

Submitted:
04 November 2023
Posted:
07 November 2023
You are already at the latest version
Abstract
Renewable jet fuel (RJF) production has been recognized as a promising approach for reducing the aviation sector's carbon footprint. Over the last decade, commercial production of RJF has piqued the interest of airlines and governments around the world. However, RJF production can be challenging due to its dispersed supply resources. Furthermore, the production of RJF is more costly compared to producing conventional jet fuel. In this study, using a mixed integer linear program (MILP), we design an RJF supply chain network in which we obtain an optimized configuration of the supply chain and determine operational decisions required to meet RJF demand at airports. To accelerate commercialization of RJF production, we considered four different monetary incentive programs, which could cover the supply chain’s costs. This study is validated by employing the model to design an RJF supply chain in the Midwestern US. Results from this study are promising as they show the supply chain can achieve commercialization with partial financial coverage from the incentive programs. Based on the findings of this study, policymakers can devise policies to commercialize RJF production and accelerate its adoption by industry.
Keywords:
renewable jet fuel
; supply chain optimization
; monetary incentives
; mixed integer linear programing
; incentive policy
1. Introduction
Finding cleaner sources of energy is critical to addressing concerns about energy security, food, and the environment. The aviation industry is responsible for 2% of the global carbon emissions [1]. However, the industry will continue to expand, and emissions will rise accordingly. Although electric and hydro-powered vehicles are replacing vehicles powered by fluid fuels such as fossil-based and biomass-based fluid fuels, there are not similar options for the aviation industry. In 2005, the aviation industry committed to cut its net carbon footprint to less than half of its volume by 2050 [2]. To achieve this goal, renewable jet fuel (RJF) has been proposed as a viable replacement that will effectively reduce the consumption rate of fossil-based jet fuels as well as the environmental effects of jet fuel consumption [3]. RJF production can provide economic benefits for farmers, reduced greenhouse gas (GHG) emissions, energy savings for future generations, improved diversity of energy resources, and improved resilience to oil price changes and supply risks [4,5,6].
Several types of feedstock can be considered as biomass for producing RJF. However, feedstock derived from food crops is contentious because it can also be used as food [7]. Most of the expected sustainability impacts of RJF stem from feedstock choice and its associated characteristics [8]. To address these concerns and improve sustainability in producing RJF, the aviation industry has committed to using second-generation feedstock that does not compromise food security, requires low energy to produce, uses minimal land with high yield, and improves socio-economic values to local areas where biomass is planted. Second-generation biomass comprises crop residues (e.g., corn stover, wheat straw, rice straw, and rice hull), forestry residues (e.g., wood pulp, wood chips, and sawdust), waste products (e.g., used cooking oils), or crops cultivated in perennial fields as biomass that does not induce food conflicts (e.g., switchgrass, camelina, and carinata). As Perkis & Tyner [9] stated, after meeting the U.S. Renewable Fuel Standard (RFS) requirements by first-generation corn ethanol, many states are now looking for other generations of biomass feedstock such as cellulosic crops. According to the U.S. Billion-Ton Update, there are sufficient biomass resources to meet the advanced biofuel standards of the RFS [10]. The Midwestern US entails regions where corn is widely cultivated, and its residue, called corn stover, seems to be a reliable resource for RJF production.
Wang & Tao [11] provided a comprehensive review of the pathways (process technologies) applied to RJF production. Pathways such as alcohol-to-jet (ATJ) [11,12], Fischer Tropsch (FT) [13], hydrothermal liquefaction (HTL) [14], and hydroprocessed esters and fatty acids (HEFA) [5] can be used to convert biomass to RJF. The pathways are certified or under review by the American Society for Testing and Materials (ASTM). Many studies, known as techno-economic analysis (TEA), compared the feasibility of using the conversion technologies [11,15,16,17,18]. In a study comparing the feasibility of technologies such as FT, ATJ, and HTL, de Jong et al. [15] discovered RJF price ranges higher than conventional jet fuel prices. Furthermore, several studies known as life-cycle analysis (LCA) have been conducted to estimate GHG emissions caused by the implementation of various pathway technologies [19,20].
Despite rigorous assessment on the application of TEA and LCA approaches in the literature, the related studies fail to consider the complexity of RJF supply chains. These studies do not take into consideration the optimized number and location of biorefineries that could potentially affect the supply chain costs. Due to the dispersed nature of biomass supply sources and their low energy density, a biofuel supply chain requires a large sourcing area that can meet the biofuel production requirements to meet the demands and eventually result in a profitable supply chain [21,22]. To achieve this goal, it is critical to locate biorefineries optimally to reduce transportation costs and emissions while also ensuring feedstock availability.
To become commercially feasible, RJF production cost must become competitive with the production cost of fossil-based jet fuel. The costs incurred by RJF production need to be covered by government assistance and subsidies [23]. Noh et al. [24] conducted a comprehensive study in which they discussed multiple existing incentive policies that were already in use in US agencies and could be considered for incentivizing RJF production. In another study, Ebrahimi et al. [25] investigated the application of three monetary incentives to cover the costs of an RJF supply chain. They considered three different incentive programs including biomass crop assistance program (BCAP), producer credit program (PCP), and biorefinery assistance program (BAP). In BCAP, governments and agencies cover the costs related to supplying biomass feedstock for producing the biofuel. This program has been provided by the US Department of Agriculture (USDA). BAP has provided financial support to cover capital and production costs at biorefineries. The Department of Energy (DOE) has already applied BAP incentives to incentivize biofuel production. PCP provides comprehensive support to cover all types of costs associated with RJF production in the supply chain, including costs associated with biomass supply, production, and transportation. PCP has already been employed by agencies such as the Internal Revenue Service (IRS), USDA, and DOE. Carbon trading has also been considered in several studies as a means to help renewable energy producers compete with the cost of conventional fossil fuel production [25,26]. Cap-and-trade (CT) is one of the carbon policies that restrict carbon emissions generated by industries. To implement the policy, the government sets a cap on allowed carbon emissions so that companies that surpass the cap are penalized, while those whose emissions are under the cap can sell unused carbon credits. As a result, the policy could potentially incentivize an industry with allowing producers to trade/sell their unused carbon credits [27]. The European Union, California in the US, Quebec in Canada, and seven regions in China have already adopted CT policies to encourage the production of green energies [28].
While many studies have examined the economic and environmental aspects of RJF production, a few have investigated how various monetary incentives could be employed to cover costs related to RJF production [25,29,30]. In this study, after designing an optimized RJF supply chain network in the Midwest, we study the impact of four various monetary incentives to commercialize RJF production. The monetary incentives include programs such as PCP, BCAP, BAP, and CT.
The contributions of this study are
- Determining prospective agricultural sites in the Midwest where corn stover can be extracted from lands planted by corn. The availability of biomass feedstock is one of the most significant barriers to achieve cost-effective biofuel supply chains. Therefore, ensuring a reliable biomass feedstock resource substantially increases the likelihood of commercializing the biofuel production.
- Designing a three-echelon RJF supply chain network using corn stover in the Midwest. The region’s lands are abundantly planted by corn. The production of RJF from corn stover promises to improve the farming economy of the region and the sustainability of jet fuel used by airports. This study is the first to examine the entire Midwest (12 states) as a supply region for RJF production.
- Analyzing the impact of four distinct monetary incentives on the profitability of the RJF supply chain. There have been few studies comparing the profitability of RJF supply chains based on potential direct monetary incentives.
- Evaluating the effects of changes in RJF price and demand fulfillment rate on the supply chain’s profitability. This analysis will enable decision-makers and investors to gain a better perspective on RJF supply chain profitability under a variety of circumstances.
- Generating and providing managerial insights and policy implications for investors and policymakers to design a profitable RJF supply chain and accelerate commercialization of RJF production.
2. Materials and methods
2.1. The RJF supply chain configuration
Corn is widely planted in the Midwest and its residues are considered good for producing second-generation biofuels. In this study, we developed models that could be used to design an RJF supply chain using corn stover. The models determined the supply chain’s profit through producing RJF. Due to its low capital and operational costs compared to other conversion pathways such as HTL and ATJ, we considered FT to produce RJF from corn stover [31]. The outputs from the production process include RJF, renewable diesel fuel (RDF), naphtha, and electricity [32].
We consider a supply chain with three tiers: supplier nodes, biorefineries, and demand nodes. The biomass feedstock flows from supplier nodes to biorefineries where after being preprocessed and going through the conversion process, the RJF produced in biorefineries is disseminated to demand nodes (airports). Transporting raw materials to biorefineries and RJF to demand nodes is conducted by trucks. In our study, we assumed that RDF and naphtha were sold at biorefineries, with customers being responsible for transportation costs. We also assumed that preprocessing of corn stover is performed at the activated biorefineries. Figure 1 illustrates the three echelons of the RJF supply chain and its components.
For our study we consider the Midwest in the United States. The Midwest comprises the states of Illinois, Indiana, Iowa, Kansas, Michigan, Minnesota, Missouri, Nebraska, North Dakota, Ohio, South Dakota, and Wisconsin. For supplier nodes, we consider each agricultural statistical district (ASD) as a supply node [25,29];. Supply for each ASD includes supply from all farms planting corn in the corresponding ASDs. However, to consider the corn stover that can be extracted from farms, we excluded 50% of the available corn stover and assumed only 35% of farmers would be interested in selling their corn stover [33]. The quantity of biomass feedstock was calculated by multiplying the area planted with corn [34] by the yield rate of corn stover,3.099 tonnes per acre [35]. The biorefineries can be supplied by 2,000 million tonnes of corn stover annually [31].
Since we wanted to determine the annual profit of the supply chain, we needed to annualize the capital cost of biorefineries. Eq. (1) is used to annualize the initial investment of a biorefinery with an expected life of n years and an interest rate of q%. The expected life of the biorefineries was set at 20 years, with an 11.5% interest rate [36,37]. The biorefinery’s initial investment cost was $331.63 million [31], whereas its corresponding annual cost was estimated at $45.51 million.
For transportation purposes, each supply node at an ASD is considered to originate from the center of the ASD unless the destination biorefinery is in the originating ASD. In which case, the transportation distance is assumed to be 2/3 of the radius of that ASD which is calculated by the area of each ASD [31]. Figure 2 shows the spatial placement of the RJF supply chain including the supply areas as well as potential biorefinery locations and airports.
Demand nodes are airports in the Midwest with annual RJF demands greater than 100 million gallons. Due to a 50% maximum blending limit of RJF produced through FT, only half of the required jet fuel demand was projected to be fulfilled by RJF. The airports with their corresponding demands are depicted in Table 1.
Other data related to the parameters used in the RJF supply chain model is provided in Table A1 in Appendix A.
2.2. Model formulation
We developed five MILPs: a base model with no monetary incentives and four models with incentive programs, including PCP, BCAP, BAP, and CT. The models are designed to maximize the total profit of the RJF supply chain. The supply chain’s revenue could include earnings from selling RJF, biofuel coproducts (RDF, naphtha), electricity, and unused carbon credits. On the other hand, costs could consist of expenses associated with purchasing corn stover, transportation, establishing biorefineries, production, and purchasing extra carbon credits. Moreover, the models find the optimal number and location of biorefineries to be established, as well as finding their suppliers and the airports they supply. In addition, the model determines the optimal flow of biomass to biorefineries from farmlands as well as the flow of RJF from biorefineries to airports. The optimization models are subject to several limitations that are outlined as constraints (3) - (11) and (16) within the five models. Table 2 shows the notation used in the models.
2.2.1. RJF supply chain with no monetary incentives
In this section, no carbon policy is considered in the supply chain. Eq. (2) presents the objective function used in this model to maximize profits. The first two components of the statement represent revenue from selling RJF and coproducts including RDF, naphtha, and electricity. The remainder of the statement represents costs incurred by purchasing biomass feedstock from suppliers, establishing biorefineries, production, and transportation.
Subject to:
Eqs. (3) to (11) represent the constraints for the RJF supply chain. Constraint (3) is a supply constraint for the feedstock availability and ensures the amount of corn stover purchased does not exceed the maximum biomass feedstock available at supplier nodes. Constraint (4) presents material flow in the supply chain and ensures the quantity of RJF converted from corn stover in a biorefinery is equal to the quantity of RJF leaving the biorefinery to demand nodes. Eq. (5) shows the quantity of coproducts generated at each established biorefinery. Constraint (6) guarantees the RJF transported from biorefineries to an airport will meet the RJF demand at the airport. Eq. (7) ensures that a biorefinery at location k (if activated) cannot accept more corn stover to process than its designated capacity. Eqs. (8) – (11) express the nature and non-negativity of the variables.
2.2.2. RJF supply chain incentivized with PCP
This part provides PCP incentives to the supply chain for each liter of RJF produced by biorefineries. To apply the PCP incentives in the model, we added parameter λ to the first component of the objective function in Eq. (12). However, the rest of the equation is identical to Eq. (2). For the given objective function in Eq. (12), the same constraints apply as in Eq. (2).
Subject to constraints (3) to (11).
2.2.3. RJF supply chain incentivized with BCAP
This section employs BCAP to incentivize the supply chain, with all components in Eq. (13) identical to those in Eq. (2), except for the monetary incentives to purchase corn stover (discounts on corn stover’s purchasing price) in the third component. For the objective function in Eq. (13), the same constraints apply as in Eq. (2).
Subject to constraints (3) to (11).
2.2.4. RJF supply chain incentivized with BAP
In this section, the supply chain is incentivized using BAP, with each component in Eq. (14) being identical to those in Eq. (2), except for monetary incentives that are factored into the fourth composite component, including costs related to capital and operational costs at biorefineries. For the given objective function in Eq. (14), the same constraints apply as in Eq. (1).
Subject to constraints (3) to (11).
2.2.5. RJF supply chain incentivized with cap-and-trade policy
This section considers CT for emissions created by the RJF supply chain. CT considers a carbon capacity for the supply chain, while it also allows trading unused carbon credits. In other words, to meet demand in a supply chain with capacitated emission levels, the network might either generate less carbon credits than the designated cap and sell unused carbon emissions or exceed the carbon emission cap and have to purchase extra carbon credits. In the objective function presented in Eq. (15), and are defined as the quantity of carbon credits purchased and sold, respectively. However, if needed, the capacity could be increased by purchasing carbon credits. For the objective function in Eq. (15), the same constraints apply as in Eq. (2), plus constraint (16) which is related to the carbon cap. Eq. (16) ensures the carbon generated throughout the supply chain does not exceed the carbon cap considered for the supply chain.
subject to constraints (3) to (11) and
3. Results and Discussion
In this section, we first determined the optimal configuration of the RJF supply chain network, including the number and location of biorefineries (strategic decisions), as well as the material flow between the various supply chain components (tactical decisions). Afterwards, application of the four incentive policies on profitability of the supply chain is discussed. We assume that the minimal incentive to commercialize RJF production is the level that reduces profit loss to zero. Finally, the impacts of changes in various parameters of the supply chain on its profitability are analyzed. The optimization problems were solved via Python 3.7 using the Gurobi 9.1.2 optimization engine.
3.1. Supply chain analysis with no monetary incentives
The results from the optimization model showed that 10 biorefineries in ASDs 1710, 1720, 1750, 1850, 2690, 2750, 2790, 2910, 2960, and 5590 were established to meet the demand at airports. In terms of the biomass feedstock necessary to supply the biorefineries, 28.96 million tonnes of corn stover were required to produce the desired RJF. The region had a potential availability of 44.44 million tonnes of corn stover (for conversion to RJF), which could provide 6,417 million liters of RJF a year. Because of the blending limitations (50%), we assumed airports could only refill their airplanes with RJF up to 50% of their capacity. As a result, only 4,180.42 million liters of RJF were expected to be supplied to the selected airports. The optimal assignments of the supply and demand nodes to the activated biorefineries are shown in Table A2.
According to the findings, the supply chain resulted in a profit loss of $481.65 million, which equates to a profit loss of $0.12 per liter. As shown in Figure 3, the majority of supply chain revenue (46%) could be attributed to the revenue from selling RJF, while the lowest revenue share (15%) could be attributed to the sale of power generated during the manufacturing process.
Supply chain costs include operating costs (OPEX), capital costs (CAPEX), transportation costs, and purchasing cost of biomass feedstock, where operational costs constitute the largest portion of the costs. In terms of transportation costs, 25.53% and 41.48 % of the total transportation costs were due to the fixed and variable transportation costs for transporting corn stover, while 0.22% and 32.78% of the total were allocated to the fixed and variable transportation costs for transporting RJF from biorefineries to airports. The results could be attributed to the higher transportation costs of biomass (fixed and variable transportation costs) as well as their lower density compared to RJF [25,31].
Also Figure 4 shows the spatial configuration of the optimized RJF supply chain network including the location of farms and their potential to supply the supply chain with available corn stover, location of activated biorefineries, and location of the airports. According to the results, the 10 activated biorefineries were located in ASDs where there was a balanced distance between biorefineries and airports, as well as between farms and refineries. Thus, the model located biorefineries at ASDs where biomass feedstock was abundantly available in their vicinity, while also reducing transportation costs between the biorefineries and the airports. It should be noted that the model did not use the corn stover from ASDs located in the western Midwest to supply the activated biorefineries. This can be attributed to the fact that the majority of the airports were located in the central and eastern parts of the Midwest, where there was enough biomass feedstock to supply their supporting biorefineries. The ASDs that did not supply the biorefineries are differentiated from those that did with hatched lines. It should also be stated that only 18% of the available corn stover in ASD 4630 was utilized to supply the RJF production in the supply chain (illustrated with crosshatched lines in Figure 4).
3.2. Supply chain analysis with application of different monetary incentives
In this section, we provide the results regarding the application of the monetary incentives PCP, BCAP, BAP, and CT on the RJF supply chain profitability.
3.2.1. Supply chain incentivized with PCP
PCP allocates direct monetary incentives to each liter of produced RJF. PCP incentives were considered to cover the total costs in the supply chain including purchasing costs of the biomass feedstock, transportation cost, and capital and operational costs. Figure 5 shows the impact of PCP incentive programs on reducing supply chain costs. The supply chain breaks even if the PCP incentive program cover 9.04% of its total costs.
Since monetary incentives could also be employed to other biofuels produced along RJF, including RDF and naphtha, we calculated the quantity of monetary incentives that could be applied to the total amount of biofuel produced. In this study, the corresponding incentives would be referred to as inclusive incentives [25]. According to the results illustrated in Figure 5, the supply chain needed an incentive of $0.12 per liter of RJF produced to obtain profitability, while it needed an inclusive monetary incentive of only $0.06 per liter.
3.2.2. Supply chain incentivized with BCAP
In this section, we investigated the application of BCAP to cover costs associated with purchasing corn stover from farmers (Figure 6). The results showed that the RJF supply chain could achieve profitability if 33.53% of the costs related to purchasing corn stover were covered by the incentive program. The greater percentage of the biomass purchasing costs covered by the incentive program compared to the coverage rate by the PCP program is due to a lower share of the costs associated with the purchase of biomass feedstock compared to the total costs in the supply chain.
3.2.3. Supply chain incentivized with BAP
The costs associated with the biorefineries, including CAPEX and OPEX, could be compensated by BAP as an incentive program. According to the results, presented in Figure 7, the BAP incentive program could potentially reduce the profit loss to the commercialization level by covering at least 16.64% of the CAPEX and OPEX in the supply chain. As a result of the high share of CAPEX and OPEX among the supply chain costs (57.3%), the BAP program provided a low coverage rate to reach the commercialization level. We also considered PCP incentives as a complementary incentive program to cover the remaining costs of the supply chain. Furthermore, how much of an inclusive incentive is needed to reach commercialization is also shown in Figure 7.
3.2.4. Supply chain incentivized with the carbon cap-and-trade policy
In implementing CT, we considered a cap for the carbon generated through the supply chain. To satisfy production and fulfill RJF demand, the supply chain members can sell or buy carbon. Due to RJF’s lower carbon footprint compared to conventional jet fuel production, we expect the RJF supply chain to have unused carbon credits that can be sold. As such, carbon policies can serve as an efficient mechanism to incentivize and support RJF production and commercialization.
We assumed that an additional kilogram of carbon emissions incurs a social cost of $0.22 [19,31]. The same price was considered for selling unused carbon credits (the carbon units below a specified carbon cap). The carbon emissions generated by the supply chain were 0.46 million tonnes. However, we established the baseline carbon cap based on the quantity of carbon emissions that could be produced by producing the same amount of conventional jet fuel (12.89 million tonnes). An emission rate of 3.08 kg CO2e per liter was used for producing conventional jet fuel [19].
We examined the policy under four different scenarios where the carbon generation through the supply chain was capacitated to various levels with regard to carbon generation for producing the same amount of conventional jet fuel. The carbon emission capacity was set to 100%, 75%, 50%, and 25% of the carbon generated through producing the same amount of conventional jet fuel. The corresponding results are illustrated in Table 3. Comparing the results related to the profit loss from the base model with cases having monetary incentives from CT, demonstrates the significant impact of implementing CT on incentivizing RJF production. The policy had the potential to change the supply chain profit from a loss of $0.12 per liter to a gain of $0.53 per liter.
It was observed that when a 20% reduction in carbon emissions was desired (compared to the base emission level from conventional jet fuel), the RJF supply chain was profitable. The results also showed that if we capped the carbon emission in the supply chain to the total emissions made by conventional jet fuel, the supply chain profit was $0.5 per liter.
3.3. Supply chain analysis with regard to changes in parameters
In this section, we evaluated the effect of changing various model parameters on supply chain profitability. Figure 8 indicates that lowering the demand fulfillment rate allows lower monetary incentives to commercialize RJF manufacturing. However, given the social costs of using conventional jet fuel, creating more RJF and its associated social and environmental advantages balances the impact of additional monetary incentives required for greater demand fulfillment rates.
We also investigated the impact of changing biofuel prices on profitability of the RJF supply chain. Based on the data from [38], the lowest average price for conventional jet fuel was from 2020, at 1.293 $/gallon, while the highest average price was from 2012, at 3.104 $/gallon. Comparing the base price ($0.51 per liter) with the maximum and minimum prices experienced through recent years, it can be concluded that the jet fuel price fluctuated between 30% less and 60% higher than the base price. If biofuel prices rise by 60% above the basis price, the supply chain will become profitable, resulting in a profit of $0.45 per liter of RJF produced, whereas if biofuel prices fall 30% below the base price, there will be a profit loss of $0.40 per liter of RJF produced. It can also be concluded that if biofuel prices (RJF, RDF, and naphtha prices) increased by 12% over the base case, the supply chain could become profitable.
4. Conclusions
Commercialization of RJF can be highly dependent on the lower cost of RJF supply chains that can efficiently and effectively produce the required RJF to meet demand at airports. Using proper biomass that is abundantly available and does not pose a threat to food and feed production is essential. Furthermore, RJF production can cost more compared to the production of fossil-based jet fuel. Using MILPs, we developed a supply chain for corn stover that did not compete with any food resources and accessed a large supply of biomass feedstock. The current US administration’s interest in accelerating RJF production as well as the lack of a comprehensive understanding of all aspects of producing RJF may stimulate investigations to find ways to accelerate the commercialization of RJF.
In this study, we investigated the impacts on profitability of applying four different monetary incentives to RJF production. From the results, we concluded that all four incentive policies can make the RJF supply chain profitable. It is worth mentioning that while PCP, BCAP, and BAP were merely aimed at subsidizing the supply chain by covering its costs, CT offered monetary incentives that could be earned over selling unused carbon credits. Thus, CT is a reward-based mechanism in that supply chains can continuously look for efficient and effective approaches to reduce carbon emissions and also provide an opportunity to sell unused carbon credits. Furthermore, PCP required the lowest share of coverage (9.04% of the total costs as incentives) to achieve commercialization thresholds compared with other monetary incentives. Other monetary incentives in terms of the minimum coverage required to make the supply chain profitable were BAP with covering 16.64% of the production cost, CT capped at 20% of the carbon generated through producing conventional jet fuel, and BCAP with 33.53% of the costs related to purchasing corn stover. It should be noted that all the incentive programs were aimed at covering the same amount of the supply chain costs. However, they differed based on the types of costs they covered (total supply chain cost, biomass purchasing cost, or operational cost). Furthermore, due to the high sensitivity of the RJF supply chain’s profitability to changes in the biofuel price and considering the increase in the oil price (which can affect biofuel price), it is expected that a price increase will result in a profitable RJF supply chain, even without application of monetary incentives.
These results shed light on the complexity of RJF supply chain networks and their corresponding costs. Considering the fact that the incentive policies have been inspired by several incentive policies already employed by agencies such as USDA, DOE, and IRS, the observation of applying the programs to incentivize RJF production may encourage them to devise such policies to promote commercialization of RJF production. In addition, commercializing corn stover based RJF production will grow the interest of farmers in selling their crop residues, thus providing a greater supply to support RJF demand fulfillment.
Future studies can pursue several directions. In this research we considered converting corn stover to RJF whereas crop residues, such as wheat straw, can also be used, either singly or in combination with other crop residues. Our work can also be extended to address more strategic and operational decisions such as intermodal transportation for logistics decisions and co-locating RJF biorefineries with existing facilities that produce other biofuels. Also, considering uncertainties in the supply chain model’s parameters, using stochastic programming may be worthy of future exploration.
Author Contributions
Sajad Ebrahimi: Conceptualization, Investigation, Data curation, Methodology, Formal analysis, Software, Visualization, Writing – original draft. Joseph Szmerekovsky: Conceptualization, Investigation, Validation, Writing – review & editing. Bahareh Golkar: Data curation, Visualization, Writing – review & editing. Seyed Ali Haji Esmaeili: Validation, Writing – review & editing.
Funding
This research received no external funding.
Data Availability Statement
The data presented in this study are available upon reasonable request from the corresponding authors.
Conflicts of Interest
The authors declare no conflict of interest.
Appendix A

Table A1.
Values of input parameters for RJF supply chain with corn stover feedstock.
| Parameter & Value | Description | Reference |
|---|---|---|
| = 0.36 | Selling price of naphtha ($/liter) | [25] |
| = 0.50 | Selling price of RDF ($/liter) | [25] |
| 0.51 | Selling price of RJF ($/liter) | [31] |
| = 49.61 | Selling price of corn stover ($/tonne) | [25] |
| = 0.59 | Production cost of RJF at biorefinery ($/liter) | [32] |
| = 144.38 | RJF conversion rate from corn stover (liter/tonne) | [32] |
| = 72.25 | Fuel coproduct j (naphtha) conversion rate from corn stover (liter/tonne) | [32] |
| = 72.25 | Fuel coproduct j (RDF) conversion rate from corn stover (liter/tonne) | [32] |
| = 6.615 | Transportation fixed cost of corn stover via truck ($/tonne) | [39] |
| = 0.0548 | Transportation variable cost of corn stover via truck ($/tonne-km) | [39] |
| = 0.0031 | Transportation fixed cost of RJF via truck ($/liter) | [40] |
| = 0.000394 | Transportation variable cost of RJF via truck ($/liter-km) | [40] |
| = 0.0756 | Emission factor of transporting corn stover (kg CO2e/tonne-km) | [41] |
| = 0.00009235 | Emission factor of transporting RJF (kg CO2e/liter-km) | [42] |
| = 0.0001654 | Emission factor of corn stover acquisition (kg CO2e/tonne) | [41] |
| = −0.344a | Emission factor of producing RJF through FT pathway from corn stover (kg CO2e/liter) | [31] |
| = 45.51 | Annual fixed cost of biorefinery (M $) | [31] |
| 0.59 | Production cost of RJF at biorefinery ($/liter) | [32] |
a This emission factor is a result of emission generated through preprocessing corn stover and transforming it to RJF. The negative sign refers to the fact that the emission credits awarded by electricity generated through producing RJF outweighs the emissions generated through preprocessing corn stover and other operations to produce RJF at biorefineries [19].
Table A2.
Optimal assignment of supply zones and demand nodes to activated biorefineries.
| Supplier district (Share of supply assignment) |
Activated biorefinery and its capacity | Demand node (Share of demand fulfillment) |
|---|---|---|
| Sb1940 (34.82%), S1950 (38.53%), S1960 (26.65%). | Bc1710 | ORD (100%). |
| S1710 (34.07%), S1720 (16.16%), S1810 (17.09%), S1930 (5.30%), S1980 (10.40%), S1990 (16.98%). | B1720 | MDW (1.11%), ORD (98.89). |
| S1730 (19.75%), S1740 (29.67%), S1750 (28.36%), S1760 (21.18%), S1810 (1.04%). | B1750 | MDW (71.53%), DTW (28.47%). |
| S1770 (26.67%), S1820 (10.88%), S1840 (12.69%), S1850 (18.06%), S1860 (7.59%), S1870 (12.28%), S1880 (3.09%), S1890 (2.45%), S3790 (5.98%). | B1850 | CVG (40.60%), DTW (17.63%), IND (41.77%). |
| S1820 (3.03%), S1830 (8.21%), S2610 (0.38%), S2620 (1.10%), S2630 (0.83%), S2640 (1.78%), S2650 (5.34%), S2660 (8.19%), S2670 (7.53%), S2680 (12.20%), S2690 (3.76%), S3910 (6.09%), S3920 (7.08%), S3930 (4.12%), S3940 (11.77%), S3950 (13.56%), S3960 (1.67%), S3980 (2.03%), S3990 (1.32%). | B2690 | DTW (100%). |
| S2740 (31.79%), S2750 (29.97%), S2760 (3.18%), S2770 (25.42%) S4630 (3.06%), S5510 (6.58%). |
B2750 | MSP (100%). |
| S1920 (40.24%), S2780 (34.29%), S2790 (23.51%), S5540 (1.96%). | B2790 | MSP (48.12%), ORD (51.88%). |
| S1970 (30.36%), S2070 (20.13%), S2080 (8.74%), S2910 (21.21%), S3190 (19.56%). | B2910 | OMA (31.73), KCI (68.27%). |
| S1760 (10.14%), S1780 (12.06%), S1790 (12.14%), S2080 (0.92%), S2920 (9.76%), S2930 (15.18%), S2940 (10.23%), S2950 (11.37%), S2960 (4.62%), S2970 (3.82%), S2980 (0.56%), S2990 (9.21%). | B2960 | STL (100%). |
| S1930 (27.65%), S5520 (6.59%), S5530 (3.97%), S5540 (11.67%), S5550 (8.04%), S5560 (10.36%), S5570 (11.36%), S5580 (16.32%), S5590 (4.06%). | B5590 | MKE (30.70%), ORD (69.30%). |
a The letter “S” in the beginning of the biorefinery node indicates that the supply node is located at ASD 1940. b The letter “B” in the beginning of the biorefinery node indicates that the biorefinery node is located at ASD 1720.
References
- ATAG Beginner’s Guide to Aviation Biofuels. Geneva Air Transp. Action Gr. 2009, 24.
- ATAG Aviation Benefits beyond Borders 2016. Wildl. Soc. Bull. 2016, 40, 210.
- Wei, H.; Liu, W.; Chen, X.; Yang, Q.; Li, J.; Chen, H. Renewable Bio-Jet Fuel Production for Aviation: A Review. Fuel 2019, 254, 115599. [Google Scholar] [CrossRef]
- Chao, H.; Agusdinata, D.B.; DeLaurentis, D.A. The Potential Impacts of Emissions Trading Scheme and Biofuel Options to Carbon Emissions of U.S. Airlines. Energy Policy 2019, 134, 110993. [Google Scholar] [CrossRef]
- Mousavi-Avval, S.H.; Shah, A. Techno-Economic Analysis of Hydroprocessed Renewable Jet Fuel Production from Pennycress Oilseed. Renew. Sustain. Energy Rev. 2021, 149, 111340. [Google Scholar] [CrossRef]
- Escalante, E.S.R.; Ramos, L.S.; Rodriguez Coronado, C.J.; de Carvalho Júnior, J.A. Evaluation of the Potential Feedstock for Biojet Fuel Production: Focus in the Brazilian Context. Renew. Sustain. Energy Rev. 2022, 153, 111716. [Google Scholar] [CrossRef]
- Stelle, P.; Pearce, B. Powering the Future of Flight: The Six Easy Steps to Growing a Viable Aviation Biofuels Industry. Geneva Air Transp. Action Gr. 2011, 1–20. [Google Scholar]
- Diniz, A.P.M.M.; Sargeant, R.; Millar, G.J. Stochastic Techno-Economic Analysis of the Production of Aviation Biofuel from Oilseeds. Biotechnol. Biofuels 2018, 11, 1–15. [Google Scholar] [CrossRef] [PubMed]
- Perkis, D.F.; Tyner, W.E. Developing a Cellulosic Aviation Biofuel Industry in Indiana: A Market and Logistics Analysis. Energy 2018, 142, 793–802. [Google Scholar] [CrossRef]
- U.S.-Department-of-Energy U.S. Billion-Ton Update: Biomass Supply for a Bioenergy and Bioproducts Industry | Department of Energy. Oak Ridge Natl. Lab. 2011.
- Wang, W.C.; Tao, L. Bio-Jet Fuel Conversion Technologies. Renew. Sustain. Energy Rev. 2016, 53, 801–822. [Google Scholar] [CrossRef]
- Geleynse, S.; Brandt, K.; Garcia-Perez, M.; Wolcott, M.; Zhang, X. The Alcohol-to-Jet Conversion Pathway for Drop-In Biofuels: Techno-Economic Evaluation. ChemSusChem 2018, 11, 3728–3741. [Google Scholar] [CrossRef]
- Ail, S.S.; Dasappa, S. Biomass to Liquid Transportation Fuel via Fischer Tropsch Synthesis – Technology Review and Current Scenario. Renew. Sustain. Energy Rev. 2016, 58, 267–286. [Google Scholar] [CrossRef]
- Kargbo, H.; Harris, J.S.; Phan, A.N. “Drop-in” Fuel Production from Biomass: Critical Review on Techno-Economic Feasibility and Sustainability. Renew. Sustain. Energy Rev. 2021, 135, 110168. [Google Scholar] [CrossRef]
- de Jong, S.; Hoefnagels, R.; Faaij, A.; Slade, R.; Mawhood, R.; Junginger, M. The Feasibility of Short-Term Production Strategies for Renewable Jet Fuels - a Comprehensive Techno-Economic Comparison. Biofuels, Bioprod. Biorefining 2015, 9, 778–800. [Google Scholar] [CrossRef]
- Natelson, R.H.; Wang, W.C.; Roberts, W.L.; Zering, K.D. Technoeconomic Analysis of Jet Fuel Production from Hydrolysis, Decarboxylation, and Reforming of Camelina Oil. Biomass and Bioenergy 2015, 75, 23–34. [Google Scholar] [CrossRef]
- Pearlson, M.; Wollersheim, C.; Hileman, J. A Techno-Economic Review of Hydroprocessed Renewable Esters and Fatty Acids for Jet Fuel Production. Biofuels, Bioprod. Biorefining 2013, 7, 89–96. [Google Scholar] [CrossRef]
- Pham, V.; Holtzapple, M.; El-Halwagi, M. Techno-Economic Analysis of Biomass to Fuel Conversion via the MixAlco Process. J. Ind. Microbiol. Biotechnol. 2010, 37, 1157–1168. [Google Scholar] [CrossRef] [PubMed]
- De Jong, S.; Antonissen, K.; Hoefnagels, R.; Lonza, L.; Wang, M.; Faaij, A.; Junginger, M. Life-Cycle Analysis of Greenhouse Gas Emissions from Renewable Jet Fuel Production. Biotechnol. Biofuels 2017, 10, 1–18. [Google Scholar] [CrossRef] [PubMed]
- Agusdinata, D.B.; Zhao, F.; Ileleji, K.; Delaurentis, D. Life Cycle Assessment of Potential Biojet Fuel Production in the United States. Environ. Sci. Technol 2011, 45, 9133–9143. [Google Scholar] [CrossRef]
- Castillo-Manzano, J.I.; Castro-Nuño, M.; López-Valpuesta, L.; Vassallo, F.V. The Complex Relationship between Increases to Speed Limits and Traffic Fatalities: Evidence from a Meta-Analysis. Saf. Sci. 2019, 111, 287–297. [Google Scholar] [CrossRef]
- Malladi, K.T.; Sowlati, T. Biomass Logistics: A Review of Important Features, Optimization Modeling and the New Trends. Renew. Sustain. Energy Rev. 2018, 94, 587–599. [Google Scholar] [CrossRef]
- Zheng, T.; Wang, B.; Rajaeifar, M.A.; Heidrich, O.; Zheng, J.; Liang, Y.; Zhang, H. How Government Policies Can Make Waste Cooking Oil-to-Biodiesel Supply Chains More Efficient and Sustainable. J. Clean. Prod. 2020, 263, 121494. [Google Scholar] [CrossRef]
- Noh, H.M.; Benito, A.; Alonso, G. Study of the Current Incentive Rules and Mechanisms to Promote Biofuel Use in the EU and Their Possible Application to the Civil Aviation Sector. Transp. Res. Part D Transp. Environ. 2016, 46, 298–316. [Google Scholar] [CrossRef]
- Ebrahimi, S.; Haji Esmaeili, S.A.; Sobhani, A.; Szmerekovsky, J. Renewable Jet Fuel Supply Chain Network Design: Application of Direct Monetary Incentives. Appl. Energy 2022, 310. [Google Scholar] [CrossRef]
- Waltho, C.; Elhedhli, S.; Gzara, F. Green Supply Chain Network Design: A Review Focused on Policy Adoption and Emission Quantification. Int. J. Prod. Econ. 2019, 208, 305–318. [Google Scholar] [CrossRef]
- Malladi, K.T.; Sowlati, T. Impact of Carbon Pricing Policies on the Cost and Emission of the Biomass Supply Chain: Optimization Models and a Case Study. Appl. Energy 2020, 267, 115069. [Google Scholar] [CrossRef]
- Haites, E. Carbon Taxes and Greenhouse Gas Emissions Trading Systems: What Have We Learned? Clim. Policy 2018, 18, 955–966. [Google Scholar] [CrossRef]
- Haji Esmaeili, S.A.; Sobhani, A.; Szmerekovsky, J.; Dybing, A.; Pourhashem, G. First-Generation vs. Second-Generation: A Market Incentives Analysis for Bioethanol Supply Chains with Carbon Policies. Appl. Energy 2020, 277, 115606. [Google Scholar] [CrossRef]
- Haji Esmaeili, S.A.; Szmerekovsky, J.; Sobhani, A.; Dybing, A.; Peterson, T.O. Sustainable Biomass Supply Chain Network Design with Biomass Switching Incentives for First-Generation Bioethanol Producers. Energy Policy 2020, 138. [Google Scholar] [CrossRef]
- Huang, E.; Zhang, X.; Rodriguez, L.; Khanna, M.; de Jong, S.; Ting, K.C.C.; Ying, Y.; Lin, T. Multi-Objective Optimization for Sustainable Renewable Jet Fuel Production: A Case Study of Corn Stover Based Supply Chain System in Midwestern U.S. Renew. Sustain. Energy Rev. 2019, 115, 109403. [Google Scholar] [CrossRef]
- Pereira, L.G.; MacLean, H.L.; Saville, B.A. Financial Analyses of Potential Biojet Fuel Production Technologies. Biofuels, Bioprod. Biorefining 2017, 11, 665–681. [Google Scholar] [CrossRef]
- Guo, C.; Hu, H.; Wang, S.; Rodriguez, L.F.; Ting, K.C.; Lin, T. Multiperiod Stochastic Programming for Biomass Supply Chain Design under Spatiotemporal Variability of Feedstock Supply. Renew. Energy 2022, 186, 378–393. [Google Scholar] [CrossRef]
- NASS Cropland Data. Available online: https://www.nass.usda.gov/ (accessed on 13 June 2021).
- Mohamed Abdul Ghani, N.M.A.; Vogiatzis, C.; Szmerekovsky, J. Biomass Feedstock Supply Chain Network Design with Biomass Conversion Incentives. Energy Policy 2018, 116, 39–49. [Google Scholar] [CrossRef]
- Zetterholm, J.; Pettersson, K.; Leduc, S.; Mesfun, S.; Lundgren, J.; Wetterlund, E. Resource Efficiency or Economy of Scale: Biorefinery Supply Chain Configurations for Co-Gasification of Black Liquor and Pyrolysis Liquids. Appl. Energy 2018, 230, 912–924. [Google Scholar] [CrossRef]
- Osmani, A.; Zhang, J. Economic and Environmental Optimization of a Large Scale Sustainable Dual Feedstock Lignocellulosic-Based Bioethanol Supply Chain in a Stochastic Environment. Appl. Energy 2014, 114, 572–587. [Google Scholar] [CrossRef]
- EIA US Jet Fuel Wholesale/Resale Price by Refiners. Available online: www.eia.gov (accessed on 13 June 2021).
- Sokhansanj, S.; Mani, S.; Turhollow, A.; Kumar, A.; Bransby, D.; Lynd, L.; Laser, M. Large-Scale Production, Harvest and Logistics of Switchgrass ( Panicum Virgatum L. ) - Current Technology and Envisioning a Mature Technology. Biofuels, Bioprod. Biorefining 2009, 3, 124–141. [Google Scholar] [CrossRef]
- Searcy, E.; Flynn, P.; Ghafoori, E.; Kumar, A. The Relative Cost of Biomass Energy Transport. In Proceedings of the Applied Biochemistry and Biotechnology, April 2007; Vol. 137–140, pp. 639–652. [Google Scholar]
- You, F.; Wang, B. Life Cycle Optimization of Biomass-to-Liquid Supply Chains with DistributedÀCentralized Processing Networks. Ind. Eng. Chem. Res 2011, 50, 10102–10127. [Google Scholar] [CrossRef]
- Zhang, F.; Johnson, D.M.; Wang, J. Life-Cycle Energy and GHG Emissions of Forest Biomass Harvest and Transport for Biofuel Production in Michigan. Energies 2015, 8, 3258–3271. [Google Scholar] [CrossRef]
Figure 1.
RJF supply chain network and the activities at each echelon.
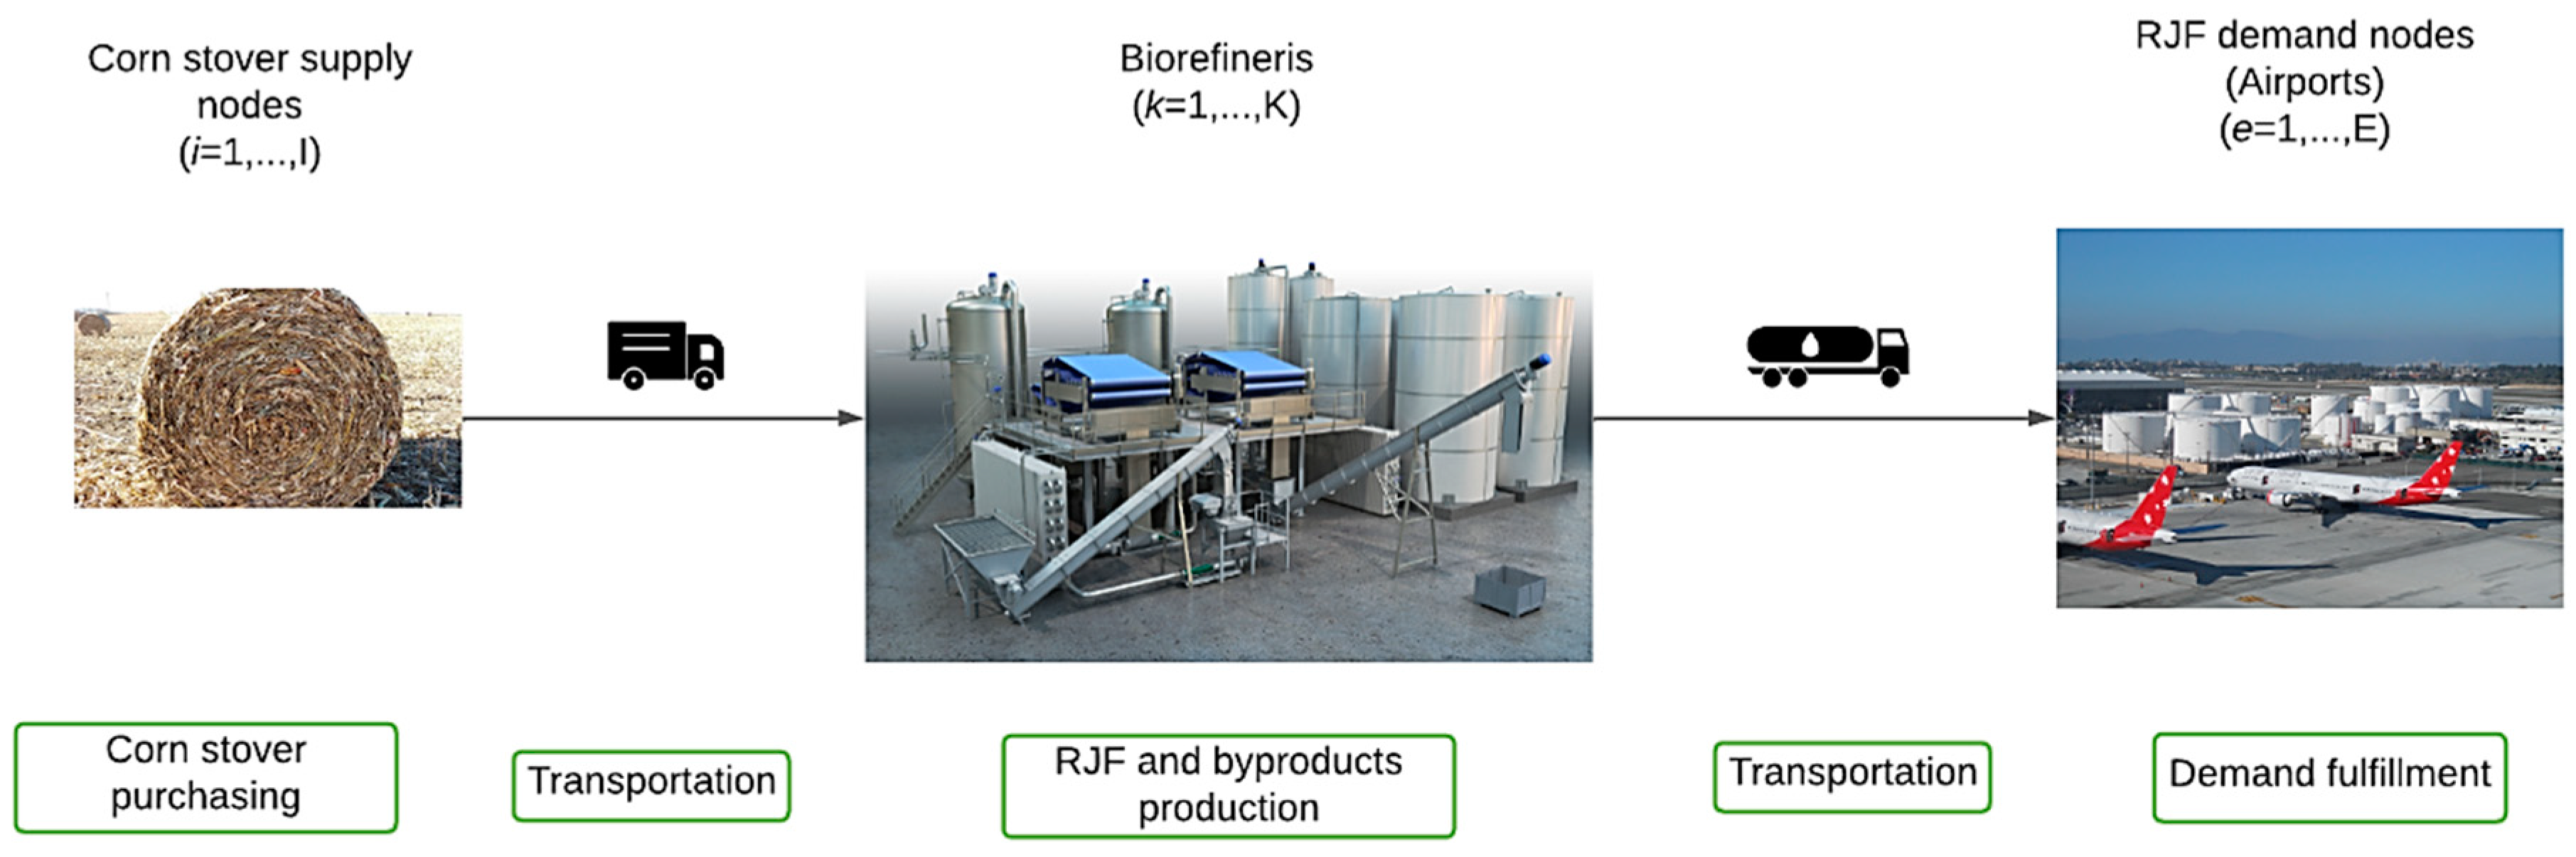
Figure 2.
Spatial distribution of the RJF supply chain components in the Midwest.
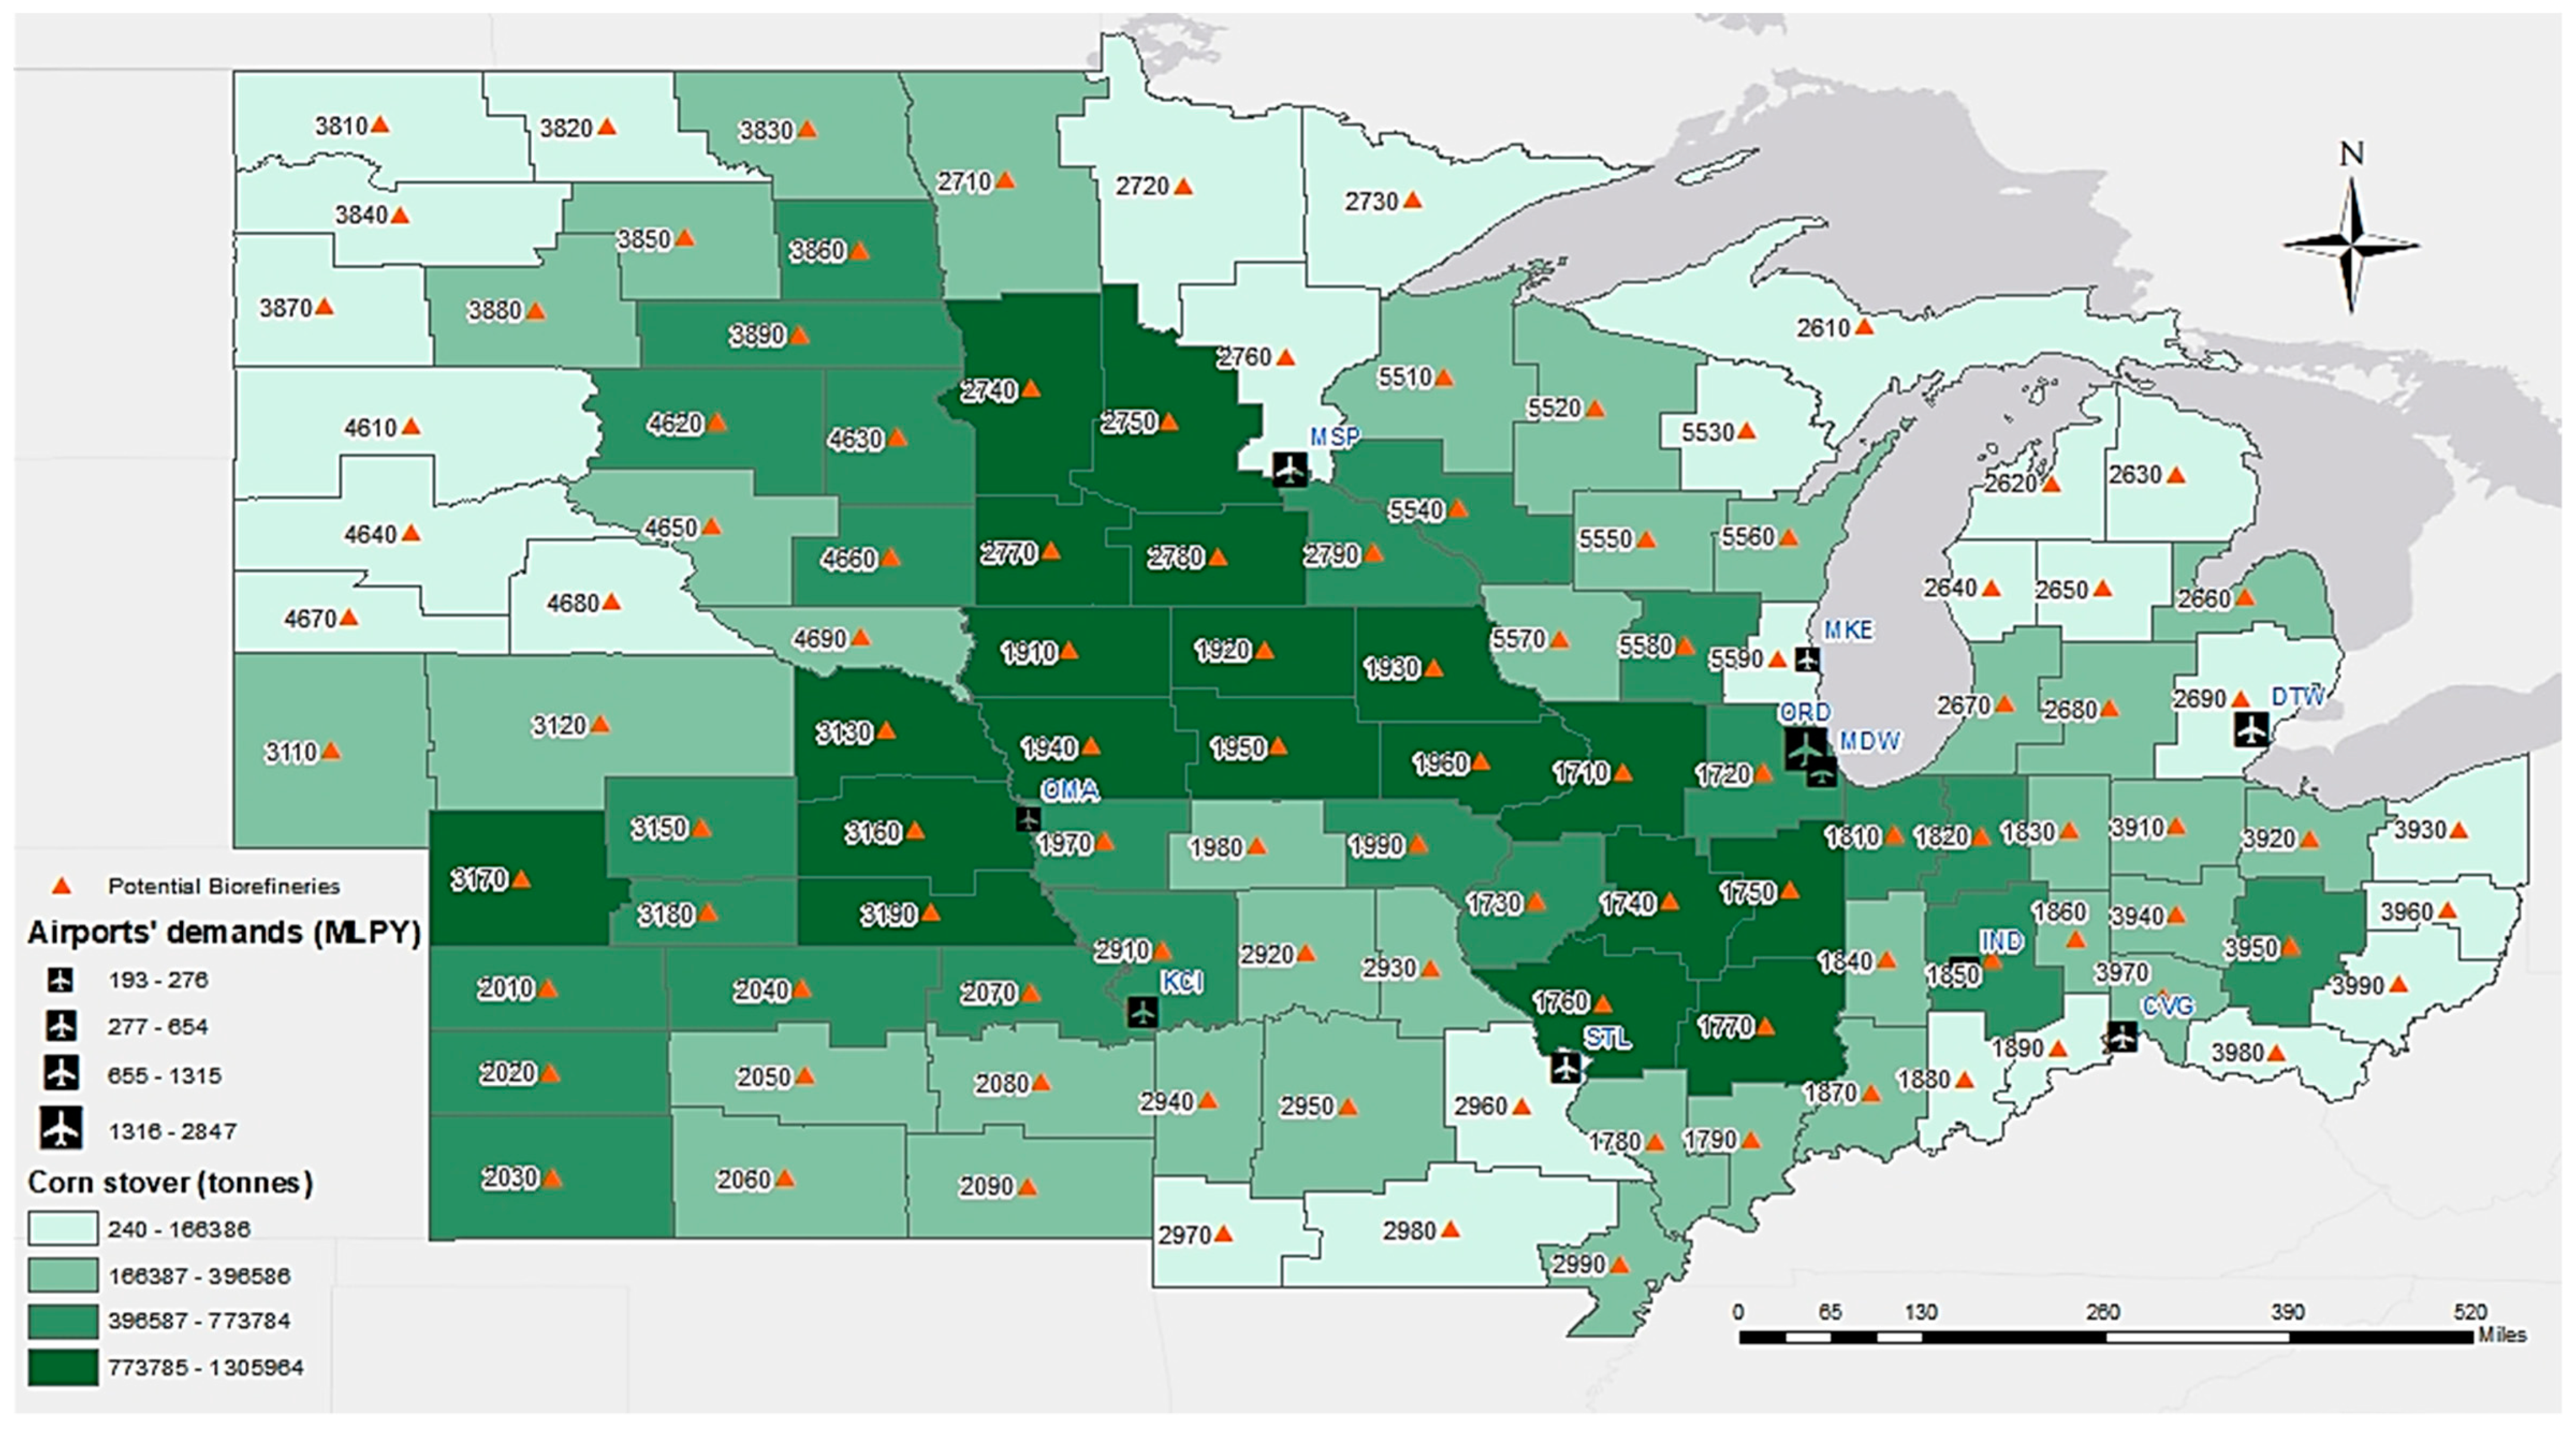
Figure 3.
Total revenue and cost breakdowns for producing RJF.
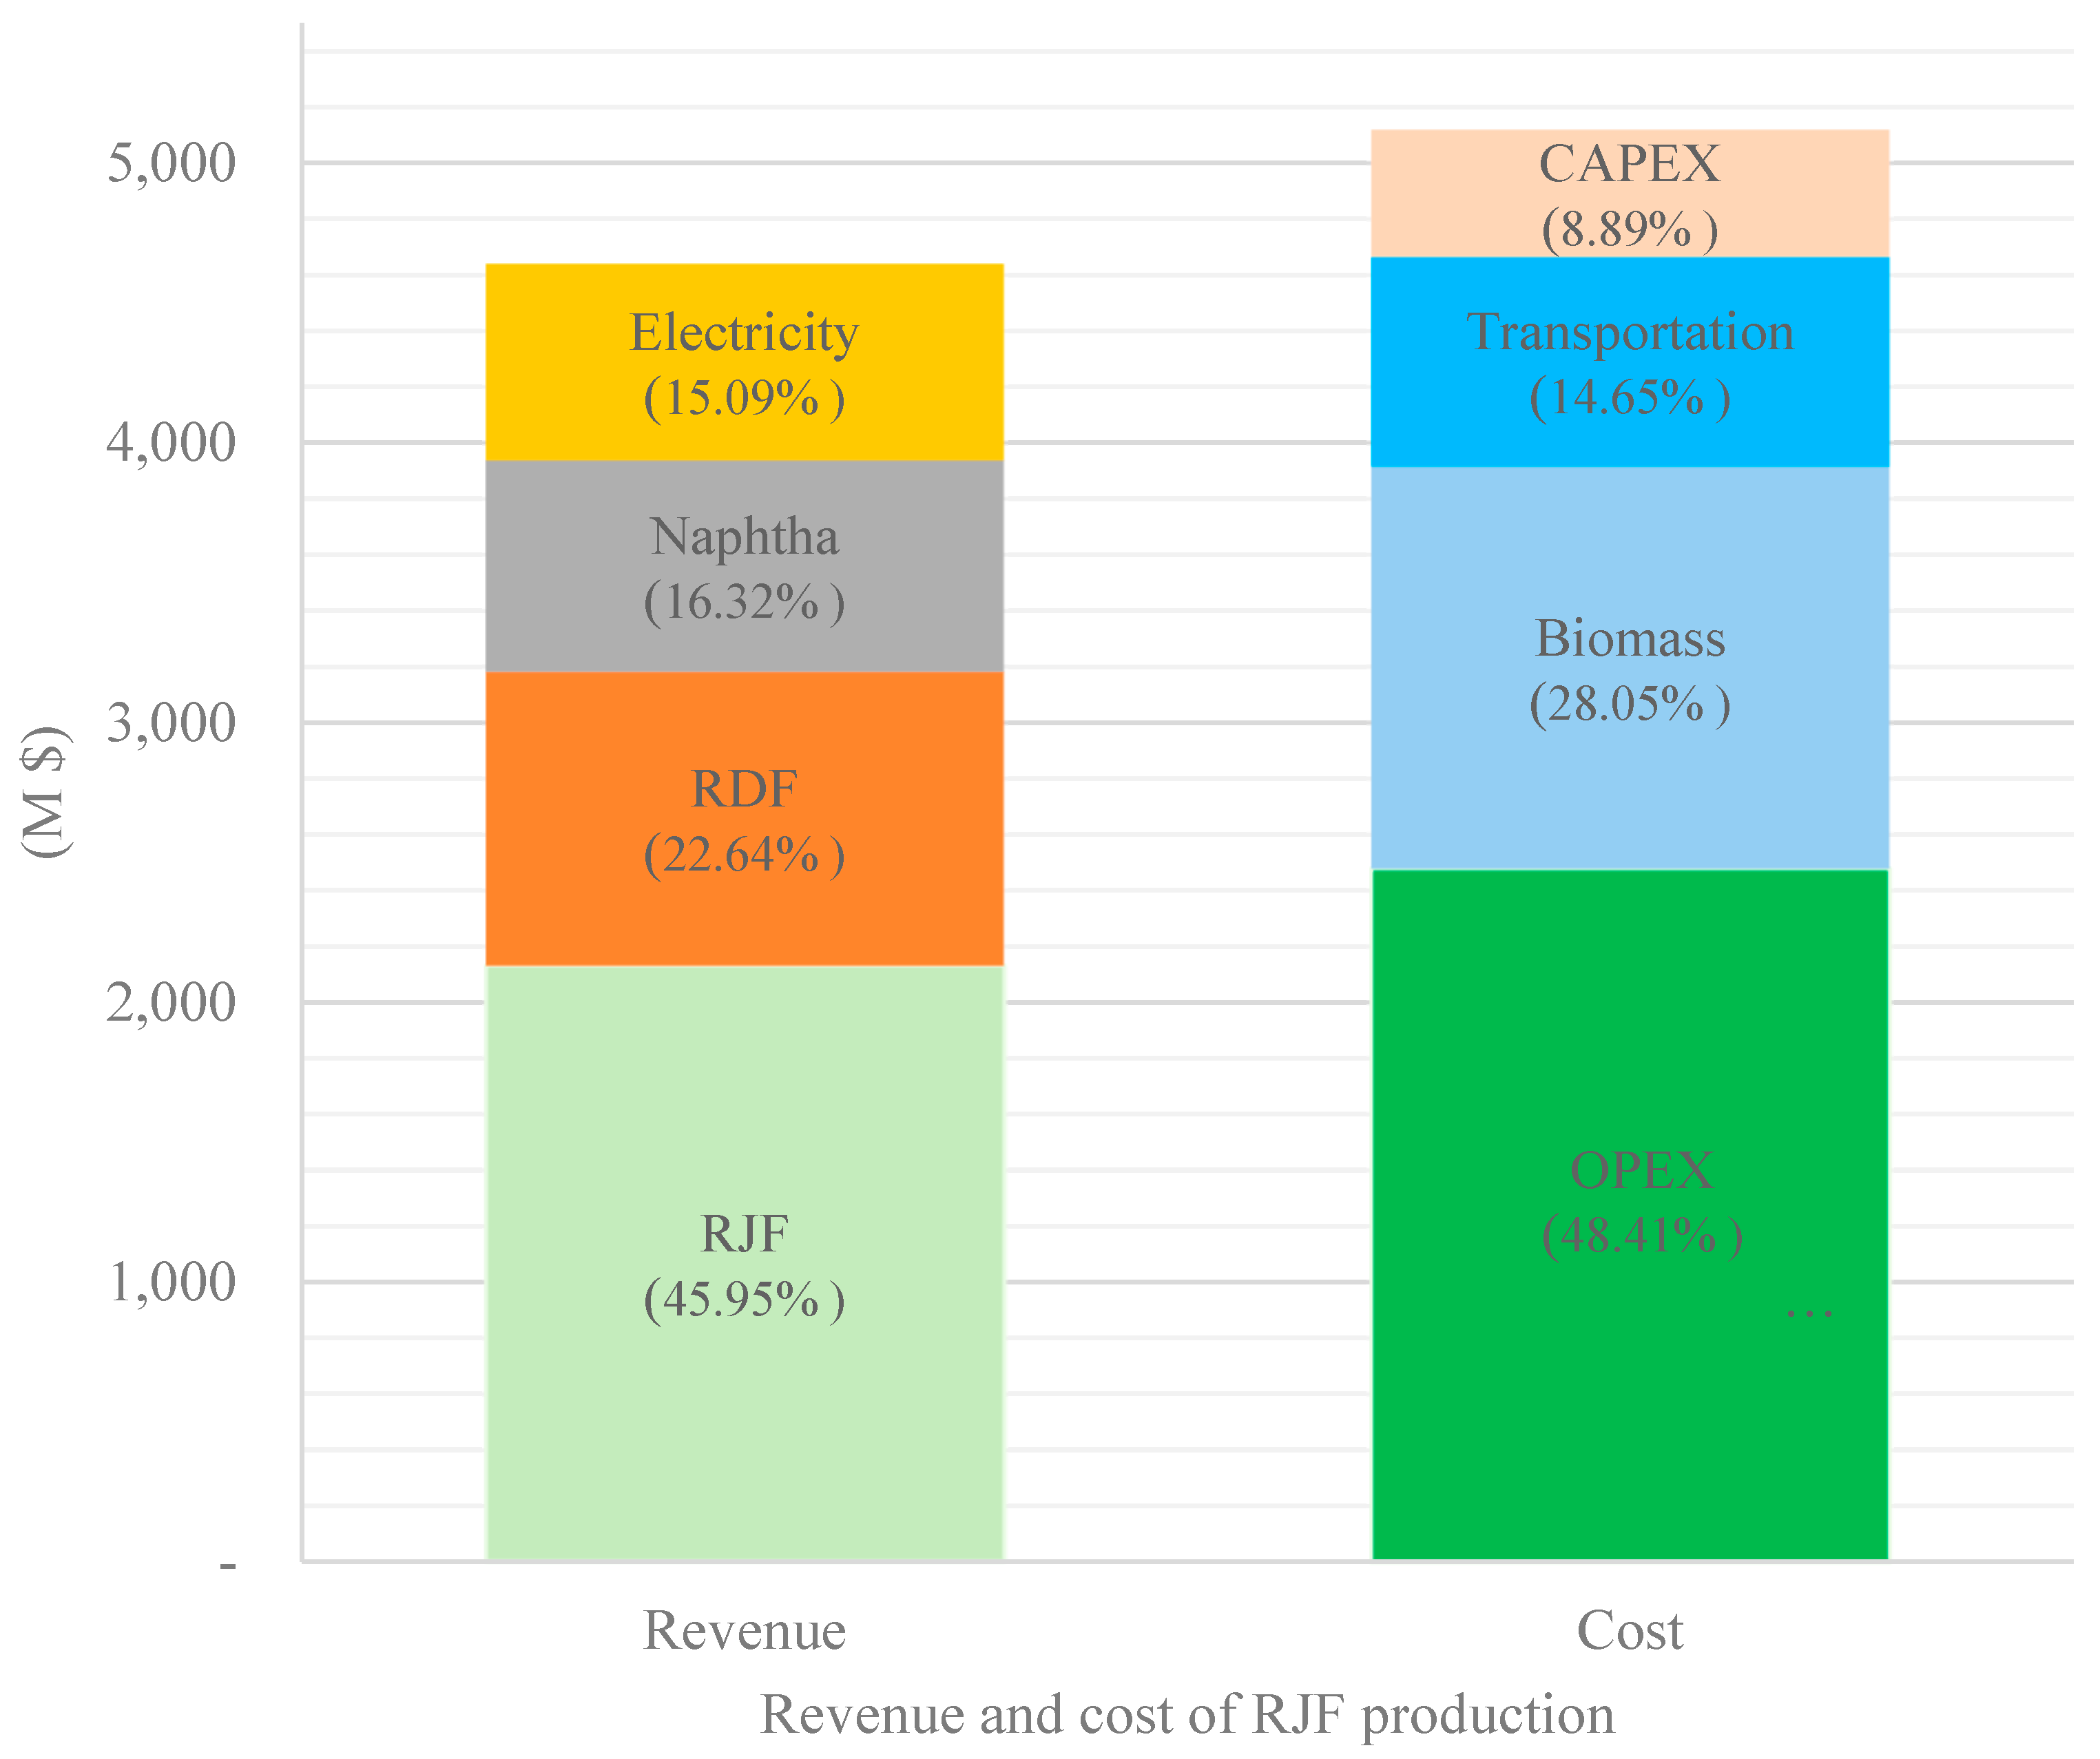
Figure 4.
Configuration of the RJF supply chain for the base model.
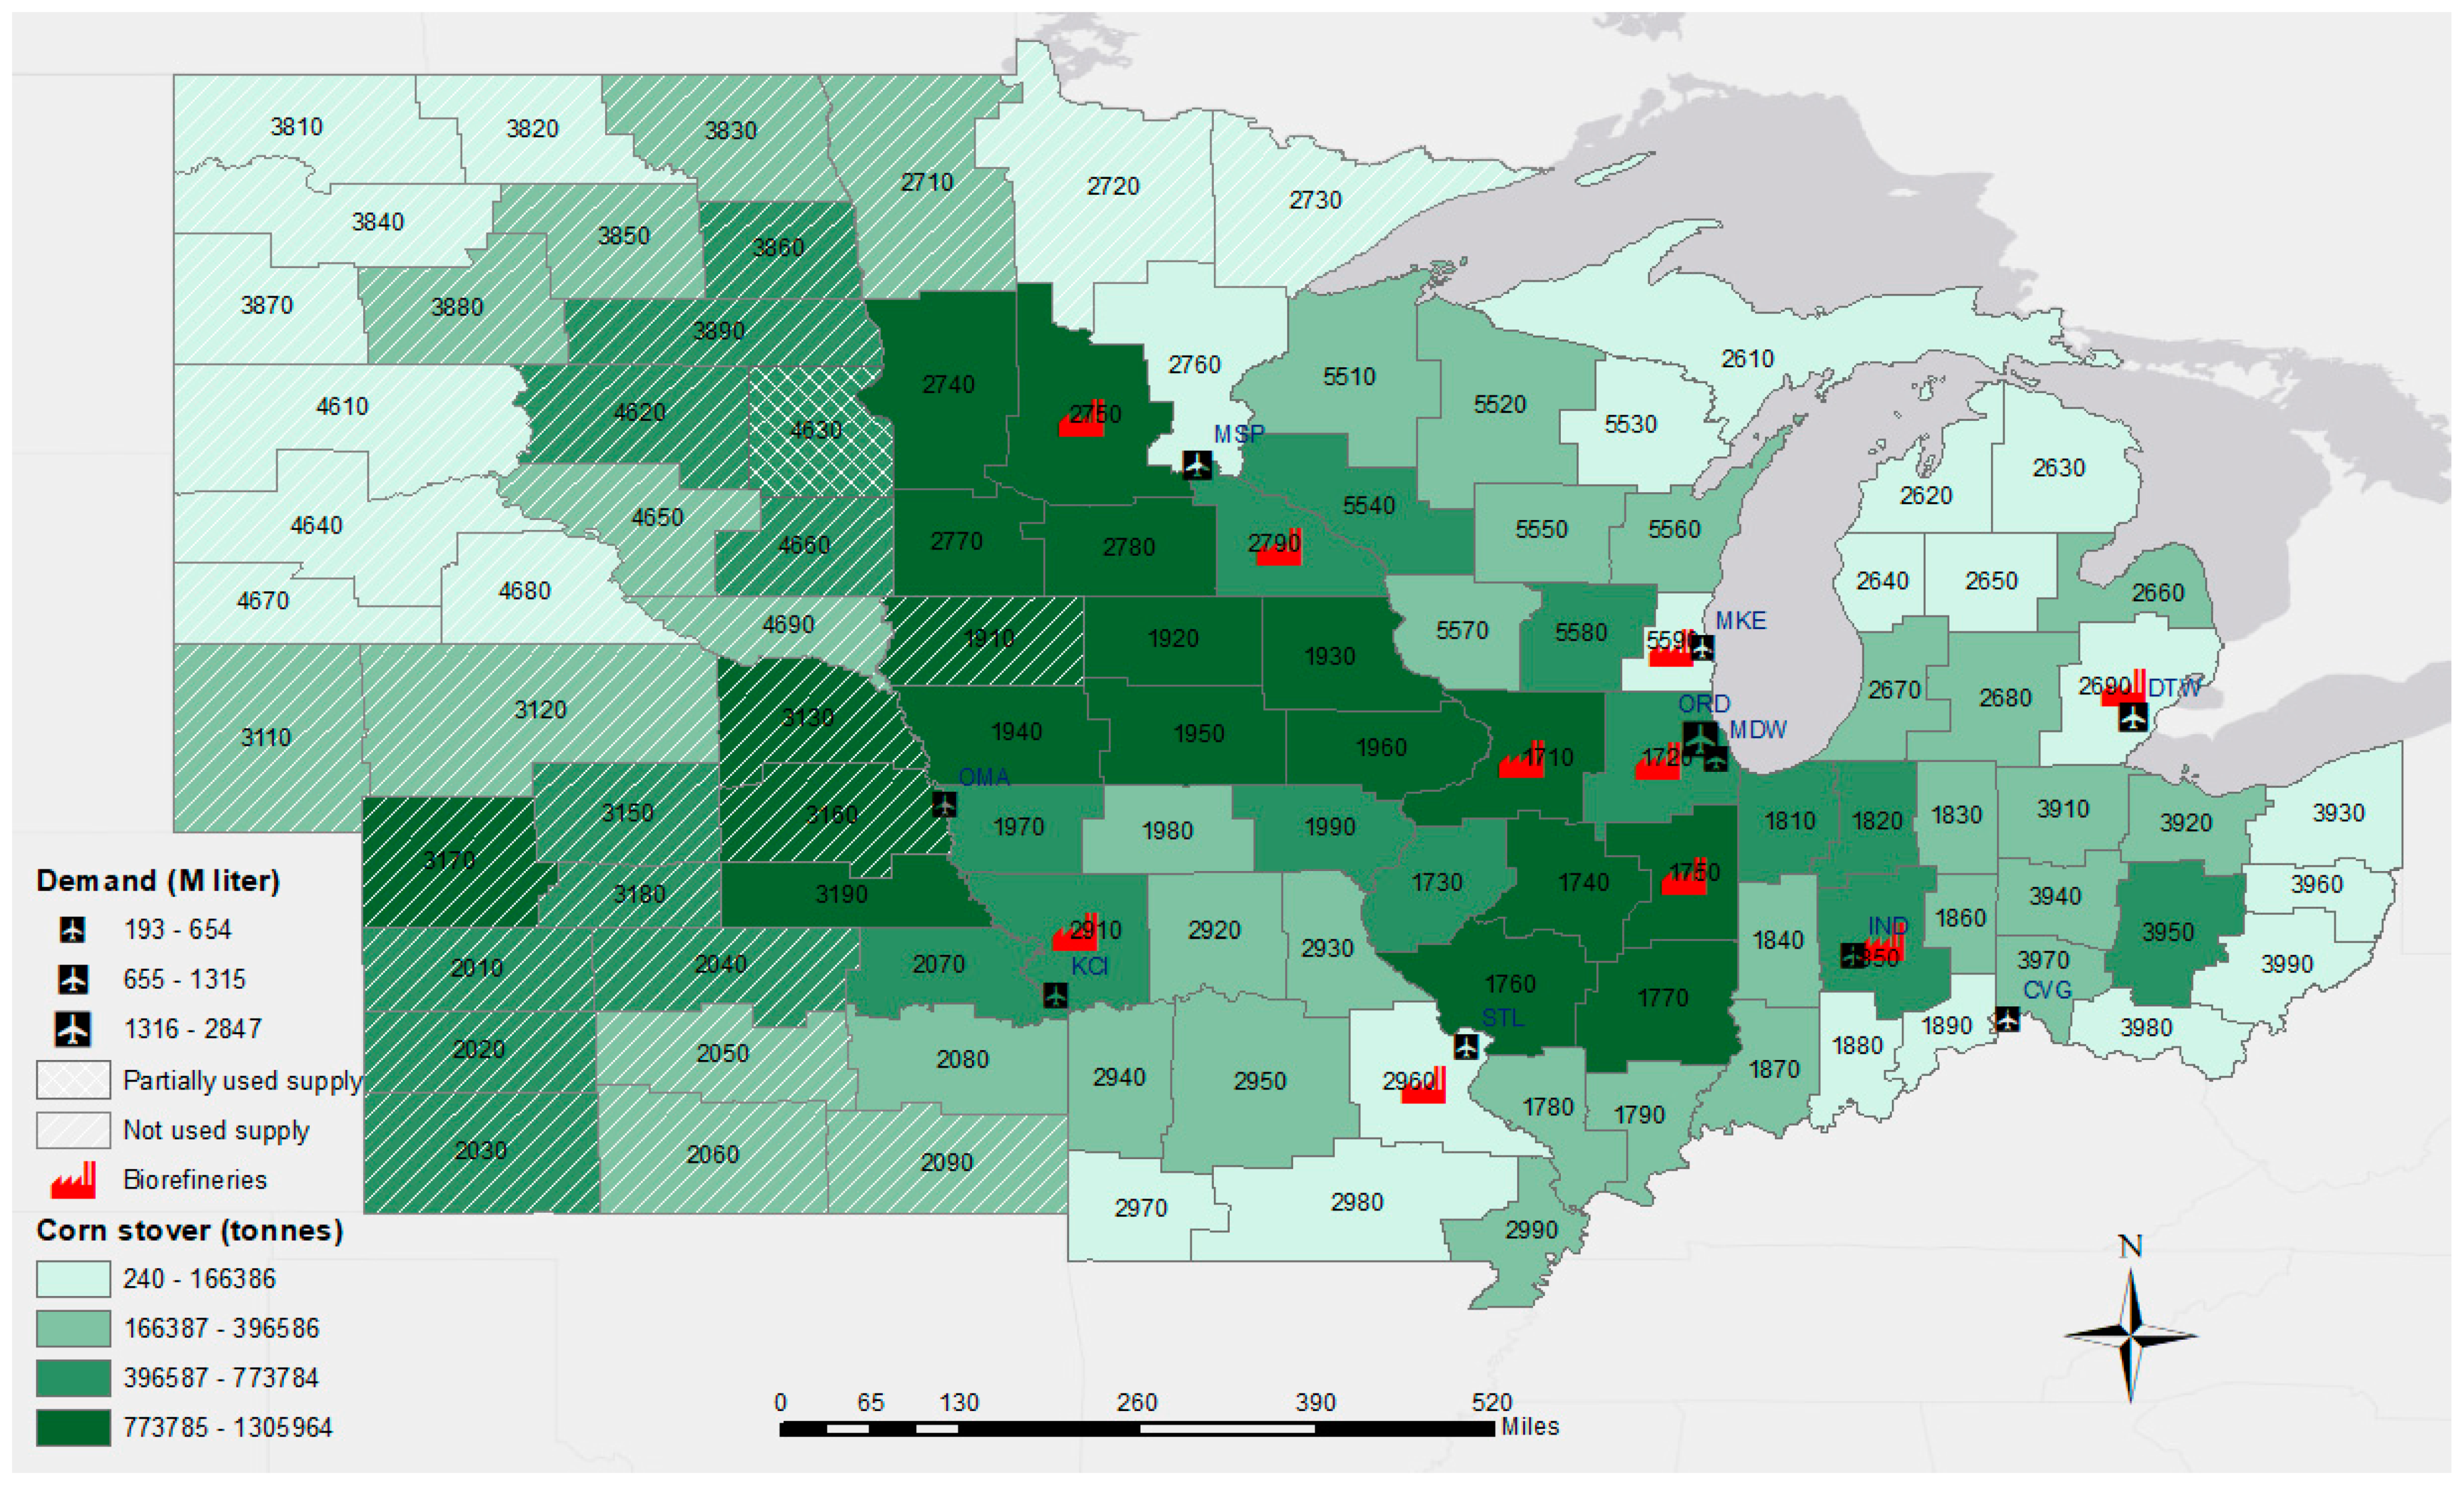
Figure 5.
RJF supply chain profit, with regard to various PCP incentive scenarios.
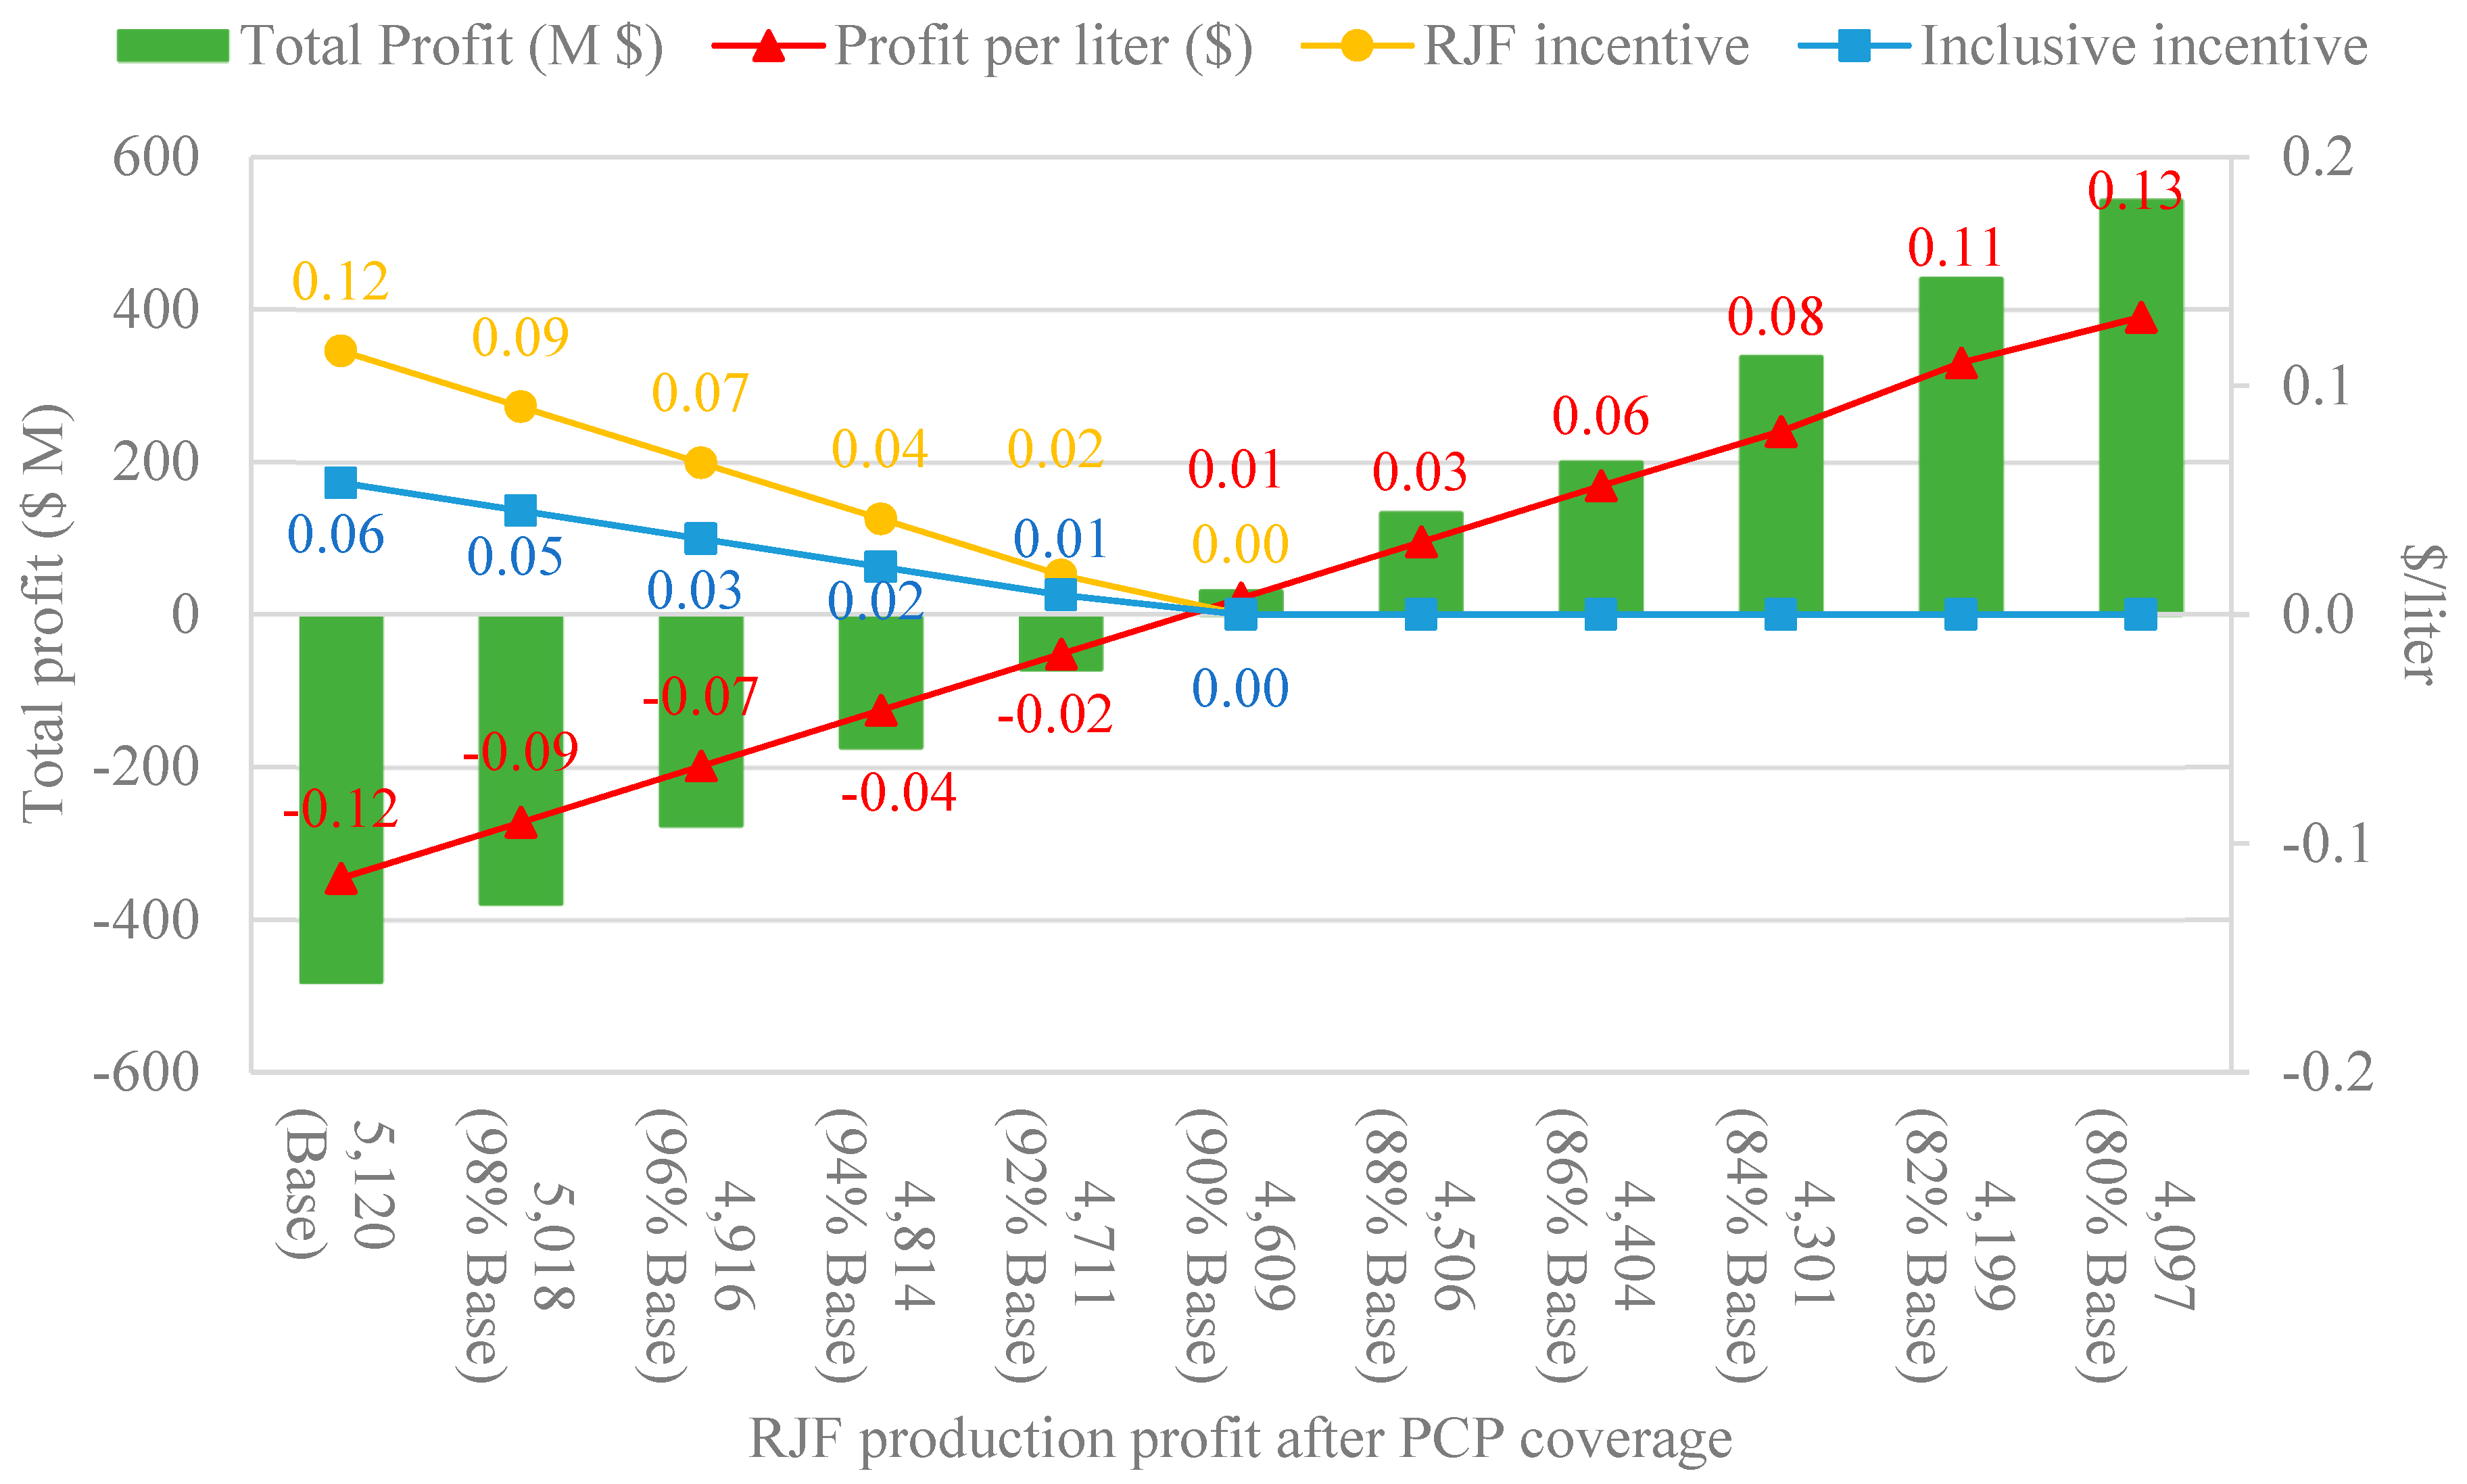
Figure 6.
RJF production profit, with regard to various BCAP incentive scenarios.
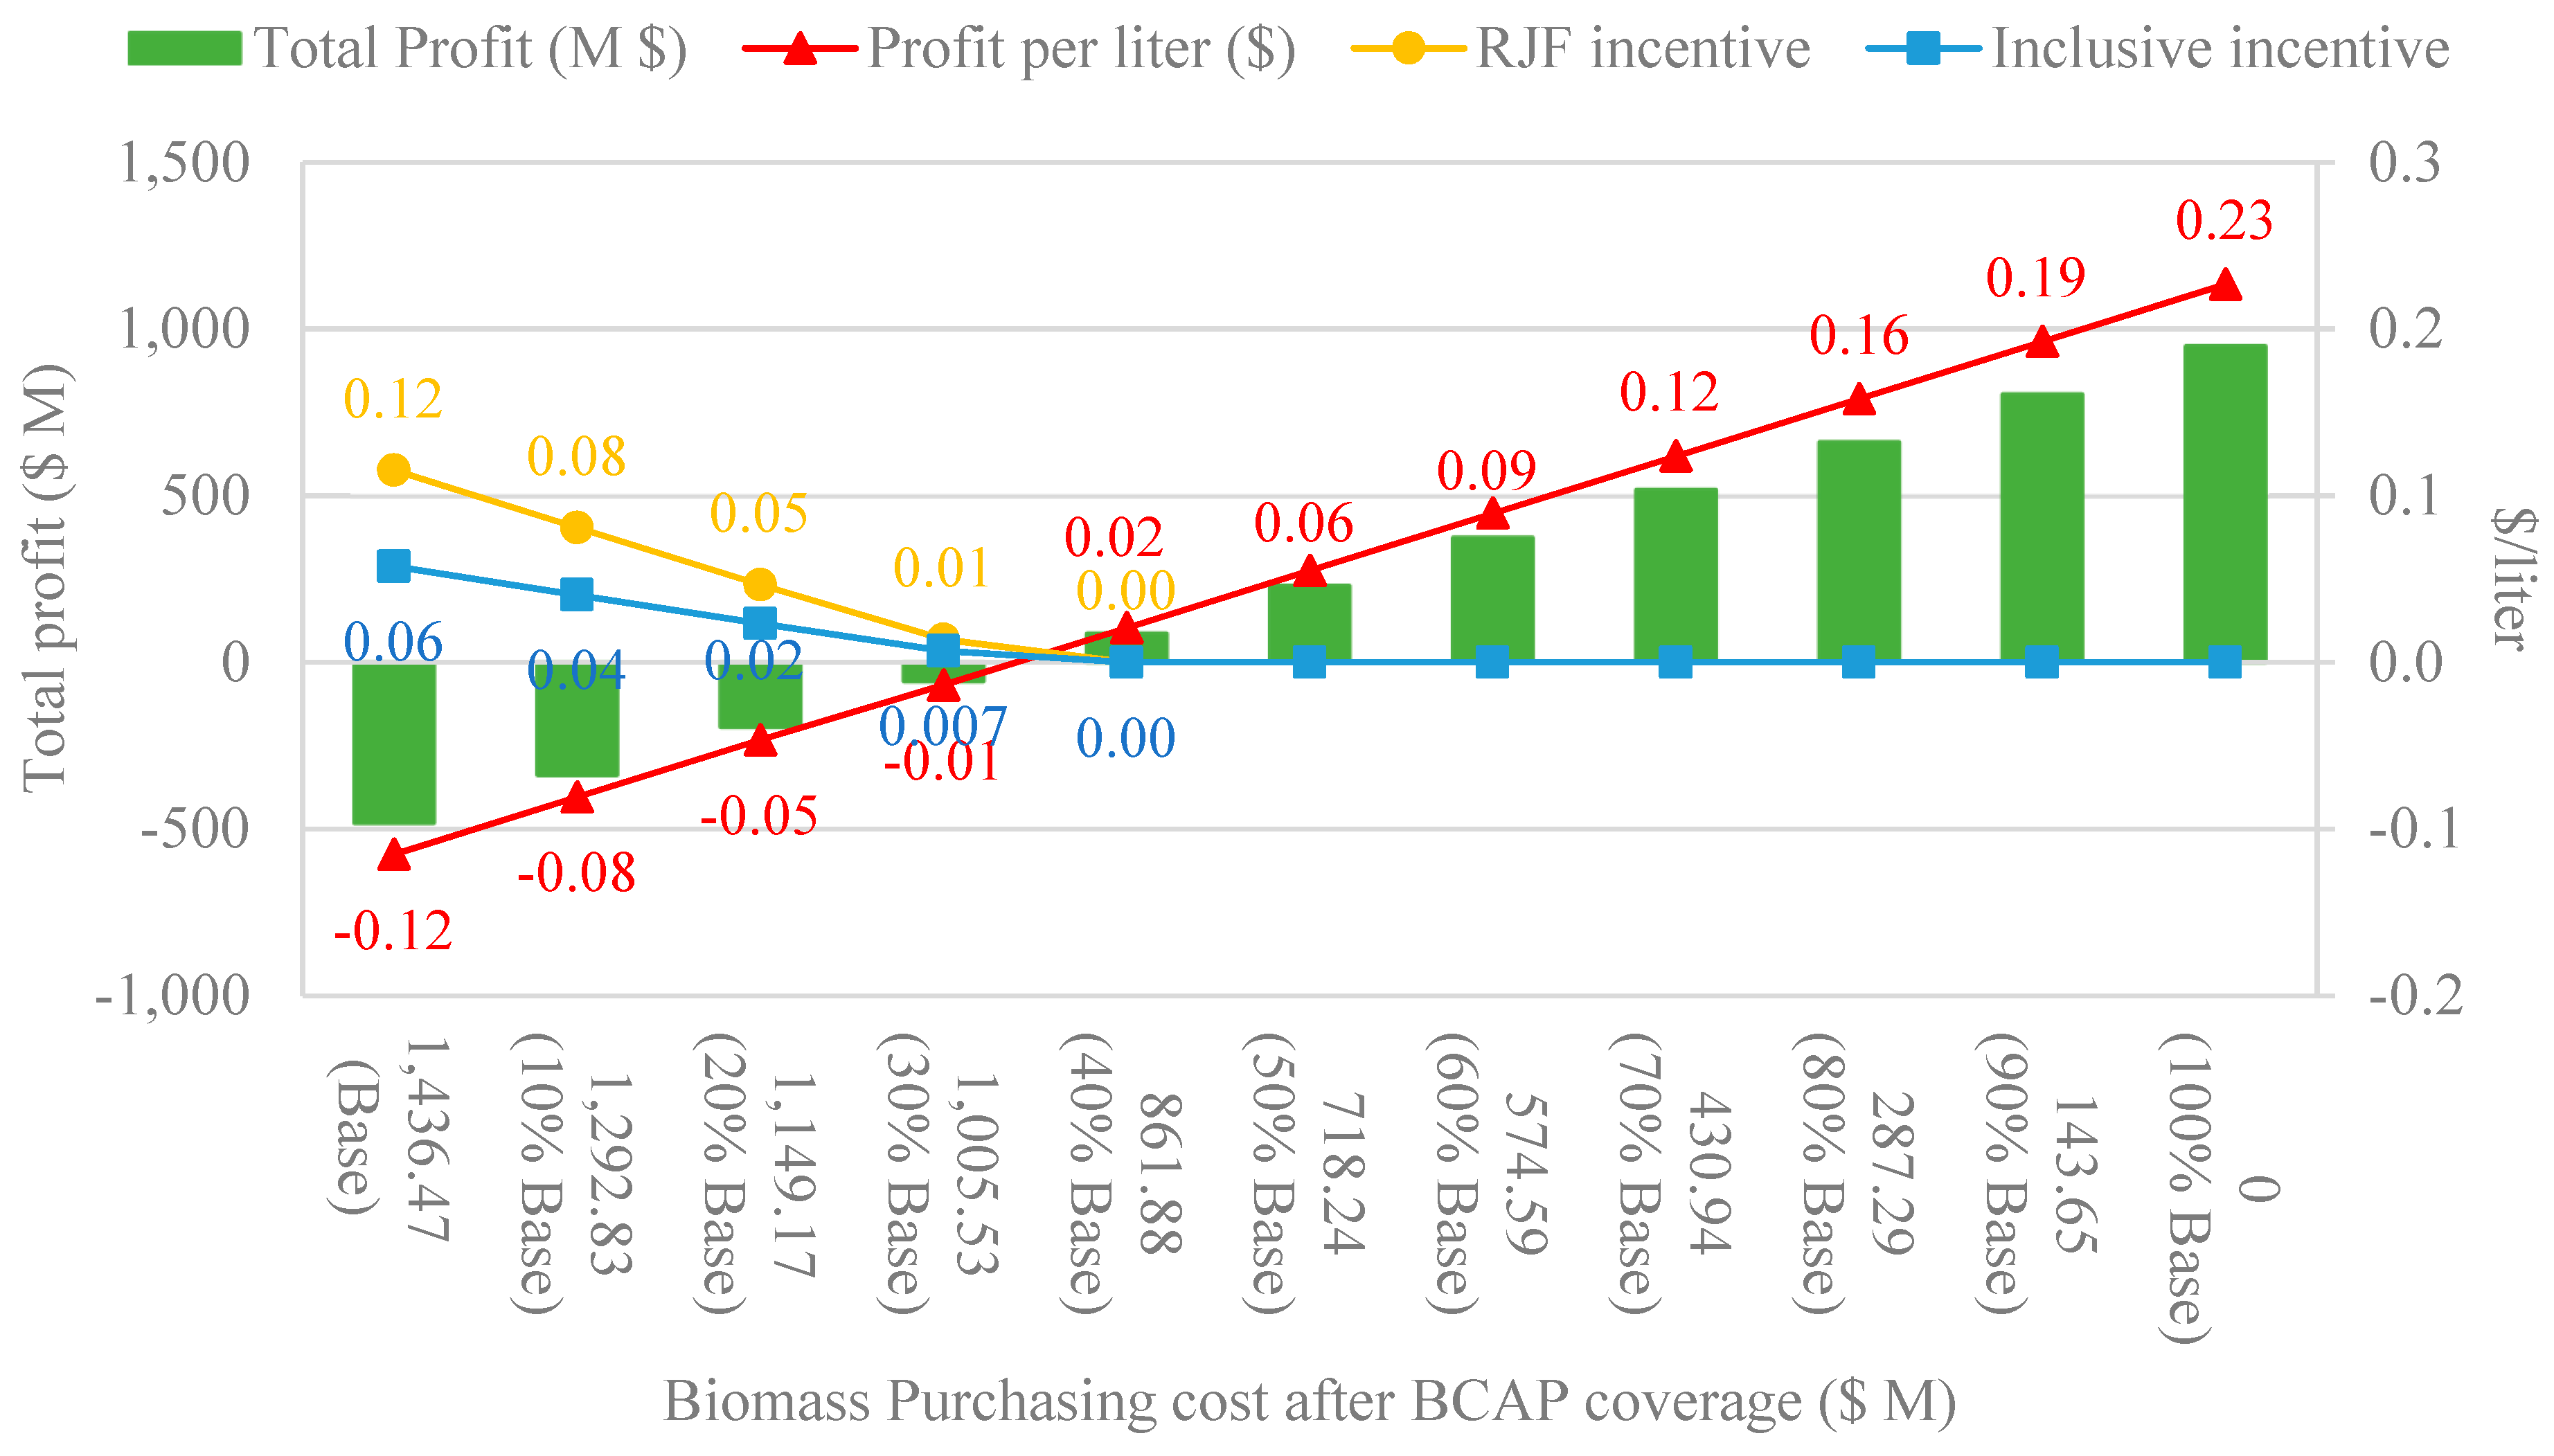
Figure 7.
RJF supply chain profit, with regard to various BAP incentive scenarios.
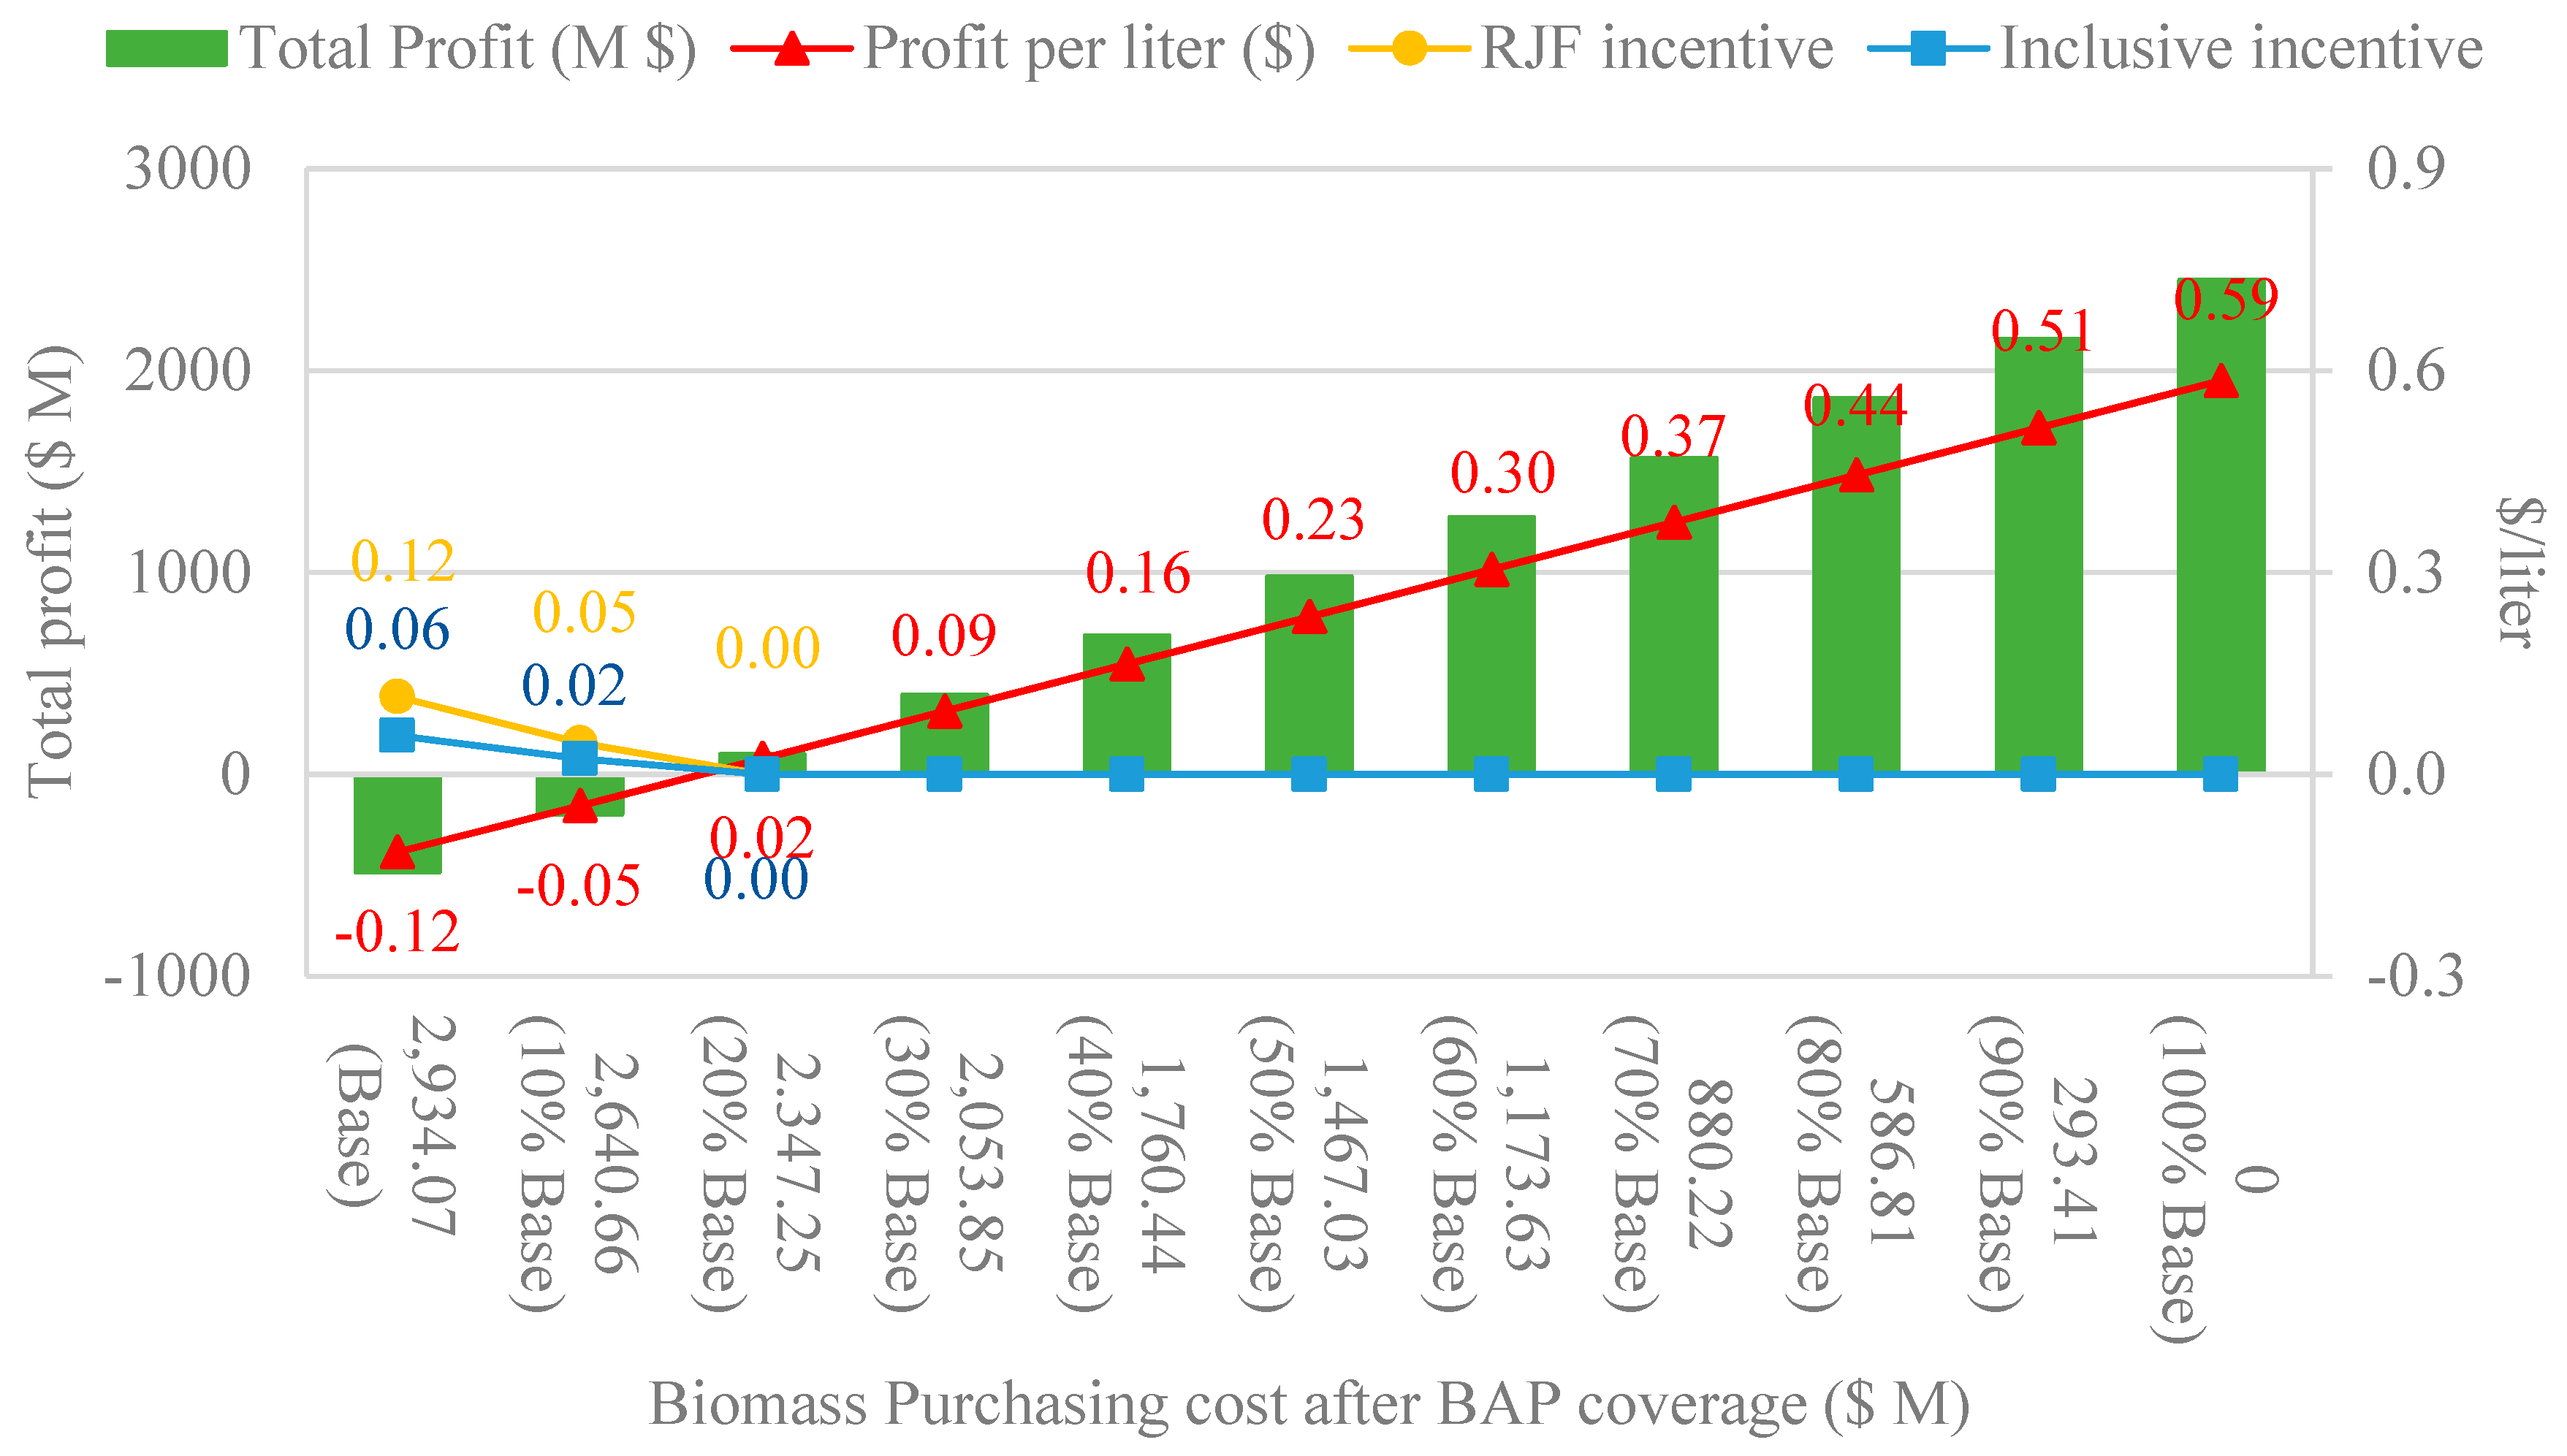
Figure 8.
The effects of different demand fulfillment rates on RJF supply chain profitability.
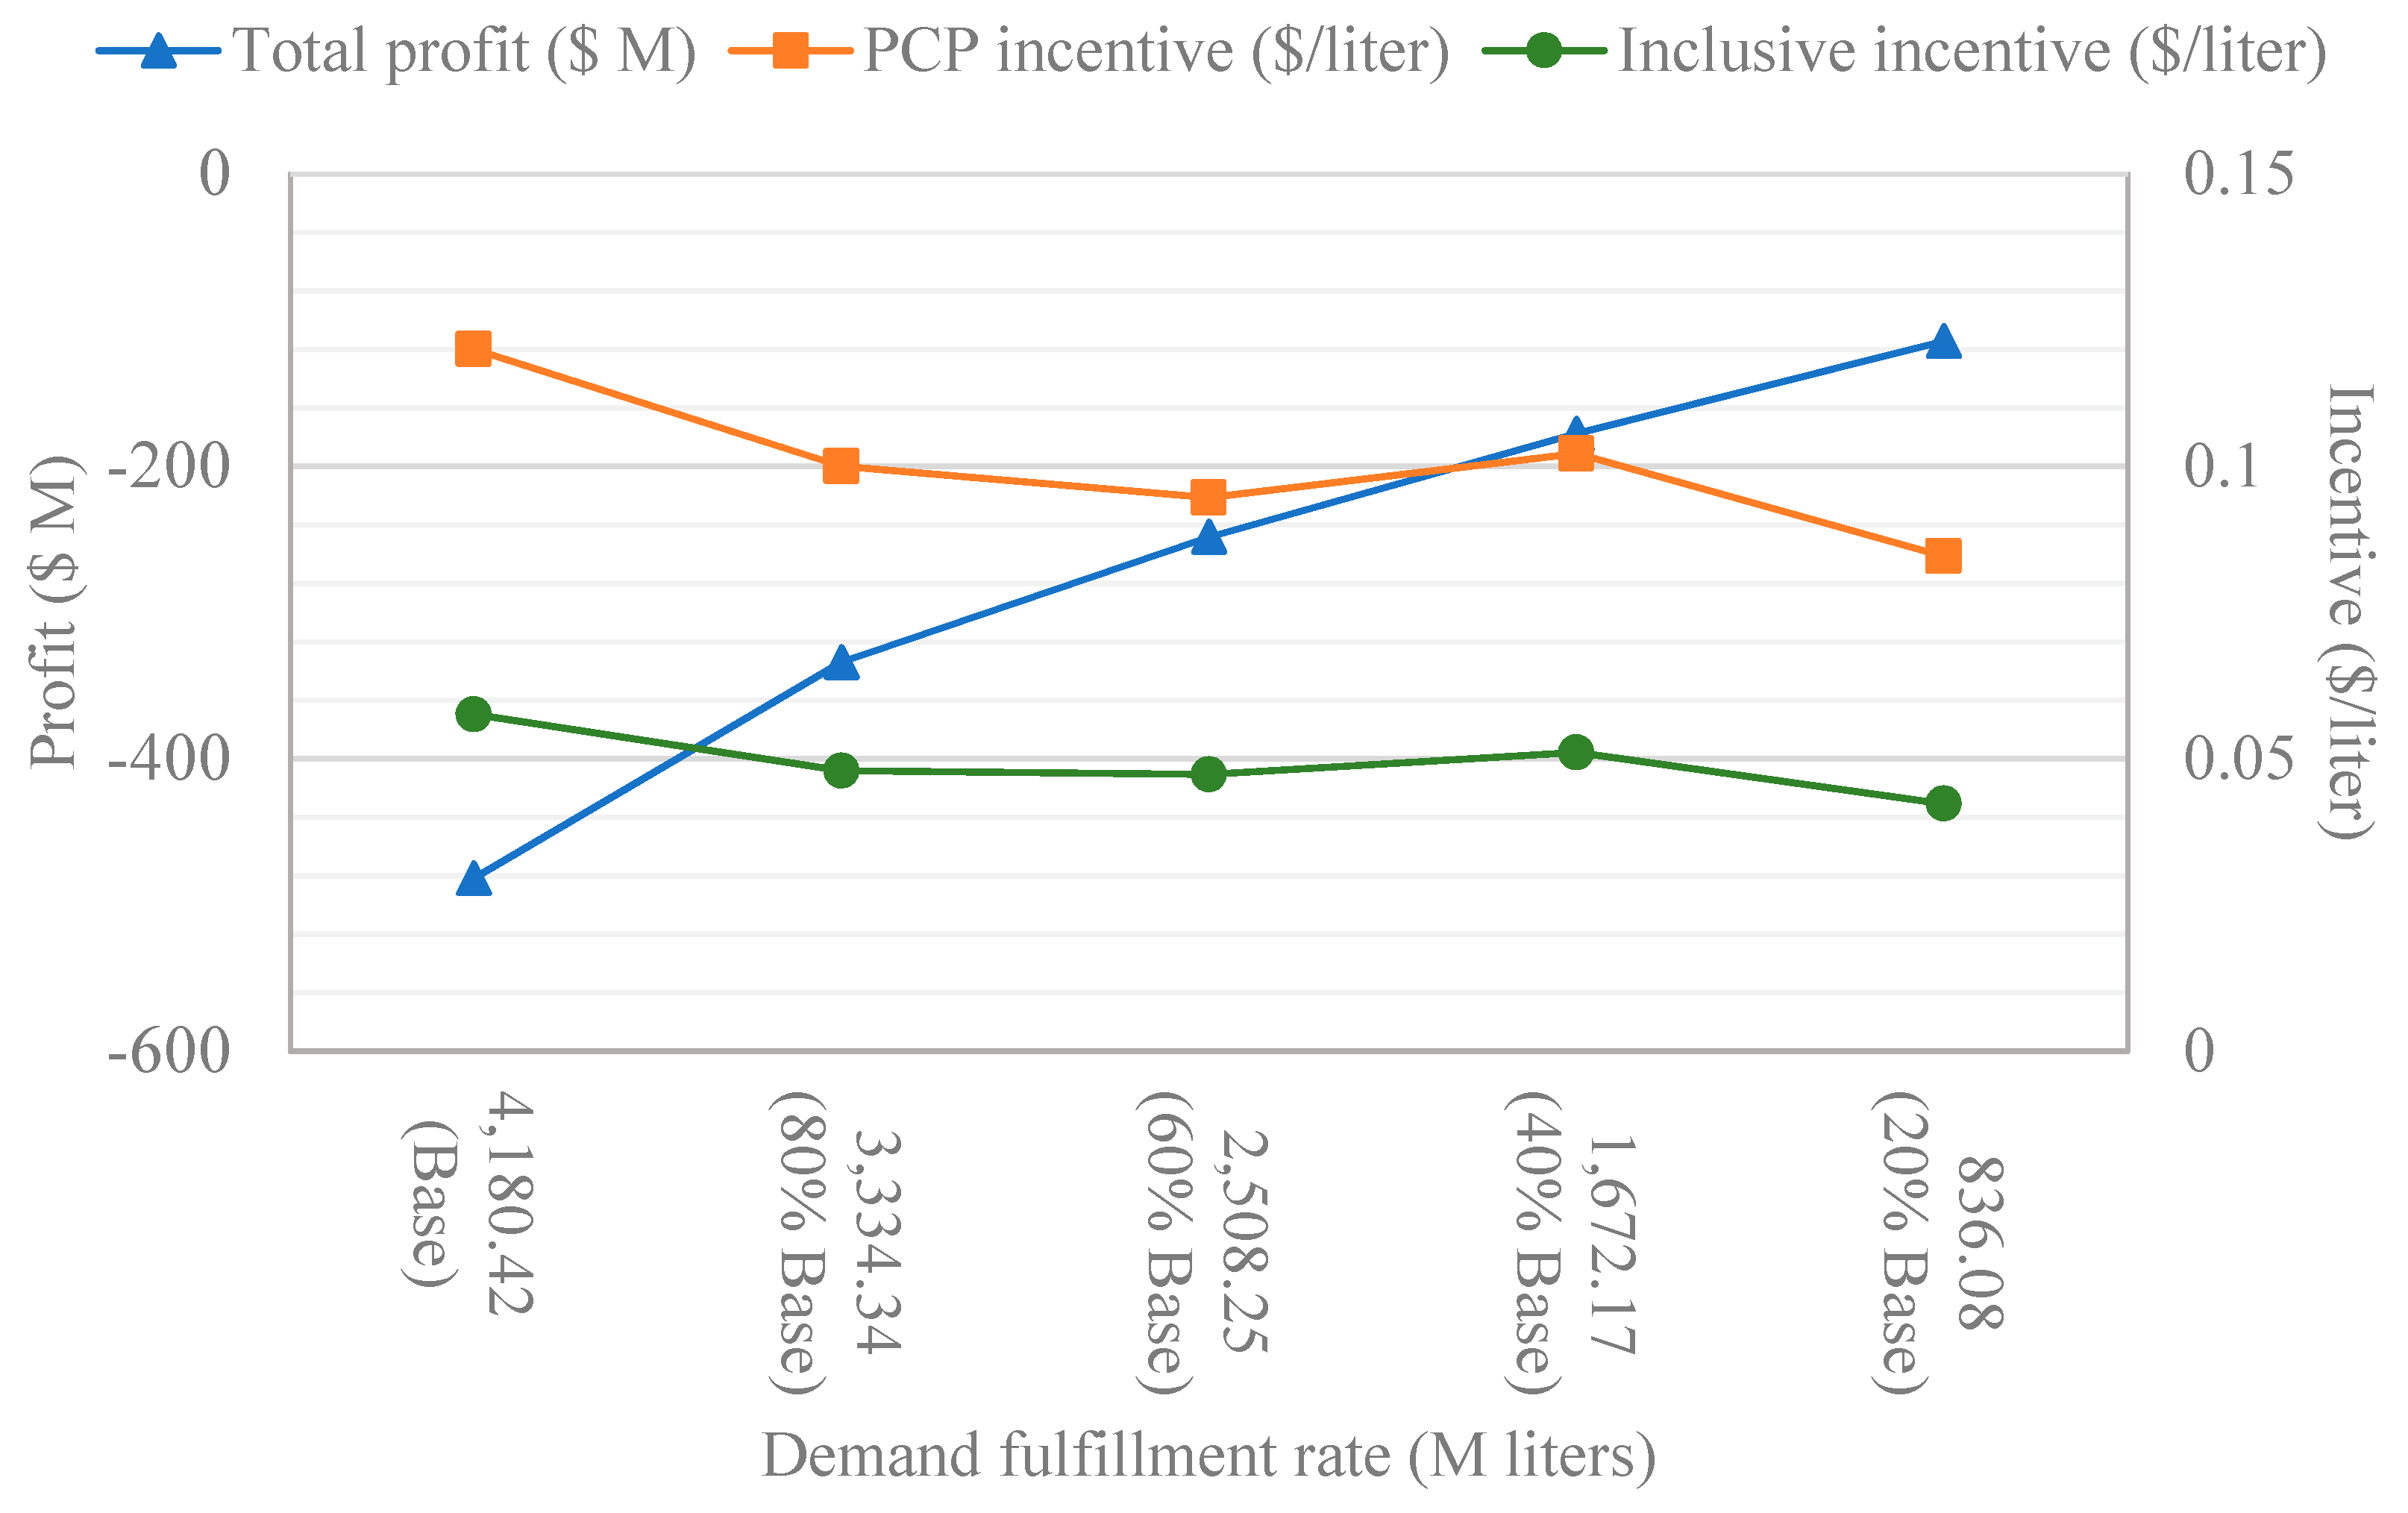
Table 1.
The estimated RJF demand in the airports.
| Airports | Total Jet fuel demand (MLPY) | Estimated RJF demand (MLPY) |
|---|---|---|
| O’Hare International Airport (ORD) | 2,846.51 | 1,423.25 |
| Minneapolis-Saint Paul International Airport (MSP) | 1,301.50 | 650.75 |
| Detroit Metropolitan Wayne County Airport (DTW) | 1,314.88 | 657.44 |
| Chicago Midway International Airport (MDW) | 653.79 | 326.90 |
| St. Louis Lambert International Airport (STL) | 618.58 | 309.29 |
| Kansas City International Airport (KCI) | 415.03 | 207.51 |
| Indianapolis International Airport (IND) | 375.96 | 187.98 |
| Cincinnati/Northern Kentucky International Airport (CVG) | 365.37 | 182.69 |
| General Mitchell International Airport (MKE) | 276.33 | 138.16 |
| Eppley Airfield (OMA) | 192.90 | 96.45 |
| Total | 8,360.84 | 4,180.42 |
Table 2.
Sets, decision variables, and parameters.
| Indices | Description | Indices | Description |
|---|---|---|---|
| Sets | Parameters | ||
| Set of suppliers, indexed by i | Transportation fixed cost of corn stover via truck ($/tonne) | ||
| Set of biorefineries, indexed by k | Transportation variable cost of corn stover via truck ($/tonne-km) | ||
| Set of demand zones, indexed by e | Transportation fixed cost of RJF via truck ($/liter) | ||
| Set of byproducts, indexed by j; naphtha, RDF, and electricity | Transportation variable cost of RJF via truck ($/liter-km) | ||
| Variables | Selling price of byproduct j ($/liter) | ||
| 1 if a biorefinery is activated at location k; 0 otherwise | Annual RJF demand level at demand node e (liter) | ||
| Quantity of biomass transported from supply area i to biorefinery k (tonnes) | Production cost of RJF at biorefinery ($/liter) | ||
| Quantity of RJF transported from biorefinery k to demand zone e (liters) | ) in the carbon market ($) | ||
| Quantity of byproduct j produced at biorefinery k (liters) | ) in the carbon market ($) | ||
| Number of carbon credits purchased | Emission factor of transporting corn stover ( /tonne-km) | ||
| Number of carbon credits sold | Emission factor of transporting RJF ( /liter-km) | ||
| RJF selling price ($/liter) | Emission factor of corn stover acquisition ( /tonne) | ||
| BAP discount rate | Emission factor of producing RJF from corn stover ( /liter) | ||
| BCAP discount rate | Distance from supplier i to biorefinery k (km) | ||
| Monetary incentive for PCP program ($/liter) | Distance from biorefinery k to demand zone e (km) | ||
| Selling price of corn stover ($/tonne) | Capacity of a biorefinery (tonne) | ||
| Quantity of corn stover available at supply node i | Annualized fixed cost of biorefinery ($) | ||
| RJF conversion rate from corn stover (liter/tonne) | Annualized variable cost of biorefinery ($) | ||
| Conversion rate of fuel byproduct j from corn stover (liter/tonne) | Carbon capacity allowed for the RJF supply chain (kg ) | ||
Table 3.
Supply chain performance under CT.
| Carbon cap with regard to emission created by fossil-based jet fuel | |||||
|---|---|---|---|---|---|
| Base | 25% | 50% | 75% | 100% | |
| Total profit ($ M) | -481.65 | 126.59 | 826.27 | 1,526.82 | 2,210.26 |
| Sold carbon credit (Mg) | 0 | 2,795 | 6,013 | 9,236 | 12,442 |
| Profit per liter ($) | -0.12 | 0.03 | 0.19 | 0.37 | 0.53 |
Disclaimer/Publisher’s Note: The statements, opinions and data contained in all publications are solely those of the individual author(s) and contributor(s) and not of MDPI and/or the editor(s). MDPI and/or the editor(s) disclaim responsibility for any injury to people or property resulting from any ideas, methods, instructions or products referred to in the content. |
© 2023 by the authors. Licensee MDPI, Basel, Switzerland. This article is an open access article distributed under the terms and conditions of the Creative Commons Attribution (CC BY) license (https://creativecommons.org/licenses/by/4.0/).
Copyright: This open access article is published under a Creative Commons CC BY 4.0 license, which permit the free download, distribution, and reuse, provided that the author and preprint are cited in any reuse.


