
Submitted:
17 July 2025
Posted:
21 July 2025
You are already at the latest version
Abstract
Fuel scarcity remains a persistent issue in Nigeria, disrupting daily activities and economic stability. This study proposes a mathematical model to investigate the downstream petroleum sector, focusing on the distribution of petroleum products for domestic consumption. The model captures critical factors such as vandalism, industrial actions, diversion, and hoarding, which contribute to fuel scarcity. The feasibility, positivity of solutions, and existence and uniqueness of the model were established to validate its applicability to real - world scenarios.Five equilibrium points were identified, representing various states of fuel distribution. A critical supply threshold of 42 million liters per day was derived for PMS, which means the minimum volume needed to meet consumer demand and eliminate fuel queues. Stability analyses using Lyapunov functions and Routh - Hurwitz criteria demonstrated that effective distribution can be sustained under favorable government policies. Numerical simulations revealed that the hoarding of PMS by private retail marketers significantly worsens the scarcity, while industrial actions would have a more severe impact than pipeline vandalism.The study underscores the importance of alternative transportation methods, such as rail, to mitigate challenges in the downstream sector, including poor road infrastructure and pipeline vandalism. Recommendations include the government to intensify efforts to foster a conducive environment for stakeholders, improve monitoring mechanisms for private marketers, and optimize fuel transportation systems.Although the model generalizes refinery sources and assumes rail as a transportation alternative, it provides a robust framework for understanding fuel distribution dynamics. The framework is adaptable to other oil-producing and non-oil-producing countries, offering valuable insights for policymakers and stakeholders in energy distribution systems.
Keywords:
downstream
; mathematical model
; vandalism
; product hoarding and diversion
; fuel scarcity
1. Introduction
Petroleum products, the lifeblood of Nigeria’s economy, are critical for powering industries, transportation, and households across the nation. However, the persistent scarcity of these refined products has posed significant challenges, hampering economic growth and adversely affecting the general populace. A deeper understanding of the distribution system is essential for formulating effective strategies to eradicate scarcity and ensure a consistent and reliable supply of petroleum products.
Crude oil exploration in Nigeria dates back to 1908, when the Shell Darcy Development Petroleum Company commenced operations in Okitipupa and Araromi, in present-day Ondo State [1,2,3,4]. These efforts continued until 1938 [4]. In 1956, Shell-BP discovered crude oil in commercial quantities in Oloibiri, Rivers State [2]. This landmark discovery positioned Nigeria among the ranks of oil-producing nations, with its first oil field going operational in 1958, producing 5,100 barrels per day [5,6,7]. Since then, oil production has grown significantly [8].
Nigeria boasts four refineries with a combined installed production capacity of 445,000 barrels per day [9,10,11], initially adequate to meet domestic consumption and allow for exports. Recently, six additional refineries with a total refining capacity of 41,000 barrels per day were established between 2020 and 2022 [12]. Despite this infrastructure and Nigeria’s proven oil reserves [1,3], the country has yet to fully harness its potential to meet domestic demand for refined products.
Paradoxically, while Nigeria is Africa’s largest crude oil producer and one of the continent’s largest exporters [11,12], it remains plagued by recurrent shortages of refined petroleum products. The country imports the majority of its refined products (e.g., kerosene, PMS, aviation kerosene, and diesel) to meet domestic needs [13]. Overreliance on imported refined products, coupled with an aging and inefficient distribution infrastructure, has contributed to chronic scarcity. This scarcity disrupts economic activities, increases operational costs, and fuels public dissatisfaction.
Efforts to address the problem, which spans from military administrations to the current democratic dispensation, have not yielded lasting solutions [14]. Nigeria remains one of the few oil producing countries that imports 95% of its domestic petroleum products [5,12,15]. The smuggling of refined products, particularly PMS, to neighboring countries where pump prices are significantly higher, exacerbates the situation. Fuel-loaded trucks intended for Nigerian service stations are often diverted to these border towns by smugglers to make more money [16].
To address these systemic issues, the Nigerian government recently deregulated the petroleum sector by removing fuel (PMS) subsidies and enacting the Petroleum Industry Act (PIA) [17]. These measures aim to minimize, if not eradicate fuel scarcity and attract private sector investment [2,10,13,18,19]. However, challenges such as pipeline vandalism, road transportation inefficiencies, hoarding, smuggling, and Nigeria’s growing population continue to strain the downstream sector.
The Dangote Refinery, a multibillion-dollar project nearing operational commencement, is widely anticipated to transform Nigeria’s fuel supply landscape. Many citizens view the refinery as a potential game-changer for addressing the nation’s domestic fuel demand. Despite significant government investment, concerns persist regarding the state of supporting infrastructure. Poor road conditions around the refinery pose serious risks to safety and logistics. Moreover, the Petroleum Industry Act (PIA) lacks provisions for road infrastructure improvements or alternative transportation routes, leaving critical gaps in planning and preparedness.
This study aims to address these challenges by examining the historical and current state of Nigeria’s downstream sector, with a focus on issues such as pipeline vandalism, industrial actions by oil and gas workers, and the hoarding and diversion of petroleum products. It provides insights from a novel mathematical model designed to guide decision-makers in managing the downstream sector more effectively. Additionally, the study seeks to demystify the operations of the NNPC’s downstream activities for public understanding while emphasizing the need for sustainable and effective policies to benefit all stakeholders.
The remainder of the manuscript is organized as follows: a glossary of terms and abbreviations clarifies technical terminology in Table 1. Section 2 describes the model and its formulation. Section 3 explores the mathematical properties of the model and presents analytical results. Numerical simulations and their interpretations are detailed in Section 4 . Finally, Section 5 summarizes the key findings, draws conclusions, and outlines the study’s limitations.
2. Scientific Approach and Model Formulation
This section outlines the scientific methodology employed, reviews related studies, and presents the formulation of the proposed model.
2.1. Scientific Approach, Literature Review, and Justification
Mathematical models provide a systematic approach to representing real-world systems, enabling critical analysis and informed decision-making [20,21,22,23]. According to Rutherford Aris: "a set of mathematical equations that provide an adequate description of a physical system."
Mathematical modeling has been extensively applied in epidemiology to study population dynamics and disease transmission [24,25]. Its applications have expanded into social sciences, including economic and energy systems [26,27,28,29,30], with studies emphasizing global stability analysis and compartmental frameworks for complex systems [31,32].
Modeling has also been instrumental in optimizing energy systems. For example, a bilevel mixed-integer nonlinear programming model integrates supply chain design with competitive market dynamics to optimize fuel pricing [33]. Gasification models for solid fuels incorporate temperature, pressure, and fuel composition to enhance syngas production [34,35]. Additionally, research on fuel mixture ignition highlights the impact of droplet size distribution on combustion efficiency [36], while graph theory and differential equations improve operational planning for underground gas storage [37].
Despite these advancements, studies on Nigeria’s downstream petroleum sector primarily focus on operational challenges rather than intrinsic efficiency and effectiveness, which are crucial for ensuring value for money. Key issues include pipeline vandalism, governance inefficiencies, and supply disruptions [14,38,39,40,41,42]. Weak regulatory frameworks hinder coordination among stakeholders [9], while transportation and storage losses further exacerbate shortages [9,43,44].
2.2. Justification for the Compartmental Model
A compartmental model is well-suited for analyzing Nigeria’s petroleum sector due to its complexity, as highlighted by the Organization of Economic Cooperation (OEC) [15]. These models divide systems into manageable sub-populations governed by ordinary differential equations (ODEs), allowing for quantitative analysis and prediction [45,46]. Widely used in epidemiology, biology, and social sciences, they offer a structured way to analyze system dynamics, integrate diverse data, and derive analytical solutions [47,48,49].
Unlike Agent-Based Models (ABMs), which simulate individual interactions, or statistical models, which focus on correlations, compartmental models emphasize population-level dynamics and mechanistic relationships [50,51]. While they involve simplifying assumptions and challenges in parameter estimation, they remain effective for studying nonlinear systems [46,48].
Fuel scarcity in Nigeria affects nearly all citizens, with inflationary consequences sparing only a few elites and top officials. Given the sector’s complexity and the limited availability of detailed data, a compartmental approach provides a practical and efficient framework for studying fuel distribution challenges. By capturing key factors influencing supply and disruptions, this model offers a structured approach for evaluating policy interventions and improving system resilience.
2.3. A Guide to Model Formulation
The operational framework of the Petroleum Products Marketing Company (PPMC), as outlined on the Nigerian National Petroleum Corporation (NNPC) webpage [52], serves as the primary guide for this model formulation, supported by additional resources such as [2,10,17,38,53,54]. The petroleum distribution network in Nigeria involves pipelines connecting 21 white product depots and tank farms nationwide [43,55]. However, frequent acts of vandalism have led the Nigerian government and NNPC management to restructure the old PPMC into the Nigerian Pipelines and Storage Company (NPSC), PPMC, and NNPC Shipping [3,52]. This model is based on that restructuring, aiming to eliminate product shortages at the consumer level.
2.4. Model Formulation
The proposed model captures the flow of petroleum products across key nodes in Nigeria’s downstream sector. The system consists of six compartments:
- Product Refinement/Importation : Initial supply of petroleum products
- Transporter/NUPENG/PENGASSAN/PPMC: Distributors responsible for delivering products to retail stations.
- Retail Stations : Points of sale, classified into major marketers (NNPC Retail/Mega Stations) and independent marketers.
- Consumers (): The final stage where petroleum products are utilized.
The interactions among these compartments are modeled using ordinary differential equations (ODEs), incorporating key operational, policy, and environmental factors such as vandalism rates (), natural loss rates (), and stakeholders contributions ().
The compartments, represented as () evolve over time t. At time t, the NNPC downstream infrastructure for refined petroleum products, represented by holds a quantity of petroleum product, replenished daily at a rate (representing the amount refined or imported by PPMC). The proportion of products transported via pipelines per day is denoted by , while vandalism, modeled as a constant function (), results in a loss of ([39,40,41,42,57,58,59,60,61]).
Losses occur at various stages; Depot losses, , Retail station loses and consumer-level loses (). The depot losses are documented in NNPC’s 2021 Monthly FAAC reports and illustrated in Figure 1.
The quantity of fuel dispensed to retail marketers depends on the refined products from NNPC local refineries and PPMC [9]. The percentage distributed from NNPC retail depots via PENGASSAN/NUPENG to filling stations is denoted by c, resulting in a net distribution rate of .
To facilitate the model formulation, the following fundamental assumptions are considered:
2.4.1. Basic Assumption of the Model
The model assumptions are as follows:
- Fuel scarcity leads to price increases, either directly at the pump or through parallel markets (black markets), prompting hoarding and diversion.
- Ideally, retail marketers are meant to be the sole suppliers to consumers unless tanker drivers siphon products, so a siphon parameter () is included in the model.
- All parameters are non-negative; any negative results in the model will be interpreted as impractical.
- Fuel scarcity can be resolved when consumer demand is lower than supply from major and independent marketers. Therefore, policy and good implementation are embedded in the model simulation
According to Ambituuni et al., fuel distribution in Nigeria’s downstream sector is shared among NNPC Retail Ltd (23.43%), six major marketers (25.47%), and independent marketers (51%). Thus, the combined share of major marketers and NNPC Retail is x, while independent marketers contribute y. The distribution formula allocates 48.90% to NNPC retail stations and major marketers, with independent marketers receiving 51%. A siphon factor and natural losses at retail stations account for the remaining 0.1%. Despite differing infrastructures [56], major marketers and NNPC Retail are treated as a single entity due to their similar pricing regulations and operations. The rate of product distribution to consumers is expressed as:
In cases of severe vandalism, an alternative railway transport route is introduced, modeled as to offset losses. Since rail transport is independent of road infrastructure (Ambituuni et al.), the adjusted fuel distribution dynamics during crises are:
The product volume sold to consumers by major and independent marketers, denoted by and , respectively, is modeled as:
2.4.2. General Form of the Model
The model formulation, along with the assumptions, is visually summarized in the diagram (Figure 2) below, followed by the corresponding mathematical expressions:
Additionally, the total population (i.e. the amount (quantity) of refined products) at time t is represented by the equation:
This formulation captures the flow of products, losses, and interactions between various subsystems, providing a framework for exploring the effects of policy changes and operational interventions. The description of the model parameters are presented in Table 2 Further analysis, including stability and sensitivity, follows in subsequent sections.
3. Properties and Analysis of the Mathematical Model
3.1. Model Properties
Since the model describes fuel distribution, where fuel quantities cannot be negative, all model parameters and state variables are assumed to be non-negative for any time t. This assumption is formalized in the following theorem:
Theorem 1.
Let:
- represents a set of storage facilities owned by NNPC/MOMAN for distributing products.
- represents the storage at retail (refilling) stations.
- represents the quantity of fuel stored by consumers, and
- Ω is the combined quantity of refined products in the country.
Then
bounded and it is non-negative for all and at . Hence, Ω is positively invariant and attracting for the proposed model.
Proof.
The total quantity of refined product in circulation is denoted by , summing (5) to (10)
The integral solution of this differential equation is
Therefore,
This shows that is ultimately bounded for all t.
Next, to prove the non-negativity of the state variables, consider
Using integrating factors
the solution for becomes:
Since , a similar approach applied to the other state variables shows that they are all non-negative, completing the proof. □
3.2. Existence and Uniqueness of Solutions
To establish that the model is mathematically well-posed, we verify the Lipschitz condition. For clarity, we summarize this in the following theorem and provide its interpretation. Detailed mathematical proofs are available in Appendix A.1.
Theorem 2.
Interpretation: Continuous differentiability and the Lipschitz condition ensure that the model is mathematically well-posed, meaning the model reliably describes Nigeria’s fuel crisis dynamics. This guarantees its applicability in managing NNPCL’s downstream operations and supports decision-making for policymakers.
The next section will explore the model’s stability under various scenarios.
4. Model Analysis: Equilibrium Points, Threshold Parameter, and Stability Analysis
This section examines key scenarios affecting petroleum product distribution in oil-producing countries, particularly Nigeria, highlighting factors that may disrupt supply and potential mitigation strategies.
-
High Pipeline Vandalism:
- Significant vandalism severely disrupts product distribution,
- The system relies solely on pipelines, with no secured alternative distribution routes.
- Despite the stability of other system components, high vandalism creates a major bottleneck.
- No Pipeline Vandalism: Assumes no vandalism, ensuring uninterrupted pipeline distribution. However, industrial actions may still disrupt supply despite functional infrastructure.
-
Mitigation Measures and Alternative Routes:
- Policies and interventions are implemented to curb vandalism.
- Alternative distribution routes (e.g., railways for inter-state transportation and long distance transport) reduce dependence on pipelines.
- A diversified distribution strategy enhances system resilience against disruptions.
These scenarios underscore the need for proactive measures to secure fuel distribution, addressing vandalism, industrial actions, and security threats to oil and gas workers. Evaluating these factors helps strengthen the supply chain and ensure a more reliable distribution system. The following subsection presents the mathematical analysis of these scenarios.
4.1. POINTS OF EQUILIBRIUM
Theorem 3.
The system of Equations (5)–(10) exhibits five equilibrium points, denoted as , subject to the following conditions:
- (vandalism level),
- (industrial action level),
implies vandalism reaches its maximum level when , and NUPENG embarks on industrial action (i.e., ).
The proof of this theorem is in the Appendix A.2. However, we present the summary of the prove below for continual readability.
The equilibrium points, denoted as are obtained under various scenarios outlined at the beginning of this Section 4 and the elements of the set are respectively defined as:
- Critical Collapse - Severe fuel scarcity with widespread economic and social disruption.
- Partial Collapse - Significant shortages are causing moderate disruptions to daily activities.
- Partial Functionality - Limited fuel availability with manageable impacts.
- Moderate Functionality - Consistent but suboptimal fuel supply meeting most consumer needs.
- Optimal Distribution - Smooth and efficient fuel supply, fully satisfying demand.
Interpretation:
- Critical Collapse (): When vandalism reaches its peak and industrial actions (e.g., strikes by key transporters or workers such as NUPENG) occur, the entire fuel distribution system collapses. In this state, fuel is confined to the White Tank storage with no distribution across the supply chain. This scenario mirrors recent events where industrial actions triggered nationwide fuel crises [65].
- Partial Collapse (): In this scenario, vandalism remains at maximum levels , and no alternative transportation routes exist , but transporter activities continue . This state may give the illusion of operational functionality while the system struggles to maintain supply. Further details are provided in Equation (A10).
- Partial Functionality (): This event occurs when vandalism is significantly reduced, but the absence of transporters disrupts distribution. Although the system is less strained, the lack of transporter involvement continues to impair functionality.
- Moderate Functionality (): In this case, vandalism is minimal , and while transporters are active , no alternative transportation routes are available . However, this scenario does not account for the anticipated population growth, which will inevitably lead to increased fuel demand.
- Optimal Functionality (): This scenario represents a state of crisis preparedness and ensures optimal operation at all times. It is characterized by minimal vandalism, active transporters, and alternative routes that provide resilience against disruptions.
More details are provided in Appendix (Appendix A.2)
4.2. THRESHOLD FOR PRODUCT DISTRIBUTION
Nigeria’s growing population [66] without proportional infrastructure growth raises concerns. To address fuel scarcity, the Nigerian National Petroleum Corporation (NNPC) must proactively analyze demand and, where necessary, improve the supply chain. Collaboration with other stakeholders to resolve bottlenecks in the downstream sector is essential for hitch-free fuel supply. The daily consumption (threshold) to prevent PMS scarcity is derived using the Next Generation Matrix (NGM) approach in [47], the parameters that constituted this threshold (including ) are estimated from macroeconomic trends ([67]) and NNPC data ([39,40,41,42]).
While Figure 3 illustrates Nigeria’s population growth and annual percentage change, reports from Premium Times and other Nigerian news outlets indicate a decline in petrol (PMS) consumption following the removal of the fuel subsidy by the current Nigerian government. This trend is depicted in Figure 4. However, the actual daily fuel consumption before the subsidy removal on May 29, 2023, remains uncertain.
This subsection analytically derives a threshold parameter for daily fuel distribution to meet consumption needs and numerically estimates it using available data from [39,40,41,42]. The necessary conditions to eliminate fuel scarcity are summarized in the following theorem:
Theorem 4.
Fuel scarcity can be eliminated if threshold parameters and satisfy:
- , , in the event of a pipeline crisis.
- under smooth transportation conditions.
The interested reader will find the proof of this Theorem 4 at Appendix A.3, but the interpretation is:
Interpretation:
Equation (A16) represents the analytic threshold derived from the proposed model, capturing two scenarios: transportation without an alternative route and with an alternative route.
Equation (A16) defines the analytic threshold derived from the proposed model, capturing both transportation scenarios with and without alternative routes.
This threshold is critical for addressing corruption in Nigeria’s downstream oil and gas sector. Despite NNPC Limited and its partners being responsible for fuel distribution, they have not provided a clear or reliable estimate of the country’s actual daily PMS consumption. Investigative journalism has played a crucial role in exposing discrepancies in reported figures. Therefore, deriving this threshold through a scientific approach is essential.
In Section 5, we will use data from FAAC reports, NMDPRA, and other available sources earlier mentioned to estimate the threshold value numerically.
4.3. STABILITY ANALYSIS OF THE MODEL
This section establishes the criteria for evaluating the viability of the proposed model in decision-making. Stability analysis, a fundamental tool in mathematical biology [47], can be performed locally around equilibrium points or globally across the entire system. Here, we examine both local (detail in Appendix A.4) and global stability (Appendix A.5) of the equilibrium points identified in Theorem 3.
4.3.1. Methodology for Stability Analysis
To determine the stability at each equilibrium point, we employ the following approach:
- Eigenvalue Computation: Evaluate the eigenvalues of the Jacobian matrix,
- Conditions for Stability: Derive conditions on system parameters that ensure the eigenvalues meet the stability criteria.

Table 3.
Characterization of Stability Analysis. [68]
Table 3.
Characterization of Stability Analysis. [68]
| Eigenvalues of J | Type of Critical Point | Remark |
| Source | Unstable | |
| Sink | Asymptotically Stable | |
| Saddle Point | Unstable | |
| Outward Spiral | Unstable | |
| Inward Spiral | Asymptotically Stable | |
| , | Centre | Indeterminate |
4.4. Stability Result Summary
The stability results are summarized in the below theorem and the proof in Appendix A.4.1:
Theorem 5.
The system (5)–(10) is locally asymptotically stable (LAS) near Scenario II if the following conditions hold:
- ,
- and , ensuring product demand does not exceed supply, regardless of the distribution method.
Additionally,
- is globally asymptotically stable
- is globally asymptotically stable whenever the arithmetic mean exceeds the geometric mean of Lyapnouv function for
4.4.1. Interpretation
The results suggest that fuel scarcity can be eliminated if government policies ensure a balanced operational framework among stakeholders. Aligning policy interventions with the model’s stability conditions will enhance fuel supply consistency and resilience against disruptions.
4.4.2. Terminology Consistency
To maintain coherence with established terminology in mathematical epidemiology, the following conventions are adopted:
- Scenario IIa is referred to as the Products Distribution-Free Equilibrium (PDE), representing conditions where no products are distributed.
- Scenario IIb is referred to as the Products Distribution Persistent Equilibrium (PDP), representing conditions where product distribution continues over time.
- The parameter is introduced as a generalized threshold encompassing both and , serving as a comprehensive indicator of system stability.
- Analytical results use conditions or to establish equilibrium stability, following classical approaches.
- Numerical simulations compute actual values to provide a realistic representation of fuel distribution dynamics.
4.4.3. Appendix Reference
The mathematical proof of Theorem 5 is provided in Appendix A.4.1 and Global stability analysis in Appendix A.5, which offer a detailed exploration of the stability conditions.
5. Numerical Simulation and Discussion of Results
This section outlines the baseline values used for numerical simulations and discusses the results. The baseline parameters are derived from empirical data sourced from the NNPC and other credible organizations to ensure accuracy and reliability.
5.1. Parametrization and Base Value
The initial condition for the state variables used for simulation are:
for time . These estimates are based on data from the 2021 NNPC-FAAC reports [39]–61], NNPC-ASB reports [69], and the NMDPRA [70].
The baseline parameter values are computed as the mean of data collected over at least five consecutive months from the NNPC-FAAC reports. These values in Table 4 provide the foundation for the numerical simulations, enabling an accurate representation of the real-world dynamics in the downstream petroleum sector.
5.1.1. Assumption of Parameters Value
- Values for are assumed due to insufficient direct empirical data.
- Loss rates at and are denoted as () and is treated uniformly in their respective subsystems for simplicity.
The value of used for simulation is the mean (average) of 5- years (2016-2020) vandalization on pipeline
5.1.2. Simulation Setup
The model Equations (5)–(10) were solved numerically using a standard ODE solver. Results were generated for different scenarios, reflecting variations in vandalism activity, government policy, and transporter dynamics. These simulations help visualize the interplay between stakeholders in the downstream sector and assess how system interventions affect fuel distribution efficiency and scarcity resolution.
The next subsection presents the results of the simulations and their implications for addressing the challenges in Nigeria’s downstream sector.
5.1.3. Brief About the Data
The data presented in Figure 5 is from the NNPC FAAC reports highlight the erratic operations of Nigeria’s refineries over the past decade. In 2016, the highest crude oil input to Nigerian refineries was recorded at 20%, but this figure steadily declined to 0% by 2020. This downward trend underscores the diminishing local refining capacity, culminating in a complete halt in refinery operations as of March 2024.
Figure 6 illustrates the Petroleum Products Distribution (PPD) through the NNPC retail network, further confirming that the majority of petroleum products are imported rather than locally refined. The high cost of importation, as noted in [2], remains a significant contributor to the persistent fuel scarcity in Nigeria.
Given that Premium Motor Spirit (PMS) accounts for the highest demand among petroleum products, its distribution data from the NNPC FAAC reports is used as the basis for this study’s simulations. This focus ensures the analysis captures the most critical aspect of Nigeria’s downstream challenges.
5.2. Scenario Simulation and Results Discussion
This section presents numerical simulations for the scenarios described in Section 4 to validate the analytical results. Using baseline values from Table 4, we simulate the minimum threshold (A16) required for petroleum product distribution and consumption. The analysis identifies 42 million liters per day as the minimum supply needed to prevent scarcity before subsidy removal, approximately 3 million liters less than the post-subsidy demand reported in [71].
5.2.1. Effect of Vandalism and Alternative Routes on ()
The stability of the minimum supply threshold (Equation (A16))
The minimum supply required to eliminate fuel scarcity, denoted as (Equation (A16)), (Equation (A16)) was analytically proven in Section 5. Simulations assess how pipeline vandalism and alternative transportation routes affect this threshold.
Figure 7 presents the results. Panel (a) shows a contour plot, while panel (b) provides a 3D perspective. The analysis considers values between 0 and 1 and scenarios of high vandalism (). The results indicate that even under severe vandalism (blue regions), a 10% provision of effective alternative routes can prevent fuel scarcity. When alternative routes are 100% effective (yellow regions), consistently exceeds demand, ensuring fuel supply stability and minimizing economic disruptions.
5.2.2. Effect of Hoarding and Diversion of Product on the
Simulations also examine the impact of hoarding and product diversion under varying levels of vandalism. Figure 8 shows that when vandalism is low (10%), a 10% contribution from NNPC retail hubs and major marketers is sufficient to maintain stable fuel distribution and increase PMS reserves.
Under extreme vandalism (unity), stability is maintained as long as product diversion is minimized. Meeting the 42 million liters per day threshold effectively prevents fuel crises, underscoring the need for robust distribution strategies and efficient supply chain management.
5.2.3. General Model Simulation
The simulation of the entire model provided valuable insight, as shown in Figure 9, Figure 10, Figure 11, Figure 12 and Figure 13.
When vandalism is extremely high (90%) and there are no alternative routes, operators at stop pipeline transport, causing fuel accumulation in the Q compartment (dashed blue plot, Figure 9). This bottleneck disrupts downstream compartments A, Z, , , and M (Figure 9, Figure 10 and Figure 11), resulting in a critical fuel scarcity crisis.
In contrast, moderate operations ("smooth operation") or alternative transportation routes () significantly reduce disruptions. Here, the Q compartment becomes less critical, highlighting the urgent need for alternative transport infrastructure, such as railways, to complement Nigeria’s aging pipeline network.
Introducing alternative routes improves distribution efficiency, reducing reliance on road transportation and minimizing risks such as petroleum truck accidents. These findings align with existing literature [72].
Hoarding by Retail Marketers
Hoarding, primarily by privately owned independent marketers ( class), poses a greater threat to consumers than extreme vandalism.
- Without stricter regulations, hoarding disrupts distribution and fuels smuggling to neighboring countries where PMS prices are higher will on the daily basis increase.
- This highlights the urgent need for regulatory measures targeting independent marketers to ensure equitable fuel distribution.
Although the Department of Petroleum Resources (DPR) oversees licensing, safety, and quality control in Nigeria’s oil sector [73], stronger enforcement is needed to curb hoarding and improve supply chain transparency.
Transportation Efficiency and Industrial Actions
The model estimates 99% transportation efficiency under low to moderate vandalism (0-90%), even with minimal reliance on alternative routes. However, industrial actions (strikes) by transporters (Z class) introduce severe supply disruptions, as shown in Figure 12 and Figure 13.
- These findings emphasize the need for policymakers to address stakeholder grievances in the Z class to maintain supply chain stability.
Ensuring a cooperative and functional Z compartment is crucial for sustaining fuel distribution and preventing recurrent crises.
6. Summary, Conclusions, and Limitation
This section synthesizes the findings and implications of the mathematical model developed to address challenges in Nigeria’s downstream petroleum sector. The study emphasizes critical aspects of fuel distribution, including factors such as vandalism, industrial actions, and hoarding, which exacerbate scarcity. It concludes with actionable recommendations for transportation optimization, stakeholder policies, and the potential adaptability of the model to broader contexts. Limitations are acknowledged to inform future research avenues, offering insights into enhancing the robustness of the model and its applications.
6.1. Summary from mathematical Analysis
This study developed a mathematical model to analyze the downstream petroleum sector in Nigeria, specifically focusing on the distribution of petroleum products for domestic consumption. The model incorporated critical factors such as vandalism, industrial actions (strikes), diversion, and hoarding of products by the NNPC Retail hub, independent marketers, and private marketers, all of which contribute to fuel scarcity.
Key Findings:
- Model Validation: The feasibility region, positivity of solutions, and existence and uniqueness of the model were established, ensuring alignment with real-world scenarios and validating the model’s applicability.
- Equilibrium Points: Five equilibrium points were identified, representing conditions under which fuel scarcity could be mitigated or resolved.
- Threshold Analysis: A critical supply PMS threshold of 42 million liters per day was derived, indicating the minimum volume required to meet consumer demand and eliminate queues at service stations.
- Stability Analysis: Using the Lyapunov function and Routh-Hurwitz criteria, the study demonstrated that effective fuel distribution could achieve stability, provided government policies create a conducive environment for stakeholders such as NUPENG, MOMAN, and tanker drivers.
-
Simulation Results: Numerical simulations, conducted using the classical Runge-Kutta method in Maple 18, highlighted that:
- Hoarding by private retail stations exacerbates fuel scarcity and drives up prices of fuel and other commodities.
- Industrial actions by marketers and transporters (Z) have a more significant impact on fuel distribution crises than pipeline vandalism, underscoring the need for robust government intervention.
6.2. Insights, Challenges, and Future Directions in Fuel Distribution Modeling
This study employs a deterministic, autonomous, and continuous ODE model to analyze fuel distribution in Nigeria’s downstream petroleum sector, focusing on vandalism, industrial action, hoarding, and fuel diversion. Future research could explore hybrid models combining deterministic and stochastic approaches for a more comprehensive analysis.
The model’s insights are adaptable to other countries facing similar fuel distribution challenges, provided robust data is available. However, data limitations constrained this study. Future work should incorporate sensitivity analysis, optimal control, and cost-effectiveness evaluations.
This study considers both pre- and post-subsidy removal scenarios, though simulations were primarily based on the subsidy era to establish demand and supply thresholds for PMS. Future research will extend this work to capture post-subsidy fuel distribution trends more comprehensively.
6.3. Conclusion, Recommendation, and Limitation
This study concludes that alternative transportation methods (e.g., rail), strong policies, and political will are essential for addressing challenges in Nigeria’s downstream sector. Key interventions include:
- Advanced security systems (e.g., smart surveillance) to protect pipelines.
- Infrastructure improvements to mitigate vandalism, corruption, and poor road conditions.
- Effective regulatory oversight of private marketers (Z) to ensure supply stability.
For oil-producing developing nations, reliance on a single transport route poses risks during crises. Implementing alternative routes, as proposed in this study, enhances resilience. Conversely, non-oil-producing nations face significant risks from road-based tanker transportation. Rail infrastructure offers a safer alternative, and governments can apply this model to inform energy security policies.
With the Dangote Refinery now operational, the Nigerian government should explore formal partnerships with neighboring countries to establish legitimate fuel supply channels. ECOWAS could also facilitate regional fuel refining and transportation, reducing smuggling and associated security risks.
Finally, this research highlights critical gaps in fuel consumption data, as NNPCL has yet to transparently disclose actual daily PMS usage. Future studies should focus on data acquisition and validation to enhance policy formulation and sectoral efficiency.
Author Contributions
Conceptualization, A.K.B.; Methodology, I.A.A., S.T.A., and A.K.B; Software, S.T.A., and A.K.B.; Scenario Simulation and Discussion, I.A.A., S.T.A., and A.K.B.; Formal analysis, S.T.A., and A.K.B.; Interpretation, S.T.A., and A.K.B.; Data curation, A.K.B., and I.A.A.; Writing - original draft preparation, I.A.A., and A.K.B.; Writing - review and editing, S.T.A., A.K.B., Supervision, K.B.A. All authors have read and agreed to the published version of the manuscript.
Funding
The authors received no specific funding for this work.
Data Availability Statement
The values used for simulation in this study were estimated or sourced from publicly available reports, including the NNPC Monthly FAAC Report, NNPC Annual Statistical Report, and Truck-Stock Report. All data sources are properly cited, with links in the reference list.
Acknowledgments
We extend special thanks to Mr. Muftaudeen Taoheed of Baze University, Abuja, for reviewing the initial draft of this manuscript. Furthermore, we deeply appreciate the editorial team and peer reviewers for their insightful feedback and constructive critiques, which have significantly enhanced the quality of this work.
Conflicts of Interest
The authors declare that they have no conflicts of interest related to this study.
Appendix A.
Appendix A.1. Existence and Uniqueness of Solutions
To ensure that the model is mathematically well-posed, we check the Lipschitz condition. The system of Equations (5)–(10) can be written as:
For Lipschitz continuity, we compute the partial derivatives of (A1), with respect to each state variable i.e.
Similar steps are applied to the remaining state variables, ensuring that all partial derivatives are bounded. This shows that the model is bounded and satisfies the Lipschitz condition.
We investigate each of the model state variables solutions at any two points in the region as follows
Similarly for ,
Appendix A.2. Equilibrium Points
To establish Theorem 3, the right-hand sides (RHS) of Equations (5)–(10) are set to zero. On the simplification, we have:
Proof.
Scenario I: Severe Vandalism
Scenario II: Reduced Vandalism
- Partial functionality: When vandalism is significantly reduced () and , the system stabilizes at:
- Moderate functionality: Vandalism is reduced (), , and . The equilibrium is:where:
Scenario III (Optimal Distribution): Increased Fuel Demand and Systemic Challenges
For this scenario, , , and . These are considered while solving (1)–(10) and the equilibrium is:
where:
□
Appendix A.3. Proof of the Threshold Parameter
Proof.
Two scenarios are considered: product distribution under high vandalism (with and without alternative routes).
Matrix F represents the volume of petroleum transported via pipelines to storage facilities, while matrix V accounts for transitions leading to product delivery to consumers.
If alternative routes are unavailable , the system relies solely on pipelines. The inverse of V is given by:
The threshold parameter, which accounts for both smooth distribution and disruptions, is determined by the spectral radius of . The results for the two scenarios are:
At the Petroleum Distribution-Free Equilibrium (PDE), substituting the value of A in Equation (A15) yields:
□
Appendix A.4. Stability Analysis
Appendix A.4.1. Application of the Methodology
The stability theorem (5) is proved using the methodology outlined in Section 3. The study focuses on improving fuel distribution to mitigate scarcity, leveraging concepts from mathematical epidemiology. Accordingly, stability is analyzed around the equilibrium points corresponding to Scenarios II and III, encompassing partial functionality, moderate functionality, and optimal distribution states.
Two specific equilibrium points are analyzed:
Proof of Local Stability
To demonstrate local asymptotic stability, the following steps are undertaken: The Jacobian matrix J of the system is defined as:
- Step 1: Linearization: The Jacobian matrix of the system is obtained and evaluated near the partial functionality equilibrium and for a specific case; in the absence of alternative routes, the Jacobian reduces to:
- Step 2: Eigenvalue Computation: The eigenvalues are determined from the characteristic equation .
- Step 3: Characterization of Eigenvalues: The eigenvalues of the Jacobian are:
-
Step 4: Stability Criteria: By the Routh-Hurwitz stability criterion, all eigenvalues must be negative for local asymptotic stability.
- -
- hold true.
- -
- For , the vandalism rate must satisfy .
- -
- For , the consumer demand must exceed the supply at retailer filling stations, implying .
Consequently, stability depends on controlling vandalism and ensuring the supply chain meets consumer demand. The model is locally asymptotically stable under these conditions, affirming Theorem 5.
Reduced System Analysis
To simplify the stability analysis, fuel distribution is narrowed to major petroleum dealers and suppliers in the community. This enables qualitative analysis of the subsystem:
where .
The equilibrium points for this subsystem are:
- PDE (): ,
- PDP (): ,
where and .
Global Stability Analysis
-
At : The Jacobian matrix evaluated at yields the characteristic equation:Eigenvalues are:Stability holds if , establishing as globally asymptotically stable under this condition.Theorem A1.The stability at is Globally Asymptotically stable if and the system transits to instability .Proof:Consider the Lyapnouv function with derivative offrom PDE (partial functionality), , (A23) becomessimplification givesTherefore if and if . Thus, F is a Lyapnouv function and by LaSellei invariance principle, every solution of (A19) approaches as .
- At : Using the Goh-Volterra nonlinear Lyapunov function, global stability at is confirmed if .
Appendix A.5. Global Stability at Moderate Functionality
Proof.
To establish the system’s global stability, it is a suffix to use the reduced system (A19) at by formulating the Goh-Volterra nonlinear Lyapnouv function
Differentiate the Lyapnouv function (A26) gives:
substituting (A19) in (A27) to get
substitute into (A28) to obtain
Expanding and simplification of (A29) gives
Let , we have
factorizing the common terms and further simplification gives
we observed from PDE (partial functionality) that , thus, we substitute in (A32) to get
Since the arithmetic mean exceeds the geometric mean, it follows that
and
In this view, the relationship between the arithmetic mean of being greater than or equal to the geometric mean supports our conclusion about for and for .
This completed the last part of the Theorem 5 □
References
- Abayomi, A.; Adam, S.; Alumbugu, A.I. Oil Exportation and Economic Growth in Nigeria. Developing Country Studies 2015, 5, 83–92. [Google Scholar]
- Kate, N.E.; Obiageli, O.L.; Uzochukwu, O.C.; Onyilofor, T.U. Fuel Scarcity and Business Growth in Nigeria From 2005 To 2015. European Journal of Business, Economics and Accountancy 2016, 4(8), 9–31.
- Odularu, G.O. Crude Oil and the Nigerian Economic Performance. Oil and Gas Business 2007, pp. 1–29.
- Steyn, P. OIL EXPLORATION IN COLONIAL NIGERIA, C.1903-1958. Stirling Online Research Reciprocitory, University of Stirling 2009.
- OPEC, B.C. OPEC: Nigeria and OPEC: 50 years together. OPEC 2021.
- Nwankwo, G.O. Nigeria and OPEC: To Be Or Not to Be. CBN Economic and Financial Review 1982, 20, 6–13. [Google Scholar]
- Onwe, O.J. Economic Implications of Petroleum Policies in Nigeria: An Overview. American International Journal of Contemporary Research 2012. [Google Scholar]
- Industry History. NNPC Old Website: Retrieved July 18, 2022, from https://nnpcgroup.com/NNPC-Business/Business-Information/Pages/Industry-History.aspx.
- Ambituuni, A.; Amezaga, J.; Emeseh, E. Analysis of safety and environmental regulations for downstream petroleum industry operations in Nigeria: Problems and prospects. Environmental Development 2014, 9(1), 43–60. [Google Scholar] [CrossRef]
- BPE. Pipelines and Products Marketing Company Limited (PPMC). Bureau of Public Enterprises BPE News 2022. Available at: https://bpe.gov.ng/pipelines-and-products-marketing-company-limited-ppmc/ (Accessed: April 20th, 2022).
- NBS. Foreign Trade in Goods Statistics: Q1 2021 (Issue March) 2021.
- OPEC. 2023 OPEC Annual Statistical Bulletin. OPEC 2023, 58th Edition.
- Onyeizugbe, C.; Onwuka, E. Fuel Subsidy Removal as an Imperative for Enhancing Business Development in Nigeria. VSRD International Journal of Business and Management Research 2012, 2, 454–461. [Google Scholar]
- Ugbodoga, M. NNPC: We spent N49.69bn on pipeline repairs in 10 months. The Cable Nigeria 2021. (Retrieved December 21, 2021).
- OEC. Refined Petroleum in Nigeria: OEC - The Observatory of Economic Complexity. OEC Profile Summary 2022. Retrieved June 21, 2022.
- Simon, S.E. Nigeria’s subsidised petrol rated 8th cheapest globally. DailyTrustrust 2022. [Google Scholar]
- KPMG-Nigeria. Petroleum Industry Bill (PIB) 2021- A Game Changer? 2021 Issue July.
- NMDPRA. Nigerian Midstream and Downstream Petroleum Regulatory Authority (NMDPRA) Petroleum Products Stock and Days Sufficiency Report (July 2022 - September 2022) (Accessed: 2022).
- Olujobi, O.J. Deregulation of the downstream petroleum industry: An overview of the legal quandaries and proposal for improvement in Nigeria. Heliyon 2021, 7, e06848. [Google Scholar] [CrossRef]
- Zieyel, E.R. Operations Research: Applications and Algorithms; Vol. 30, Technometrics, Taylor and Francis, 2020. [CrossRef]
- Singh, H.; Kumar, D. ; & Baleanu, D. Methods of Mathematical Modelling: Fractional Differential Equations. Taylor & Francis Online.
- Bora, A.; Ahmed, S. Mathematical Modeling: An Important Tool for Mathematics Teaching. International Journal of Research and Analytical Reviews (IJRAR) 2019, 6(2), 252–256. [Google Scholar]
- Diekmann O., J. H.; J.A.J., M. On the definition and the computation of the basic reproduction ratio R 0 in models for infectious diseases in heterogeneous populations. Journal of Mathematical Biology 1990. [Google Scholar] [CrossRef]
- F., B.; Castillo-Chavez, C. Mathematical Models in Population Biology and Epidemiology (second); Springer, 2019.
- Saldanha, R.A.; Hoppensteadt, F.C.; & Peskin, C.S. Mathematics in Medicine and the Life Sciences. In The Statistician 1994, 43.
- Akande, K.; Ibrahim, M.O. Preventive and curative control for terrorism. Journal of the Nigerian Association of Mathematical Physics 2011, 14, 57–70. [Google Scholar]
- Castillo-Chavez C., & Song, B. 7 Models for the Transmission Dynamics of Fanatic Behaviors.; Frontiers in Applied Mathematics, 2003. [CrossRef]
- Adenuga, J.I.; Ajide, K.B.; Odeleye, A.T.; Ayoade, A.A. Abundant Natural Resources, Ethnic Diversity, and Inclusive Growth in sub-Saharan Africa: A Mathematical Approach. Applications and Applied Mathematics: An International Journal (AAM) 2021, 16(2), 1221–1247.
- Camacho, E.T. The development and interaction of terrorist and fanatic groups. Communications in Nonlinear Science and Numerical Simulation 2013, 18, 3086–3097. [Google Scholar] [CrossRef]
- Akande, K.B.; Makinde, J.; Ibrahim, M.O. Dynamics of Terrorism in Contemporary Society for Effective Management. International Journal of Mathematics and Mathematical Sciences 2022. [Google Scholar] [CrossRef]
- Ibrahim, M.O.; Akinyemi, S.T.; Dago, M.M.; Bakare, G.N. Mathematical Modelling of a Staged Progression HIV/AIDS Model with Control Measures. Journal of the Nigerian Association of Mathematical Physics 2015. [Google Scholar]
- Rabiu, M.; Akinyemi, S.T. Global analysis of dengue fever in a variable population. Journal of the Nigerian Association of Mathematical Physics 2016. [Google Scholar]
- Androutsopoulos, K.N.; Zografos, K.G. Modeling and solving the fuel distribution problem with unloading precedence and loading sequence considerations. Annals of Operations Research 2024, 332, 909–947. [Google Scholar] [CrossRef]
- Djuric, S.; Nogo, S.; Varupa, E.; Kuzmic, G. Mathematical Model of Gasification of Solid Fuel. Symmetry 2024, 16. [Google Scholar] [CrossRef]
- Fulop, M.T.; Guban, M.; Kovacs, G.; Avornicului, M. Economic Development Based on a Mathematical Model: An Optimal Solution Method for the Fuel Supply of International Road Transport Activity. Energies 2021, 14, 2963. [Google Scholar] [CrossRef]
- Hareli, S.; Nave, O.; Gol’dshtein, V. Impact of a polydispersed fuel distribution on the ignition characteristic. Scientific Reports 2024, 14, 18304. [Google Scholar] [CrossRef]
- Seddighi, A.H.; Naimi-Sadigh, A. A Mathematical Model for Fuel Pricing Considering Supply Chain Network Design Decisions. Energy Engineering and Management 2023, 8, 58–69. [Google Scholar] [CrossRef]
- NNPC-ASB. 2020 Annual Statistical Bulletin. NNPC ASB 2020. Accessed in 2022.
- NNPC-FAAC. NNPC JAN 2021 Crude Oil and Gas Sales and Proceeds Received in February 2021. NNPC - Federation Account Allocation Committee (FAAC) Report 2021.
- NNPC-FAAC. NNPC February - March 2021 Crude Oil and Gas Sales and Proceeds Received in April 2021. NNPC - Federation Account Allocation Committee (FAAC) Report 2021.
- NNPC-FAAC. NNPC April 2021 Crude Oil and Gas Sales and Proceeds Received in May 2021. NNPC - Federation Account Allocation Committee (FAAC) Report 2021.
- NNPC-FAAC. NNPC October 2021 Crude Oil and Gas Sales and Proceeds Received in November 2021. NNPC - Federation Account Allocation Committee (FAAC) Report 2021.
- NNPC-NPSC.. Nigerian Pipelines and Storage Company Limited. Nigeria Bureau of Statistics - NBS 2022. Retrieved July 15, 2022.
- NMDPRA. Nigerian Midstream & Downstream Petroleum Regulatory Authority ( NMDPRA ) Petroleum Products Stock & Days Sufficiency Reports (December 2021 - March 2022) (Accessed: 2022).
- Hethcote, H.W. The Mathematics of Infectious Diseases; SIAM, 2000.
- Diekmann, O.; Heesterbeek, J. Mathematical Epidemiology of Infectious Diseases: Model Building, Analysis, and Interpretation; John Wiley & Sons, 2000.
- Fred, B.; Carlos, C.C. Mathematical Models in Population Biology and Epidemiology; Springer, 2010.
- Anderson, R.M.; May, R.M. Infectious Diseases of Humans: Dynamics and Control.; Oxford University Press., (1992).
- Keeling, M.J.; Rohani, P. Modeling Infectious Diseases in Humans and Animals; Princeton University Press, 2008.
- Macal, C.M.; North, M.J. Tutorial on agent-based modeling and simulation. Journal of Simulation 2010. [Google Scholar] [CrossRef]
- Hastie, T.; Tibshirani, R.; Friedman, J. The Elements of Statistical Learning: Data Mining, Inference, and Prediction; Springer, 2009.
- page, N.P.O. Product Distribution- NNPC. Nigeria Bureau of Statistics - NBS 2022. Retrieved July 15, 2022.
- NNPC-ASB. 2019 Annual Statistical Bulletin. Nigeria Bureau of Statistics - NBS 1st Edition, 2019. Accessed in 2021.
- Olawale, E.K.B.; Yayock, E.S. Persistent fuel scarcity, price increases, and way forward in Nigeria. International Journal of Research and Innovation in Applied Science May 2023, VIII, 72–79. [Google Scholar] [CrossRef]
- Tata, H.; Ariyo, T.O.; Omogunloye, O.G. Mapping and Spatial Distribution of Petroleum Products by Marketers in Nigeria. In Proceedings of the Proceedings of the Joint International Conference (JIC) on 21st Century Human Habitat: Issues, Sustainability, and Development. Proceedings of the Joint International Conference (JIC) on 21st Century Human Habitat: Issues, Sustainability, and Development, March 2016, pp. 1037–1044.
- NNPC/Independent Marketers Depot Facilities (DAPPMA- Storage Facilities).
- NNPC-FAAC. NNPC May 2021 Crude Oil and Gas Sales and Proceeds Received in June 2021. NNPC - Federation Account Allocation Committee (FAAC) Report 2021.
- NNPC-FAAC. NNPC June - July 2021 Crude Oil and Gas Sales and Proceeds Received in August 2021. NNPC - Federation Account Allocation Committee (FAAC) Report 2021.
- NNPC-FAAC. NNPC August 2021 Crude Oil and Gas Sales and Proceeds Received in September 2021. NNPC - Federation Account Allocation Committee (FAAC) Report 2021.
- NNPC-FAAC. NNPC September 2021 Crude Oil and Gas Sales and Proceeds Received in October 2021. NNPC - Federation Account Allocation Committee (FAAC) Report 2021.
- NNPC-FAAC. NNPC November 2021 Crude Oil and Gas Sales and Proceeds Received in December 2021. NNPC - Federation Account Allocation Committee (FAAC) Report 2021.
- Izuaka, M. Fuel Scarcity: NUPENG threatens nationwide strike. Premium Times Nigeria. Premium Times News 2021. Available at: https://www.premiumtimesng.com/news/top-news/495670-fuel-scarcity-nupeng-threatens-nationwide-strike.html (Accessed: April 20th, 2022).
- NNPC-FAAC. NNPC June 2021 Crude Oil and Gas Sales and Proceeds Received in July 2021. NNPC - Federation Account Allocation Committee (FAAC) Report 2021.
- Akinpelu, Y. ANALYSIS: Nigeria spends billions on pipeline maintenance as hundreds are vandalized annually. Premium Times News 2021. Available at: https://www.premiumtimesng.com/news/headlines/454439-analysis-nigeria-spends-billions-on-pipeline-maintenance-as-hundreds-are-vandalised-annually.html (Accessed: November 24th, 2021).
- Izuaka, M. Fuel Scarcity Looms as NUPENG Begins Mobilization for Labour Union’s Strike. Premium Times 28 September 2023.
- World_Population, R., 2021. (Retrieved December 21, 2021).
- Macrotrends. Nigeria Population 1950 - 2024. macrotrend 2024.
- Morgan, R. Linearization and Stability Analysis of Nonlinear Problems. Rose-Hulman Undergraduate Mathematics Journal 2015, 16, Article 5.
- NMDPRA. Nigerian Midstream & Downstream Petroleum Regulatory Authority (NMDPRA) Petroleum Products Stock & Days Sufficiency Report (July 2022 - September 2022) (Accessed: 2022).
- NMDPRA. Nigerian Midstream & Downstream Petroleum Regulatory Authority (NMDPRA) Petroleum Products Stock & Days Sufficiency Report (June 2022) (July 2022 - December 2022) (Accessed: 2022).
- Okechukwu Nnodim, D.O.; Nwafor, A. Subsidy: FG may spend N236bn monthly on imported, Dangote petrol. In Proceedings of the Subsidy: FG may spend N236bn monthly on imported, Dangote petrol, 25th September, 2024.
- Josiah, O. Ondo mourns victims of deadly oil tanker explosion. Primium times Nigeria 2023. [Google Scholar]
- DPR Responsibility.
Figure 1.
Quantity of PMS product loses per month in 2021 NNPC FAAC Reports
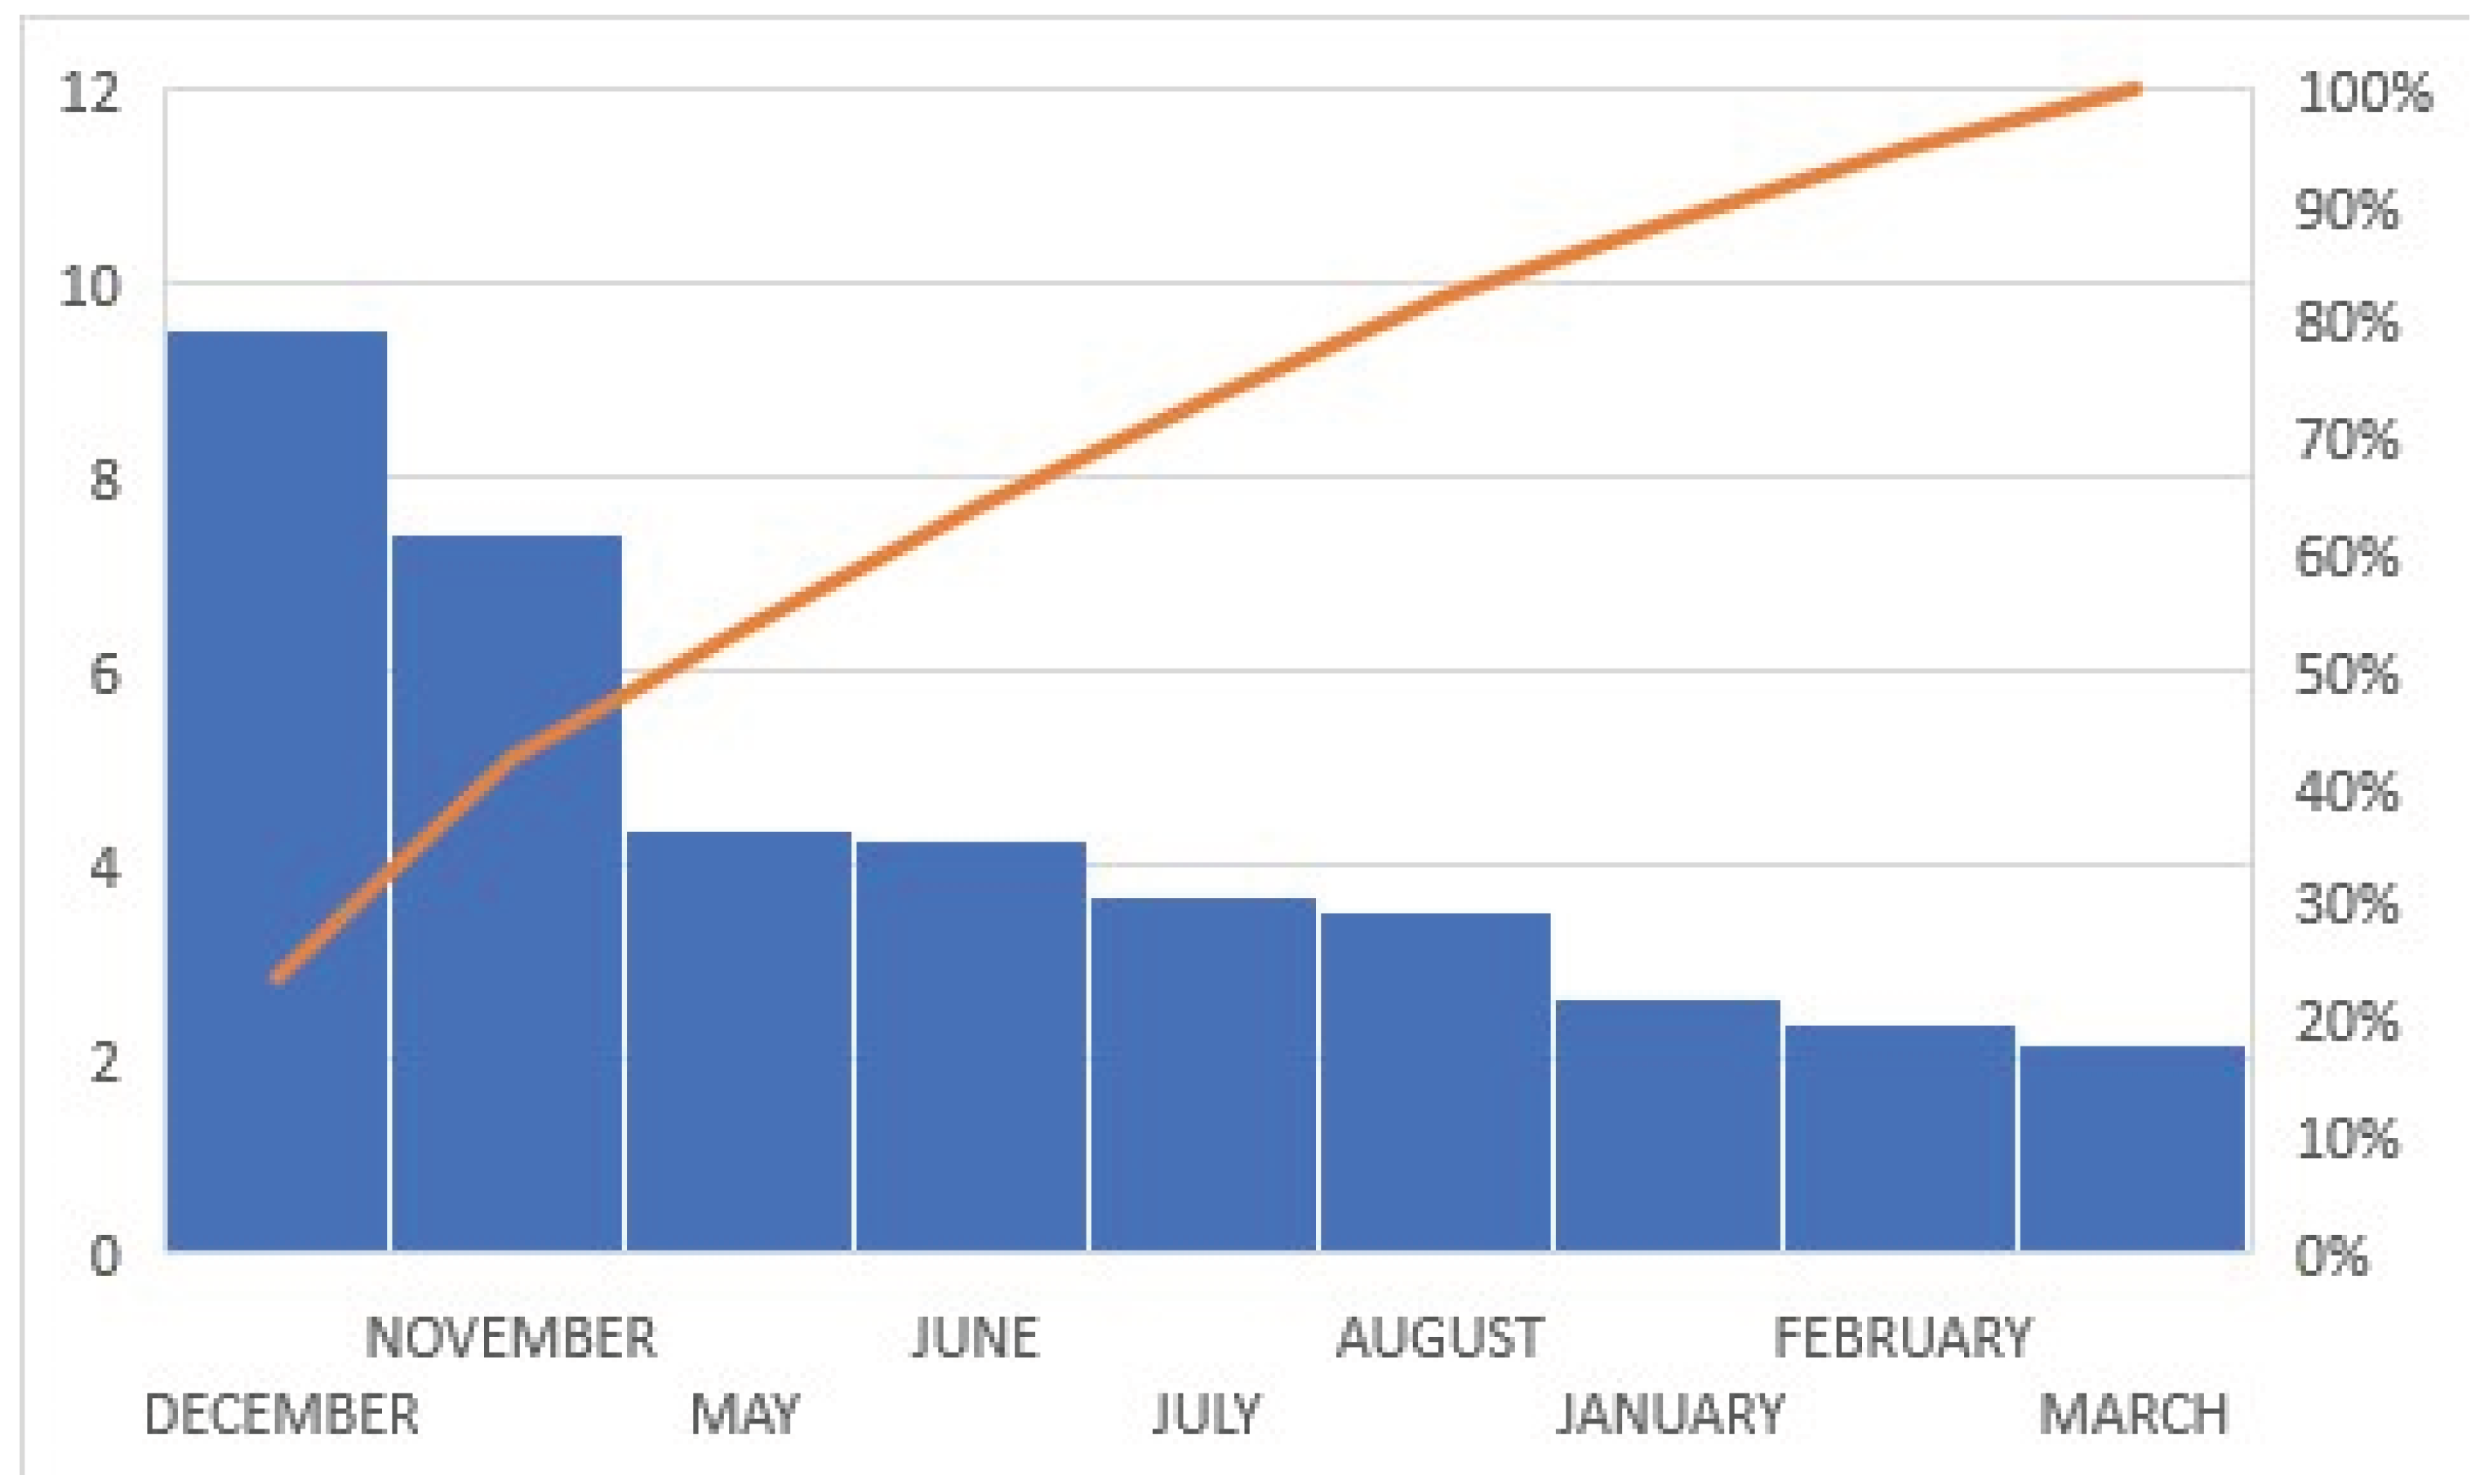
Figure 2.
Proposed model for Petroleum Product Distribution (PPD)
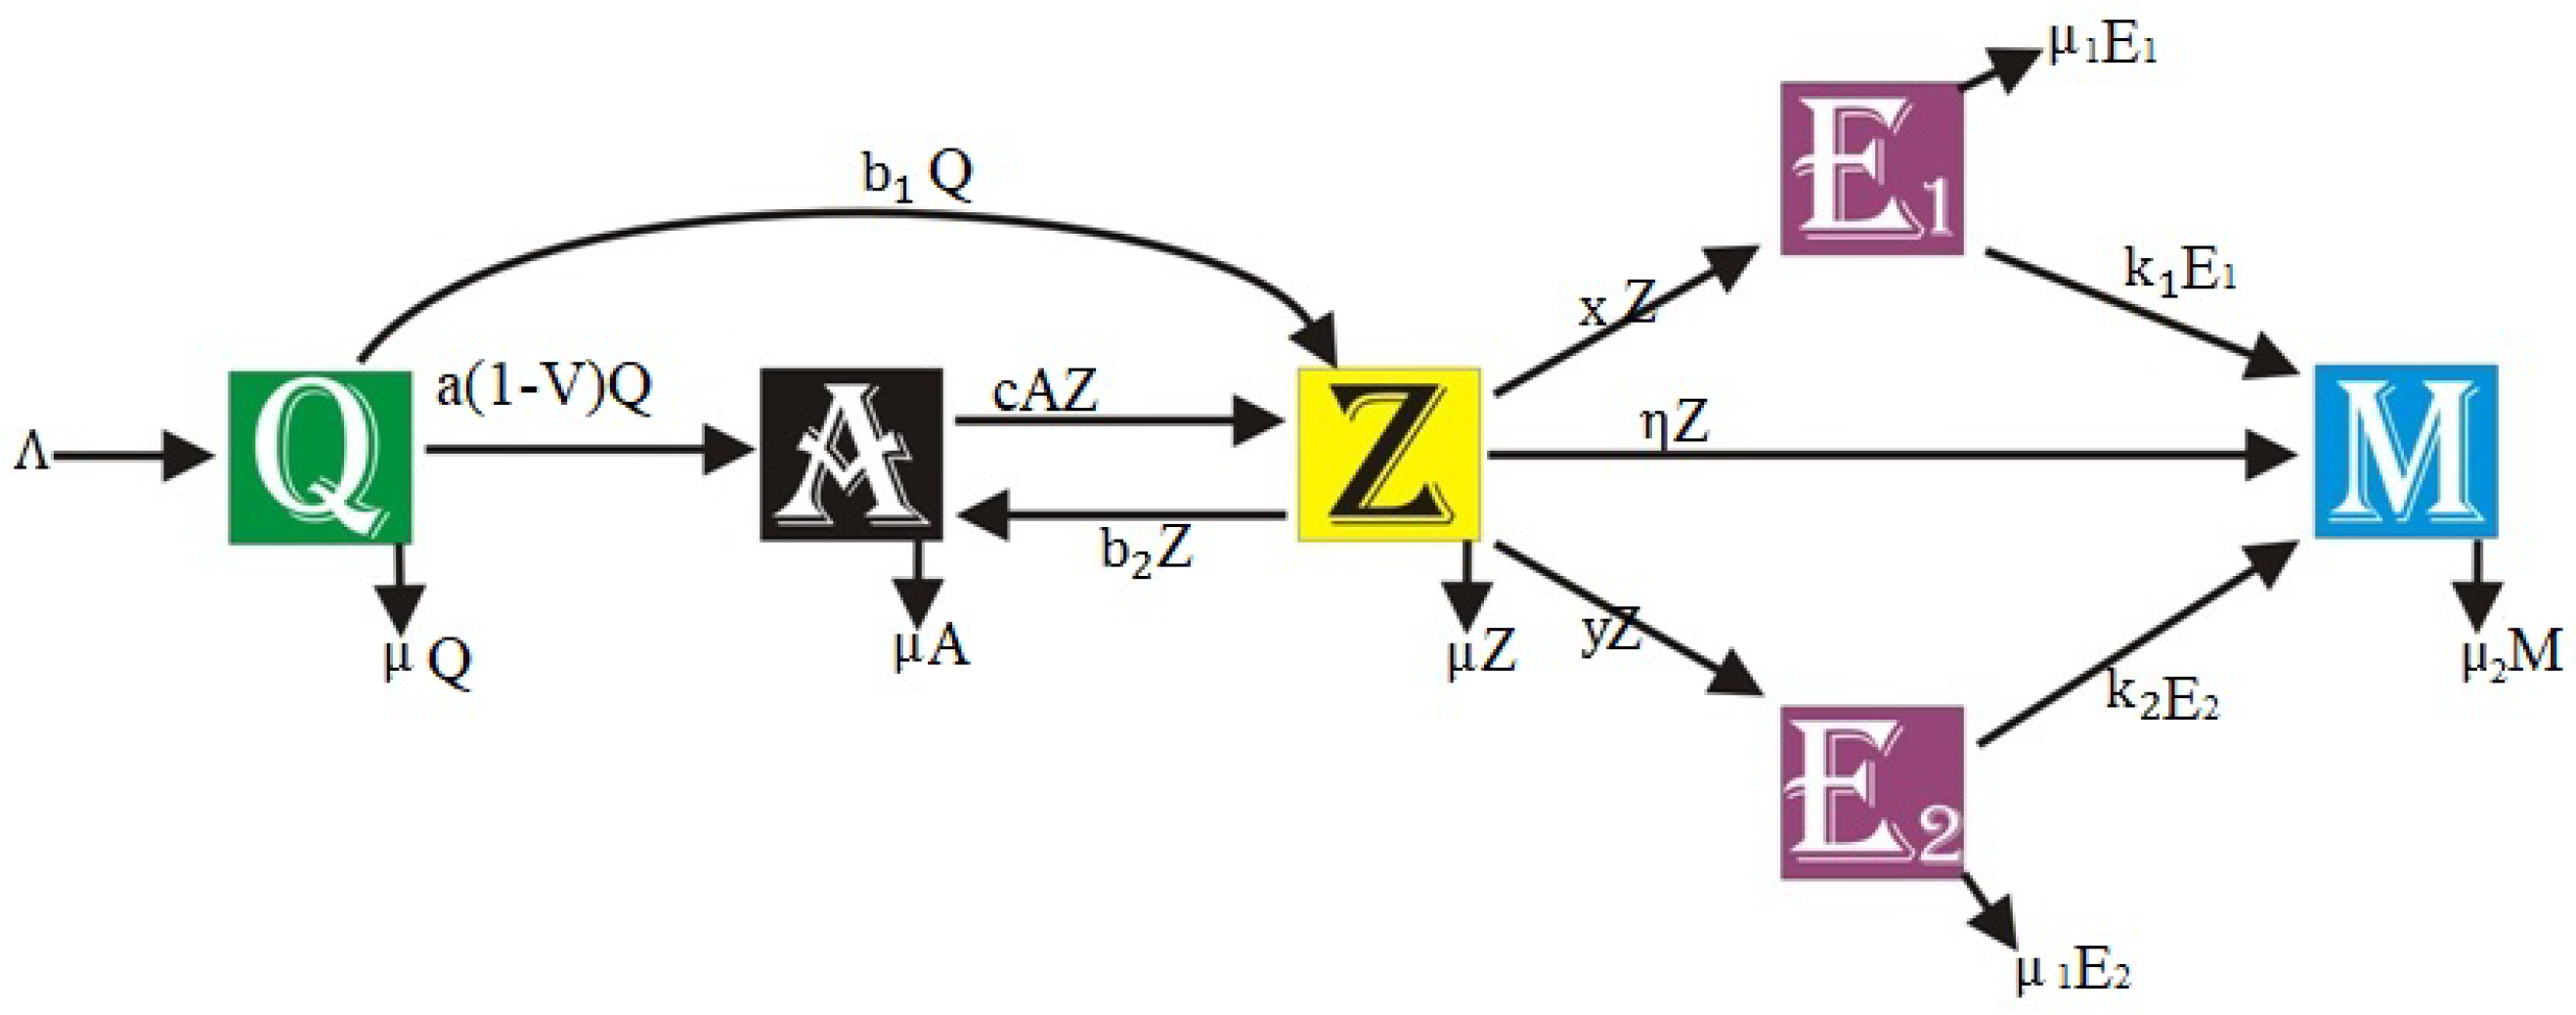
Figure 3.
Trend of Nigerian population. (source Macrotrends [67])
Figure 3.
Trend of Nigerian population. (source Macrotrends [67])
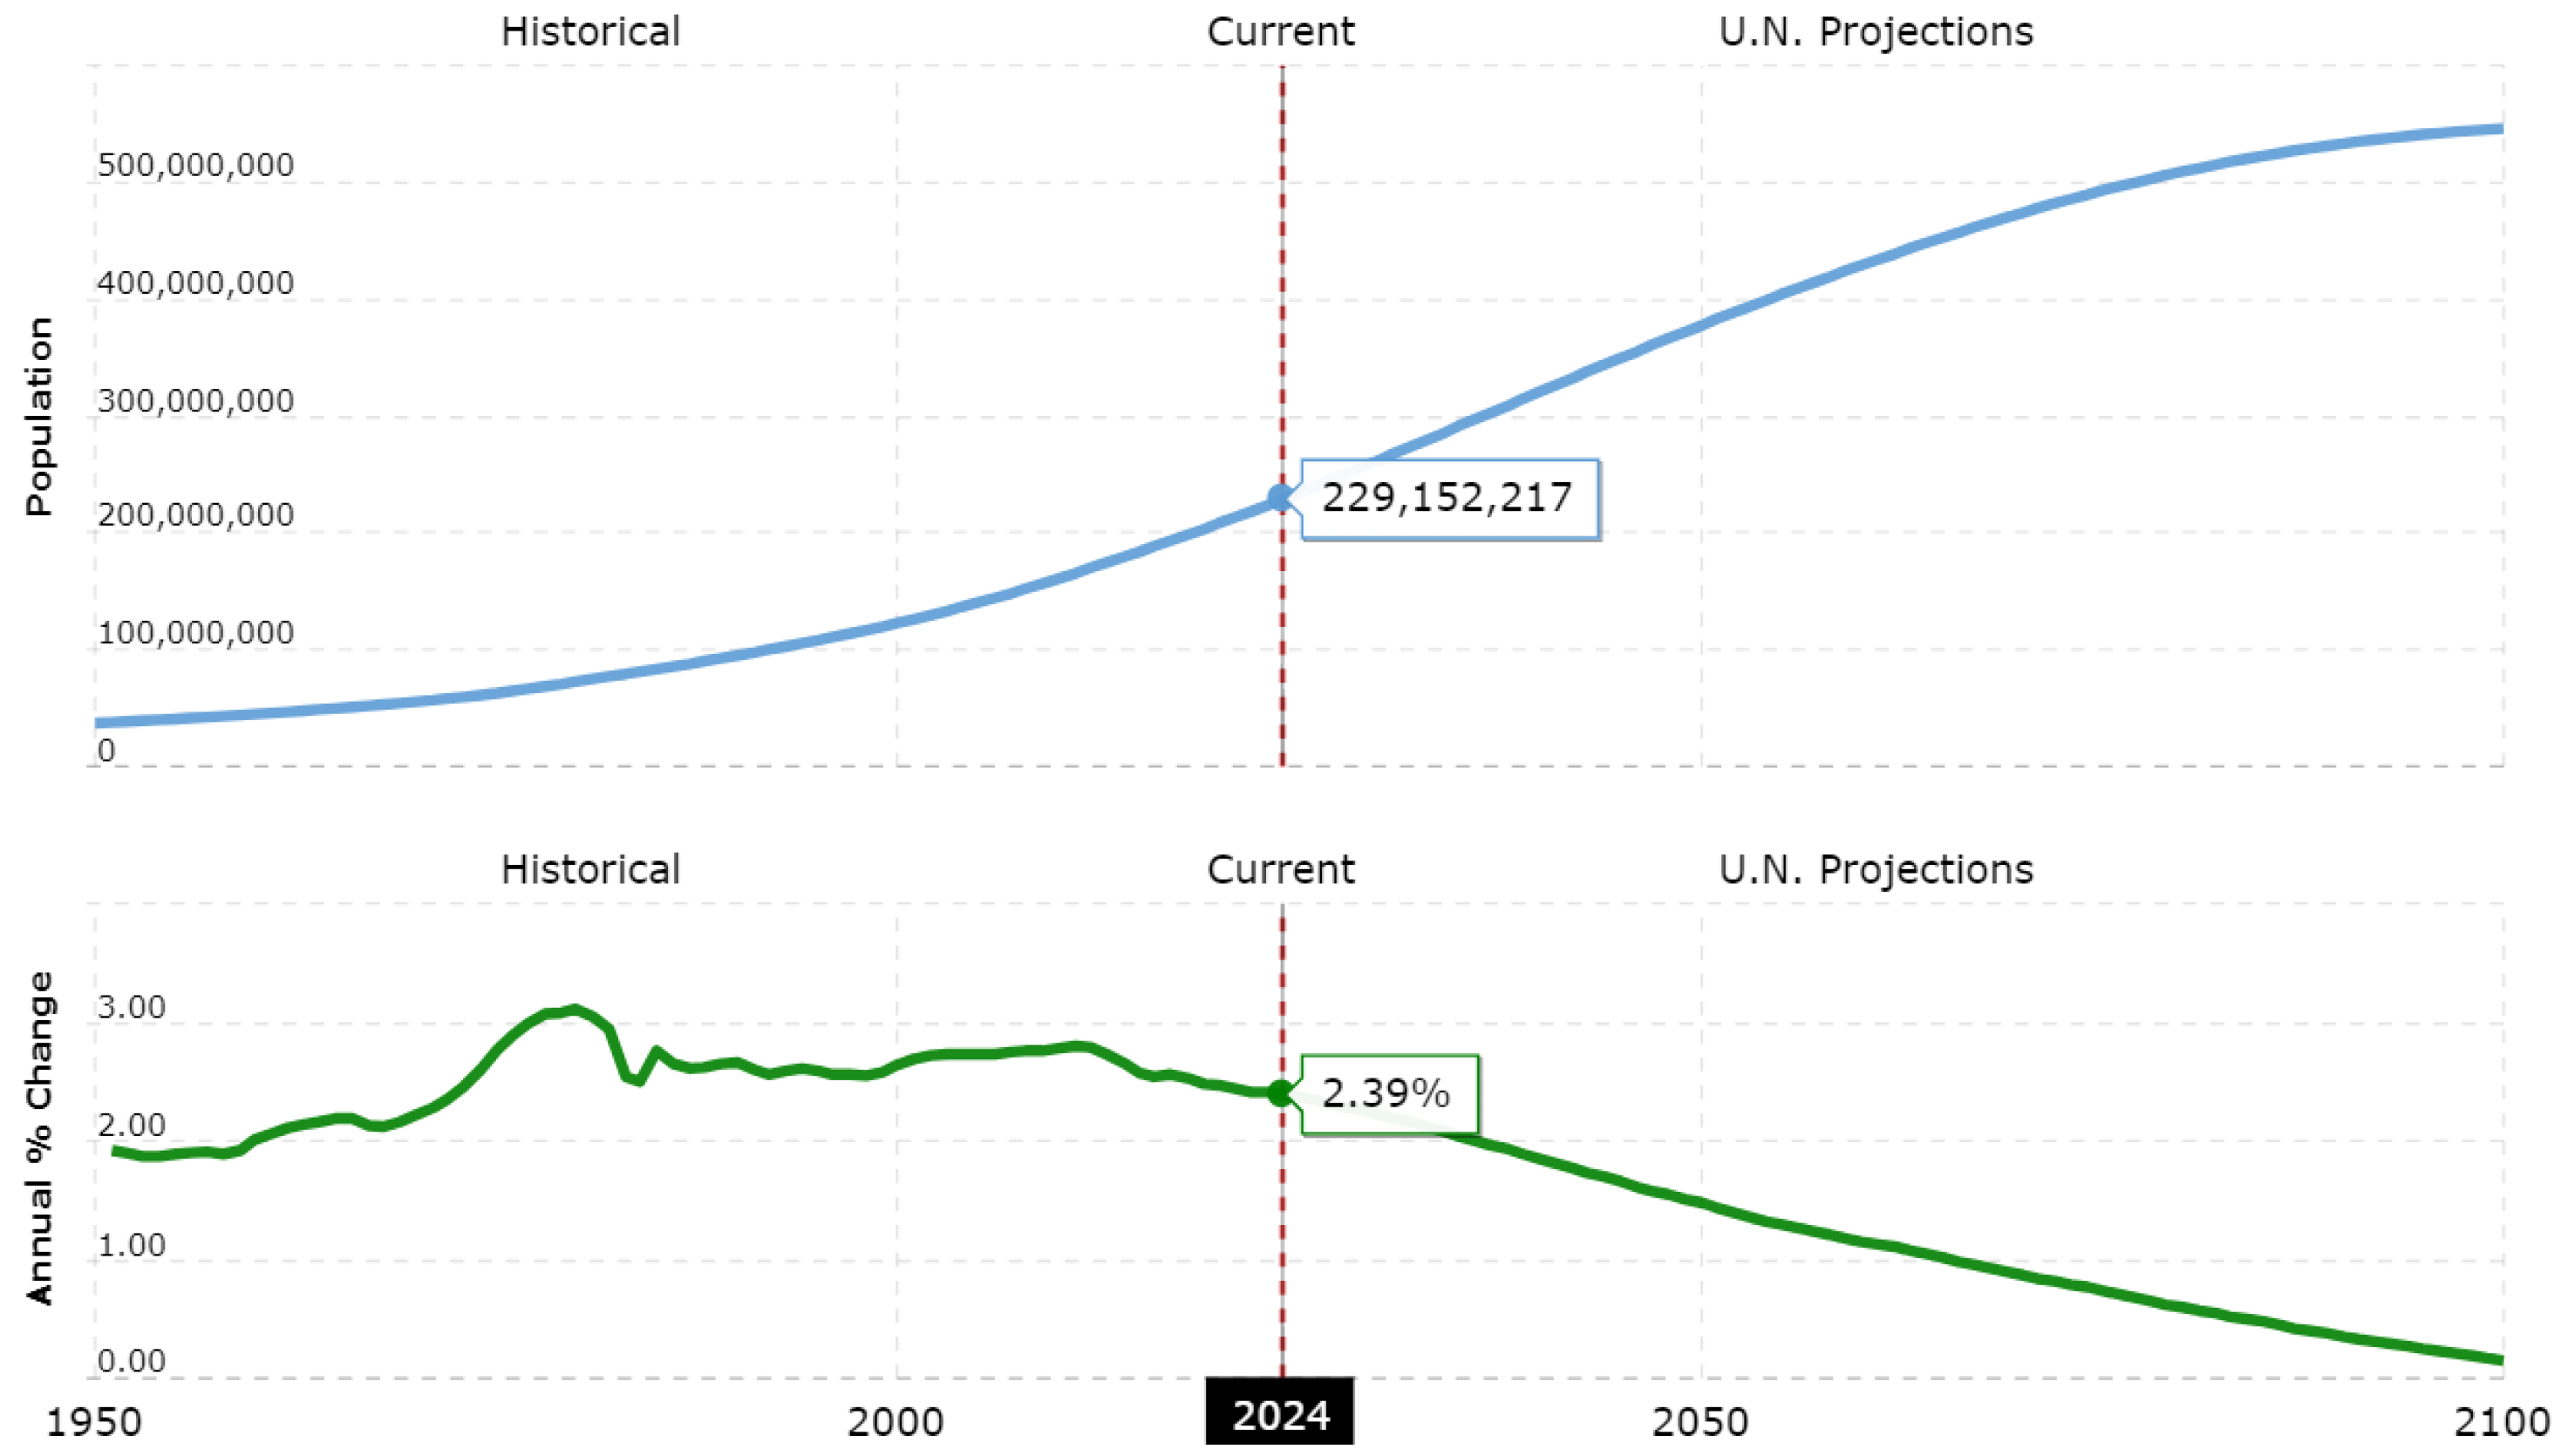
Figure 4.
Effect of subsidy removal in May 2023 (source: Premium Times)
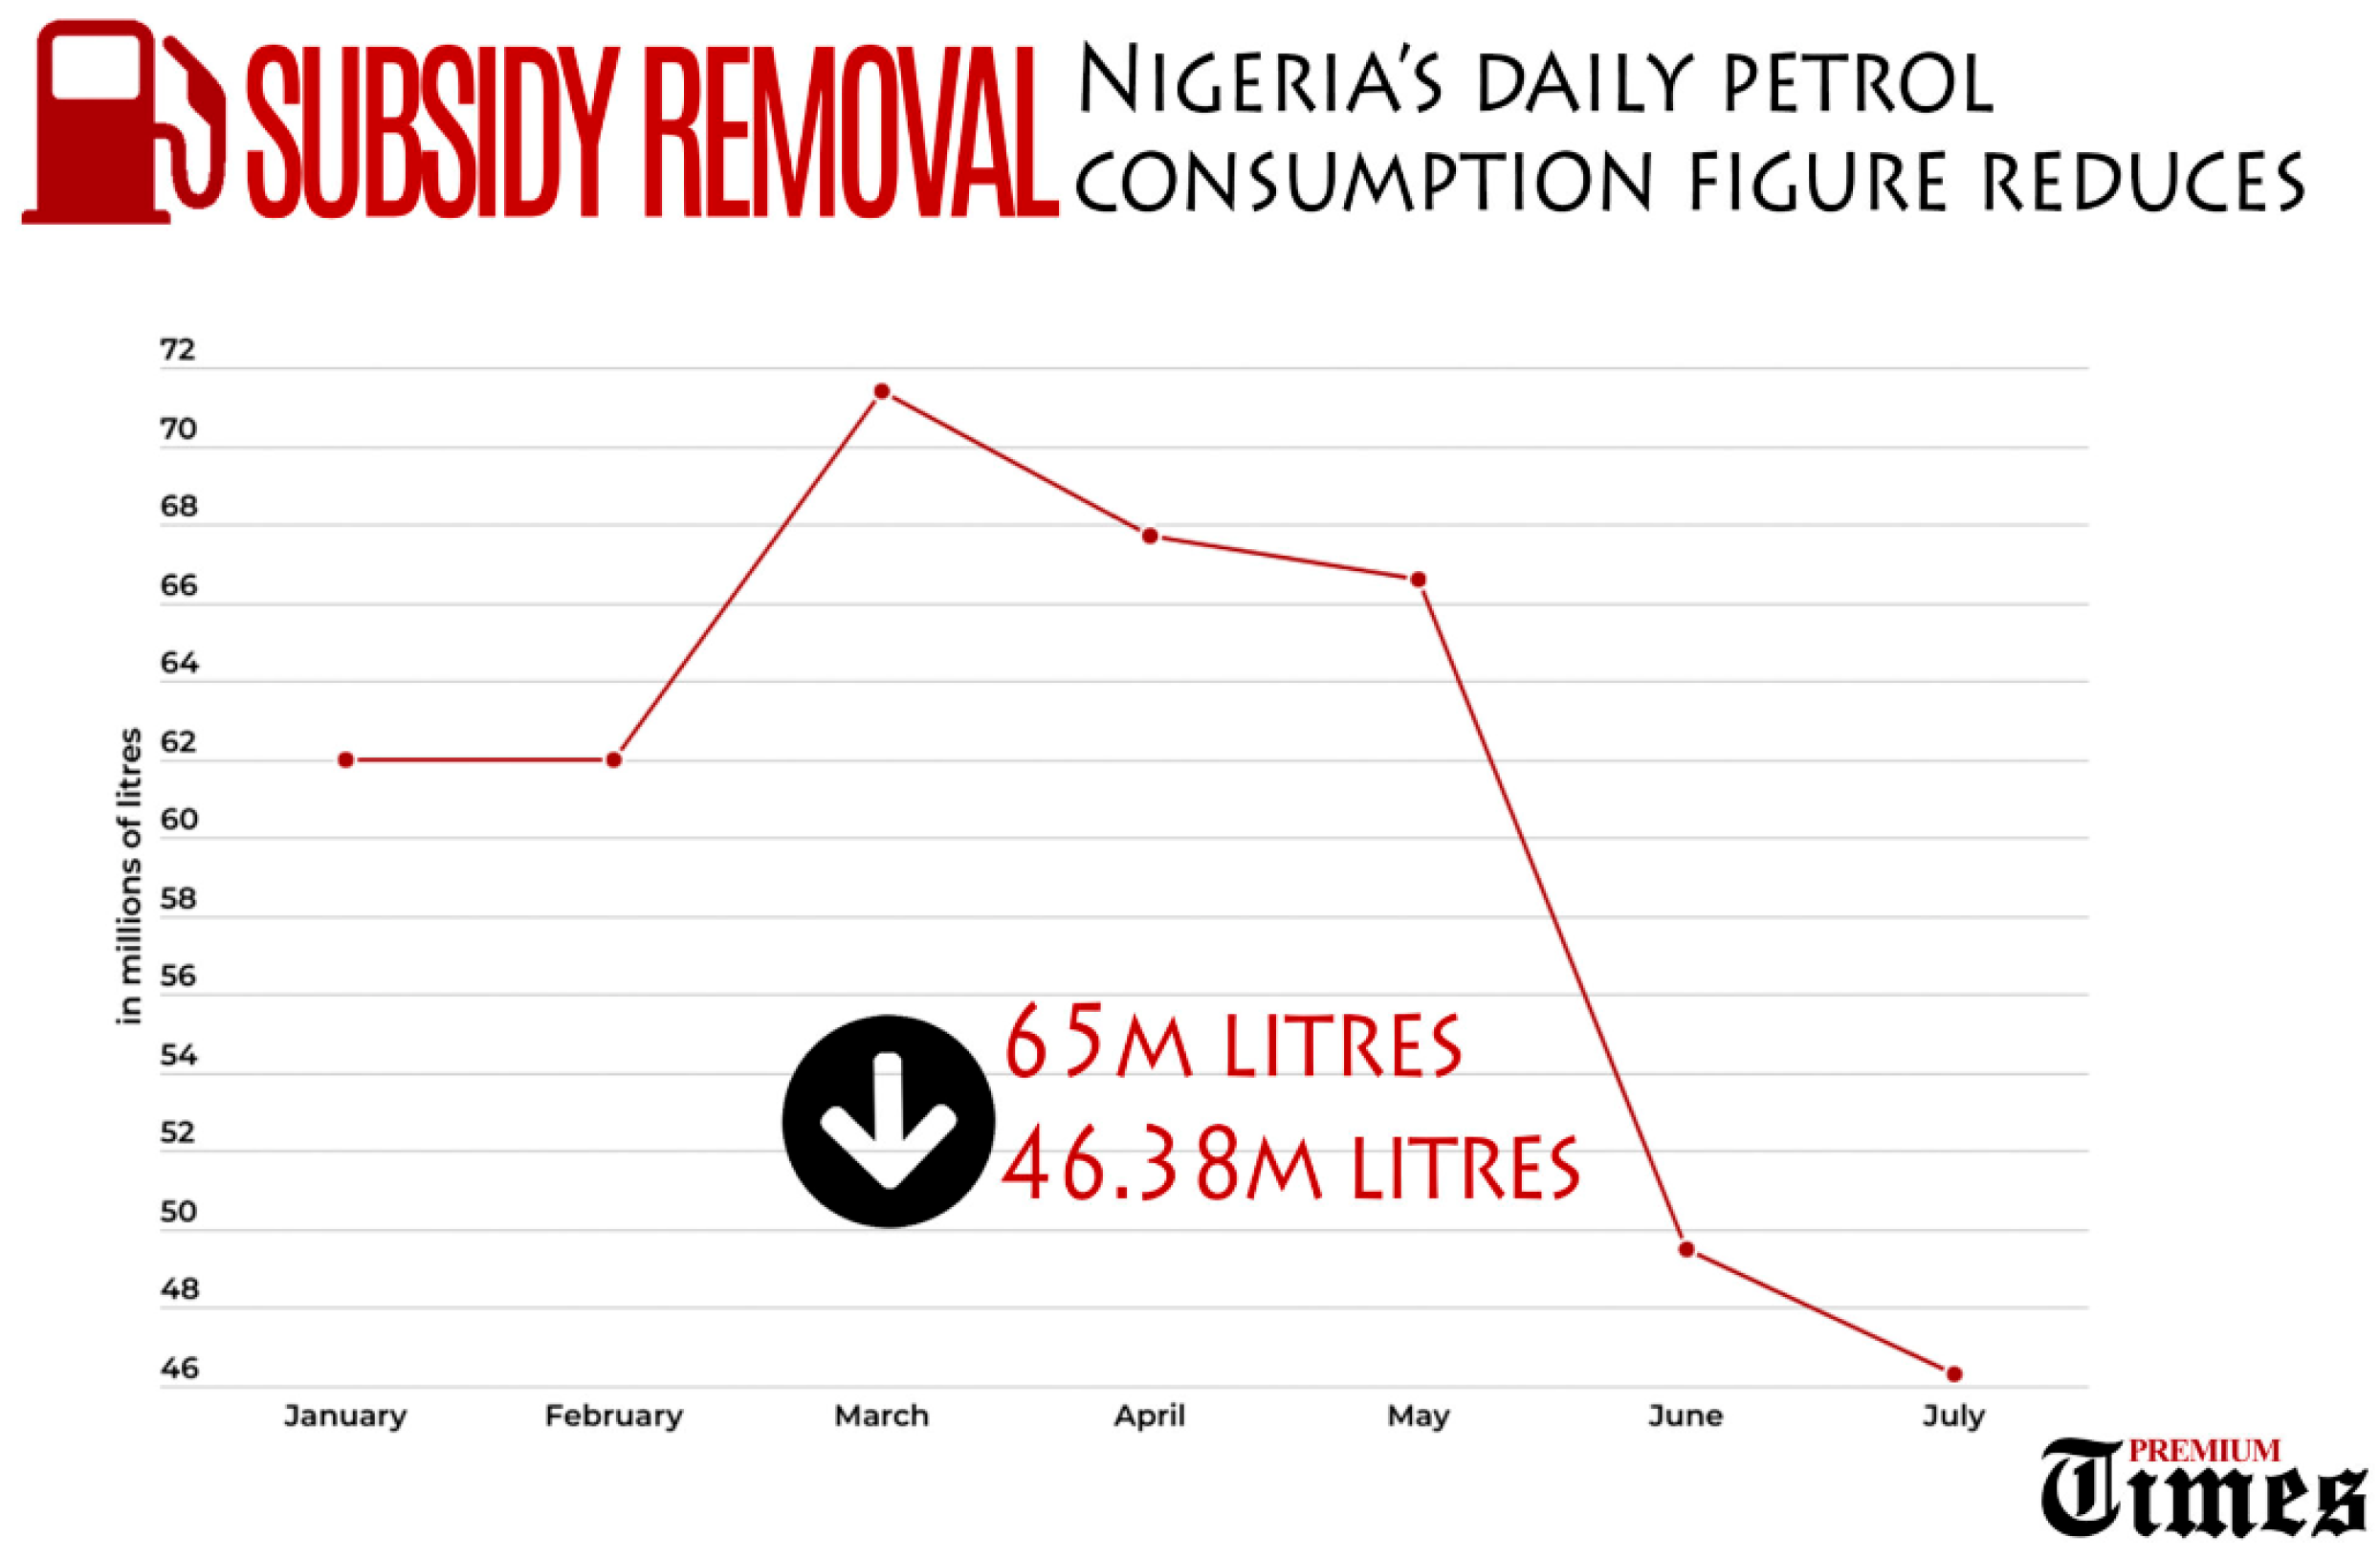
Figure 5.
10-Year Crude Oil Pumped to Local Refineries (Source: NNPC FAAC reports)
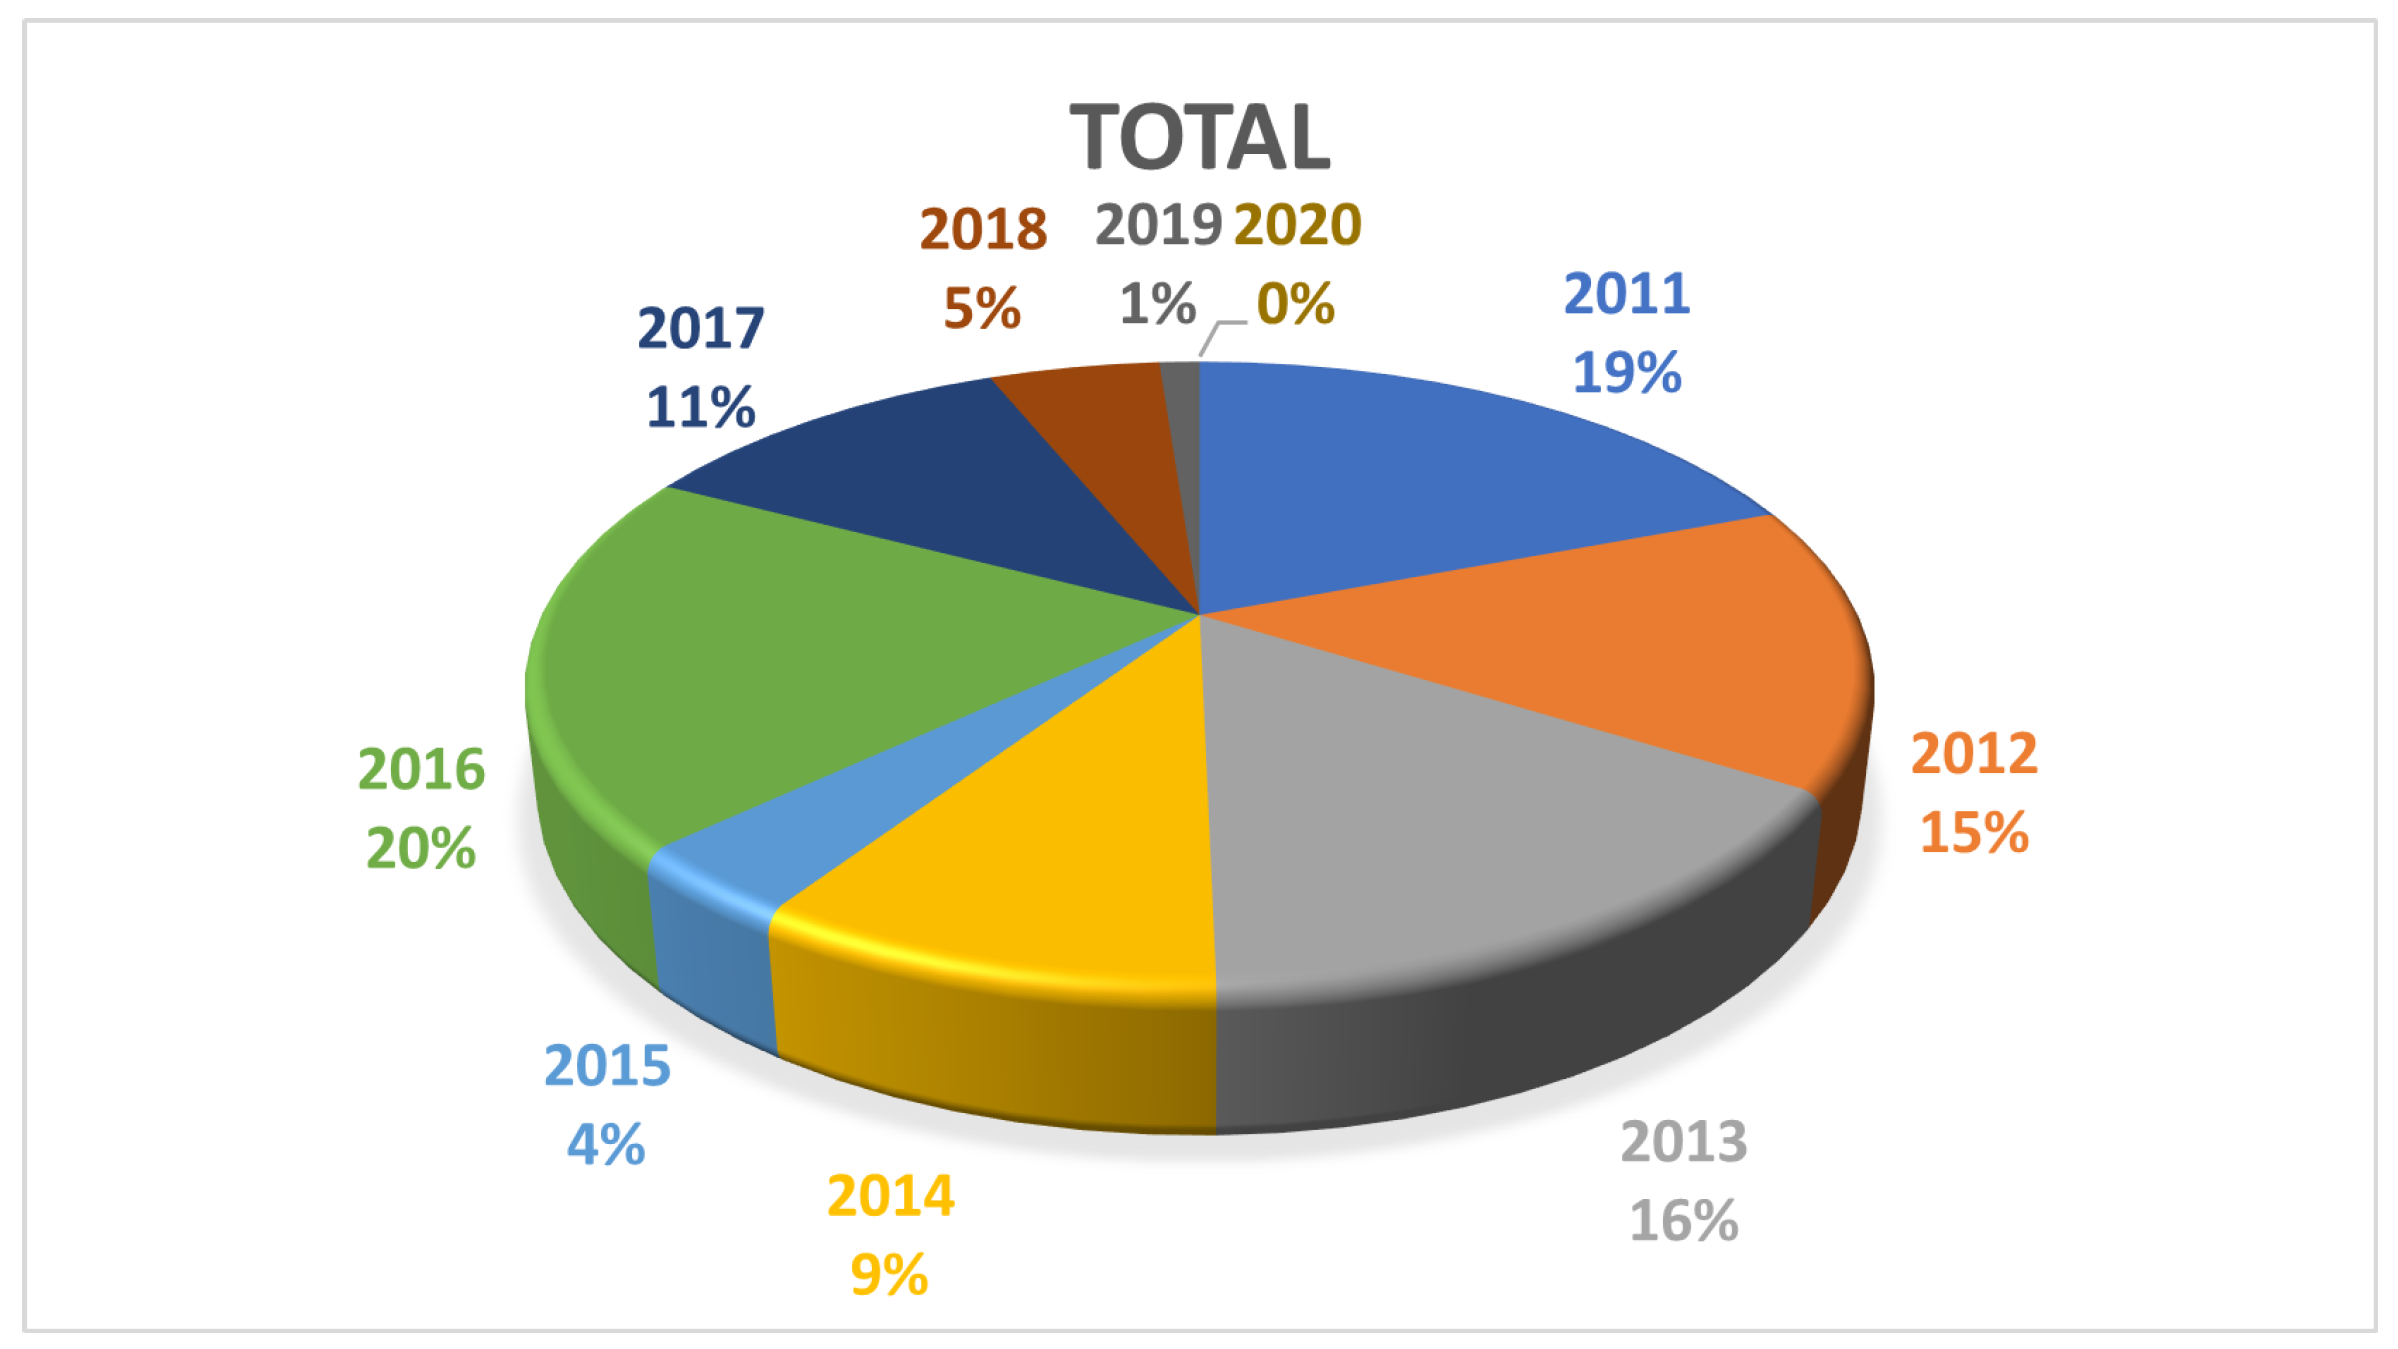
Figure 6.
Component Bar Chart: 5-Year Petroleum Products Distribution by NNPC Retail Ltd (Source: NNPC FAAC reports)
Figure 6.
Component Bar Chart: 5-Year Petroleum Products Distribution by NNPC Retail Ltd (Source: NNPC FAAC reports)
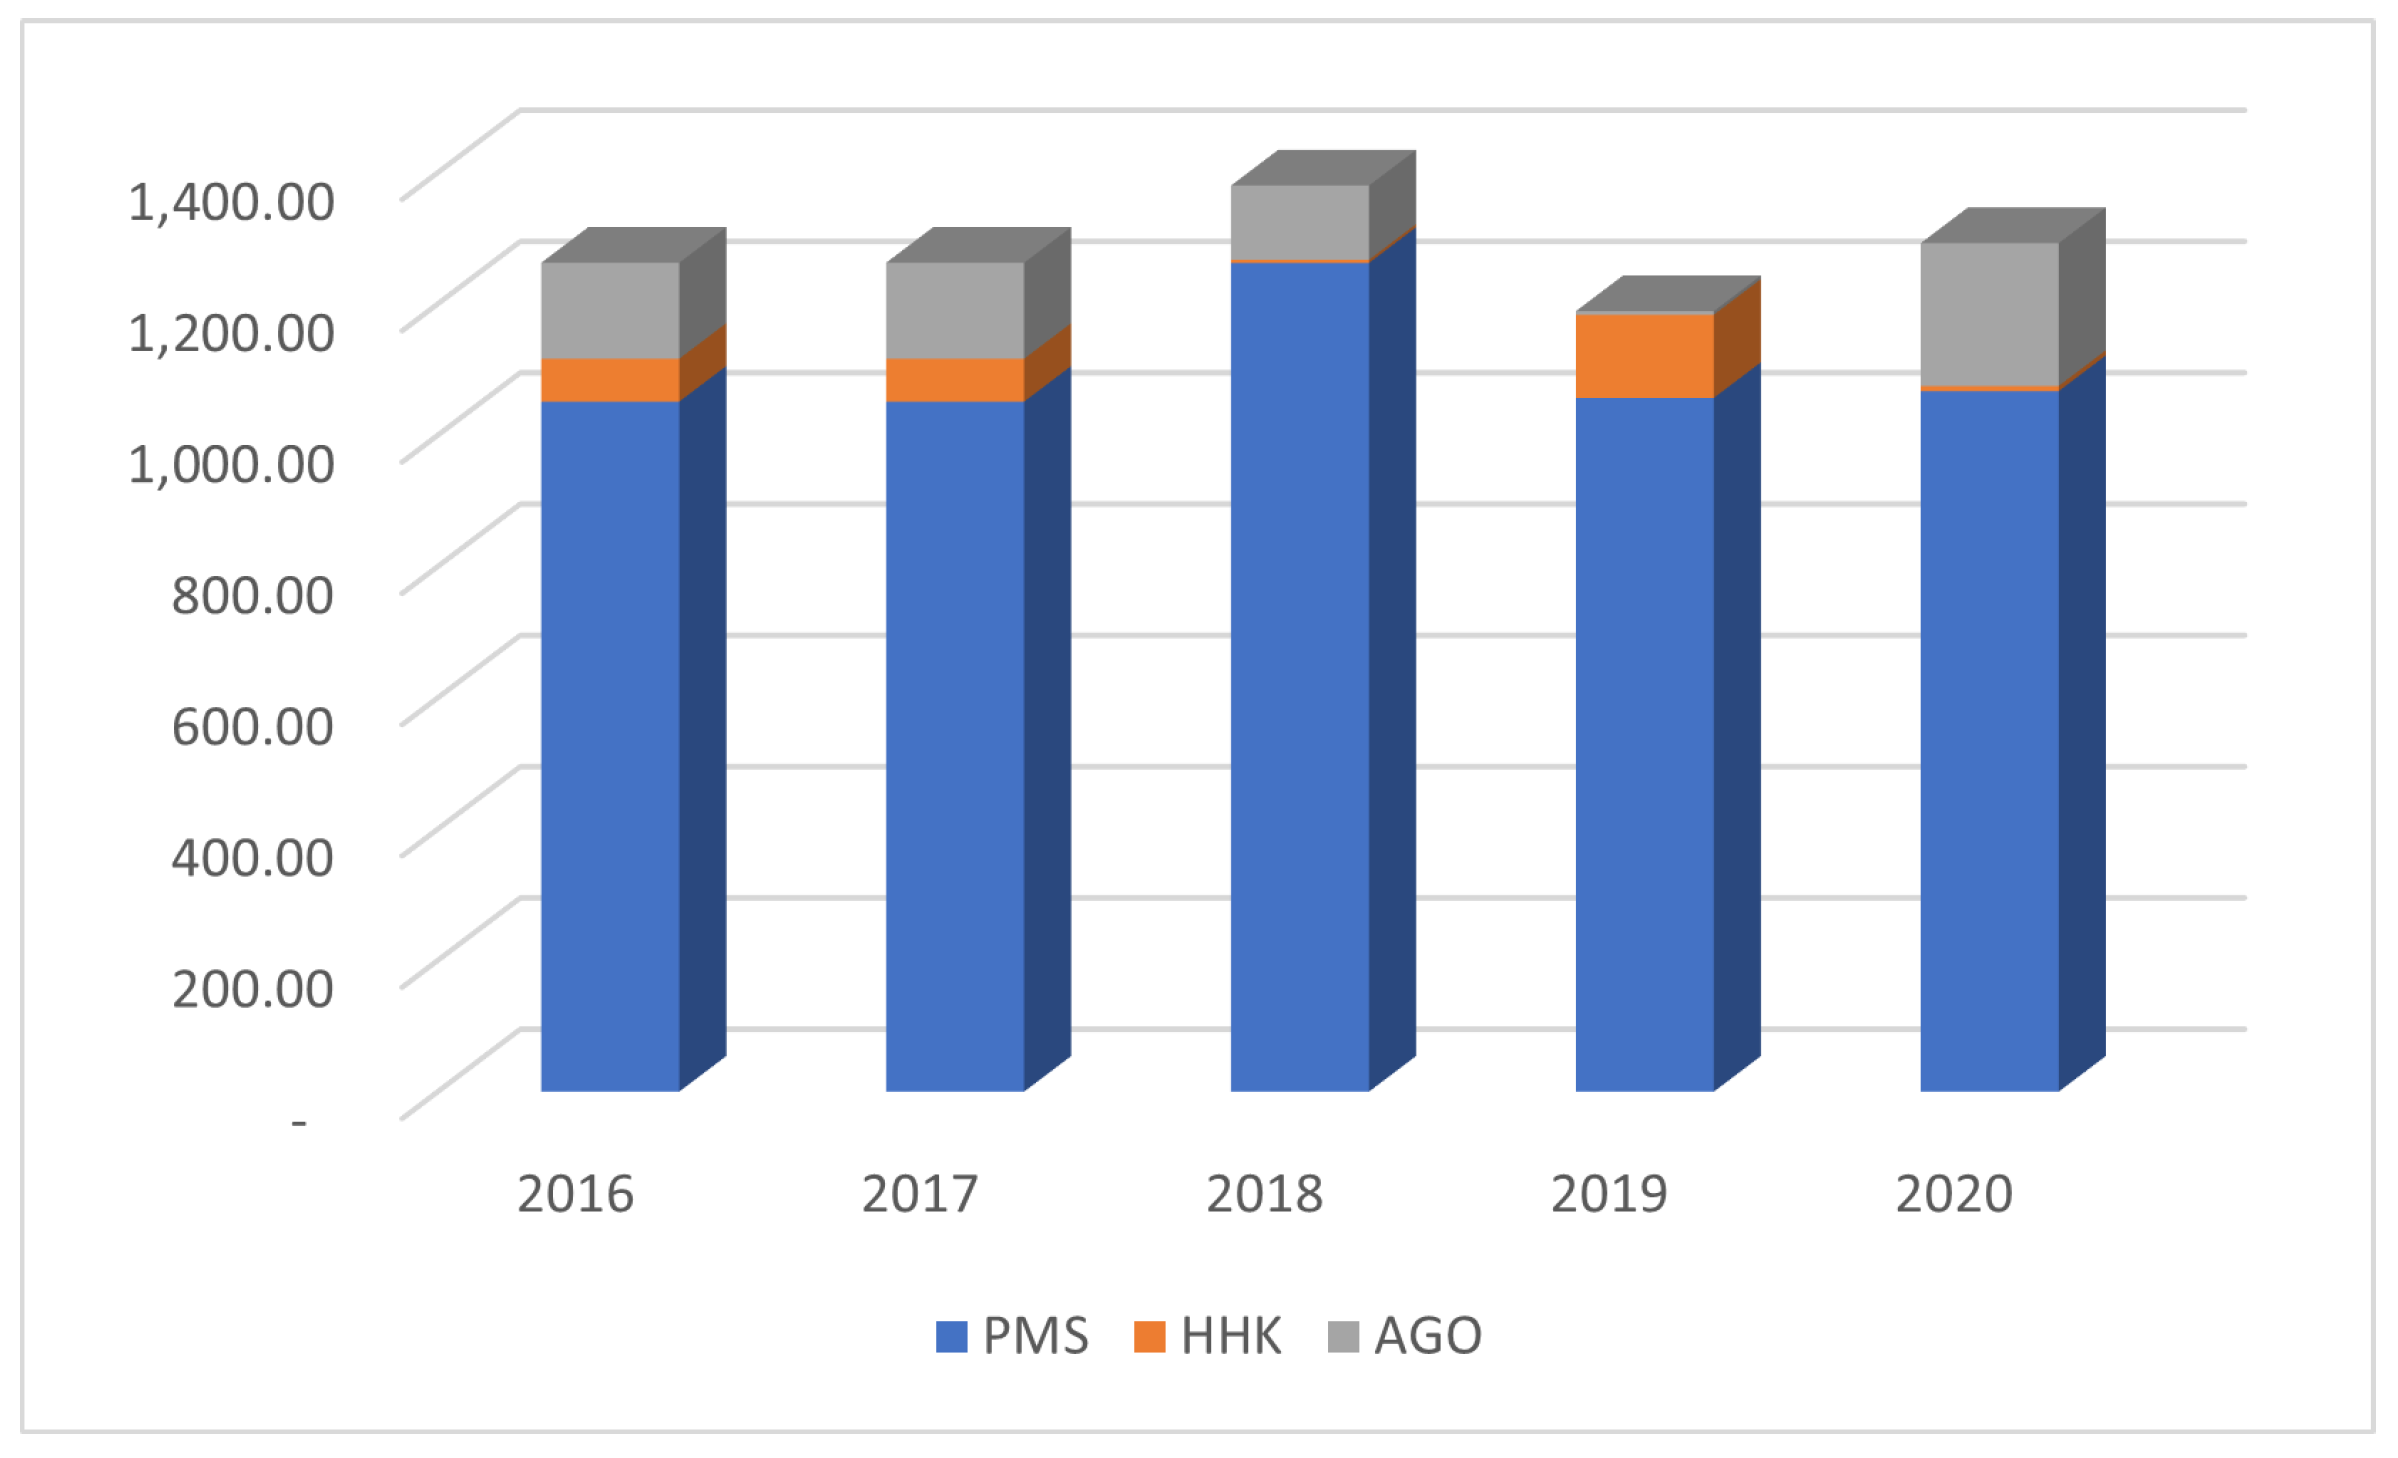
Figure 7.
Simulation showing the impact of alternative routes during high vandalism. When vandalism (v-axis) is at unity and an alternative route ( axis) is effective, exceeds the threshold of 42 million liters per day, assuring a free supply chain (blue-shaded region).
Figure 7.
Simulation showing the impact of alternative routes during high vandalism. When vandalism (v-axis) is at unity and an alternative route ( axis) is effective, exceeds the threshold of 42 million liters per day, assuring a free supply chain (blue-shaded region).
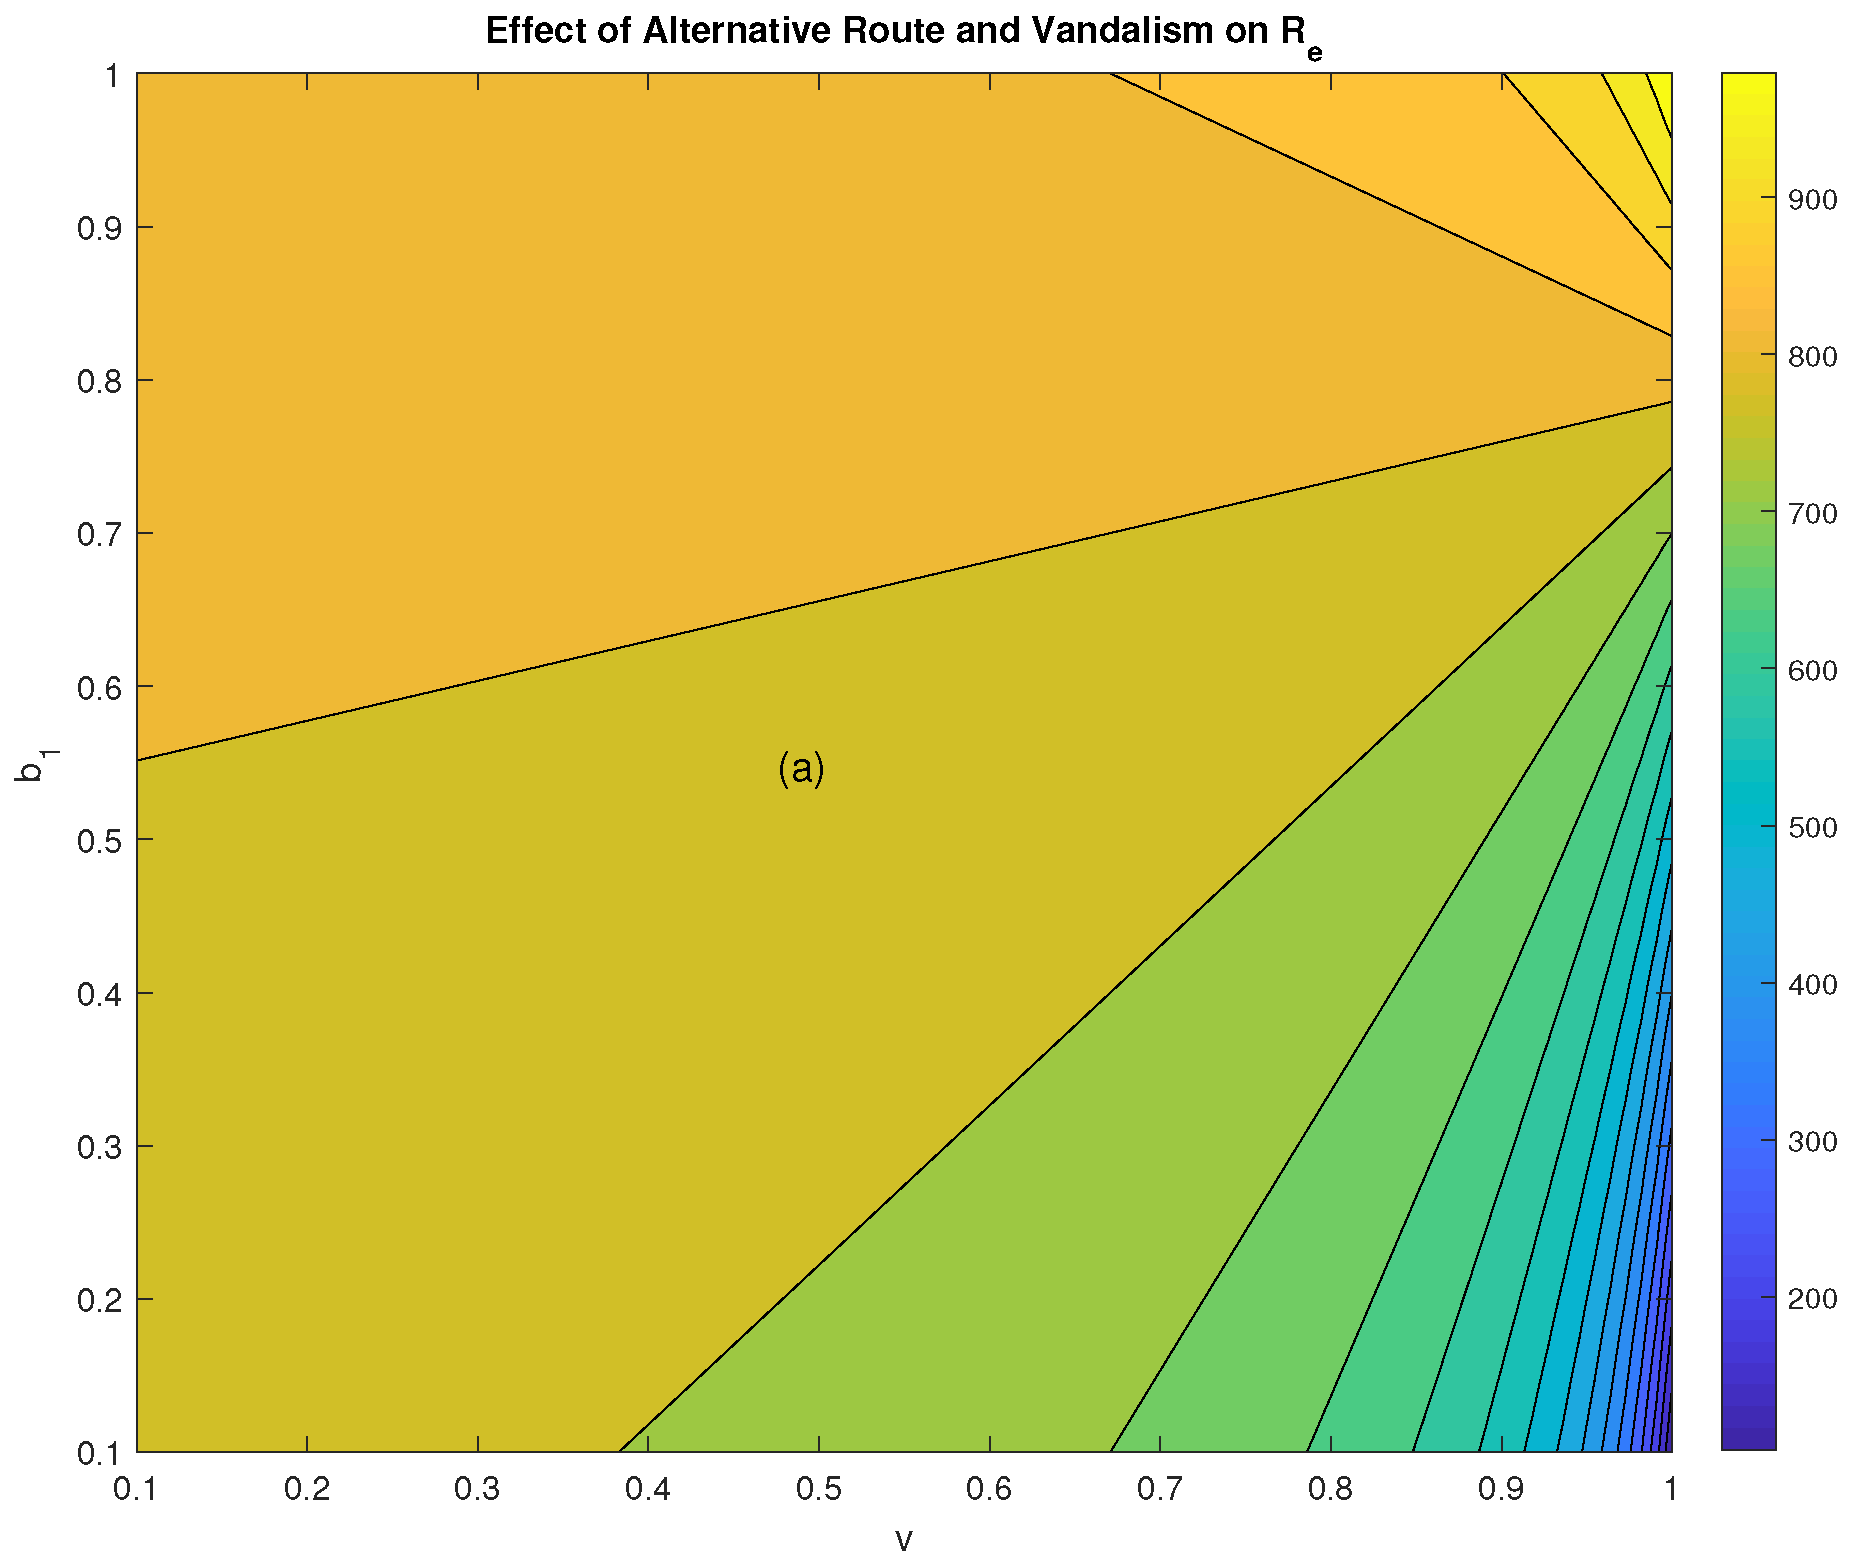
Figure 8.
Simulation showing the effect of vandalism and interventions by NNPCL and major marketers. Maximum supply is achieved with minimal vandalism and negligible diversion (yellow region).
Figure 8.
Simulation showing the effect of vandalism and interventions by NNPCL and major marketers. Maximum supply is achieved with minimal vandalism and negligible diversion (yellow region).
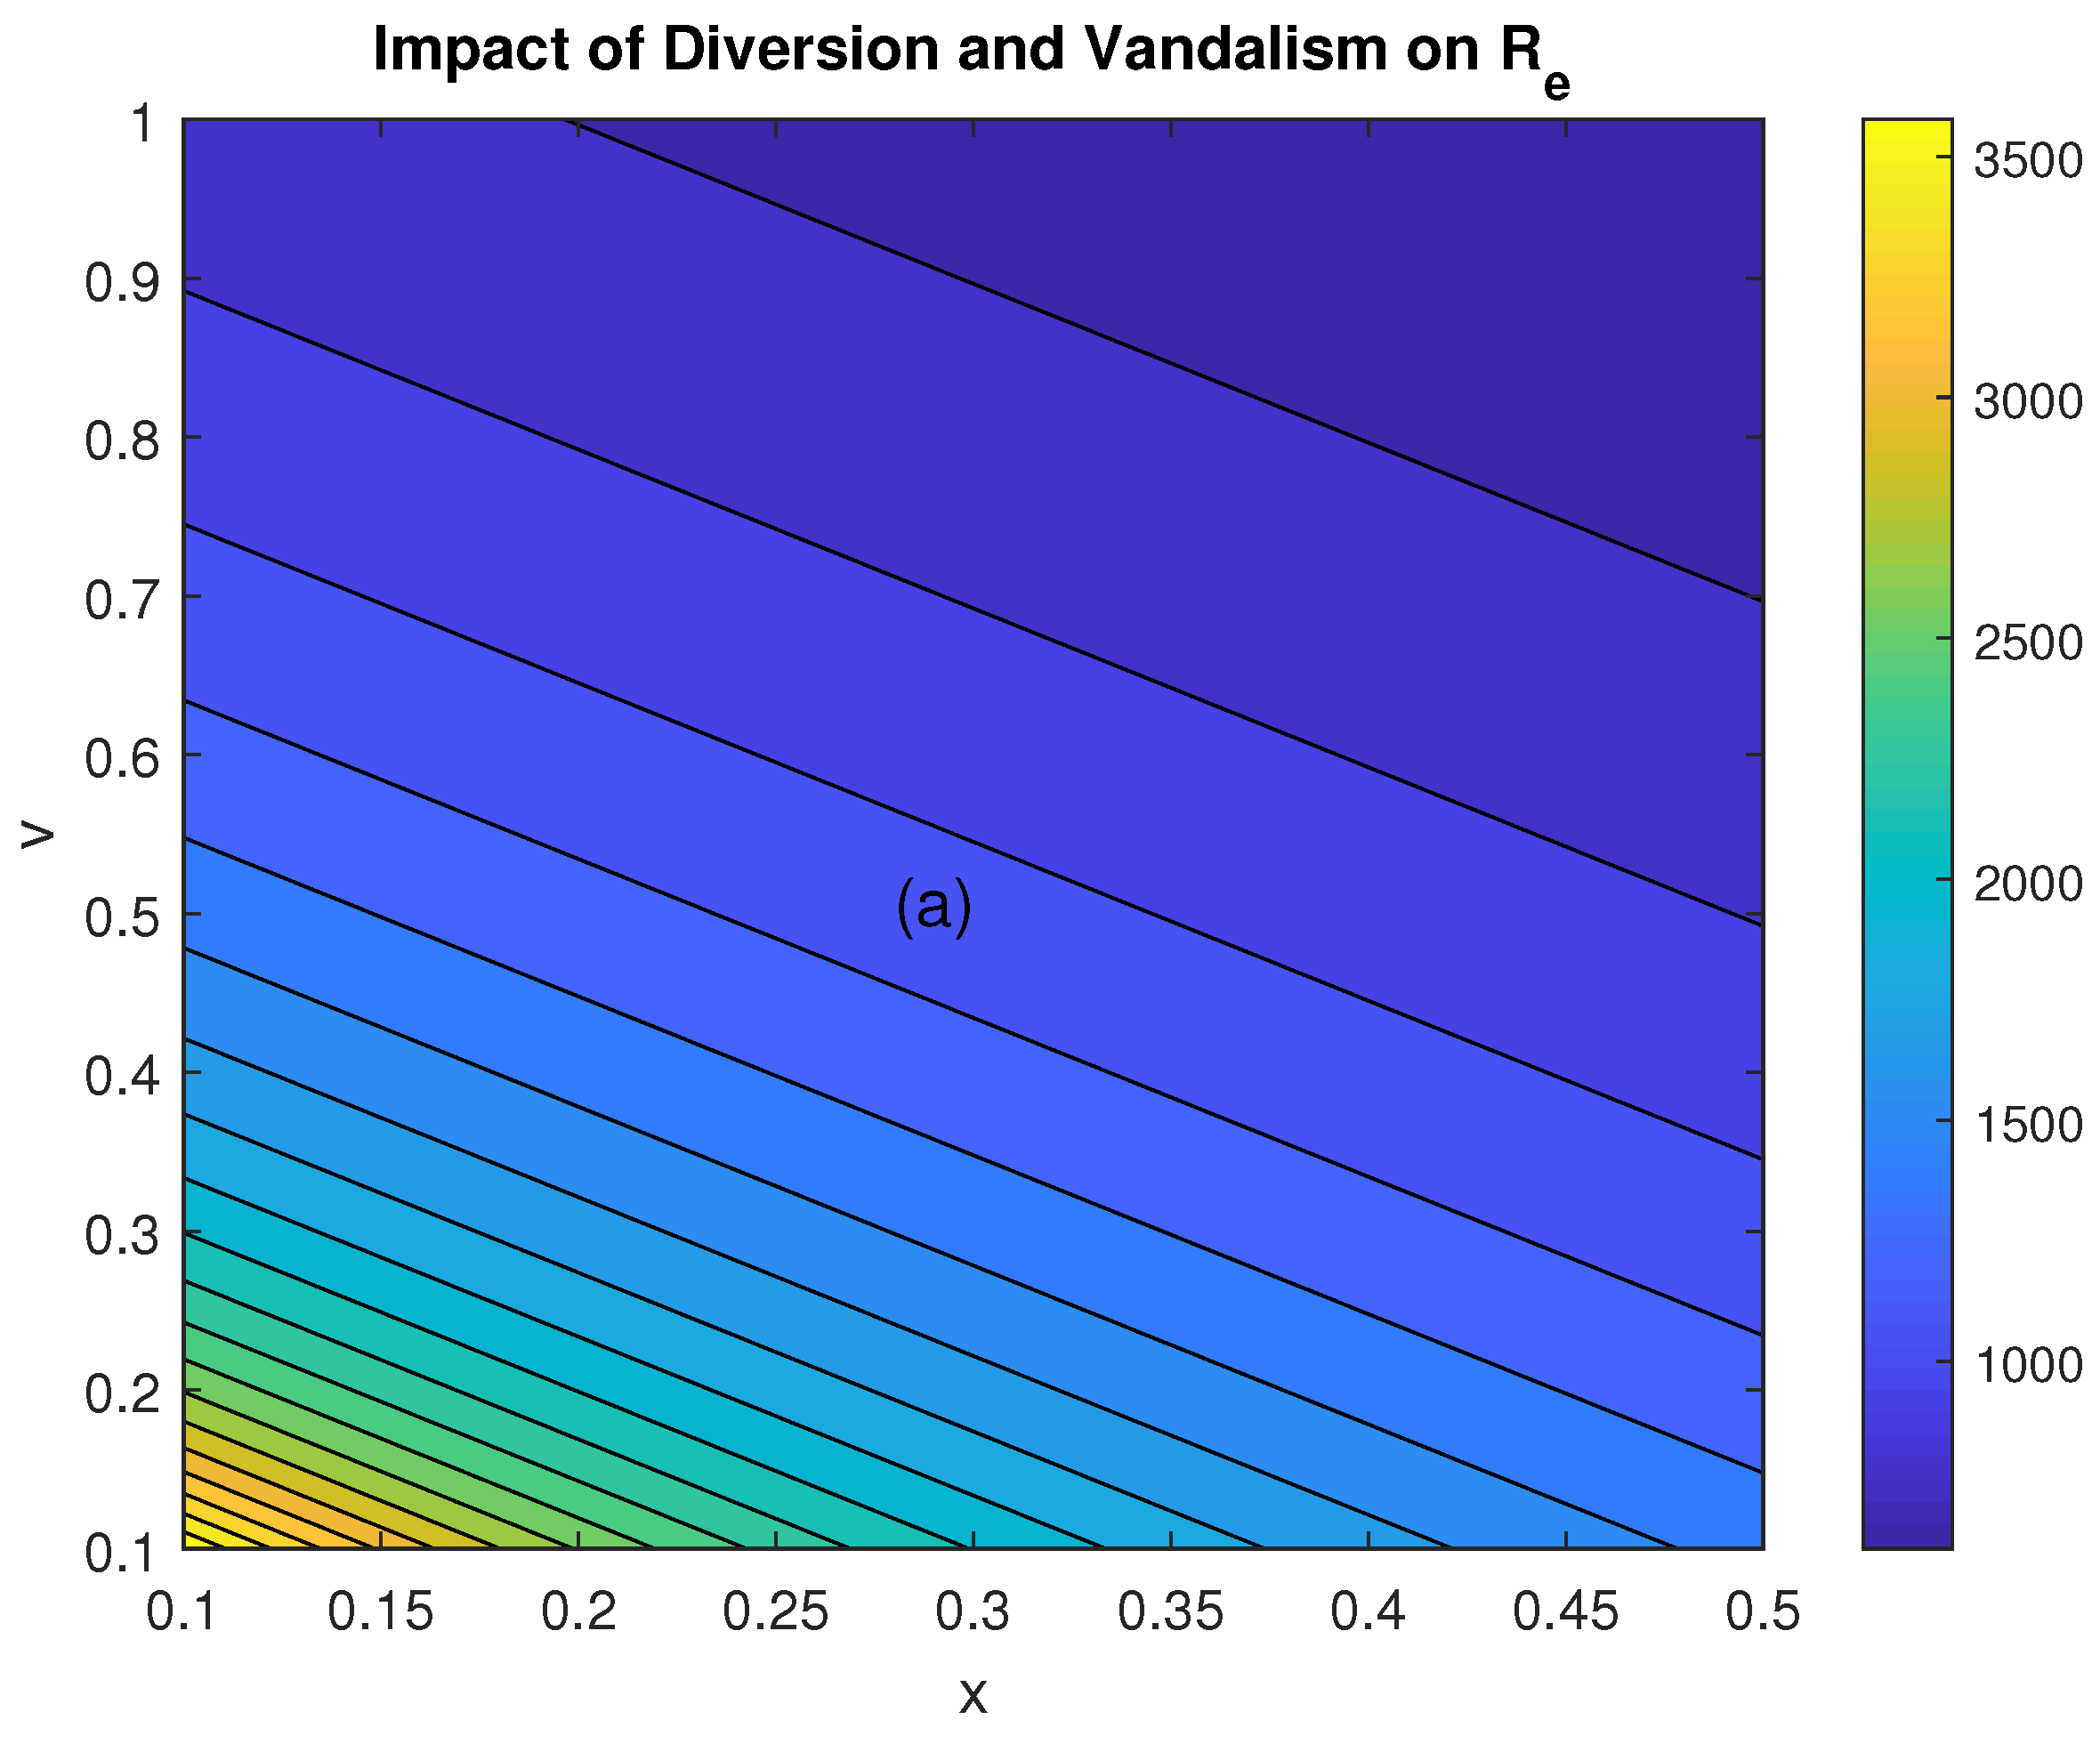
Figure 9.
Q plot: High vandalism without alternative transport traps refined products in storage, worsening fuel scarcity. A plot: Fuel dynamics at NNPC/PPMC depots, where efficiency () ensures continuous downstream distribution. The y. axis quantity of refined petroleum in a million litres
Figure 9.
Q plot: High vandalism without alternative transport traps refined products in storage, worsening fuel scarcity. A plot: Fuel dynamics at NNPC/PPMC depots, where efficiency () ensures continuous downstream distribution. The y. axis quantity of refined petroleum in a million litres
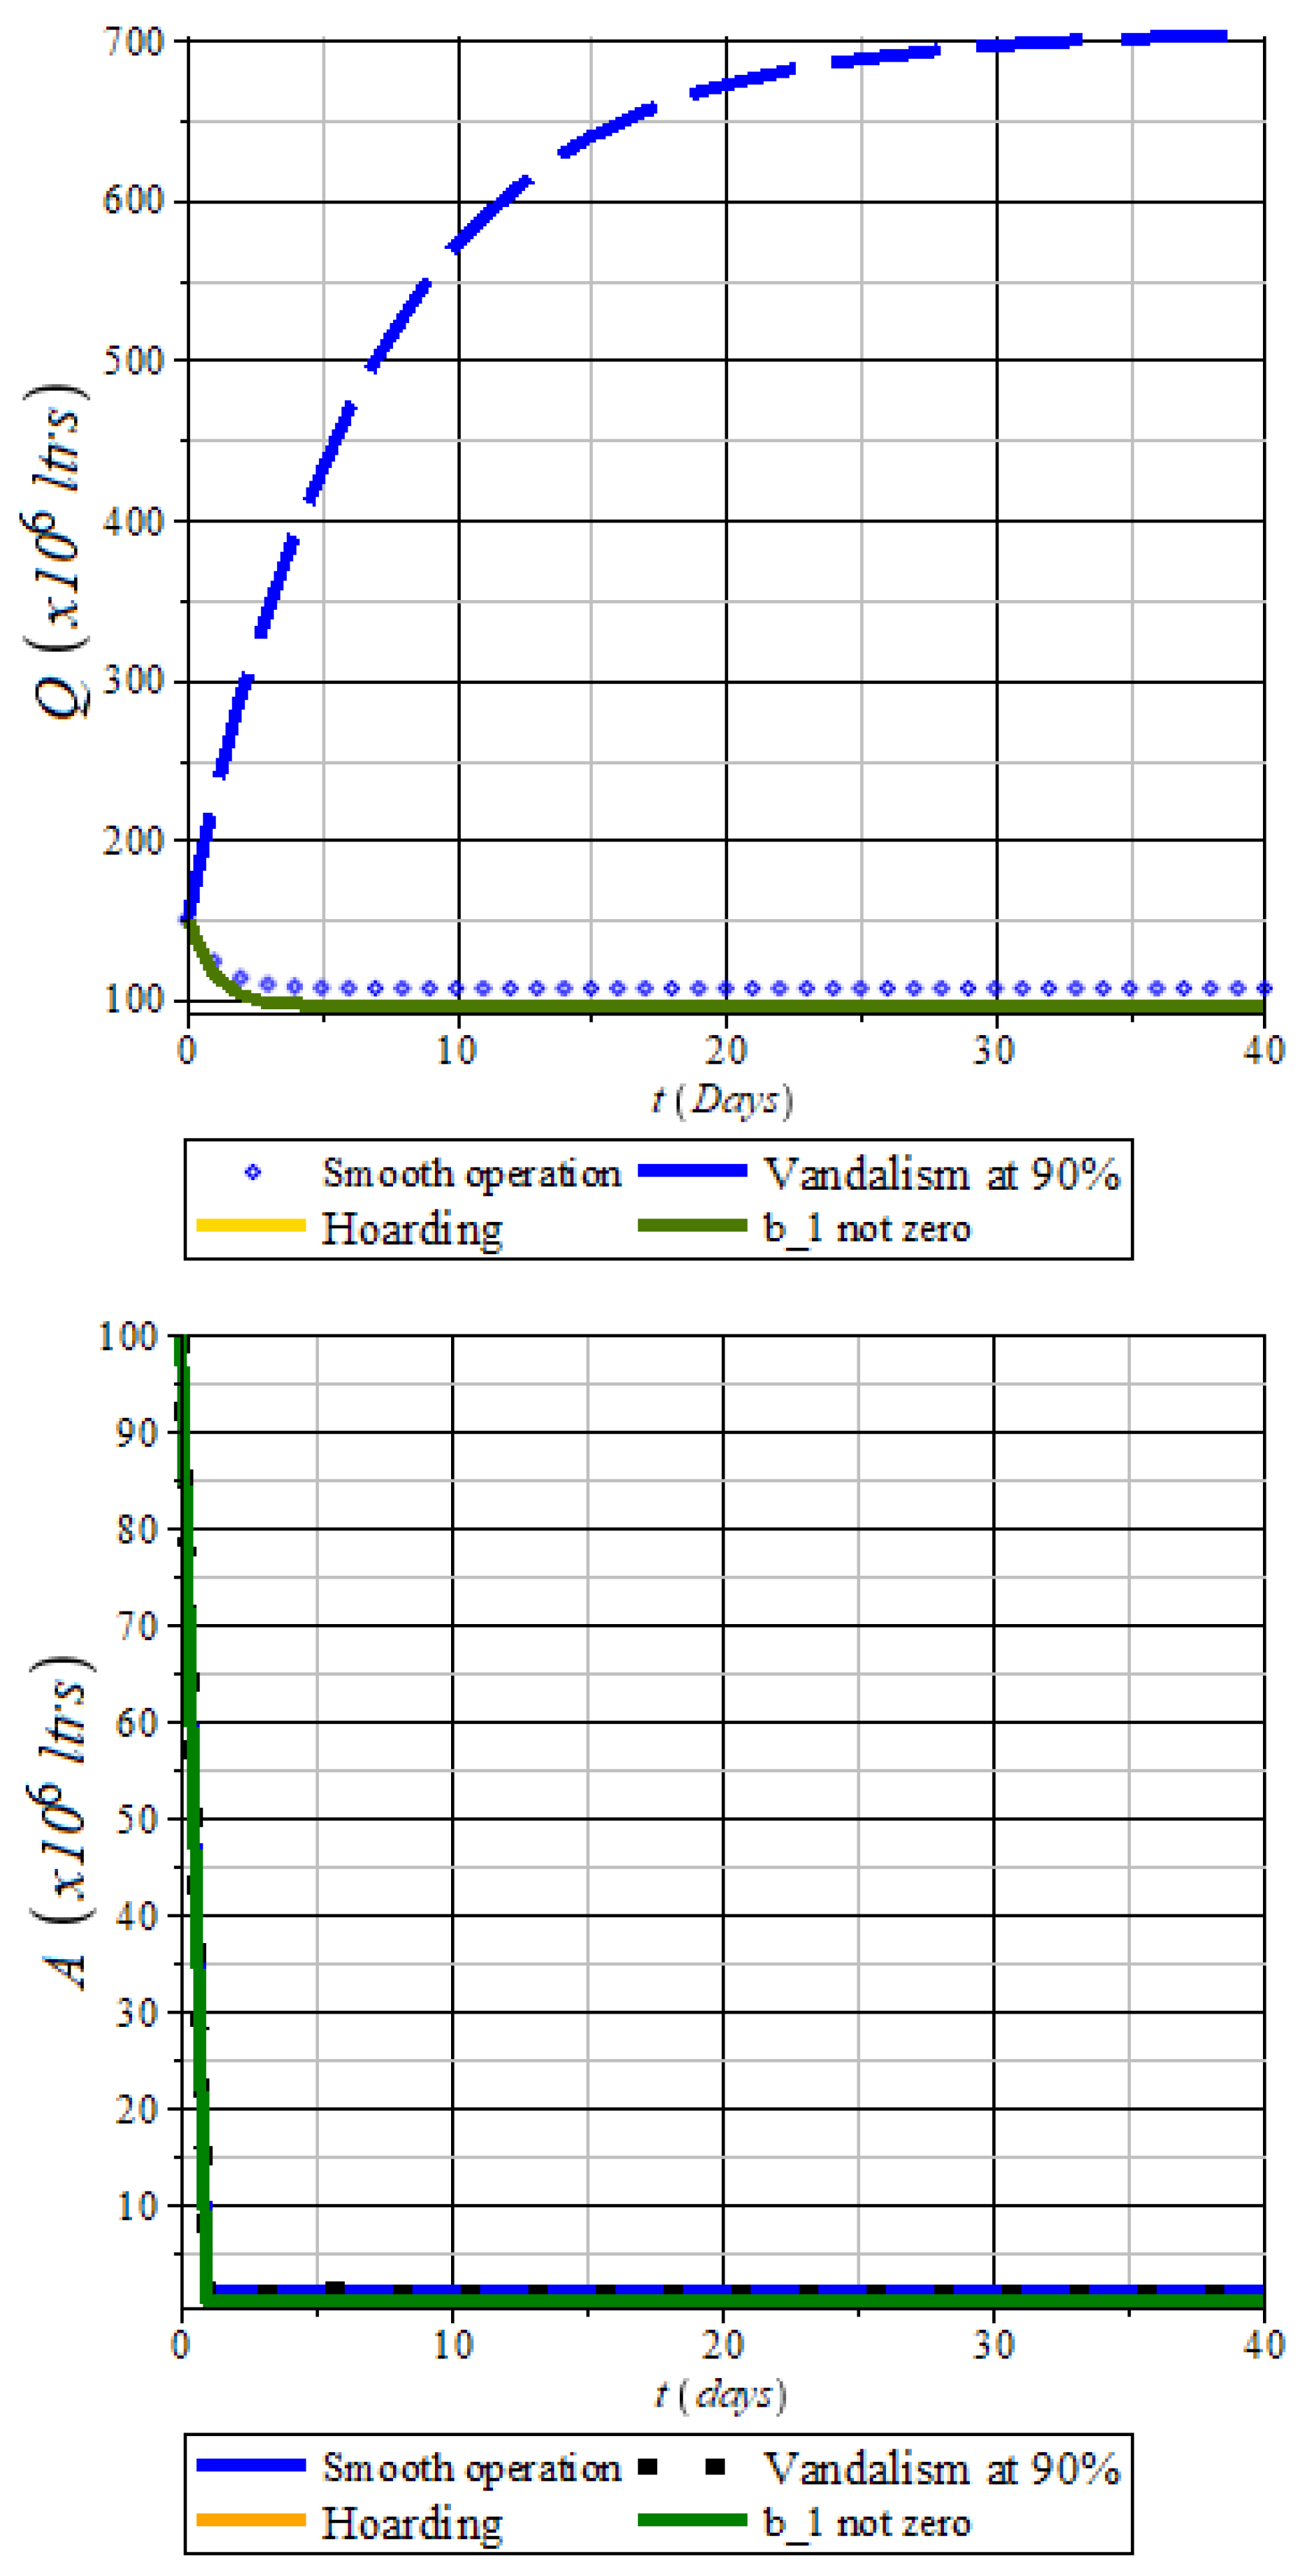
Figure 10.
Z Profile: Simulation showing the impact of high vandalism and lack of alternative transport on fuel lifting by transporters (black-dotted plot). Profile: Fuel distribution dynamics at NNPCL and major marketers’ stations under scenarios of vandalism, hoarding, moderate functionality, and optimal operation. Fuel diversion to independent marketers significantly affects availability.
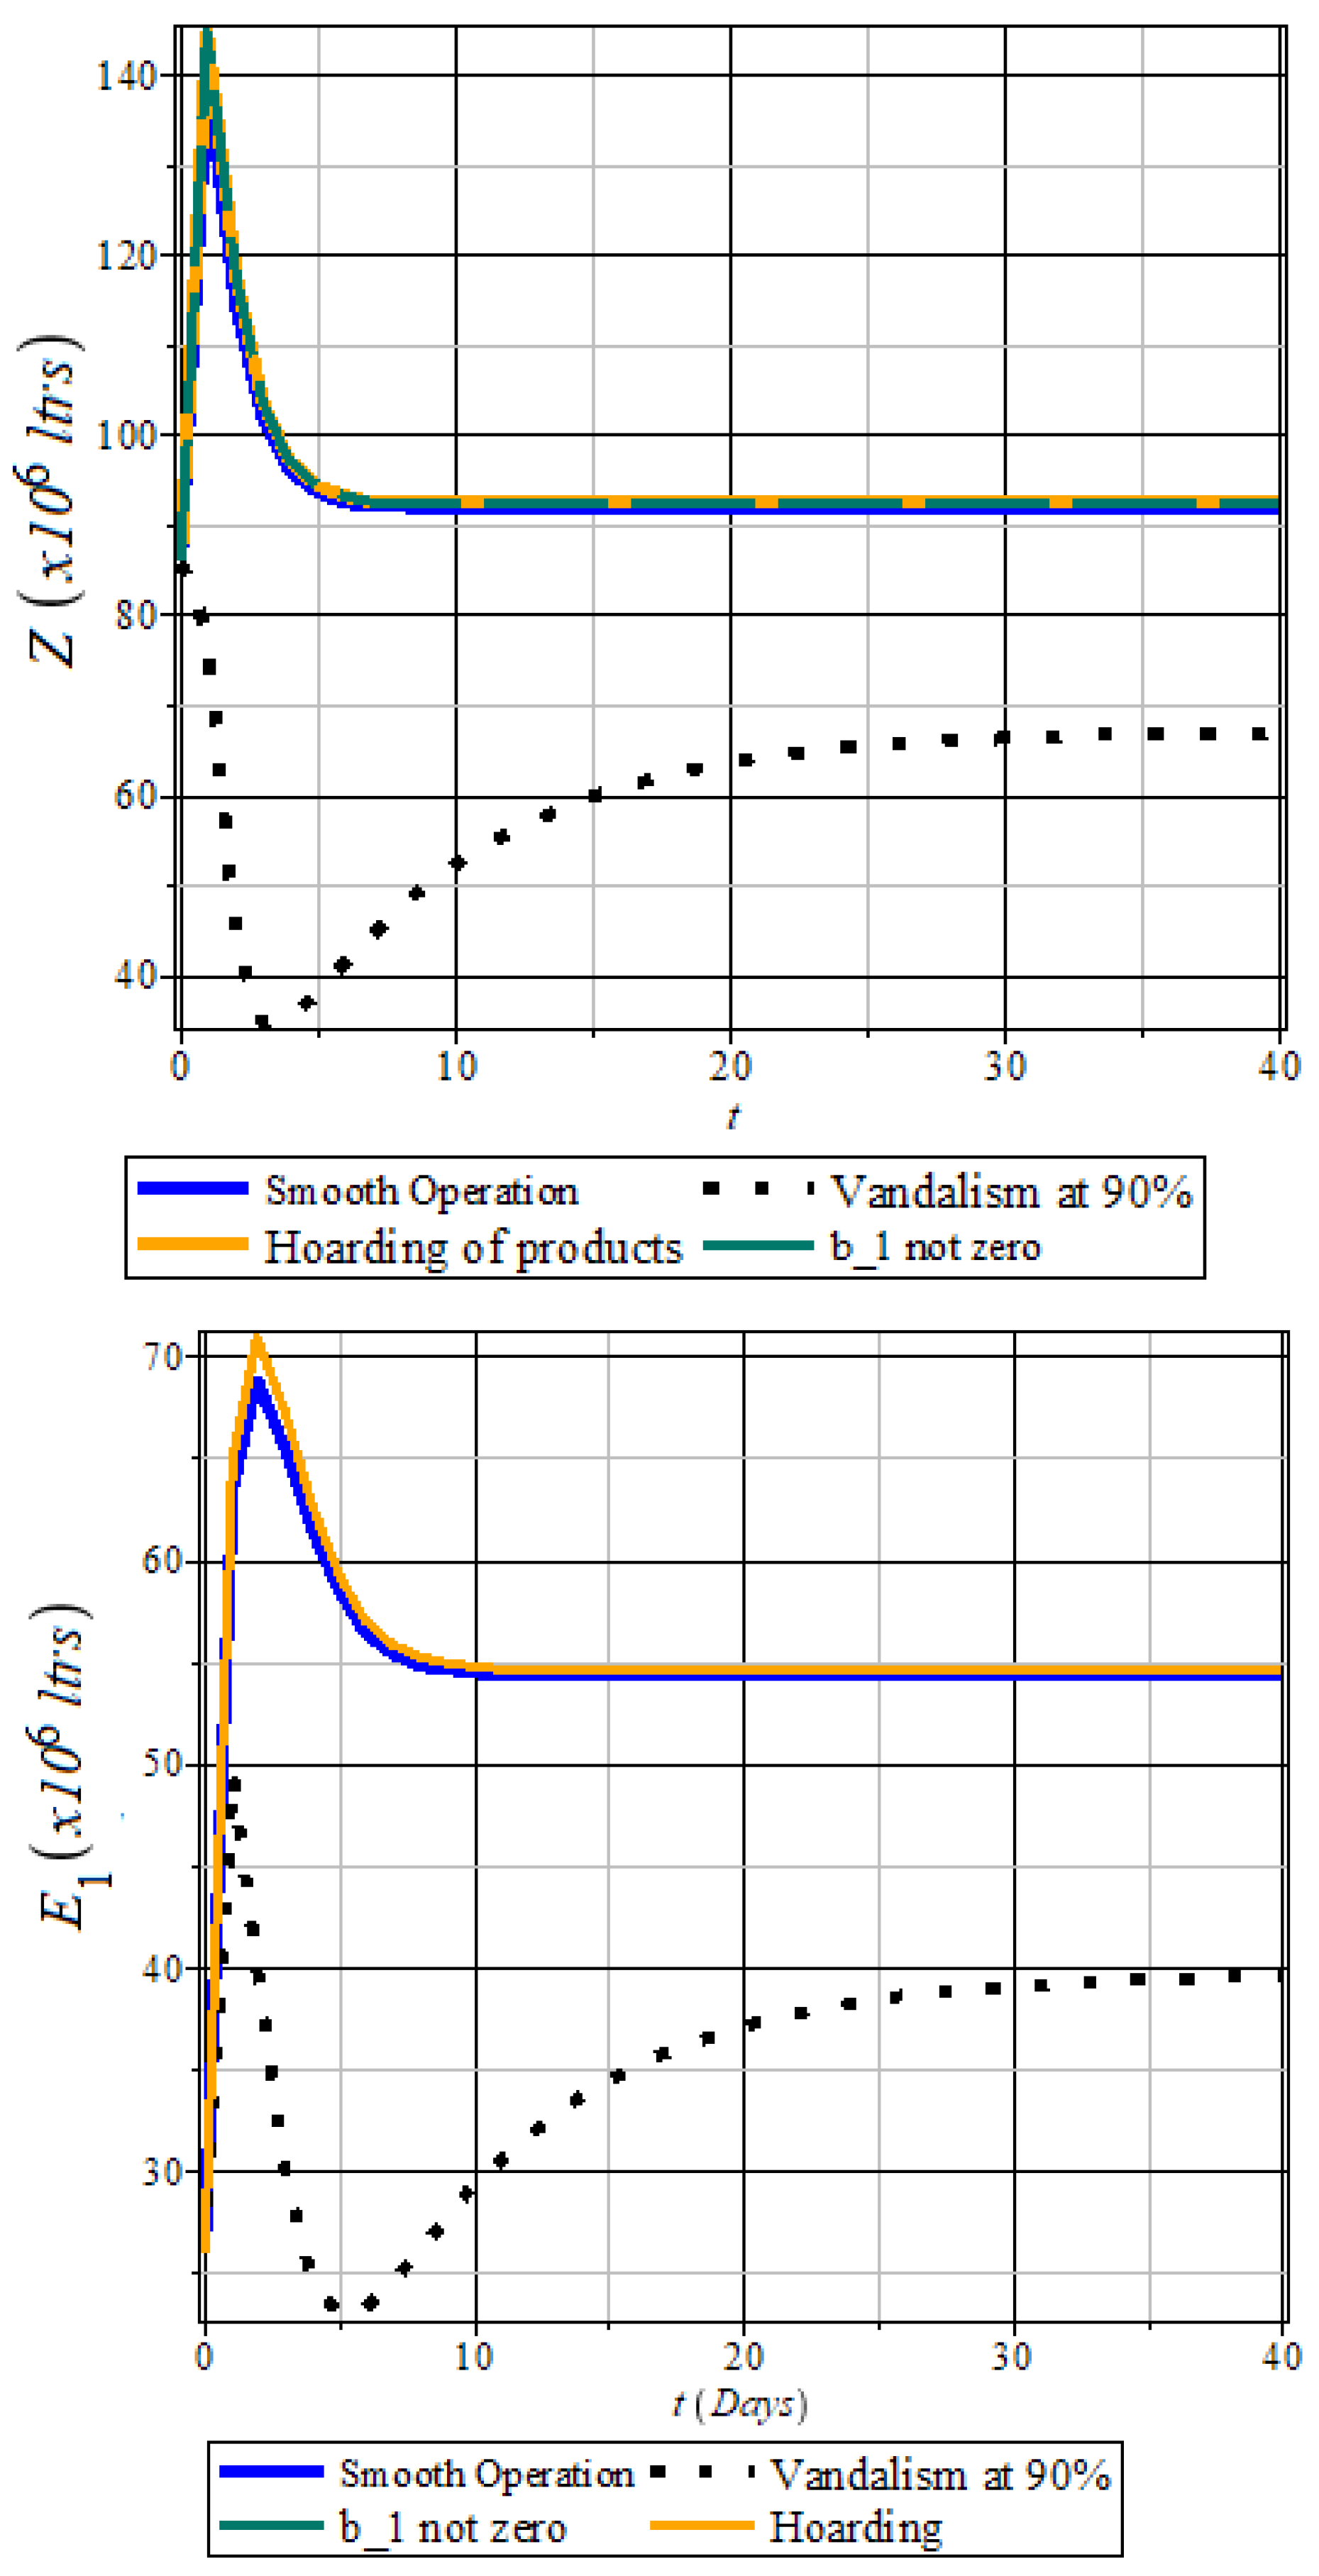
Figure 11.
Profile: Simulation of private-owned retail stations under high vandalism, hoarding, moderate functionality, and optimal operation, showing their impact on fuel availability. M Profile: Effects of hoarding, fuel diversion, and high vandalism on fuel distribution. Hoarding poses the greatest threat, intensifying fuel scarcity.
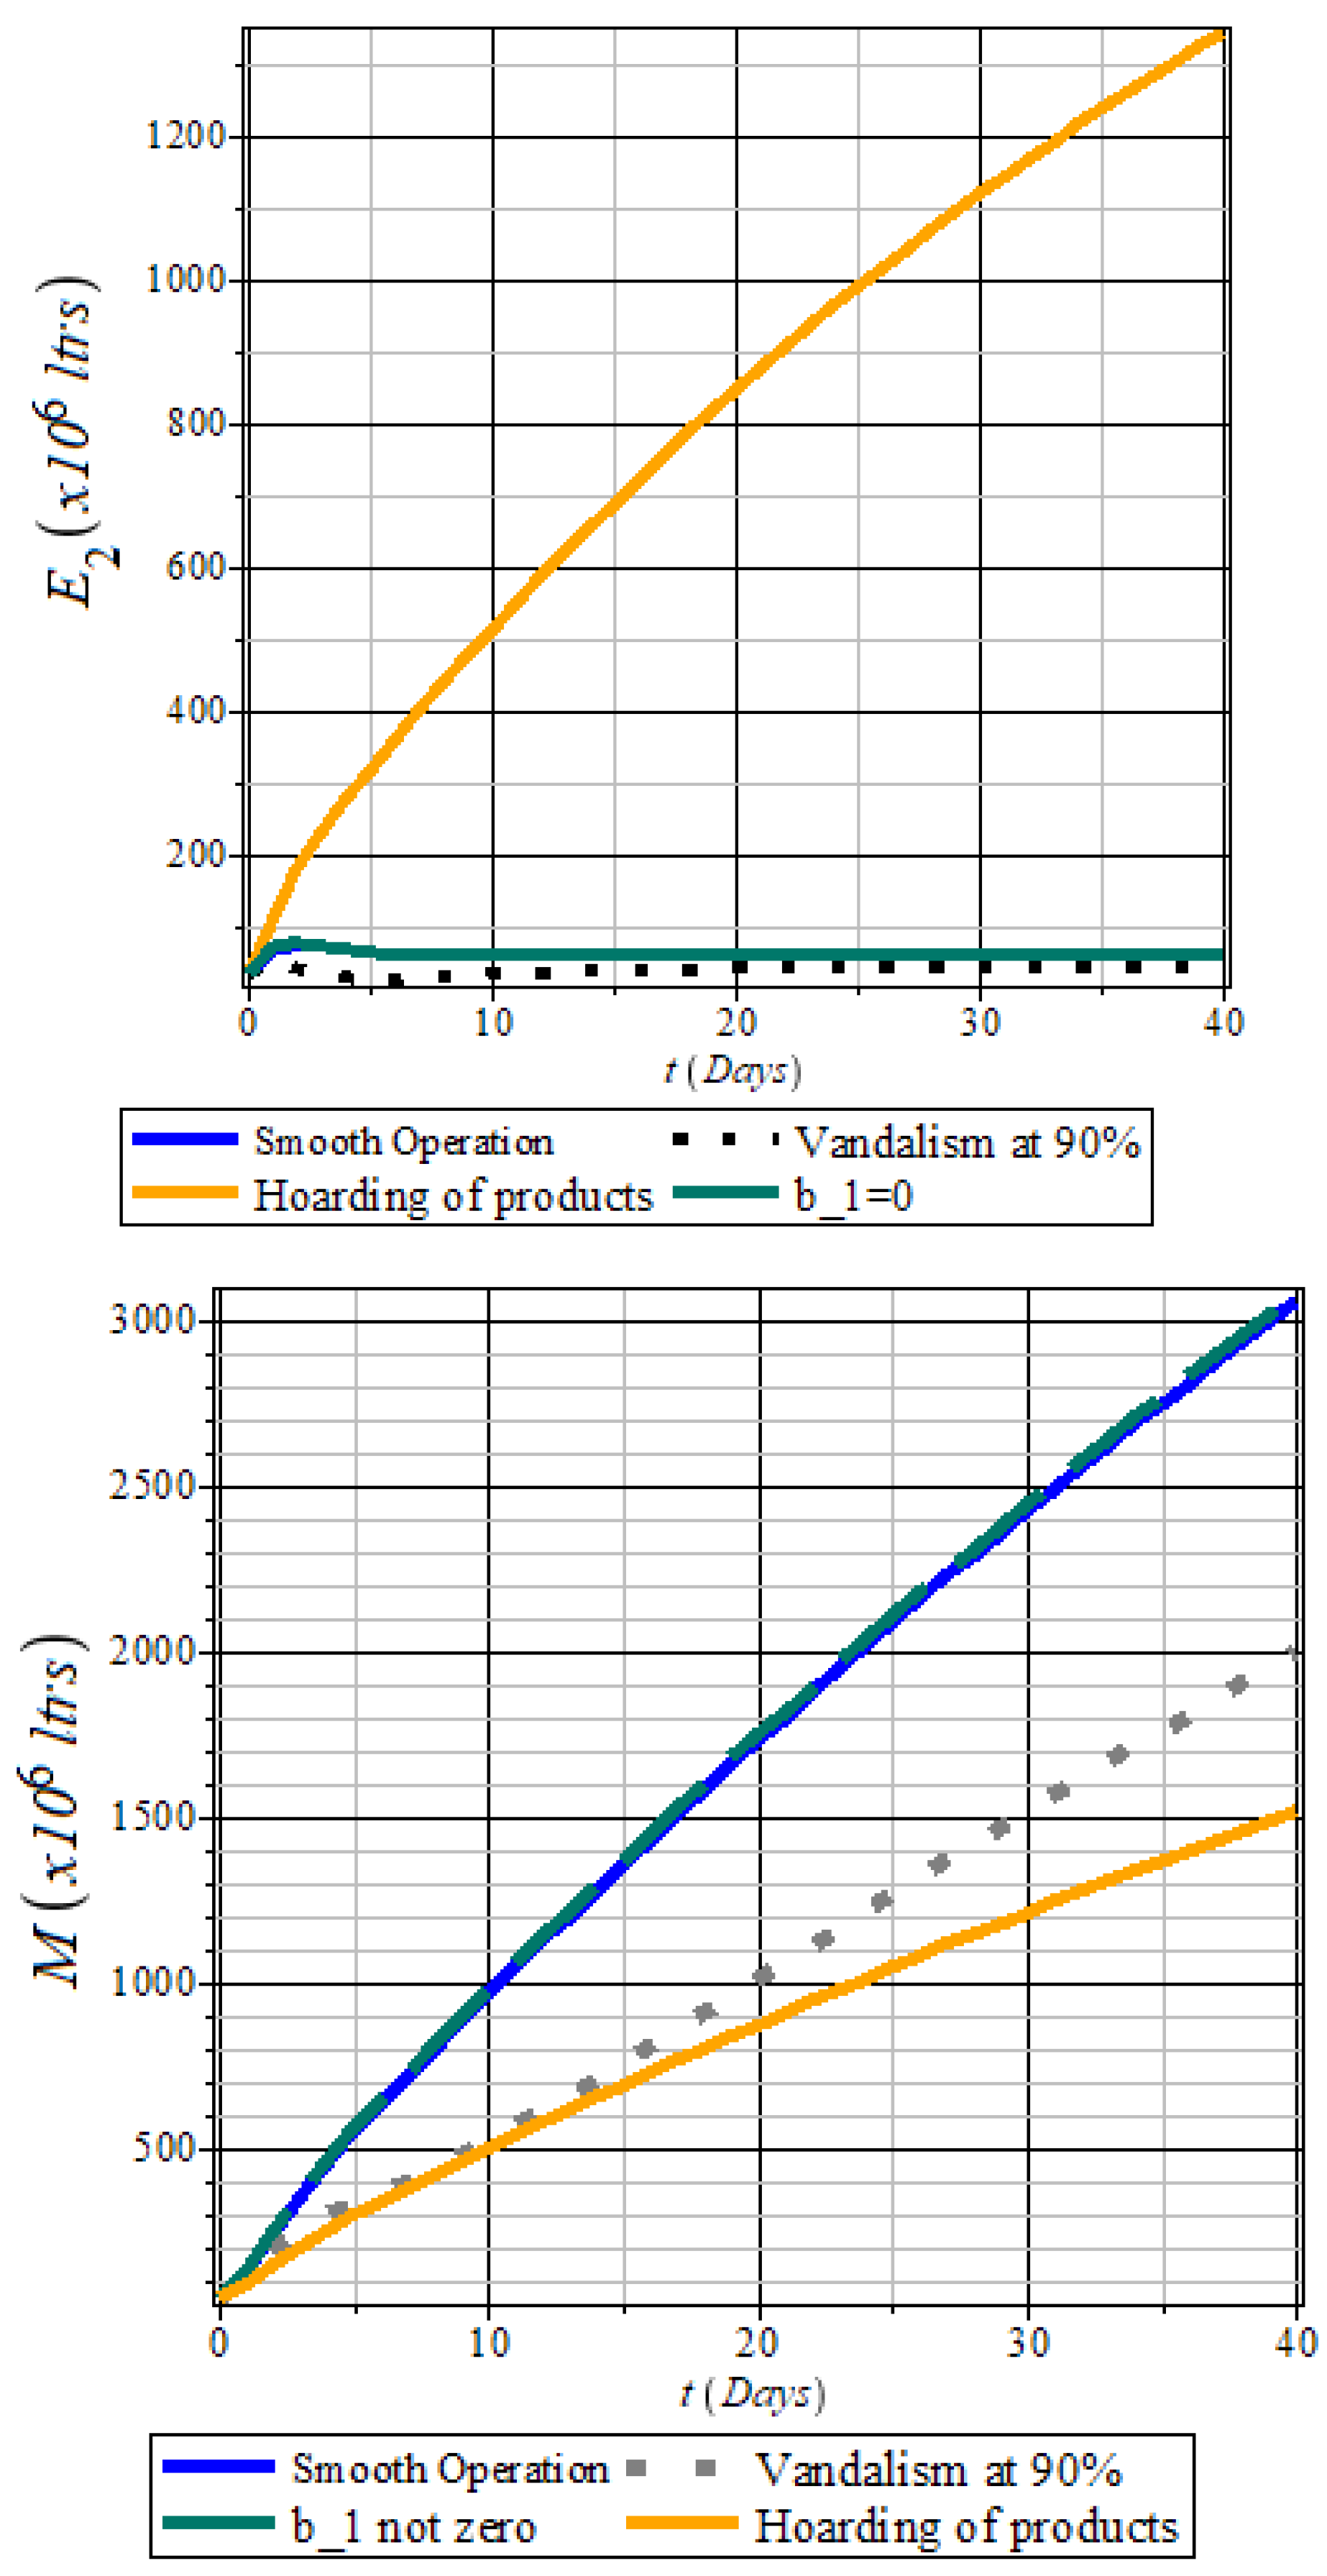
Figure 12.
Impact of Transporters (Z) and Vandalism on Retail Variables (). The red plot () with high vandalism leads to severe fuel shortages, while the blue plot shows that transporter involvement, despite high vandalism, mitigates the crisis through alternative routes.
Figure 12.
Impact of Transporters (Z) and Vandalism on Retail Variables (). The red plot () with high vandalism leads to severe fuel shortages, while the blue plot shows that transporter involvement, despite high vandalism, mitigates the crisis through alternative routes.
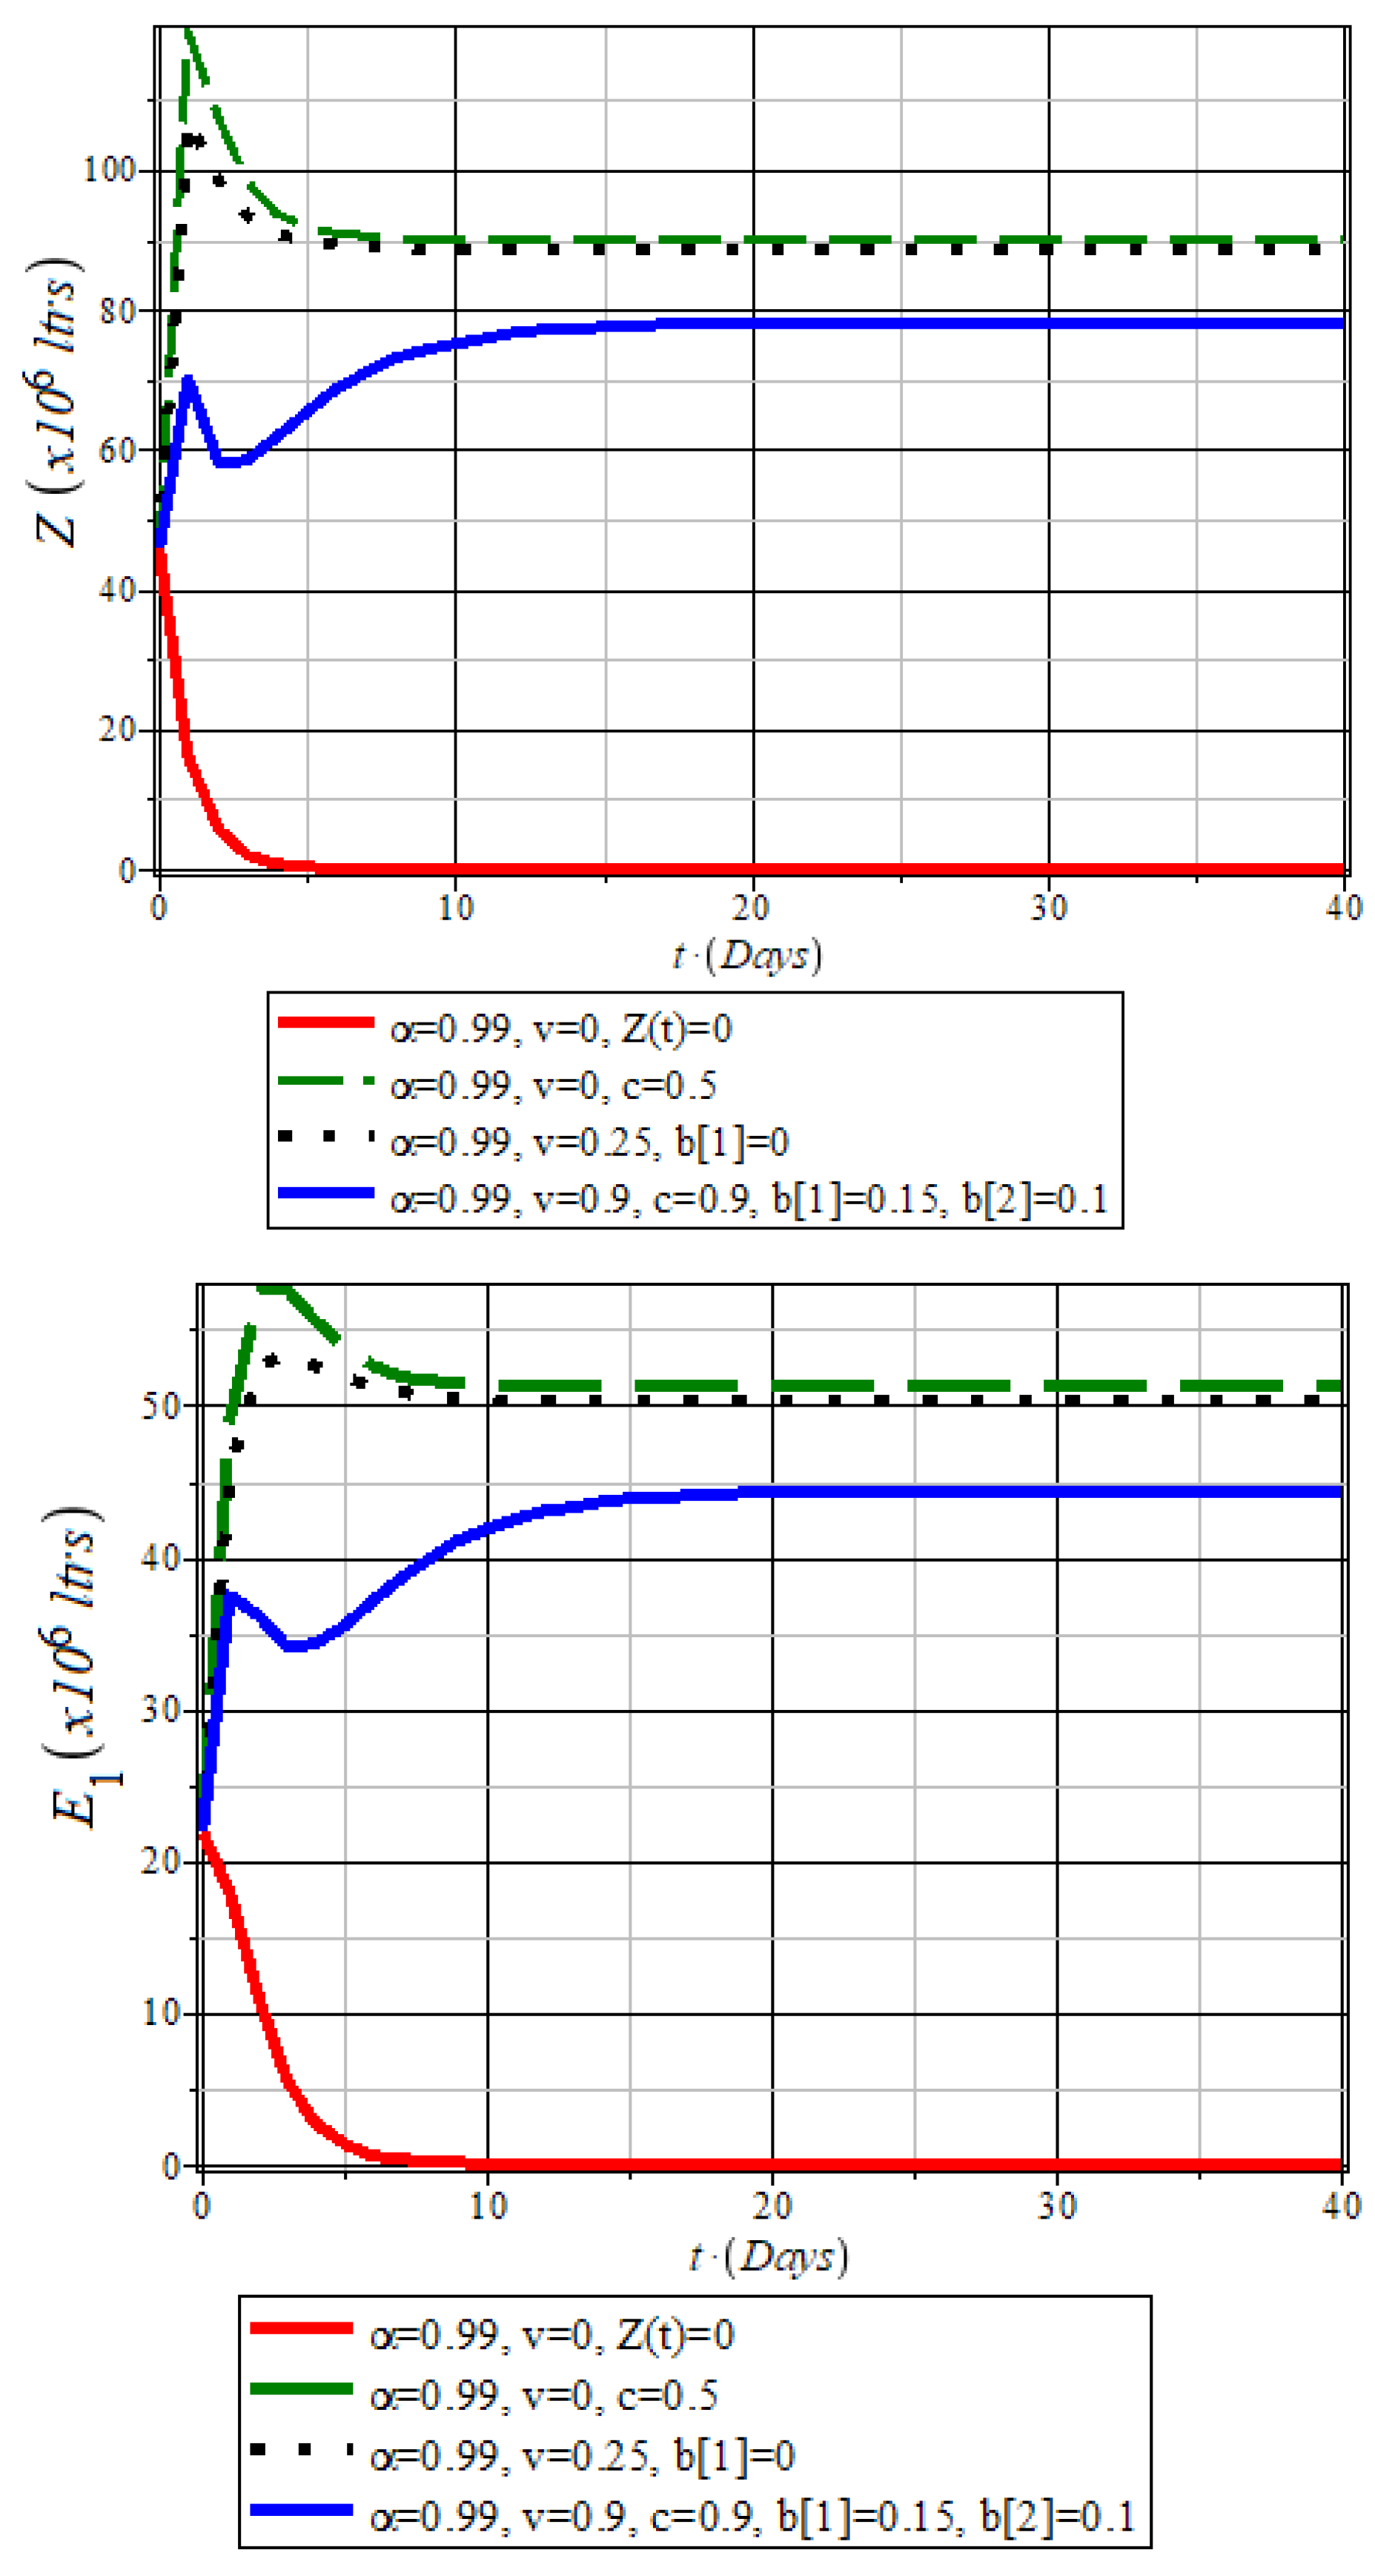
Figure 13.
Impact of Transporters () and Vandalism () on Fuel Distribution. The plots show how industrial actions reduce fuel supply to private-owned retail stations, worsening distribution challenges.
Figure 13.
Impact of Transporters () and Vandalism () on Fuel Distribution. The plots show how industrial actions reduce fuel supply to private-owned retail stations, worsening distribution challenges.
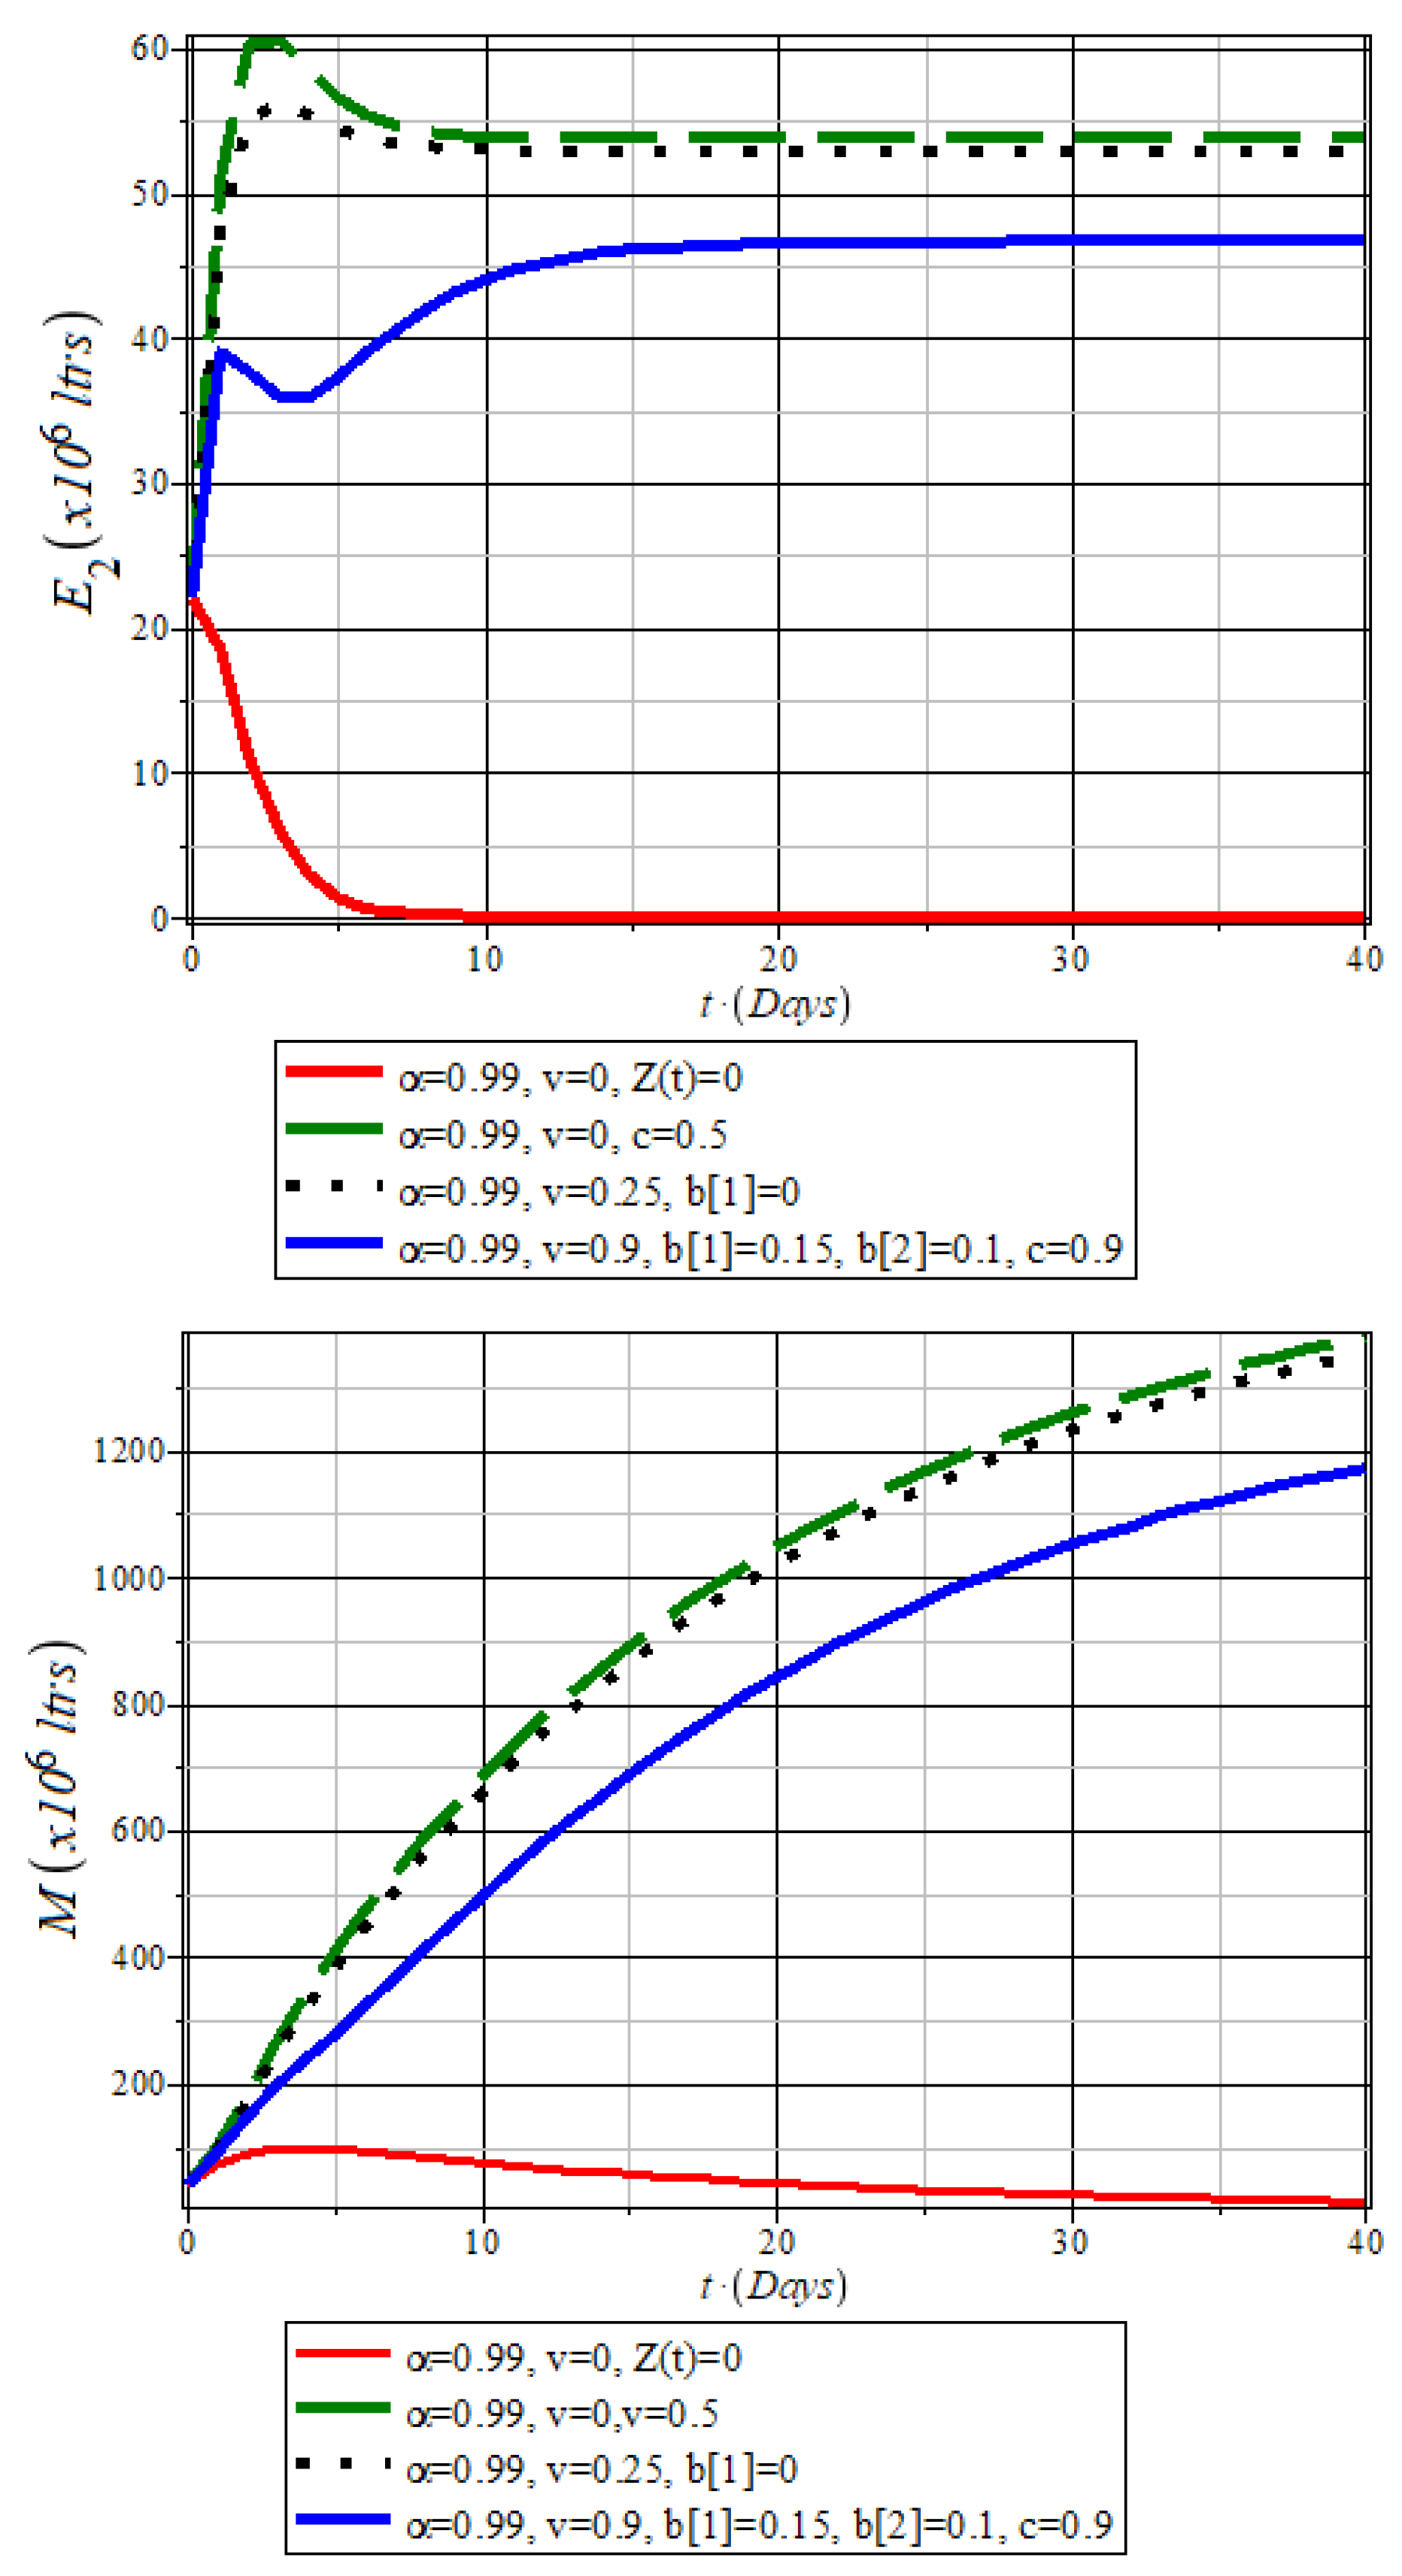
Table 1.
Glossary of Terms and Abbreviations.
| ACRONYMS | DESCRIPTION |
|---|---|
| AGO | Automotive Gas Oil |
| PMS | Premium Motor Spirit |
| DPK | Dual Purpose Kerosene |
| HHK | House Hold Kerosene |
| LPG | Liquefied Petroleum Gas |
| DPR | Department for Petroleum Resources |
| PPD | Petroleum Products Distribution |
| WRPC | Warri Refining and Petrochemical Company |
| mbbls | Million Barrels |
| PHRC | Port Harcourt Refining Company |
| FAAC | Federation Account Allocation Committee |
| PPMC | Pipelines and Products Marketing Company Limited |
| PIMS | Pipeline Information Management System |
| PPPRA | Petroleum Product Price Regulatory Agency |
| PEFMB | Petroleum Equalization Fund (Management Board) |
| NMDPRA | Nigerian Midstream and Downstream Petroleum Regulatory Authority |
| PENGASSAN | Petroleum and Natural Gas Senior Staff Association of Nigeria |
| NUPENG | Nigeria Union of Petroleum and Natural Gas Workers |
| OECD | Organization for Economic Co-operation and Development |
| MOMAN | Major Oil Marketers Association of Nigeria |
| NNPC | Nigerian National Petroleum Corporation Limited |
Table 2.
Description of Variables and Parameters.
| Parameter | Description |
| Quantity of products refined/imported for NNPC Downstream | |
| Proportion of products pumped from refineries/PPMC import storage | |
| V | Constant function & representing vandalism on the pipeline |
| Percentage of natural loss on product pumped via pipeline | |
| c | Operational efficiency of product pumped/transported from A(t) to Z(t) |
| x and y | Percentage of sharing formula for stakeholders involvement in products |
| Proportion of product siphoned by Tanker drivers during transportation | |
| and | the rate of sale of products to final consumers by retail filling stations |
| proportion of natural loss of the product at , and | |
| Q(t) | White Depot/PPMC Depot |
| A(t) | NNPC/PPMC Retail Deport |
| Z(t) | NUPENG/Transporters |
| NNPC Mega Station/Independent Marketers Filling Station | |
| Private Marketers Filling Stations | |
| M(t) | Petroleum Products Consumers |
Table 4.
Parameters and basis values for simulation.
| Par. | Short Description (Unit) | Baseline Value | Range | Source |
|---|---|---|---|---|
| Total fuel supply per day (Mltr/day) | 100 Mltr/Day | 1-100 | [40,44,60,63] | |
| Rate of pipeline supply to large storage distributors(Fraction/day) | 0.99 | [0,1] | Assumed | |
| V | Vandalism activity parameter(percentage) | 0.01 | (0,1] | Table 29.0 in [38] |
| Fuel natural loss at and (Percentage) | 0.043 | Estimated | [39,40,41,42,57,58,59,60,61,63] | |
| c | Proportion of product pumped/transported from A(t) to Z(t) (Percentage) | 0.25 | [0,1] | [39,40,41,42,57,58,59,60,61,63] |
| x, y | NNPC Retailing Plc (23.43%) + 6 major marketers 25.47%, and 3800 Independent/private marketers (51%) | 0.489, 0.510 | 0.489, 0.510 | Estimated [9] |
| Proportion of product siphon by Tanker drivers during transportation (Fraction/day) | 0.001 | 0.001 | Assumed | |
| , | the rate of sale of products to final consumers by retail filling stations(dimensionless) | 0.8, 0.8 | [0,1] | Assumed |
| proportion of natural loss of the product at , and | 0.02 | 0.02 | Assumed | |
| proportion of natural loss of the product at | 0.0095 | 0.0095 | Assumed |
NOTE: x is used to denote percentage share of involvement of NNPC Retailing and the 6 major marketers (Oando, Mobil, Total, Forte, MRS, and Conoil)in the fusil fuel distribution, and y comprises of 3800 Independent marketers. throughout the article
Disclaimer/Publisher’s Note: The statements, opinions and data contained in all publications are solely those of the individual author(s) and contributor(s) and not of MDPI and/or the editor(s). MDPI and/or the editor(s) disclaim responsibility for any injury to people or property resulting from any ideas, methods, instructions or products referred to in the content. |
© 2025 by the authors. Licensee MDPI, Basel, Switzerland. This article is an open access article distributed under the terms and conditions of the Creative Commons Attribution (CC BY) license (http://creativecommons.org/licenses/by/4.0/).
Copyright: This open access article is published under a Creative Commons CC BY 4.0 license, which permit the free download, distribution, and reuse, provided that the author and preprint are cited in any reuse.


