
Submitted:
03 June 2025
Posted:
05 June 2025
You are already at the latest version
Abstract
Hydrotreated ester and fatty acids to jet (HEFA-tJ) is presently the most developed and economically attractive pathway to produce sustainable aviation fuel (SAF). However, an ongoing systematic study of the critical variables of different pathways to SAF has revealed significantly lower GHG reduction potential for the HEFA-tJ pathway compared to competing markets using the same resources for road diesel production. Moderate yield variations between air and road pathways lead to several hundred thousand tons less GHG reduction by project, which is generally not evaluated thoroughly in standard environmental assessments. We also demonstrate that if the HEFA-tJ market has attractive features that biodiesel/renewable diesel does not have, market attractiveness is temporary and will lead to considerable viability risks as HEFA-tJ fuel market integration rises. The negative environmental impact of palm oil production, the primary resource for road production, could also be reduced if methane capture technologies were applied more widely. We emphasize the need for more transparent data and effort in this regard before envisaging rising drastically HEFA-tJ production. Overall, reducing road diesel carbon intensity appears to be less capital-intensive, risky, and several times more efficient in reducing GHG emissions.
Keywords:
sustainable aviation fuels
; technical and economic analysis
; sustainability evaluation methodology
; CORSIA
; palm oil
; biofuels
1. Introduction
The production of sustainable aviation fuels (SAF) from vegetable oil, waste cooking oil and animal fat has attracted significant interest from industrial players like Neste, Total and Shell. Hydrotreated ester and fatty acids to jet (HEFA-tJ) is currently the most developed and cost-effective conversion pathway available [1,2]. Policy is driving the incorporation of SAF to 5 or 10% in the near future [3]. This will result in the construction of many new HEFA-tJ plants, or existing plants dedicated to renewable diesel or biodiesel production (RD) could be converted to meet the required volume of SAF. In the United States (U.S.), the Department of Energy (DOE) announced the SAF Grand Challenge, targeting SAF production of at least 9 Mt/yr by 2030, requiring a 50% carbon intensity reduction from these fuels [4]. In Europe, the ReFuelEU initiative from the European Commission has adopted new legislation to force the integration of 6% SAF fuels by 2030 and 20% by 2035 [5], representing around a 2.8 Mt SAF target for 2030, and 9.2 Mt for 2035 [6]. The International Air Transport Association [7] estimates that 24 Mt of SAF could be produced worldwide by 2030.
This report provides critical data to enhance understanding of the opportunities and challenges associated with the HEFA-tJ pathway. Scaling the production of SAF fuels to meet actual demand would require several billion dollars. For instance, Neste and World Energy Paramount announced around $2B in investments to expand their HEFA-tJ production to 500–700 kt/y of SAF in Rotterdam and California [8,9]. Even when considering a more optimistic range of investment costs at $2–4k/t, required investments and timeframe are, at the least, very ambitious: around $18–36B to reach the 2030 SAF Grand Challenge Roadmap in the U.S., and similar investments in Europe to reach the 2035 ReFuelEU target [4,10]. Construction times for a new HEFA plant range from 2–5 years after budget approval [11]. Ensuring that investments and efforts are directed appropriately is of primary importance. Since most feedstocks for the HEFA-tJ process are used for road production [12], key considerations are how fuel producers, aviation companies, legislators, and customers could be impacted by the market shift from road to air fuel, and how it helps efficiently achieve GHG reduction goals. Scientific literature has merely compared road and air fuel production’s economic risks and environmental benefits. Market response to raising SAF production is rarely discussed.
In the first case, most recent SAF reviews do not discuss biodiesel or renewable diesel in much detail [1,13,14]. For instance, Wei et al. [15] only assumed other technologies (electrification) could be adopted for heavy-duty road fuels. Bardon et al. [12] briefly discuss the upcoming rivalries for the utilization of used cooking oil (UCO) by road and air fuels. Based on the International Energy Agency (IEA) evaluations and analysis from the International Council of Clean Transportation (2019), they underline that, for economic reasons, road fuel will potentially still utilize most of the UCO and other feedstocks for the BD and RD pathways by 2050, and question if some degree of priority on feedstock should be given to aviation. Ng et al. [16] briefly discuss the same competition between road and air fuels, and suggest that SAF production should avoid utilizing feedstock used by road markets. How market fluctuations and legislation uncertainties affect SAF plant viability has not been discussed yet, but it is a well-known issue for ethanol, BD, and RD, leading to dozens of plants turning idle, reducing production, or closing during unfavourable economic periods [17].
For GHG reduction potential comparison between HEFA-tJ, BD, and RD, only the National Renewable Energy Laboratory State of Industry (NREL SOI) has made some comparisons to our knowledge [11]. As sustainable road fuel carbon intensity (CI) has been evaluated for a long time by various institutions, HEFA-tJ evaluations are compared with BD and RD in Section 8.1, showcasing undiscussed variations between carbon intensity estimation related to yield variations, feedstock transport hypothesis and GHG reduction potential. In this perspective, the Carbon Offsetting and Reduction Scheme for International Aviation (CORSIA), the official International Civil Aviation Organization (ICAO) framework to evaluate the CI of aviation fuels, employs a jet selectivity ratio of 25 wt% over other products [18], while the NREL SOI and other references discussed in Section 2 use a selectivity of over 45 wt% [19,20]. The smaller selectivity to SAF in the CORSIA framework minimizes yield variations between HEFA-tJ and RD, but is not representative of most discussions on HEFA-tJ involving the supply of large quantities of SAF rapidly.
For demand response to higher market penetration of SAF, Bardon et al. [21] reviewed 67 SAF decarbonization scenarios and emphasized that only six considered how higher SAF prices would affect demand and passenger reaction. As the perspective of these studies is identifying net zero pathways, lower demand associated with a higher price is often considered desirable. Only Gössling et al. [22,23] evaluated that these higher costs compared to the fossil alternatives could strongly refrain airline companies from adopting decarbonization measures. They also underlined that the aviation profit margins between 1978 and 2022 have been $88B, including 18 years with a deficit margin, while an investment of $500–2000B is an estimated requirement to reach net zero by 2050 [24]. They thus argue that net zero ambition for aviation is highly challenging and that limitation measures, such as CO2 taxes, carbon budget, and alternative fuel obligations, are mandatory for efficient aviation decarbonization.
From an economic and rapid deployment perspective, HEFA-tJ seems to be the safest and most logical pathway to decarbonize aviation. However, when we consider broader factors such as competing markets for resources, resource availability, investment efficiency towards GHG emissions reduction and potential future technological optimizations for competitive SAF production costs, the HEFA-tJ pathway reveals potential adverse environmental impacts and economic risks that must be carefully evaluated. A global view of the technical, logistical, and operational issues, as well as economic challenges, market competition, and sustainability indicators, is essential to facilitate informed decisions from investors, industrialists, and researchers.
2. Methodology
To reduce sustainable project failure risks and raise their GHG reduction efficiency, we are conducting systematic studies on various biomass conversion projects based on critical variables that can influence their viability and environmental impact. These include, but are not limited to, the project size, cost, resource availability, logistics, yield, carbon intensity, selectivity, maturity, and impact on the electric grid. Our methodology distinguishes itself from other technology reviews, like the State of Technologies from the Bioenergy Technology Office [25], by considering more variables and applying them specifically for SAF production. Production size, effect on the electrical grid, market entry challenges, optimization potential, speed of implementation, and operational risks are examples of variables that are often not discussed in a concerted way. Open literature resources were used to discuss each criterion. By doing this, some knowledge gaps can be identified, and company/institution claims can be challenged more easily. Our approach is inspired by a sustainable project analysis framework published by the consulting group Deloitte [26], but more in-depth technical, economic, and environmental analyses are applied.
Gathering and synthesizing with clarity the most relevant data from multiple fields, such as life cycle analysis, technical-economic analysis, and recent technological advances, is of the utmost importance for decision-makers. We thus present ten key facts for understanding these HEFA-tJ issues in a synthetic way. Essential references for each fact, and mathematical models describing relevant perspectives, are presented when needed. Technical and detailed descriptions of operational units are only provided when necessary to understand a critical issue.
3. Results
3.1. The HEFA-tJ Fuel Market Is Attractive Despite Prohibitive Production Costs
SAF production costs are at least two or three times higher than conventional jet fuels [5,27]. Production costs are, however, not the only variable influencing market attractivity. Market penetration and utilization rates have a profound impact on both road and air fuels. In this perspective, SAF production is attractive as the current market penetration is very low compared to BD and RD, at an estimated 0.5% or around 0.5–1 Mt/y. The aviation industry being international, book and claims systems allow the division of the SAF over-costs between multiple flights, reducing the impact of SAF adoption on customers’ costs at the onset of market integration.
To illustrate the impact of market integration rates on customers’ costs, a simplified model was developed (Figure 1). Customers’ fuel costs are estimated based on different fuel market integration rates and cost premiums (based on IEA data [28]). The cost premium is the difference in cost compared to standard jet fuels (Equation 1). Equation 2, where P is the SAF over-costs (%) and I is the SAF integration rate (%), serves as a model for the customer’s cost.
Figure 1 schematically illustrates variations of premium values for different fuels and their integration in different regions (Europe, U.S., and Canada) according to Equation 2. This is necessarily a simplification, as actual sustainable fuel costs of emerging and mature pathways are challenging to obtain and compare due to low commercialization for emerging pathways, subsidies, and tax exemptions received in mature pathways. Figure 1 illustrates how higher integration rates of sustainable fuels generate an increasing impact on fuel prices and risks. Below 2–3% integration, premium variations from 100–400% impact less than 12% of the fuel price. Reaching such integration, however, represents substantial world SAF production at around 10 Mt/y and the attractive perspective of many new plants for technology suppliers.
Conversely, the current integration of BD/RD at around 8% in Europe is much more sensible to premium variations. Customers’ costs vary from 2–14% even if the premium range is narrower (at 25–175%) than SAF’s premium (100–400%) in the model. The market will also become more challenging if higher BD/RD integration rates are warranted. Reducing the SAF premium from 300 to 100% with technology development at 5–10% integration, which represents an impressive optimization, still leads to higher customer costs than 400–500% premium at 1% integration. Market risks are low when adoption begins. Consumers pay only premiums for a negligible fraction of their supplies. Consequently, SAF is advantageous compared to road fuels in regions where BD and RD integration rates are high. In North America, however, BD/RD road fuel usage is concentrated in a few states, such as California, Texas, Illinois, and Minnesota. Most states have less than 1–3% market integration for BD/RD [29] and could integrate more sustainable road fuels without significantly impacting customers’ costs.
From a broader perspective related to BD/RD road alternatives, it is worth noting that long-range electric and hydrogen heavy-duty vehicles are also strongly affected by market integration rates, but often in a reverse fashion. Mauler et al. [30] evaluated the premium of these solutions at around 50–75% for long-distance trips (750 km) and several technical-economic analyses estimate similar or more competitive costs according to technology advancement [31,32,33,34]. The levelized total usage cost premium for electric and fuel-cell hydrogen heavy-duty vehicles is thus expected to be lower than SAF. Market penetration rates, however, have drastic implications related to those sectors. For instance, the Argonne Laboratory developed several technical-economic models of hydrogen and electric refuelling stations, illustrating that the fleet size had a profound effect on customers’ costs [35]. For example, steam methane reforming hydrogen delivery costs at low deployment volumes are expected to reach $11–28/kg and the cost for delivery stations is $6–8/kg. At high volume rates, these costs are expected to be significantly lower, at less than $5/kg and $2/kg, respectively [36,37]. These high volumes imply around 50 to 100 heavy-duty vehicles for each station a day and, in the case of liquefied hydrogen delivery, production of around 27 tonnes daily for 10 to 30 stations [38].
Compared to the aviation sector, risks and market barriers are thus different. If both require high capital investments from stakeholders, overruns and risks can be absorbed by aviation customers without significant impact at low integration rates. Inversely, low utilization rates necessarily lead to drastic premiums in the hydrogen market for heavy-duty transport, considering levelized cost parity with diesel vehicles is estimated to be $5-6/kg for hydrogen delivered to vehicles [39,40]. In this case, to reduce the number of stakeholders involved—and the associated risks that some may abandon or reduce their commitment to a move to hydrogen vehicles—fast integration rates by companies are likely favourable to reach considerable fleet volumes quickly and reduce the impact on customers’ prices.
Electric heavy-duty vehicles for long transport deliveries may face less drastic premiums at low integration rates but are expected to be deployed progressively, starting with regions with lower electricity prices and high fleet volumes [39]. Market penetration of BD and RD is still low in many world regions. Shifting feedstock usage for these productions to SAF should be based on economic and environmental reasons, as hydrogen and electrification face considerable market barriers. In some net zero scenarios [41], this prevents them from competing with the road biofuel market share before 2035–2040, but less optimistic scenarios involve no competition before 2050 [12,41].
3.2. HEFA-Road Has Higher Yield and Selectivity than HEFA-tJ
The HEFA refinery pathway can be configured to predominantly generate renewable diesel or jet fuels, which strongly affects the overall yield and the types of products generated. Yields have significant economic and environmental impacts on a process, as they occur in the denominator of all calculations. They allow us to estimate and discuss literature values on resource costs, their impact on production costs, and literature environmental assessments of the pathway. Table 1 presents selectivity data from various literature sources and related yield estimates for the HEFA-tJ and RD pathways. As production costs represent the sum of operational costs divided by the production, it helps understand why the HEFA-road pathway leads to at least 30% lower production costs than the HEFA-tJ pathway in the Zeck et al. technical-economic analyses (TEA) study, for instance [20]. The latter needs a hydrocracker that generates higher rates of naphtha and refinery gas [42]. Consequently, higher-value production (jet and diesel) reaches much higher selectivity in the HEFA-road pathways, at 81 vs. 73 wt% in the Pearlson et al. [19] study and 78 vs. 53 wt% in the Zech et al. study [20].
One important aspect is the fate of naphtha and refinery gas and whether they should be considered when estimating yields. Refinery gas composition is difficult to predict and may be rich in CO2 and CO [43]. We expect it to be more likely used internally for heating, reducing the yield and offsetting CO2 emissions. This usage was, for example, described by Shell in a conference on HEFA-tJ production [44]. Naphtha is also likely to be used for chemicals and converted to olefines with a steam cracker. Neste’s naphtha is envisaged to be used for chemical production by Mitsui and SK Geo Centric [45,46,47]. It was also announced for the TotalEnergies HEFA-tJ plant in Grandpuits [48] and UOP Ecofining® technology is sold by specifying its naphtha production is a key feedstock for bioplastic production [49]. In our assessment, naphtha conversion to plastics is expected to lead to a 30% yield loss, but literature data indicates around up to a 38% loss [50]. To achieve high SAF selectivity, extraction of the jet fraction by distillation may also result in a diesel fraction that is too heavy for the diesel market but suitable for marine fuels [11]. However, market incentives differ for marine fuels and may not be well defined. As incentives are mandatory for SAF production profitability, this generates sales revenue uncertainties.
The official carbon intensity evaluation for SAF, the CORSIA framework, does not consider these additional losses and uses a scenario similar to the RD pathway described above [18]. No explanation is given for this choice and we deduced their jet selectivity at 25 % from the value they used to estimate indirect land use change, as it is not stipulated otherwise. Propane separation from refinery gas, and valorization of refinery gas, is also potentially done by Neste in their Rotterdam plant, which limits refinery gas yield losses [51,52]. The National Renewable Energy Laboratory’s TEA on HEFA-tJ uses naphtha as a fuel additive [42]. These cases lead to values similar to those in Table 1 for ‘yield without conversion losses’. However, as can be observed in the ‘yield with naphtha conversion losses and inner usage of refinery gas’, there are significant 7 and 11% yield differences between HEFA-tJ and RD when considering these losses. The environmental impact of these yield differences is discussed in detail in section 8. Economically, naphtha yield losses do not impact naphtha’s market price. Still, renewable naphtha complexifies selling, and uncertainty exists on whether market demand is as attractive as jet and road fuels. The market value of fossil naphtha is usually considered lower [20,42]. Selling refinery gas and bio-propane also necessitates additional operational units and logistics.
It must thus be noted that the global market is currently more attractive for HEFA-tJ production than RD, as the integration rate of SAF is much lower than road fuels (Figure 1). An additional factor is the environmentally sustainable image of the airlines utilizing it. However, we expect this attractiveness over the BD/RD pathway will likely fade with higher SAF integration rates, as the price difference is an important market disadvantage for HEFA-tJ compared to RD.
3.3. Resource Costs for HEFA-tJ Are Much Higher than Conventional Jet and Diesel Fuel Costs, Implying Low Production Cost Reduction Potential
Watson et al. [1] published a review of various TEA studies and estimated that the HEFA-tJ premium reaches 120%. However, it is important to note that, as the HEFA pathway is relatively mature, the current premium market prices for HEFA-tJ for different resources are available and reached 220% (three times that of conventional fuel cost) in January 2024 [53]. Higher premiums were also considered elsewhere [5,27].
Market prices do not always represent production costs, as suppliers may sell for short periods at a loss. Resource costs are the most significant contributor to the HEFA-tJ fuel costs [11]. To achieve fast estimations of the HEFA pathways’ competitiveness for air and road fuels compared to standard fuels, historical prices for primary resources and standard fuels from various sources (USDA, EIA, IndexMundi) [54,55] were thus compared, considering RD, SAF yields, and energy density. The study period is from 2017 to 2024. The model is inspired by Don Hofstrand’s model for biodiesel production cost estimation [56]. A generic cost of $150/t was added to the primary resource cost for electricity, other chemicals, and hydrogen production. SAF yields were estimated at 79% (optimistic value, Table 1) with an energy density (low heating value) of 40.5 MJ/kg [57]. RD yields were estimated at 85% with an energy density of 43 MJ/kg [58]. Figure 2 illustrates diesel and jet fuel prices (EIA, 2024) compared to estimated resource costs for soybean RD and SAF (other resources not shown for clarity). As different product distribution and selling prices are expected, Figure 2 should not be used as a reference for actual product cost. It illustrates, however, that the resource costs, without considering the process cost, are more expensive than jet or diesel fuels.
Compared to RD production, the lower prices of conventional jet fuels to diesel also significantly drive the SAF premium to values higher than 100%, while RD is, on average, below 100% (Figure 3). Yellow grease and palm oil even periodically decrease to reach competitive prices for RD (without considering capital expenses).
Because primary resources have a critical impact on production costs, the potential of reducing costs of the HEFA-tJ pathways is low and relies primarily on economies of scale [42]. In that perspective, while many TEA studies often imply plants with 250–500 kt of resource supplies [20,42], announced and actual projects are much bigger and usually involve more than 900 kt of resources.
For instance, Neste announced a $1.91B expansion of its Rotterdam plant in order to produce 700 kt/y of HEFA-tJ. Shell’s SAF plant in Rotterdam was expected to produce 800 kt/y of fuels (the project is now on pause). World Energy Paramount, in California, is expected to raise its production sevenfold, up to approximately 1.1 Mt/y. One of the smallest HEFA-tJ plants (Grandpuits), announced by TotalEnergy, is still at around 500 kt of resources (estimated from the 285 kt/y of SAF announced). The first plants will likely mobilize more sustainable resources with the lowest cost. Higher costs for resources are thus expected in the future—and indeed have already been observed—making HEFA-tJ less amenable to production cost reduction [11].
3.4. Used Cooking Oil (UCO) and Animal Fats (Tallow) Are the Only Resources with a Significant Commercial Deployment that Can Lead to More than 65% Reduction in Carbon Intensity Compared to Conventional Fuel
The main reason for producing SAF is to reduce aviation GHG emissions. Fuel norms are based on carbon intensity (CI), which measures the GHG CO2-equivalent emissions for a defined quantity of energy. The International Civil Aviation Organization (ICAO) set the conventional jet fuel CI at 89 g/MJ [59]. This value is further used to evaluate carbon intensity reduction.
To evaluate the CI of different SAF pathways, the standard methodology, still in development, is called the Carbon Offsetting and Reduction Scheme for International Aviation (CORSIA) and was agreed in 2018 by the 192 members of ICAO. Two working groups have developed life cycle assessment (LCA) for the CORSIA: the “Core LCA group” and the “iLUC group” [59,60]. The Core LCA group concentrates on the different SAF processes and uses data from the databases of E3db and the GREET® models. Issues associated with indirect land use change (iLUC) are studied separately using the GTAP-BIO and the GLOBIOM models [59]. Land use change (LUC) is the estimated environmental effects of replacing agrifood production with energy application and the consequent cropland expansion (iLUC).
Table 2 illustrates the CORSIA evaluation for different SAF fuels, including core and iLUC values. Only four resources reach more than 65% CI reduction for HEFA-tJ (or 31.2 g/MJ). UCO (22.5 g/MJ) and tallow (13.9 g/MJ) are the only resources currently reaching significant commercialization (see Section 5).
3.4.1. iLUC Heated Debates
iLUC evaluations have been heavily criticized, and many issues have been acknowledged by iLUC’s methodology developers (see Taheripour et al. [61]). iLUC evaluation requires complex datasets and several assumptions to estimate the economic projection of land use changes. Additional hypotheses on land use emission factors must be further used to convert land use changes to GHG emissions. The various assumptions and modelling approaches generate variable iLUC estimations. For instance, the GREET iLUC estimation for U.S. corn ethanol was historically below 9.5 g/MJ, while the CORSIA value is at 24.5 g/MJ [18,62]. For soybean HEFA, CORSIA iLUC values are also estimated at 24.5 g/MJ, while the GREET value is 9.7 g/MJ [11]. Such wide variations could result in the specific feedstock pathway not being eligible for subsidies such as the Grand Challenge Roadmap requiring a 50% CI reduction. This is the case for U.S. soya and canola oils. As a result, countries and industries with a strong economic interest in biofuels have judged the validity of iLUC methodologies severely [63,64,65]. A recent IEA Bioenergy webinar also involved many speakers criticizing its value [66], while the NREL State of Industries on HEFA did not consider them, judging them too complex [11].
From a green financing perspective, however, methodology uncertainties and complexities are invalid arguments for neglecting a phenomenon or selecting the most optimistic values describing it. The investments involved, the high premium, and the uncertainty on the environmental benefits of some SAF pathways lead to tangible financial risks and potentially inefficient public investment. For instance, Indonesia’s palm oil production for biofuel increased by 4.3 Mt between 2018 and 2022, while European fuel legislation started banning palm oil importation progressively, reducing its consumption for biofuels in Europe by 0.5 Mt in that period [67,68]. The additional palm oil production (approximately 4.9 Mt) consequently had to be sold on the Indonesian domestic market, potentially at a much lower economic value than on the European market. This example illustrates that constructing multi-million-dollar plants before clarifying sustainability issues can lead to significant economic problems.
In that perspective, it is also worth noting that lower GREET values for iLUC might increase towards the CORSIA value soon, as a recent study on land emission uncertainty factors by the System Assessment Center (related to the GREET model) involved iLUC values between 13 and 24.9 g/MJ for corn ethanol-to-jet [61]. These uncertainties led the authors to claim that new critical studies were required to assess the validity of the different models, and to validate emission factors, using advanced satellite and remote sensing, for example. Without those, “public policy may have unintended consequences of supporting fuel options that may have high-iLUC GHG emissions”.
3.4.2. Market Share Importance in Carbon Intensity Evaluation
One under-discussed critical factor in understanding carbon intensity evaluation is the related process market and resource shares. This factor is particularly relevant for the HEFA-tJ/BD/RD pathways, as many primary resources are usually used simultaneously in a plant, and the ratio of the different resources involved significantly affects a plant’s carbon intensity. In 2021, the National Biodiesel Board (NBB) surveyed 60% of the U.S. BD plants (27 plants) and 5 RD plants [69]. It was revealed that 13 BD plants used only vegetable oil, while the others used a mixture of vegetable oil, tallow, and yellow grease, amongst other resources. Less data on resource usage distribution was discussed for RD to maintain company confidentiality. Nevertheless, Gerveni et al. [70] published estimations of resource usage for BD and RD according to USDA values between 2011 and 2023 (Figure 4 relates to resource shares in 2023). From these values and the carbon intensity associated with different resources (Table 2), the average carbon intensity of allocating the current feed to a BD/RD process plant to SAF production can be estimated.
Converting a BD plant to SAF compared to an RD plant is not straightforward, but it is discussed here as the NREL State of Industries for HEFA claimed 57% of renewable diesel was produced from soybean oil [11]. However, according to the data presented in Figure 4, this value belongs to biodiesel production. It is, thus, not representative of RD and illustrates the dire need for adequate resource share evaluation when estimating process carbon intensity. Soybean oil represents a much smaller share of RD production at 26%. Considering a higher ratio of soybean and canola oil means that significant additional and expensive efforts are necessary to lower the CI by, for example, reducing hydrogen production emissions (around 11 g/MJ) to achieve at least 50% carbon intensity reduction.
Thus, the U.S. BD and RD resource share carbon intensity were estimated according to CORSIA standard values if used for SAF (core + iLUC). The carbon intensity of other resources (in grey) is disregarded, as their nature is unknown. With mitigated emission reduction potential, soybean oil and canola oil are in red, and high GHG reduction potential resources are in green. An average carbon intensity of 54.3 g/MJ for the biodiesel resource shares was calculated for potential SAF production. This represents a 39% reduction in carbon intensity, which is insufficient to reach 50% GHG reduction.
Using RD resource shares, an average carbon intensity of 39.3 g/MJ was estimated. This represents a 56% reduction in carbon intensity. Compared to BD plants, RD plants are more amenable to transition to SAF plants. According to the SAF Grand Challenge’s carbon reduction goals and today’s standards (CORSIA), an RD plant using the average resource share in the U.S. would thus be adequate for SAF production. Greening hydrogen production can reduce the carbon intensity further. It is, however, not mandatory at present for that average plant. Inversely, a plant using 57% soybean oil would not be adequate for SAF production (BD case example). The latter could incorporate more sustainable resources, or delay until better scientific consensus on iLUC leads to lower iLUC estimation—which may not occur.
3.5. UCO and Tallow World Availability Cannot Cover Actual HEFA Road Usage
UCO and tallow are among the lowest carbon-intensive resources. They represent 20% of the resources used for RD and BD production (10.4 Mt), and their usage has risen by 48% since 2018 [67,68] (Figure 5). As their availability is estimated at 40 Mt [71,72], around 25% is thus potentially already in use. Meanwhile, it is not apparent from available data whether these resources include RD utilization (the assumption has been made that it does). However, the availability of these resources is hardly enough for road fuels that use 52 Mt of oil equivalent. Expanding their usage for future SAF fuel production is, therefore, seen by the industry as one of the most challenging issues [11]. As described in section 2, it must also be noted that yield losses in the HEFA-tJ pathway compared to the RD pathway can lead to 8–13% of these low carbon intensive resources being potentially wasted in further conversion steps.
3.6. Other Resources Used in Commercial Deployments for the HEFA Pathway Have Mitigated Environmental Impacts
Figure 5 and Table 2 provide key data to understand the potential environmental impact of expanding SAF production from the HEFA-tJ pathway. First, rapeseed and soybean oils, representing 46% of the oil used for BD and RD productions (Figure 5), allow a 14–28% reduction in carbon intensity if used for SAF according to CORSIA evaluation (Table 2).
Second, palm oil, the most used resource at 36%, has a variable carbon intensity depending on whether the methane generated by the palm mill oil effluent treatment (POME) is captured (14% carbon intensity reduction) or simply released into the atmosphere (11% more emissions than standard jet fuel) (Table 2). However, there is a lack of transparent and credible data demonstrating how many palm oil plants capture methane. The actual number of plants adopting such technologies, at 5-6% from the available literature data [18,73,74], is potentially underestimated as significant efforts have been deployed to target this objective (see section 7). We evaluate, however, that higher rates cannot be considered before more standardized data are available. Consequently, we consider 34% of HEFA fuel production worse than conventional fuels if used for SAF, at 99.1 g/MJ. The CORSIA framework also acknowledges this low adoption of methane capture technology [18]. However, it does not provide updated data on the issue. Prioritizing better data and reducing carbon emissions of the actual road pathway production appears to be essential, as shifting these resources to SAF would lead to 73–80% of fuels having low to no carbon emission reduction despite their high premium. Globally, the potential cumulative carbon intensity reduction considering the actual usage of palm, rapeseed, and soybean oil (73% of resources) for SAF reaches only around 7.3%.
3.6.1. Reducing HEFA-tJ Pathway Carbon Intensity with Other Resources
Other resources with low carbon intensity are also often discussed for the HEFA-tJ pathway, such as POME conversion to jet, palm fatty acid distillate (PFAD) oil extraction, and growing dedicated oil crops on degraded land (e.g., carinata, and pennycress) [1,59]. However, from our perspective, these resources are not expected to gain significant market share in the future.
POME, the liquid waste stream of palm oil mills, is currently an environmental burden that could be valorized for biofuel production with some environmental and economic benefits [75]. Quantum Biofuels estimates the price competitiveness to be similar to UCO and other HEFA-tJ resources [53]. However, the total theoretical biofuel production is expected to be 400 kt/y and 900 kt/y for Malaysia and Indonesia, the most prevalent producers, respectively [75]. Some volumes are also already sold in China for biofuel production. Neste’s evaluation of POME resource availability is likely higher but included with UCO and tallow availability estimation [71]. It, thus, cannot be regarded as an important low-carbon resource for HEFA-tJ.
PFAD is a side product of palm oil production (3–5% mass) and another low-carbon resource of HEFA production [76]. Its market price is lower than palm oil, but is considered 100% utilized primarily in markets other than biofuels. Global production can be estimated as moderate (around 3–4 Mt/yr), but shifting its usage to biofuel could favour rising palm oil production and associated environmental problems. Although it could be a valuable resource for HEFA production, the market side effects must be well considered. The CORSIA should also clarify ethical and methodological issues regarding these resources. For instance, Neste only uses PFAD from sustainably certified palm plants [77]. In the CORSIA framework, a palm oil plant involved in peatland degradation—causing considerable land use changes and related GHG emissions—could still sell its PFAD as a low-carbon intensity resource (20.7 g/MJ). Such norms hardly promote the adoption of better practices by palm oil producers. It is also difficult to understand why standard PFAD carbon intensity evaluation considers palm oil plants where methane emissions from POME are captured [11]. This practice should be considered marginal, as explained earlier.
The estimated availability of oil trees on degraded land and oil cover crops is 155 Mt/yr [59,60,61]. As yields are less attractive on these lands, and the envisaged crops are less efficient at producing oil, using such resources would likely negatively affect the SAF prices. For example, palm oil agricultural yield is about 3.72–3.92 t/ha, while cover crops such as carinata, camelina, and pennycress yield, respectively, 0.42, 0.39, and 0.32 t/ha [76,78].
3.6.2. Uncertainties About the Positive Environmental Impact of Animal Fat and Low LUC/iLUC Feedstocks
If the valorization of low iLUC feedstocks, such as tallow, yellow grease, and even forest residues for other SAF pathways, is prioritized, biofuel mandates favouring these resources may also generate economic advantages for industries susceptible to causing deforestation and direct land usage changes, for instance, beef and some forestry industries.
Cattle are by far the biggest generator of deforestation for agriculture-linked commodities globally, at 451 thousand square kilometres from 2001 to 2015 [79,80]. Even though negative land use change associated with beef production has been acknowledged for a long time [81], cattle farming expansion and land speculation led to a further 60% increase in deforestation in Brazil from 2016 to 2020 [80]. As a result of an increased biofuel demand, beef tallow imports in the U.S. from Brazil have increased dramatically by 377% between January and April 2024 (from 23 kt to 110 kt) compared to 2023 [82]. To our knowledge, the evaluation of the impact of the direct land use change of cattle deforestation and its related attribution to tallow has not been discussed in the CORSIA framework, and no published study from GREET has rigorously estimated the extent of the issue. Through the work of organizations such as Trase, World Resources Institute, and Global Forest Watch, the traceability of companies with activities leading to direct land use changes is rising. Efforts to quantify the market share of tallow feedstock from cattle causing direct land use change should thus be sought.
3.7. Considerable Efforts Are Being Deployed to Reduce Palm Oil’s Carbon Intensity
Deforestation and peatland degradation in palm oil-producing countries have been a significant international community focus, ranking second after cattle in agriculture commodities generating deforestation [83]. Around 10.5 million hectares of forest were converted to palm oil plantations between 2001 and 2015, with 7 and 2.7 million hectares from Indonesia and Malaysia, respectively [79]. In 2011, palm oil producers in Indonesia made “No Deforestation” commitments, and considerable reductions in deforestation were acknowledged as a result [79,83]. From an intensive period causing 200–310 thousand hectares by year of deforestation (2005–2012), Indonesian palm oil deforestation decreased substantially, reaching only 21 thousand hectares in 2020, for instance [83].
Twenty percent of palm oil mills in Indonesia are now certified as sustainable, and the primary producer countries, Indonesia and Malaysia, are interested in substantially increasing the number of palm plants capturing methane from the effluent treatment of their production [84].
The Malaysian Palm Oil Board published biogas capture plant number data in 2019, at 28% and 125 plants [85]. Regulations in Malaysia have forced palm oil mills to install methane capture systems since 2014, with a required 75–85% POME rate treatment, but exemptions were given in 2021 for plants processing less than 216 kt/y of fresh fruit bunches [86]. No similar data are available for Indonesia, and it is unknown if Malaysian biogas capture projects are still active. Adopting biogas capture technologies by palm oil mills is critical in determining whether palm oil fuels are better or worse than conventional jet fuel. Detailed, updated, and transparent related data are required.
3.8. Shifting Production from HEFA-Road to HEFA-tJ Can Potentially Reduce the Environmental Benefits of Fuel Production From Vegetable Oils
3.8.1. Yield Impacts on Carbon Intensity
Yield is an essential component of carbon intensity, as this indicator considers a process’s global life cycle emissions divided by the production generated. It is, for example, well known that ethanol production carbon intensity in the U.S. has dropped significantly, partly due to agricultural yield improvement, and partly attributable to a higher rate of plants selling dry distiller grains—both increasing global yields [60,61,87].
Inversely, HEFA-tJ yield losses from naphtha conversion and inner refinery gas usage can increase the pathway’s carbon intensity. Significant uncertainties in our yield estimates exist as our data cover a wide range of values for byproduct naphtha and refinery gas (Table 1). The exact chemical composition and real market potential can profoundly affect yield values. As these data are often kept confidential in commercial or emerging HEFA-tJ technologies, evaluating how yield variations affect carbon intensity is challenging but necessary. Figure 6 illustrates how yield variations for HEFA-tJ affect the carbon intensity of the HEFA-tJ pathway with various resources. Carbon intensity calculations for different yields can be evaluated simply, by a rule of three based on the CORSIA data. Results of these yield variations—from 87 to 73%, for instance—show few effects for those resources already having a low carbon intensity. For example, HEFA-tJ from tallow varies by 4.32 g/MJ, and UCO by 2.67 g/MJ. However, much more significant effects are observed for palm oil, with and without open ponds, at 14–19 g/MJ. Reliable and transparent data on yield variation effect and influencing factors are thus mandatory for rigorous carbon intensity evaluation, as these variations have high impacts on sustainability estimations. CORSIA is a valuable tool for SAF carbon intensity evaluation, with transparent data for the overall carbon emission sources of the different pathways [18]. However, only one value for yield is given for each path, and no detail is given on the assumptions made and their uncertainties. NREL State of Industries (SOI) for HEFA acknowledges that yield variations lead to variable carbon intensity between the RD and the HEFA-tJ pathways [11]. Not many details on the factors influencing those yields are given, and the impact of yield variation on the iLUC factor is neglected, significantly reducing the influence of yield on carbon intensity.
In the literature, only the Renewable National Laboratory’s State of Industry (NREL SOI) [11] has attempted any comparative evaluation of the carbon intensity between BD/RD and HEFA-tJ fuels. Several past carbon intensity evaluations for road fuels are, however, available (Figure 7), such as those from GREET, the Joint Research Center (JRC), and an IEA Bioenergy review of data from several past assessments [69,88,89]. Comparing and discussing carbon intensity evaluation of HEFA-tJ with road fuels is necessary as, otherwise, it may give the impression that evaluators have a biased perspective towards air fuels.
For instance, with the exception of evaluations by the GREET model and the Brazilian Virtual Sugarcane Biorefineries (VSB) [89], all BD/RD carbon intensities are estimated to be slightly higher than the CORSIA evaluations (without iLUC). For example, JRC (Europe) and GREET (US) considered values of 22.1 g/MJ and 18.6 g/MJ for feedstock cultivation-gathering for RD, while HEFA-tJ CORSIA values are lower at 20.6 g/MJ (Europe) and 17.9 g/MJ (U.S.). Yield variation impacts are also unclear for oil extraction or feedstock-conversion carbon intensity. Globally, the inverse tendency should be observed with slightly higher carbon intensity for SAF, as yield and hydrogen usage disfavour HEFA-tJ [11]. Standardization of carbon intensity evaluations, and clarification of differences across processes using the same operational units, would give more transparency to such evaluations.
The primary factor leading to a higher carbon intensity evaluation for road fuels, however, is the consideration of oil transportation emissions, at around 9–12 g/MJ for BD/RD compared to approximately 2 g/MJ for CORSIA (in pink). From this perspective, it is worth noting that American producers expect future HEFA-tJ and road fuel production to come mostly from international importation [11]. This would raise transport emissions as evaluations from GREET considered only local feedstocks, for instance [89].
3.8.2. Yield Effects on GHG Reduction
The impacts of yield on environmental sustainability go far beyond carbon intensity. If SAF fuel norms concern carbon intensity (g/MJ), countries’ climate goals and sustainable investments aim to reduce GHG emissions (t/y). Comparing only the carbon intensity of products gives a limited perspective on the best resource usage, as it does not consider how efficient different processes are at converting feedstocks. To our knowledge, Staples et al. are the only ones to have compared the GHG reduction potential of various feedstocks [90,91]. These studies offered a global perspective on the efficiency of converting biomass to heat and power or fuels and the efficiency of jet fuel production from various feedstocks (wood, corn, and vegetable oil). However, they did not compare how different processes using the same feedstock for biofuels affect GHG reduction potential, nor the impact of varying parameters within a single process.
GHG emissions reduction for a project (Equation 4) can be estimated from the carbon intensity (CI) of the sustainable fuel (sust.) versus the conventional fuel (conv.) and the total production (P). The latter varies with yield (Equation 5), and a comparison of GHG emission reduction of different technologies can be made by considering the same quantity of process input.
Modelling the GHG reduction associated with various resources and yield variations is straightforward, as illustrated in Figure 8 for a standard 900 kt/y plant. The 73% and 81% yields correspond to our estimate for HEFA-tJ and HEFA-road yields, while the 87% yield is our estimate for CORSIA. As a relevant example, we considered a scenario between our estimation and CORSIA, at 85% yield for RD, and 79% yield for SAF. The model is necessarily a simplification to illustrate the critical importance of yield, the fate of byproduct streams, and feedstock choice.
In Figure 8, hydrogen usage is neglected. It is expected to be higher for HEFA-tJ than RD, leading to more GHG emissions (steam methane reforming is the expected method with emissions of CO2 of 10 t/t of hydrogen). From the Zeck et al. study (2018), around 5.4 kt of additional hydrogen would be needed for the HEFA-tJ pathway compared to the HEFA-road pathway, resulting in approximately 54 kt less CO2-equivalent emission reductions. Conversely, as refinery gas production is higher in the HEFA-tJ pathway, it is expected to be reformed internally to lower hydrogen production emissions [44], making preliminary estimations more complex. Naphtha conversion to chemicals also necessitates high thermal energies, but leads to carbon sequestration if the plastic is not incinerated or used for energy at its end of life [92,93]. The fossil emissions associated with conventional diesel are higher than those of jet, and from Equation 4, it is evident that replacing diesel generates slightly more GHG reduction than replacing jet fuels. Finally, the carbon intensities of road fuels for different feedstocks are 11–18 g/MJ lower than for jet fuels (section 10), but they are considered equivalent here. Globally, the results presented in Figure 8, however, are significant enough to neglect those considerations.
First, as both carbon intensity and GHG reduction calculations depend on yield, the slope related to every resource feedstock is the same. Shifting from RD (85% yield) to HEFA-tJ (79% yield) leads the model to more than 200 kt/y avoided differences for a standard HEFA plant using 900 kt of oil. Scenarios valorizing naphtha as a fuel additive or selling refinery gas would be closer to the CORSIA’s scenario. Higher, i.e., more pessimistic, values for yield difference between the two pathways lead to higher avoided GHG emission differences.
Figure 8 also shows that investments to increase the UCO and tallow usages feedstock shares for BD and RD production have a higher GHG reduction potential than building new HEFA-tJ plants using low GHG reduction resources. A new rapeseed oil HEFA-tJ plant would lead to approximately 300 kt/y GHG reduction, while replacing an equivalent quantity of rapeseed oil by tallow leads to more than 1.85 Mt/y GHG reduction. Even with CORSIA’s data at 87% yield, replacing a plant size quantity of rapeseed oil by tallow for RD, for instance, generates a 1.65 Mt /y avoided difference, which is several times more efficient than building a new SAF plant with soybean, rapeseed, or palm oils. Economically, changing a plant feedstock necessitates much lower investment and market risk than building a new plant.
3.9. Reducing Palm Oil Production’s Environmental Impact by Capturing Methane from Effluent Treatment Is a Less Capital-Intensive and More Efficient Way to Reduce Global GHG Emissions than Producing HEFA-tJ
Figure 8 also illustrates that, from an environmental perspective, favouring methane capture for palm oil could also be an effective way to reduce GHG emissions. Indonesia and Malaysia produce around 68 Mt of palm oil annually, and GHG emissions associated with palm oil production are estimated to be more than 1.75 t/t of palm oil higher without methane capture [74]. With more than 1 Mt/y avoided if all palm oil used by a plant involved palm oil plant with closed ponds, the positive effect is several times higher than that of a new HEFA-tJ plant with a low GHG emission reduction potential (350–550 kt/y avoided). As biomethanization plants are an order of magnitude less investment-intensive than SAF plants, economic risks are potentially less prohibitive. The economy of numbers can also favour more straightforward production cost reduction with more efficient technology adoption as methane capture integration increases. As market entry barriers are lower, more suppliers and economic competition are also expected.
3.10. Social Costs of Reducing GHG Emissions with Vegetable Oil and Animal Fat Products Are Important
Assessing how much society must pay to reduce GHG emissions with different technologies is challenging, as it relies on many hypotheses. Total capital investments (TCI) for a project are particularly subject to significant underestimation and overrun. Environmental assessments, as discussed earlier for iLUC and deforestation issues, also face methodological challenges and political pressure that may undermine their value. Despite these considerations, metrics combining both economic and environmental impacts remain critical. Cost by ton of GHG avoided is thus calculated based on the premium cost ($/MJ) and the carbon intensity reduction (CI, g/MJ) of each feedstock (soybean oil, canola oil, tallow, corn oil, and yellow grease), according to their utilization ratio, r. All HEFA-tJ, RD, and BD calculations are estimated based on the American resource usage distribution discussed in Section 4.2.
3.10.1. Economic Model for Social Cost Estimation
A simplified economic model compares HEFA-tJ, RD, and BD production. The analysis of section 3 is extended by adding TCI costs, return on investments (RI), taxes, maintenance costs, and more specific hypotheses on hydrogen, methanol, electricity, and natural gas usage and costs. For TCI, Table 3 presents various assessments based on values found in the literature and announced by companies for HEFA-tJ and BD. The base unit of all analyses is calculated by ton of feedstock.
Wide variations are observed for HEFA-tJ TCI, ranging from $550–1869/t of feedstock (in 2024). The lowest values (< $1000/t) are considered an underestimation, as they are below project announcements at $1168–1337/t (Neste, World Energy Paramount, and TotalEnergy). These projects are also considerably smaller, at less than 400 kt/y of feedstock, and do not benefit from the economy of scale of the latter (more than 1400 kt/y for Neste and World Energy Paramount).
Hofstrand [94] and Air Liquide [56] describe BD projects at a considerably lower TCI than HEFA-tJ and RD, ranging from $315–500/t. As overruns and underestimation are expected, we considered in our model both HEFA-tJ and BD to have higher TCI, from $1200–1600/t for HEFA-tJ and $500–650/t for BD (Table 3). A gross estimation of 92% HEFA-tJ TCI was used for the RD process. Hydrogen costs are not included in the TCI for RD, HEFA-tJ, and are estimated independently at $2000/t of hydrogen (Table 4).
To evaluate the effects of TCI and resource usage variation, annual capital and operational costs are estimated in a lightweight model based on general hypotheses related to depreciation, RI, taxes, maintenance, and primary resource usage and cost (Table 4 and Table 5). These rules of thumb were estimated based on NREL TEA studies [95,96]. The validity of such hypotheses appears acceptable in a preliminary comparative study where feedstock costs dominate. From 2017 to 2023, primary resources (oil and fat) represented in our model between 61 and 81% of the total annual cost for HEFA-tJ and RD, while they accounted for 78–91% for BD. Depreciation cost calculation is similar to Hofstrand’s [56] and NREL’s models.
3.10.2. Carbon Intensity Model for GHG Reduction and Social Cost Estimation
Carbon intensity values are based on CORSIA and GREET assessments [59,69] and compared in Table 6 to GHG emissions avoided by kg of feedstock (Equation 4). Yields of HEFA-tJ and RD were considered to be 79% and 85%. Yields of BD were considered to be 95% for animal-derived fat (tallow and yellow grease), 97% for vegetable oils, and related carbon intensities are based on GREET evaluation [69]. Because GREET evaluations for feedstock cultivation and collection are significantly lower than CORSIA’s evaluation for soybean and canola oil (Figure 7), we added 10 g/MJ for these feedstocks to avoid disparities in the comparison and to illustrate mostly yield impacts on GHG reduction and social costs. The soybean feedstock collection CORSIA’s value with GREET methodology is 17.8 g/MJ, while Xu, H. et al. [69] value is 8.9 g/MJ. Further clarifications on this large gap should be sought. Multiple iLUC values were given for canola oil and soybean oil for BD and RD pathways (ibid), so a generic value of 20 g/MJ was considered for these resources.
The RD mix (using US resource distribution for RD) offers the highest GHG emission reduction, at 2236 g/kg of feedstock, followed by the BD mix, at 1725 g/kg. RD offers a 29% improvement in GHG reduction over BD, 38% over HEFA-tJ with RD mix, and 101% over HEFA-tJ with BD mix. Despite having a lower energy density and a higher rate of high carbon-intensity resources (soybean and canola oil), BD offers 6% and 55% better GHG reduction than HEFA-tJ with RD and BD resource usage.
3.10.3. Social Costs of the Different Pathways
Figure 9 presents the social cost of GHG reduction, combining the economic and environmental models. Two lines are shown for each scenario, illustrating the variable TCI studied (min/max values).
HEFA-tJ pathways lead to considerably higher social costs caused by much lower associated GHG reduction and higher costs related to yield losses. Lower jet fuel costs compared to diesel fuel are another important factor impacting the social cost of HEFA-tJ. Uncertainties exist regarding the selected data for those costs. Statista presents similar diesel retail prices to EIA, while IndexMundi considers costs closer to conventional jet fuel but still 7–10% more expensive. We thus selected IndexMundi diesel prices in Figure 8, as they reduced the advantage of road fuels by about $100/t. Still, HEFA-tJ bears a significantly higher social cost than the latter. There is also a notable social cost difference between HEFA-tJ using the U.S. BD and RD mix, at more than $200/t.
Concerning road fuels, RD’s advantage over BD (red vs green lines) is less clear despite its 29% higher GHG reduction potential (Table 6). A much higher TCI for RD mainly explains this situation (Table 3). More favourable RD conditions are observed only from 2020 to 2022. Our model may, however, underestimate RD’s advantage in adapting to market fluctuations compared to BD.
As for BD, it is important to note that implementing new technologies to expand feedstock possibilities holds the promise of the most efficient solution from a social cost perspective (purple lines). For instance, Air Liquide’s commercialization of supercritical pretreatment in 2017, allowing higher utilization rates of tallow and yellow grease, is a significant step in this direction [94]. Even if BD’s TCI were to reach the upper-bound cost of our model and higher with such pretreatment (> $650/t), the TCI remains considerably lower than RD and leads to significantly lower social costs, at around $30–70/t difference (purple upper-bound line vs red lines). Many BD facilities are also already operating (59 in the U.S.), implying that new plants do not need to be built in most cases. Incentives favouring adoption of technologies that allow more feedstock flexibility for BD appear to be a sound orientation that favours both actual plant economic activities and GHG reduction.
Globally, despite being more favourable from a social cost perspective, the price for road diesel remains important, at over $150–200/t. Incentives for GHG reduction can hardly cover higher costs. Periods of economic instability, where feedstock costs rise drastically, have also proven difficult. Many BD plants have faced significant challenges recently [94,97]. Chevron closed two plants in 2024, and primary resource price fluctuations since 2020 have deeply affected BD plants’ profitability [97]. This can also be observed in Figure 9, where social prices oscillate from $250 to 650/t (2020–2023). HEFA-tJ fuels, with social costs rising well above $900/t for several months in the same period, would have faced even more dire challenges.
4. Discussion: The Role of Different Actors in Maximizing the Climate Offsets of the SAF Production
4.1. Lawmakers and Aviation Industries
Rising SAF production using the HEFA-tJ pathway is, at first sight, the most attractive path to lower aviation GHG emissions because of its maturity and the market’s low integration rates. However, yield losses (Figure 2) when trying to produce jet fuels at high selectivity make the pathway much less competitive than renewable diesel production. In fact, the industry currently favours renewable diesel production [11]. Additional incentives could change the tendency, but it would come at a higher societal cost and with lower GHG emission reduction. In our opinion, book and claim systems for investments outside of SAF and aviation—such as in road-diesel production or methane capture systems for palm oil effluent (POME)—should be considered/studied seriously by the aviation industry as these investments appear significantly more efficient.
Another key message is that rising market integration rates of SAF or RD should not be considered a primary goal for legislation; in contract to reducing GHG emissions. Shifting actual BD and RD feedstock to SAF would lead to 70–80 % of biofuels to have mitigated environmental impact (slightly positive or negative). Restraining biofuel production primarily to low-carbon intensity/low iLUC feedstock has also been historically challenging for BD and RD. Incentives toward this aim for HEFA-tJ might be less efficient as the social cost of using high-carbon intensity feedstock for SAF production is several times higher than for road diesel. In another perspective, if considerable efforts to lower the environmental impacts of palm oil production must be acknowledged, more transparent and rigorous data are required. Efforts must be pursued to capture/valorize methane from POME treatment or favour more sustainable plant accreditation.
Consequently, raising production to a new market (SAF) is potentially not a sound orientation. Considering the short time frame required to achieve significant world GHG emission reduction, and the relatively slow deployment time for constructing HEFA-tJ plants (more than 2–5 years), reducing the carbon intensity of biofuel production from vegetable oil is a far more realistic option. It is less capital-intensive than building new SAF plants and considerably faster.
Finally, low-carbon-intensity resources such as tallow and yellow grease are limited. The industry acknowledges that the HEFA-tJ using these resources is insufficient to achieve the claimed SAF objectives for 2030 [11]. Other technologies and primary feedstocks are needed. Investing now in the HEFA-tJ pathway, or other low-risk strategies, will saturate the SAF market and make adopting more efficient emerging pathways to reduce GHG emissions challenging (Figure 1). Developing risky technologies that can lower the premium cost should thus be done sooner rather than later.
4.2. Takeaway for R&D and R&D Investors
From a commercialization perspective, road diesel fuels from biomass feedstock are some of the most successful sustainable alternatives to fossil fuels. However, their market integration worldwide remains well below 5–10%, and their social price is high according to our model, from approximately $100 to 650/t between 2020 and 2023. Aiming to achieve higher market integration will be very challenging with other technologies where feedstock cost, high capital investments, or high energy demand lead to social costs several times higher than actual BD or RD (i.e., HEFA-tJ). Industrial plants’ survival ability may also significantly be diminished during challenging economic times like COVID-19 and war, as illustrated in Figure 8.
Achieving higher market integration rates of sustainable solutions in various fields (more than 15%) requires new technologies with lower social costs, ideally much less than $100/t. In our opinion, relying solely on electrification and intermittent energies’ expected cost drop is insufficient, as the world’s electric grid has a very high carbon intensity and already faces considerable challenges in its reduction [98,99]. New ideas are needed. A focus on technologies that can achieve low GHG emissions, and also demonstrate a clear pathway to cost and economic risk reduction, is of utmost importance. From that perspective, using fossil feedstock wisely to reach a higher yield or generate the required hydrogen for a process may appear an unpopular idea, but it should not be ignored. Both BD and RD road fuel pathways use substantial amounts of fossil-based methanol and hydrogen while reaching low carbon intensity if supplied with low iLUC resources, with more than 60–70% CI reduction. Many of the most promising technologies presented in the BETO’s State of Technologies [25], which tries to summarize the main economic results from thousands of past projects they founded on biomass conversion, also require significant quantities of fossil fuels. This is the case for the catalytic fast pyrolysis pathway, the dry feedstock bioconversion pathway and upgrading via 2,3-butanediol and mixed-acid intermediates, and the combined algae processing via 2,3-butanediol intermediates [25]. According to their LCA and economic analyses, these processes have the potential to reach competitive prices and low carbon intensity (more than 70% CI reduction).
4.3. Takeaway for LCA Developers
Market distribution/resource share usage is critical to evaluating whether low-carbon intensity solutions are competitive and applicable. For instance, it should be clear to an unspecialized LCA expert that a palm oil plant with methane capture is a marginal practice, and that rigorous data on the practice usage are missing. Such marginal practice should also not be considered a reference scenario for PFAD without justification. The share of side-products from feedstocks leading to considerable direct land use changes should be studied more rigorously. Whether it be as a result of palm plantation or cattle farming causing deforestation, data on these issues and their market importance are becoming progressively more available. Knowing the proportion of plants adopting a technology, using only soybean oil, or using a mixture of primary resources is also critical to determine if action must be taken. The origin of the feedstock and the related transport distance proportional to the market share should also be considered, as feedstock importation in the U.S. is gaining importance. Better resource share usage data is relevant for policymakers and industrialists.
Yield is susceptible in some processes to important variations according to the plant conception or process performance. Precisions on these variations are mandatory for rigorous environmental evaluation. Methodologically, we also showed that global GHG emission reduction must be considered when comparing projects, not just carbon intensity.
4.4. Takeaway for the Industry
ILUC evaluation should be considered seriously, even if the associated methodology is complex and leads to uncertainty—and, therefore, risk. According to Figure 4, many renewable diesel plants in the U.S. should also not be worried about iLUC or greening their hydrogen production if they shift to SAF.
5. Conclusions
The aviation industry faces considerable pressure to reduce the GHG emissions from its different activities while society pushes for the fast adoption of strong related legal constraints in different sectors. These objectives are laudable. However, the capacity of involved measures to efficiently reduce GHG emissions must be considered rigorously. If the HEFA-tJ pathway is the most readily available for SAF production, its cost comes with a substantial premium and considerable investments from society. Consequently, society should expect a significant reduction in GHG emissions. We particularly emphasize the need for more transparent data on the environmental impacts of rising HEFA-tJ production compared to investing in the GHG reduction of alternative markets using similar primary resources, such as biodiesel (BD) and RD. This will enable stakeholders to make more informed decisions and contribute to the sustainable development of the aviation industry. More generally, it appears that the competing market for primary resources, and the impact of yield in evaluating the environmental benefits of investing in HEFA-tJ, are significant issues that require immediate consideration and discussion.
Author Contributions
These contributions have been detailed in the submission section.
Funding
This research was funded by NSERC Canada.
Acknowledgments
The authors are indebted to the personnel of the GRTP (Group of Research on Technologies and Processes) of the Department of Chemical & Biotechnological Engineering of the Université de Sherbrooke.
Conflicts of Interest
The authors declare no conflicts of interest.
Abbreviations
The following abbreviations are used in this manuscript:
| BD | Biodiesel (fatty acid methyl ester, FAME) |
| BETO | USDOE, Bioenergy Technology Office |
| CI | Carbon intensity |
| CORSIA | Carbon Offsetting and Reduction Scheme for International Aviation |
| EIA | U.S. Energy Information Administration |
| HEFA-tJ | Hydrotreated ester and fatty acid pathway to jet |
| HEFA-road | Hydrotreated ester and fatty acid pathway to renewable diesel (RD) |
| FOG | Fats, oils and greases |
| IATA | International Air Transport Association |
| ILUC | Indirect land use changes |
| JRC | Joint Research Center |
| Mt | Million tonnes |
| NREL SOI | National Renewable Energy Laboratory State of Industry |
| PFAD | Palm fatty acid distillate |
| RD | Renewable diesel, also called HVO (hydrogenated vegetable oil) |
| SAF | Sustainable aviation fuels |
| TCI | Total Capital Investment |
| UCO | Used Cooking Oil |
| USDA | United States Department of Agriculture |
| USDOE | United States Department of Energy |
References
- Watson, M. J.; Machado, P. G.; da Silva, A. V.; Saltar, Y.; Ribeiro, C. O.; Nascimento, C. A. O.; Dowling, A. W. Sustainable Aviation Fuel Technologies, Costs, Emissions, Policies, and Markets: A Critical Review. Journal of Cleaner Production 2024, 449, 141472. [CrossRef]
- Calderon, R., O.; Tao, L.; Abdullah, Z. Sustainable Aviation Fuel (SAF) State-of-Industry Report: State of SAF Production Process; NREL, 2024. https://www.nrel.gov/docs/fy24osti/87802.pdf.
- Nigam, S.; Singer, D. Pathway to SAF—Europe Edition; 2024.
- BETO. SAF Grand Challenge Roadmap Flight Plan for Sustainable Aviation Fuel; 2022. https://www.energy.gov/sites/default/files/2022-09/beto-saf-gc-roadmap-report-sept-2022.pdf.
- European Commission. REGULATION OF THE EUROPEAN PARLIAMENT AND OF THE COUNCIL on ensuring a level playing field for sustainable air transport, 2021.
- European Union Aviation Safety Agency. Current landscape and future of SAF industry | EASA Eco. https://www.easa.europa.eu/eco/eaer/topics/sustainable-aviation-fuels/current-landscape-future-saf-industry (accessed 2024-06-09).
- IATA. Developing Sustainable Aviation Fuel (SAF). https://www.iata.org/en/programs/sustainability/sustainable-aviation-fuels/ (accessed 2024-08-13).
- Neste. Rotterdam refinery | Neste. https://www.neste.com/about-neste/how-we-operate/production/rotterdam-refinery (accessed 2024-08-13).
- World Energy Paramount. Advanced Alternatives: World Energy Paramount Renewable Fuels Project, 2022. https://laedc.org/wpcms/wp-content/uploads/2022/06/LAEDC_AlpineReport_FINAL_rvs-06.20.2022.pdf.
- ReFuelEU. “Ajustement à l’objectif 55”: accroître l’utilisation de carburants plus écologiques dans les secteurs aérien et maritime. https://www.consilium.europa.eu/fr/infographics/fit-for-55-refueleu-and-fueleu/ (accessed 2024-06-09).
- Calderon, R., O.; Tao, L.; Abdullah, Z.; Talmadge, M.; Milbrandt, A.; Smolinski, S.; Moriarty, K.; Bhatt, A.; Zhang, Y.; Ravi, V.; Skangos, C.; Davis, R.; Payne, C. Sustainable Aviation Fuel State-of-Industry Report: Hydroprocessed Esters and Fatty Acids Pathway, 2024.
- Bardon, P.; Massol, O. Decarbonizing Aviation with Sustainable Aviation Fuels: Myths and Realities of the Roadmaps to Net Zero by 2050. Renewable and Sustainable Energy Reviews 2025, 211, 115279. [CrossRef]
- Braun, M.; Grimme, W.; Oesingmann, K. Pathway to Net Zero: Reviewing Sustainable Aviation Fuels, Environmental Impacts and Pricing. Journal of Air Transport Management 2024, 117, 102580. [CrossRef]
- Doliente, S. S.; Narayan, A.; Tapia, J. F. D.; Samsatli, N. J.; Zhao, Y.; Samsatli, S. Bio-Aviation Fuel: A Comprehensive Review and Analysis of the Supply Chain Components. Front. Energy Res. 2020, 8. [CrossRef]
- Wei, H.; Liu, W.; Chen, X.; Yang, Q.; Li, J.; Chen, H. Renewable Bio-Jet Fuel Production for Aviation: A Review. Fuel 2019, 254, 115599. [CrossRef]
- Ng, K. S.; Farooq, D.; Yang, A. Global Biorenewable Development Strategies for Sustainable Aviation Fuel Production. Renewable and Sustainable Energy Reviews 2021, 150, 111502. [CrossRef]
- Perkins, J. Dozens of Ethanol Plants Remain Idle in Early 2021. Successful Farming. https://www.agriculture.com/news/business/dozens-of-ethanol-plants-idle-production-in-early-2021 (accessed 2025-02-12).
- CORSIA. CORSIA SUPPORTING DOCUMENT v5, CORSIA Eligible Fuels—Life Cycle Assessment Methodology; v5; 2022; p 203.
- Pearlson, M.; Wollersheim, C.; Hileman, J. A Techno-Economic Review of Hydroprocessed Renewable Esters and Fatty Acids for Jet Fuel Production. Biofuels, Bioproducts and Biorefining 2013, 7 (1), 89–96. [CrossRef]
- Zech, K. M.; Dietrich, S.; Reichmuth, M.; Weindorf, W.; Müller-Langer, F. Techno-Economic Assessment of a Renewable Bio-Jet-Fuel Production Using Power-to-Gas. Applied Energy 2018, 231, 997–1006. [CrossRef]
- Bardon, P.; Massol, O.; Thomas, A. Greening Aviation with Sustainable Aviation Fuels: Insights from Decarbonization Scenarios. Journal of Environmental Management 2025, 374, 123943. [CrossRef]
- Gössling, S.; Humpe, A. Net-Zero Aviation: Time for a New Business Model? Journal of Air Transport Management 2023, 107, 102353. [CrossRef]
- Gössling, S.; Humpe, A. Net-Zero Aviation: Transition Barriers and Radical Climate Policy Design Implications. Science of The Total Environment 2024, 912, 169107. [CrossRef]
- Dray, L.; Schäfer, A. W. Cost and Emissions Pathways towards Net-Zero Climate Impacts in Aviation. Nature Climate Change 2022, 12 (10), 956–962. [CrossRef]
- Bioenergy Technology Office. State of Technology, 2020; DOE, 2021; p 168.
- Hamberg, K.; Leslie, M.; Walter, C.; Stratton, T.; Markham, D.; Tang, M.; Weatherbed, L. Scaling Solutions, Accelerating the Commercialization of Made-in-Canada Clean Technology, 2023.
- Dyk, S. V.; Saddler, J. Progress in the Commercialization of Biojet / Sustainable Aviation Fuels: Technologies, Potential and Challenges | Bioenergy; IEA Bioenergy Task 39, 2021. https://www.ieabioenergy.com/blog/publications/progress-in-the-commercialization-of-biojet-sustainable-aviation-fuels-technologies-potential-and-challenges/ (accessed 2024-04-25).
- IEA. Ethanol and gasoline prices 2019 to April 2022—Charts—Data & Statistics. IEA. https://www.iea.org/data-and-statistics/charts/ethanol-and-gasoline-prices-2019-to-april-2022 (accessed 2024-04-27).
- EIA. U.S. Energy Information Administration—EIA—Independent Statistics and Analysis. https://www.eia.gov/state/search/?sid=AL#?1=682&2=182&r=false (accessed 2025-02-01).
- Mauler, L.; Dahrendorf, L.; Duffner, F.; Winter, M.; Leker, J. Cost-Effective Technology Choice in a Decarbonized and Diversified Long-Haul Truck Transportation Sector: A U.S. Case Study. Journal of Energy Storage 2022, 46, 103891. [CrossRef]
- Jadun, Paige, Colin McMillan, Daniel Steinberg, Matteo Muratori, Laura Vimmerstedt, and Trieu Mai. 2017. Electrification Futures Study: End-Use Electric Technology Cost and Performance Projections through 2050. Golden, CO: National Renewable Energy Laboratory. NREL/TP-6A20-70485. https://www.nrel.gov/docs/fy18osti/70485.pdf.
- Ledna, C.; Muratori, M.; Yip, A.; Jadun, P.; Hoehne, C.; Podkaminer, K. Assessing Total Cost of Driving Competitiveness of Zero-Emission Trucks. iScience 2024, 27 (4). [CrossRef]
- Link, S.; Stephan, A.; Speth, D.; Plötz, P. Rapidly Declining Costs of Truck Batteries and Fuel Cells Enable Large-Scale Road Freight Electrification. Nat Energy 2024, 9 (8), 1032–1039. [CrossRef]
- Noll, B.; del Val, S.; Schmidt, T. S.; Steffen, B. Analyzing the Competitiveness of Low-Carbon Drive-Technologies in Road-Freight: A Total Cost of Ownership Analysis in Europe. Applied Energy 2022, 306, 118079. [CrossRef]
- Argonne National Laboratory. Hydrogen Delivery Infrastructure Analysis. https://hdsam.es.anl.gov/index.php (accessed 2025-02-17).
- Elgowainy, A. Economic and Environmental Perspectives of Hydrogen Infrastructure Deployment Options, 2019.
- HDSAM. Hydrogen Delivery Scenario Analysis Model. https://hdsam.es.anl.gov/index.php?content=hdsam (accessed 2025-02-19).
- Connelly, E., Penev, M., Elgowainy, A., Hunter, C. Current Status of Hydrogen Liquefaction Costs. DOE Hydrogen and Fuel Cells Program Record 19001. https://www.hydrogen.energy.gov/docs/hydrogenprogramlibraries/pdfs/19001_hydrogen_liquefaction_costs.pdf?sfvrsn=378c2204_1.
- Ragon, P.-L.; Kelly, S.; Egerstrom, N.; Brito, J.; Sharpe, B.; Allcock, C.; Minjares, R.; Rodriguez, F. Near-term infrastructure deployment to support zero-emission medium- and heavy-duty vehicles in the United States. International Council on Clean Transportation. https://theicct.org/publication/infrastructure-deployment-mhdv-may23/ (accessed 2025-02-19).
- Burnham, A.; Gohlke, D.; Rush, L.; Stephens, T.; Zhou, Y.; Delucchi, M. A.; Birky, A.; Hunter, C.; Lin, Z.; Ou, S.; Xie, F.; Proctor, C.; Wiryadinata, S.; Liu, N.; Boloor, M. Comprehensive Total Cost of Ownership Quantification for Vehicles with Different Size Classes and Powertrains; ANL/ESD-21/4; Argonne National Lab. (ANL), Argonne, IL (United States), 2021. [CrossRef]
- Aryanpur, V.; Rogan, F. Decarbonising Road Freight Transport: The Role of Zero-Emission Trucks and Intangible Costs. Sci Rep 2024, 14 (1), 2113. [CrossRef]
- Tao, L.; Milbrandt, A.; Zhang, Y.; Wang, W.-C. Techno-Economic and Resource Analysis of Hydroprocessed Renewable Jet Fuel. Biotechnology for Biofuels 2017, 10 (1), 261. [CrossRef]
- Marker, T. L. Opportunities for Biorenewables in Oil Refineries. 2005. [CrossRef]
- Cross, D. SHELL’S POWERING PROGRESS STRATEGY, 2022. https://www.gti.energy/wp-content/uploads/2022/05/01-tcbiomass2022-Keynote-Presentation-Darren-Cross.pdf.
- Digital Refining. Neste Oil adds NExBTL renewable naphtha suitable for producing bioplastics. https://www.digitalrefining.com/news/1001438/neste-oil-adds-nexbtl-renewable-naphtha-suitable-for-producing-bioplastics (accessed 2024-04-09).
- Oki, N. Japan’s Mitsui Chemicals adds new bio-petchem products | Latest Market News. https://www.argusmedia.com/en/news-and-insights/latest-market-news/2508701-japan-s-mitsui-chemicals-adds-new-bio-petchem-products (accessed 2024-04-09).
- Chang-Won, L. SK Geo Centric delivers first shipment of renewable benzene to Covestro. Aju Press. https://www.ajupress.com/view/20220620135800806 (accessed 2024-04-09).
- Kotrba, R. Total converting Grandpuits refinery to produce renewable diesel, SAF, bioplastics, solar power. BiobasedDieselDaily. https://www.biobased-diesel.com/post/total-investing-500-million-euros-converting-grandpuits-refinery-to-produce-hvo-saf-bioplastics (accessed 2024-04-09).
- Honeywell. Honeywell Introduces New Technology To Produce Key Feedstock For Plastics. https://www.honeywell.com/us/en/press/2022/02/honeywell-introduces-new-technology-to-produce-key-feedstock-for-plastics (accessed 2024-04-09).
- Zhao, Z., Jiang, J., Wang, F. An economic analysis of twenty light olefin production pathways, Journal of Energy Chemistry, Volume 56, 2021, Pages 193-202, ISSN 2095-4956. [CrossRef]
- Neste. Borealis producing certified renewable polypropylene from Neste’s renewable propane at own facilities in Belgium. https://www.neste.com/news/borealis-producing-certified-renewable-polypropylene-from-neste-s-renewable-propane-at-own-facilities-in-belgium (accessed 2024-04-09).
- Neste. Neste delivers first batch of 100% renewable propane to European market. https://www.neste.com/news/neste-delivers-first-batch-of-100-renewable-propane-to-european-market (accessed 2024-04-09).
- Quantum Commodity Intelligence. https://www.qcintel.com/ (accessed 2024-04-25).
- EIA. U.S. Gulf Coast Kerosene-Type Jet Fuel Spot Price FOB (Dollars per Gallon). https://www.eia.gov/dnav/pet/hist/LeafHandler.ashx?n=PET&s=EER_EPJK_PF4_RGC_DPG&f=M (accessed 2024-08-12).
- USDA. US Bioenergy Statistics, 2024. https://www.ers.usda.gov/data-products/u-s-bioenergy-statistics/.
- Hofstrand, D. Tracking Biodiesel Profitability | Ag Decision Maker, 2024. https://www.extension.iastate.edu/agdm/energy/html/d1-15.html (accessed 2024-08-05).
- Carlson, N. A.; Talmadge, M. S.; Singh, A.; Tao, L.; Davis, R. Economic Impact and Risk Analysis of Integrating Sustainable Aviation Fuels into Refineries. Front. Energy Res. 2023, 11. [CrossRef]
- DOE Alternative Fuels Data Center. Alternative Fuels Data Center: Fuel Properties Comparison. https://afdc.energy.gov/fuels/properties (accessed 2024-08-12).
- Prussi, M.; Lee, U.; Wang, M.; Malina, R.; Valin, H.; Taheripour, F.; Velarde, C.; Staples, M. D.; Lonza, L.; Hileman, J. I. CORSIA: The First Internationally Adopted Approach to Calculate Life-Cycle GHG Emissions for Aviation Fuels. Renewable and Sustainable Energy Reviews 2021, 150, 111398. [CrossRef]
- Unnasch, S. Review of EPA Workshop on Biofuel Greenhouse Gas Modeling, 2022.
- Taheripour, F.; Mueller, S.; Emery, I.; Karami, O.; Sajedinia, E.; Zhuang, Q.; Wang, M. Biofuels Induced Land Use Change Emissions: The Role of Implemented Land Use Emission Factors. Sustainability 2024, 16 (7), 2729. [CrossRef]
- Wang, Michael. « Opportunities for Lowering GHG Emissions of Corn Ethanol », 2022. https://www.energy.gov/sites/default/files/2022-03/02-beto-gen-1-wksp-wang.pdf.
- NAIDU, L.; MOORTHY, R.; HUDA, M. I. M. THE ENVIRONMENTAL AND HEALTH SUSTAINABILITY CHALLENGES OF MALAYSIAN PALM OIL IN THE EUROPEAN UNION—Journal of Oil Palm Research. http://jopr.mpob.gov.my/the-environmental-and-health-sustainability-challenges-of-malaysian-palm-oil-in-the-european-union/ (accessed 2024-07-27).
- Schroeder, K. Waiting for Takeoff | Ethanol Producer Magazine. https://ethanolproducer.com/articles/waiting-for-takeoff (accessed 2024-08-05).
- O’Malley, J.; Pavlenko, N. Drawbacks of Adopting a “Similar” LCA Methodology for U.S. Sustainable Aviation Fuel (SAF). https://theicct.org/wp-content/uploads/2023/09/ID-16-Briefing-letter-v3.pdf.
- IEA BioEnergy. IEA Bioenergy Webinar—Understanding Indirect Land-Use Change (ILUC) and Why Reality is a Special Case—Bioenergy. https://www.ieabioenergy.com/blog/publications/iea-bioenergy-webinar-understanding-indirect-land-use-change-iLUC-and-why-reality-is-a-special-case/ (accessed 2024-08-13).
- UFOP. UFOP Report On Global Market Supply 2019-2020, 2020 . https://www.ufop.de/files/1115/7953/1340/WEB_UFOP_Global_Supply_Report_A5_EN_19_20.pdf.
- UFOP. UFOP Report On Global Market Supply 2023-2024, 2024 https://www.ufop.de/files/8217/0548/9837/UFOP-2116_Report_Global_Market_Supply_A5_EN_23_24_160124.pdf.
- Xu, H.; Ou, L.; Li, Y.; Hawkins, T. R.; Wang, M. Life Cycle Greenhouse Gas Emissions of Biodiesel and Renewable Diesel Production in the United States. Environ. Sci. Technol. 2022, 56 (12), 7512–7521. [CrossRef]
- Gerveni, M.; Hubbs, T.; Irving, S. FAME Biodiesel, Renewable Diesel and Biomass-Based Diesel Feedstock Volume Estimates, 2024.
- Lange, T. Presentation_Thorsten-Lange_2021-04-14_Neste-SAF.Pdf, 2021. https://www.europarl.europa.eu/cmsdata/232175/Presentation_Thorsten-Lange_2021-04-14_Neste-SAF.pdf (accessed 2022-11-03).
- World Economic Forum. Clean Skies for Tomorrow: Sustainable Aviation Fuels as a Pathway to Net-Zero Aviation; 2020. https://www.weforum.org/publications/clean-skies-for-tomorrow-sustainable-aviation-fuels-as-a-pathway-to-net-zero-aviation/ (accessed 2024-04-26).
- Schmidt, J.; De Rosa, M. Certified Palm Oil Reduces Greenhouse Gas Emissions Compared to Non-Certified. Journal of Cleaner Production 2020, 277, 124045. [CrossRef]
- Alcock, T. D.; Salt, D. E.; Wilson, P.; Ramsden, S. J. More Sustainable Vegetable Oil: Balancing Productivity with Carbon Storage Opportunities. Science of The Total Environment 2022, 829, 154539. [CrossRef]
- Yeoh, M. L.; Goh, C. S. Hydrotreated Vegetable Oil Production from Palm Oil Mill Effluents: Status, Opportunities and Challenges. Biofuels, Bioproducts and Biorefining 2022, 16 (5), 1153–1158. [CrossRef]
- Ritchie, H.; Roser, M. Palm Oil. Our World in Data 2024.
- Neste. Neste sets ambitious PFAD targets : 100 % traceable in 2020 https://www.neste.com/news/neste-sets-ambitious-pfad-targets-100-traceable-in-2020 (accessed 2024-08-13).
- Taheripour, F.; Sajedinia, E.; Karami, O. Oilseed Cover Crops for Sustainable Aviation Fuels Production and Reduction in Greenhouse Gas Emissions Through Land Use Savings. Frontiers in Energy Research 2022, 9.
- Goldman, E., M.J. Weisse, N. Harris, and M. Schneider. 2020. “Estimating the Role of Seven Commodities in Agriculture-Linked Deforestation: Oil Palm, Soy, Cattle, Wood Fiber, Cocoa, Coffee, and Rubber.” Technical Note. Washington, DC: World Resources Institute. Available online at: wri.org/publication/estimating-the-role-of-sevencommodities-in-agriculture-linked-deforestation.
- Trase. Brazil beef—Supply chain—Explore the data—Trase. trase.earth. https://trase.earth/explore/supply-chain/brazil/beef (accessed 2024-10-14).
- Steinfeld, Henning, Pierre Gerber, T. Wassenaar, V. Castel, Mauricio Rosales, et C. de Haan. « Livestock’s long shadow », 2006. https://www.fao.org/4/a0701e/a0701e00.htm.
- Freitas, G.; Veloso, T.; Chipman, K. US Edged Out by Brazil Beef Fat Destined for Biofuels. Energy Connects. (accessed 2024-10-03).
- Gaveau, D. L. A.; Locatelli, B.; Salim, M. A.; Husnayaen; Manurung, T.; Descals, A.; Angelsen, A.; Meijaard, E.; Sheil, D. Slowing Deforestation in Indonesia Follows Declining Oil Palm Expansion and Lower Oil Prices. PLOS ONE 2022, 17 (3), e0266178. [CrossRef]
- RSPO. Impact Update 2023, RSPO; 2023. https://rspo.org/wp-content/uploads/Impact-Update-2023_.pdf.
- Loh. Biogas Capturing Facilities in Palm Oil Mills: Current Status and Way Forward—PALM OIL ENGINEERING BULLETIN. http://poeb.mpob.gov.my/biogas-capturing-facilities-in-palm-oil-mills-current-status-and-way-forward/ (accessed 2024-03-26).
- Environment Protection Department (EPD), et Sabah. « GUIDELINE ON WASTE MANAGEMENT(EFFLUENT AND SOLID WASTES) FOR PALM OIL MILLS IN SABAH », 2022.
- Lee, U.; Kwon, H.; Wu, M.; Wang, M. Retrospective Analysis of the U.S. Corn Ethanol Industry for 2005–2019: Implications for Greenhouse Gas Emission Reductions. Biofuels, Bioproducts and Biorefining 2021, 15 (5), 1318–1331. [CrossRef]
- Edwards, R.; Padella, M.; Giuntoli, J.; Koeble, R.; O’, C. A. P.; Bulgheroni, C.; Marelli, L. Definition of input data to assess GHG default emissions from biofuels in EU legislation: Version 1c—July 2017. JRC Publications Repository. [CrossRef]
- IEA BioEnergy. Comparison of Biofuel Life Cycle Analysis Tools—Phase 2, Part 1: FAME and HVO/HEFA; 2018. https://www.ieabioenergy.com/wp-content/uploads/2019/07/Task-39-CTBE-biofuels-LCA-comparison-Final-Report-Phase-2-Part-1-February-11-2019.pdf.
- Staples, M. D.; Malina, R.; Barrett, S. R. H. The Limits of Bioenergy for Mitigating Global Life-Cycle Greenhouse Gas Emissions from Fossil Fuels. Nat Energy 2017, 2 (2), 1–8. [CrossRef]
- Staples, M. D.; Malina, R.; Suresh, P.; Hileman, J. I.; Barrett, S. R. H. Aviation CO2 Emissions Reductions from the Use of Alternative Jet Fuels. Energy Policy 2018, 114, 342–354. [CrossRef]
- de Oliveira, C. C. N.; Angelkorte, G.; Rochedo, P. R. R.; Szklo, A. The Role of Biomaterials for the Energy Transition from the Lens of a National Integrated Assessment Model. Climatic Change 2021, 167 (3), 57. [CrossRef]
- de Oliveira, C. C. N.; Zotin, M. Z.; Rochedo, P. R. R.; Szklo, A. Achieving Negative Emissions in Plastics Life Cycles through the Conversion of Biomass Feedstock. Biofuels, Bioproducts and Biorefining 2021, 15 (2), 430–453. [CrossRef]
- Air Liquide, 2022. Profits without subsidies ? https://engineering.airliquide.com/sites/engineering/files/2022-07/air_liquide_biodiesel_final.pdf (accessed 2024-10-12).
- Dutta, Abhijit, Asad Sahir, et Eric Tan. « Process Design and Economics for the Conversion of Lignocellulosic Biomass to Hydrocarbon Fuels: Thermochemical Research Pathways with In Situ and Ex Situ Upgrading of Fast Pyrolysis Vapors », s. d., 275.
- Swanson, R. M., A. Platon, J. A. Satrio, R. C. Brown, et D. D. Hsu. « Techno-Economic Analysis of Biofuels Production Based on Gasification », 1 novembre 2010. [CrossRef]
- Irwin, Scott. « Biodiesel Prices and Profits…Again ». Farmdoc Daily 14, no 49 (11 mars 2024). https://farmdocdaily.illinois.edu/2024/03/biodiesel-prices-and-profits-again.html.
- EA Energy. Will more wind and solar PV capacity lead to more generation curtailment?—Renewable Energy Market Update—June 2023—Analysis. IEA. https://www.iea.org/reports/renewable-energy-market-update-june-2023/will-more-wind-and-solar-pv-capacity-lead-to-more-generation-curtailment (accessed 2024-08-05).
- Ritchie, H., Rosado, P. and Roser, M. (2023)—“Energy”. Data adapted from Ember, Energy Institute. “Data Page: Carbon intensity of electricity generation”, part of the following publication: Retrieved from https://ourworldindata.org/grapher/carbon-intensity-electricity [online resource].
Figure 1.
Sustainable fuel integration rate impact on selling price.
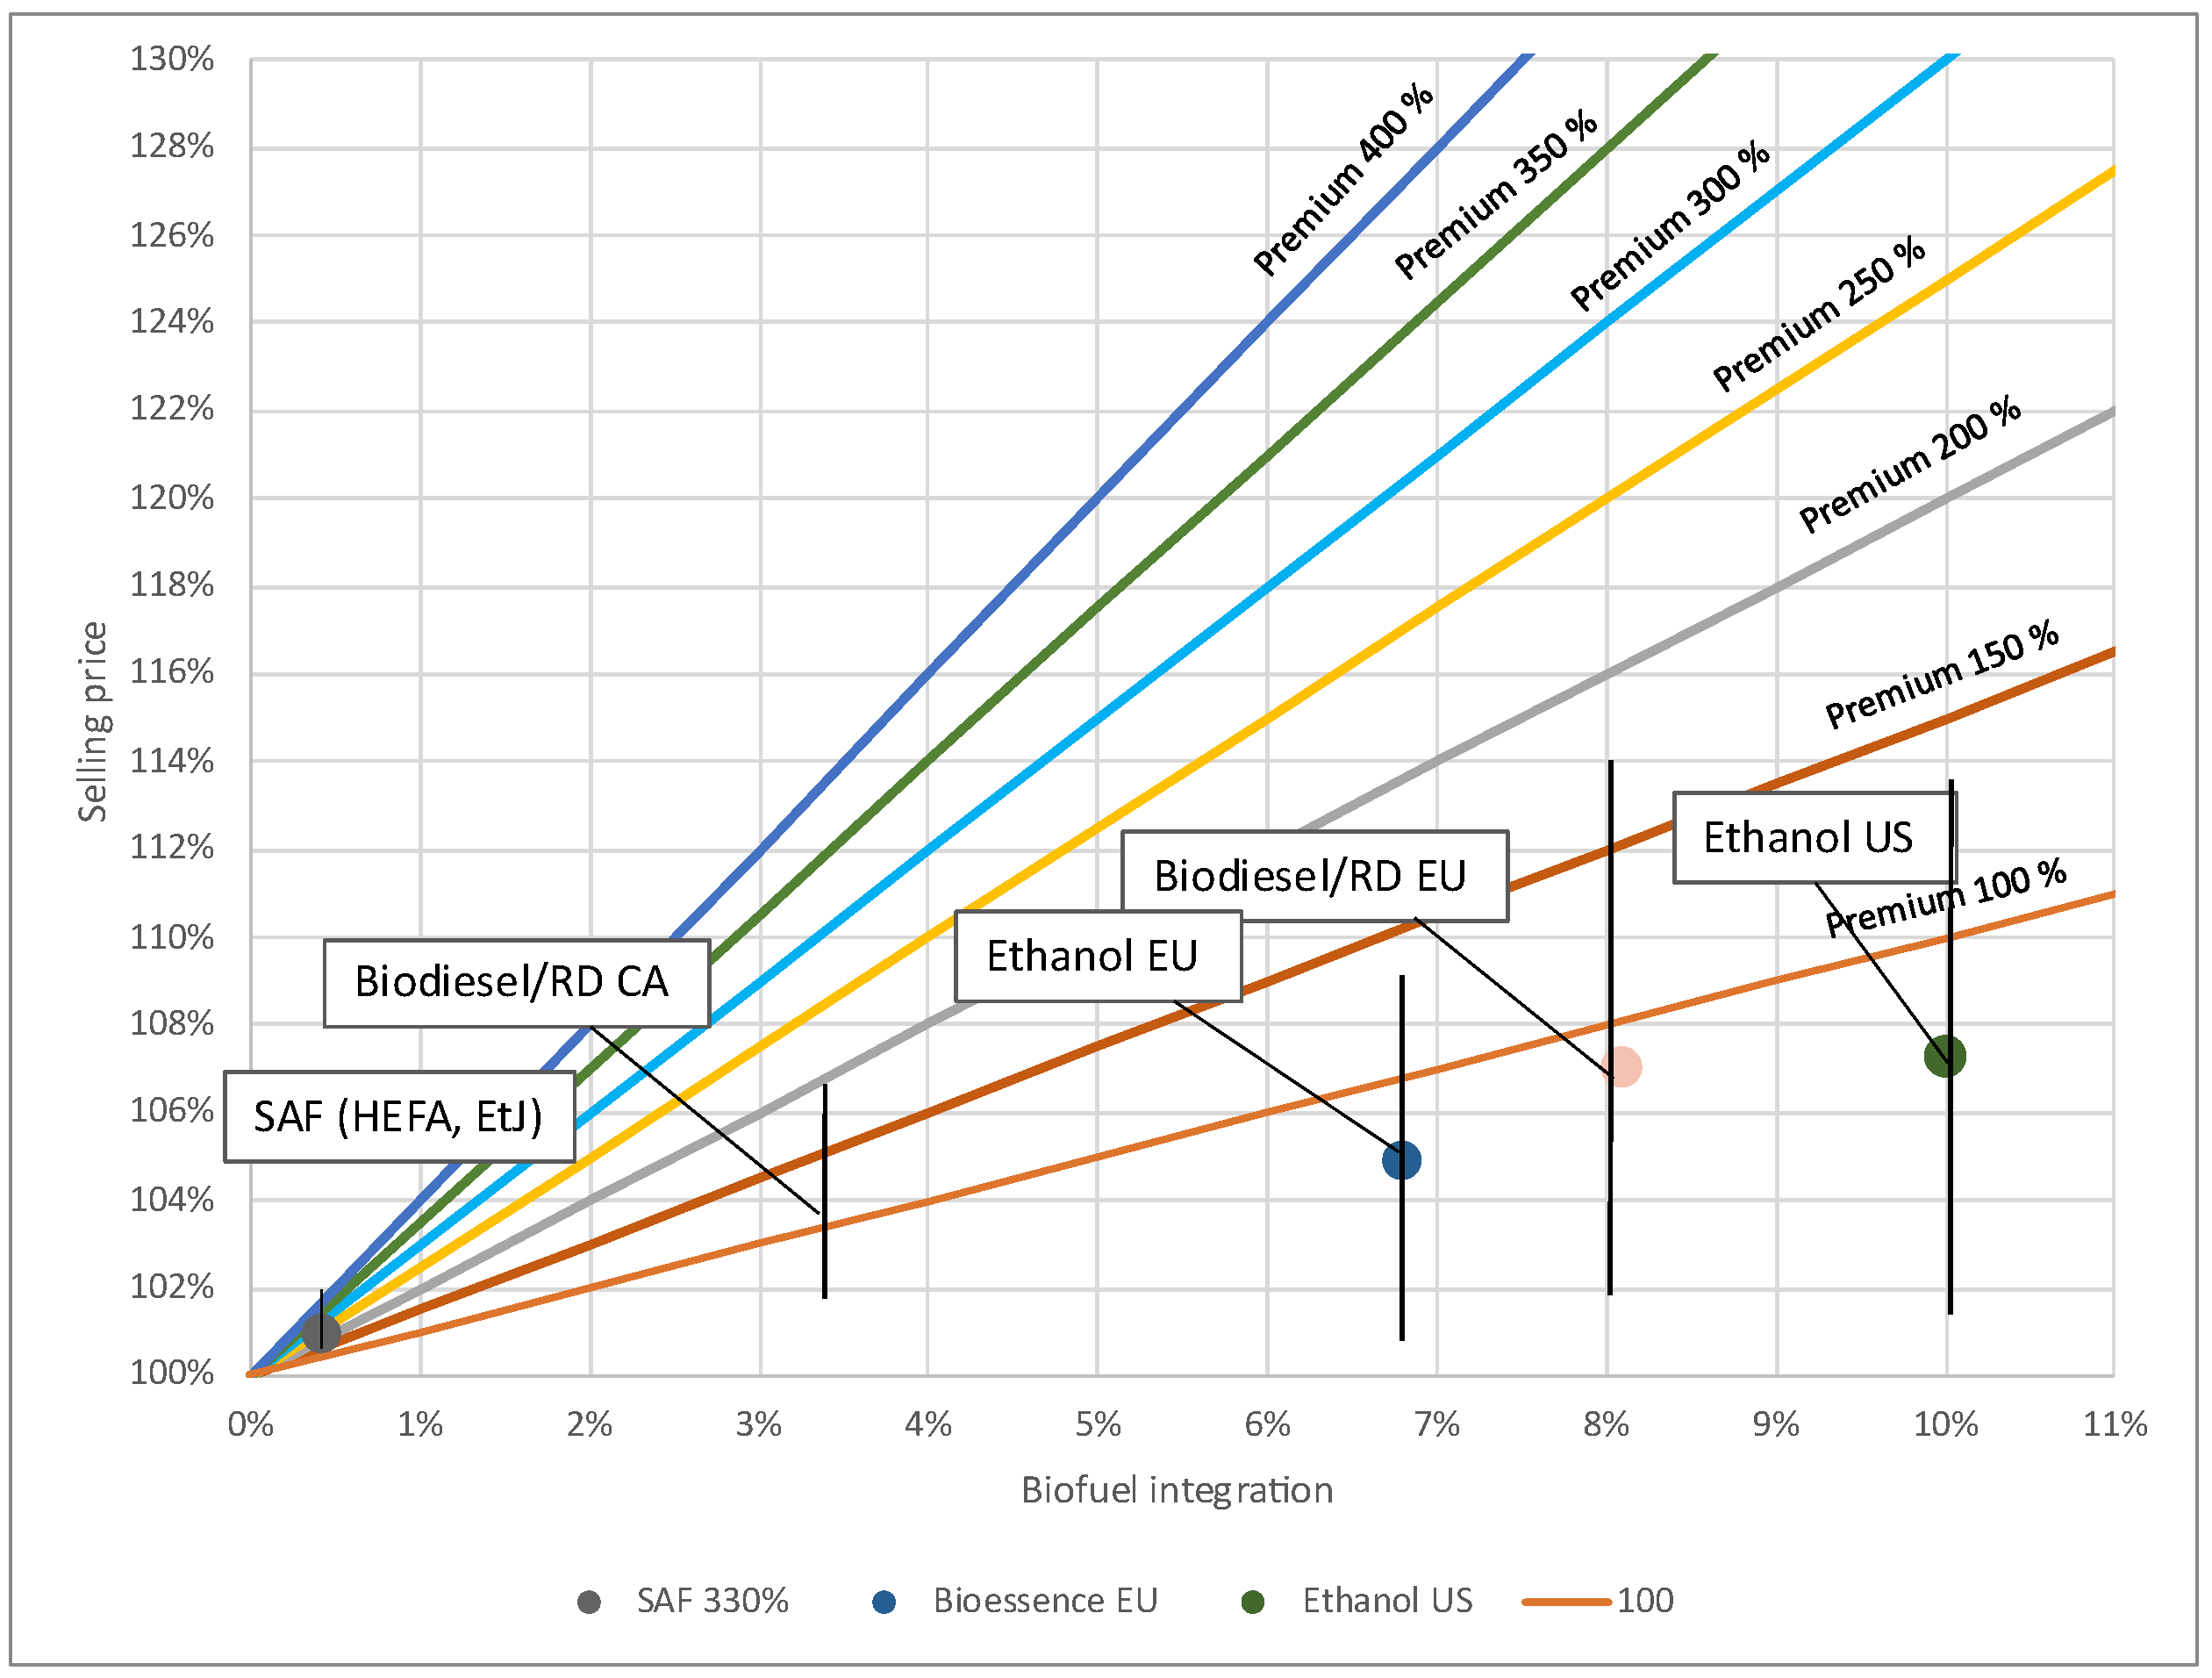
Figure 2.
Soybean RD and SAF compared to fossil diesel and jet fuel.
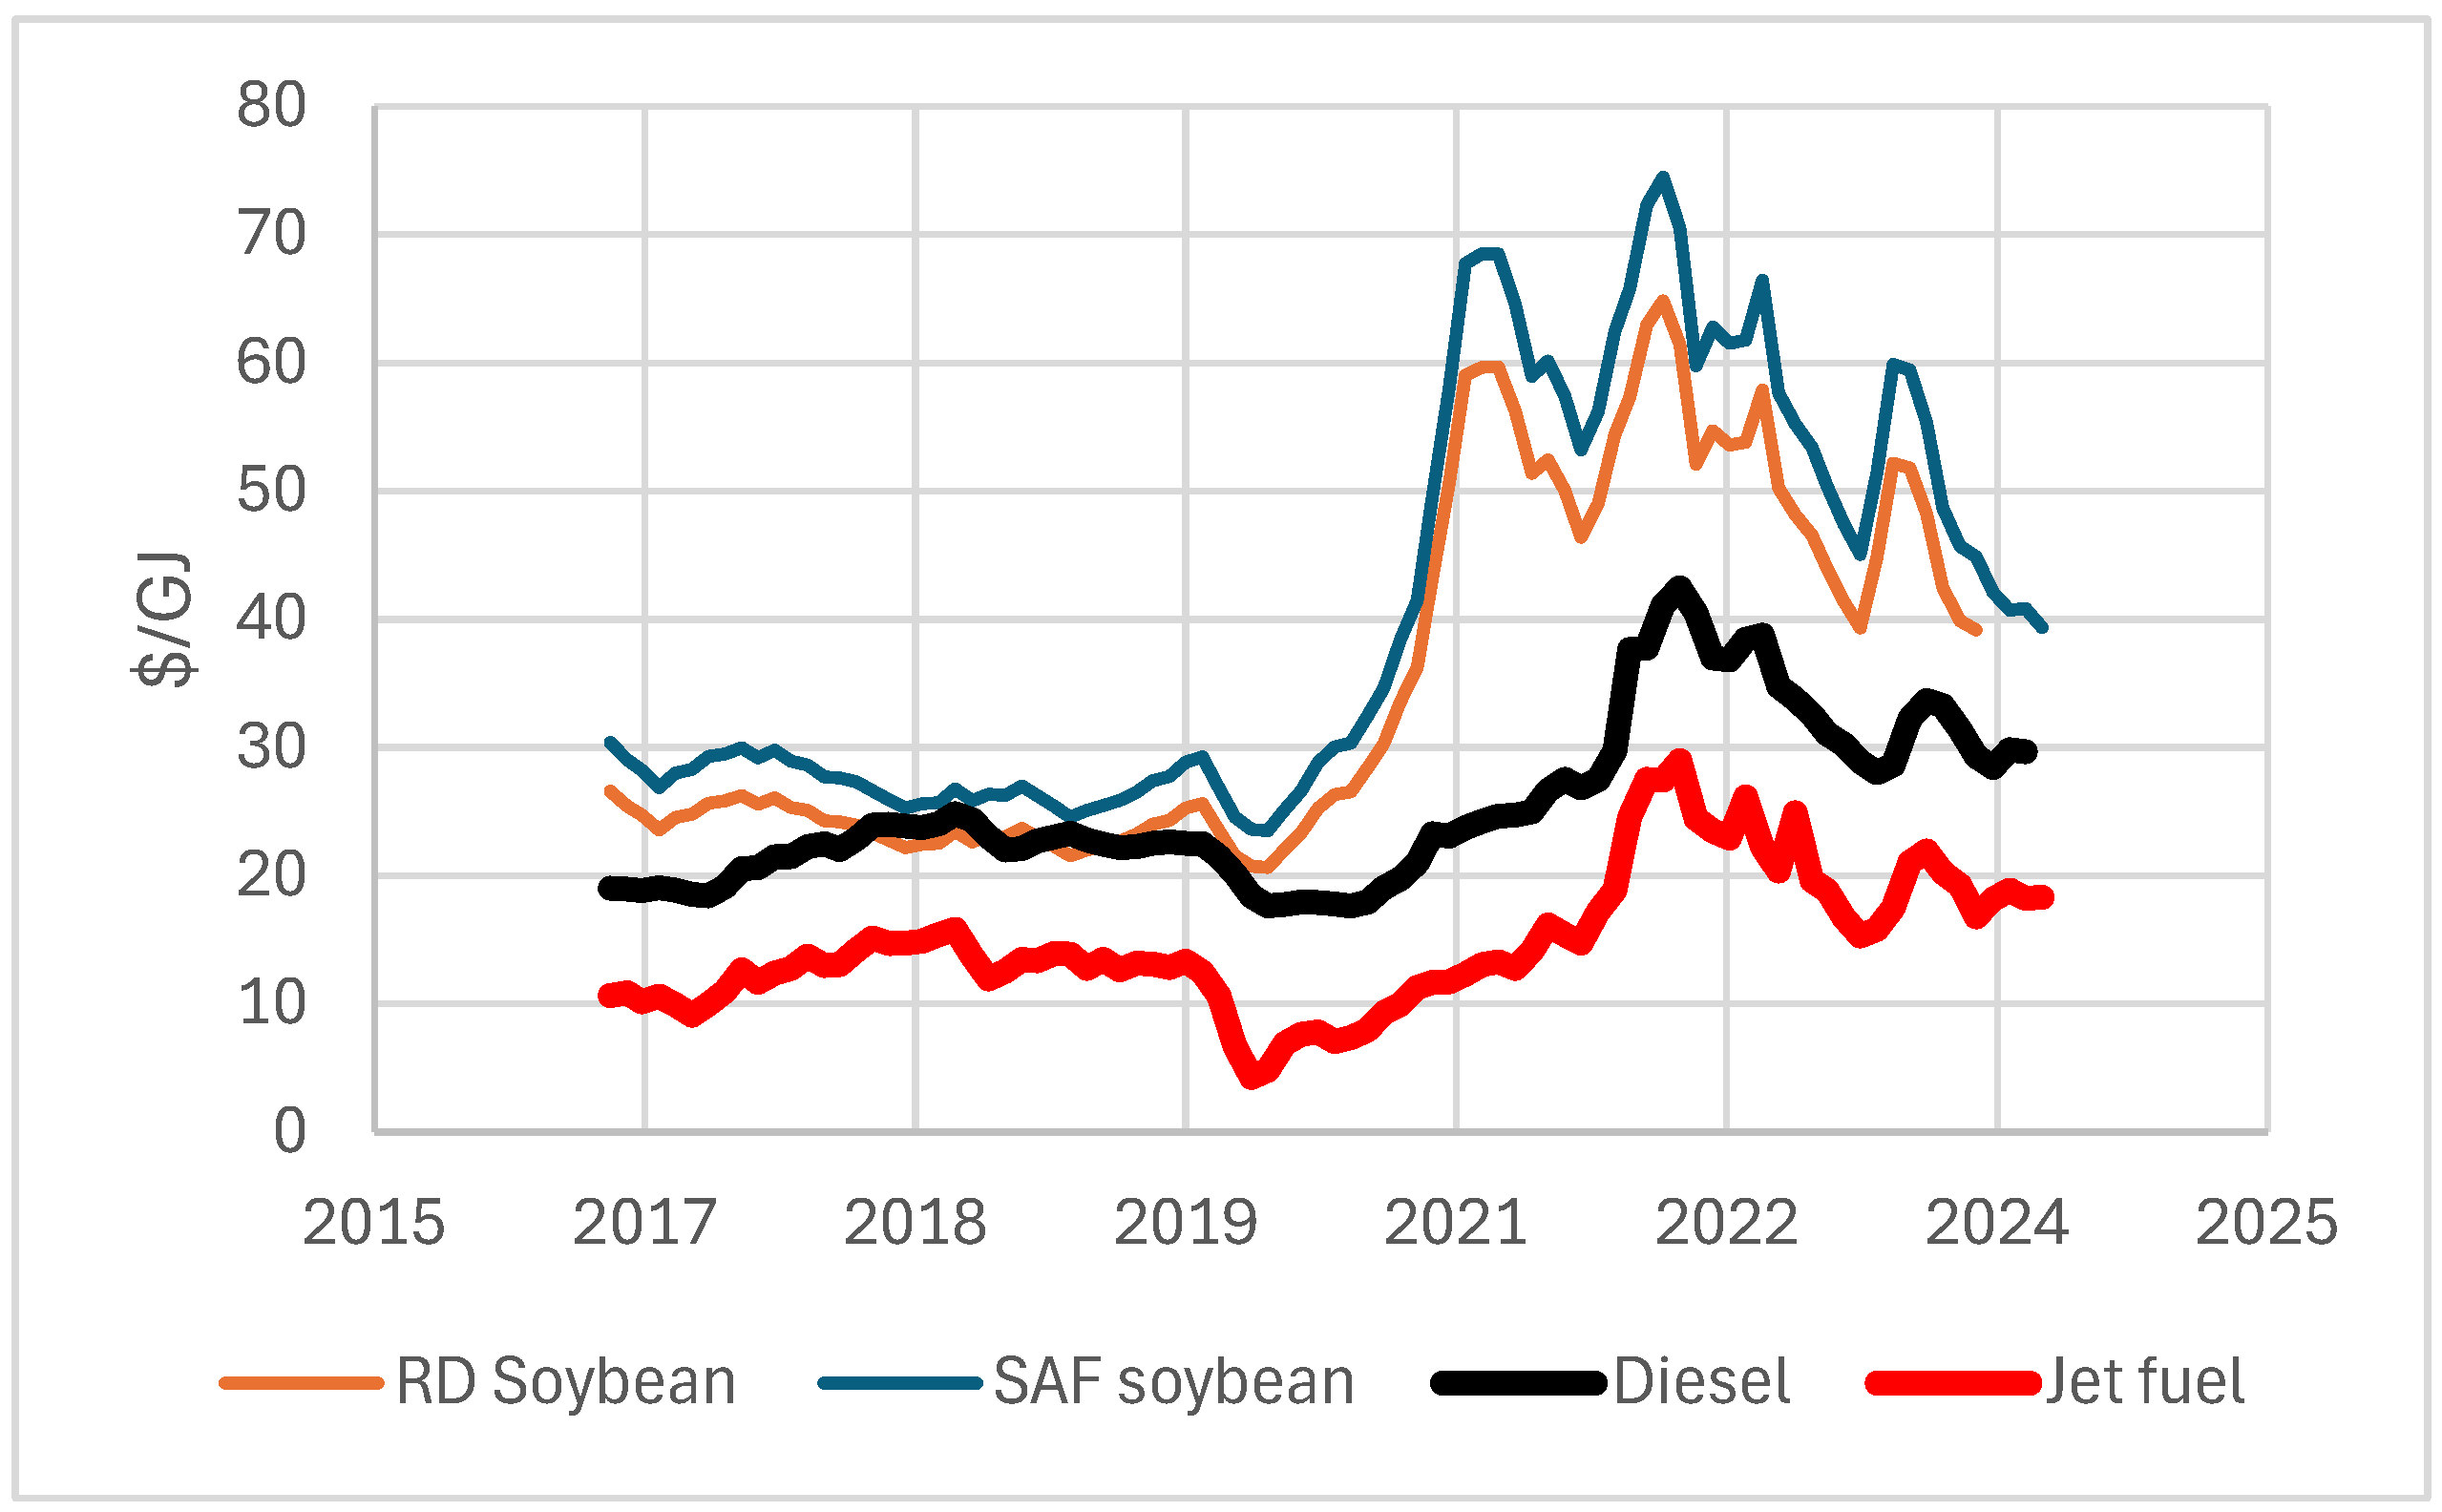
Figure 3.
Resources premium for RD and SAF compared to fossil fuels (diesel and jet).
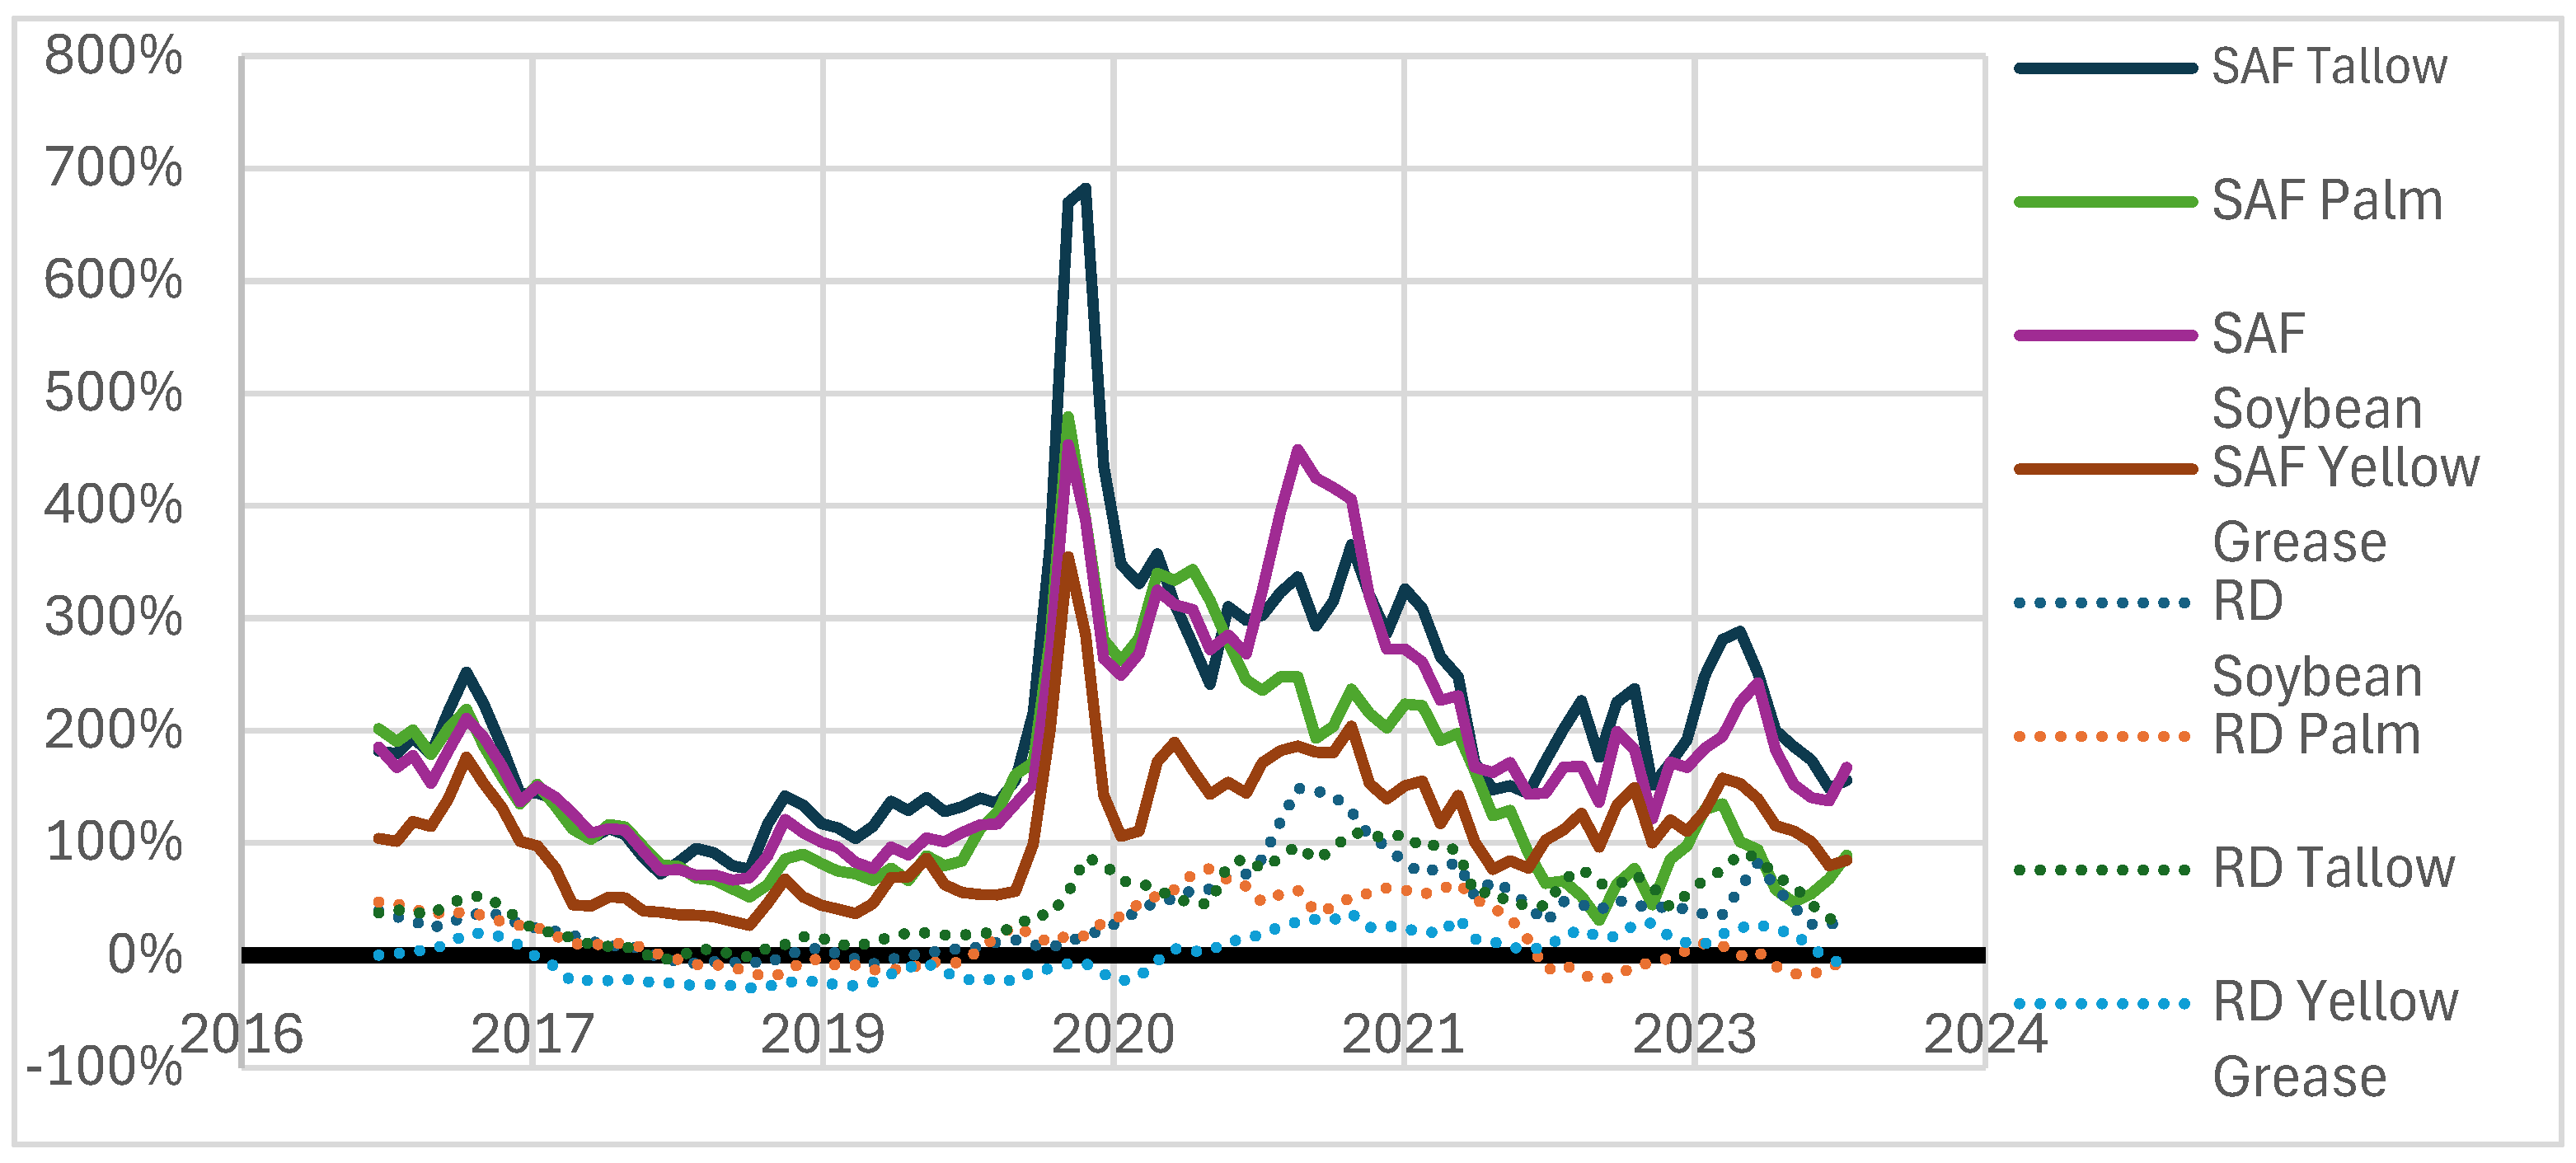
Figure 4.
Resources used for BD and RD in the U.S. [70] and potential cumulative CI if these resources were used for SAF.
Figure 4.
Resources used for BD and RD in the U.S. [70] and potential cumulative CI if these resources were used for SAF.
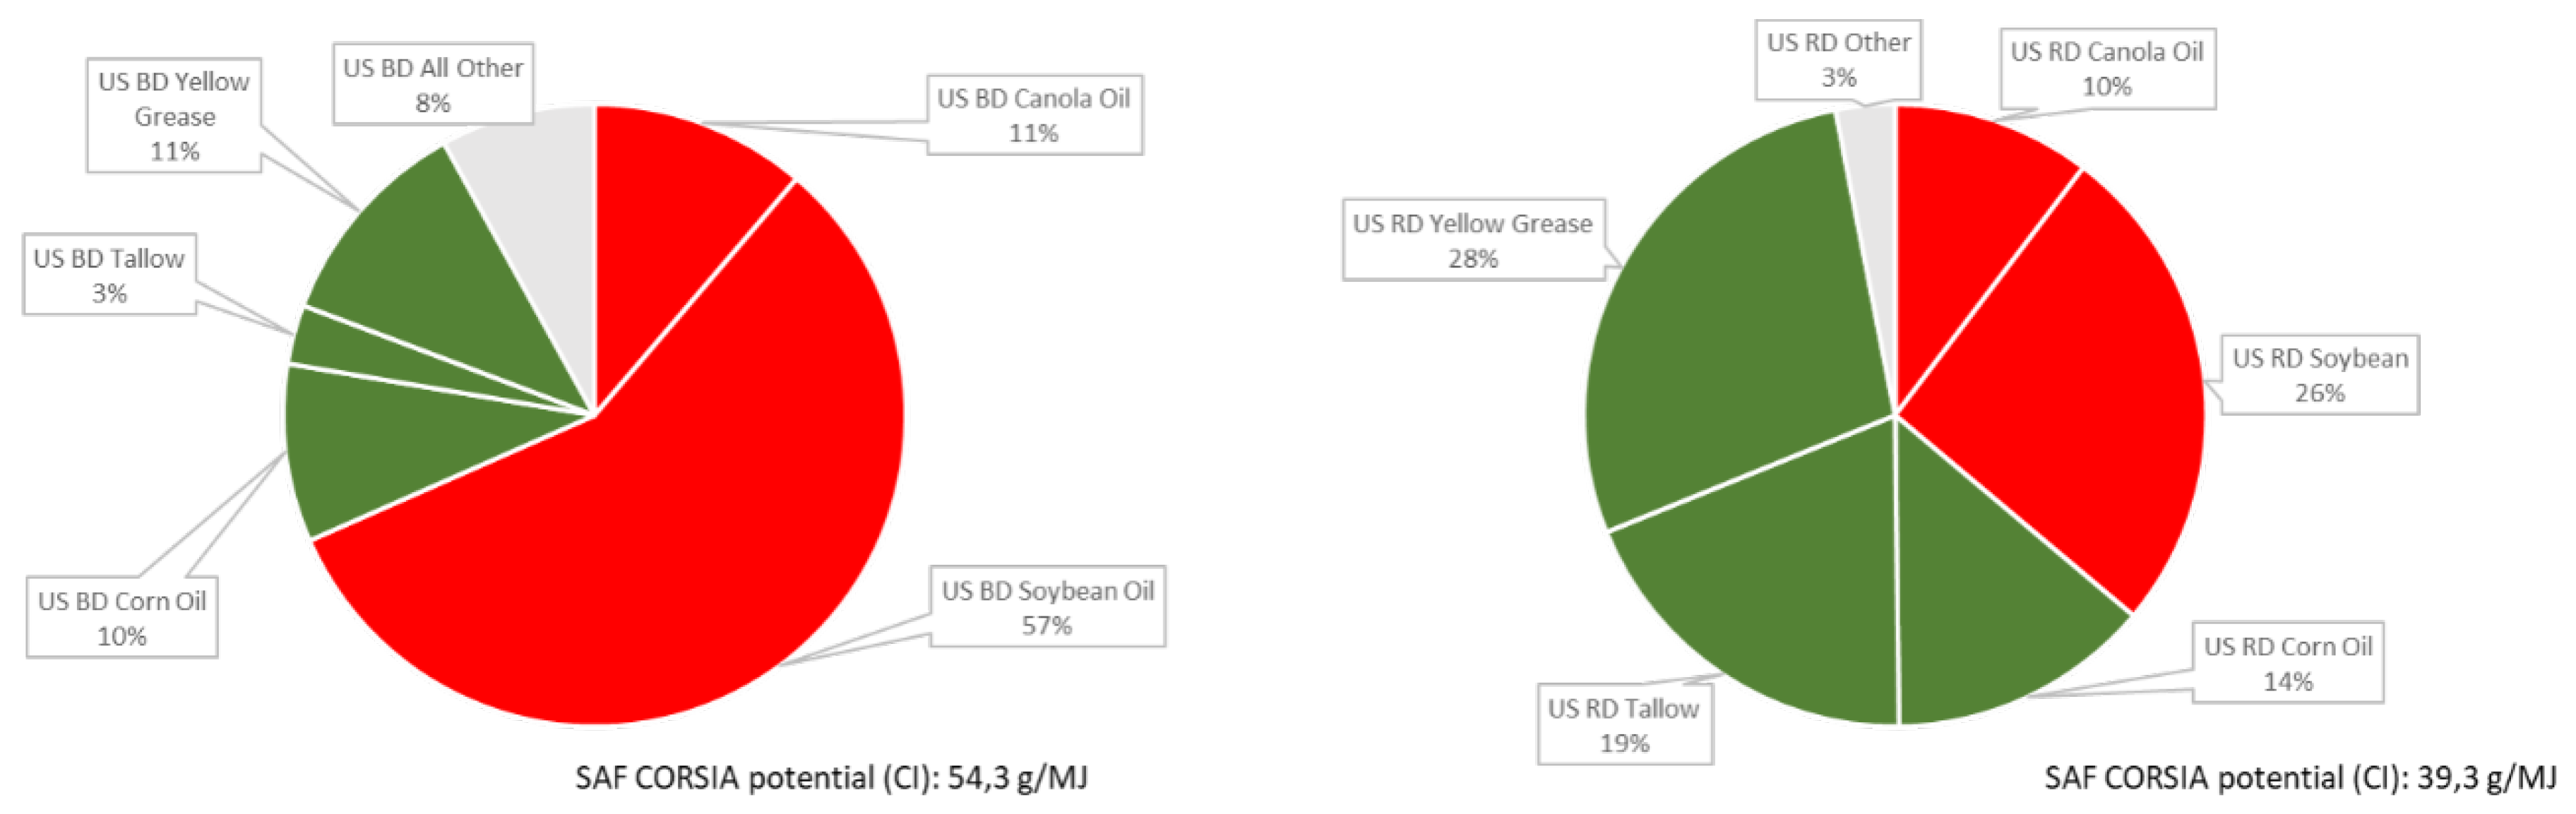
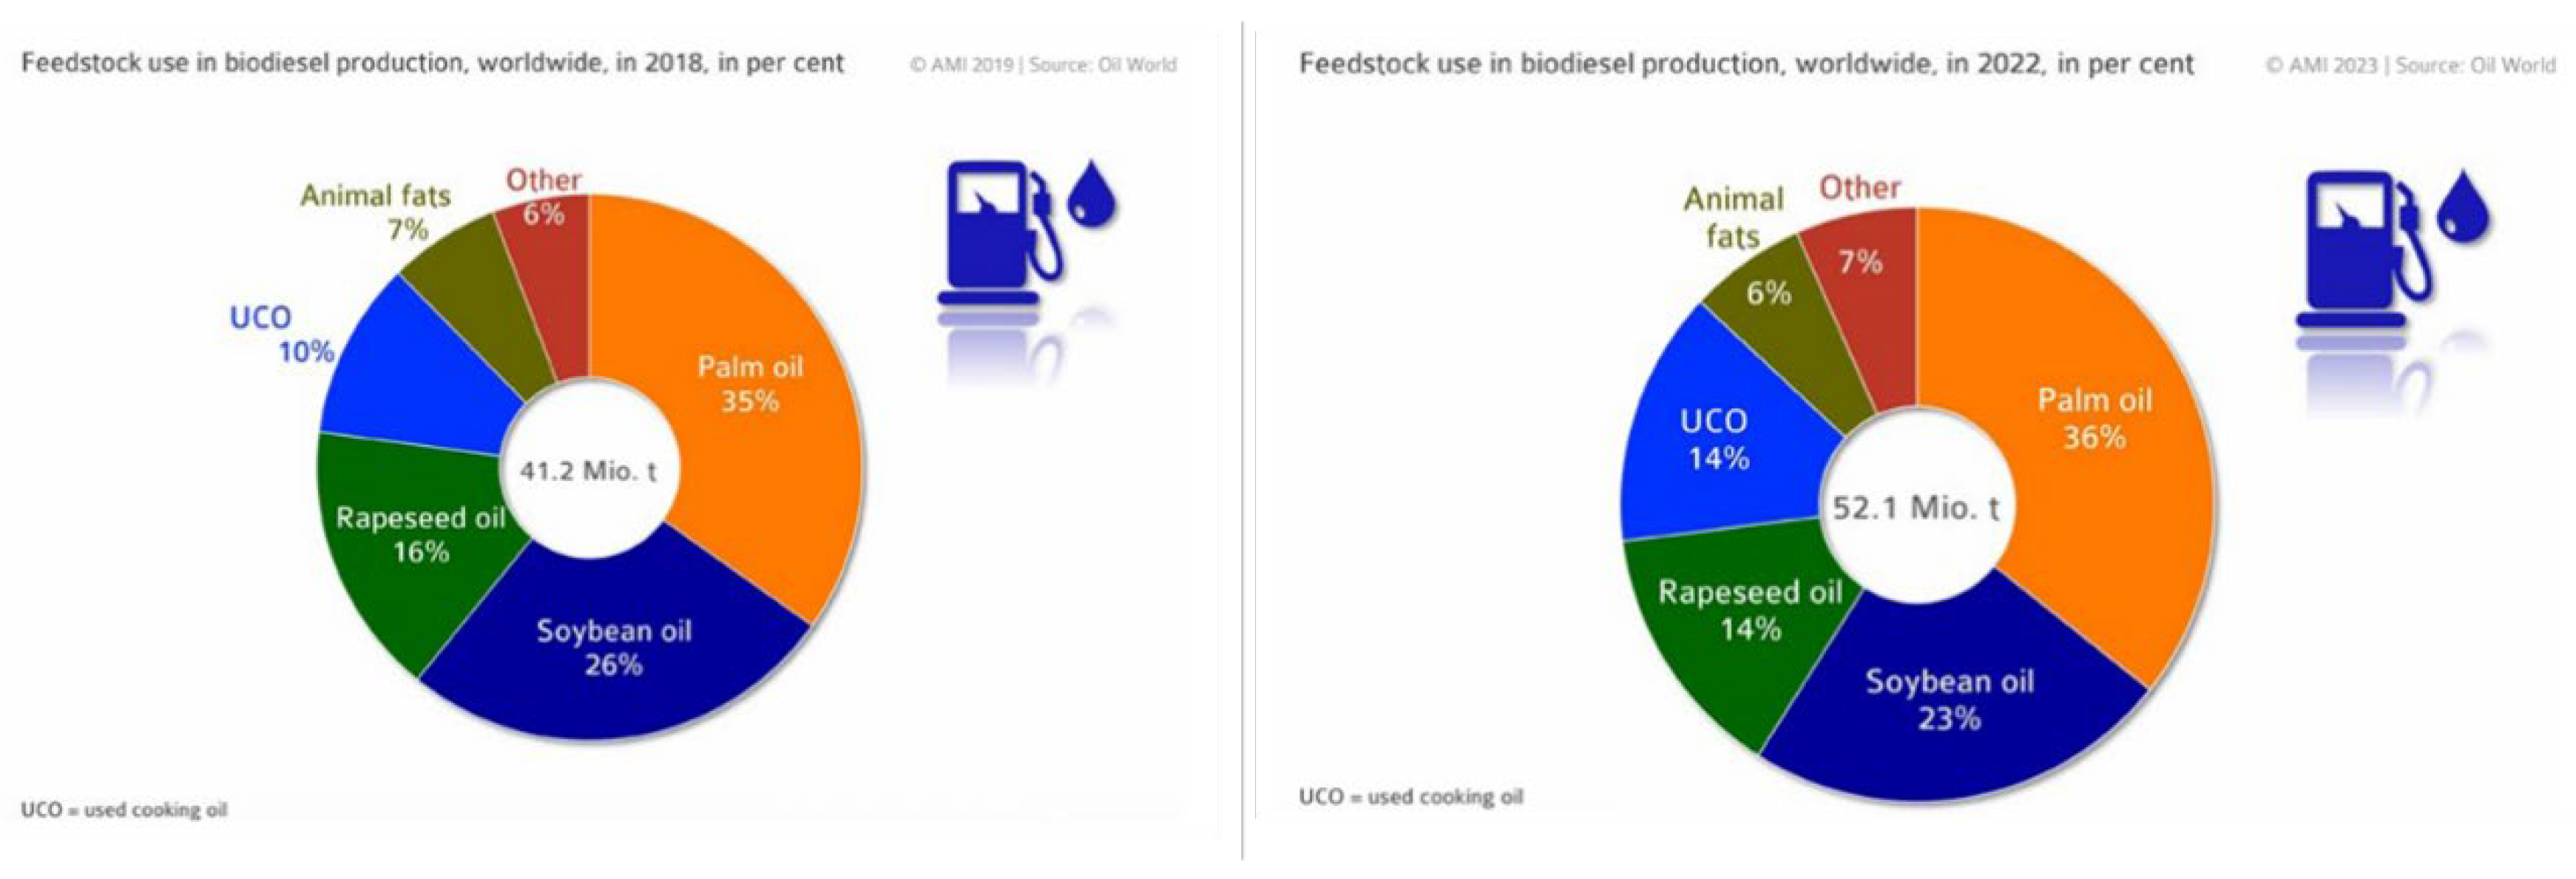
Figure 6.
Effect of yield variations on the carbon intensity of HEFA-tJ pathway from various resources.
Figure 6.
Effect of yield variations on the carbon intensity of HEFA-tJ pathway from various resources.
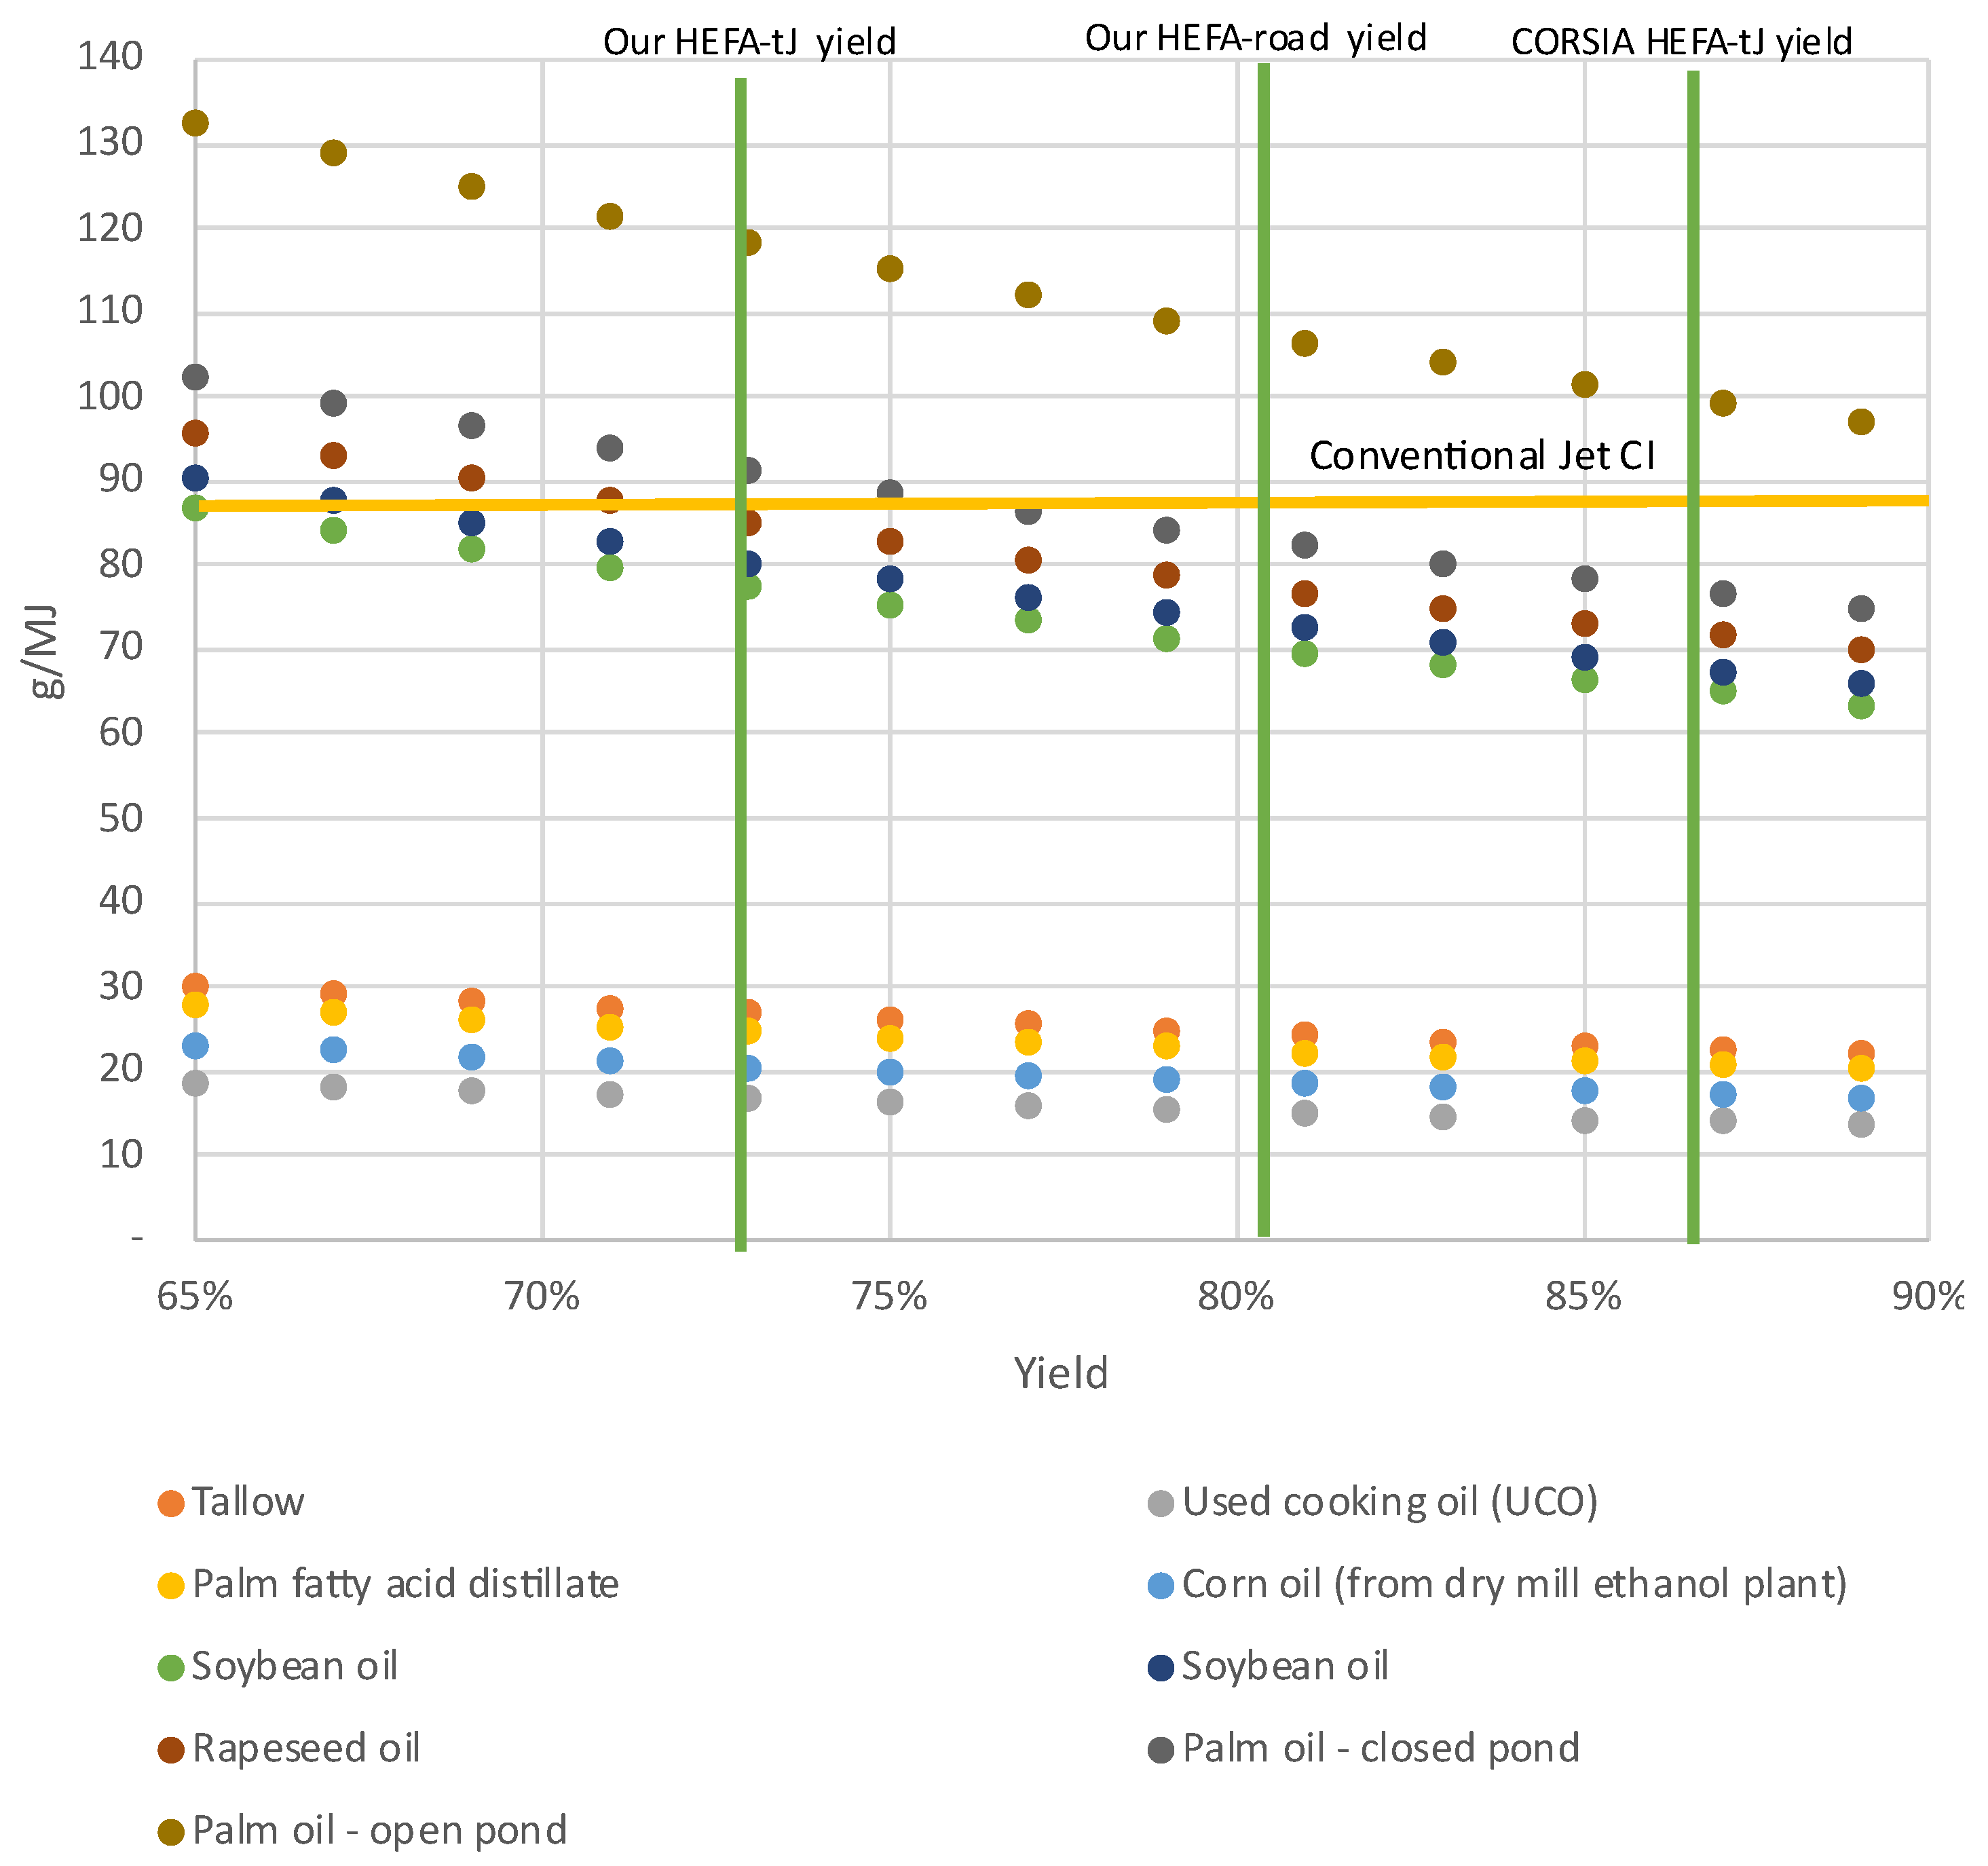
Figure 7.
Carbon intensity evaluation for HEFA-tJ, BD and RD.
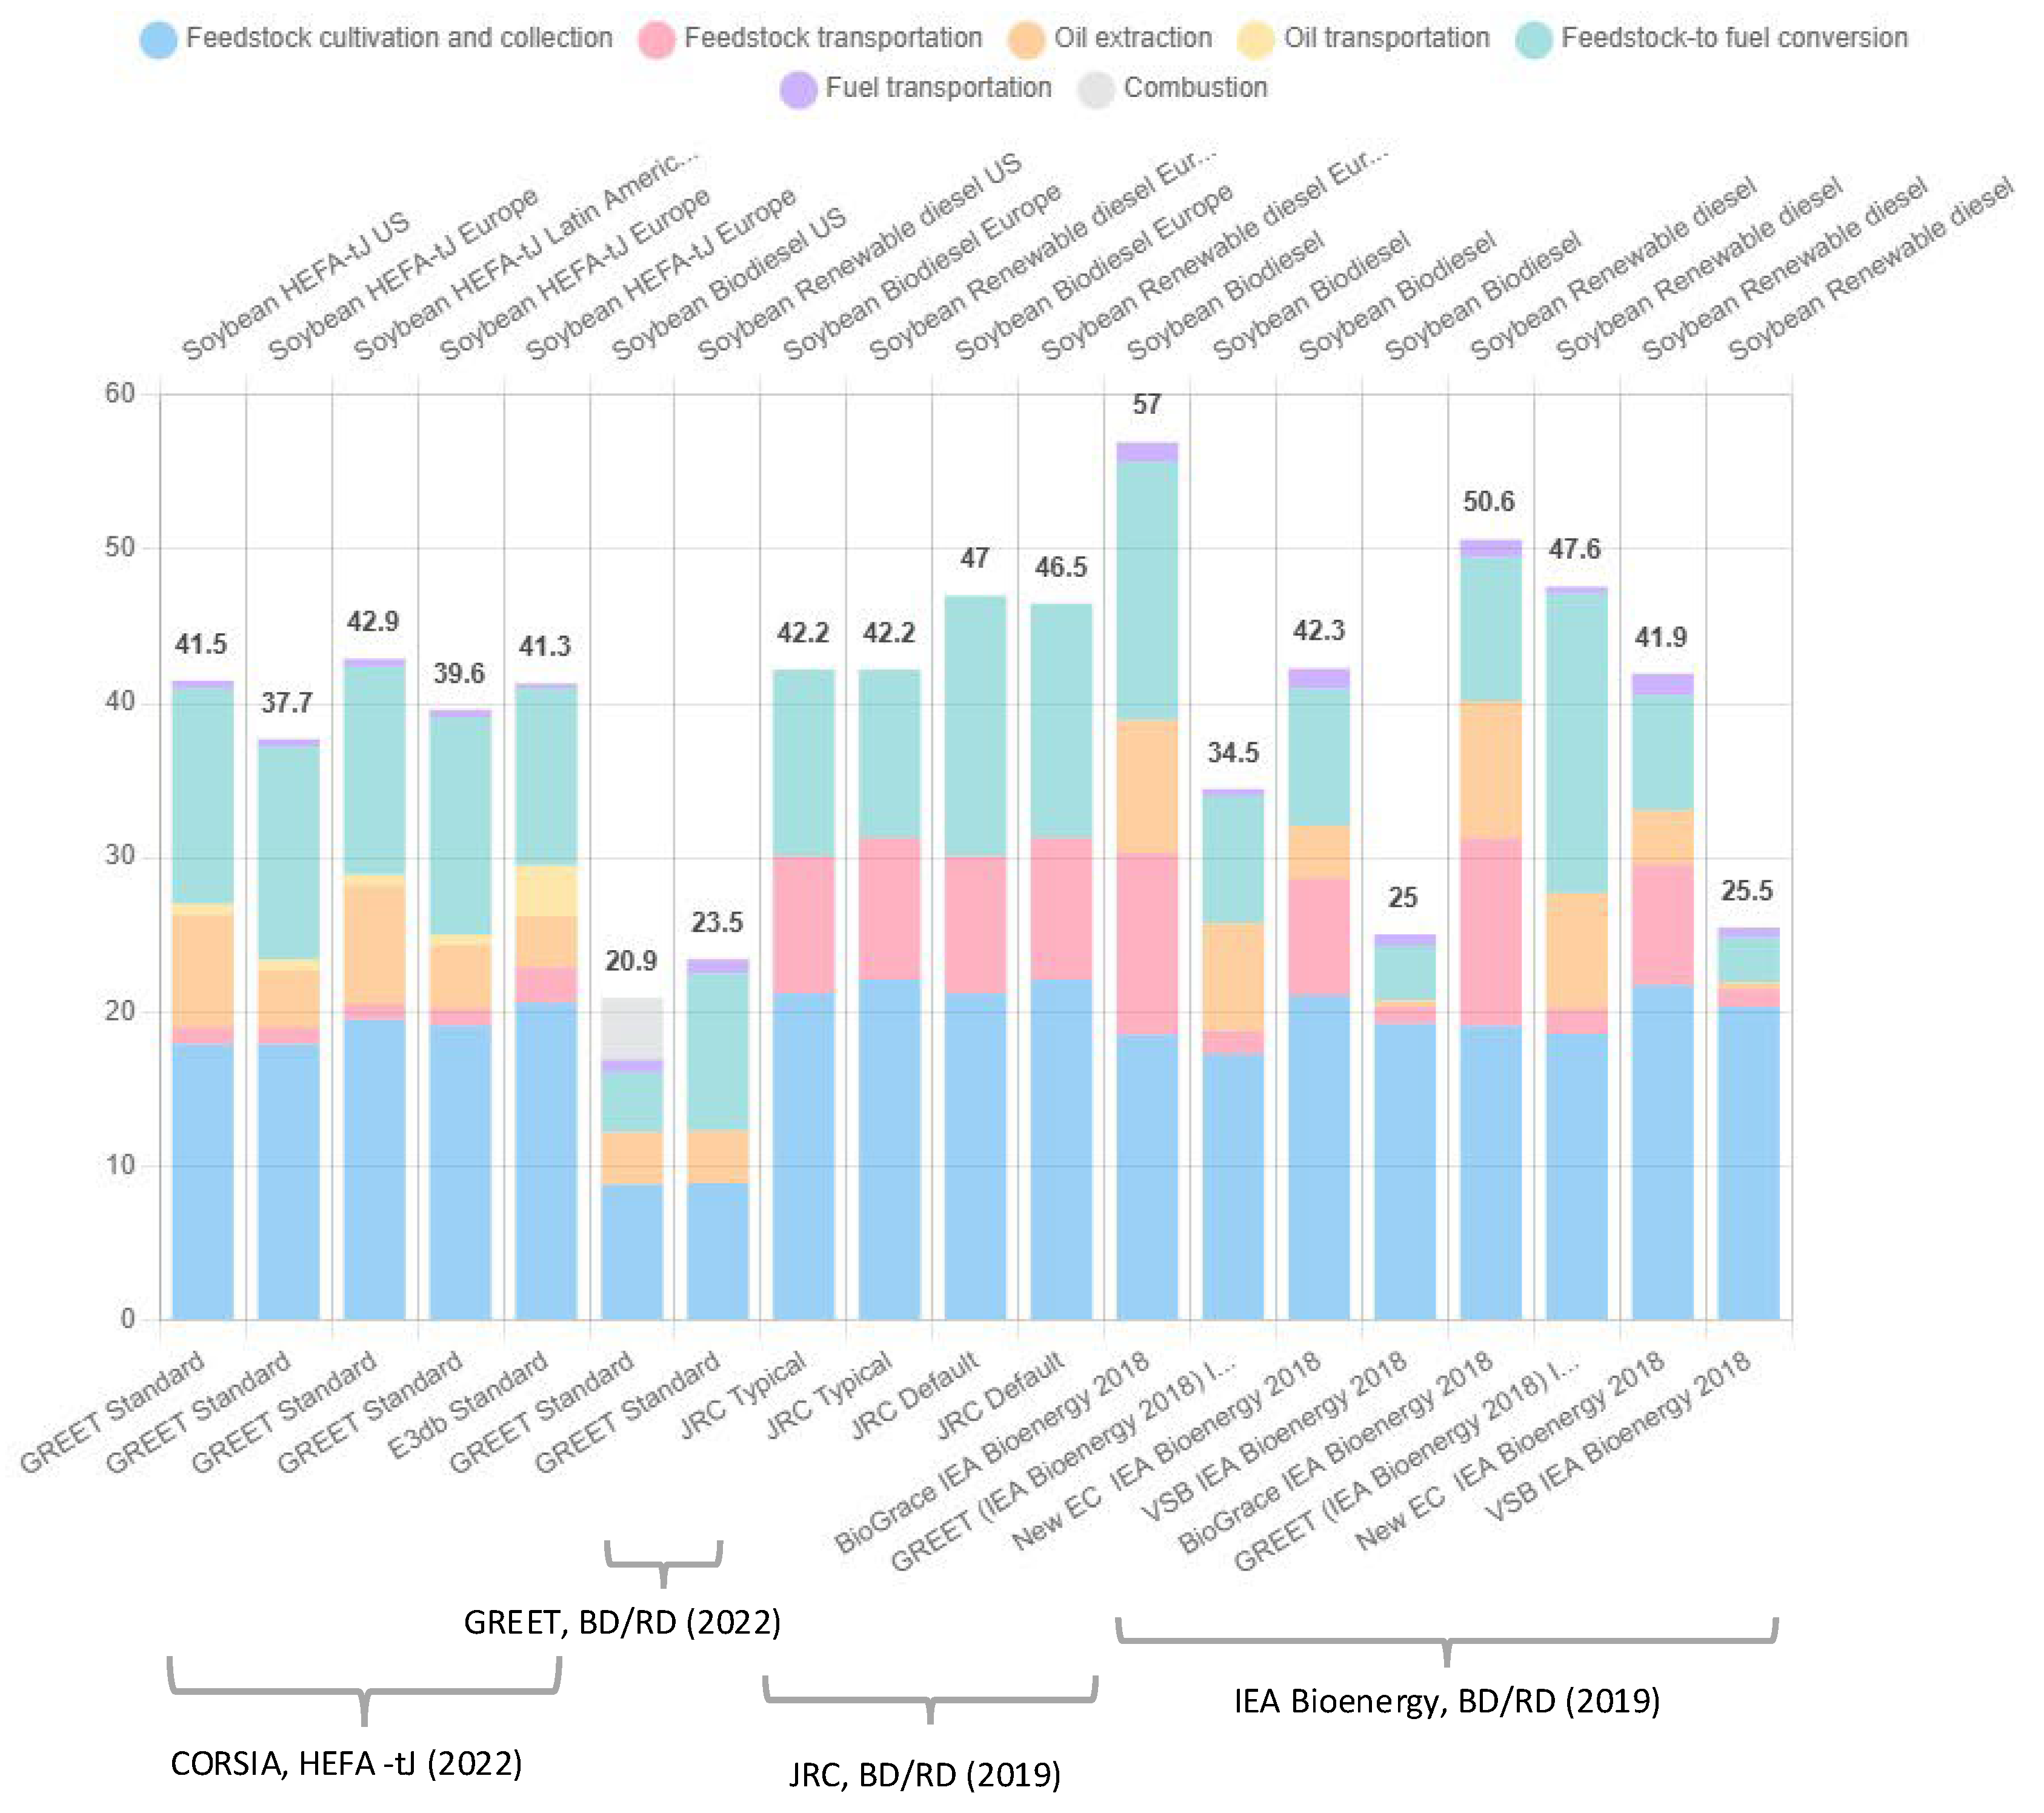
Figure 8.
GHG emissions avoided for HEFA pathways according to yield and resources.
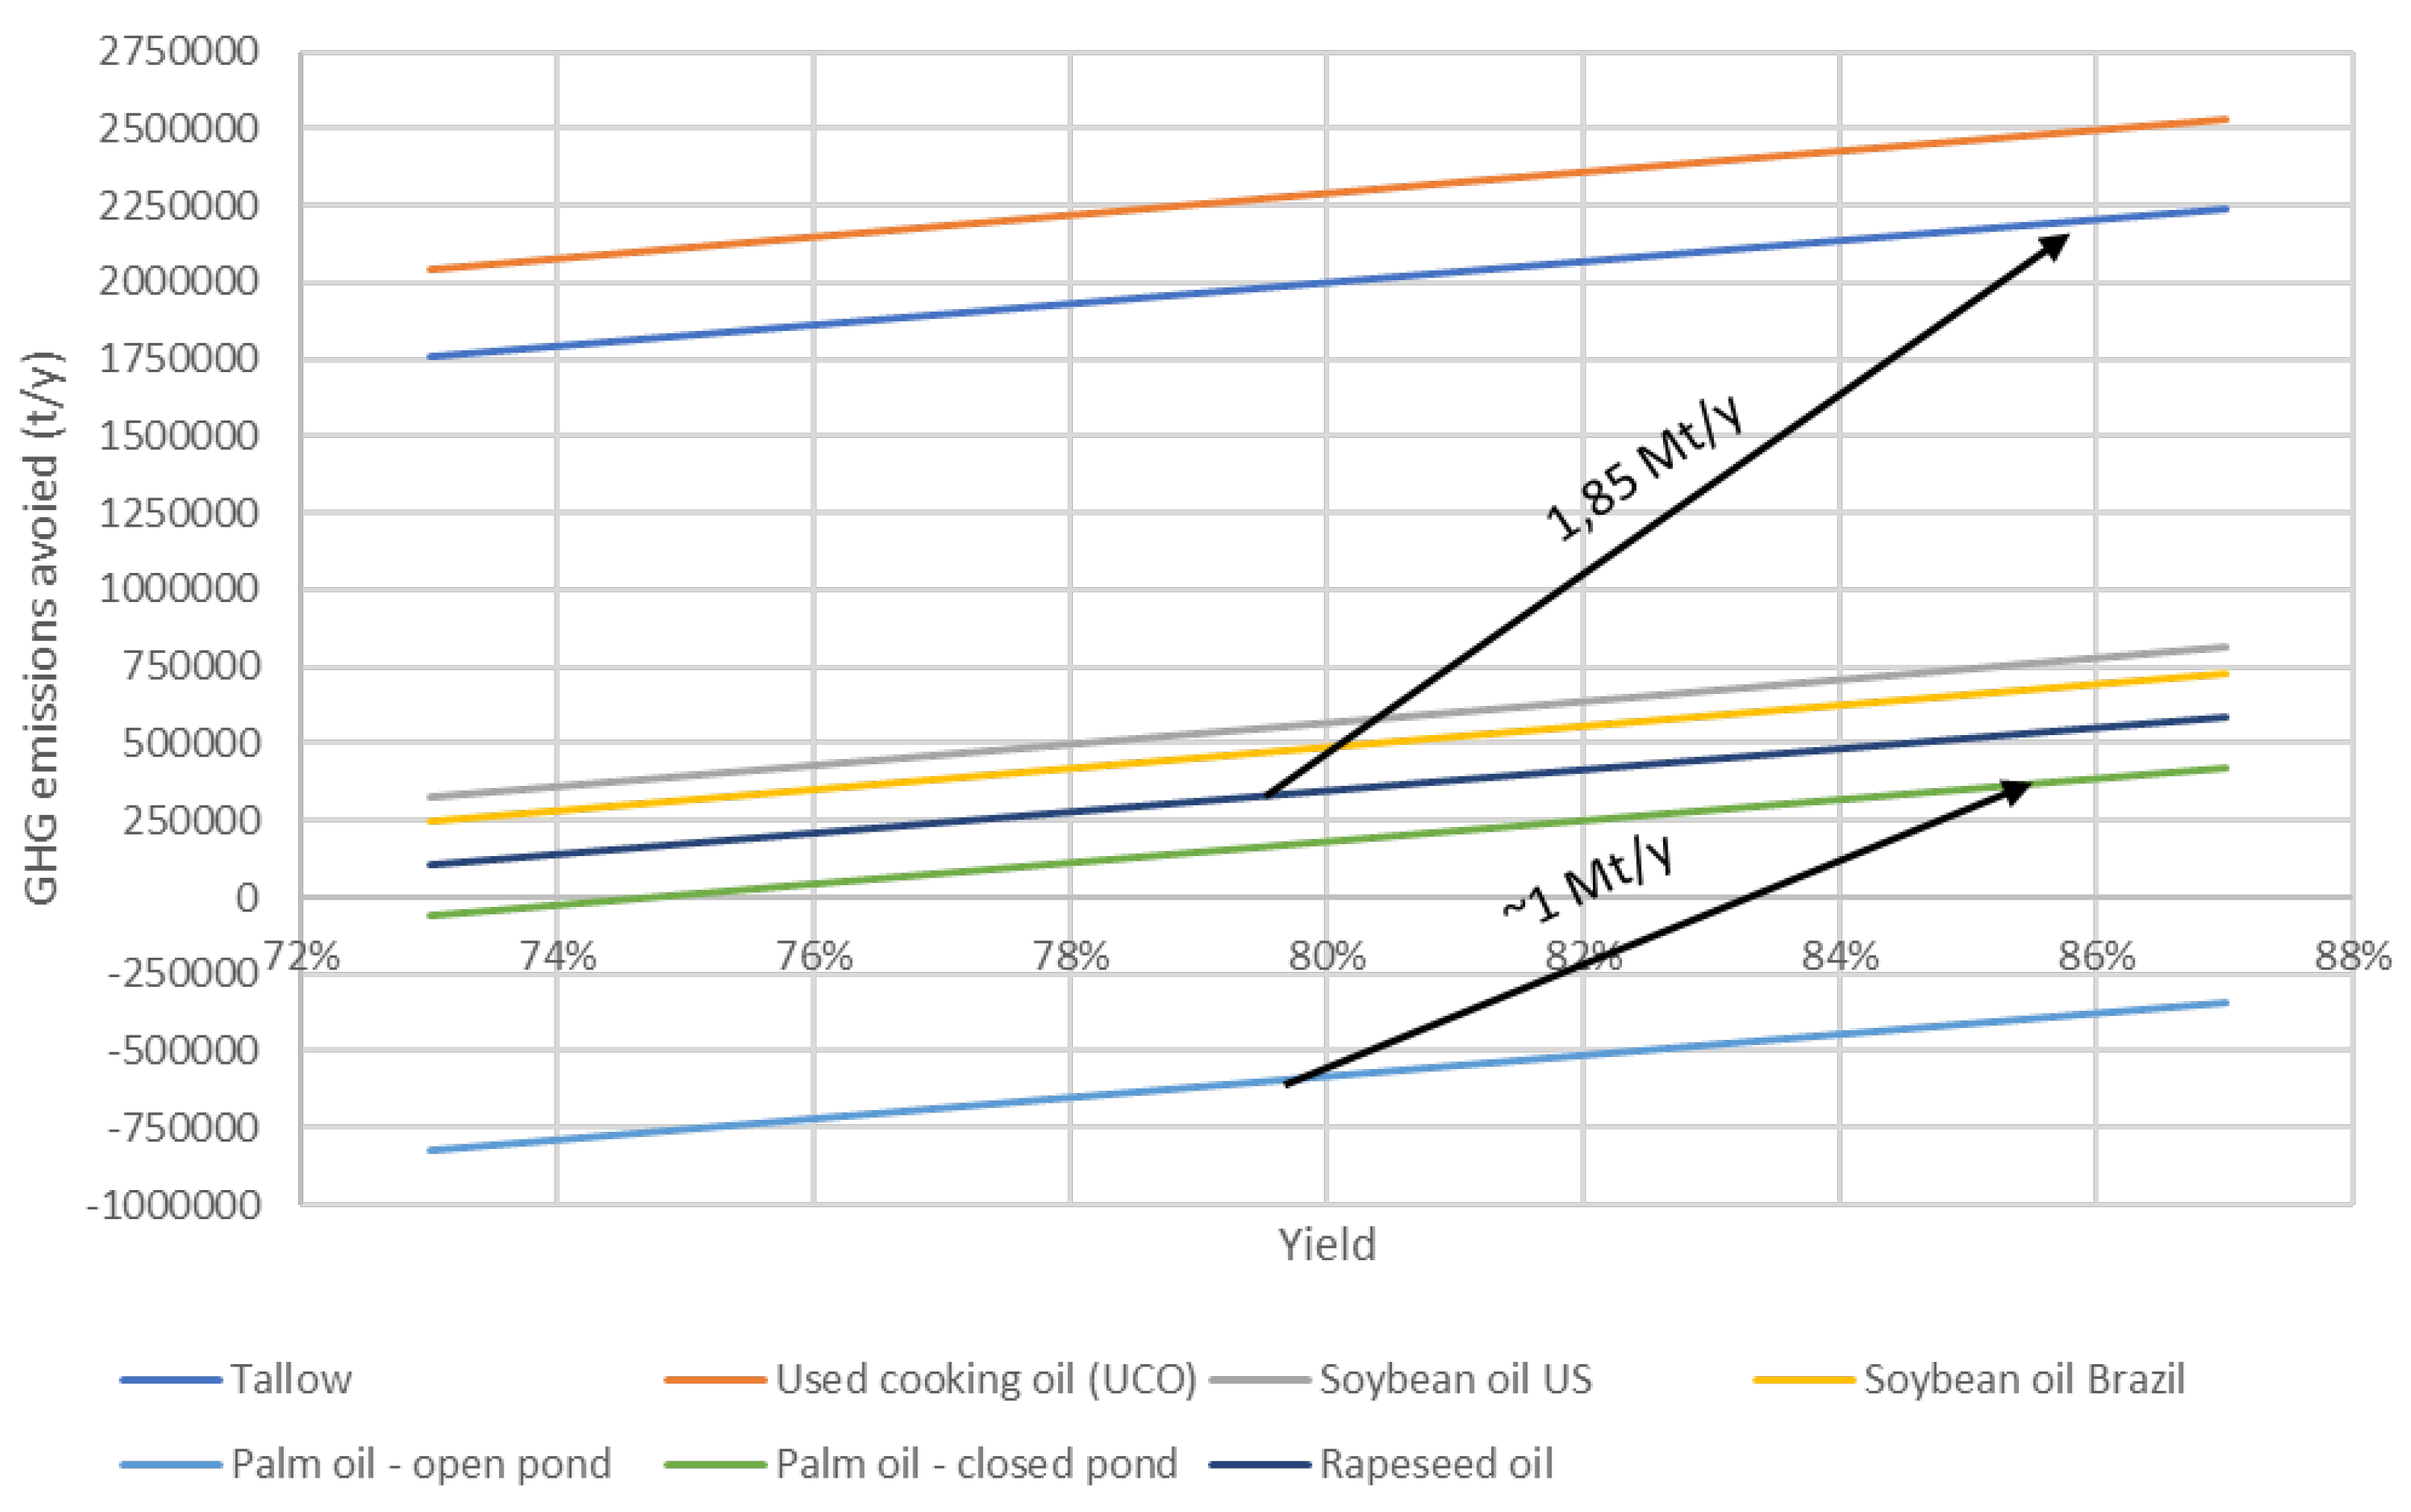
Figure 9.
Social cost ($/t) of GHG reduction for HEFA-tJ, RD, and BD from 2017-2023.
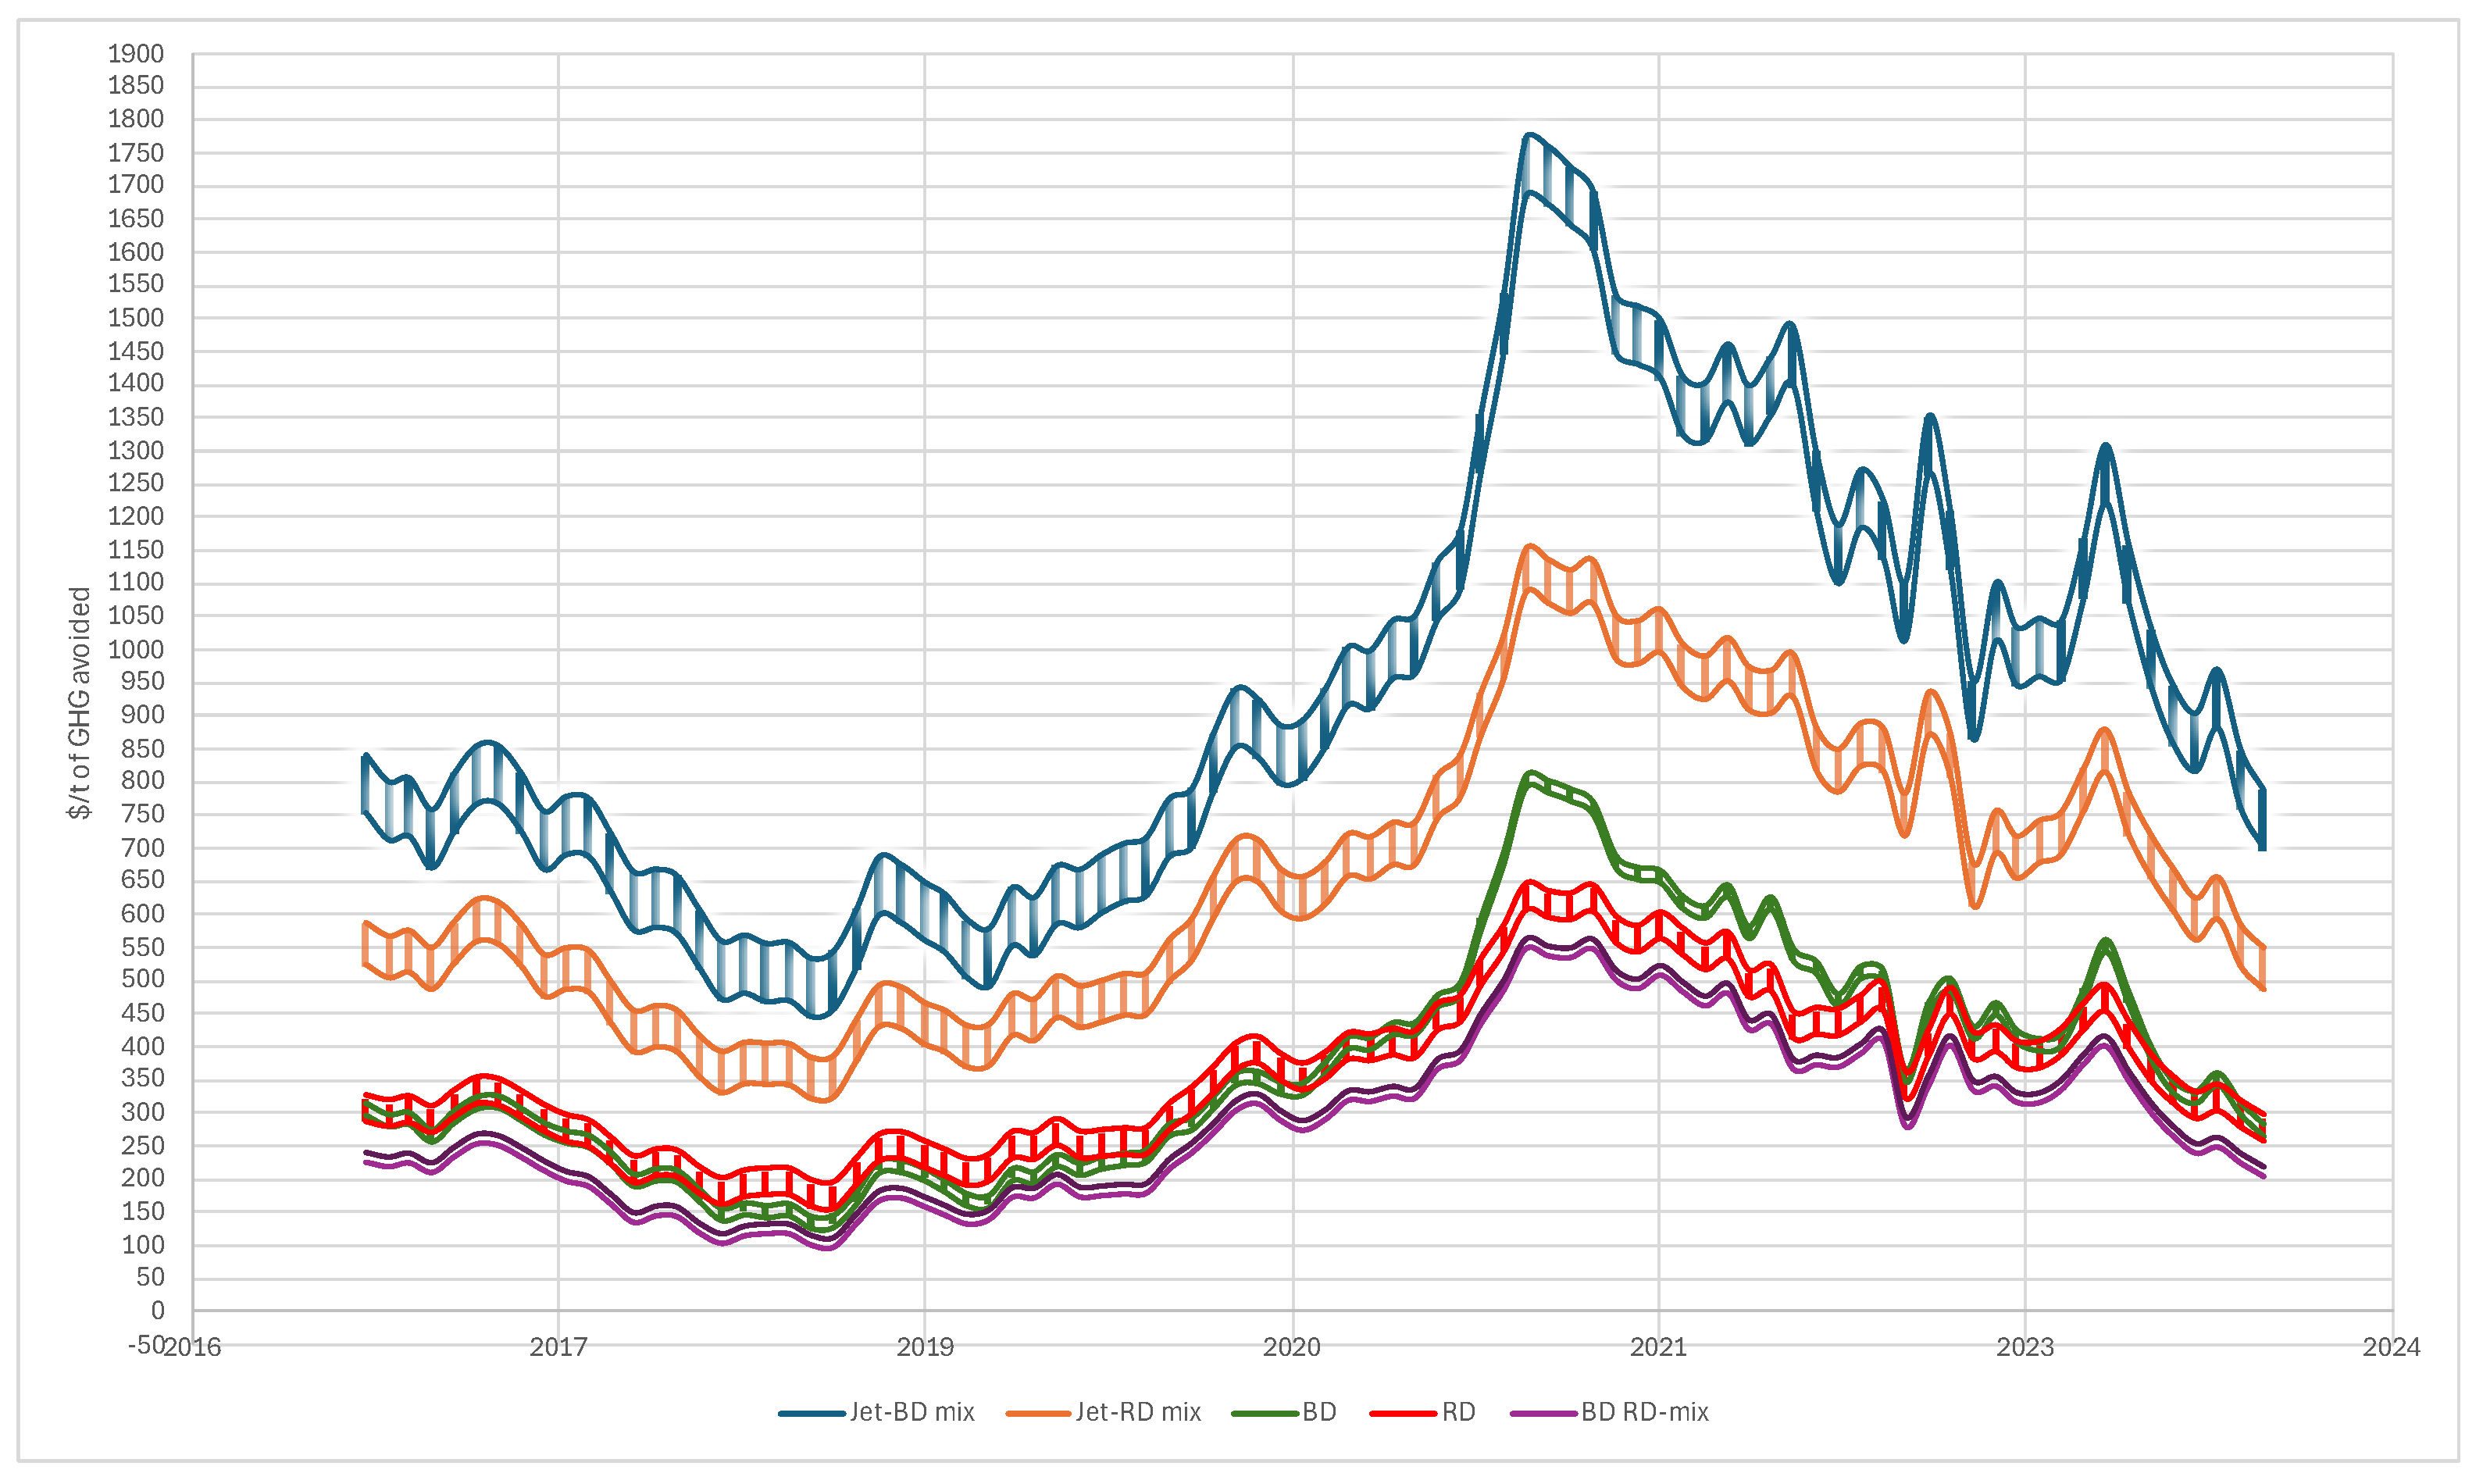

Table 1.
HEFA-tJ vs HEFA-road yields and selectivity.
| Pearlson et al., 2013 | Zech et al., 2018 | |||
| HEFA-tJ | HEFA-road | HEFA-tJ | HEFA-road | |
| Jet fuels | 49.4 | 12.8 | 45.4 | 12 |
| Diesel fuels | 23.3 | 68.1 | 8 | 66 |
| Naphtha | 7 | 1.8 | 27 | 4 |
| Refinery gas | 10.2 | 5.8 | 7.2 | 3 |
| Yield without conversion losses | 88 | 90 | 86 | 88 |
| Yield with conversion losses | 79 | 86 | 73 | 84 |
Table 2.
CORSIA Official CI for HEFA-tJ with different resources (CORSIA, 2022).
| Region | Feedstock | Core LCA Value | iLUC LCA | Total (g/MJ) |
|---|---|---|---|---|
| Global | Tallow | 49.4 | 0 | 22.5 |
| Global | Used cooking oil | 23.3 | 13.9 | |
| Global | Palm fatty Acid Distillate | 7 | 20.7 | |
| Global | Corn oil | 10.2 | 17.2 | |
| USA | Soybean oil | 40.4 | 24.5 | 64.9 |
| Brazil | Soybean oil | 40.4 | 27 | 67.4 |
| EU | Rapeseed oil | 47.4 | 24.1 | 71.5 |
| Malaysia and Indonesia | Palm oil—closed pond | 37.4 | 39.1 | 76.5 |
| Malaysia and Indonesia | Palm oil—open pond | 60 | 39.1 | 99.1 |
Table 3.
TCI for HEFA-tJ and BD based on literature and company announcements.
| Reference | Plant type | Data type | Capacity kt/y feedstock | TCI ($/t feedstock) | TCI (2024) |
| Zech. H. et al., 2018 | HEFA-tJ | Literature | 500 260 116-378 1470 |
396 | 550 |
| Tao. L, et al., 2017 | HEFA-tJ | Literature | 1346 | 1 869 | |
| Pearlson, M. et al., 2013 | HEFA-tJ | Literature | 293-619 | 440-937 | |
| Neste | HEFA-tJ | Announcement | 1337 | ||
| World Energy Paramount (CA) | HEFA-tJ | Announcement | 1500 | 1337 | |
| TotalEnergy Grandpuits | HEFA-tJ | Announcement | 470 | ~1168 | |
| Holstrand, D., 2024 | BD | TEA | 106 | 493 | |
| AirLiquide 2022 | BD | Announcement | 50-350 | 315-475 | |
| Our estimates | HEFA-tJ | No SMR included | >1000 | 1200-1600 | |
| Our estimates | RD | No SMR included | 700 | 1080-1440 | |
| Our estimates | BD | 110 | 500-650 |
Table 4.
Main hypotheses for the simplified economic model.
| Simplified economic model hypothesis | ||
| Study period (SP) | 15 | |
| Depreciation | TCI/SP | |
| RI | 7% | %TCI |
| Taxes | 2% | %TCI |
| Maintenance | 5% | %TCI |
| Resource cost hypotheses (by ton of feedstock) | ||
| Methanol cost | 441 | $/t |
| NG cost | 335 | $/t |
| H2 cost | 2000 | $/t |
| Electricity cost | 0.08 | $/kWh |
Table 5.
Resource usage hypotheses.
| Resource usage hypothesis for different pathways (by ton of feedstock) | |||
|---|---|---|---|
| BD | Methanol | 105 | kg/t |
| NG | 46 | kg/t | |
| Electricity | 179 | kWh/t | |
| RD | H2 | 29,8 | kg/t |
| Electricity | 66 | kWh/t | |
| HEFA-tJ | H2 | 35.7 | kg/t |
| Electricity | 66 | kWh/t | |
Table 6.
Carbon intensity and GHG reduction of HEFA-tJ, RD, and BD with US resource usage.
| CI g/MJ | CI reduction | MJ/kg fuel | g/kg of GHG avoided by feedstock | |
|---|---|---|---|---|
| HEFA-tJ BD mix | 54.29 | 39 % | 40.5 | 1 111 |
| HEFA-tJ RD mix | 38.23 | 57 % | 40.5 | 1 624 |
| BD mix | 43.31 | 52 % | 37.37 | 1 725 |
| RD mix | 31.12 | 66 % | 43.2 | 2 236 |
Disclaimer/Publisher’s Note: The statements, opinions and data contained in all publications are solely those of the individual author(s) and contributor(s) and not of MDPI and/or the editor(s). MDPI and/or the editor(s) disclaim responsibility for any injury to people or property resulting from any ideas, methods, instructions or products referred to in the content. |
© 2025 by the authors. Licensee MDPI, Basel, Switzerland. This article is an open access article distributed under the terms and conditions of the Creative Commons Attribution (CC BY) license (http://creativecommons.org/licenses/by/4.0/).
Copyright: This open access article is published under a Creative Commons CC BY 4.0 license, which permit the free download, distribution, and reuse, provided that the author and preprint are cited in any reuse.


