Submitted:
13 April 2025
Posted:
15 April 2025
You are already at the latest version
Abstract
Liquid hydrogen (LH2) and 100% synthetic paraffinic kerosene (SPK), or sustainable aviation fuel (SAF), represent viable alternatives to conventional Jet-A for long-haul aviation, provided they are produced via pathways enabling net-zero well-to-wake (WTWa) emissions. This study evaluates the WTWa performance, including non-CO2 emissions, of a blended wing body aircraft (300 passengers, 13,890 km range) powered by either LH2 or 100% SPK. Use-phase emissions are quantified, and fuel production impacts are assessed using the GREET model. Analysis of over 100 production pathways reveals that LH2 can achieve net-zero or negative WTWa CO2-equivalent emissions when produced from biomass or integrated fermentation with carbon sequestration. Non-CO2 emissions are shown to contribute significantly to WTWa impacts. When miscanthus is used as a feedstock, 100% SPK reduces WTWa CO2-equivalent emissions by 70–85% compared to Jet-A. A high-level supply analysis indicates that SAF and hydrogen production in 2050 could meet the energy demands of long-haul aviation, assuming a 4% annual traffic growth rate and full adoption of these fuels. These findings provide critical insights to guide R&D investments, fuel cost analyses, and aviation policy development for sustainable long-haul aviation.
Keywords:
Life cycle assessment
; decarbonising long-range aviation
; climate neutral aviation
; Hydrogen aircraft
; alternative aviation fuel
; sustainable aviation fuel
1. Introduction
Aviation’s climate impact stems from both CO2 and non-CO2 effects, including soot, aerosols, water vapor, NOx emissions, and contrail-induced cirrus clouds [1,2,3]. Currently, aviation contributes 3.5% to anthropogenic radiative forcing, with non-CO2 effects accounting for approximately two-thirds of this impact [1,2,3]. Despite the pandemic, air travel demand is projected to double over the next two decades (2024–2043) [4], significantly exacerbating aviation’s climate footprint. While advancements in aircraft technology and low-carbon fuels could address 80% of the measures needed for carbon-neutral growth [5,6], achieving this goal requires a comprehensive understanding of life cycle emissions.
Life cycle emissions from aviation fuels encompass both operational and production phases, with the former contributing ~70% of total greenhouse gas (GHG) emissions for Jet-A fuel [7]. Current regulatory and technological efforts primarily focus on operational emissions, but a holistic approach is essential to evaluate the sustainability of alternative fuels. Tools like the GREET model [8] enable comprehensive life cycle assessments, revealing that not all alternative fuel pathways have low embodied GHG emissions. For instance, while liquid hydrogen (LH2) offers zero operational emissions and higher energy density than Jet-A, its life cycle GHG emissions can be 3 times as that of conventional Jet-A fuel, when derived from coal.
Decarbonizing long-haul aviation remains a significant challenge [6,9]. Presently, 100% synthetic paraffin kerosene (SPK) is not permitted for use in the existing aircraft fleet. Approved drop-in fuels for civil aviation use include up to a 50% blend of alcohol-to-jet (ATJ), Fischer-Tropsch (FT), and hydro-processed renewable or hydro-processed esters and fatty acids (HRJ or HEFA) SPK pathways, as well as a 10% blend of sugar-to-jet (STJ) SPK pathway [10,11,12,13]. Among the alternatives, LH2 and 100% SPK are the only viable options for long-range, large twin-aisle (LTA) aircraft, whether tube-wing or blended wing body designs [6,14,15,16]. However, existing studies on SPK and LH2 often focus solely on operational impacts, neglecting embodied emissions from fuel production [17,18]. A holistic evaluation framework is therefore critical to identify sustainable fuel pathways and assess their life cycle performance.
This study adopts a life cycle approach to evaluate fuel feedstock and production pathways for LH2 and 100% SPK, aiming to enable climate-neutral long-range flights for LTA aircraft. By integrating operational and embodied emissions, this work contributes to the development of a methodological framework for sustainable aviation, addressing gaps identified in recent reviews [19,20,21]. The analysis focuses on combustion-based LTA aircraft, providing insights into the potential of LH2 and 100% SPK as alternatives to conventional Jet-A fuel.
Numerous studies have conducted life cycle or well-to-wake (WTWa) emissions analyses for SPK and LH2 fuels across various aircraft range applications. These include fossil fuel-based SPK [22], bio-jet fuel e.g., [23,24,25,26], power-to-liquid (PtL) or electro-fuel e.g., [27,28], and LH2 (e.g., [29,30]. However, none of these studies comprehensively examine the combination of feedstocks and manufacturing pathways required to achieve climate-neutral long-range flights for LTA aircraft powered by LH2 and 100% SPK (bio-jet and PtL fuels). Additionally, many of these analyses exclude non-CO2 emissions in their WTWa assessments, limiting their applicability to sustainable aviation goals.
Key findings from recent reviews highlight the potential of alternative fuels to reduce WTWa GHG emissions. For instance, Lau et al. [31] report that HEFA and alcohol-to-jet (ATJ) bio-jet fuels can reduce WTWa GHG emissions by 19–42% and 20–65%, respectively. Braun et al. [25] find that Fischer-Tropsch (FT) SPK fuel derived from miscanthus, agricultural residues, and municipal solid waste can achieve up to 100% reduction in WTWa GHG emissions, with regional variations exceeding 125%. Ansell [32] notes that bio-jet fuel and renewable hydrogen can reduce WTWa CO2 emissions by 68% and ~80%, respectively, assuming a fully renewable grid. However, these studies do not account for non-CO2 emissions, which are critical for a holistic assessment of aviation’s climate impact.
Afonso et al. [23] and Song et al. [33] demonstrate that bio-jet fuels can reduce WTWa GHG emissions by up to 80% (including non-CO2 emissions) and 41–89% (excluding non-CO2 emissions), depending on feedstock and production pathways. Despite these advancements, existing research often focuses on limited or selective feedstocks, leaving gaps in understanding the full potential of alternative fuels for decarbonizing long-haul aviation.
For further details on manufacturing pathways, fuel properties, operability issues, and other aspects of alternative fuels, readers are directed to comprehensive reviews by Su-ungkavatin et al. [34]), Cabrera and Sousa [35], Ansell [32], and Braun et al. [25]. A detailed review of selected studies is also provided in Supplementary Information (SI) file SI §1.
Kolosz et al. [22] compare WTWa performance metrics for blended/drop-in SPK fuels, including fossil fuel-based SPK (derived from coal, oil sands, oil shale, and natural gas) and bio-jet fuels (first, second, and third generation). Similarly, Wei et al. [36], Pavlenko et al. [37], and De Jong et al. [24] assess WTWa emissions for bio-jet fuels but focus on limited biomass feedstocks. Studies by the International Civil Aviation Organization [38] and Prussi et al. [39] explore bio-jet fuels using feedstocks listed in the CORSIA database, while Van Der Sman et al. [40] review WTWa emissions for SPK fuels (bio-jet and PtL) within the EU region. Saad et al. [41] estimate a ~50% reduction in WTWa emissions for PtL and bio-jet fuels but limit their analysis to Switzerland. Notably, none of these studies account for non-CO2 emissions from aircraft operations in their WTWa analyses.
Grim et al. [42] report that PtL fuels can reduce WTWa GHG emissions by 66–94% (excluding non-CO2 effects). In the study by Grim et al., the wide range of 66–94% reduction is attributable to the variability in the sourcing of (carbon) feedstock (direct air capture or point based carbon sourcing). while Sacchi et al. [43] find reductions of 65–100% (including non-CO2 effects) for PtL derived from direct air capture and carbon storage. Micheli et al. [44] and Papantoni et al. [45] highlight the role of renewable energy in PtL production, with Micheli et al. [44] reporting WTWa GHG reductions of 27.6–46.2% (with non-CO2 effects) and 52.6–88.9% (without non-CO2 effects) for PtL produced using wind power in Germany. Papantoni et al. [45] observe reductions of 32% (solar) and 42% (wind) when non-CO2 emissions are included. Klenner et al. [46] find that PtL and LH2 produced using wind power in Norway reduce WTWa GHG emissions by 48% and 44%, respectively, for short flights (<200 km), with higher reductions (52% for PtL and 54% for LH2) for longer flights. VanLandingham [47] and VanLandingham and Hall [48] report WTWa GHG reductions of 43% (PtL) and 61% (LH2) for a Boeing 737, while Prashanth et al. [49] estimate reductions of 84–93% (PtL) and 91–98% (LH2) depending on the renewable energy source (solar or wind). Studies by the German Environment Agency (2016) and Schmidt et al. [28] project near-100% WTWa GHG reductions for PtL in Germany’s future energy mix. However, these analyses are often limited to specific energy landscapes or feedstocks, and the life cycle GHG performance of PtL and LH2 depends heavily on CO2 sourcing (direct air capture vs. point sources) and the electricity mix used in production.
Delbecq et al. [27] evaluate the WTWa performance of bio-jet fuel, PtL, and hydrogen at the aviation system level for a small aircraft. However, the individual WTWa GHG reduction potential of each fuel remains unclear, and the feedstock sourcing for bio-jet fuel is unspecified, while PtL and hydrogen are limited to renewable energy. Fantuzzi et al. [50] assess alternative aviation fuels but focus on limited feedstocks/pathways for bio-jet fuel (HEFA and ATJ), PtL, and hydrogen (steam methane reformation [SMR] and electrolysis), achieving up to 70% WTWa GHG savings (excluding non-CO2 emissions). Their analysis is restricted to the UK energy landscape. [51] provide a detailed evaluation of alternative fuels, including bio-jet fuel (ATJ, HEFA, FT), PtL (using direct air capture), and hydrogen (electrolysis with renewable power), considering non-CO2 emissions. They project an 89–94% reduction in WTWa GHG emissions by 2050, accounting for efficiency improvements and contrail avoidance, despite a 2–3x increase in demand. However, their study examines limited feedstocks for each fuel.
Quante et al. [52] report WTWa GHG reductions (excluding non-CO2 emissions) of 85% (FT SPK), 100% (PtL), 54% (HEFA SPK), 62% (ATJ SPK), 61% (STJ SPK), and 80% (hydrogen), though specific bio-jet fuel feedstocks are unspecified. Penke et al. [53] find WTWa GHG reductions (excluding non-CO2 emissions) of 77% (PtL), 30% (HEFA from soy oil), and 95% (renewable hydrogen). Kossarev et al. [54,55] focus on renewable hydrogen, algae-based HEFA, and hydrogenated vegetable oil, achieving WTWa GHG reductions (including non-CO2 emissions) of 59.5%, 35.8%, and 112%, respectively. These studies are limited to specific energy landscapes or feedstocks, restricting their broader applicability.
Studies on hydrogen as an aviation fuel [56,57,58] frequently exclude non-CO2 emissions, a critical oversight. Similar limitations are found in other prior studies [30,50,52,59,60]. Additionally, many studies [56,57,61] limit feedstock/pathway selection to renewable power, neglecting other potential sources. These similar limitations are observed in other previous literature [30,58,62,63]. The impact of aircraft use-phase energy consumption and emissions on WTWa performance is significant, yet studies often fail to account for the poor volumetric energy density of LH2, which penalizes aircraft energy performance.
Koroneos et al. [61] examine LH2 for an A320-type aircraft, considering realistic design effects, but their analysis is outdated and limited in LH2 production methods. Mukhopadhaya and Rutherford [30] project ~100% WTWa GHG reductions (excluding non-CO2 emissions) for PtL and LH2 from renewable electrolysis. Tveitan [57] reports a 58% WTWa GHG reduction (excluding non-CO2 emissions) for green hydrogen, while Chan et al. [58] find that green hydrogen and bio-jet fuel (feedstock unspecified) can achieve up to 88% WTWa GHG reductions. However, these studies often omit non-CO2 emissions, limiting their comprehensiveness.
Miller [64] and Miller et al. [65] expand on previous studies by evaluating a broader range of feedstocks and pathways for LH2 and bio-jet fuels, incorporating contrail-cirrus effects in their WTWa analysis. However, their work excludes PtL or electro-fuels and the STJ pathway, and their results are limited to smaller, shorter-range aircraft, unlike the LTA aircraft focus of this study. The FlyZero report [66] addresses performance penalties from cryogenic tank installation and includes non-CO2 emissions in its WTWa analysis of LH2, PtL, and bio-jet SPK fuels for small to mid-size aircraft. Nevertheless, it examines only a limited number of feedstocks and manufacturing pathways for these fuels.
A critical gap in the existing literature is the lack of comprehensive WTWa analyses that include non-CO2 emissions and explore diverse feedstock and manufacturing pathway combinations for achieving climate-neutral long-range flights using LH2 and 100% SPK (bio-jet and PtL fuels). While studies such as Afonso et al. (2023), Ansell (2023), and others provide valuable insights, they often focus on specific energy landscapes, limited feedstocks, or exclude non-CO2 effects. Furthermore, none of these studies consider fuel production routes that integrate carbon capture and storage (CCS), except for Fantuzzi et al. [50], who demonstrate that CCS in SMR-based LH2 production can reduce WTWa GHG emissions by 60% (median value). Pavlenko and Searle [67] highlight hydrogen’s critical role in SPK fuel production, emphasizing that green hydrogen can significantly reduce WTWa GHG emissions. However, the sensitivity of hydrogen production to SPK life cycle emissions remains unexplored.
According to the International Air Transport Association [68], achieving net-zero CO2 emissions by 2050 will require a combination of strategies: sustainable aviation fuels (SAF) contributing 65%, new aircraft technologies (e.g., electric and hydrogen) 13%, operational efficiencies 3%, and offsets/carbon capture 19%. Carbon removal is identified as a key strategy, yet its integration into fuel production pathways is underexplored. Additionally, none of the reviewed studies estimate the energy demand for long-haul aviation in 2050 or assess whether this demand can be met entirely with 100% SPK (or SAF) and/or LH2.
The limitations in existing literature motivate this study, which aims to address critical gaps in understanding the life cycle or WTWa GHG performance of long-range LTA aircraft powered by LH2 and 100% SPK, including bio-jet and PtL fuels. This work evaluates over 100 feedstocks and manufacturing pathways, some incorporating CCS, while accounting for non-CO2 emissions. Additionally, it investigates the sensitivity of hydrogen sourcing to SPK production, biomass sourcing for hydrogen pathways, and the impact of energy mix transitions (2020 vs. 2050). The study also estimates future (2050) energy demand and supply for long-haul aviation using 100% SPK (or SAF) and LH2, providing novel contributions to the field.
In the authors’ previous work [15,16], the engine and operational energy performance of a 2030+ (N+2 timeframe) blended wing body (BWB) LTA aircraft powered by LH2 and 100% SPK was conducted while incorporating penalties from cryogenic tank installation for LH2. These prior studies based on conceptual design/low order modelling enable estimation of use-phase GHG emissions in the present work, which, combined with manufacturing-phase emissions, facilitates comprehensive WTWa or life cycle emissions analysis. Because the prior studies were conducted using low order modelling, the use phase emission estimation in this work is of low fidelity level. Over 100 production pathways for LH2, PtL, and bio-jet SPK are examined, including those employing CCS. The primary objectives of this work are:
- Develop a database of energy, emissions, and materials inventory for alternative fuels produced via various pathways.
- Assess sensitivities of hydrogen sourcing to SPK production and biomass sourcing for hydrogen pathways.
- Evaluate aircraft operational-phase emissions, including non-CO2 effects.
- Estimate future energy demand and supply (2050) for 100% SPK (or SAF) and LH2 in long-haul aviation.
In addition to quantifying CO2-equivalent emissions, this study evaluates unintended effects of LH2 and 100% SPK use, such as fossil fuel consumption, water use, and other emissions. The GREET model [8], CORSIA default values, and literature are used to create an inventory of manufacturing-phase CO2-equivalent emissions for over 100 fuel production pathways. Use-phase emissions are modeled for a 2030+ BWB aircraft powered by LH2 and 100% SPK, incorporating non-CO2 emissions from literature to estimate WTWa CO2-equivalent emissions. Further details are provided in the Supplementary Information (SI) document.
2. Methodology
The WTWa emissions or performance of any fuel is the summation of emissions during the fuel manufacturing stage (from raw material extraction stage to its transportation and storage at fuel pump) and the operational phase of the aircraft. The fuel manufacturing stage is referred to as well-to-pump (WTP) and operational phase of aircraft is referred to as pump-to-wake (PTWa). In this work, it is assumed that for all fuels the pump to aircraft tank emissions and/or leakages are zero. Figure 1 shows the schematic of WTWa emissions calculation process from WTP and PTWa emissions, used in this work. Referring to Figure 1, WTWa CORSIA default values (2021), are available directly from literature and these are listed in Table SI 5 (in SI §1). It is to be noted that the CORSIA default values are limited to a few feedstocks and/or pathways for bio-jet fuel. The methodology for WTWa emissions calculation is split into WTP and PTWa as separate models, or estimation procedures are required. The methodology for estimating WTP and PTWa is discussed separately in §2.1 and §2.2, respectively. It is to be noted that for both 100% SPK and LH2, all feedstocks and manufacturing pathway combinations that are available in GREET model are explored in this work. The latest version of the GREET model is available both in .NET framework and as Excel Spreadsheet from resource [69]. The version of the GREET model used in this work is available in resource [70] [email registration is required before it can be downloaded] and it is also provided as a supplementary information file.
2.1. Well to Pump Emissions
Referring to Figure 1, the GREET model is used for making a database of fuel manufacturing phase emissions for LH2 and 100% SPK (bio-jet fuel and PtL). The different processes of manufacturing LH2 and 100% SPK routes are reviewed/discussed in SI §2. The GREET model is documented extensively in literature (report, articles, manual, etc.) and the list of publications can be found in resource [71]. It is to be noted that the GREET model is USA specific, and thus is a limitation of this work. For both LH2 and 100% SPK, a wide range of manufacturing pathways and/or feedstocks are examined. For a fuel under consideration, not all feedstocks and/or pathways are considered for whole WTWa analysis. Most feedstocks and/or pathways are screened out based on their WTP performance for computational compactness and ease. Additionally, a few parameters are identified from literature to which the WTP emissions are sensitive, and these parameters are varied in GREET, for each fuel type under examination, and these are detailed next. It is to be noted that GREET model includes all emissions in WTP phase including transportation of products/raw materials and indirect emissions (land use change).
2.1.1. Liquid Hydrogen
Table 1 lists the different feedstock and/or pathways for producing hydrogen at centralised manufacturing unit with or without carbon sequestration facility and type of liquefication used. There are in total 59 different ways to produce LH2 from centralised manufacturing units in the USA as simulated, using GREET model [8].
There are two assumptions/models for hydrogen production in GREET: (a) H2A model of National Renewable Energy Lab, USA (b) Industry data. 59 cases (and Jet-A) are simulated for both hydrogen production assumptions, wherever applicable and available. For example: Industry data assumptions are applicable/available in GREET for all 59 cases except four cases: (a) North American natural gas (NANG) with carbon sequestration (w CS) and hydrogen liquefication using US mix electricity (LUSME); (b) renewable natural gas (RNG) w CS LUSME; (c) NANG w CS and liquification using power from natural gas combined cycle (LNGCC); (d) RNG w CS LNGCC. Similarly, H2A model assumptions are applicable/available in GREET for all 59 cases except 18 cases: six feedstocks each (willow, poplar, switchgrass, corn stover, forest residue, and miscanthus) for biomass manufacturing plant type w CS for both LUSME type and hydrogen liquefied using electricity from biomass integrated gasification combined cycle (LBIGCC), and six feedstocks (same as above) with integrated fermentation manufacturing plant type w CS.
In the results section (§3), for each of the 59 manufacturing cases, the sensitivity of the selection of model assumptions (H2A or industry data) is reflected as a range of values. This is the first sensitivity parameter. Additionally, each of the 59 manufacturing cases (and Jet-A) with respective manufacturing model assumptions is simulated for year 2020 and 2050. This is essentially to check the sensitivity of US energy mix, the second sensitivity parameter, on LH2 WTWa emissions. The energy mixes for both 2020 and 2050 are listed in Table 2. According to Table 2, the USA energy mix in 2050 is expected to be dominated by more renewable energy sources, especially solar energy (photovoltaics [PV]). The objective of this work is to find (fuel) feedstock and pathway combinations that enable climate neutral long-range flight. Thus, after examining 59 cases, only LH2 manufacturing options that provide near-zero and/or negative CO2 equivalent emissions are considered for further WTWa analysis.
2.1.2. 100%. Synthetic Paraffin Kerosene
2.1.1.1. Preliminary Shortlisting of Feedstocks and Pathways
In this section, four SPK fuel pathways are examined using the GREET model, where the 100% SPK fuel is produced from different feedstocks and manufacturing schemes. These are ATJ, STJ, HRJ or HEFA, and FT. For each of the four SPK fuel pathways, different feedstocks and manufacturing schemes are evaluated. Table 3 and Table 4 list different feedstocks and manufacturing schemes for 100% SPK produced from ATJ (18 cases) and STJ (24 cases), and FT (eight cases) and HEFA (four cases each of food and non-food crops) pathways, respectively.
For HEFA, though there are eight feedstocks in total that are considered purely as an academic exercise in Table 4, only four non-food crops will be considered as feedstocks for fuel production in this work for further consideration. This arises from social concerns of using food crops for fuel production. In total there are 54 different ways (58 ways if food crops are included) in which 100% SPK can be produced using the above four pathways and feedstock combinations. These 54 manufacturing options are examined and only the options that provide lowest or negative CO2 equivalent emissions for each of the four pathways are considered for sensitivity analysis (discussed next) and further WTWa analysis.
2.1.2.2. Manufacturing Emissions Sensitivity to Identified Parameters
According to the study by Pavlenko et al. [67], hydrogen is one of the important component required in the SPK fuel manufacturing process and therefore it contributes significantly to the life cycle GHG emissions of SPKs, especially for HEFA and STJ pathways. Additionally, the use of green hydrogen for producing SPKs could be useful to reduce the life cycle greenhouse gas emissions [67]. From the exercise on LH2 discussed in §2.1.1, the feedstocks/pathways that enable a near-zero or negative emissions fuel production are used for this sensitivity analysis. For example, if solar-PV and biomass routes of hydrogen production are shortlisted via the approach detailed in §2.1.1, then these routes will be used for producing the required hydrogen in the manufacturing process of a given SPK pathway. In the results section (§3), for each of the shortlisted SPK fuel manufacturing case, the sensitivity of the hydrogen production route for manufacturing SPK fuel, is reflected as a range of values. The hydrogen production route for manufacturing SPK fuel is the first sensitivity parameter.
Additionally, similar to the exercise for LH2, the WTP emissions for SPKs are simulated for year 2020 and 2050 (more renewable energy sourcing), and this is useful in the estimation of the sensitivity of US energy mix, the second sensitivity parameter, on 100% SPK WTWa emissions.
2.2. Pump to Wake Emissions
In the authors’ previous studies [15,16], the engine (ultrahigh bypass ratio geared turbofan) and aircraft operational energy performance modelling of a 2030+ (N+2 timeframe) BWB LTA aircraft powered by Jet-A, LH2, and 100% SPK (separately) are conducted. For the LH2 aircraft, the penalties due cryogenic tank installation are modelled. The Jet-A, LH2, and 100% SPK aircraft operational performance enables the estimation of emissions in the aircraft use-phase. Additionally, the engine cycle parameters required for PTWa emissions modelling are known for the aircraft from authors’ previous study [15]. The PTWa emissions estimation process for the BWB aircraft (Jet-A, 100% SPK, and LH2) modelled in [15,16] is considered next. It is to be noted that these prior studies model the engine and aircraft using low order modelling methods, therefore the emission modelling would be at a low fidelity level. The reader is advised to explore studies [73,74,75,76] for high order modelling of non-volatile particulate matter, NOx, carbon monoxide, and hydrocarbon emission, especially for Jet-A fuel.
2.2.1. Oxides of Nitrogen
In the authors’ previous study [15], the use of the lean direct injection (LDI) combustor type in the BWB aircraft (Jet-A, 100% SPK, and LH2) is discussed. In terms of oxides of nitrogen (NOx) emission modelling for this combustor, the emission index (EI) estimation process for NOx is known from the study by Marek et al. [77], which is based on experiments conducted by NASA. The (grams NOx per kg fuel) i.e., emissions index for Jet-A LDI combustor is given by equation 1 (source [77]),
where , (MPa), (K), , and (%) are correlation constant for emission index based on Jet-A fuel, combustor inlet pressure, combustor inlet temperature, fuel to air ratio, and fuel injector air flow pressure drop ratio, respectively. is 14 for advanced LDI technology, and , , and are known from authors’ previous study [15] (GasTurb engine modelling for engines powered by different fuels). A nominal value of 4% for is used for the combustor design (for both Jet-A and hydrogen) as reported by Marek et al. [77] and is used in this work for NOx modelling. It is assumed in this work that equation 1 is also applicable to 100% SPK, and respective , , and are used (known from authors’ previous study [15]).
For hydrogen, C4 type of LDI combustor configuration (please refer to authors’ previous study [15] for details about all configurations) is used in this work for emissions modelling, as according to Marek et al. [77], it was the only configuration that performed the best from a low NOx and durability criteria. For hydrogen, NOx is estimated in terms of parts per million (ppm) i.e. , in the study by Marek et al. [77]. The calculation of for hydrogen LDI combustor is given by equation 2 (source [77]),
where , and are correlation constants for emission index based on hydrogen data, and and are hydrogen equivalence ratio and combustor residence time, respectively. For C4 configuration, the values of , and are known to be 9.355, 0.275, 4.12, 0.455, 211, and -0.288, respectively. is calculated from the fuel to air ratio according to the definition in authors’ previous study [15]. The fuel to air ratio and are known from authors’ previous study [15] (GasTurb engine modelling). The generic equation for the estimation of from is given by equation 3 (source [77]),
where is the molecular weight for respective species. The of is 46 and for the combustion products it is calculated using the ‘major species’ combustion model as described in authors’ previous study [15]. Therefore, once is calculated using equation 2, the can be estimated using equation 3 for a given fuel case where the is known.
It is to be noted that equations 1 and 2 that estimate NOx are applicable to typical temperature and pressure combination during cruise, according to Marek et al. [77]. Therefore, using equation 1, and equations 2 – 3 the cruise for Jet-A (and 100% SPK) and LH2 aircraft can be calculated, respectively.
For estimating at other points in the flight mission, the ‘DLR fuel flow correlation’ method [78] is used which is dependent on pressure, temperature, and Mach number, for respective flight segment. After calculating cruise , the at sea level static (SLS) () point can be calculated using the DLR method, where both are related by parameters that depend on flight altitude, ambient pressure and temperature, and flight Mach number. Thus, now knowing the , the at other flight points like engine start and warm up, taxi out, take-off, climb, descent and approach, loiter, landing, taxi in, and shutdown, can be calculated knowing the respective flight altitude, ambient pressure and temperature, and flight Mach number. The relation between and at other flight points is given by equation 4,
, , , , , , , , , , and are ambient pressure (in Pa), total pressure (in Pa), ambient temperature (in K), total temperature (in K), flight Mach number, specific heat ratio (1.4 for air), pressure correction factor, temperature correction factor, NOx emission index at SLS, humidity correction factor, and flight altitude (in feet), respectively.
The breakdown of mission fuel burn or block fuel (WF,block, in kg) for Jet-A, 100% SPK, and LH2 (case 3) is known from the authors’ previous study [16] at different flight segments such as engine start and warm up, taxi out, take-off, climb, cruise descent and approach, loiter, landing, taxi in, and shutdown. After calculating for these segments, the quantity of NOx (kg) emitted can be calculated. Table SI 6 (in SI §3) lists the engine parameters required to estimate during cruise (in equations 1 – 3) for different fuel cases. Table SI 7 (in SI §3) provides the operational conditions and fuel burn for different fuels at various flight segments needed for estimating (using equations 4 – 9). For estimating the speed of the aircraft during taxi out (20 knots [79]), take-off (150 knots [80,81]), descent (average descent 250 knots [80]), and landing (155 knots approach-landing speed [80,82]), the speed of present-day LTA aircraft are used (values in SI system in Table SI 7 (in SI §3)).
2.2.2. Carbon Dioxide, Water Vapour, Sulphur Dioxide, Other Emissions, and Contrails
Table SI 8 (in SI §3) lists the emission index of different species and contrails for the three fuels under consideration. CO2, H2O, and sulphur dioxide (SO2) emission vary linearly with fuel burn. The production of species like volatile organic compounds (VOC), carbon monoxide (CO), particulate matter 10 and 2.5 (PM10 and PM2.5 respectively), oxides of sulphur (SOx) (total), black carbon (BC), organic carbon (OC), methane (CH4), and nitrous oxide (N2O), after Jet-A and 100% SPK fuel combustion is not linearly dependent on fuel burn and its estimation requires detailed combustion physics-based modelling. It is to be noted that the impacts of non-CO2 emissions, especially contrails, vary by region, altitude, humidity, time of the day, etc. Non-CO2 emissions are uncertain, and difficult to quantify, and depend on type of technology and fuel used – they are not linearly dependent on the fuel burn.
Future LDI combustors are expected to have significantly lower emission indices for these species. In this work, it is assumed that the emission index for these species in the future (N+2 timeframe) BWB remains similar to the present-day emission index listed in Table SI 8 (in SI §3) for LTA aircraft. Similarly, contrail modelling requires detailed physics-based simulation which should capture the effects of nucleation particles and/or lubrication oil from the aircraft engine acting as nuclei for ice formation, presence of nucleation particles in atmosphere (concentration expected to vary with time), and interaction of engine wake and wing-tip vortices. In this work, for aircraft’s operational phase (PTWa) though all non-CO2 emissions are calculated except for contrails, the CO2 equivalent for the total non-CO2 emissions (in g/MJ) for Jet-A, 100% SPK or SAF, and LH2 reported by Dray et al. [51] is used directly. The CO2 equivalent of the total non-CO2 emissions during aircraft’s operational phase for Jet-A, 100% SPK or SAF, and LH2 are 9.4 – 54 g/MJ, 6 – 47 g/MJ, and 11 – 68 g/MJ, respectively [51].
2.3. Global Warming Potential
Table SI 9 (in SI §3) lists the global warming potential (GWP) of NOx and H2O at different mission segments. The GWP of NOx increases from a negative value at zero altitude to a positive value at 11 km altitude [83]. A study by Svensson [83] provides the variation of GWP of NOx and H2O with altitude. The GWP of H2O is zero until 9 km (from zero altitude) and increases thereafter. For cruise, the most recent GWP values for NOx and H2O from the study by Lee et al. [2] are used in this work and are listed in Table SI 9 (in SI §3). At zero and low altitudes (< 2 km), the GWP of NOx provided by GREET model [8] is used here. For altitude between 2 km and 10.67 km (cruise), the NOx GWP provided in a study by Svensson [83], is used in this work. Table SI 10 (in SI §3) provides the GWP of all emissions in the WTP and PTWa phase.
2.4. Other Unintended Environmental and Social Impacts
In addition to the CO2 and non-CO2 effects of aircraft on climate, there are other metrics that should be considered and quantified. These include the use of fossil fuels, water consumption, and WTWa emissions that affect air-quality. The emissions that are considered include VOC, CO, NOx, PM10, PM2.5, SOx, BC, and OC. These emissions affect both the environmental and human health. It is assumed that the emission index for VOC, CO, PM10, PM2.5, SOx, BC, and OC for the future (N+2 timeframe) BWB remains similar to the present-day emission index listed in Table SI 8 (in SI §3) for LTA aircraft. The use of fossil fuels (natural resource) has an environmental impact, and water consumption has both environmental and social impact. The WTWa data for VOC, CO, PM10, PM2.5, SOx, BC, and OC is directly obtained from GREET model. WTWa NOx is calculated from WTP NOx obtained from GREET, and PTWa NOx calculated from methodology described in §2.2.1. The data for use of fossil fuels and water consumption is directly obtained from GREET model.
2.5. Future Worldwide Energy Demand and Supply of Sustainable Aviation Fuel and Green Hydrogen
The total Jet-A fuel consumption for 2024/25 is known to be 14.04 EJ from IATA [84] and Boeing’s CASCADE tool [85]. Long-haul aviation contributes to 37% [86] – 43% [87] of the total aviation fleet CO2 emissions. Therefore, the energy demand for long-haul aviation is presently 37% – 43% of 14.04 EJ. In this work, the energy demand for long-haul aviation in 2050 is calculated for two traffic growth rate cases i.e. 3% and 5% compound annual growth rate (CAGR). For this calculation, it is assumed that the share of energy demand of long-haul aviation to total aviation energy demand will stay constant in future (i.e. 37% – 43%).
The quantification of future supply potential of SPK or SAF is conducted using data available from Boeing SAF dashboard [88] and Air Transport Action Group (ATAG) report [89]. Boeing SAF dashboard provides global SAF supply potential until 2035, and it provides data for operational manufacturing unit along with other plant types such as planned, aspirational, final investment decision, under construction, and pending final investment decision. ATAG report provides global SAF supply potential for 2050, for three supply scenarios.
Similarly, the quantification of future supply potential of green hydrogen is carried out using data available from the International Energy Agency (IEA) hydrogen dashboard [90], McKinsey report [91], and ATAG report [89]. The IEA hydrogen dashboard provides hydrogen supply until 2030 for different manufacturing plant types, where low-carbon hydrogen is produced from electrolysis, fossil fuel with carbon capture, utilization and storage, and other routes. These manufacturing plant types include conceptual, demonstration projects, feasibility study, under construction and operational plants. McKinsey report provides four supply scenarios. Lastly, ATAG report provides global hydrogen supply potential for 2050, for three supply scenarios. It is to be noted that the effect of different supply scenarios of SAF and hydrogen is considered in this work via a range of energy supply values for each fuel.
3. Results and Discussion
3.1.1. Well to Wake Emissions for Liquid Hydrogen
Figure 2 shows the WTWa comparison of different LH2 feedstocks and/or pathways (59 manufacturing cases) for 2020 and 2050 US energy mix (with only CO2 emissions in PTWa phase). In this figure, for the WTP stage all greenhouse gas emissions are considered but for PTWa only CO2 emissions are included. The non-CO2 emissions are included later in §3.1.3. As discussed in §2.1.1, sensitivity to two parameters is analysed. For each of the 59 manufacturing cases, the sensitivity of the selection of model assumptions (H2A or industry data) is reflected as a range of values. This is the first sensitivity parameter.
Additionally, each of the 59 manufacturing cases (and Jet-A) with respective manufacturing model assumptions is simulated for both 2020 and 2050 to check the sensitivity of US energy mix - the second sensitivity parameter, on LH2 WTWa emissions.
It can be observed from Figure 2 that grey and blue hydrogen WTWa emissions are of the similar magnitude as that of Jet-A or more, regardless of the hydrogen production assumptions used or the energy mix type. Additionally, not all green hydrogen manufacturing cases have near zero or sub-zero WTWa CO2 equivalent emissions. Certain manufacturing schemes like IF w/o CS, HTE SOEC – NGCC, and By-prod Cl plant have higher WTWa CO2 equivalent emissions than Jet-A. This can be attributed to the low manufacturing efficiency resulting in higher WTWa GHG emissions.
As discussed in §2.1.1, only the LH2 manufacturing options that provide near-zero and/or negative CO2 equivalent emissions are considered for further WTWa analysis (including non-CO2 emissions in PTWa). The LH2 manufacturing cases that have near-zero and/or negative CO2 equivalent emissions are RNG w CS LUSME, RNG w CS LNGCC, solar PV L-solar, nuclear HTGR LUSME, biomass w/o CS LBIGCC, biomass w CS LUSME, biomass w CS LBIGCC, and IF w CS. These eight cases will be considered for further WTWa analysis in §3.1.3, which includes non-CO2 emissions in PTWa.
3.1.2. Well to Wake Emissions for 100% Synthetic Paraffin Kerosene
3.1.2.1. Preliminary Shortlisting of 100% Synthetic Paraffin Kerosene Feedstocks and Pathways
Figure 3, Figure 4, Figure 5, and Figure 6 provide the WTWa comparison of different FT, HEFA, ATJ, and STJ feedstocks, respectively, for 2020 (with only CO2 emissions in PTWa phase). It can be observed from Figure 3 that electro-fuel (E-fuel) or PtL, and biomass are the two feedstocks/routes that have lowest (almost zero) WTWa CO2 equivalent emissions and are shortlisted for further analysis. For the biomass case, six feedstocks are considered that include willow, poplar, switchgrass, miscanthus, corn stover, and forest residue. This is included as a range in Figure 3. Switchgrass has a poor performance whereas forest residue provides a greater reduction in WTWa CO2 equivalent emissions and is thus considered as the default FT biomass-based feedstock for further analysis.
Similarly, it can be seen from Figure 4 that Carinata is the only non-food crop that has lowest WTWa CO2 equivalent emissions of all HEFA feedstocks and is thus considered for further analysis. Ideally, corn oil has the lowest emissions but as discussed in §2.1.2 only non-food crops are considered for analysis (due to the social impacts).
Referring to Figure 5, Miscanthus is the feedstock which provides lowest WTWa CO2 equivalent emissions in both standalone and distributed ATJ production schemes (S.Miscanthus and D.Miscanthus) and are therefore shortlisted for further analysis. Similarly, it can be observed from Figure 6 that Miscanthus provides negative WTWa CO2 equivalent emissions in three STJ production schemes – biological, catalytic with in-situ H2 plant type, and catalytic with H2 from biomass gasification plant type (B.Miscanthus, CWIH.Miscanthus and CWHBG.Miscanthus, respectively), and are thus considered for further analysis. It is to be noted that the above shortlisting of FT, HEFA, ATJ, and STJ feedstock/pathways (for further analysis) also takes into consideration WTWa CORSIA default values (2021) which are included in Table SI 5 (in SI §1). The feedstock/pathways shortlisted from analysis in Figure 3, Figure 4, Figure 5, and Figure 6 have significantly lesser WTWa than the CORSIA data.
3.1.2.2. Manufacturing Emissions Sensitivity to Identified Parameters
From §3.1.1, RNG w CS, Solar PV, Nuclear HTGR, Biomass, and IF (biomass) LH2 production pathways are found to provide near-zero or sub-zero WTWa CO2 equivalent emissions. For each of the shortlisted 100% SPK fuel manufacturing cases in §3.1.2.1, the sensitivity of selection of the hydrogen production route (discussed above) and the US energy mix type (year) for manufacturing SPK fuel on the WTWa CO2 equivalent emissions is analysed.
Figure 7 provides the WTWa comparison of low-carbon 100% SPK feedstocks and pathways for 2020 and 2050 US energy mix scenarios using hydrogen produced from less carbon intense scheme (with only CO2 emissions in PTWa phase). It can be observed that HEFA (Carinata), miscanthus STJ biological production type, and both ATJ distributed and standalone schemes using miscanthus, are sensitive to the hydrogen manufacturing route. This is because hydrogen input to the production of these 100% SPK routes are greater than other routes for fuel production (i.e., greater dependency on hydrogen), in GREET. Also, it can be observed that for ATJ distributed and standalone schemes using miscanthus, and miscanthus STJ biological production type, the WTWa CO2 equivalent emissions increase between 2020 to 2050, opposite to the trend observed for other 100% SPK cases. This is primarily due to the higher use of fossil fuels via these routes, and the increased need for fossil fuels in the 2050 US energy mix which otherwise has a greater share of renewable energy as discussed in §2.1.1. The effect of use of fossil fuels is further detailed in SI §4.
3.1.3. Comparative Well to Wake Analysis with Non-CO2 Emissions
A comparative analysis of PTWa (CO2 equivalent) NOx, H2O, SO2 and other emissions (VOC, CO, BC, OC, CH4 and N2O) for Jet-A, LH2 and 100% SPK is provided in Figure SI 13. It is observed that by using an LDI combustor, there is a significant drop in PTWa NOx emissions (CO2 equivalent) for N+2 BWB Jet-A (and 100% SPK) and LH2 aircraft, compared to present-day LTA aircraft. N+2 BWB (using LDI combustor) Jet-A, 100% SPK, and LH2 aircraft in use phase (PTWa) show 52%, 54%, and 96% reduction in NOx emissions (CO2 equivalent), respectively, compared to present-day LTA aircraft.
Figure 8 shows the WTWa CO2 equivalent emission comparison for different LH2 and 100% SPK feedstock and pathways for 2020 and 2050 US energy mix scenarios with non-CO2 effects (including contrails). Referring to Figure 8, the error bars in WTP phase reflect a range of values to accommodate a significant variability (in the life cycle emissions) for any given pathway, especially due to the carbon intensity of the sourced feedstock. Also, the error bars in PTWa phase reflect the variability due to non-CO2 emissions. For LH2 cases, the error bars in WTP show a range of values arising from the use of different biomass feedstocks. Similarly, for 100% SPK cases, the error bars in WTP phase show a range of values due to the sensitivity because of using hydrogen produced from different low-carbon source for producing 100% SPK (see Figure 7 and discussion).
Table 5 provides a summary of Figure 8 in terms of WTWa GHG emissions (CO2 equivalent) reduction potential of different LH2 and 100% SPK feedstock and pathways for 2020 and 2050. It can be observed from Figure 8 and Table 5 that all listed feedstock and pathways of producing LH2 and 100% SPK could make aviation climate neutral (while considering highest reduction for any case). Particularly, LH2 fuel can enable net zero or negative WTWa CO2 equivalent emissions long-range flight of 300 passengers where LH2 fuel is produced from Biomass w CS LUSME (260.8% – 266.1% reduction), Biomass w CS LBIGCC (296.2% – 302.6% reduction), and/or integrated fermentation (IF) w CS (96.2% – 150.7% reduction), relative to Jet-A. It is to be noted that though the GHG reduction potentials could increase in 2050 (as observed from Table 5), the comparison is made with 2020 numbers.
Additionally, the effect of carbon sequestration on LH2 WTWa emissions can be observed from Table 5. In 2020, biomass LBIGCC without and with carbon sequestration show 2.8% – 85.6% and 296.2% – 302.6% reduction in WTWa GHG emissions, which is a significant impact. The of low carbon fuels and carbon capture which are few of IATA’s decarbonization strategies, are observed to be simultaneously employed in the case of Biomass w CS LUSME.
Moreover, it can be observed from Figure 8 that on an average the WTWa CO2 equivalent emissions of 100% SPK long-range (BWB) flight of 300 passengers can be reduced by 70% – 85% if the fuel is produced from Miscanthus (depending on manufacturing route such as ATJ/STJ, standalone/distributed, etc.). This is similar to the observations made by Afonso et al. [23] and Song et al. [33] bio-jet fuel can reduce WTWa GHG emissions by up-to 80% (with non-CO2 emissions), compared to Jet-A. The authors acknowledge that life cycle emissions for any given fuel and manufacturing pathway could vary significantly, particularly due to the carbon intensity of the feedstock used.
As summarised in §1 via a literature review, the non-CO2 emissions contribute significantly to WTWa GHG emissions. If these effects are ignored in this work, then all the feedstocks/pathways shortlisted for LH2 fuel can enable a net negative carbon emission (according to Figure 8). For Jet-A and 100% SPK cases, the PTWa non-CO2 emissions (g/MJ) are of similar magnitude as that of PTWa CO2 effects. Moreover, for LH2 fuel cases, the contribution of non-CO2 emissions to WTWa emissions are significant, though the net WTWa CO2 equivalent emission is significantly lesser than Jet-A. The use of only advanced technology and low-carbon fuel (like LH2) enable near-zero WTWa CO2 equivalent emissions long-range flight, but these are insufficient strategies to reduce the effect of non-CO2 emissions such as contrails. Similar to Jet-A aircraft, for LH2 powered aircraft, operational strategies such as avoiding ice-supersaturated regions to prevent contrail formation could be used [92,93].
The perspective used to select three feedstock and/or pathways for LH2 fuel identified above only take into consideration the WTWa CO2 equivalent emissions. However, for commercial aviation, the fuel cost, and the resulting direct operating cost (inclusive of carbon tax exemption) are significant aspects which should be accounted for identifying fuel manufacturing pathways for both LH2 and 100% SPK. In this work, cost analysis is not conducted. The accuracy of fuel cost analysis depends primarily on the accuracy of simulation of the fuel manufacturing process, year of simulation, government incentives and market penetration of a fuel, and scale of fuel manufacturing and/or fuel manufacturing process technology readiness level. Additionally, there are fuel cost fluctuations due to externalities. For example: economic uncertainties due to pandemic like COVID-19, instability in Middle Eastern countries, and events such as the 2022 Eastern European conflict directly affect the global energy cost. The aspect of fuel production capacity is addressed in SI §3 (Table SI 11). Additionally, the other unintended environmental and social impacts (fossil fuel use, water consumption, air-quality, etc.) are addressed in SI §4. Overall, the success of LH2 powered aviation requires appropriate: airport infrastructure, aircraft design, air-traffic or operations management, safety, fuel supply chain/manufacturing efficiency and capacity to meet the required fuel demand, fuel cost and direct operating cost, and policy.
3.1.4. Future Energy Demand for Long-Haul Aviation and Supply of SAF and Green Hydrogen
It is to be noted that the production capacities and supply estimates of different feedstocks and pathways explored in this work for SAF and hydrogen, are not available in literature. In this sub-section, a high-level demand and supply aspect is explored as a feasibility check for the alternative fuels considered in this work.
Figure 9 shows the energy demand forecast for long-haul aviation and supply of SAF. It is to be noted that this analysis (in Figure 9) assumes that all long-haul aviation will be powered by SAF. It can be observed from Figure 9 that the supply of SAF in 2050, considering the uncertainties, would satisfy a 3% CAGR in air-traffic and it might just be enough to support the energy demand for a 5% CAGR in air traffic. It is to be noted that the present air traffic growth rate is 4% [4]. Additionally, the SAF supply is expected to be dominated by PtL and advanced feedstocks as per ATAG.
Figure 10 shows the energy demand forecast for long-haul aviation and supply of green hydrogen. It is to be noted that this analysis (in Figure 10) assumes that all long-haul aviation will be powered by hydrogen. It can be observed from Figure 10 that the supply of hydrogen in 2050, considering the uncertainties, would satisfy a 3% CAGR in air-traffic according to ATAG and McKinsey (MK) green hydrogen supply estimates. However, for a 5% CAGR in air traffic, ATAG 2050 supply estimates for hydrogen would support the required energy demand but for MK supply estimates the energy demand might be met with at least current trajectory and/or accelerated production capacities (scenarios are part of the uncertainty band). Furthermore, it is extremely important to note that these estimates are global estimates and there would be other sectors competing with aviation for hydrogen.
Considering the high-level analysis in this sub-section, the forecasted SAF and hydrogen supply in 2050 can meet the energy demand of long-haul aviation with the present air traffic CAGR of 4% if flights are completely powered by either of the two fuels. An increase in air traffic CAGR (to 5%) and other competing sectors, necessitates ramping up of production capacities, especially for hydrogen. Alternatively, some of the long-haul flights could be powered with SAF and some with hydrogen, such that the energy supply easily meets the required energy demand while the energy demand from other sectors are satisfied simultaneously. In any scenario, to enable a climate neutral long-haul aviation, the production capacities of SAF and hydrogen should be increased than the existing production trajectories.
3.1.5. Limitations of the Present Work
The fuel WTP emissions database used in this work is primarily based on the GREET model which is US specific. The WTP emissions are sensitive to country’s energy mix, availability of raw materials (according to the location) and the number of such locations in the country (determines the transportation emissions), transportation mode used (emissions and efficiency, viz. rail vs trucks, electricity/battery vs diesel, etc.), transportation network and its efficiency (direct connectivity between two points, terrain type of the transportation network, etc.), and fuel manufacturing plant efficiency. Additionally, for LH2 fuel it is assumed that the pump to tank emission is zero. This assumption is simplistic and there could be some emissions associated in terms of energy/emission required to maintain the cryogenic temperature and pressure while filling LH2 fuel in the aircraft tank, transportation used (depending on the location of the fuel storage at or away from airport), and fuel losses while filling LH2 fuel in aircraft tank. Also, NOx estimation in this work is based on a simplified (multi-segment) mission where the energy consumption in smaller flight segments is calculated using the modifications to Roskam’s fuel fraction. Moreover, the quantification of net non-CO2 emissions used in this work for use-phase emissions (including contrails) are based on literature. The errors from those studies will add up in the results of this work. Lastly, this work does not conduct cost analysis for aircraft mission powered by different fuels produced from various feedstocks and/or pathways.
4. Conclusions
Liquid hydrogen and 100% synthetic paraffin kerosene could serve as alternatives to Jet-A for long-haul aviation, provided they are produced from feedstocks and/or processes that ensure zero life cycle well-to-wake emissions. In this work, the life cycle or well-to-wake performance is evaluated for long-range large twin aisle aircraft powered by liquid hydrogen and 100% synthetic paraffin kerosene or SAF (separately) manufactured from different feedstocks and/or pathways. The GREET model is used for making a database of fuel manufacturing phase emissions for liquid hydrogen and 100% synthetic paraffin kerosene (bio-jet and power-to-liquid fuel), and the use-phase emissions are quantified separately in this work. In this work, the sensitivity of hydrogen sourcing to SPK production, and of biomass sourcing for some hydrogen production pathways, are addressed. Similarly, this work addresses the sensitivity of energy mix to alternative fuel production.
After examining over 100 different ways in total for producing liquid hydrogen and 100% synthetic paraffin kerosene, it is observed that liquid hydrogen fuel can enable net zero or negative well-to-wake CO2 equivalent emissions for long-range (blended wing body aircraft) flight of 300 passengers where liquid hydrogen fuel is produced from Biomass (liquefication is done using US electricity mix and manufacturing unit employing carbon sequestration) (260.8% – 266.1% reduction), Biomass (liquefication is done using electricity from biomass integrated gasification combined cycle and manufacturing unit employing carbon sequestration) (296.2% – 302.6% reduction), and/or integrated fermentation with carbon sequestration (96.2% – 150.7% reduction). This aligns with the decarbonization strategies of the International Air Transport Association of use of alternative fuel and carbon capture. Also, it is found that non-CO2 emissions are significant to the net well-to-wake CO2 equivalent emissions, and operational strategies need to be employed for reducing contrail formation. It is to be noted that the quantification of non-CO2 effects (such as contrails) from hydrogen aircraft in literature is relatively at a nascent stage and more research work is required. The well-to-wake CO2 equivalent emissions of 100% synthetic paraffin kerosene long-range (blended wing body aircraft) flight of 300 passengers can be reduced (on an average) by 70% – 85% (depending on SAF manufacturing pathways), using miscanthus as a feedstock, compared to Jet-A. It is to be noted that there could be a significant variability in the life cycle emissions for any given fuel and the manufacturing pathway, especially due to the carbon intensity of the sourced feedstock.
Based on the high-level analysis in this work, the projected SAF and hydrogen supply in 2050 can meet the energy demand of long-haul aviation with the current air traffic CAGR of 4%, assuming all flights are powered solely by one of these two fuels. However, if the air traffic CAGR increases to 5% and other sectors also compete for energy, production capacities, especially for hydrogen, will need to be scaled up. Alternatively, a mix of SAF and hydrogen could be used for long-haul flights, ensuring the energy supply meets the demand while also satisfying the needs of other sectors. In any case, achieving climate-neutral long-haul aviation will require boosting the production capacities of SAF and hydrogen beyond current projections.
The perspective used to select three feedstock and/or pathways for liquid hydrogen fuel identified in this work, only take into consideration the well-to-wake CO2 equivalent emissions. However, for commercial aviation the fuel cost and the resulting direct operating cost (inclusive of carbon tax exemption) are significant aspects which also needs to be accounted for identifying fuel manufacturing pathways for both liquid hydrogen and 100% synthetic paraffin kerosene, which are not considered in this work. The fossil-fuel based energy consumption in fuel manufacturing phase should be reduced by increasing the share of renewables in the energy mix and improving the energy efficiency of the fuel manufacturing process and supply chain, for making SAF and/or liquid hydrogen an environmentally and socially benign aviation fuels. This work will inform: (i) research and development investments aimed at increasing production capacities for identified fuel manufacturing processes; (ii) assessments of fuel costs; and (iii) the formulation of aviation policies. Lastly, the success of liquid hydrogen powered aviation requires appropriate airport infrastructure, aircraft design, air-traffic or operations management, safety, and fuel supply chain/manufacturing capacity and energy efficiency, to meet the required fuel demand, fuel cost and direct operating cost, and policy.
More information:
Nomenclature
Abbreviations
| ATAG | Air Transport Action Group | LNGCC | Liquification using power from natural gas combined cycle |
| ATJ | Alcohol-to-jet | LTA | large twin aisle |
| B. | Biological plant type | LUSME | Liquefication using US mix electricity |
| BC | Black carbon | L-Nuclear | Liquefication using electricity from nuclear energy |
| BWB | Blended wing body | L-Solar | Liquefication using electricity from solar energy |
| By-product Cl plant | H2 produced as a by-product of chlorine manufacturing plant | Flight Mach number | |
| CAGR | Compound annual growth rate | MK | McKinsey |
| CDM | Corn with dry mill | MW | Molecular weight |
| CDMWE | Corn dry mill with extraction | NAFG | North American flared gas |
| CDMWOE | Corn dry mill without extraction | NANG | North American natural gas |
| CH4 | Methane | NGCC | Natural gas combined cycle |
| CO | Carbon monoxide | NGL | Natural gas liquid |
| CO2 | Carbon dioxide | NOx | Oxides of nitrogen |
| COG | Coke oven gas | N2O | Nitrous oxide |
| CORSIA | Carbon offsetting and reduction scheme for international aviation | N+2 | 2030+ timeframe |
| CS | Carbon sequestration | OC | Organic carbon |
| CUSM | Corn US mix | PM | Particulate matter |
| CWEH | Catalytic with external H2 plant type | PtL | Power-to-liquid |
| CWHBG | Catalytic with H2 from biomass gasification plant type | , | parts per million of oxides of nitrogen |
| CWIH | Catalytic with in-situ H2 plant type | PTWa | Pump-to-wake |
| CWM | Corn wet mill | PV | Photovoltaics |
| D. | Distributed | RNG | Renewable natural gas |
| FFB | Fresh fruit bunch | SAF | Sustainable aviation fuel |
| FT | Fischer–Tropsch | SC | Steam cracking |
| GHG | Greenhouse gas | SI | Supplementary information |
| GREET | Greenhouse Gases, Regulated Emissions, and Energy Use in Technologies | SLS | Sea level static |
| GWP | Global warming potential | SMR | Steam methane reformation |
| HEFA | Hydro-processed esters and fatty acids | SOEC | Solid oxide electrolysis cell |
| HRJ | Hydro-processed renewable jet fuel | SOx | Oxides of sulphur |
| HTE | High temperature electrolysis | SO2 | Sulphur Dioxide |
| HTGR | High temperature gas reactor | SPK | Synthetic paraffinic kerosene |
| IATA | International Air Transport Association | STJ | Sugar-to-jet fuel |
| IF | Integrated fermentation | S. | Standalone |
| LBIGCC | Liquefied using electricity from biomass integrated gasification combined cycle | TCCW | Thermochemical cracking of water |
| LCIGCC | Liquification using electricity from coal integrated gasification combined cycle | VOC | Volatile organic compound |
| LDI | Lean direct injection | w CS | With carbon sequestration |
| LH2 | Liquid hydrogen | WTP | Well-to-pump |
| WTWa | Well-to-wake |
| w/o CS | Without carbon sequestration |
Symbols
| , and | Correlation constants for emission index based on hydrogen data |
| Correlation constant for emission index based on Jet-A fuel | |
| EI | Emission index |
| or FAR | Fuel air ratio |
| Flight altitude (in feet) | |
| Humidity correction factor | |
| Ambient pressure (in Pa) | |
| Total pressure (in Pa) | |
| Combustor inlet pressure (in MPa) | |
| Ambient temperature (in K) | |
| Total temperature (in K) | |
| Combustor inlet temperature (in K) | |
| WF,block | Block fuel weight |
| Pressure correction factor | |
| Specific heat ratio (1.4 for air) | |
| Fuel injector air flow pressure drop ratio | |
| Φ | Equivalence ratio |
| Hydrogen equivalence ratio | |
| Combustor residence time | |
| Temperature correction factor |
References
- D. S. Lee, “The current state of scientific understanding of the non-CO2 effects of aviation on climate,” Manchester Metropolitan University, 2018. https://assets.publishing.service.gov.uk/government/uploads/system/uploads/attachment_data/file/813342/non-CO2-effects-report.pdf (accessed Jan. 02, 2020).
- D. S. Lee et al., “The contribution of global aviation to anthropogenic climate forcing for 2000 to 2018,” Atmos. Environ., vol. 244, p. 117834, Jan. 2021. [CrossRef]
- D. S. Lee, M. R. Allen, N. Cumpsty, B. Owen, K. P. Shine, and A. Skowron, “Uncertainties in mitigating aviation non-CO 2 emissions for climate and air quality using hydrocarbon fuels,” Environ. Sci. Atmos., vol. 3, no. 12, pp. 1693–1740, Dec. 2023. [CrossRef]
- Boeing, “COMMERCIAL MARKET OUTLOOK 2024–2043,” 2024. https://www.boeing.com/commercial/market/commercial-market-outlook#overview (accessed Oct. 02, 2024).
- J. Hupe, “Setting the Scene-Aviation and Climate Change,” ICAO_Aviation_Green_Recovery_Seminar, 2020. https://www.icao.int/Meetings/GreenRecoverySeminar/Documents/1.1 ICAO AGR - Setting the scene.pdf (accessed Jun. 05, 2021).
- S. S. Jagtap, P. R. N. Childs, and M. E. J. Stettler, “Energy performance evaluation of alternative energy vectors for subsonic long-range tube-wing aircraft,” Transp. Res. Part D Transp. Environ., vol. 115, p. 103588, Feb. 2023. [CrossRef]
- M. V Chester and A. Horvath, “Environmental assessment of passenger transportation should include infrastructure and supply chains,” Environ. Res. Lett., vol. 4, no. 2, p. 024008, Apr. 2009. [CrossRef]
- ANL, “GREET 2021,” Argonne National Laboratory, 2021. https://greet.es.anl.gov/.
- World Economic Forum, “Target True Zero Unlocking Sustainable Battery and Hydrogen-Powered Flight - Insight Report,” 2022. Accessed: Aug. 05, 2022. [Online]. Available: https://www3.weforum.org/docs/WEF_Target_True_Zero_Aviation_ROUND_2022.pdf.
- S. S. Jagtap, “Sustainability assessment of hydro-processed renewable jet fuel from algae from market-entry year 2020: Use in passenger aircrafts,” in 16th AIAA Aviation Technology, Integration, and Operations Conference, Jun. 2016. [CrossRef]
- S. S. Jagtap, “Assessment of feedstocks for blended alcohol-to-jet fuel manufacturing from standalone and distributed scheme for sustainable aviation,” in AIAA Propulsion and Energy 2019 Forum, 2019. [CrossRef]
- S. S. Jagtap, “Comparative assessment of manufacturing setups for blended sugar-to-aviation fuel production from non-food feedstocks for green aviation,” in AIAA Propulsion and Energy 2019 Forum, 2019. [CrossRef]
- S. S. Jagtap, “Evaluation of blended Fischer-Tropsch jet fuel feedstocks for minimizing human and environmental health impacts of aviation,” in AIAA Propulsion and Energy 2019 Forum, 2019. [CrossRef]
- S. S. Jagtap, P. R. N. Childs, and M. E. J. Stettler, “Performance sensitivity of subsonic liquid hydrogen long-range tube-wing aircraft to technology developments,” Int. J. Hydrogen Energy, vol. 50, pp. 820–833, Jan. 2024. [CrossRef]
- S. S. Jagtap, P. R. N. Childs, and M. E. J. Stettler, “Conceptual design-optimisation of a future hydrogen-powered ultrahigh bypass ratio geared turbofan engine,” Int. J. Hydrogen Energy, vol. 95, pp. 317–328, Dec. 2024. [CrossRef]
- S. S. Jagtap, P. R. N. Childs, and M. E. J. Stettler, “Conceptual design-optimisation of a subsonic hydrogen-powered long-range blended-wing-body aircraft,” Int. J. Hydrogen Energy, vol. 96, pp. 639–651, Dec. 2024. [CrossRef]
- P. Proesmans and R. Vos, “Comparison of future aviation fuels to minimize the climate impact of commercial aircraft,” AIAA Aviat. 2022 Forum, 2022. [CrossRef]
- P. Proesmans and R. Vos, “Hydrogen, medium-range airplane design optimization for minimal global warming impact,” CEAS Aeronaut. J., pp. 1–26, May 2024. [CrossRef]
- S. Pinheiro Melo et al., “Sustainability Assessment and Engineering of Emerging Aircraft Technologies—Challenges, Methods and Tools,” Sustainability, vol. 12, no. 14, p. 5663, Jul. 2020. [CrossRef]
- D. Keiser, L. H. Schnoor, B. Pupkes, and M. Freitag, “Life cycle assessment in aviation: A systematic literature review of applications, methodological approaches and challenges,” J. Air Transp. Manag., vol. 110, p. 102418, Jul. 2023. [CrossRef]
- P. Su-ungkavatin, L. Tiruta-Barna, and L. Hamelin, “Methodological framework for Life Cycle Assessment of sustainable aviation (SA) systems,” Sci. Total Environ., vol. 885, p. 163881, Aug. 2023. [CrossRef]
- B. W. Kolosz, Y. Luo, B. Xu, M. M. Maroto-Valer, and J. M. Andresen, “Life cycle environmental analysis of ‘drop in’ alternative aviation fuels: a review,” Sustain. Energy Fuels, vol. 4, no. 7, pp. 3229–3263, Jun. 2020. [CrossRef]
- F. Afonso et al., “Strategies towards a more sustainable aviation: A systematic review,” Prog. Aerosp. Sci., vol. 137, p. 100878, Feb. 2023. [CrossRef]
- S. De Jong et al., “Life-cycle analysis of greenhouse gas emissions from renewable jet fuel production,” Biotechnol. Biofuels, vol. 10, no. 1, pp. 1–18, Mar. 2017. [CrossRef]
- M. Braun, W. Grimme, and K. Oesingmann, “Pathway to net zero: Reviewing sustainable aviation fuels, environmental impacts and pricing,” J. Air Transp. Manag., vol. 117, p. 102580, May 2024. [CrossRef]
- S. S. Jagtap, “Non-food feedstocks comparison for renewable aviation fuel production towards environmentally and socially responsible aviation,” in 2019 AIAA Propulsion & Energy Forum, 2019.
- S. Delbecq, T. Planès, A. Salgas, F. Pollet, and V. Budinger, “Climate and energy impact analysis of electric, hybrid-electric and hydrogen aircraft in prospective scenarios for air transport,” 2024. https://hal.science/hal-04659593 (accessed Aug. 04, 2024).
- P. Schmidt, V. Batteiger, A. Roth, W. Weindorf, and T. Raksha, “Power-to-Liquids as Renewable Fuel Option for Aviation: A Review,” Chemie Ing. Tech., vol. 90, no. 1–2, pp. 127–140, Jan. 2018. [CrossRef]
- Y. Bicer and I. Dincer, “Life cycle evaluation of hydrogen and other potential fuels for aircrafts,” Int. J. Hydrogen Energy, vol. 42, no. 16, pp. 10722–10738, Apr. 2017. [CrossRef]
- J. Mukhopadhaya and D. Rutherford, “Performance analysis of evolutionary hydrogen-powered aircraft,” International Council on Clean Transportation, 2022. https://theicct.org/publication/aviation-global-evo-hydrogen-aircraft-jan22/ (accessed Jun. 04, 2022).
- J. I. C. Lau et al., “Emerging technologies, policies and challenges toward implementing sustainable aviation fuel (SAF),” Biomass and Bioenergy, vol. 186, p. 107277, Jul. 2024. [CrossRef]
- P. J. Ansell, “Review of sustainable energy carriers for aviation: Benefits, challenges, and future viability,” Prog. Aerosp. Sci., vol. 141, p. 100919, Aug. 2023. [CrossRef]
- Z. Song, Z. Li, and Z. Liu, “Comparison of Emission Properties of Sustainable Aviation Fuels and Conventional Aviation Fuels: A Review,” Appl. Sci. 2024, Vol. 14, Page 5484, vol. 14, no. 13, p. 5484, Jun. 2024. [CrossRef]
- P. Su-ungkavatin, L. Tiruta-Barna, and L. Hamelin, “Biofuels, electrofuels, electric or hydrogen?: A review of current and emerging sustainable aviation systems,” Prog. Energy Combust. Sci., vol. 96, p. 101073, May 2023. [CrossRef]
- E. Cabrera and J. M. M. de Sousa, “Use of Sustainable Fuels in Aviation—A Review,” Energies 2022, Vol. 15, Page 2440, vol. 15, no. 7, p. 2440, Mar. 2022. [CrossRef]
- H. Wei, W. Liu, X. Chen, Q. Yang, J. Li, and H. Chen, “Renewable bio-jet fuel production for aviation: A review,” Fuel, vol. 254. Elsevier Ltd, p. 115599, Oct. 15, 2019. [CrossRef]
- N. Pavlenko, S. Searle, and A. Christensen, “The cost of supporting alternative jet fuels in the European Union,” International Council on Clean Transportation. https://theicct.org/sites/default/files/publications/Alternative_jet_fuels_cost_EU_20190320.pdf (accessed Jul. 13, 2019).
- INTERNATIONAL CIVIL AVIATION ORGANIZATION, “CORSIA Default Life Cycle Emissions Values for CORSIA Eligible Fuels,” INTERNATIONAL CIVIL AVIATION ORGANIZATION, Mar. 2021. https://www.icao.int/environmental-protection/CORSIA/Documents/ICAO document 06 - Default Life Cycle Emissions - March 2021.pdf (accessed May 31, 2022).
- M. Prussi et al., “CORSIA: The first internationally adopted approach to calculate life-cycle GHG emissions for aviation fuels,” Renew. Sustain. Energy Rev., vol. 150, p. 111398, Oct. 2021. [CrossRef]
- Elisabeth van der Sman, Bram Peerlings, Johan Kos, Rogier Lieshout, and Thijs Boonekamp, “Destination 2050 – A route to net zero European Aviation - SEO Economisch Onderzoek,” NLR – Royal Netherlands Aerospace Centre, 2021. https://www.seo.nl/en/publications/destination-2050-a-route-to-net-zero-european-aviation/ (accessed May 31, 2022).
- D. M. Saad, T. Terlouw, R. Sacchi, and C. Bauer, “Life Cycle Economic and Environmental Assessment of Producing Synthetic Jet Fuel Using CO2/Biomass Feedstocks,” Environ. Sci. Technol., vol. 58, no. 21, pp. 9158–9174, May 2024. [CrossRef]
- R. G. Grim et al., “Electrifying the production of sustainable aviation fuel: the risks, economics, and environmental benefits of emerging pathways including CO2,” Energy Environ. Sci., vol. 15, no. 11, pp. 4798–4812, Nov. 2022. [CrossRef]
- R. Sacchi et al., “How to make climate-neutral aviation fly,” Nat. Commun. 2023 141, vol. 14, no. 1, pp. 1–17, Jul. 2023. [CrossRef]
- M. Micheli, D. Moore, V. Bach, and M. Finkbeiner, “Life-Cycle Assessment of Power-to-Liquid Kerosene Produced from Renewable Electricity and CO2 from Direct Air Capture in Germany,” Sustain., vol. 14, no. 17, p. 10658, Sep. 2022. [CrossRef]
- V. Papantoni et al., “Life Cycle Assessment of Power-to-Liquid for Aviation: A Case Study of a Passenger Aircraft,” in 10th International Conference on Life Cycle Management, LCM 2021, 2022. [CrossRef]
- J. Klenner, M. T. Lund, H. Muri, and A. H. Strømman, “Combining Fleetwide AviTeam Aviation Emission Modeling with LCA Perspectives for an Alternative Fuel Impact Assessment,” Environ. Sci. Technol., vol. 58, no. 21, pp. 9135–9146, May 2024. [CrossRef]
- Vanlandingham, “Environmental and Economic Impact of Transport Aircraft Using Sustainable Aviation Fuel or Liquid-Hydrogen as Alternative Fuels,” Penn State, 2024. Accessed: Jul. 03, 2024. [Online]. Available: https://etda.libraries.psu.edu/catalog/32384avv5448.
- VanLandingham and D. K. Hall, “Conceptual Design Optimization of Liquid-Hydrogen-Fueled Transport Aircraft for Environmental and Economic Performance,” Jun. 2023. [CrossRef]
- P. Prashanth et al., “Near-zero environmental impact aircraft,” Sustain. Energy Fuels, 2024. [CrossRef]
- Fantuzzi, N. M. Paola A. Saenz Cavazos, M. High, M. Bui, and I. von H. A. William Rutherford, “Low-carbon fuels for aviation,” Briefing Paper No 9, Institute for Molecular Science and Engineering, 2023. https://core.ac.uk/download/pdf/554493568.pdf (accessed Aug. 01, 2024).
- L. Dray et al., “Cost and emissions pathways towards net-zero climate impacts in aviation,” Nat. Clim. Chang. 2022 1210, vol. 12, no. 10, pp. 956–962, Sep. 2022. [CrossRef]
- G. Quante, N. Bullerdiek, S. Bube, U. Neuling, and M. Kaltschmitt, “Renewable fuel options for aviation – A System-Wide comparison of Drop-In and non Drop-In fuel options,” Fuel, vol. 333, p. 126269, Feb. 2023. [CrossRef]
- Penke, C. Falter, and V. Batteiger, “Pathways and Environmental Assessment for the Introduction of Renewable Hydrogen into the Aviation Sector,” Sustain. Prod. Life Cycle Eng. Manag., pp. 41–52, 2021. [CrossRef]
- K. Kossarev, A. E. Scholz, P. Egerer, and M. Hornung, “Comparison of Environmental Life Cycle Impact Assessment Methods for Future Aircraft Designs,” AIAA Aviat. 2022 Forum, 2022. [CrossRef]
- K. Kossarev, A. E. Scholz, and M. Hornung, “Comparative environmental life cycle assessment and operating cost analysis of long-range hydrogen and biofuel fueled transport aircraft,” CEAS Aeronaut. J., vol. 14, no. 1, pp. 3–28, Jan. 2023. [CrossRef]
- K. Mazur, M. Saleh, and M. Hornung, “Integrating Life Cycle Assessment in Conceptual Aircraft Design: A Comparative Tool Analysis,” Aerosp. 2024, Vol. 11, Page 101, vol. 11, no. 1, p. 101, Jan. 2024. [CrossRef]
- S. Tveitan, “Life cycle assessment of hydrogen fuel in aviation,” University of Bergen, 2020. Accessed: Aug. 04, 2024. [Online]. Available: https://bora.uib.no/bora-xmlui/bitstream/handle/1956/23149/Stine-Tveitan_Life-cycle-assessment-of-hydrogen-fuel-in-aviation_2020-06-15.pdf?sequence=1&isAllowed=y.
- J. L. Chan, Y. Sun, and H. Smith, “Conceptual Designs of Blended Wing Body Aircraft for the Application of Alternative Fuels,” in AIAA AVIATION FORUM AND ASCEND 2024, 2024. [CrossRef]
- Siddiqui and I. Dincer, “A comparative life cycle assessment of clean aviation fuels,” Energy, vol. 234, p. 121126, Nov. 2021. [CrossRef]
- S. V. Ratner, C. Yuri, and N. H. Hien, “Prospects of Transition of Air Transportation to Clean Fuels: Economic and Environmental Management Aspects,” Int. Energy J., vol. 19, no. 3, 2019, Accessed: May 30, 2022. [Online]. Available: http://www.rericjournal.ait.ac.th/index.php/reric/article/view/2084.
- Koroneos, A. Dompros, G. Roumbas, and N. Moussiopoulos, “Advantages of the use of hydrogen fuel as compared to kerosene,” Resour. Conserv. Recycl., vol. 44, no. 2, pp. 99–113, May 2005. [CrossRef]
- K. Alsamri, J. J. De la Cruz, M. Emmanouilidi, J. L. Huynh, and J. Brouwer, “Methodology to Assess Emissions and Performance Trade-Offs for a Retrofitted Solid Oxide Fuel Cell Hybrid and Hydrogen Powered Aircraft,” Jan. 2023. [CrossRef]
- K. Alsamri, J. D. la Cruz, M. Emmanouilidi, J. Huynh, and J. Brouwer, “Methodology for Assessing Retrofitted Hydrogen Combustion and Fuel Cell Aircraft Environmental Impacts,” , pp. 1–16, Apr. 2024. [CrossRef]
- T. Miller, “Environmental Assessments of Capital-Intensive Product Systems,” Yale Grad. Sch. Arts Sci. Diss., Apr. 2021, Accessed: Jun. 03, 2022. [Online]. Available: https://elischolar.library.yale.edu/gsas_dissertations/240.
- T. R. Miller, M. Chertow, and E. Hertwich, “Liquid Hydrogen: A Mirage or Potent Solution for Aviation’s Climate Woes?,” Environ. Sci. Technol., vol. 57, no. 26, pp. 9627–9638, Jul. 2023. [CrossRef]
- S. Job, M. Campbell, B. Hall, Z. Hamadache, and N. Kumar, “SUSTAINABILITY REPORT - The Lifecycle Impact of Hydrogen-Powered Aircraft,” 2022. Accessed: Jun. 05, 2022. [Online]. Available: https://www.ati.org.uk/wp-content/uploads/2022/03/FZO-STY-REP-0005-FlyZero-Sustainability-Report.pdf.
- Nikita Pavlenko and Stephanie Searle, “Assessing the sustainability implications of alternative aviation fuels,” International Council on Clean Transportation, 2021. https://theicct.org/publication/assessing-the-sustainability-implications-of-alternative-aviation-fuels/ (accessed Jun. 09, 2022).
- IATA, “IATA - Fly Net Zero,” 2024. https://www.iata.org/en/programs/sustainability/flynetzero/ (accessed Oct. 02, 2024).
- ANL, “GREET,” 2024. https://greet.anl.gov/index.php.
- ANL, “GREET 2021 Excel model,” 2021. https://greet.anl.gov/files/greet-2021rev1.
- ANL, “Argonne GREET Publications,” Argonne National Laboratory. https://greet.es.anl.gov/publications (accessed Jun. 08, 2022).
- Energy Information Administration, “Electricity,” Energy Information Administration, USA, 2021. https://www.eia.gov/outlooks/aeo/pdf/04 AEO2021 Electricity.pdf (accessed Jun. 08, 2022).
- L. Chen et al., “Towards precision aviation emission modeling: A hybrid paradigm of convolutional neural networks and semi-empirical formulas for full flight phase gas pollutant indices,” Sci. Total Environ., vol. 957, p. 177414, Dec. 2024. [CrossRef]
- F. Ge et al., “Predicting aviation non-volatile particulate matter emissions at cruise via convolutional neural network,” Sci. Total Environ., vol. 850, p. 158089, Dec. 2022. [CrossRef]
- L. Chen et al., “A convolutional neural network prediction model for aviation nitrogen oxides emissions throughout all flight phases,” Sci. Total Environ., vol. 929, p. 172432, Jun. 2024. [CrossRef]
- Y. Zhao et al., “Evaluating high-resolution aviation emissions using real-time flight data,” Sci. Total Environ., vol. 951, p. 175429, Nov. 2024. [CrossRef]
- Marek, T. Smith, and K. Kundu, “Low Emission Hydrogen Combustors for Gas Turbines Using Lean Direct Injection,” in 41st AIAA/ASME/SAE/ASEE Joint Propulsion Conference & Exhibit, Jul. 2005. [CrossRef]
- M. Schaefer and S. Bartosch, “Overview on fuel flow correlation methods for the calculation of NOx, CO and HC emissions and their implementation into aircraft performance software,” DLR, 2013. https://www.researchgate.net/publication/271210746_Overview_on_fuel_flow_correlation_methods_for_the_calculation_of_NOx_CO_and_HC_emissions_and_their_implementation_into_aircraft_performance_software (accessed Jun. 14, 2022).
- Boeing, “777 Flight Crew Training Manual Qatar Airways,” 2007. http://virtavia.online/wp-content/uploads/wpforo/attachments/1/975-B777-FCTM.pdf (accessed Jun. 16, 2022).
- “AIRBUS A350-900 - SKYbrary Aviation Safety.” https://www.skybrary.aero/index.php/A359 (accessed Jan. 21, 2021).
- “What do you know about take-off speed? V1, Vr, and V2.” https://www.aviationnepal.com/what-do-you-know-about-take-off-speed-v1-vr-and-v2/ (accessed Jun. 16, 2022).
- “Airbus A350-800 - Price, Specs, Photo Gallery, History - Aero Corner.” https://aerocorner.com/aircraft/airbus-a350-xwb/ (accessed Jun. 16, 2022).
- Svensson, “Potential of reducng the environmental impact of civil subsonic aviation by using liquid hydrogen,” Cranfield University, 2005. Accessed: Jun. 17, 2022. [Online]. Available: https://dspace.lib.cranfield.ac.uk/handle/1826/10726.
- International Air Transport Association, “Industry Statistics Fact Sheet 2024,” International Air Transport Association, 2024. https://www.iata.org/en/iata-repository/pressroom/fact-sheets/industry-statistics/ (accessed Oct. 02, 2024).
- “Boeing Cascade Climate Impact Model.” https://app.cascade.boeing.com/ (accessed Aug. 04, 2024).
- B. Graver, D. Rutherford, and S. Zheng, “CO2 emissions from commercial aviation: 2013, 2018, and 2019 - International Council on Clean Transportation,” ICCT, 2020. https://theicct.org/publication/co2-emissions-from-commercial-aviation-2013-2018-and-2019/ (accessed Nov. 28, 2024).
- R. Teoh, Z. Engberg, M. Shapiro, L. Dray, and M. E. J. Stettler, “The high-resolution Global Aviation emissions Inventory based on ADS-B (GAIA) for 2019-2021,” Atmos. Chem. Phys., vol. 24, no. 1, pp. 725–744, Jan. 2024. [CrossRef]
- “Boeing SAF Dashboard - Boeing Cascade Climate Impact Model.” https://cascade.boeing.com/perspectives/boeing-saf-dashboard/ (accessed Nov. 28, 2024).
- “Waypoint 2050 2nd edition: September 2021 (full report and summary) | ATAG.” https://atag.org/resources/waypoint-2050-2nd-edition-september-2021 (accessed Nov. 28, 2024).
- “Hydrogen production projects interactive map – Data Tools - IEA.” https://www.iea.org/data-and-statistics/data-tools/hydrogen-production-projects-interactive-map (accessed Nov. 28, 2024).
- “Global Energy Perspective 2023: Hydrogen outlook | McKinsey.” https://www.mckinsey.com/industries/oil-and-gas/our-insights/global-energy-perspective-2023-hydrogen-outlook (accessed Nov. 28, 2024).
- Svensson, “Potential of reducng the environmental impact of civil subsonic aviation by using liquid hydrogen,” Cranfield University, 2005. Accessed: Jun. 17, 2021. [Online]. Available: http://dspace.lib.cranfield.ac.uk/handle/1826/10726.
- R. Teoh, U. Schumann, A. Majumdar, and M. E. J. Stettler, “Mitigating the Climate Forcing of Aircraft Contrails by Small-Scale Diversions and Technology Adoption,” Environ. Sci. Technol., vol. 54, no. 5, pp. 2941–2950, Mar. 2020. [CrossRef]
- S. S. Jagtap, M. E. J. Stettler, and P. R. N. Childs, “Data in brief: Energy performance evaluation of alternative energy vectors for subsonic intercontinental tube-wing aircraft”.
- S. Jagtap, A. Strehlow, M. Reitz, S. Kestler, and G. Cinar, “Model-Based Systems Engineering Approach for a Systematic Design of Aircraft Engine Inlet,” in AIAA SCITECH 2025 Forum, 2025. [CrossRef]
- B. Emerson, S. Jagtap, J. M. Quinlan, M. W. Renfro, B. M. Cetegen, and T. Lieuwen, “Spatio-temporal linear stability analysis of stratified planar wakes: Velocity and density asymmetry effects,” Phys. Fluids, vol. 28, no. 4, p. 045101, Apr. 2016. [CrossRef]
- S. S. Jagtap, “A heat recovery system designed for shaft-powered aircraft gas turbine engines,” 2016.
- B. L. Emerson, S. Jagtap, and T. C. Lieuwen, “Stability Analysis of Reacting Wakes: Flow and Density Asymmetry Effects,” in 53rd AIAA Aerospace Sciences Meeting, Jan. 2015. [CrossRef]
- S. S. Jagtap, “Systems evaluation of subsonic hybrid-electric propulsion concepts for NASA N+3 goals and conceptual aircraft sizing,” Int. J. Automot. Mech. Eng., vol. 16, no. 4, pp. 7259–7286, 2019. [CrossRef]
- S. S. Jagtap, “A heat recovery system for shaft-driven aircraft gas turbine engines,” Oct. 29, 2014.
- S. S. Jagtap, “Evaluation of technology and energy vector combinations for decarbonising future subsonic long-range aircraft,” Imperial College London.
- S. S. Jagtap, M. E. J. Stettler, and P. R. N. Childs, “Data in brief: Performance sensitivity of subsonic liquid hydrogen long-range tube-wing aircraft to technology developments”.
- S. S. Jagtap, M. E. J. Stettler, and P. R. N. Childs, “Data in brief: Conceptual design-optimisation of futuristic hydrogen powered ultrahigh bypass ratio geared turbofan engine”.
- S. S. Jagtap, M. E. J. Stettler, and P. R. N. Childs, “Data in brief: Conceptual design-optimisation of a subsonic hydrogen-powered long-range blended-wing-body aircraft”.
- S. S. Jagtap, “Aero-thermodynamic analysis of space shuttle vehicle at re-entry,” IEEE Aerosp. Conf. Proc., vol. 2015-June, Jun. 2015. [CrossRef]
- S. Jagtap and S. Bhandari, “Solar Refrigeration,” Sardar Patel Int. Conf., 2012, [Online]. Available: https://papers.ssrn.com/sol3/papers.cfm?abstract_id=2103115.
- S. Jagtap and S. Bhandari, “Solar Refrigeration using Triple Fluid Vapor Absorption Refrigeration and Organic Rankine Cycle,” in Sardar Patel International Conference SPICON 2012 Mechanical, 2012.
- N. Komerath, S. Jagtap, and N. Hiremath, “Aerothermoelastic Tailoring for Waveriders,” in US Air Force Summer Faculty Fellowship Program, 2014.
- S. S. Jagtap, “Exploration of sustainable aviation technologies and alternative fuels for future inter-continental passenger aircraft.”.
- S. S. Jagtap, “Identification of sustainable technology and energy vector combinations for future inter-continental passenger aircraft.”.
- S. S. Jagtap, “Heat recuperation system for the family of shaft powered aircraft gas turbine engines,” US10358976B2, 2019 [Online]. Available: https://patents.google.com/patent/US10358976B2/en.
- S. S. Jagtap, “Heat recovery system for shaft powered aircraft gas turbine engines”.
- S. S. Jagtap and S. Bhandari, “Systems design and experimental study of a solar parabolic trough for solar refrigeration”.
- S. S. Jagtap, “Conceptual aircraft sizing using systems engineering for N+3 subsonic hybrid-electric propulsion concepts”.
- S. S. Jagtap, P. R. N. Childs, and M. E. J. Stettler, “Data in brief: Comparing alternative fuels for a futuristic subsonic long-range aircraft on a life cycle basis,” 2025.
- S. S. Jagtap, P. R. N. Childs, and M. E. J. Stettler, “Comparing alternative fuels for a futuristic subsonic long-range aircraft on a life cycle basis,” 2025.
- S. S. Jagtap, P. R. N. Childs, and M. E. J. Stettler, “Comparative life cycle evaluation of alternative fuels for a futuristic subsonic long-range aircraft,” Sustain. Prod. Consum., 2025.
- S. S. Jagtap, “An Apparatus for Exchanging Heat with Flow in an Annulus,” J. Eng. Sci. Technol. Rev., vol. 10, no. 1, pp. 173–176, 2017, Accessed: Jan. 11, 2019. [Online]. Available: http://www.jestr.org/downloads/Volume10Issue1/fulltext241012017.pdf.
Figure 1.
Schematic of WTWa emissions calculation process from WTP and PTWa emissions.
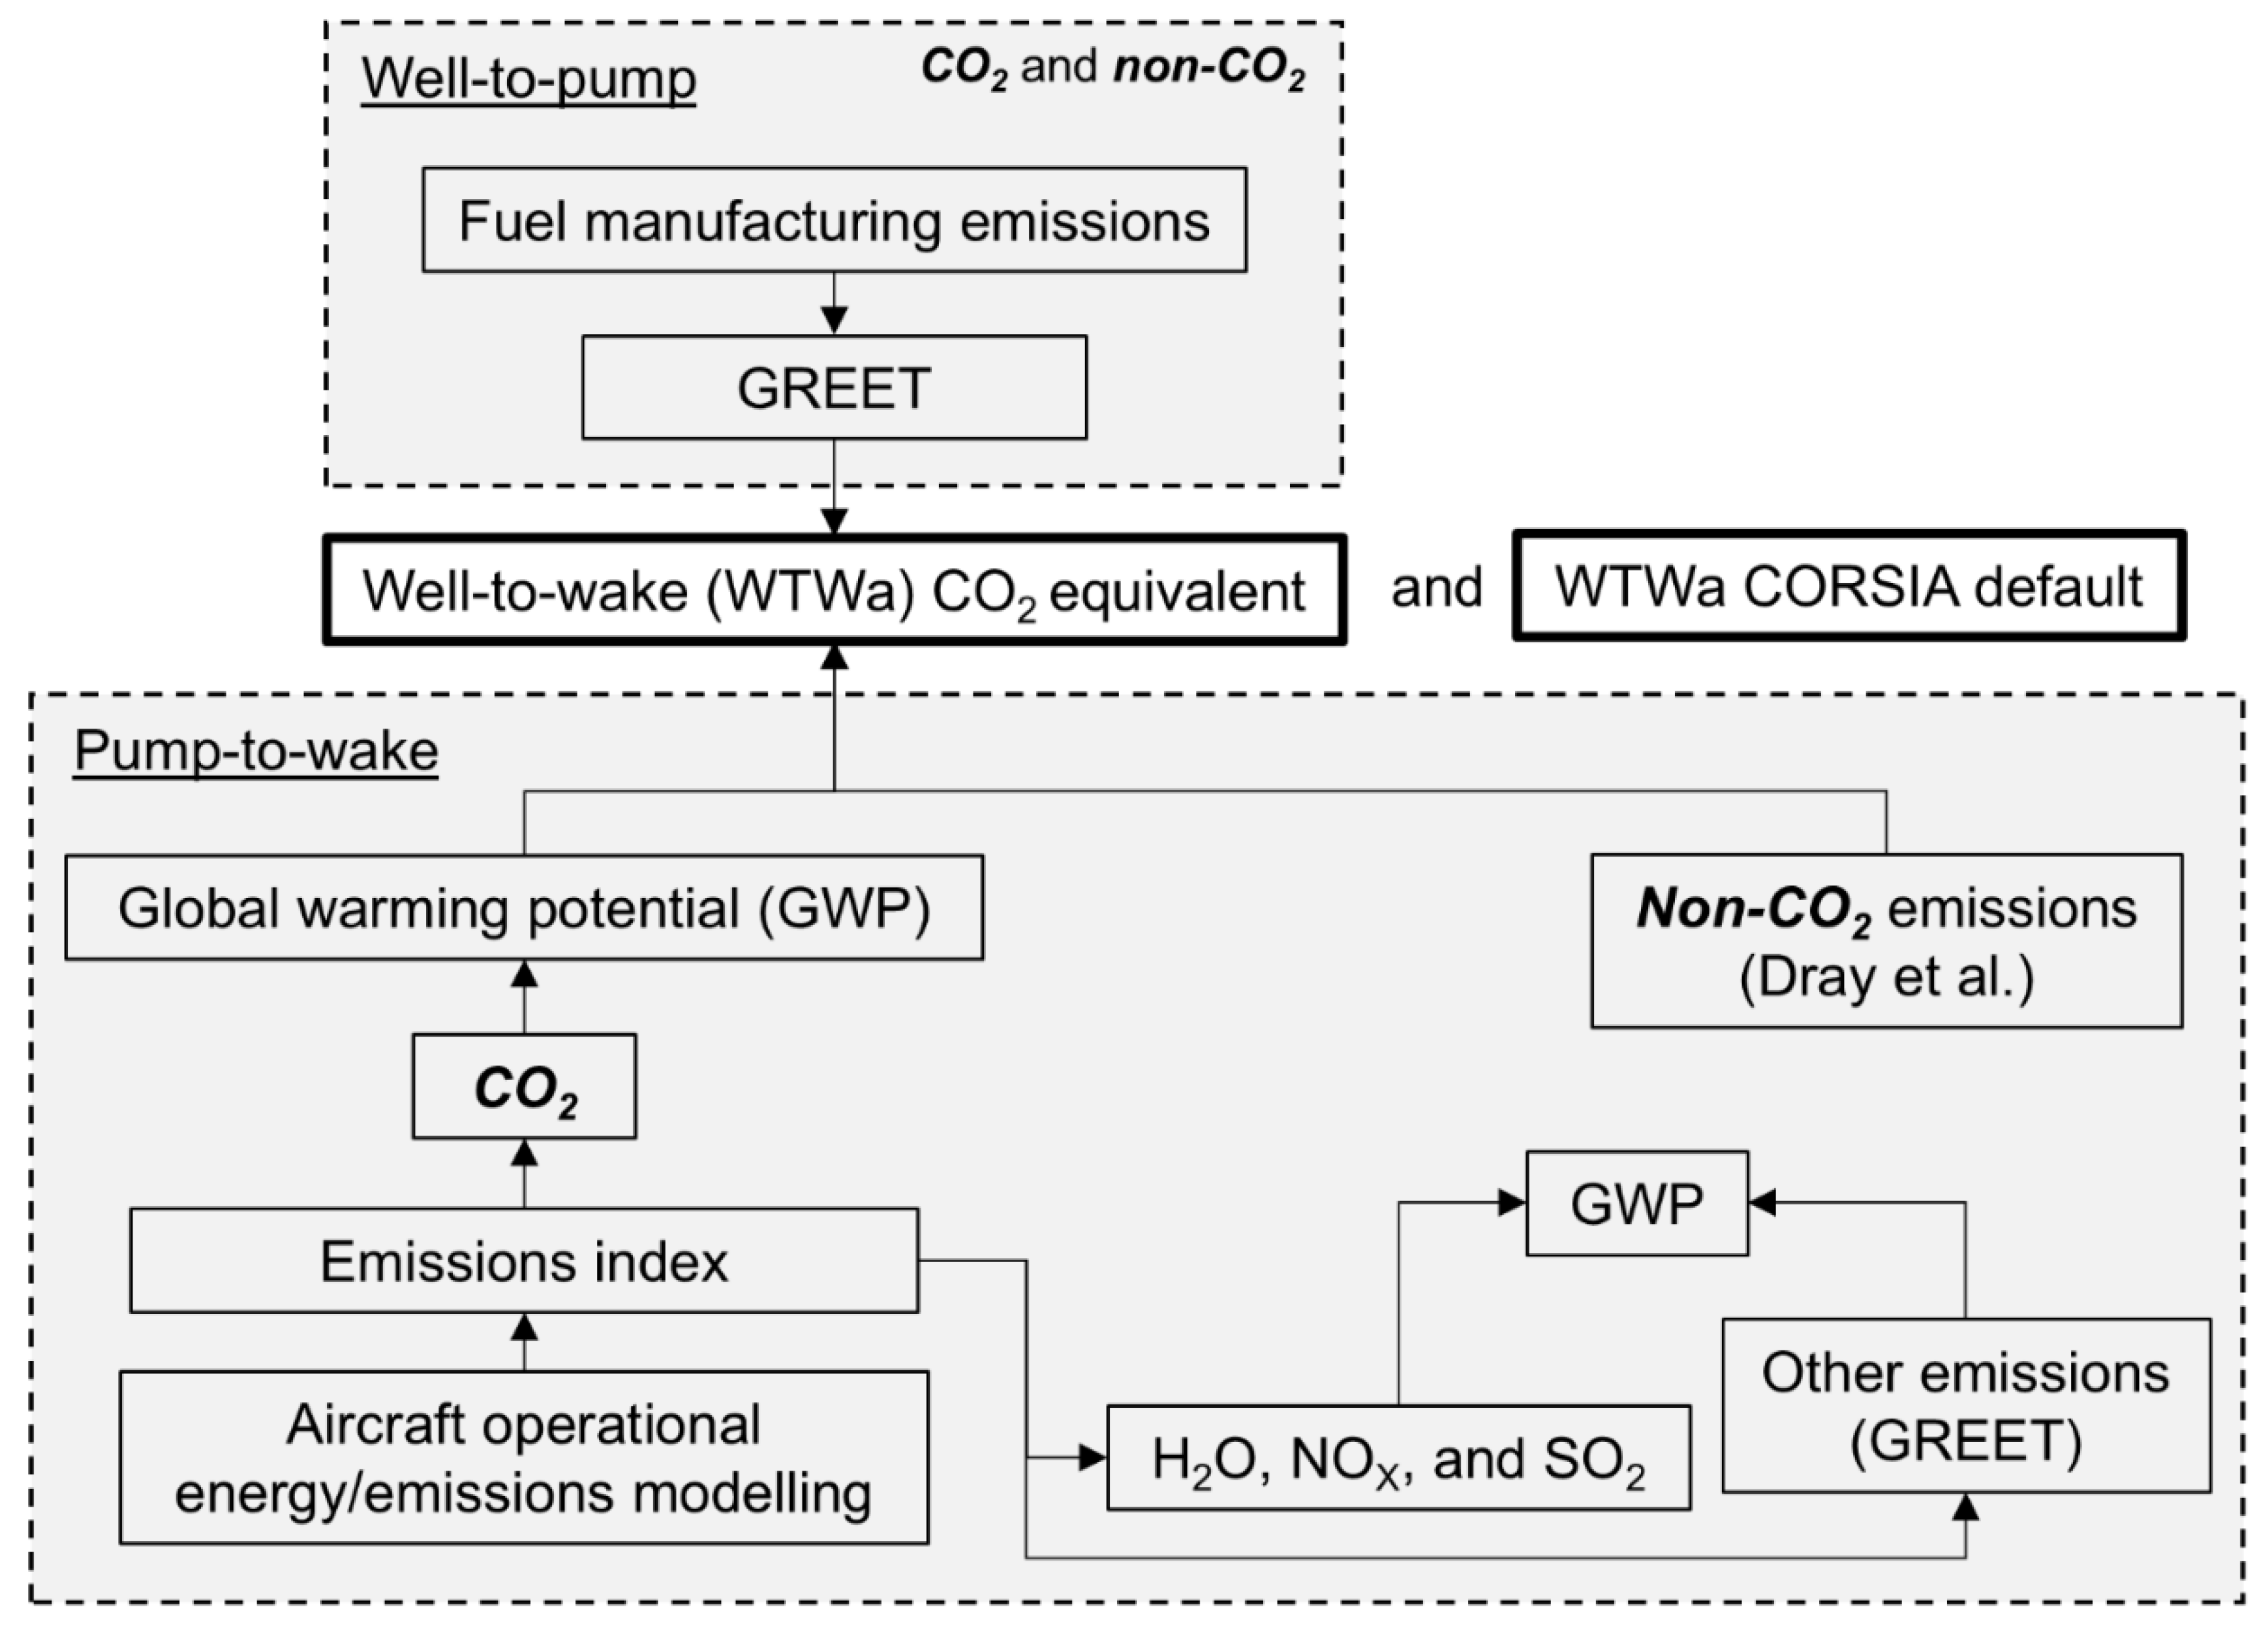
Figure 2.
WTWa comparison of different LH2 feedstocks and pathways for 2020 and 2050 (with only CO2 emissions in PTWa phase). [w/o: without; w: with; CS: Carbon sequestration; LUSME: liquification using US mix of electricity; COG: Coke oven gas; LCIGCC; Liquification using electricity from coal integrated gasification combined cycle; NANG: North American natural gas; LNGCC: Liquification using power from natural gas combined cycle; NGL: Natural gas liquid; SC: Stream cracking; RNG: Renewable natural gas; L-liquification; PV: Photovoltaic; TCCW: Thermochemical cracking of water; HTGR: high temperature gas reactor; LBIGCC: Liquefied using electricity from biomass integrated gasification combined cycle; IF: Integrated fermentation; HTE: High temperature electrolysis; SOEC: Solid oxide electrolysis cell; NGCC: Natural gas combined cycle].
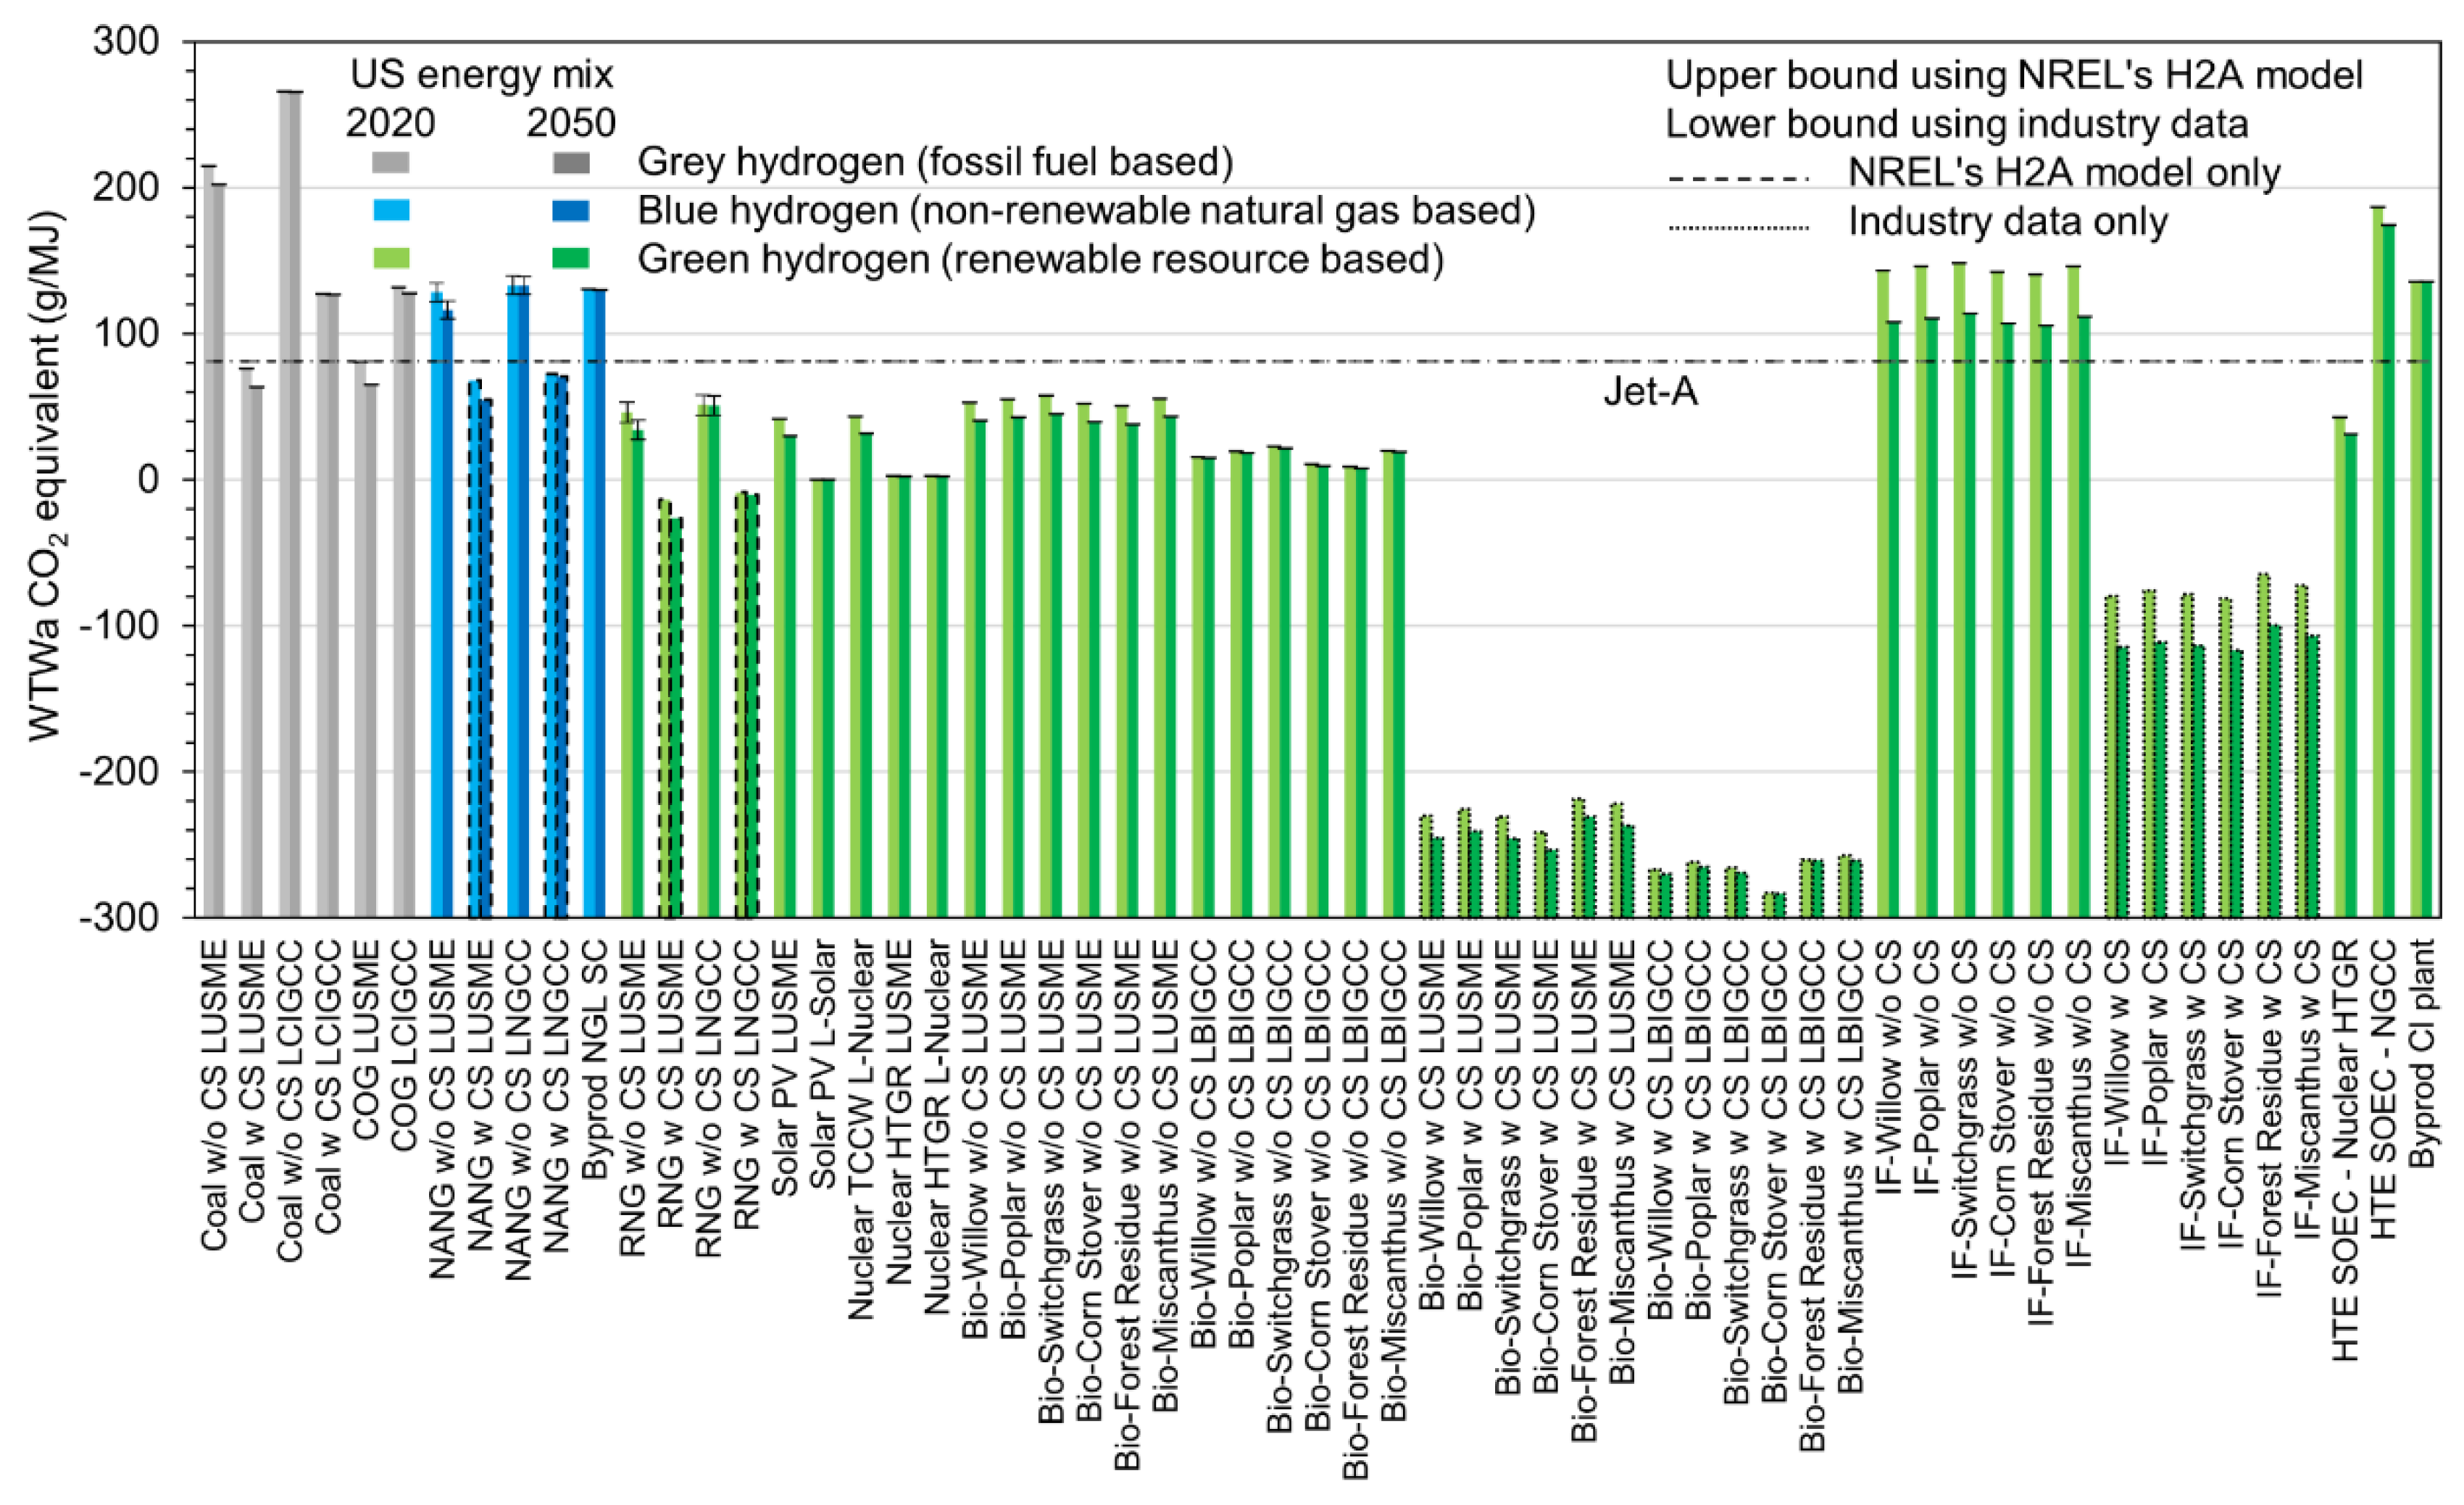
Figure 3.
WTWa CO2 equivalent emission comparison of different FT feedstocks for 2020 (with only CO2 emissions in PTWa phase). [NANG: North American natural gas; NAFG: North American flared gas].
Figure 3.
WTWa CO2 equivalent emission comparison of different FT feedstocks for 2020 (with only CO2 emissions in PTWa phase). [NANG: North American natural gas; NAFG: North American flared gas].
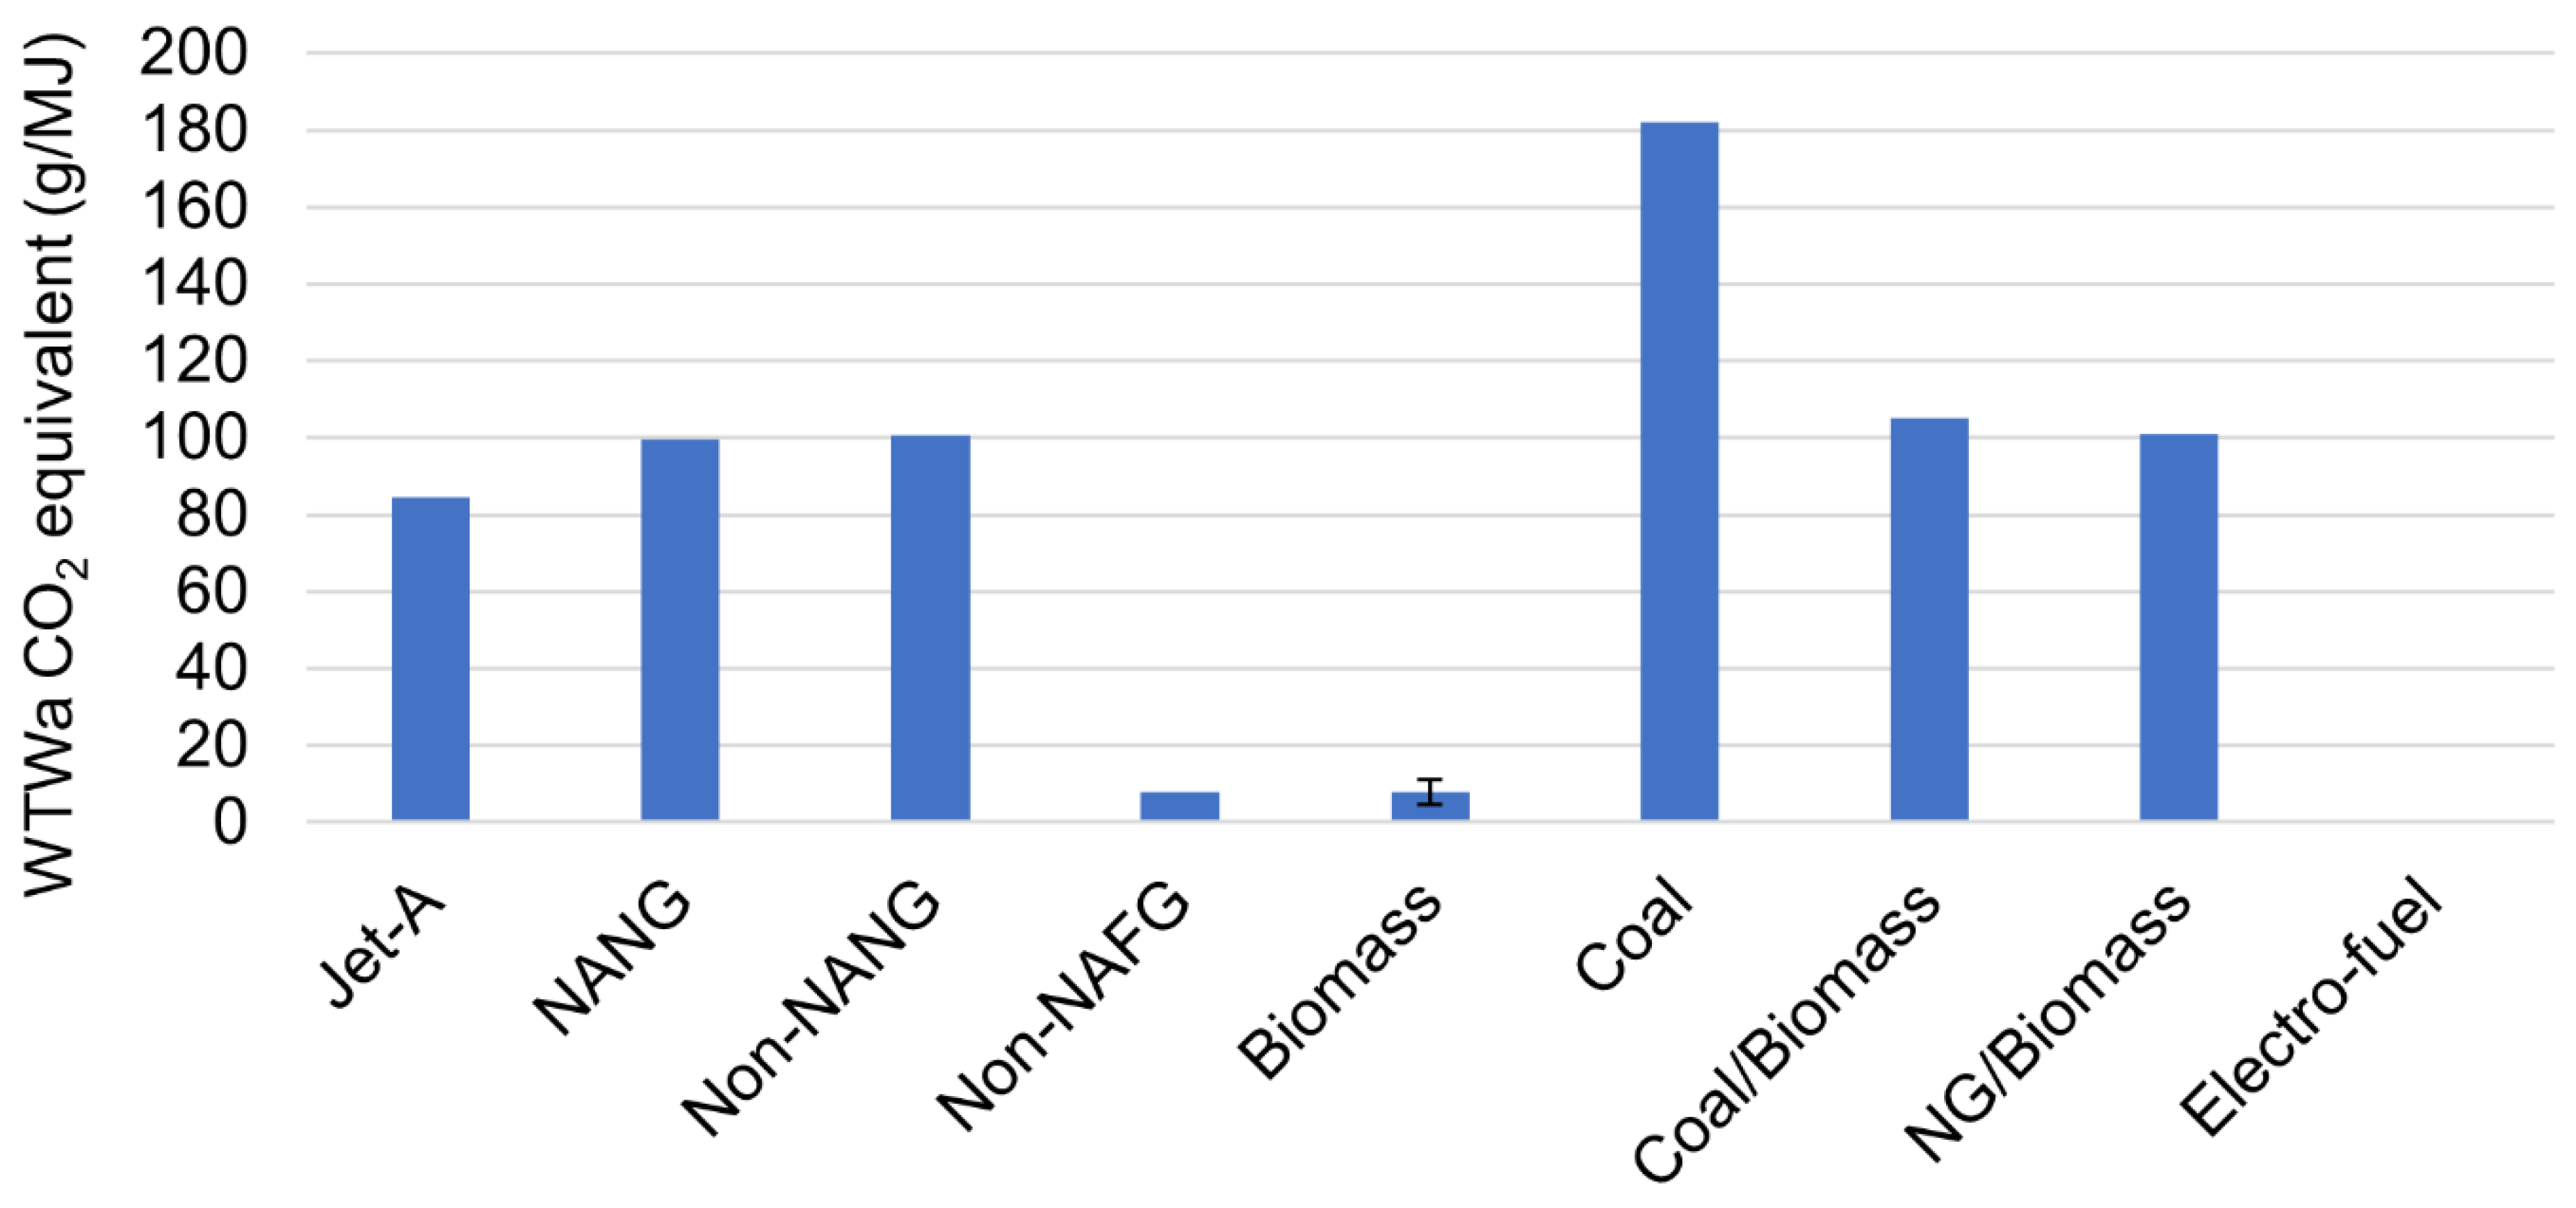
Figure 4.
WTWa CO2 equivalent emission comparison of different HEFA feedstocks for 2020 (with only CO2 emissions in PTWa phase).
Figure 4.
WTWa CO2 equivalent emission comparison of different HEFA feedstocks for 2020 (with only CO2 emissions in PTWa phase).
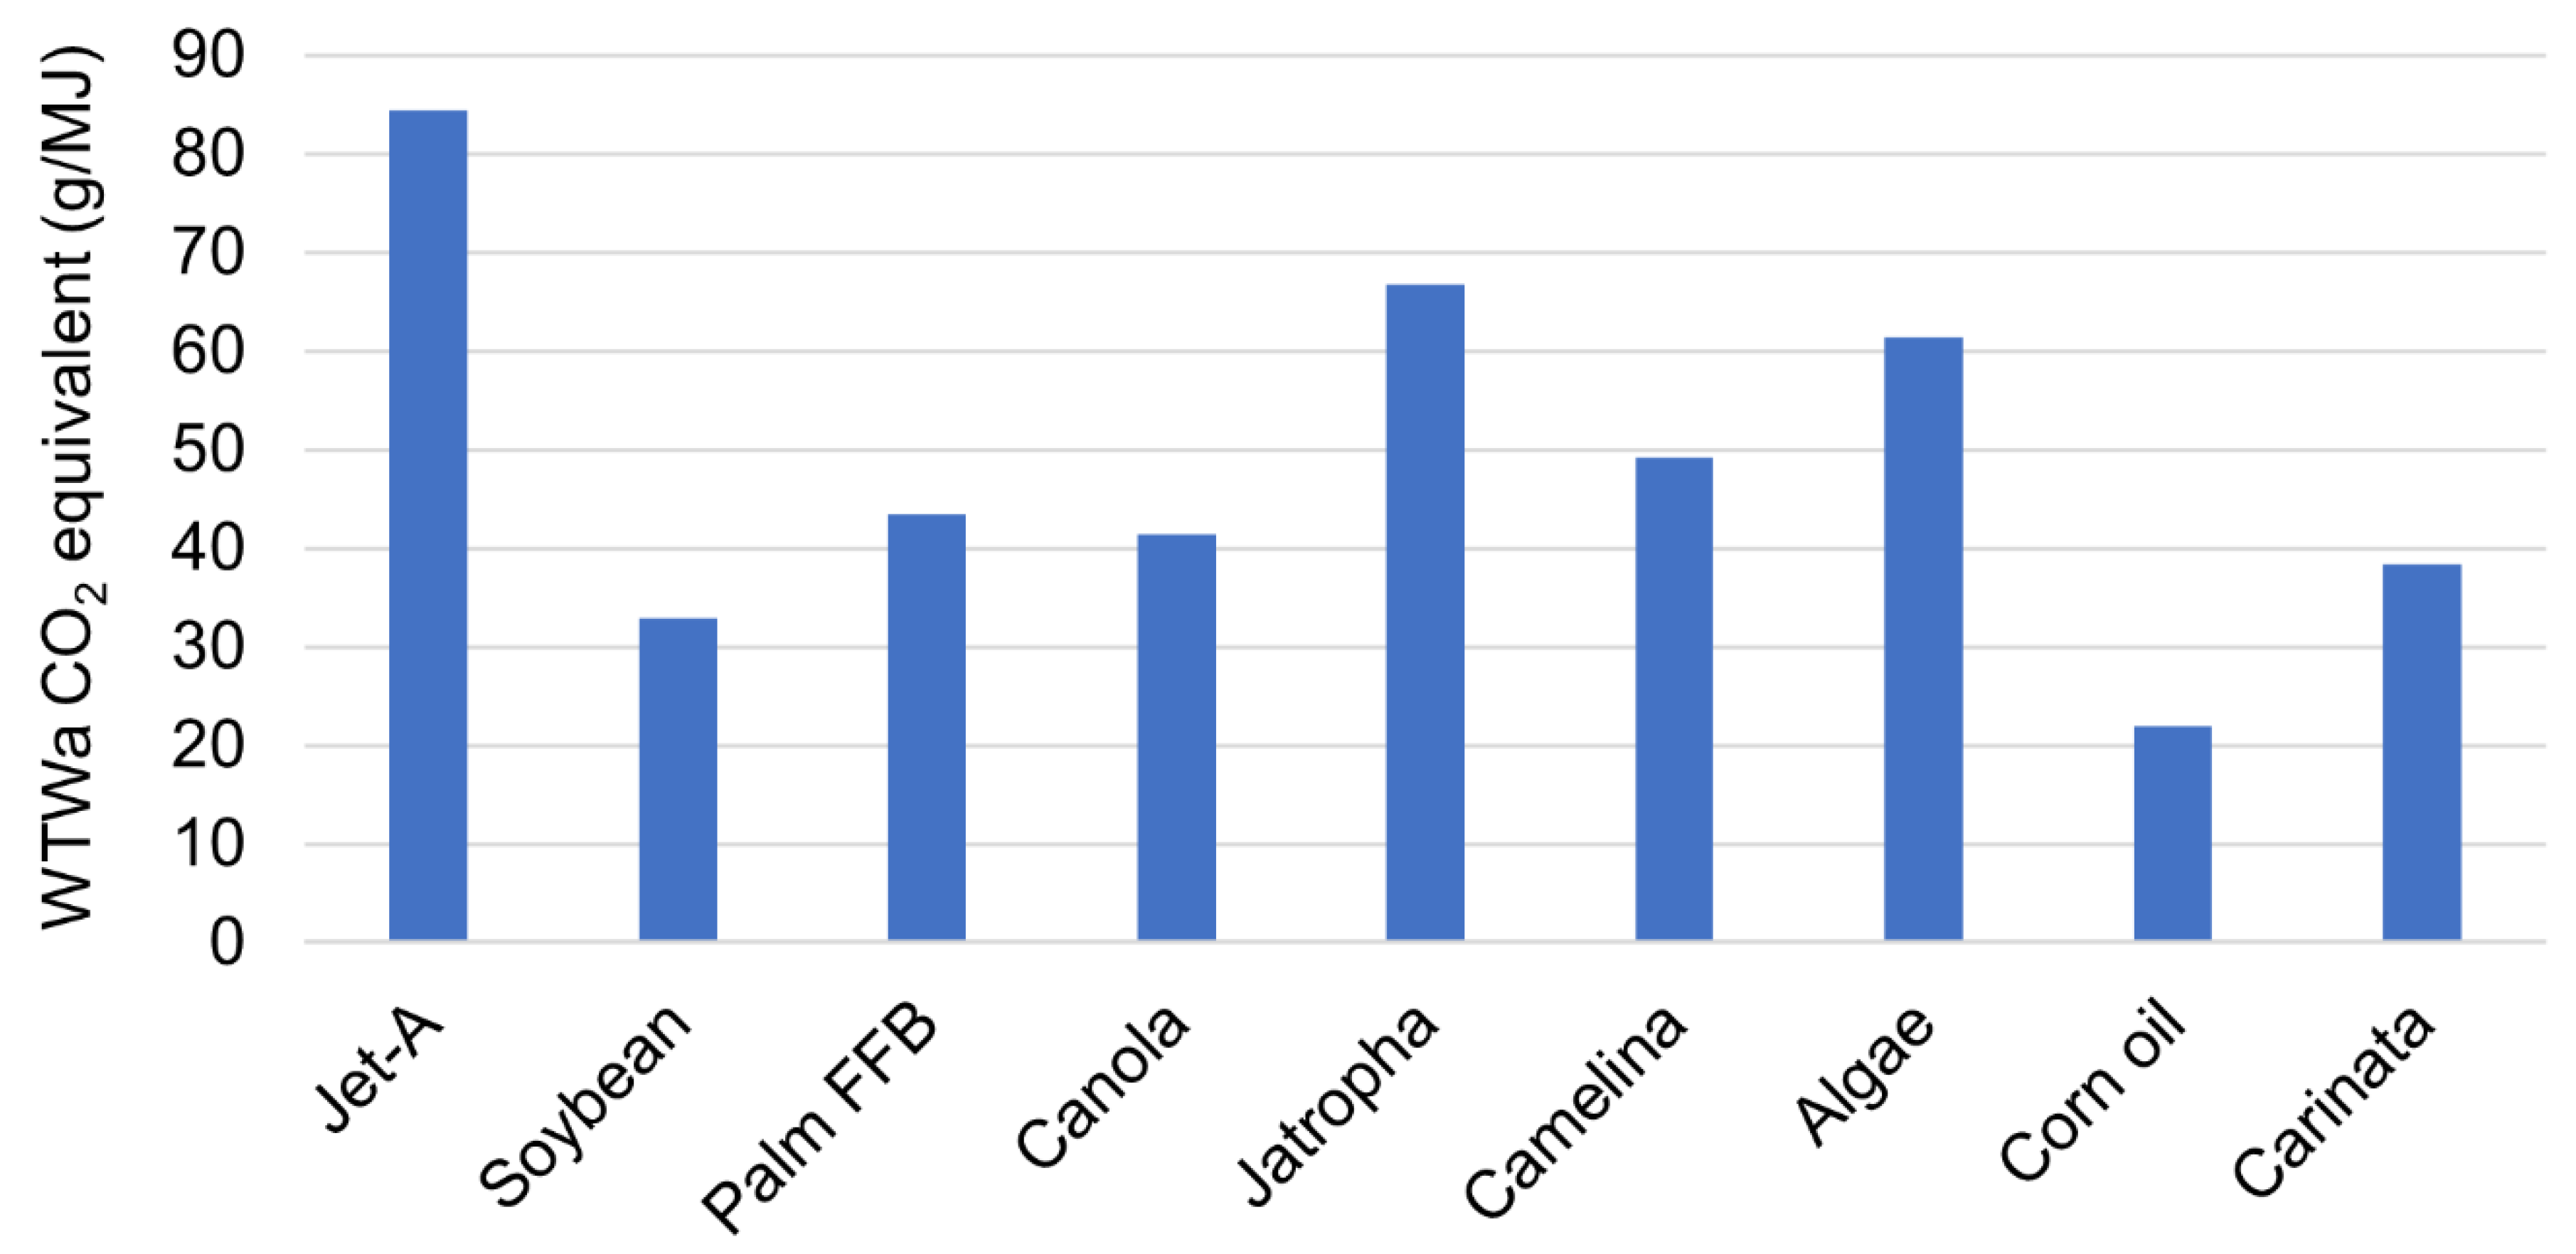
Figure 5.
WTWa CO2 equivalent emission comparison of different ATJ feedstocks for 2020 (with only CO2 emissions in PTWa phase). [S; Standalone; CDM: Corn with dry mill; D: Distributed; CUSM: Corn US mix; CDMWOE: Corn dry mill without extraction; CDMWE: Corn dry mill with extraction; CWM: Corn wet mill ].

Figure 6.
WTWa CO2 equivalent emission comparison of different STJ feedstocks for 2020 (with only CO2 emissions in PTWa phase). [B: Biological; CWEH: Catalytic with external H2 plant type; CWIH: Catalytic with in-situ H2 plant type; CWHBG: Catalytic with H2 from biomass gasification plant type].
Figure 6.
WTWa CO2 equivalent emission comparison of different STJ feedstocks for 2020 (with only CO2 emissions in PTWa phase). [B: Biological; CWEH: Catalytic with external H2 plant type; CWIH: Catalytic with in-situ H2 plant type; CWHBG: Catalytic with H2 from biomass gasification plant type].
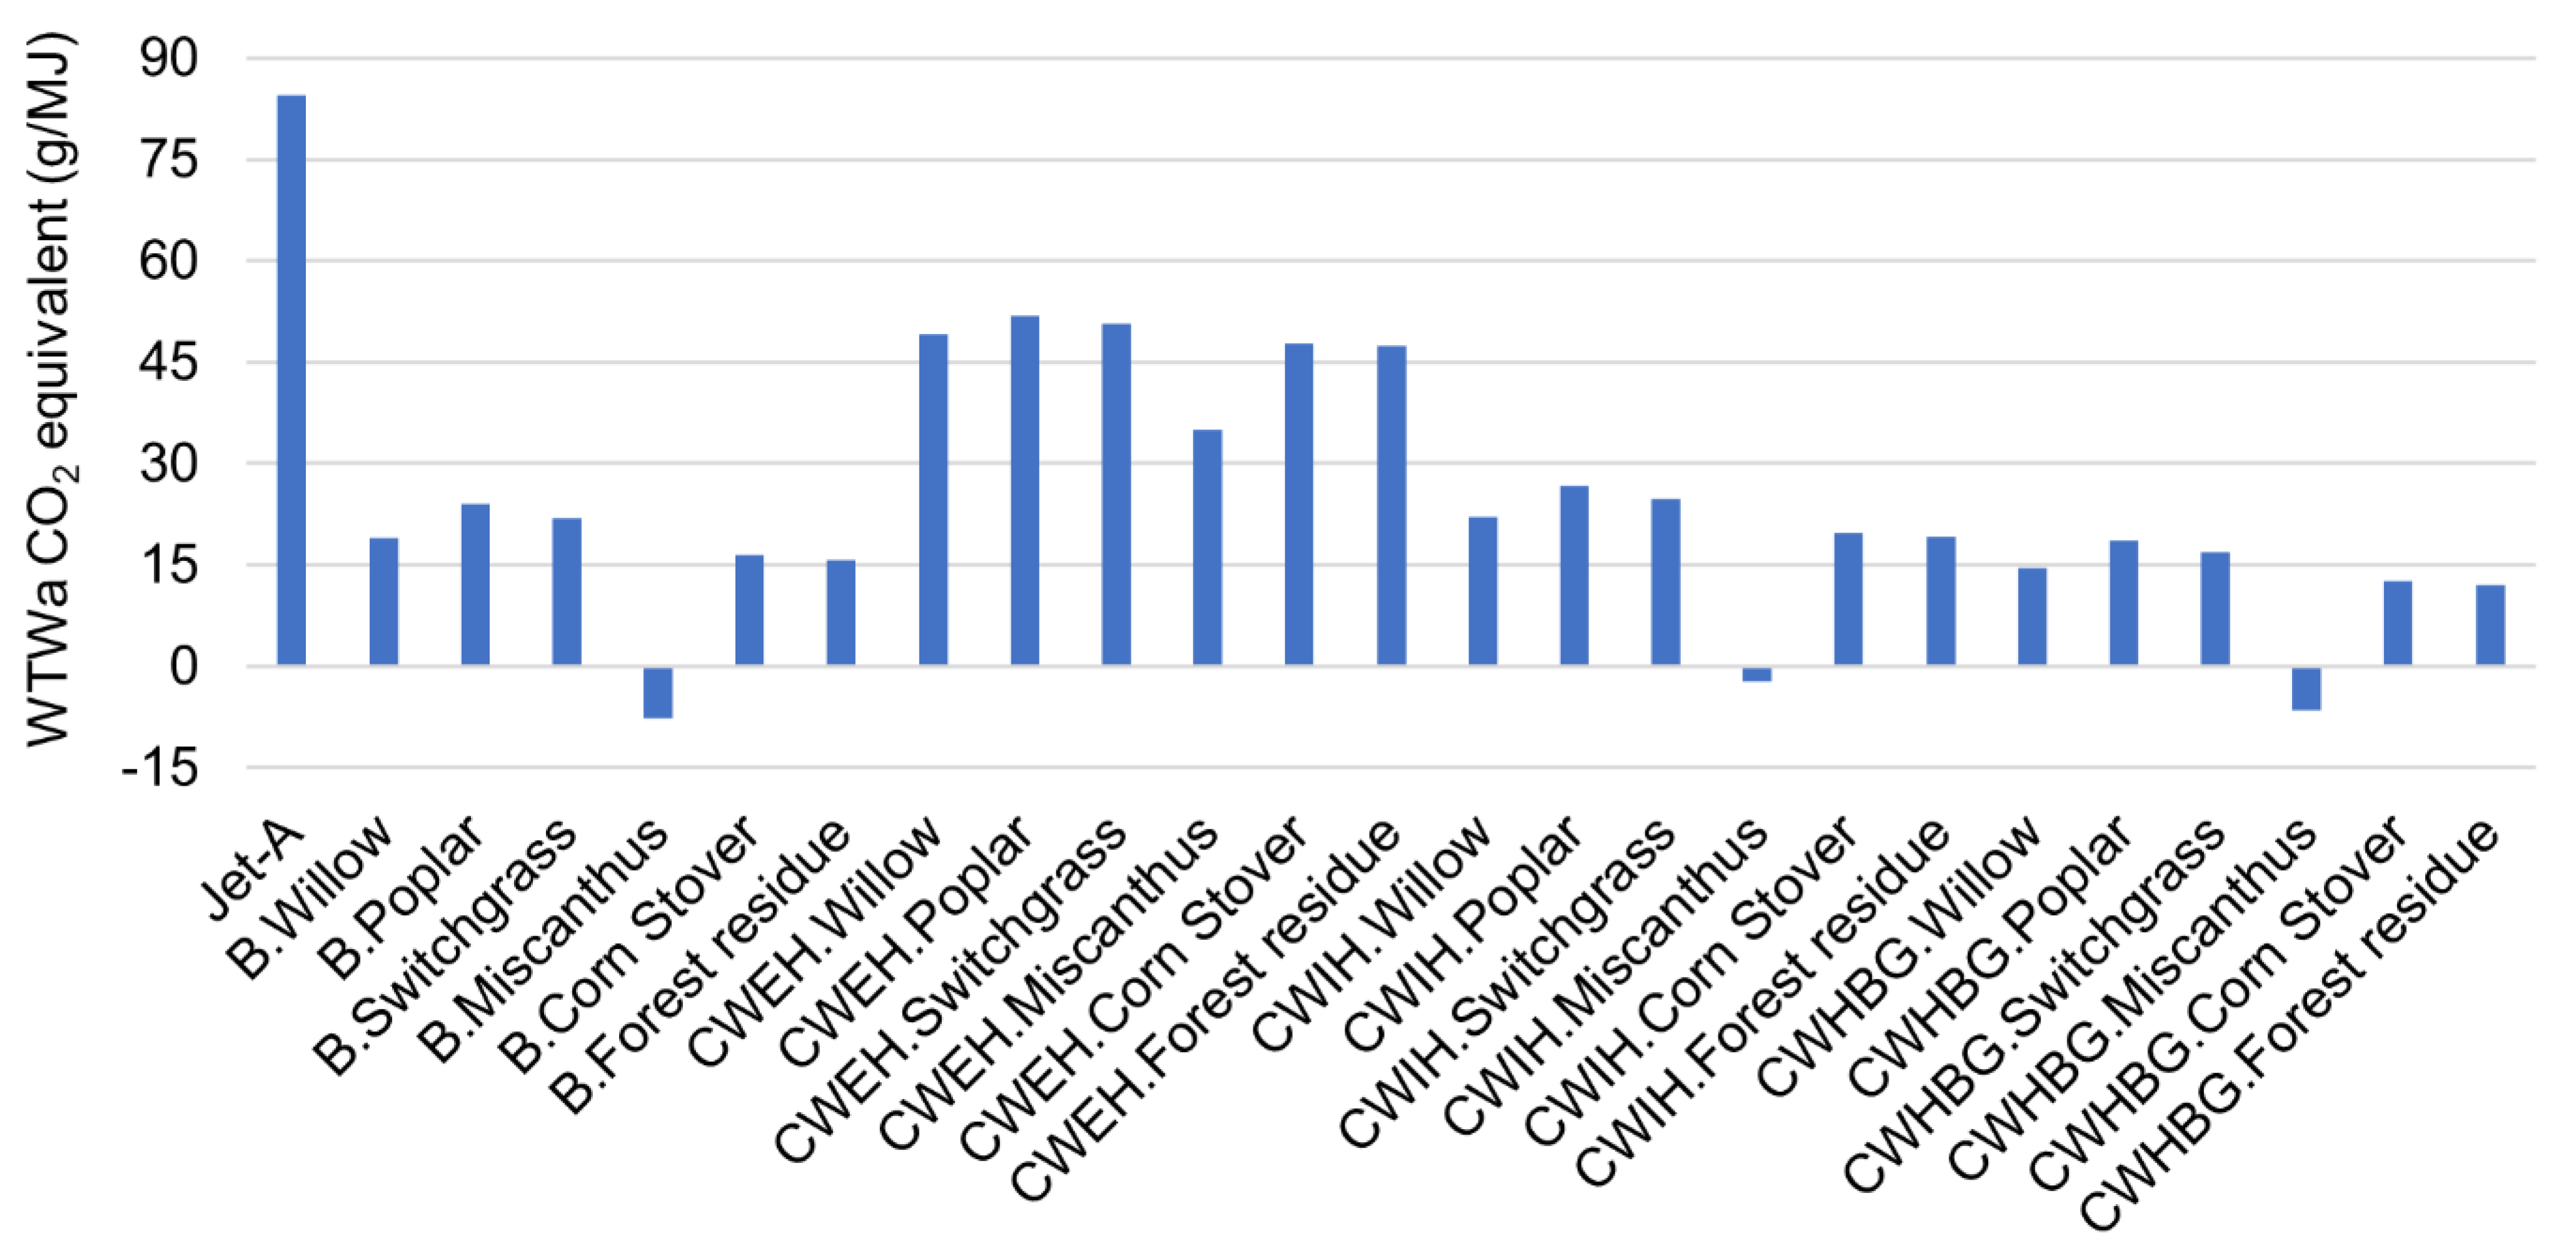
Figure 7.
WTWa CO2 equivalent emission comparison of low-carbon 100% SPK feedstocks and pathways for 2020 and 2050 US energy mix scenarios using hydrogen produced from less carbon intense scheme (with only CO2 emissions in PTWa phase). [FT: Fischer Tropsch; NAFG: North American flared gas; D: Distributed; S: Standalone; ATJ: Alcohol to jet; STJ: Sugar to jet; CWIH: Catalytic with in-situ H2 plant type; Catalytic with H2 from biomass gasification plant type; RNG: Renewable natural gas; CS: Carbon sequestration; PV: Photovoltaics; HTGR: High temperature gas reactor; IF: Integrated fermentation; SPK: Synthetic paraffin kerosene].
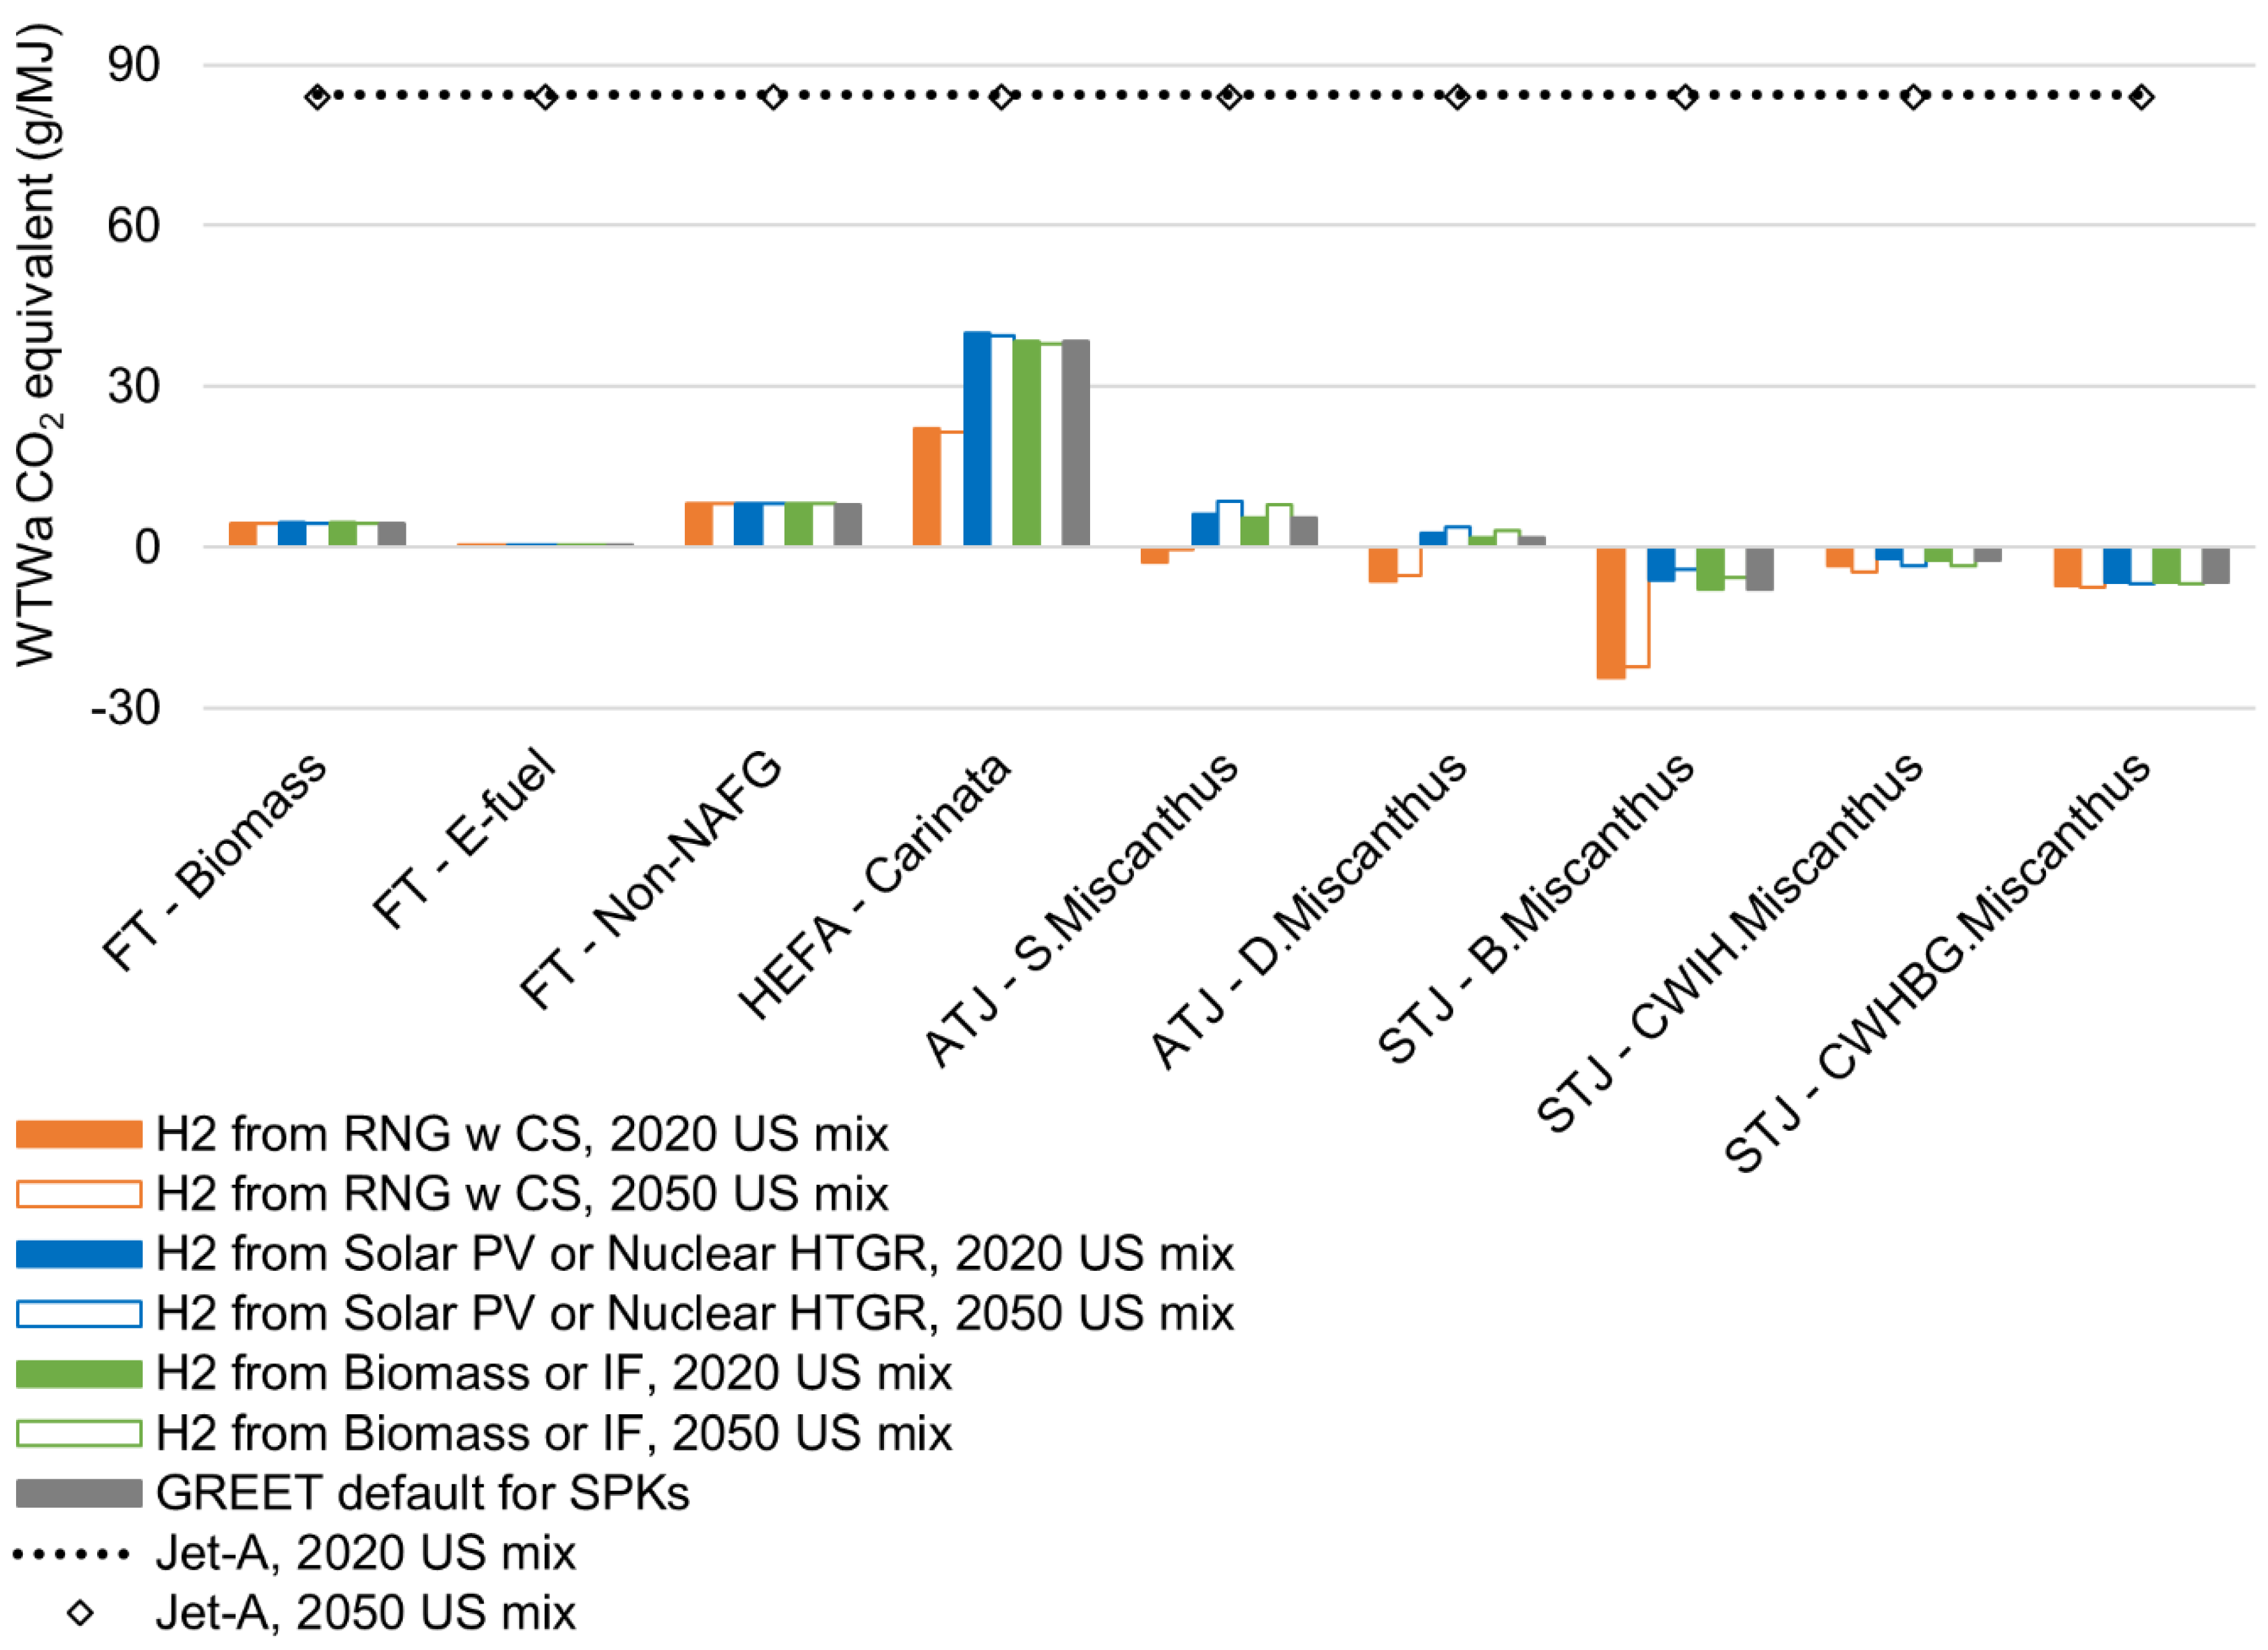
Figure 8.
WTWa CO2 equivalent emission comparison for different LH2 and 100% SPK feedstock and pathways for 2020 and 2050 US energy mix scenarios including non-CO2 effects. [w: with; w/o: without; CS: Carbon sequestration; RNG: Renewable natural gas; LUSME: liquification using US mix of electricity; PV: Photovoltaics; HTGR: High temperature gas reactor; LNGCC: Liquification using power from natural gas combined cycle; LBIGCC: Liquefied using electricity from biomass integrated gasification combined cycle; FT: Fischer Tropsch; D: Distributed; S: Standalone; ATJ: Alcohol to jet; STJ: Sugar to jet; B: Biological; CWIH: Catalytic with in-situ H2 plant type; CWHBG: Catalytic with H2 from biomass gasification plant type]
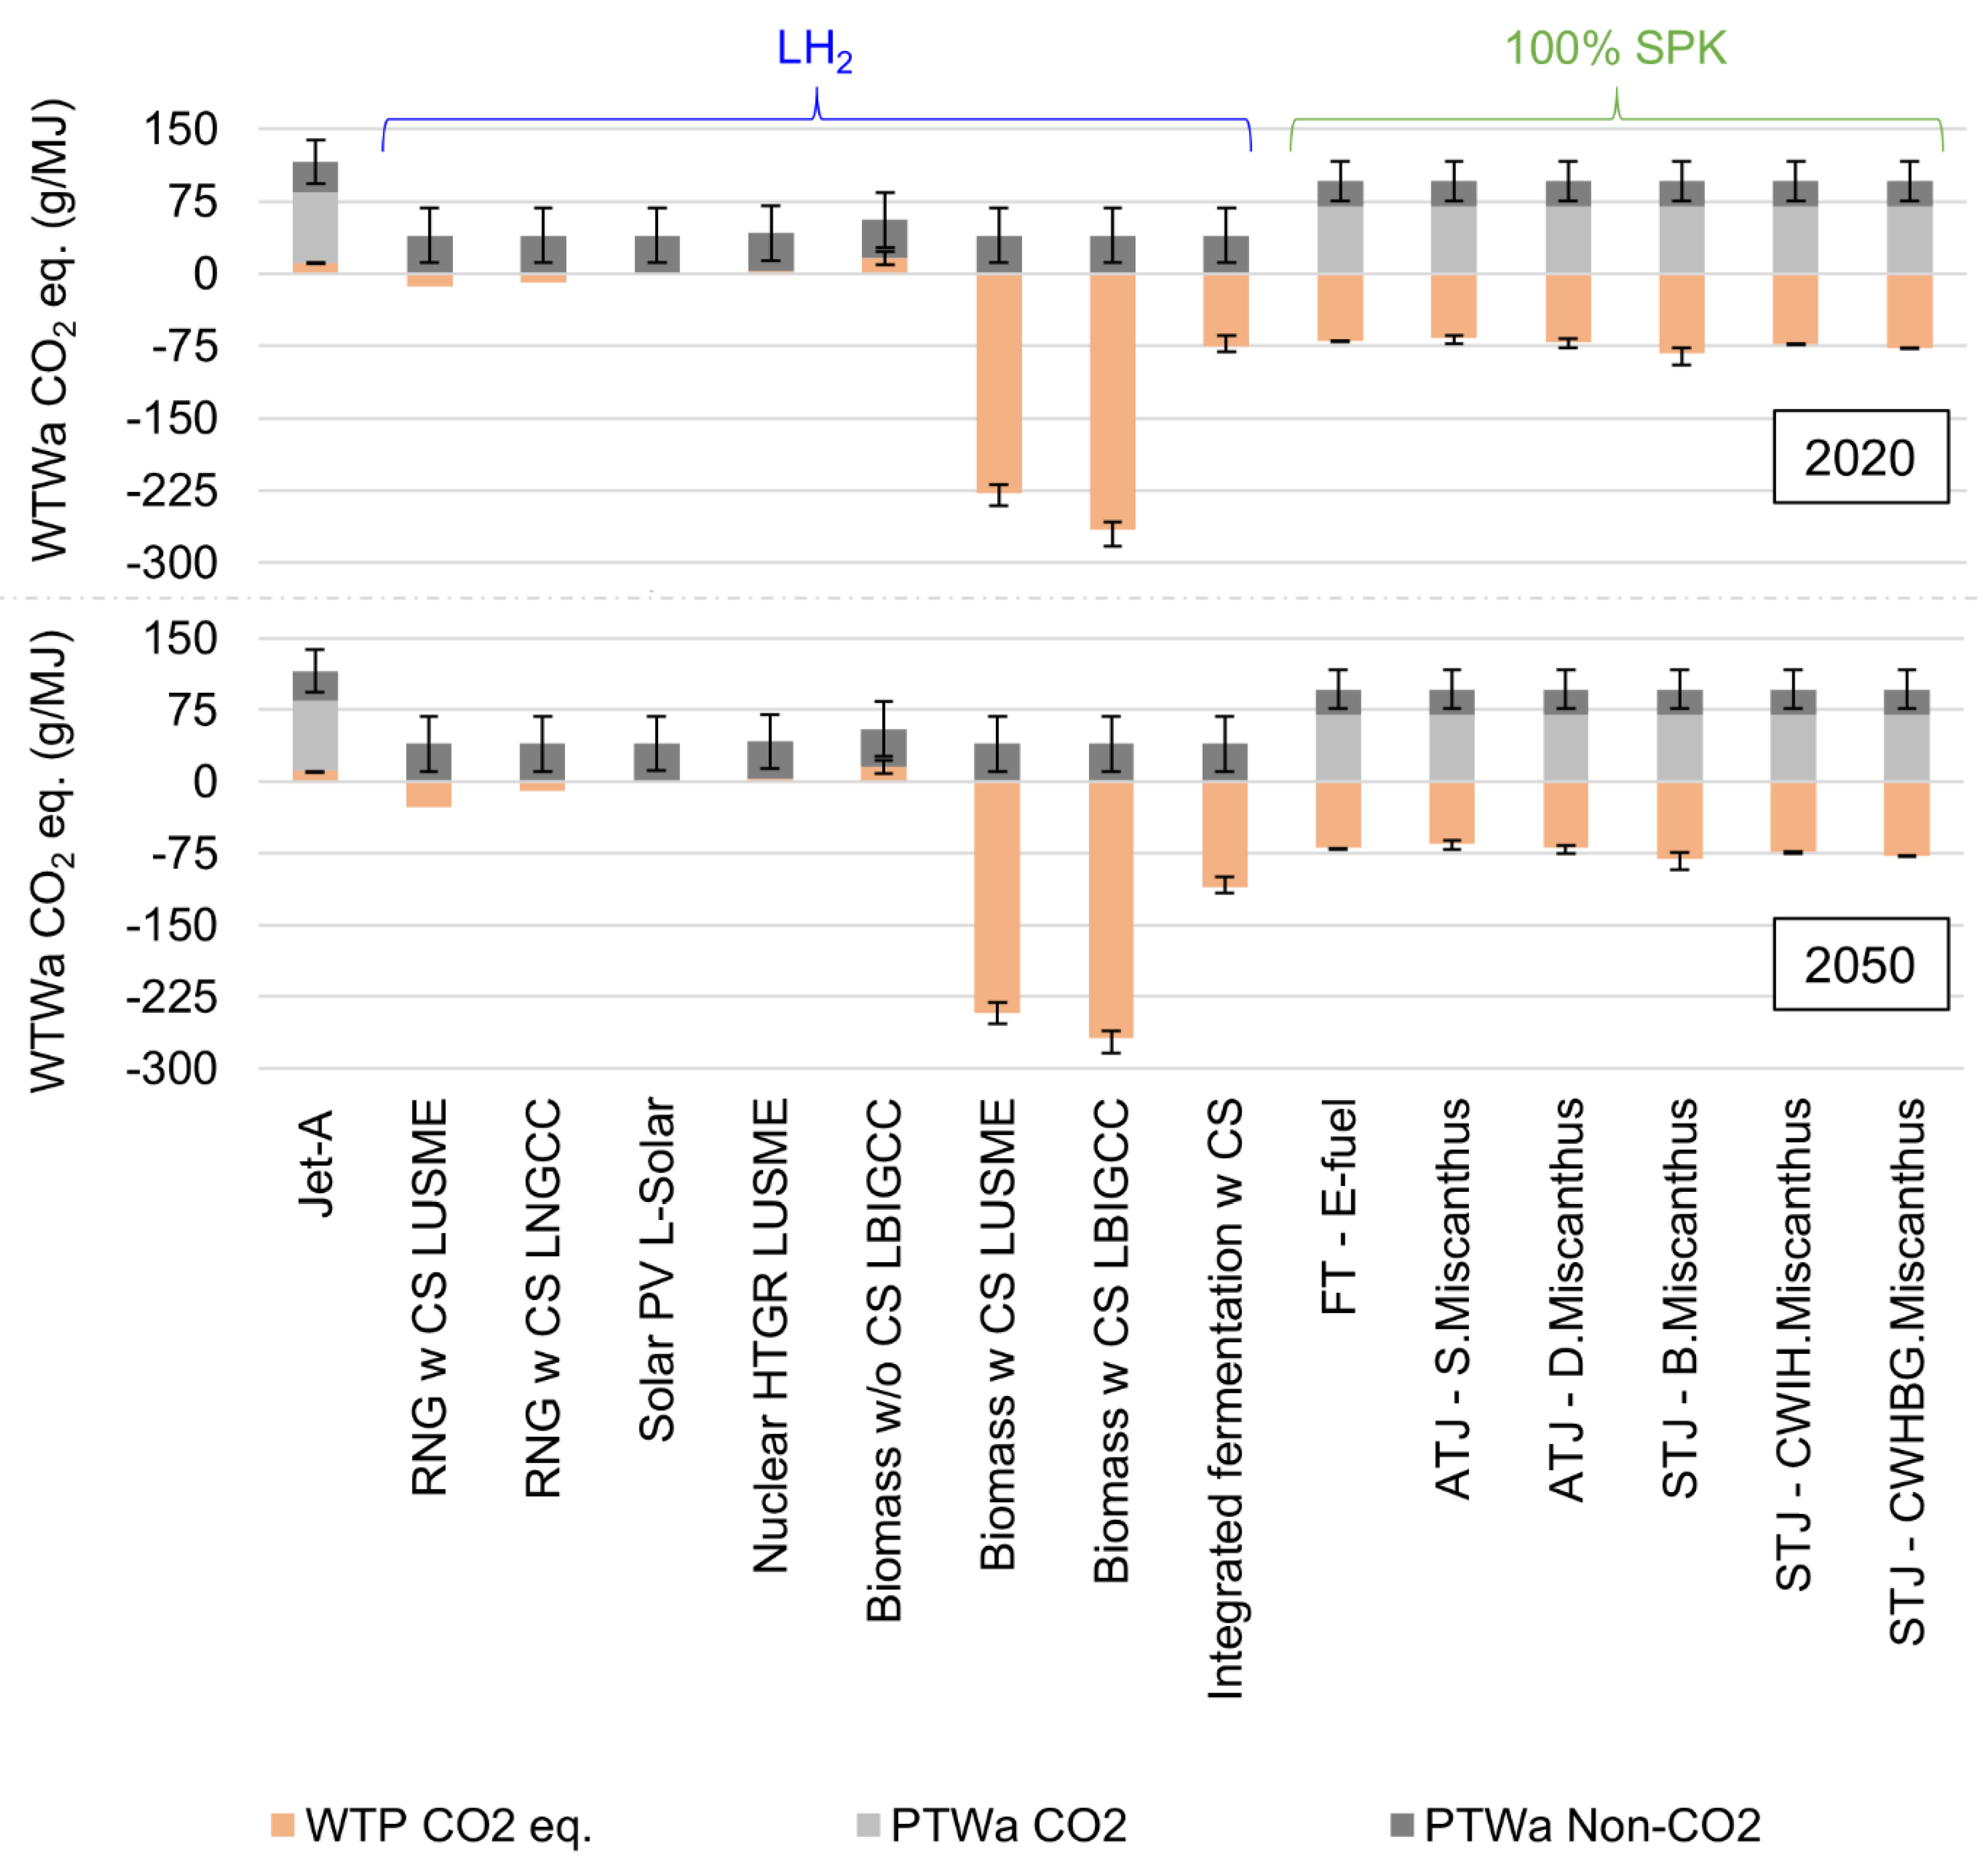
Figure 9.
Energy demand forecast for long-haul aviation and supply of SAF. [HEFA: Hydro-processed esters and fatty acids; PtL: Power to liquid fuel; CAGR: Compound annual growth rate]
Figure 9.
Energy demand forecast for long-haul aviation and supply of SAF. [HEFA: Hydro-processed esters and fatty acids; PtL: Power to liquid fuel; CAGR: Compound annual growth rate]
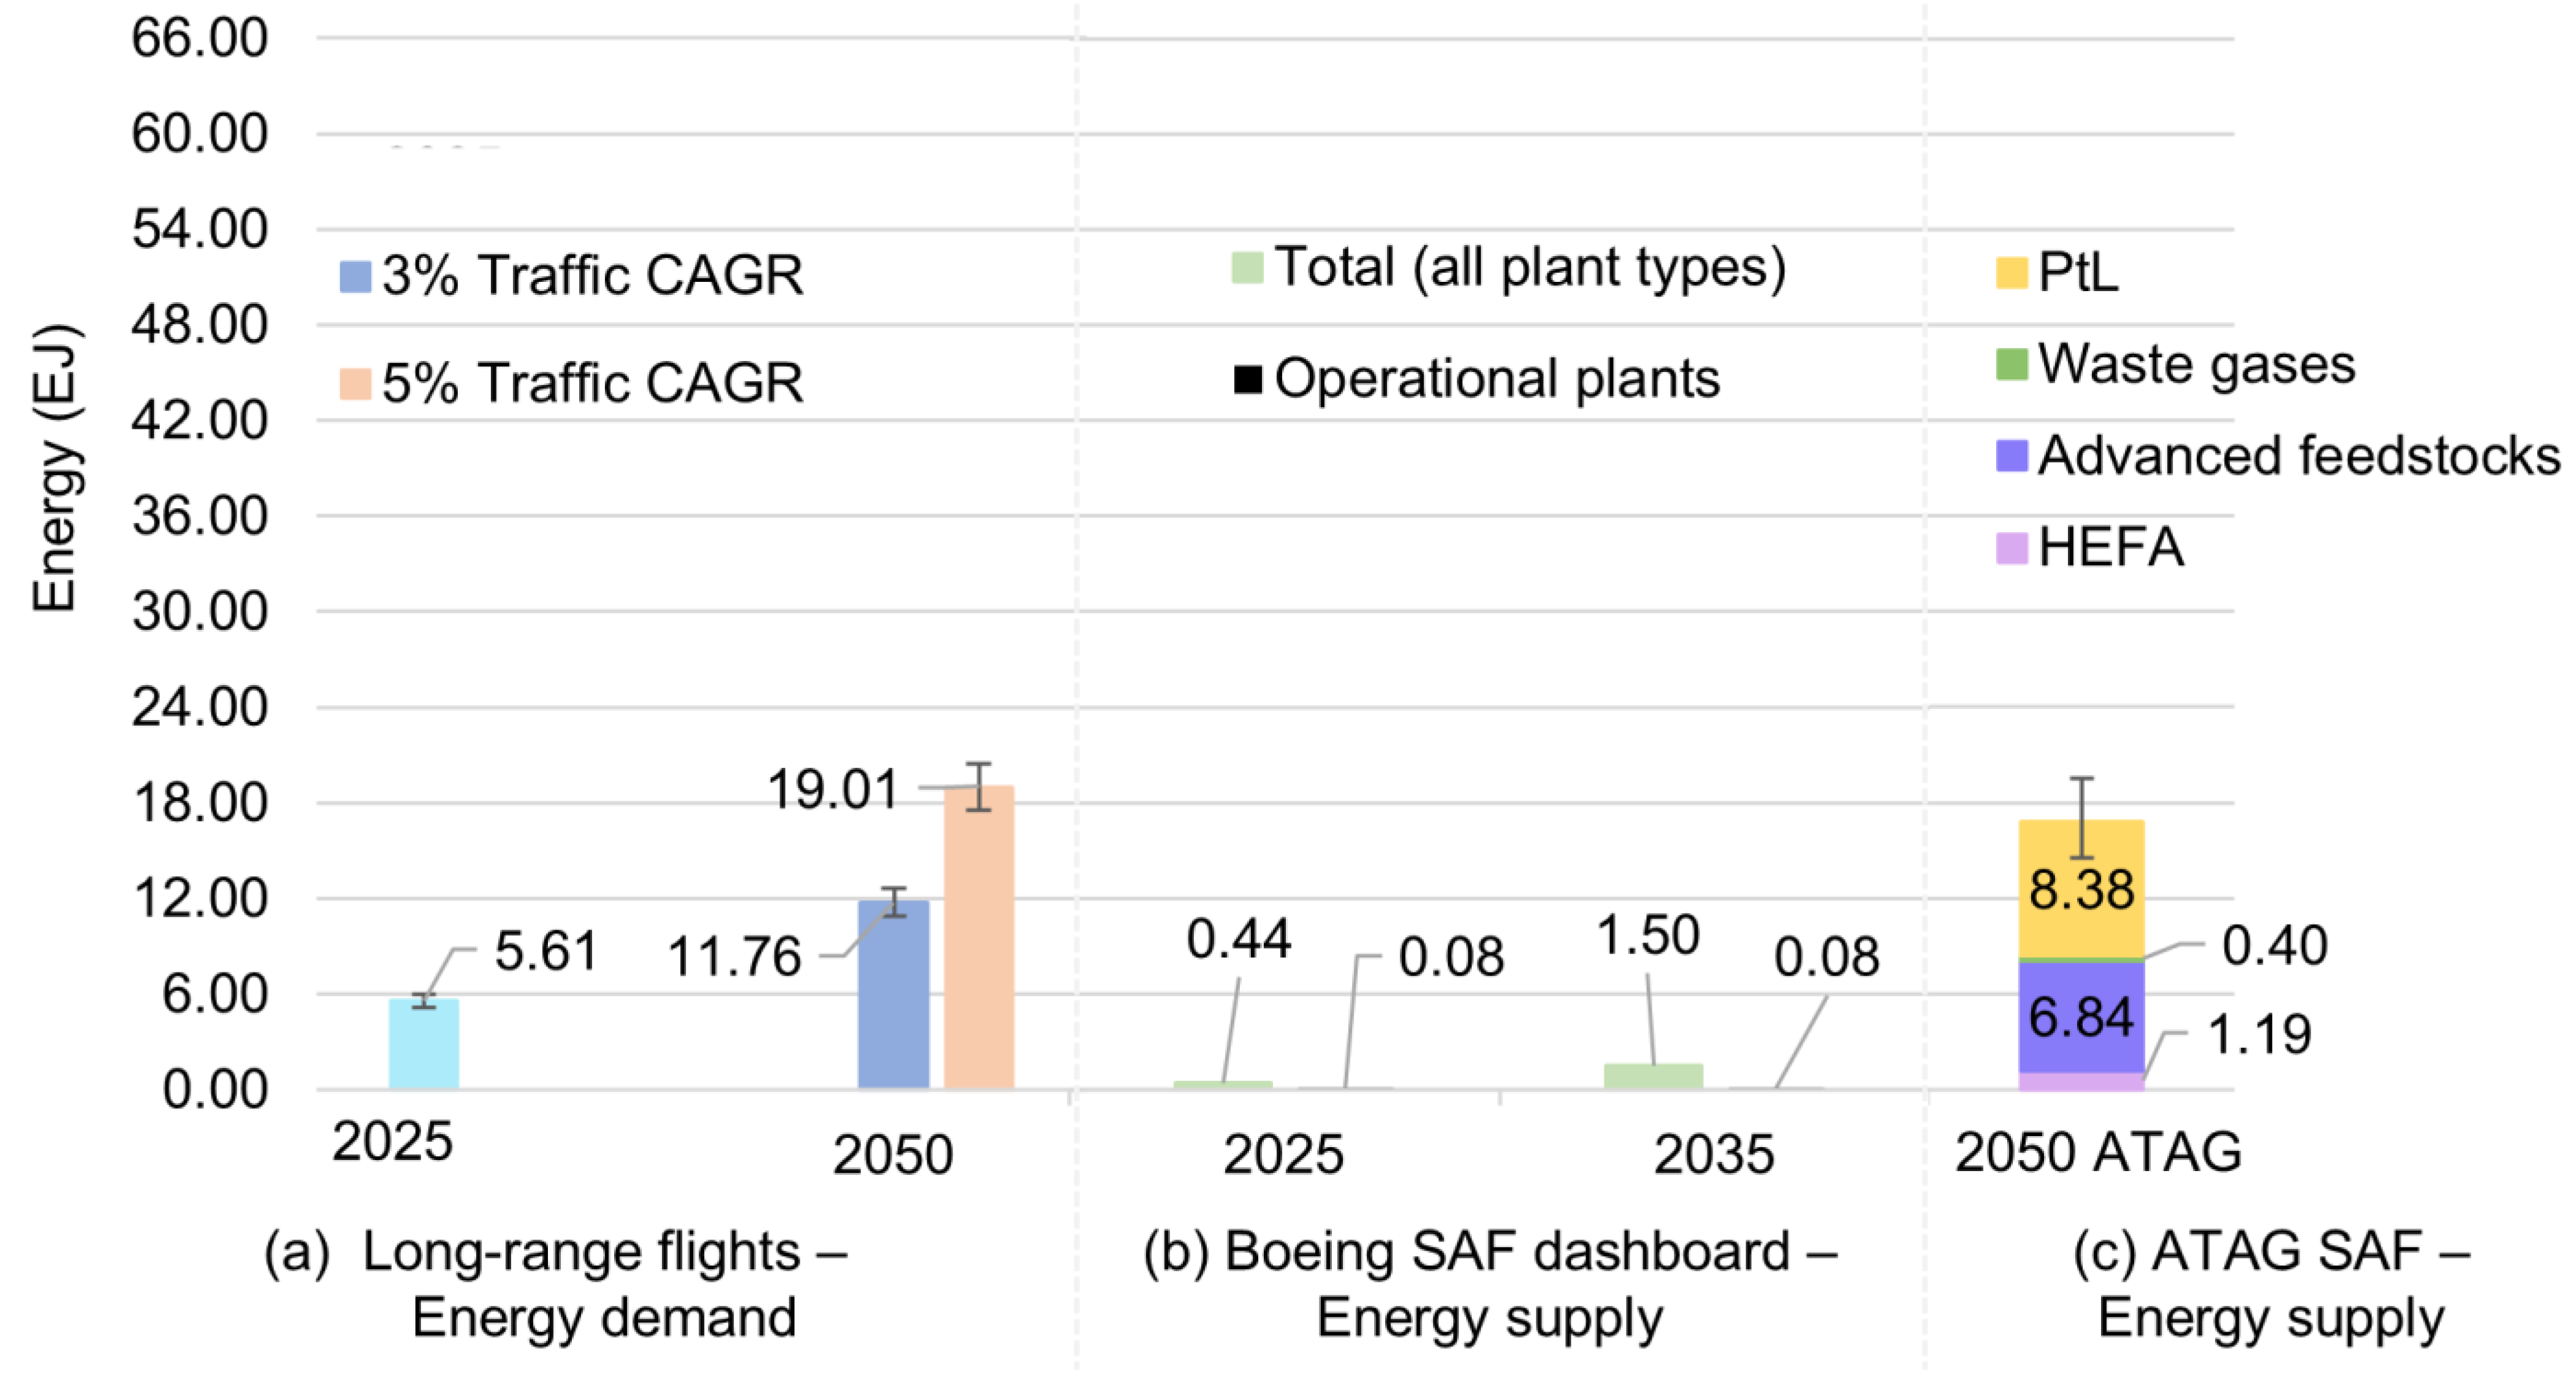
Figure 10.
Energy demand forecast for long-haul aviation and supply of green hydrogen. [ATAG: Air Transport Action Group report; MK: McKinsey report; CAGR: Compound annual growth rate].
Figure 10.
Energy demand forecast for long-haul aviation and supply of green hydrogen. [ATAG: Air Transport Action Group report; MK: McKinsey report; CAGR: Compound annual growth rate].
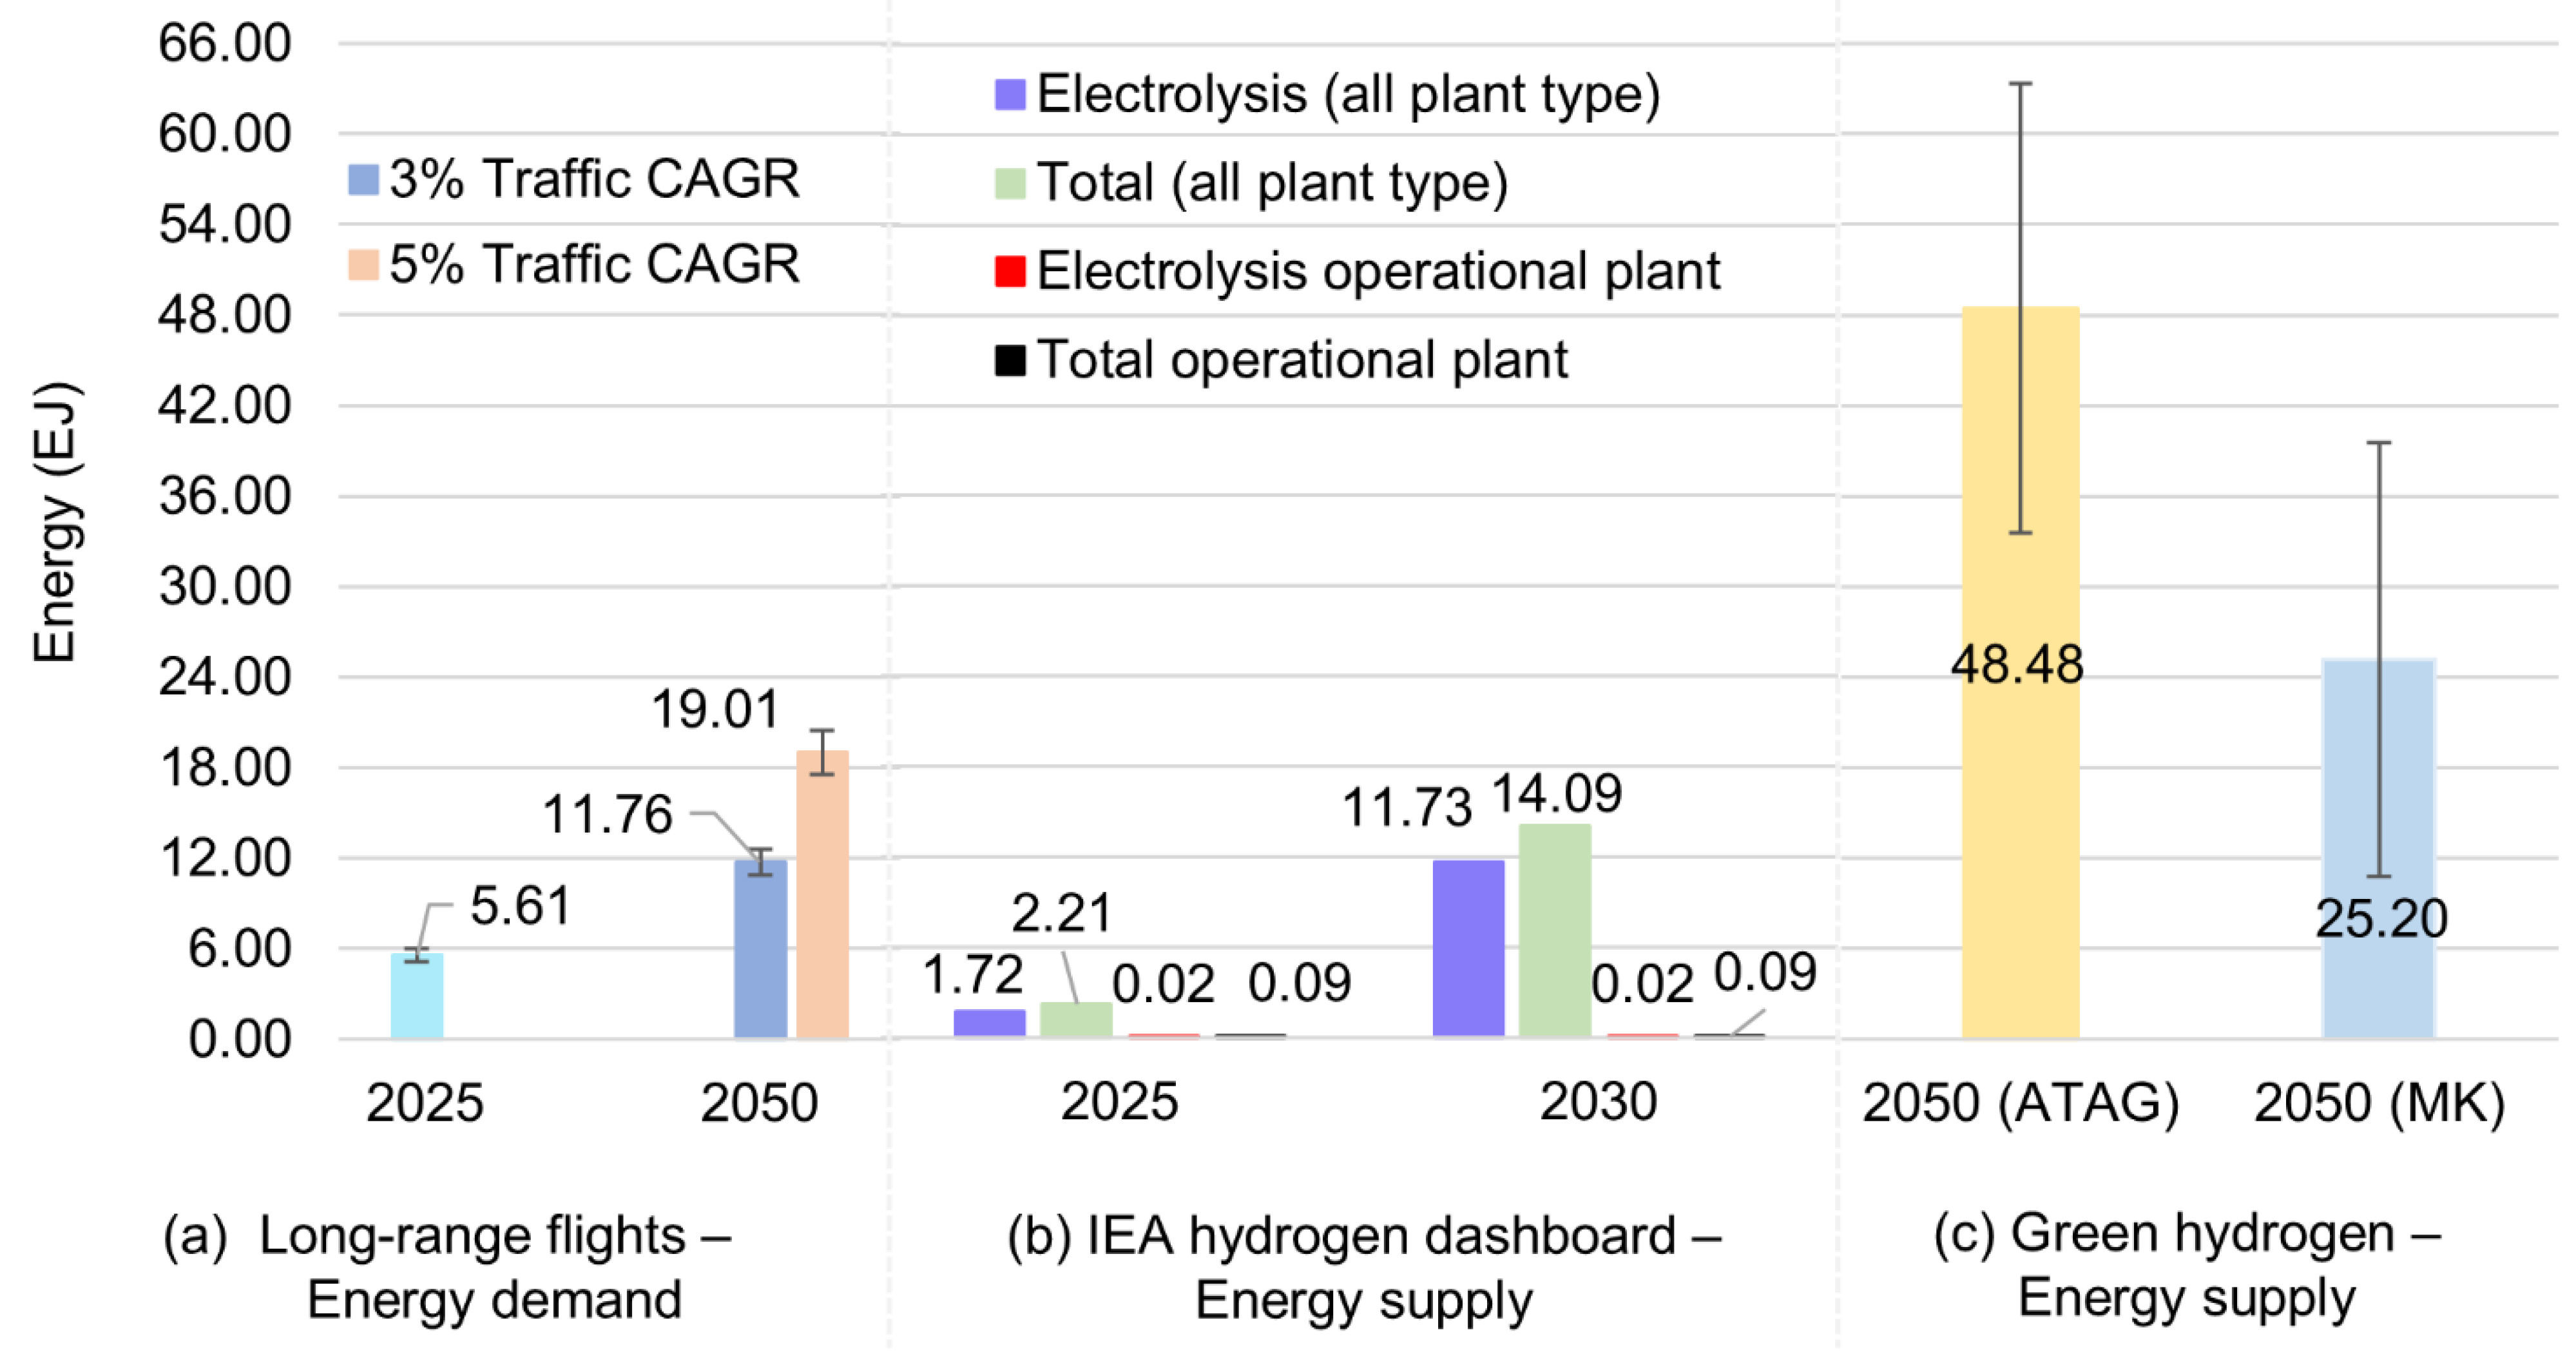

Table 1.
List of different feedstocks and/or pathways of producing hydrogen at centralised manufacturing unit with or without carbon sequestration facility and type of liquefication used.
Table 1.
List of different feedstocks and/or pathways of producing hydrogen at centralised manufacturing unit with or without carbon sequestration facility and type of liquefication used.
| Type of LH2 | Pathways/Feedstock | Carbon sequestration (CS) | Liquefication type | |
| Grey | Coal | Without (w/o) CS | Liquefied using US mix electricity (LUSME) | |
| Liquification using electricity from coal integrated gasification combined cycle (LCIGCC) | ||||
| With (w) CS | LUSME | |||
| LCIGCC | ||||
| Coke oven gas (COG) | - | LUSME | ||
| LCIGCC | ||||
| Blue | North American Natural Gas (NANG) | w/o CS | LUSME | |
| Liquefication using power from natural gas combined cycle (LNGCC) | ||||
| w CS | LUSME | |||
| LNGCC | ||||
| H2 as a by-product of natural gas liquid (NGL) steam cracking (SC) | - | LUSME | ||
| Green | Renewable natural gas (RNG) | w/o CS | LUSME | |
| LNGCC | ||||
| w CS | LUSME | |||
| LNGCC | ||||
| Solar photovoltaics (PV) | - | LUSME | ||
| - | Liquefication using electricity from solar energy (L-Solar) | |||
| Nuclear thermochemical cracking of water (TCCW) | - | Liquefication using electricity from nuclear energy (L-Nuclear) | ||
| Nuclear high temperature gas reactor (HTGR) | - | LUSME | ||
| L-Nuclear | ||||
| Biomass | Willow | w/o CS | LUSME | |
| Poplar | ||||
| Switchgrass | ||||
| Corn stover | ||||
| Forest residue | ||||
| Miscanthus | ||||
| Biomass | Willow | Liquification using electricity from biomass integrated gasification combined cycle (LBIGCC) | ||
| Poplar | ||||
| Switchgrass | ||||
| Corn stover | ||||
| Forest residue | ||||
| Miscanthus | ||||
| Biomass | Willow | w CS | LUSME | |
| Poplar | ||||
| Switchgrass | ||||
| Corn stover | ||||
| Forest residue | ||||
| Miscanthus | ||||
| Biomass | Willow | LBIGCC | ||
| Poplar | ||||
| Switchgrass | ||||
| Corn stover | ||||
| Forest residue | ||||
| Miscanthus | ||||
| Integrated fermentation (IF) (Biomass) | Willow | w/o CS | LUSME | |
| Poplar | ||||
| Switchgrass | ||||
| Corn stover | ||||
| Forest residue | ||||
| Miscanthus | ||||
| Willow | w CS | |||
| Poplar | ||||
| Switchgrass | ||||
| Corn stover | ||||
| Forest residue | ||||
| Miscanthus | ||||
| High temperature electrolysis with solid oxide electrolysis cell (HTE SOEC) using electricity from Nuclear HTGR for electrolysis | - | LUSME | ||
| HTE SOEC using electricity from natural gas combined cycle (NGCC) for electrolysis | ||||
| H2 produced as a by-product of chlorine manufacturing plant (By-product Cl plant) | ||||
Table 2.
US energy mix in 2020 and 2050 – share of different energy sources for electricity production (stationary use).
Table 2.
US energy mix in 2020 and 2050 – share of different energy sources for electricity production (stationary use).
| 2020 USA energy mix [8] | 2050 USA energy mix [72] | |||||||
| Source | % | Others source | % | Source | % | Others source | % | |
| Residual oil | 0.4 | Hydroelectric | 38.1 | Residual oil | 0.0% | Hydroelectric | 13.0% | |
| Natural gas | 39.6 | Geothermal | 2.1 | Natural gas | 36.0% | Geothermal | 2.0% | |
| Coal | 20.0 | Wind | 45.9 | Coal | 11.0% | Wind | 34.0% | |
| Nuclear power | 20.4 | Solar PV | 11.4 | Nuclear power | 11.0% | Solar PV | 47.0% | |
| Biomass | 0.3 | Miscellaneous | 2.5 | Biomass | 0.0% | Miscellaneous | 4.0% | |
| Others | 19.4 | Others | 42.0% | |||||
Table 3.
List of different feedstocks and manufacturing schemes for 100% SPK produced from ATJ and STJ pathways.
Table 3.
List of different feedstocks and manufacturing schemes for 100% SPK produced from ATJ and STJ pathways.
| ATJ schemes and feedstocks (18 cases) | STJ schemes and feedstocks (24 cases) | ||
| Feedstocks in standalone (S.) scheme | Feedstocks in distributed (D.) scheme | STJ manufacturing schemes | Feedstocks for each of the four STJ manufacturing schemes |
| Corn with dry mill (CDM) | Corn US mix (CUSM) | Biological plant type (B.) | Poplar |
| Poplar | Corn dry mill without extraction (CDMWOE) | Catalytic with external H2 plant type (CWEH.) | Forest residue |
| Forest residue | Corn dry mill with extraction (CDMWE) | Catalytic with in-situ H2 plant type (CWIH.) | Miscanthus |
| Miscanthus | Corn wet mill (CWM) | Catalytic with H2 from biomass gasification plant type (CWHBG.) | Switchgrass |
| Switchgrass | Poplar | Willow | |
| Willow | Forest residue | Corn stover | |
| Corn stover | Miscanthus | ||
| Switchgrass | |||
| Willow | |||
| Corn stover | |||
| Solid waste | |||
Table 4.
List of different feedstocks and manufacturing schemes for 100% SPK produced from FT and HEFA pathways.
Table 4.
List of different feedstocks and manufacturing schemes for 100% SPK produced from FT and HEFA pathways.
| FT feedstocks (8 main cases) | HEFA feedstocks (8 cases) |
| North American (NA) natural gas (NANG), | Food-crops |
| Non-NA natural gas (non-NANG) | Soybean |
| Non-NA flared gas (non-NAFG) | Palm FFB (fresh fruit bunch) |
| Biomass* | Canola |
| Coal | Corn oil |
| Coal (50%) + biomass* (50%) (share by mass) | Non-food feedstocks |
| Natural gas (50%) + biomass* (50%) (share by mass) | Algae |
| Electro-fuel (or PtL) | Camelina |
| *Poplar, forest residue, miscanthus, switchgrass, willow, corn stover | Jatropha |
| Carinata |
Table 5.
WTWa GHG emissions (CO2 equivalent) reduction potential of different LH2 and 100% SPK feedstock and pathways for 2020 and 2050.
Table 5.
WTWa GHG emissions (CO2 equivalent) reduction potential of different LH2 and 100% SPK feedstock and pathways for 2020 and 2050.
| Manufacturing route | % reduction relative to Jet-A | |
| 2020 | 2050 | |
| LH2 | ||
| RNG w CS LUSME | 41.5 – 101.7 | 55.7 – 111.3 |
| RNG w CS LNGCC | 36.3– 98.2 | 38.0 – 99.3 |
| Solar PV L-Solar | 26.8 – 91.8 | 26.8 – 91.8 |
| Nuclear HTGR LUSME | 24.1 – 90.0 | 24.6 – 90.3 |
| Biomass w/o CS LBIGCC | 2.8 – 85.6 | 3.6 – 86.1 |
| Biomass w CS LUSME | 260.8 – 266.1 | 274.1 – 275.6 |
| Biomass w CS LBIGCC | 296.2 – 302.6 | 297.4 – 306.2 |
| Integrated fermentation w CS | 96.2 – 150.7 | 133.6 – 176.6 |
| 100% SPK | ||
| FT - E-fuel | 49.2 – 95.4 | 49.3 – 95.4 |
| ATJ - S.Miscanthus | 43.1 – 97.7 | 40.5 – 96.0 |
| ATJ - D.Miscanthus | 46.9 – 100.3 | 45.7 – 99.6 |
| STJ - B.Miscanthus | 56.4 – 113.3 | 54.1 – 111.8 |
| STJ - CWIH.Miscanthus | 52.1 – 92.1 | 53.4 – 99.0 |
| STJ - CWHBG.Miscanthus | 56.7 – 100.9 | 57.0 – 101.1 |
Disclaimer/Publisher’s Note: The statements, opinions and data contained in all publications are solely those of the individual author(s) and contributor(s) and not of MDPI and/or the editor(s). MDPI and/or the editor(s) disclaim responsibility for any injury to people or property resulting from any ideas, methods, instructions or products referred to in the content. |
© 2025 by the authors. Licensee MDPI, Basel, Switzerland. This article is an open access article distributed under the terms and conditions of the Creative Commons Attribution (CC BY) license (http://creativecommons.org/licenses/by/4.0/).
Copyright: This open access article is published under a Creative Commons CC BY 4.0 license, which permit the free download, distribution, and reuse, provided that the author and preprint are cited in any reuse.


