
Submitted:
27 September 2025
Posted:
05 October 2025
You are already at the latest version
Abstract
The pristine (p-SiO₂) and sulfonated silica (s-SiO₂) particles were created using the sol-gel and Stober methods. Furthermore, this study sought to show the impact of calcination time and surface changes on the morphology, and hence functionality, of the silica nanoparticles synthesised as potential fuel cell membrane additives. Tetraethyl orthosilicate (TEOS) was used as a silica precursor dissolved in water, with sulphuric acid serving as the sulphonation agent. Parametric data on particle morphology, such as particle size, porosity, total surface area, and agglomeration, were measured and evaluated using BET, Fourier transform infrared (FTIR), X-ray diffraction (XRD), and scanning electron microscopy (SEM). The amorphous nature of silica nanoparticles was confirmed by XRD analysis. The BET outcome data acquired for the synthesised silica particles were surface area ranges from 271 to 487 m²/g, pore diameter 12.10 nm - 21.02 nm, and total pore volume 0.76 - 1.58 cm³/g. This data gives crucial characteristics for designing appropriate silica nanofillers for hybrid fuel cell membranes. As a result, the gathered data can be used to make future decisions about silica synthesis methods for fuel cell applications.
Keywords:
sol gel
; Stober
; silica nanoparticles
; sulfonated silica
; pristine silica
; total pore volume
1. Introduction
Silica exists ubiquitously in the environment in different forms. Apart from not being present in nascent form, it is always present in compounds such as hydroxides, silicic acid or oxides, as in silica [1,2]. The earth’s crust is made up of 78% silicon and oxygen compounds [3]. Silica nanoparticles are prominent in scientific study due to their ease of preparation and vast range of industrial applications including catalysis, pigments, pharmaceuticals, electronic and thin film substrates, electronic, thermal insulators and humidity sensors. Recently, silica has attracted strong interests as a candidate for fuel cell membrane applications. Such fuel cell membranes include sulfonated membranes (SPEEK, SPS, SPAES, SPI), fluorinated membranes (Nafion), and various organic polymer matrixes [4,5,6]. In fuel cells, silica is the most commonly used inorganic filler, particularly in proton exchange membrane fuel cells and direct alcohol fuel cells [4]. This is owing to the amenable properties of silica such as its high stability, excellent conductivity, and its ubiquitous in nature (lower costs). Furthermore, silica particles can be modified to improve the electrical, physiochemical properties of the membrane [7,8]. For example, sulfonic group functionalised silica particles show improved qualities which makes it more suitable as an additive (guest) in polymer membranes. The introduction of sulfonated silica particles in chitosan polymer, for example, increases the tensile strength, thermal stability, and proton conductivity [7,9,10]. Subsequently, these changes have the overall effect of enhancing fuel cell performance [7,9].
According to literature, traditional processes such as flame synthesis, sol gel procedures, the Stober process, and micro emulsions have been used to produce silica [11,12]. The sol gel and Stober process are commonly used to produce silica nanoparticles. These processes involve the simultaneous condensation and hydrolysis of an alkoxide [13,14]. The rate at which condensation occurs is dependent on the reaction conditions that can lead to the formation of a three-dimensional network or a single monodisperse particle [14]. The sol gel technique is commonly employed to produce nanoparticles due to its effectiveness. Various benefits include the ability to conduct synthesis at reduced temperatures, resulting in high purity. The reaction kinetics can also be regulated by changing the composition of the reaction mixture [15].The qualities of the material are greatly influenced by the parameters that are utilized to generate synthetic silica, including the synthesis temperature, the synthesis time for condensation and hydrolysis, the concentration of the solvent, and the techniques for washing and drying. Typical silica characteristics affected by these parameters include particles size and their size distribution of SiO2 particles are affected by these characteristics [16,17]. The disadvantage of this method is that at higher (excess) TEOS, i.e. when TEOS surpasses a critical value, another population of particles appears, with completely different morphology and functionality properties.
2. Materials and Methods
2.1. Reagents
Chitosan flakes, Medium molecular weight, (Merck); Tetraethyl orthosilicate, Si(OC2H5)4, 98%, (Merck); Ammonia, NH3, 25%, (Merck); Acetic acid, CH3COOH, 99%, (Merck); Sodium hydroxide, NaOH, (Merck); Ethanol, C2H5OH, 99.9%, (Merck); Methanol, CH3OH, 99.9% (Merck); Sodium chloride, NaCl, (Merck); Hydrochloric acid, HCl, 37%, (Merck); Sulfuric acid, H2SO4, 99%, (Merck); Taurine, C2H7NO3S, 99%, (Merck).
2.2. Characterization
Surface morphology, particle size, and form of the silica nanoparticles were examined using a scanning electron microscope (SEM, EVO-18, Carl Zeiss, Germany). The XRD patterns of these particles were acquired using GBC Emma X-ray Diffraction Spectroscopy, which was outfitted with a monochromatic Cu k X-ray detector (=1.5206 at 35.5 KV and 28mA). Fourier-transform infrared (FTIR) spectroscopy (IR Tracer-100, Shimadzu, Japan) was used to identify chemical bonds at frequencies ranging from 500 to 4000 cm-1. Physical properties such as surface area, pore volume and diameter were characterized using the Brunauer Emmett Teller (BET) method.
2.3. Silica Nanoparticle Synthesis
2.3.1. Synthesis of Pristine Silica Particles by Sol Gel Method
Pure silica particles were synthesized using Tetraethyl orthosilicate (TEOS) as a precursor. This process includes hydrolysis and condensation of TEOS. 80 ml of TEOS and 200 ml of ethanol were mixed at room temperature for 30 minutes. Ammonia and water solution was poured into the first solution. Thereafter, the mixture was agitated for one hour at 70 . The obtained sol gel-like product was dried at 100 for 24 h. Then the obtained silica particles were calcinated at 600 for 2 h and 24 h respectively to remove volatile contaminants from the silica.
2.3.2. Synthesis of Unmodified Silica Particles by the Stober Method
TEOS was used as the precursor for silica during the Stober process. An 80 ml mixture of TEOS and ethanol was stirred for 30 minutes at room temperature. This was followed by the dropwise addition of ammonia solution (2.75 ml) before the mixture was further agitated for another hour at room temperature. After that, the obtained mixture was centrifuged for 31 minutes 44 seconds at 3700 rpm. The precipitate (white solid) silica was dried oven dried at 100 for 24 h and calcinated at 600 at different periods ranging from 2 h and 24 h.
2.3.3. Sulfonation of Silica Particles
The prepared silica particles were sulfonated using sulfuric acid to fabricate their surfaces for enhanced proton conductivity. The sulfonation process for both particles produced by the sol gel and Stober process was the same. For this process, 10 g of silica particles was mixed with 5ml of sulfuric acid and 200 ml methanol. The mixture was stirred vigorously at 1500 rpm for 4 h followed by the centrifugation of the sulfonated silica particles for 31 minutes 44 seconds.
3. Results for the Nanoparticles Calcinated for 2 h
3.1. FTIR Results
The FTIR spectra of the synthesized silica particles (Stober and Sol gel methods) are shown in Figure 1. The stretch at 3400 cm-1 of Figure 1a,c,d corresponds to the OH- band due to the adsorbed water molecule. It can also be ascribed to the OH- stretching vibration of the silanol group, this band is more prominent in Figure 1a,d This band (3400 cm-1) is missing in Figure 1b,c. This suggest that this frequency is made from the stretching of the silanol OH- groups from the sulfonation process since only the silica in (a) and (d) were functionalised with the sulfonated groups. This serves as a confirmation for the successful sulfonation of the s-SiO2 in Figure 1a,d [18]. It is also important to mention the possible role of adsorbed water molecules in the sulfonated silica particles. This is due to the fact that sulfonated particles have higher affinity for water adsorption and retention than the pristine silica. This, therefore, means that the OH stretch from the adsorbed water could have aided the silanol OH groups in producing a more pronounced overall stretch at 3400 cm-1 [19,20].
The siloxane bond (Si-OH) exhibits a stretching vibration, which correlates to the strong band at 804 cm-1 as shown in Figure 1a–d. The silica matrix’s structural support is provided by this band [21]. However, it is interesting to note that the intensities of this band are reduced in the corresponding SiO2 (a) and s-SiO2 (b) spectra due the elimination of volatile components during the calcination of silica. Finally, the main peaks located at 1038,1072,1052 and 1047 cm−1 in Figure 1 (a, b, c, and d respectively), are caused by the bending vibrations of Si-O-Si. Based on these observations made from the FTIR spectra in Figure 1, it can be concluded that silica particles were successfully synthesised and that the sulfonation of these particles was successful in Figure 1a,d.
3.2. XRD for Pure and Sulfonated Silica
Figure 2 indicate X-ray diffraction (XRD) of silica particles (SiO2 and s-SiO2) synthesized by sol gel and Stober processes. As seen in Figure 2a–d, the silica particles’ XRD patterns display standard diffraction peaks that correspond to amorphous nano-silica at Bragg’s angle (2 of 22° for both sulfonated and pristine silica particles synthesised using both the sol gel and Stober methods and calcinated for 2 h at 600 oC. All the four spectra of silica in Figure 2a–d show a broad humped peak which confirms the short-range ordering of amorphous silica. This implies that the synthetic particles are made of amorphous silica, as reported in literature [22,23].
3.3. SEM Results for Pure and Sulfonated Silica
Figure 3 demonstrate SEM results for silica particles produced by sol gel and Stober methods, calcinated for 2 h. The SEM image for the sol gel method in Figure 3a,b indicates an uneven distribution of the amorphous silica particles. As seen in Figure 3, the morphology of both sulfonated and pristine silica nanoparticles shows well rounded/spherical discrete nanoparticles and clusters of agglomerated nanoparticles. It can also be observed that the nanoparticles synthesised using the sol gel method (Figure 3a,b) exhibit slightly larger nanoparticle size than the once synthesised using the Stober nanoparticles. Confirmation of nanoparticle size differences is provided by the BET analysis in Section 3.4. These results agree with literature which highlights the Stober mechanism as the most efficient method for controlling silica nanoparticle size compared to the sol gel method [24,25,26]. Consequently, the smaller sized silica nanoparticles synthesised by the Stober mechanism have higher surface area compared to the ones synthesised using the sol gel method, since it is known that the smaller the nanoparticles, the larger the surface area [27,28]. The larger surface area improves the catalytic activity and the fuel cell membrane enhancing performance of these nanoparticles, hence makes them more potent. On the other hand, however, the smaller sized Stober -synthesised silica nanoparticles show higher degrees of nanoparticle agglomeration.
3.4. BET Results for the Pristine and Sulfonated Silica Calcinated for 2 h
Results for nanoparticle parameters such as surface area, total pore volume, and average pore diameter of the synthesised silica particles (calcinated for 2 h) are shown in Table 1. Their pore diameters range in size from 10.67nm to 21.00 nm, clearly indicating that they are nanoparticles [29,30,31]. The pore size information suggests that silica is a mesoporous substance. A mesoporous material is one whose pores are smaller than 50 nm in diameter, according to the International Union of Pure and Applied Chemistry [32]. It is noteworthy mentioning that sulfonated silica nanoparticles show surface areas and pore volumes that are roughly twice small as those of SiO2 particles, with SiO2 having a surface area of 4872 m2/g and the corresponding sulfonated silica 271 m2/g with pore volumes of 1.56 and 0.76 cm3/g respectively. On the same note, it can also be observed that silica nanoparticles with high surface area do simultaneously have high pore volume and small pore diameter. Similar results were reported in literature [33,34]. The high surface area of SiO2 is likely due to the inductive effect of the preformed silica network in the SiO2 [35]. Silica-based mesoporous particles are characterised by produced high specific surface areas, facile and varied surface chemistry modifications, narrow pore size distribution, customizable properties of the pore network, and great biocompatibility with a low incidence of non-specific or negative effects [36]. Another trend is also shown in the pore volumes of the sulfonated silica nanoparticles (both the sol gel and Stober-synthesised) versus the pristine silica nanoparticles. The sulfonated silica shows lower pore volume and surface area compared to the non-sulfonated ones. This is because crosslinking sulfonated groups may occupy some of the pore spaces of the fabricated silica nanoparticles, thereby reducing the pore volumes [37,38]. Due to these reported pore volumes, smaller nanoparticle sizes and large surface area of the synthesised silica nanoparticles, they are promising performance enhancer candidates for application in fuel cells.
- Results for silica calcinated for 24 h
3.5. FTIR for Pure and Sulfonated Silica
Figure 4 shows the FTIR spectra of the pristine (4. 4a) sulfonated (4.4 c) silica nanoparticles synthesised from the sol gel and the Stober ((c) and (d)) methods. The notable peak at 3410 cm-1 in the Figure 4b spectrum corresponds to the OH vibrations, possibly due to the adsorbed moisture on the nanoparticles. This is the sol gel-synthesised silica with sulfonated surfaces. This is supported by the fact that the sulfonation of the silica makes the nanoparticles more hygroscopic. Alternatively, this peak may be as a result of the hydrolysis of TEOS, which varies with the concentration of H2O and NH3 in the solution. As the concentration of NH3 increases, H2O dissociates, releasing more OH- ions, which attack the Si atoms and accelerate hydrolysis [39]. The asymmetric Si-O (1001 cm-1), asymmetric Si-OH (996 cm-1), and symmetric Si-O (778 cm-1) vibrations are more visible in the amorphous silica particles in Figure 4b while the corresponding spectra (a, c, and d) are not visible except that of symmetric Si-O band of (a, b, c, and d) which is around 778 cm-1. The superimposition of distinct SiO2 peaks and Si-OH bonding peaks, caused by leftover organic groups ascribed as the origin of the absorption bands between 800 and 1270 cm-1 in both Figure 4a–d.
3.6. XRD for Pure and Sulfonated Silica Calcinated at 24 h
Diffraction patterns of the silica nanoparticles produced using the sol gel and the Stober methods and calcinated for 24 h is demonstrated in Figure 5. Pure and sulfonated silica particles shown in Figure 5 bear amorphous structure due to continuum random network, which maintains crystalline connection and distributes the geometric parameters throughout a range [40]. The amorphous peak of these particles is situated at 2=20 [41]. These findings are consistent with the results obtained in literature [42,43] which reported that the amorphous silica has 2 hump between 15° and 35°. Also, the outcome is consistent with the silica standard pattern established by the Joint Committee on Powder Diffraction (JCPDS) for Standards. Amorphous nano-silica particles can function as a nucleus for silicic acid when the right amount of H2O is added to NH3 at the right temperature, resulting in microspheres with rounded and smooth surfaces. When nano-silica is formed, silicic acid acts as a nucleating agent, creating a substrate on which symmetric particles can grow [44].
3.7. SEM for Pure and Sulfonated Silica Calcinated at 24 h
Surface morphology of the sol gel and Stober-synthesised silica nanoparticles is shown Figure 6. The same SEM images can be used for the comparison of the morphology of the pristine versus the sulfonated silica nanoparticles, calcinated for 24 h. Since replica silica nanoparticles calcinated at 2 h have been previously reported, by extension, comparative studies can therefore be done on the influence of the calcination time on the morphology of silica nanoparticles.
Approximately equal nanoparticle sizes of silica synthesised using the sol gel method is observed for both the pristine silica and the sulfonated silica (Figure 6a,b). Compared to the silica nanoparticles synthesised using the Stober method (Figure 6c,d), these nanoparticles have relatively smaller sizes. This can be explained by the fact that the Stober method is a more efficient way of synthesising silica with regulated nanoparticle sizes [45,46,47]. This can be achieved by altering the ratios ethanol, water, ammonia and tetraethyl-orthosilicate during synthesis.
The surface morphology of sulfonated silica shows more spherical (rounded) and smooth nanoparticles than the pristine silica nanoparticles. Compared to the pristine silica nanoparticles, the sulfonated nanoparticles show an almost uniform nanoparticle size. Furthermore, there is a lower degree of agglomeration on the SEM images of the sulfonated silica compared to the pure silica counterparts. Pure silica particles in Figure 6b,c synthesised by the sol gel and Stober processes respectively show variety in size and shape of the particles, thus both the synthesis methods were unable to create silica particles that have uniform size distribution. Previous studies [48] show the same behaviour of silica. These silica particles in (b) and (c) tend to agglomerate, and it is attributed to silica having high energy and surface tension. Both silica particles in Figure 6a–d indicate smooth surface morphology.
3.8. BET Results for Pristine and Sulfonated Silica Calcinated at 24 h
BET measurements were applied for the determination of nanoparticle parameters such as surface are and pore volume. From these results, comparisons were then made for the morphology of the sulfonated versus pristine silica and silica synthesised using the sol gel or the Stober method. The results are summarised in Table 2.
The samples’ BET surface area and pore volume of the silica particles calcinated for 24 h are demonstrated in Table 2. High surface area and volume of sol gel and Stober silica particles were recorded. Table 2 further indicates that, when silica was modified, the surface area decreased from the highest of 486 m2/g to the lowest of 285 m2/g with a corresponding total pore volume of 1.56 to 0.77 cm3/g highest and lowest value, respectively. The decrease in surface area of modified silica particles was reduced by almost 50%. However, the pore volume increases with an increase in surface area and total pore volume. Large surface area is anticipated to play a role in assisting with the functionality of silica as a filler in the reduction of methanol permeability as silica tends to absorb methanol on its surface which will reduce the methanol permeability of the membrane. Refs. [49,50] reported a silica surface area of 236 m2/g and 222 m2/g respectively which are smaller than the ones found in this report. The decrease in the surface area of silica after the sulfonation of particles relates to what is reported previously in literature and [51]. Thi et al [52] also reported a decrease in the surface area of silica particles after sulfonation when propanol solution and hydrogen peroxide were used as raw material and 3-mercatopropytrimethoxysilan (MPTMS) as a precursor. Silica particles calcinated for 24 h show higher surface area and total pore volume compared to that calcinated for 2 h. These improvements in surface area are a good factor in enhancing the performance of silica particles in the membranes to be modified in terms of increasing their chemical and mechanical properties [36].
3.9. Calcination Time Effects
Calcination time is a critical parameter in the synthesis of silica nanoparticles. It significantly impacts on the morphology, and hence the activity of silica nanoparticles. For instance, increasing calcination time can lead to the production of smaller nanoparticle size due to the complete removal of organic pollutants on the nanoparticles. Such findings were observed in titanium oxide nanoparticles when calcinated at 500 oC for 1 h and 5 h respectively. The nanoparticle diameter was reduced by close to 400% from 83 ± 5 nm to 23 ± 2 nm. Results in this work (Figure 7) likewise show the parametric effects of calcination time on the physiological properties of the synthesised silica nanoparticles between 2 h and 24 h. A significant decrease in the silica nanoparticles was observer can thus be explained using this model of reasoning. On the other hand, research also suggest that increasing calcination time may cause the production of larger nanoparticles. This is so because longer calcination times tend to result in nanoparticle aggregation (agglomeration), thereby increasing nanoparticle size.
Since nanoparticle size affects the nanoparticle surface area, and by extension the surface reactions occurring on the nanoparticles, it follows that surface area is a critical metric for the evaluation of nanoparticle activity.
In this study, there a general silica nanoparticle surface area increasement with increasing calcination time from 2 h to 24 h, as seen by comparing Table 1 and Table 2 in addition to the further information in Figure 7. This effect is more apparent on the pristine silica synthesised using the sol gel method, which improved from 380 to 495 cm2/g. This can be explained in terms of the reduced nanoparticle size with increasing calcination time. This has a direct impact on the surface area of the nanoparticles since surface area is inversely proportional to nanoparticle size. Notably, the same trend was observed for the overall nanoparticle pore volumes. An overall increase in the pore volume was observed with increasing calcination time from 2 h to 24 h. Similarly, this is attributed to the reduced nanoparticle size at increased calcination time. The smaller the nanoparticle size, the larger the total pore volume.
It is noteworthy mentioning that the Stober-synthesised silica nanoparticles show higher surface area compared to the sol gel synthesised by the sol gel mechanism for both the pristine and the sulfonated nanoparticles. There is no significant difference between the surface areas of the 2 h and the 24 h calcinated nanoparticles synthesised using the Stober mechanism whilst the sol gel synthesised silica nanoparticles showed enhanced surface are at higher calcination time. This may be explained in terms of the differences in the impurity composition between the sol gel synthesised silica versus the Stober-synthesised silica. Such impurities include organic pollutants which form a surface coating on the silica nanoparticles. Hence, upon their removal during prolonged calcination, the ‘de-coated’ silica nanoparticles then appear smaller and will have larger surface area. To this end, only the pristine silica nanoparticles synthesised by the sol gel method showed a marked improvement in surface area upon increasing calcination time from 2 h to 24 h.
3.10. Effects of Sulfonation on the Silica Nanoparticles
Compared to the pristine silica nanoparticles, sulfonated silica nanoparticles showed lower surface area for both the Stober and the sol gel synthesised silica nanoparticles. This effect was observed under different calcination times. The sulfonation processes introduces the negatively charged coatation around the nanoparticles. The electrostatic interaction between the negatively charged SO3- groups and the partially positive Si in the SiO2 results in strong adherence of the sulfonation layer around the silica nanoparticles. This ultimately results in the overall enlargement of the sulfonated silica nanoparticles. This nanoparticle enlargement effect is further supported by the cross-linked interactions of the SO3- groups and the neighbouring silica nanoparticles, which leads to the clustering of the nanoparticles (agglomeration). Consequently, these combined possibilities lead to the reduction of the silica nanoparticle surface area since surface area is inversely proportional to particle size.
Finally, there is no big differences between the morphologies of the pristine and sulfonated silica nanoparticles. Almost equal and rounded (spherical) nanoparticles were obtained from both sets of the nanoparticles, proving that the sulfonation process does not interfere with the overall nanoparticle formation.
3.11. Total Pore Volumes
The total pore volume (TPV) is a critical parameter of nanoparticle performance since it informs of the size of empty spaces surrounding the silica nanoparticles. Generally, TPV is a function of nanoparticle size, and it is also used to determine the level of agglomeration of the nanoparticles since agglomerated nanoparticles have compromised TVP. The higher the TVP, the more suitable the nanoparticles are for chemical reactions, including membrane reactions in fuel cells. This is based on the fact that larger pore volumes allow better mass flow to occur. Both the reactants and products percolate freely to and from the active sites of the nanoparticles at higher pore volumes thereby improving the activity of the nanoparticles.
From Figure 8, the results in this study show that TPV varies with calcination duration, especially for the unsulfonated (pristine) silica nanoparticles synthesised using the sol gel method. This is due to the connection between nanoparticle size with pore volumes. The same nanoparticles improved its surface area upon increased calcination time, an indication of the nanoparticle size reduction effect. As explained earlier, this reduction in nanoparticle size is attributed to the complete removal of organic pollutants surrounding the nanoparticles. Because TPV is inversely proportional to pore volume, this occurrence is accompanied by increased pore volume, which will subsequently result in improved performance of the silica nanoparticles. However, no improved TPV was recorded for the sulfonated nanoparticles with increased calcination time. This may be explained in terms of limited to no organic pollutants in sulfonated silica nanoparticles. As a result, no significant loss of pollutants is observed upon increased sulfonation, to create more empty volumes (pore volumes) due to increased calcination. Also, unlike the sol gel synthesised silica nanoparticles, there is no significant change in the TPV of the Stober-synthesised silica nanoparticles upon increased calcination time. Fundamentally, this is caused by the higher ability of the Stober method to produce highly controlled nanoparticle sizes (smaller sizes) with high surface area and pore volumes. Sine these parameters are intrinsically connected to the applied method and less dependent on the calcination time, it follows naturally that increasing calcination time does not alter the TPV by any significant difference.
3.12. Stober Versus Sol Gel Synthesis Methods
At 2 h calcination time, the Stober method produces silica nanoparticles with higher pore volumes than the sol. There is a general increase in TPV with increasing calcination time from 2 h to 24 h for both methods. As the calcination time is increased to 24 h, the silica pore volumes become independent of the synthesis method. This implies that the Stober method produces more pure silica nanoparticles (with less pollutants) compared to the sol gel method. This observation is consistent with the surface areas obtained from the produced silica nanoparticles by these two methods and calcinated for the respective durations (Figure 7). The trend of increasing surface area of the silica nanoparticles synthesised using the two methods upon increased calcination time from 2 h to 24 h is observed. There is a marked difference in the surface areas of the pristine silica nanoparticles between the Stober method and the sol gel method, especially at lower (2 h) calcination times. The Stober method produced silica nanoparticles with higher surface area than the sol gel method. As stated earlier in this work, this is attributed to the precise superiority of the Stober method in controlling nanoparticle size during synthesis.
However, literature also highlights some of the advantages of using the sol gel method over the Stober method. For example, the sol gel method is more flexible since it accommodates more than one precursor alternatives. In the same vein, the sol gel method can be adjusted to influence the resulting silica nanoparticles produced morphology. Since each method has its own merits and demerits, it follows that the choice of the method employed is usually at the discretion of the user, based on the exact intended application of the silica nanoparticles.
3.13. Electrochemical Characterisation
The electrochemical properties of the prepared SiO2 nanoparticles were characterized by cyclic voltammetry in 0.1 M KCl in the presence of 5mM ferri/ferricyanide at 50 cm.s-1 using FTO as the working electrode. It is well known in the electrocatalysis field that the electrocatalyst preparation method has a great effect on the properties of the resulting electrocatalyst. This effect is well observed in Figure 9a, using Stober and Sol-gel method for the preparation SiO2 nanoparticles. The nanoparticles prepared by the Sol-gel method resulted in low current density compared to the nanoparticles prepared by the Stober method for both the 2 h and 24 h preparation time, with the 2 h Stober prepared electrocatalysts having the highest current density. The low current response of Sol-gel prepared SiO2 is an indication of low electrocatalytic activity. This is a clear proof that Stober method is a suitable method for SiO2 preparation and further proves that indeed electrocatalysts preparation method plays a major role in its properties. This results also shows the strong effect of electrocatalysts preparation/ calcination time. Upon sulfonation (Figure 9b), the peak current increases as a results of the high pore diameter of the sulfonated SiO2 compared to the pristine SiO2 nanoparticles, confirmed by BET. Large pores reduces mass limitations, enhancing electrocatalytic activity. The high peak current response is also attributed to the favourable structural modification as a result of electrostatic interactions between the negatively charged sulfur and the neutral SiO2, which enhances charge transfer process within the nanoparticles compared to the pristine silica nanoparticles and increases their potential applicability in various redox processes. Additionally, the increase in current response is an indication of an enhancement in electrochemical surface area (ECSA) and reaction kinetics. The shift in peak position potentials is an indication of improved electrocatalytic activity. Although the sulfonated SiO2 nanoparticles calcined for 2 h has low current response compared to the pristine SiO2, its peak shift shows improved electrochemical properties. The low current response might be the results of small ECSA, as the ECSA has a direct relationship with the peak current response. Figure 9d shows the Nyquist plot of the Stober prepared electrocatalysts over the 100 kHz to 0.01 Hz frequency range. The pristine SiO2 shows high capacitive behaviour, with the resistive behaviour decreasing upon sulfonation. This is indicated by the small semi-circular segment, an indication of the electron transfer resistance within an electrocatalyst. The high conductivity/ electron transfer ability of the sulfonated materials results from the enhanced charge mobility during electrocatalysis and strong attractive interactions between the sulfonic groups on the SiO2 and the redox probe. The bare FTO electrode shows the highest conductivity compared to SiO2 nanoparticles. This shows that FTO is a good electrode for electrocatalysis studies as it will not greatly influence the electrochemical analysis results of the materials, enhancing optimal characterization.
4. Conclusions
Synthesis of the pristine and the sulfonated silica nanoparticles using the sol gel and the Stober methods was successfully done. The obtained nanoparticles were subjected to calcination at 600 oC for 2 h and 24 h each. The effects of the synthesis method, calcination time and sulfonation of the silica nanoparticles was evaluated on the nanoparticle morphology in terms of surface area (nanoparticle size), total pore volumes and shape of the silica nanoparticles produced. The particles calcinated for 2 h and 24 h were found within the range of 12 nm to 21 nm with the highest pore diameters recorded on silica calcinated for 24 h. Silica particles for Stober and sol gel calcinated for 2 h and 24 h have short-range ordering resulting in them having amorphous structures. Synthesized silica particles tend to agglomerate, and this was more visible in silica particles calcinated for 2 h compared to the one calcinated for 24 h using the same method and no visible agglomeration was discovered after surface modification of silica. At both shorter and longer calcination times, sulfonated silica shows lower total pore volume compared to the pristine silica. The same trend is true for the surface areas of the sulfonated versus pristine silica nanoparticles. On the other hand, the Stober method produces silica nanoparticles with larger surface area than the sol gel method. At lower calcination time, the Stober method produces silica nanoparticles with larger total pore volume than the sol gel method. However, the total pore volume becomes independent of the synthesis route at higher calcination times.
References
- Ellerbrock, R.; Stein, M.; Schaller, J. Comparing Amorphous Silica, Short-Range-Ordered Silicates and Silicic Acid Species by FTIR. Sci Rep 2022, 12. [Google Scholar] [CrossRef]
- Chen, Z.; Shi, Z.; Ni, S.; Ren, B.; Hu, J. Origin, Formation, and Transformation of Different Forms of Silica in Xuanwei Formation Coal, China, and Its’ Emerging Environmental Problem. Environ Sci Pollut Res Int 2023, 30, 120735–120748. [Google Scholar] [CrossRef] [PubMed]
- Zargar, S. M.; Mahajan, R.; Bhat, J. A.; Nazir, M.; Deshmukh, R. Role of Silicon in Plant Stress Tolerance: Opportunities to Achieve a Sustainable Cropping System. 3 Biotech 2019, 9, 1–16. [Google Scholar] [CrossRef] [PubMed]
- Ying, Y. P.; Kamarudin, S. K.; Masdar, M. S. Silica-Related Membranes in Fuel Cell Applications: An Overview. Int J Hydrogen Energy 2018, 43, 16068–16084. [Google Scholar] [CrossRef]
- Ying, Y. P.; Kamarudin, S. K.; Masdar, M. S. Silica-Related Membranes in Fuel Cell Applications: An Overview. International Journal of Hydrogen Energy. Elsevier Ltd August 16, 2018, pp 16068–16084. [CrossRef]
- Li, J.; Xu, G.; Luo, X.; Xiong, J.; Liu, Z.; Cai, W. Effect of Nano-Size of Functionalized Silica on Overall Performance of Swelling-Filling Modified Nafion Membrane for Direct Methanol Fuel Cell Application. Appl Energy 2018, 213, 408–414. [Google Scholar] [CrossRef]
- Kusumastuti, E.; Siniwi, W. T.; Mahatmanti, F. W.; Jumaeri, J.; Atmaja, L.; Widiastuti, N. Modification of Chitosan Membranes with Nanosilica Particles as Polymer Electrolyte Membranes. In AIP Conference Proceedings; American Institute of Physics Inc., 2016; Vol. 1725. [CrossRef]
- Budnyak, T. M.; Vlasova, N. N.; Golovkova, L. P.; Markitan, O.; Baryshnikov, G.; Ågren, H.; Slabon, A. Nucleotide Interaction with a Chitosan Layer on a Silica Surface: Establishing the Mechanism at the Molecular Level. Langmuir 2021, 37, 1511–1520. [Google Scholar] [CrossRef]
- Modau, L.; Sigwadi, R.; Mokrani, T.; Nemavhola, F. Chitosan Membranes for Direct Methanol Fuel Cell Applications. Membranes (Basel) 2023, 13, 1–19. [Google Scholar] [CrossRef]
- Blachnio, M.; Zienkiewicz-Strzalka, M.; Derylo-Marczewska, A.; Nosach, L. V.; Voronin, E. F. Chitosan–Silica Composites for Adsorption Application in the Treatment of Water and Wastewater from Anionic Dyes. Int J Mol Sci 2023, 24. [Google Scholar] [CrossRef]
- Silva, A. dos S. da; Santos, J. H. Z. dos. Silica Particle Size and Polydispersity Control from Fundamental Practical Aspects of the Stöber Method. Colloids Surf A Physicochem Eng Asp 2024, 702. [Google Scholar] [CrossRef]
- Fernandes, R. S.; Raimundo, I. M.; Pimentel, M. F. Revising the Synthesis of Stöber Silica Nanoparticles: A Multivariate Assessment Study on the Effects of Reaction Parameters on the Particle Size. Colloids Surf A Physicochem Eng Asp 2019, 577, 1–7. [Google Scholar] [CrossRef]
- Gonçalves, M. C. Sol-Gel Silica Nanoparticles in Medicine: A Natural Choice. Design, Synthesis and Products. Molecules 2018, 23, 1–26. [Google Scholar] [CrossRef] [PubMed]
- St, E.; Nanoparticles, S.; Mechanism, G.; Nanostructures, S.; Imaging, M. Engineering Stöber Silica Nanoparticles : Insights into the Growth Mechanism and Development of Silica-Based Nanostructures for Multimodal Imaging Oscar Hernando Moriones Botero.
- Mujiyanti, D. R.; Surianthy, M. D.; Junaidi, A. B. The Initial Characterization of Nanosilica from Tetraethylorthosilicate (TEOS) with the Addition Polivynil Alcohol by Fourier Transform Infra Red. IOP Conf Ser Earth Environ Sci 2018, 187. [Google Scholar] [CrossRef]
- Spitzmüller, L.; Nitschke, F.; Rudolph, B.; Berson, J.; Schimmel, T.; Kohl, T. Dissolution Control and Stability Improvement of Silica Nanoparticles in Aqueous Media. Journal of Nanoparticle Research 2023, 25. [Google Scholar] [CrossRef]
- Muhammud, A. M.; Gupta, N. K. Nanostructured SiO2 Material: Synthesis Advances and Applications in Rubber Reinforcement. RSC Adv 2022, 12, 18524–18546. [Google Scholar] [CrossRef]
- Petreanu, I.; Niculescu, V. C.; Enache, S.; Iacob, C.; Teodorescu, M. Structural Characterization of Silica and Amino-Silica Nanoparticles by Fourier Transform Infrared (FTIR) and Raman Spectroscopy. Anal Lett 2023, 56, 390–403. [Google Scholar] [CrossRef]
- Martina, P.; Gayathri, R.; Pugalenthi, M. R.; Cao, G.; Liu, C.; Prabhu, M. R. Nanosulfonated Silica Incorporated SPEEK/SPVdF-HFP Polymer Blend Membrane for PEM Fuel Cell Application. Ionics (Kiel) 2020, 26, 3447–3458. [Google Scholar] [CrossRef]
- Kalaiselvimary, J.; Sundararajan, M.; Prabhu, M. R. Preparation and Characterization of Chitosan-Based Nanocomposite Hybrid Polymer Electrolyte Membranes for Fuel Cell Application. Ionics (Kiel) 2018, 24, 3555–3571. [Google Scholar] [CrossRef]
- Rangasamy, V. S.; Thayumanasundaram, S.; Seo, J. W.; Locquet, J. P. Vibrational Spectroscopic Study of Pure and Silica-Doped Sulfonated Poly(Ether Ether Ketone) Membranes. Spectrochim Acta A Mol Biomol Spectrosc 2015, 138, 693–699. [Google Scholar] [CrossRef]
- Sompech, S.; Dasri, T.; Thaomola, S. Preparation and Characterization of Amorphous Silica and Calcium Oxide from Agricultural Wastes. 2016.
- Trisunaryanti, W.; Larasati, S.; Triyono, T.; Santoso, N. R.; Paramesti, C. Selective Production of Green Hydrocarbons from the Hydrotreatment of Waste Coconut Oil over Ni- And NiMo-Supported on Amine-Functionalized Mesoporous Silica. Bulletin of Chemical Reaction Engineering & Catalysis 2020, 15, 415–431. [Google Scholar] [CrossRef]
- Ren, G.; Su, H.; Wang, S. The Combined Method to Synthesis Silica Nanoparticle by Stöber Process. J Solgel Sci Technol 2020, 96, 108–120. [Google Scholar] [CrossRef]
- Sivolapov, P.; Myronyuk, O.; Baklan, D. Synthesis of Stober Silica Nanoparticles in Solvent Environments with Different Hansen Solubility Parameters. Inorg Chem Commun 2022, 143. [Google Scholar] [CrossRef]
- Sivolapov, P.; Myronyuk, O.; Baklan, D. Synthesis of Stober Silica Nanoparticles in Solvent Environments with Different Hansen Solubility Parameters. Inorg Chem Commun 2022, 143. [Google Scholar] [CrossRef]
- Modena, M. M.; Rühle, B.; Burg, T. P.; Wuttke, S. Nanoparticle Characterization: What to Measure? Advanced Materials. Wiley-VCH Verlag 2019. [CrossRef]
- Schmid, O.; Stoeger, T. Surface Area Is the Biologically Most Effective Dose Metric for Acute Nanoparticle Toxicity in the Lung. J Aerosol Sci 2016, 99, 133–143. [Google Scholar] [CrossRef]
- Dolai, J.; Mandal, K.; Jana, N. R. Nanoparticle Size Effects in Biomedical Applications. ACS Applied Nano Materials. American Chemical Society July 23, 2021, pp 6471–6496. [CrossRef]
- Hickey, J. W.; Santos, J. L.; Williford, J. M.; Mao, H. Q. Control of Polymeric Nanoparticle Size to Improve Therapeutic Delivery. Journal of Controlled Release 2015, 219, 536–547. [Google Scholar] [CrossRef] [PubMed]
- Banerjee, A.; Qi, J.; Gogoi, R.; Wong, J.; Mitragotri, S. Role of Nanoparticle Size, Shape and Surface Chemistry in Oral Drug Delivery. Journal of Controlled Release 2016, 238, 176–185. [Google Scholar] [CrossRef] [PubMed]
- Javdani, H.; Khosravi, R.; Etemad, L.; Moshiri, M.; Zarban, A.; Hanafi-bojd, M. Y. Microporous and Mesoporous Materials Tannic Acid-Templated Mesoporous Silica Nanoparticles as an Effective Treatment in Acute Ferrous Sulfate Poisoning. Microporous and Mesoporous Materials 2020, 307, 110486. [Google Scholar] [CrossRef]
- Kumar, S.; Malik, M. M.; Purohit, R. Synthesis of High Surface Area Mesoporous Silica Materials Using Soft Templating Approach. Mater Today Proc 2018, 5, 4128–4133. [Google Scholar] [CrossRef]
- Thahir, R.; Wahab, A. W.; Nafie, N. La; Raya, I. Synthesis of High Surface Area Mesoporous Silica SBA-15 by Adjusting Hydrothermal Treatment Time and the Amount of Polyvinyl Alcohol. Open Chem 2019, 17, 963–971. [Google Scholar] [CrossRef]
- Zeng, S. zhong; Zeng, X.; Huang, L.; Wu, H.; Yao, Y.; Zheng, X.; Zou, J. The Formation Mechanisms of Porous Silicon Prepared from Dense Silicon Monoxide. RSC Adv 2017, 7, 7990–7995. [Google Scholar] [CrossRef]
- Rizzi, F.; Castaldo, R.; Latronico, T.; Lasala, P.; Gentile, G.; Lavorgna, M.; Striccoli, M.; Agostiano, A.; Comparelli, R.; Depalo, N.; Curri, M. L.; Fanizza, E. High Surface Area Mesoporous Silica Nanoparticles with Tunable Size in the Sub-Micrometer Regime: Insights on the Size and Porosity Control Mechanisms. Molecules 2021, 26. [Google Scholar] [CrossRef]
- Ge, Q.; Ding, L.; Wu, T.; Xu, G.; Yang, F.; Xiang, M. Effect of Surfactant on Morphology and Pore Size of Polysulfone Membrane. Journal of Polymer Research 2018, 25, 1–13. [Google Scholar] [CrossRef]
- Kim, K.; Kim, S. K.; Park, J. O.; Choi, S. W.; Kim, K. H.; Ko, T.; Pak, C.; Lee, J. C. Highly Reinforced Pore-Filling Membranes Based on Sulfonated Poly(Arylene Ether Sulfone)s for High-Temperature/Low-Humidity Polymer Electrolyte Membrane Fuel Cells. J Memb Sci 2017, 537, 11–21. [Google Scholar] [CrossRef]
- Huber, L. The in Fl Uence of the Ammonia Concentration and the Water Content on the Water Sorption Behavior of Ambient Pressure Dried Silica Xerogels. J Solgel Sci Technol 2020, 197–206. [Google Scholar] [CrossRef]
- Calderon V, S.; Ribeiro, T.; Farinha, J. P. S.; Baleizão, C.; Ferreira, P. J. On the Structure of Amorphous Mesoporous Silica Nanoparticles by Aberration-Corrected STEM. Small 2018, 14. [Google Scholar] [CrossRef] [PubMed]
- Zulfiqar, U.; Subhani, T.; Husain, S. W. Synthesis and Characterization of Silica Nanoparticles from Clay. Journal of Asian Ceramic Societies 2016, 4, 91–96. [Google Scholar] [CrossRef]
- Zulfiqar, U.; Subhani, T.; Wilayat Husain, S. Synthesis of Silica Nanoparticles from Sodium Silicate under Alkaline Conditions. J Solgel Sci Technol 2016, 77, 753–758. [Google Scholar] [CrossRef]
- Issa, H. K.; Taherizadeh, A.; Maleki, A. Atomistic-Level Study of the Mechanical Behavior of Amorphous and Crystalline Silica Nanoparticles. Ceram Int 2020, 46, 21647–21656. [Google Scholar] [CrossRef]
- Zulfiqar, U.; Subhani, T.; Husain, S. W. Synthesis and Characterization of Silica Nanoparticles from Clay Synthesis and Characterization of Silica Nanoparticles from Clay. Integr Med Res 2018, 4, 91–96. [Google Scholar] [CrossRef]
- Lin, Z. ting; Wu, Y. bo; Bi, Y. guang. Rapid Synthesis of SiO2 by Ultrasonic-Assisted Stober Method as Controlled and PH-Sensitive Drug Delivery. Journal of Nanoparticle Research 2018, 20. [Google Scholar] [CrossRef]
- Ren, G.; Su, H.; Wang, S. The Combined Method to Synthesis Silica Nanoparticle by Stöber Process. J Solgel Sci Technol 2020, 96, 108–120. [Google Scholar] [CrossRef]
- Fernandes, R. S.; Raimundo, I. M.; Pimentel, M. F. Revising the Synthesis of Stöber Silica Nanoparticles: A Multivariate Assessment Study on the Effects of Reaction Parameters on the Particle Size. Colloids Surf A Physicochem Eng Asp 2019, 577, 1–7. [Google Scholar] [CrossRef]
- Hagar, M. E.; Afifi, T. H. Catalytic Activity of Sulfated and Phosphated Catalysts towards the Synthesis of Substituted Coumarin. 2018, No. January. [CrossRef]
- Dhaneswara, D.; Fatriansyah, J. F.; Situmorang, F. W.; Haqoh, A. N. Synthesis of Amorphous Silica from Rice Husk Ash: Comparing HCl and CH3COOH Acidification Methods and Various Alkaline Concentrations. International Journal of Technology 2020, 11, 200–208. [Google Scholar] [CrossRef]
- Usgodaarachchi, L.; Thambiliyagodage, C.; Wijesekera, R.; Bakker, M. G. Synthesis of Mesoporous Silica Nanoparticles Derived from Rice Husk and Surface-Controlled Amine Functionalization for Efficient Adsorption of Methylene Blue from Aqueous Solution. Current Research in Green and Sustainable Chemistry 2021, 4, 100116. [Google Scholar] [CrossRef]
- Alfawaz, A.; Alsalme, A.; Alkathiri, A.; Alswieleh, A. Surface Functionalization of Mesoporous Silica Nanoparticles with Brønsted Acids as a Catalyst for Esterificatsion Reaction. J King Saud Univ Sci 2022, 34, 102106. [Google Scholar] [CrossRef]
- Thi, L.; Hoa, M.; Chi, N. T.; Dang, L. Q.; Nguyen, M. T.; Le, T.; Tran, T. Synthesis of Amorphous Silica and Sulfonic Acid Functionalized Silica Used as Reinforced Phase for Polymer Electrolyte Membrane. [CrossRef]
Figure 1.
FTIR results for different silica nanoparticles: (a) s-SiO2 Stober (b) SiO2 Stober (c) s-SiO2 sol gel (d) s-SiO2 -sol gel after calcination for 2 h.
Figure 1.
FTIR results for different silica nanoparticles: (a) s-SiO2 Stober (b) SiO2 Stober (c) s-SiO2 sol gel (d) s-SiO2 -sol gel after calcination for 2 h.
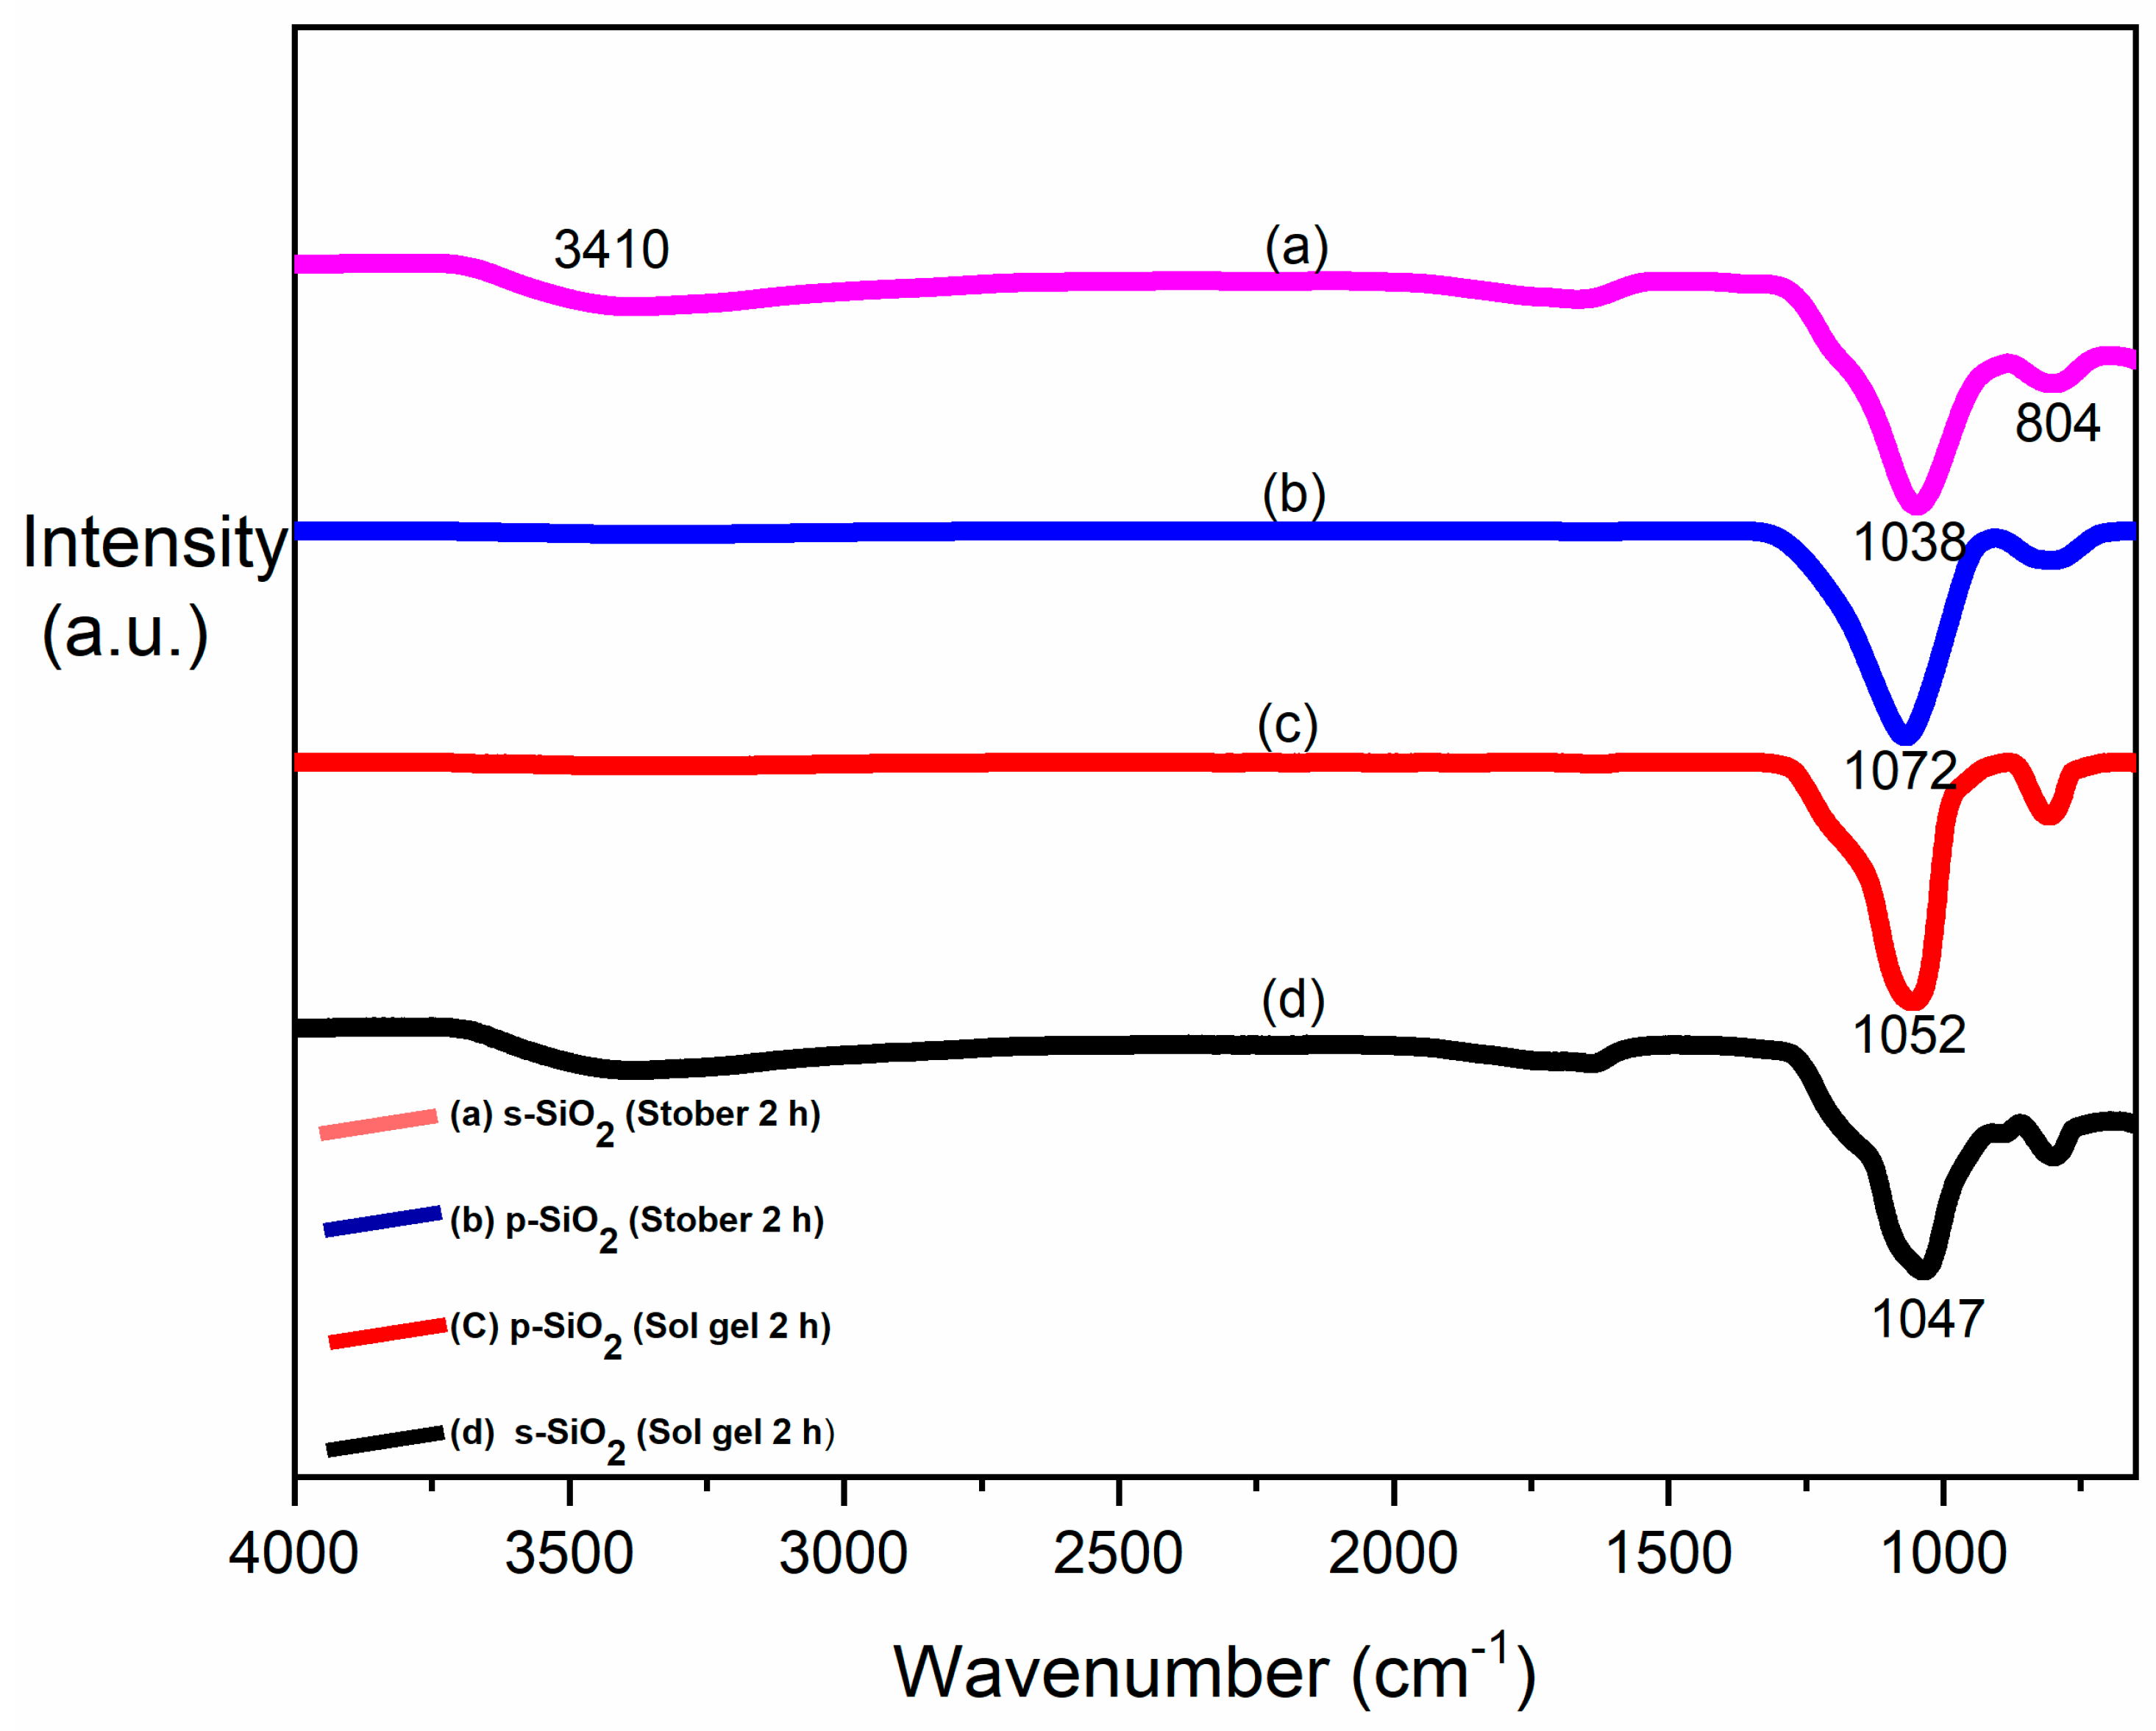
Figure 2.
XRD of (a) s-SiO2 Stober (b) SiO2 Stober (c) s-SiO2 sol gel (d)SiO2 sol gel, calcinated for 2 h.
Figure 2.
XRD of (a) s-SiO2 Stober (b) SiO2 Stober (c) s-SiO2 sol gel (d)SiO2 sol gel, calcinated for 2 h.
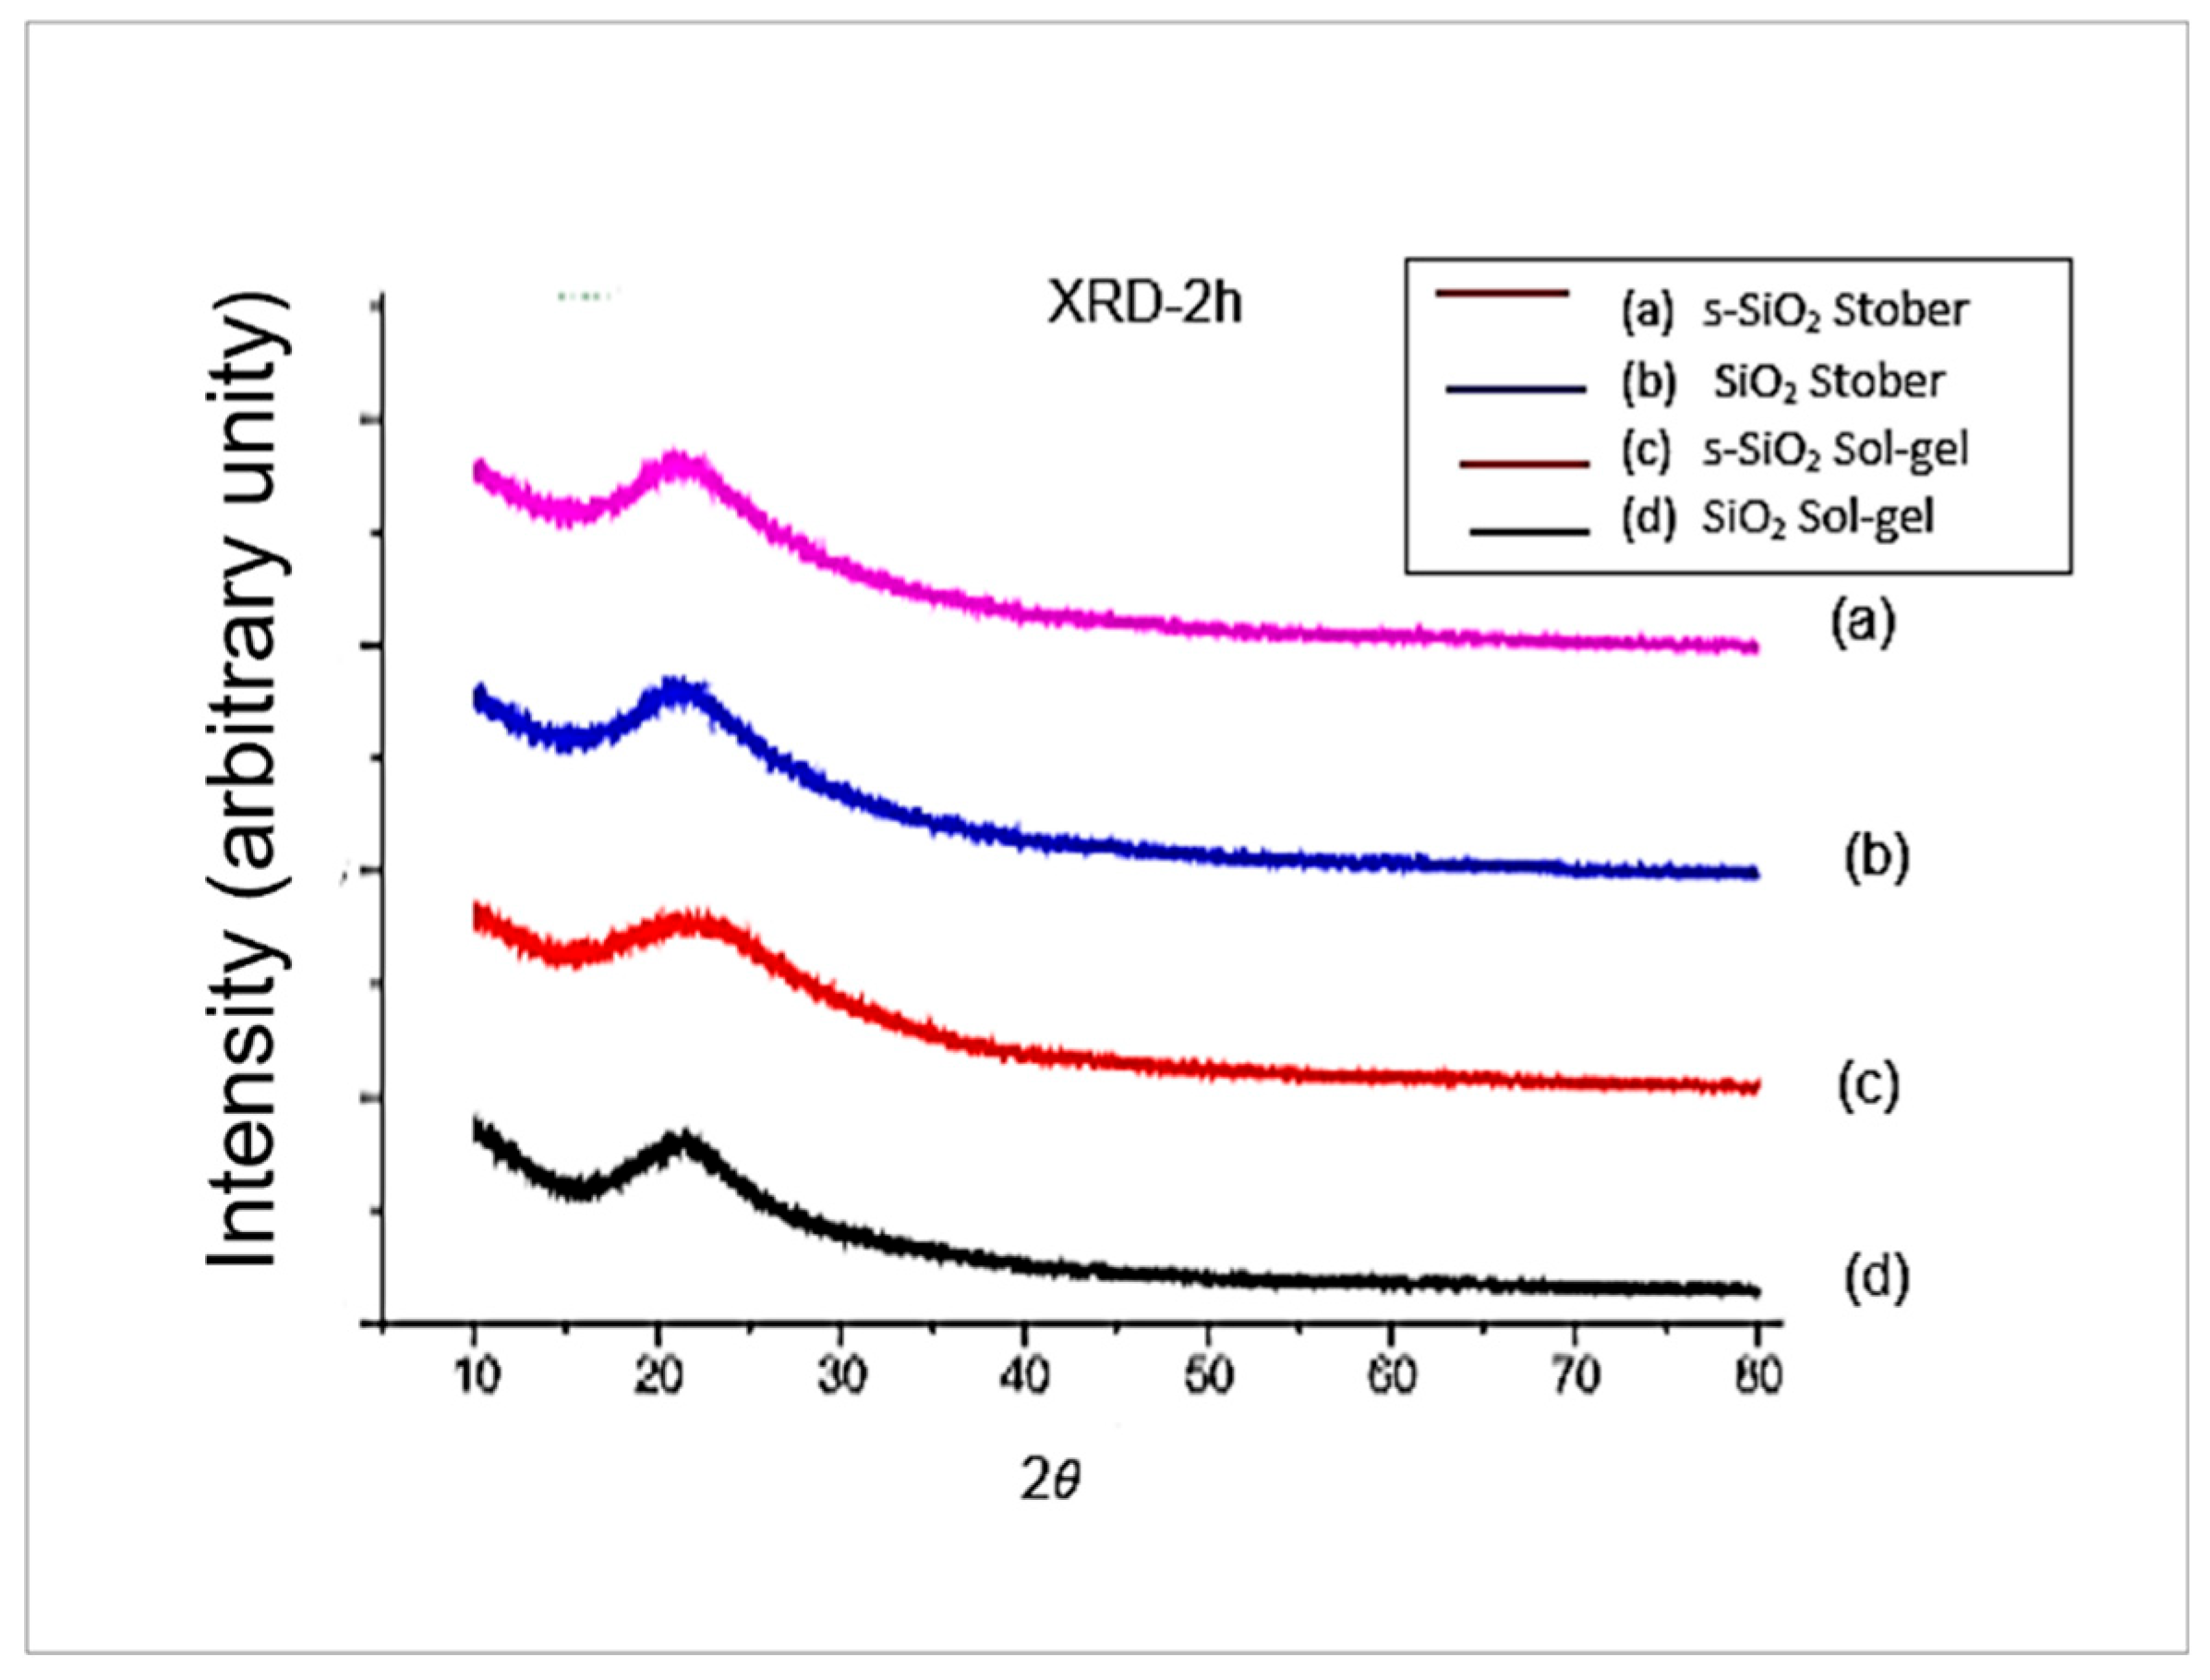
Figure 3.
SEM for (a) SiO2 sol gel (b) s-SiO2 sol gel (c) SiO2 Stober (d) s-SiO2 Stober – all calcinated for 2 h.
Figure 3.
SEM for (a) SiO2 sol gel (b) s-SiO2 sol gel (c) SiO2 Stober (d) s-SiO2 Stober – all calcinated for 2 h.
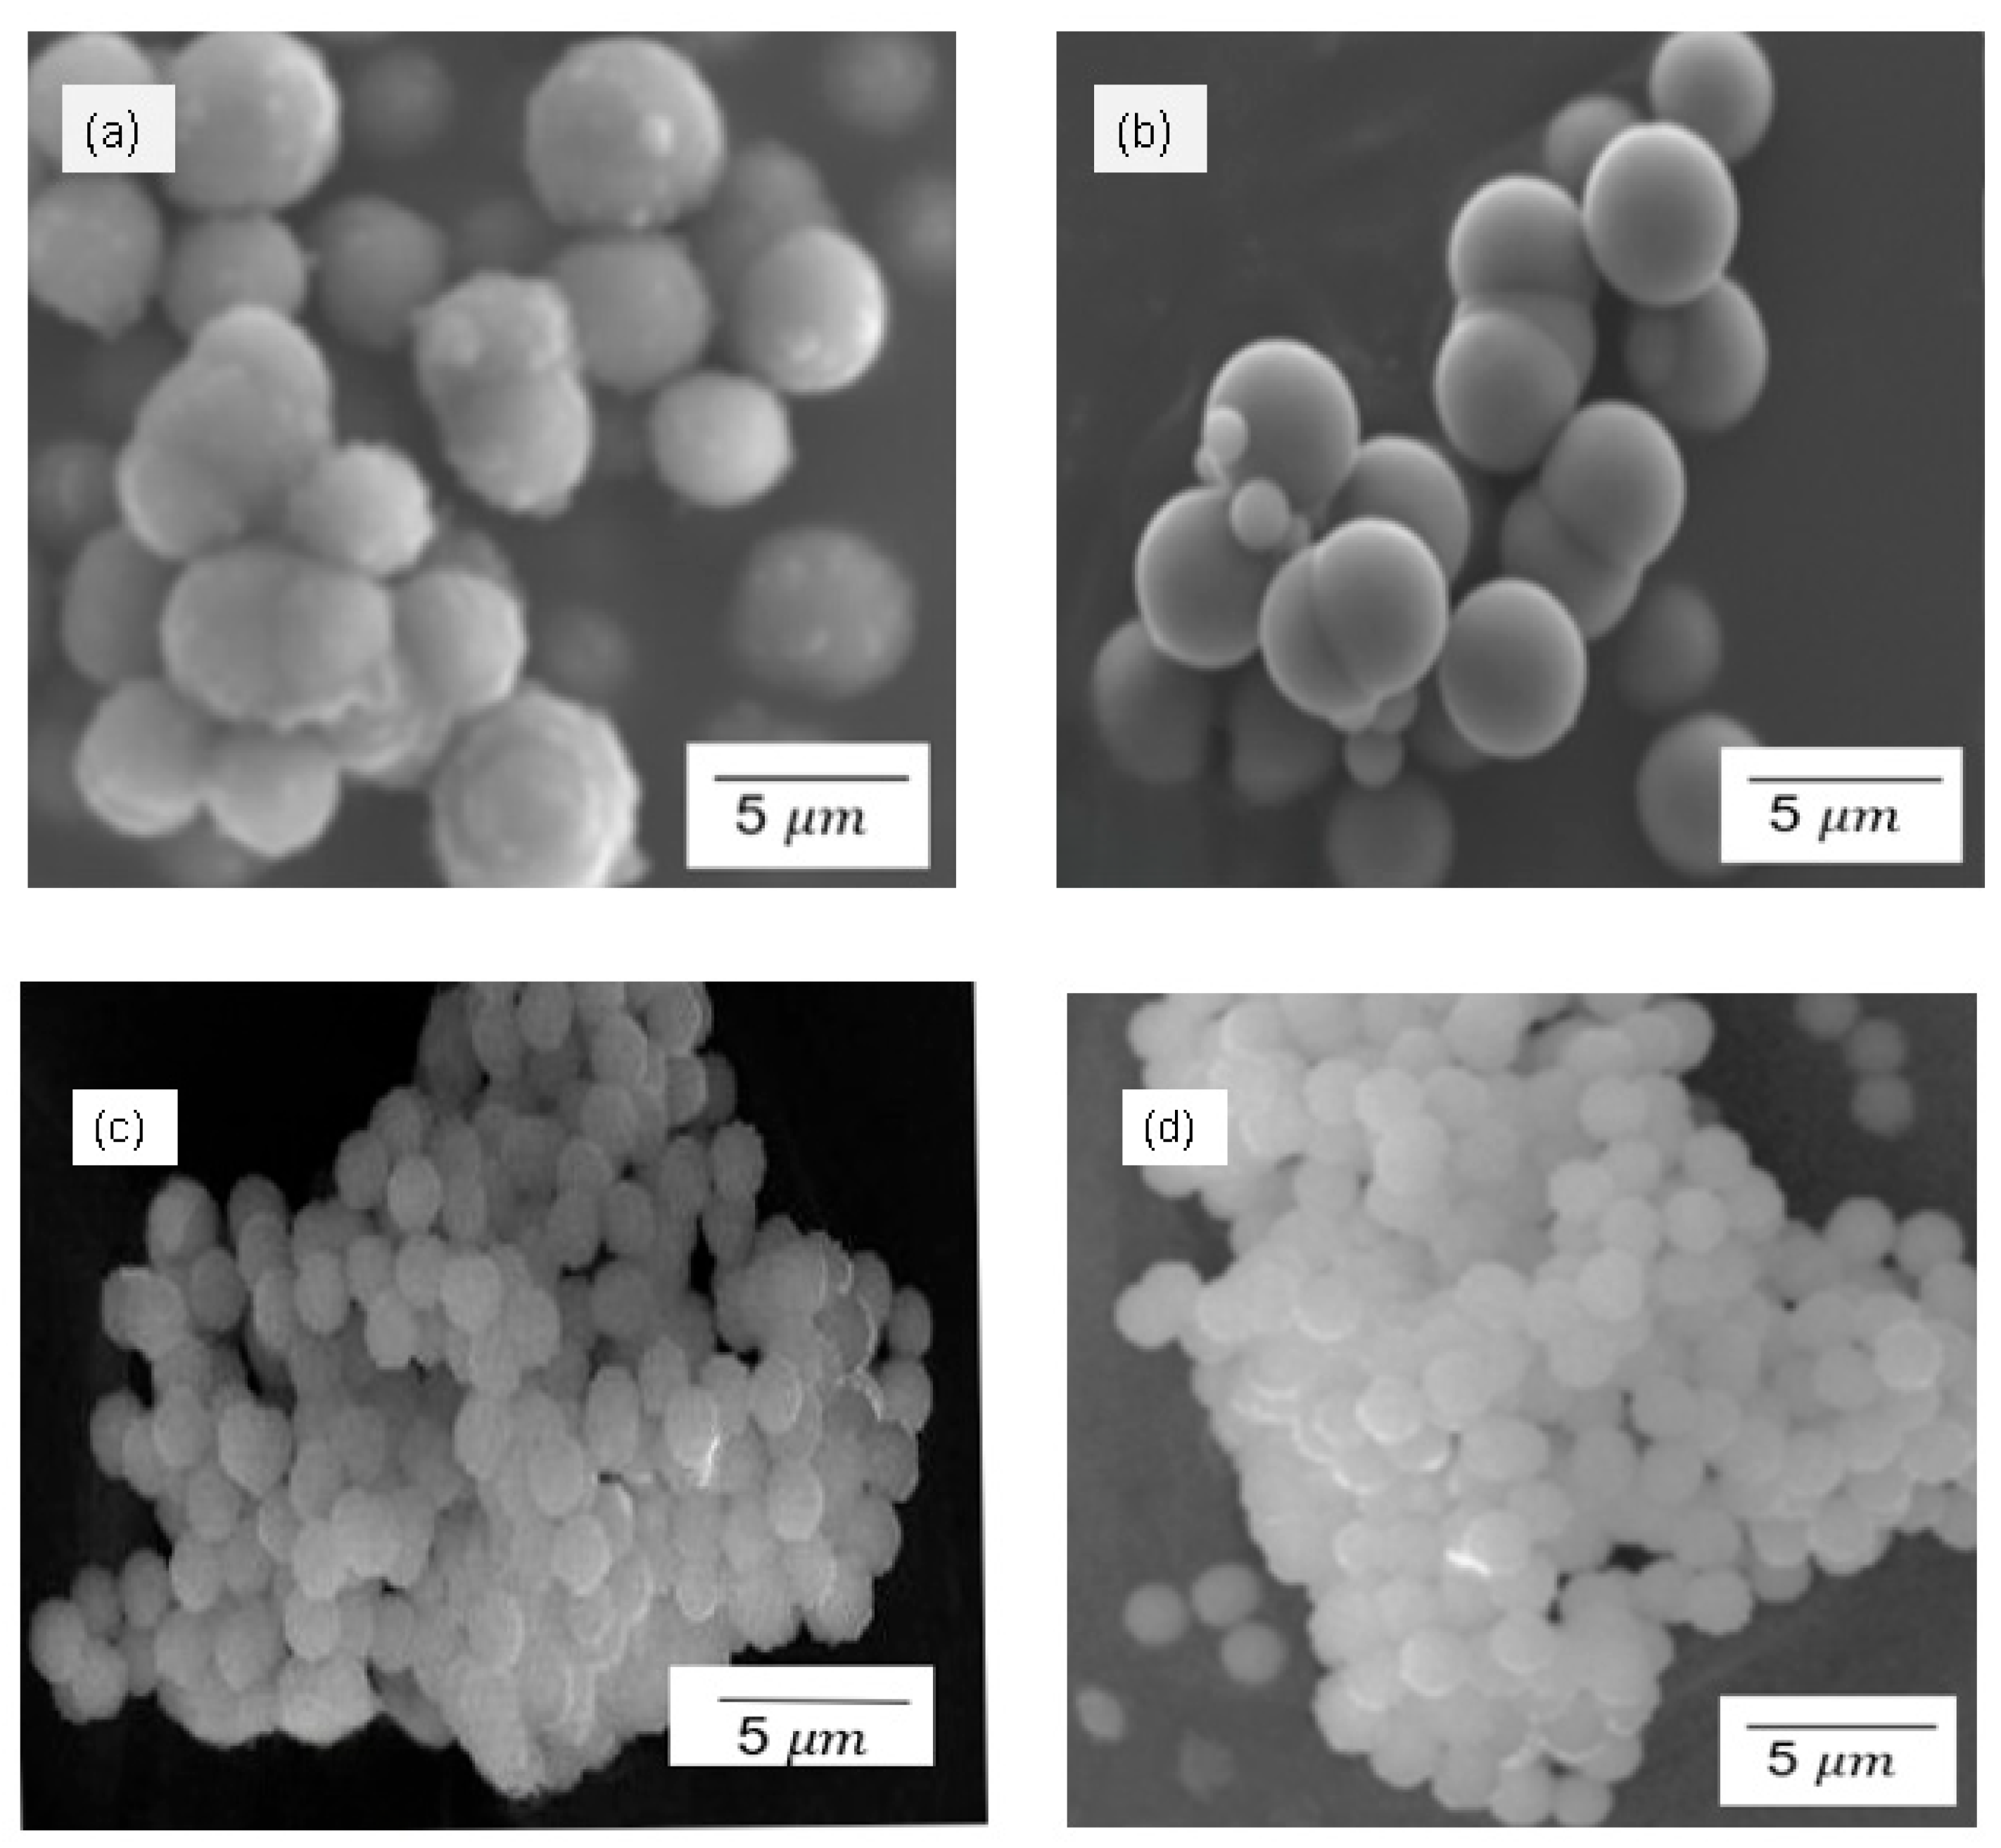
Figure 4.
FTIR for (a) p-SiO2 sol gel (b) s-SiO2 sol gel (c) p-SiO2 Stober (d) s-SiO2 Stober silica particles calcinated for 24 h.
Figure 4.
FTIR for (a) p-SiO2 sol gel (b) s-SiO2 sol gel (c) p-SiO2 Stober (d) s-SiO2 Stober silica particles calcinated for 24 h.
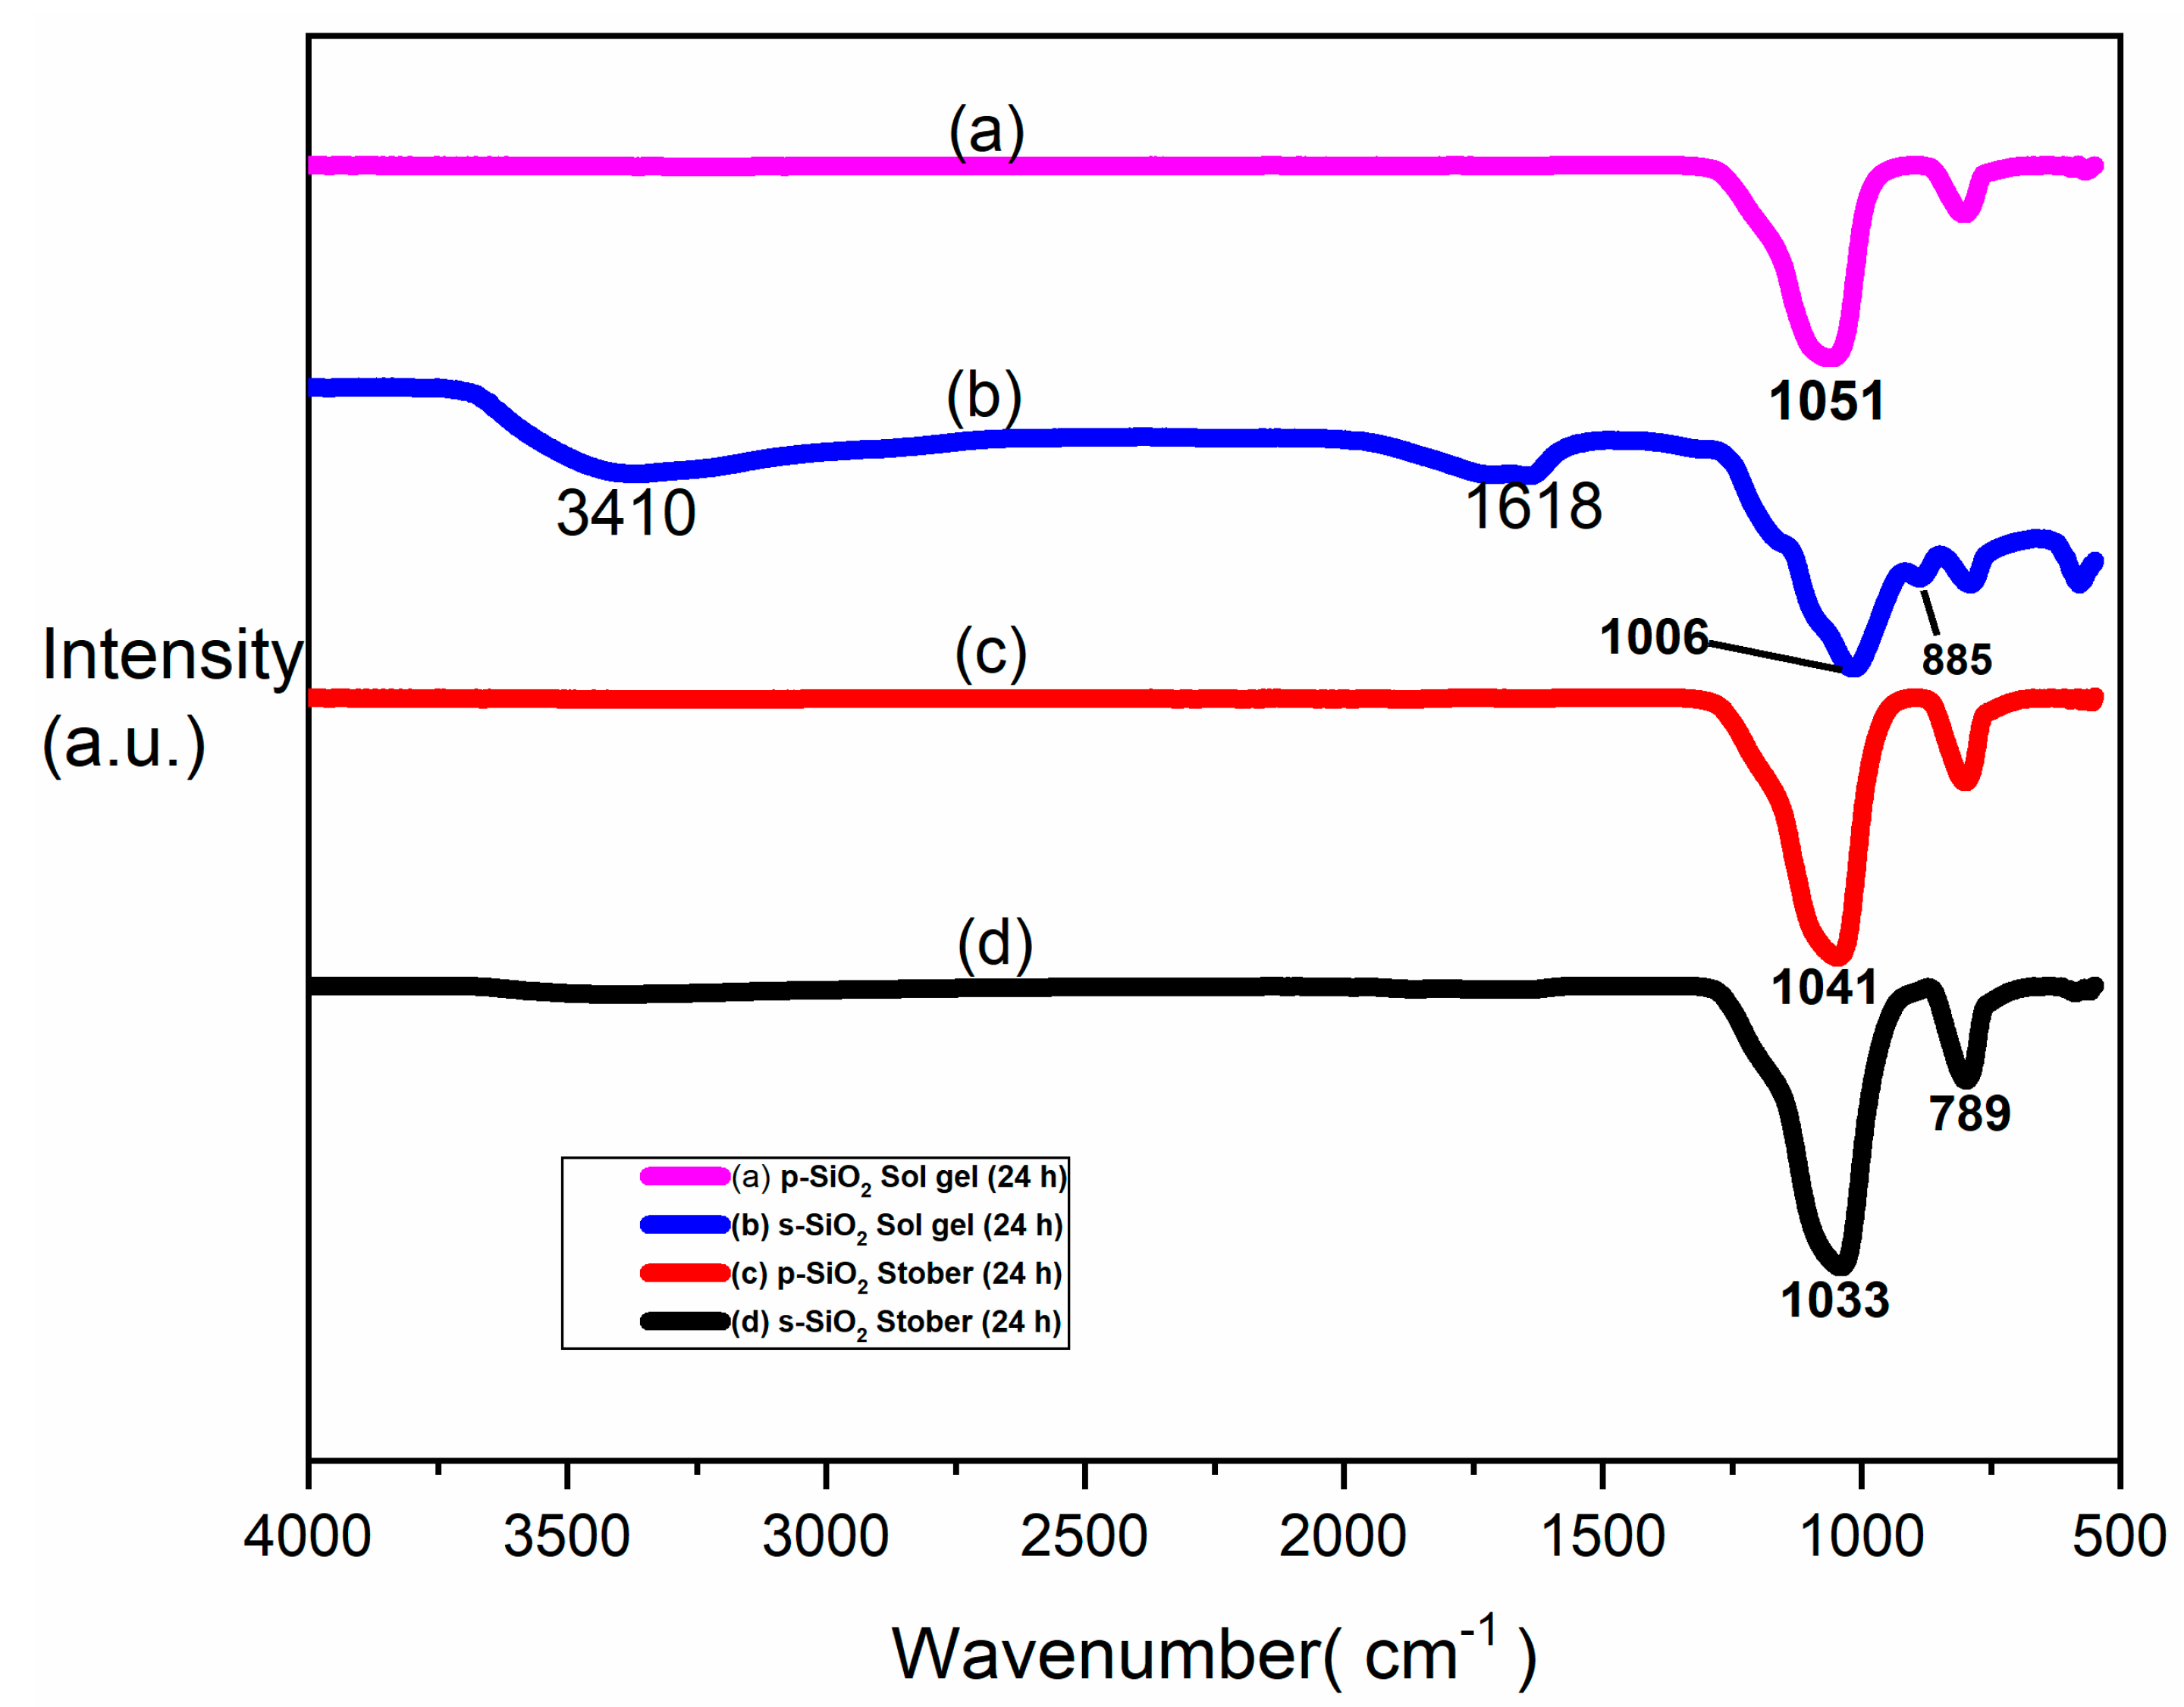
Figure 5.
Xray diffraction patterns for (a) SiO2 sol gel (b) s-SiO2 sol gel (c) SiO2 Stober (d) s-SiO2 Stober silica particles calcinated for 24 h.
Figure 5.
Xray diffraction patterns for (a) SiO2 sol gel (b) s-SiO2 sol gel (c) SiO2 Stober (d) s-SiO2 Stober silica particles calcinated for 24 h.
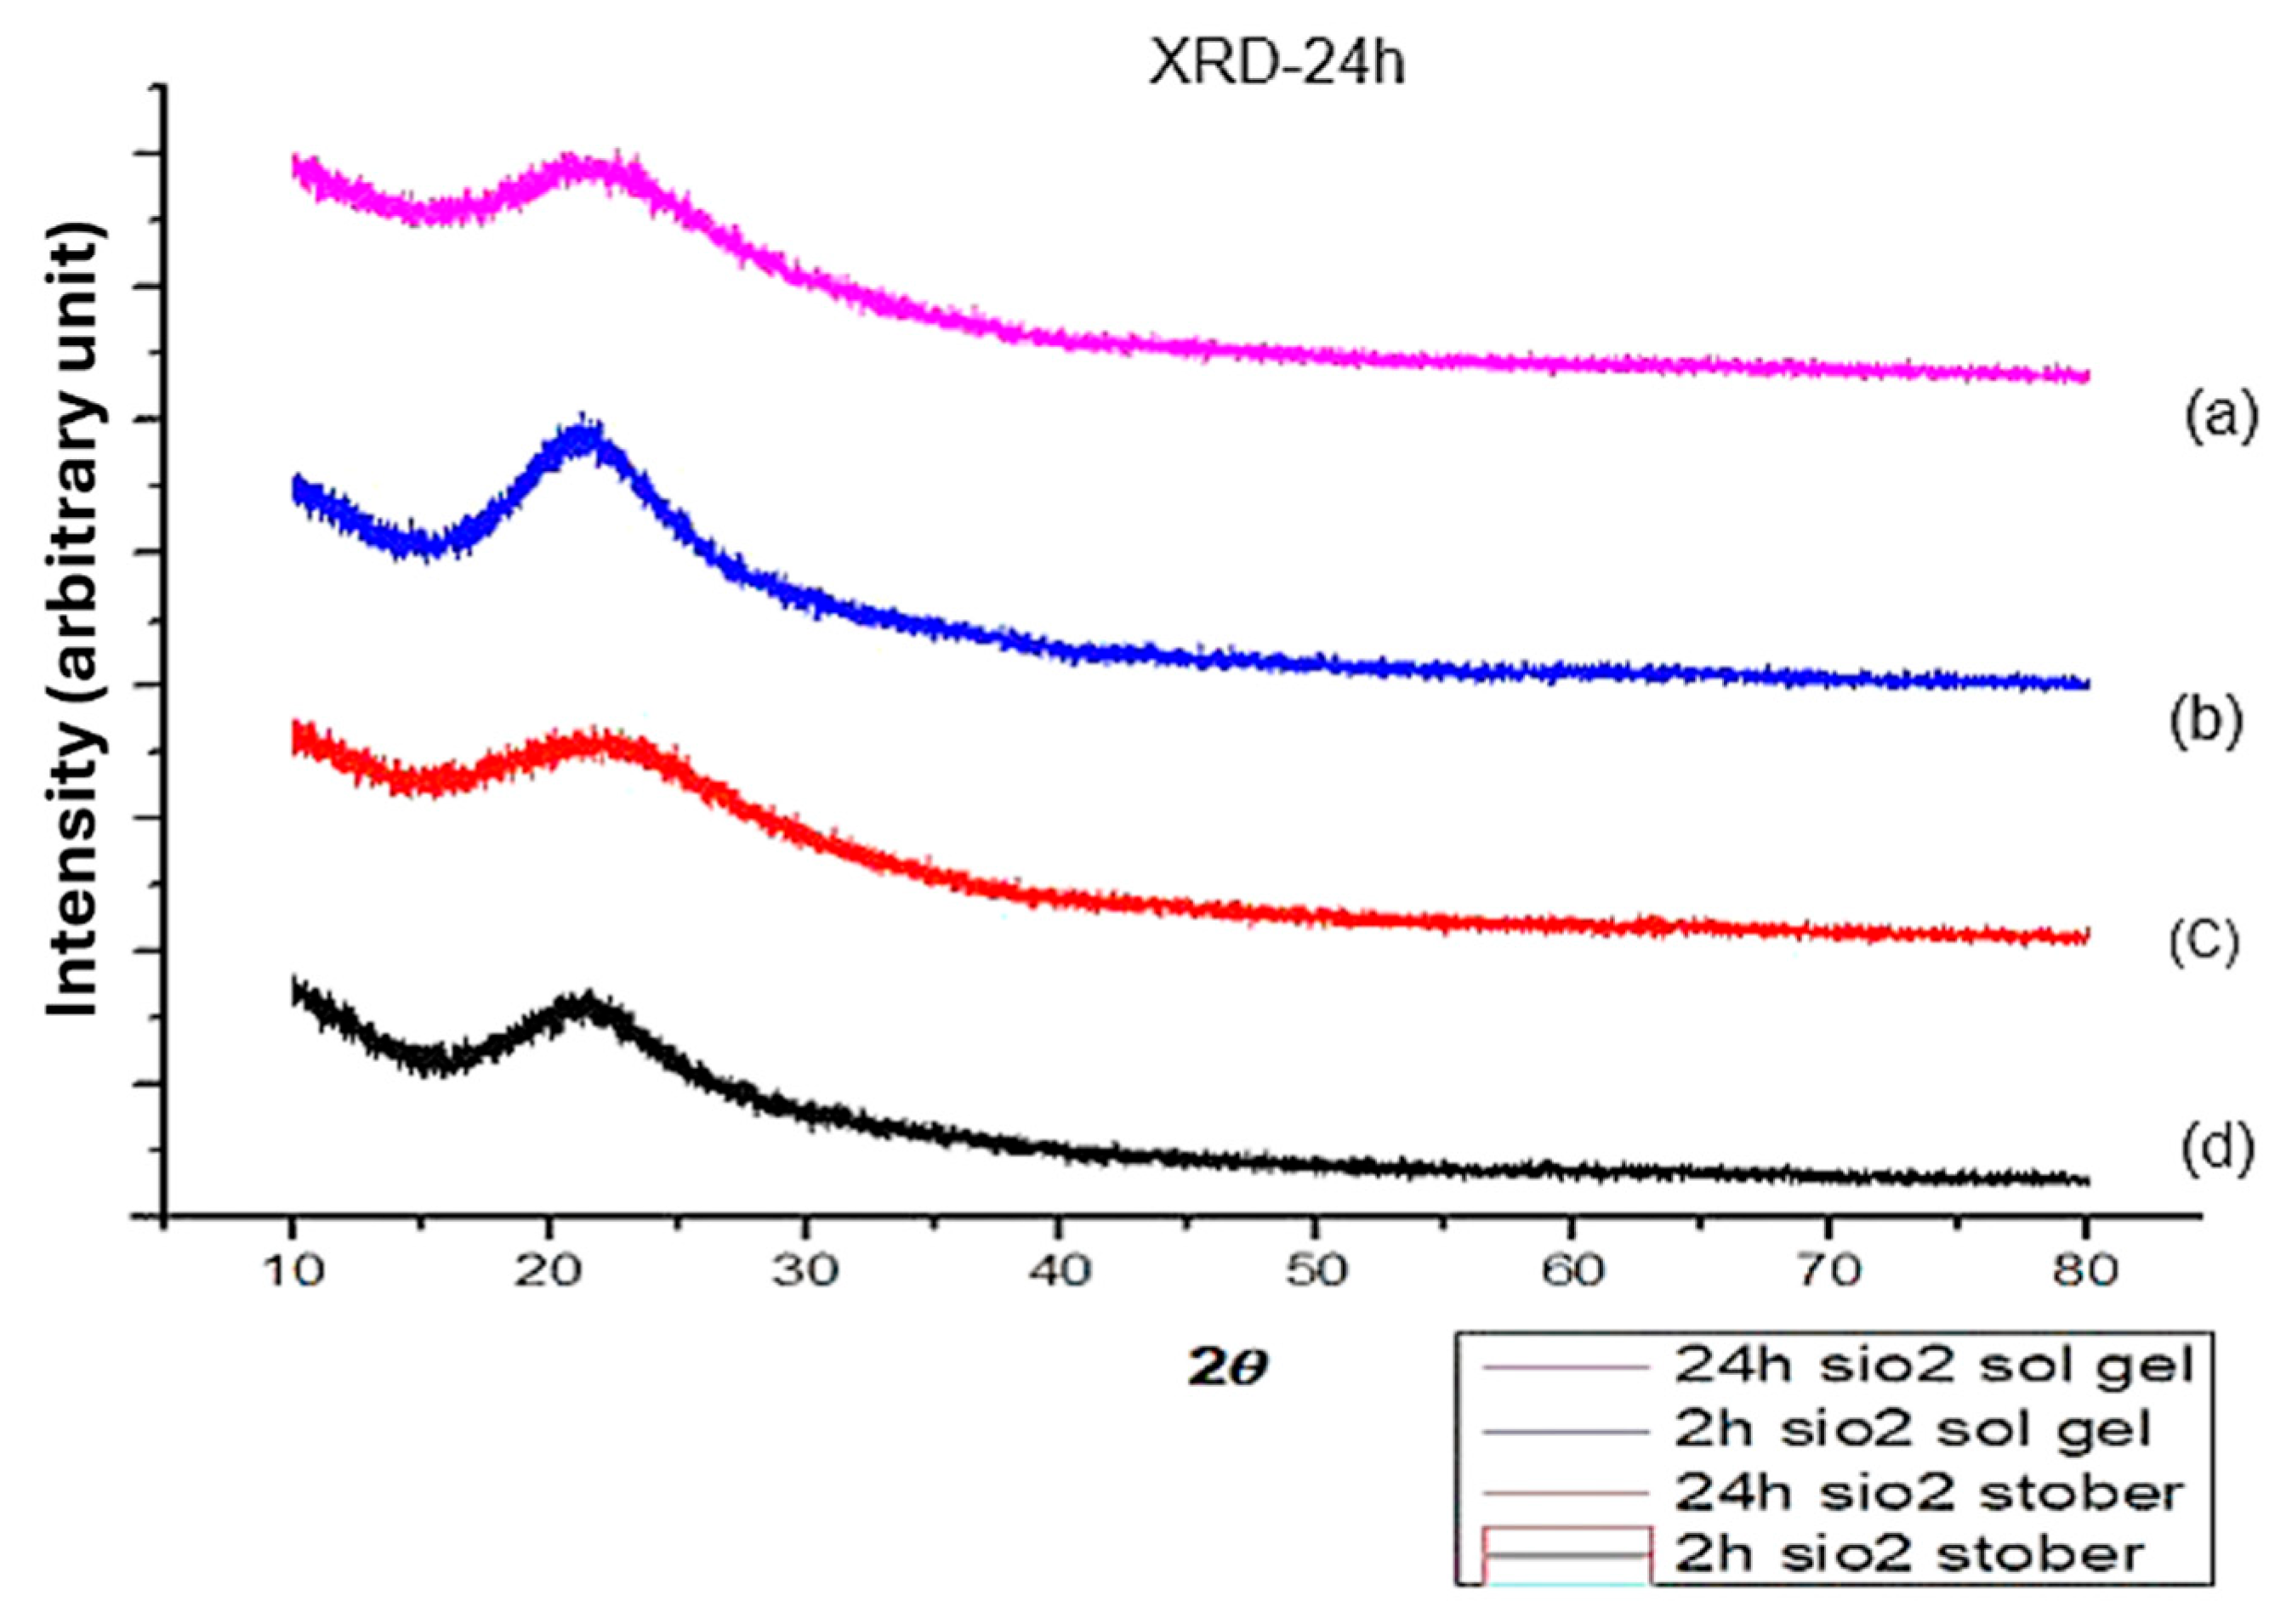
Figure 6.
SEM images for different forms of silica synthesised from different methods. (a) s-SiO2 Sol gel (b) SiO2 Sol gel (c) SiO2 Stober (d) s-SiO2 Stober silica particles calcinated for 24 h.
Figure 6.
SEM images for different forms of silica synthesised from different methods. (a) s-SiO2 Sol gel (b) SiO2 Sol gel (c) SiO2 Stober (d) s-SiO2 Stober silica particles calcinated for 24 h.
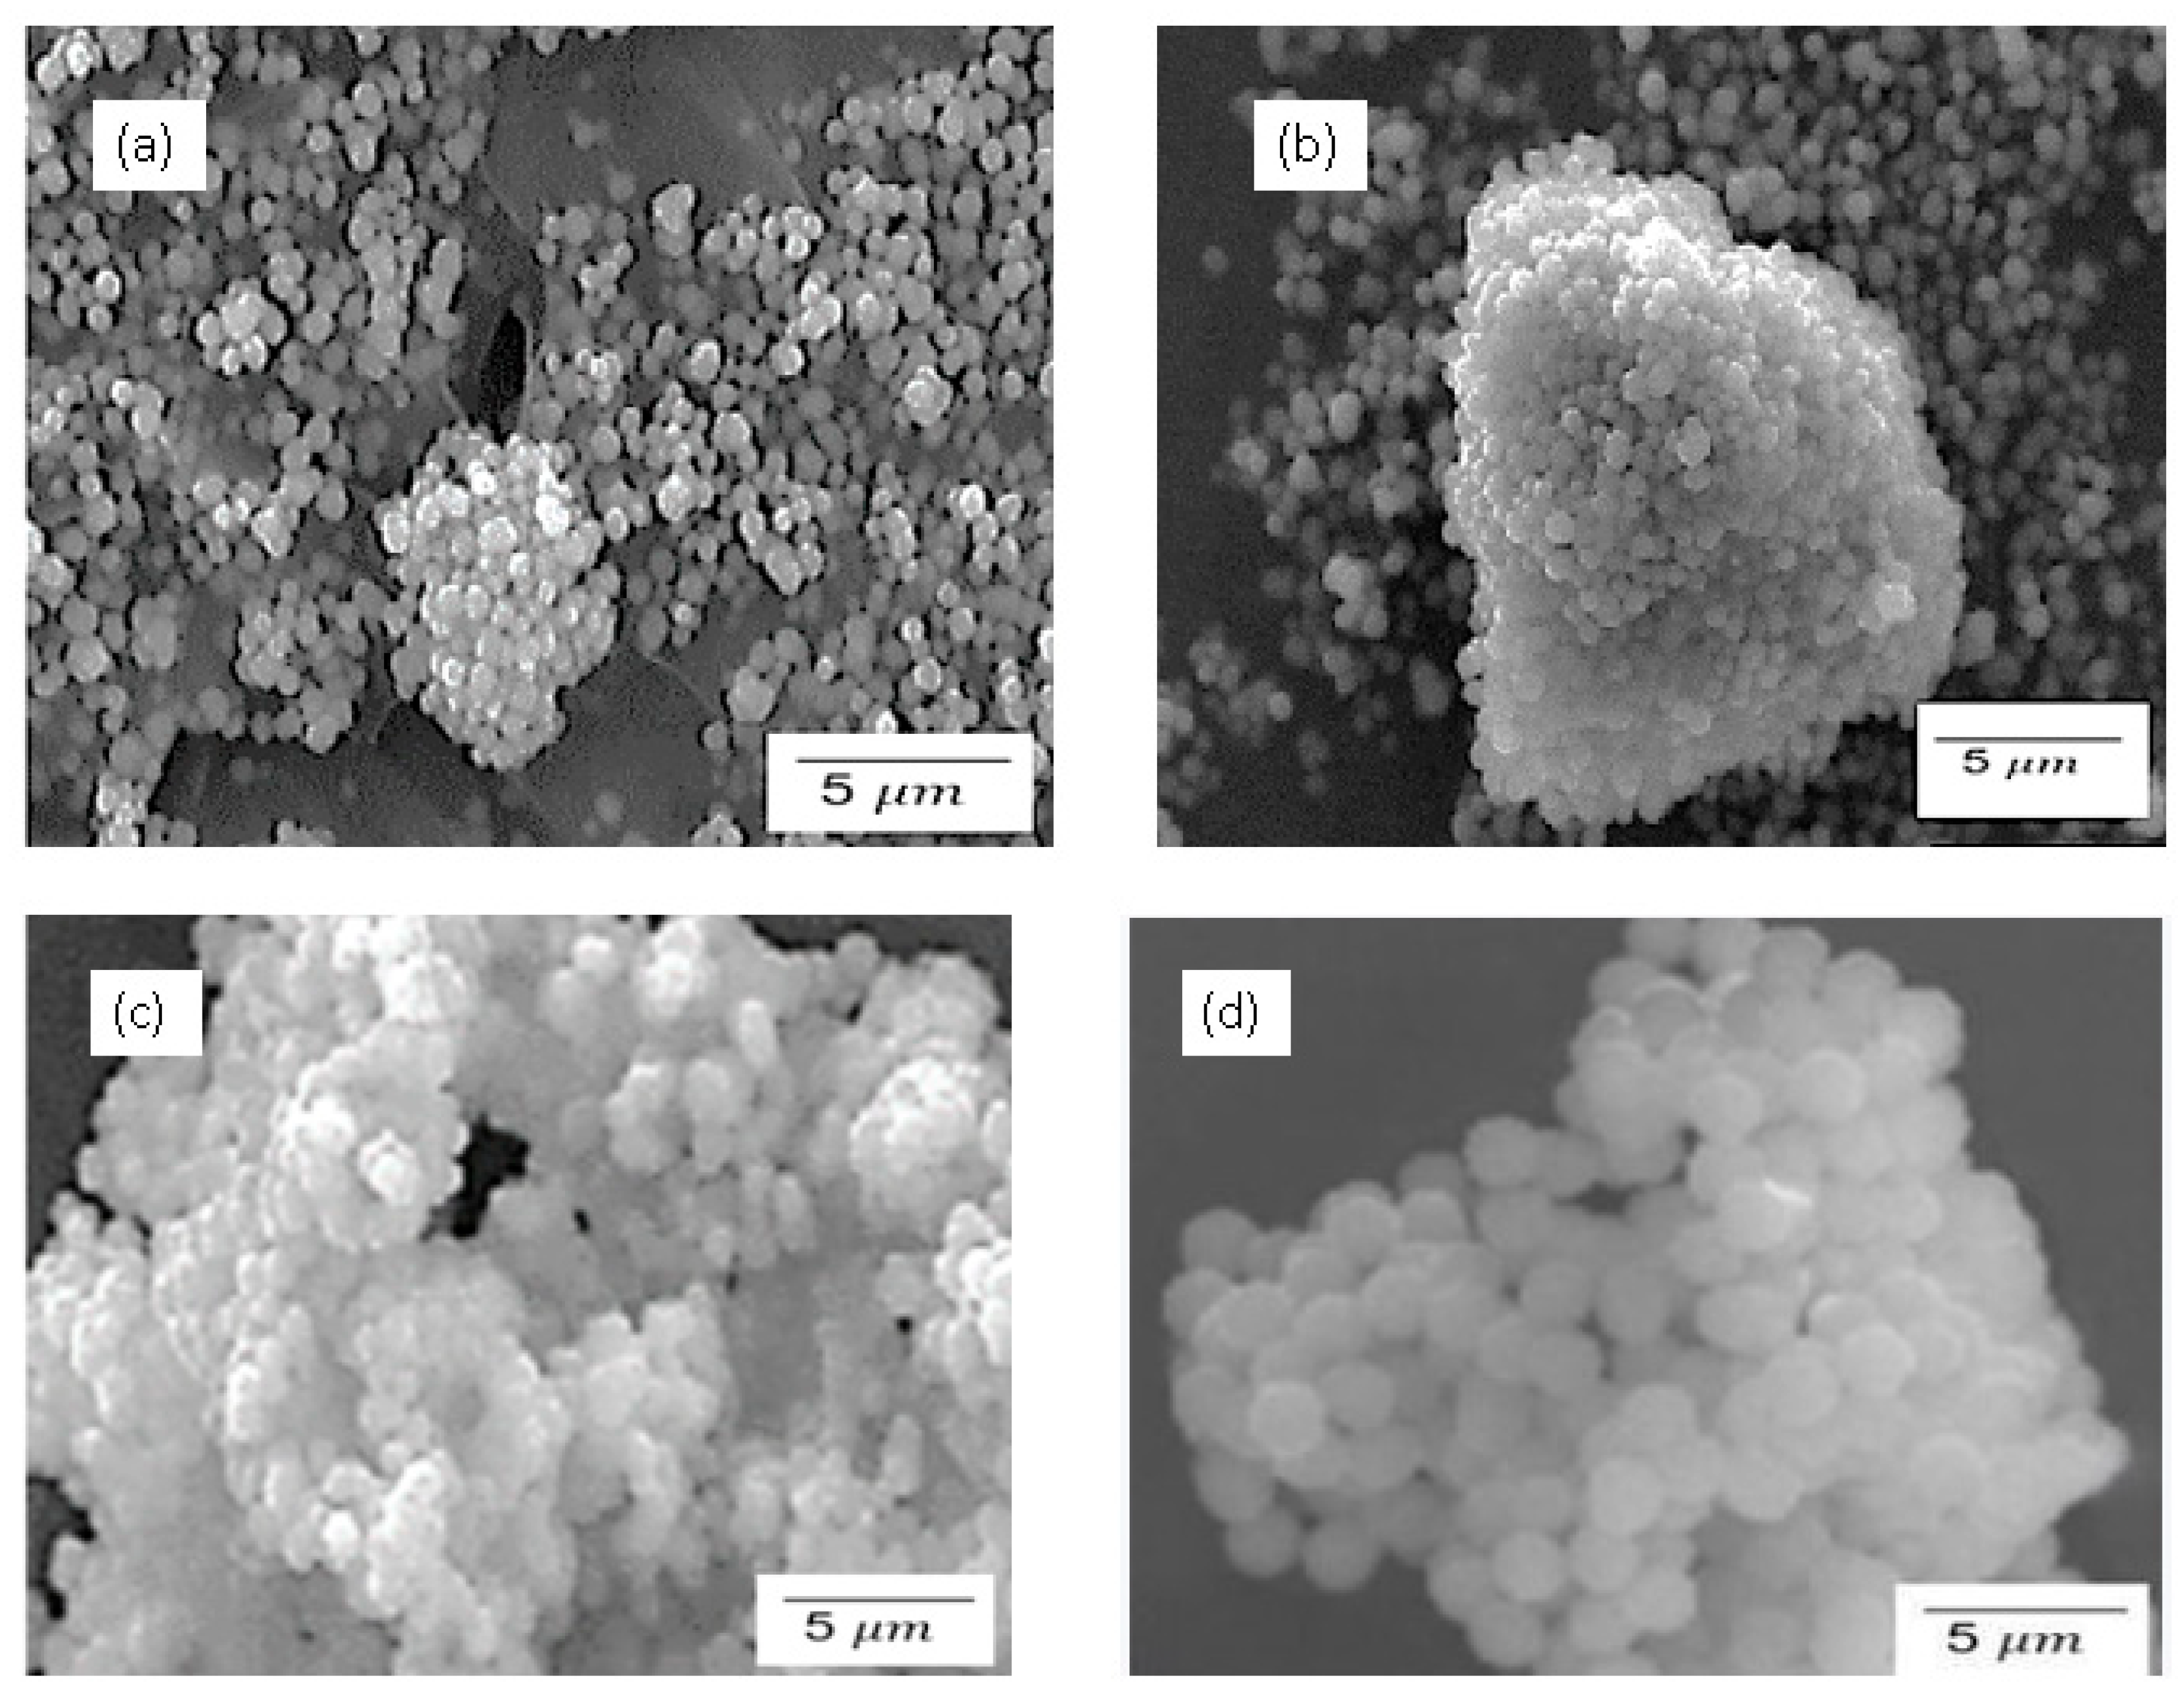
Figure 7.
Effects of calcination time on the surface area of silica nanoparticles in pristine and sulfonated silica nanoparticles synthesised using the sol gel and the Stober methods. The calcination times at 600 oC were for (a) 2 h and (b) 24 h.
Figure 7.
Effects of calcination time on the surface area of silica nanoparticles in pristine and sulfonated silica nanoparticles synthesised using the sol gel and the Stober methods. The calcination times at 600 oC were for (a) 2 h and (b) 24 h.
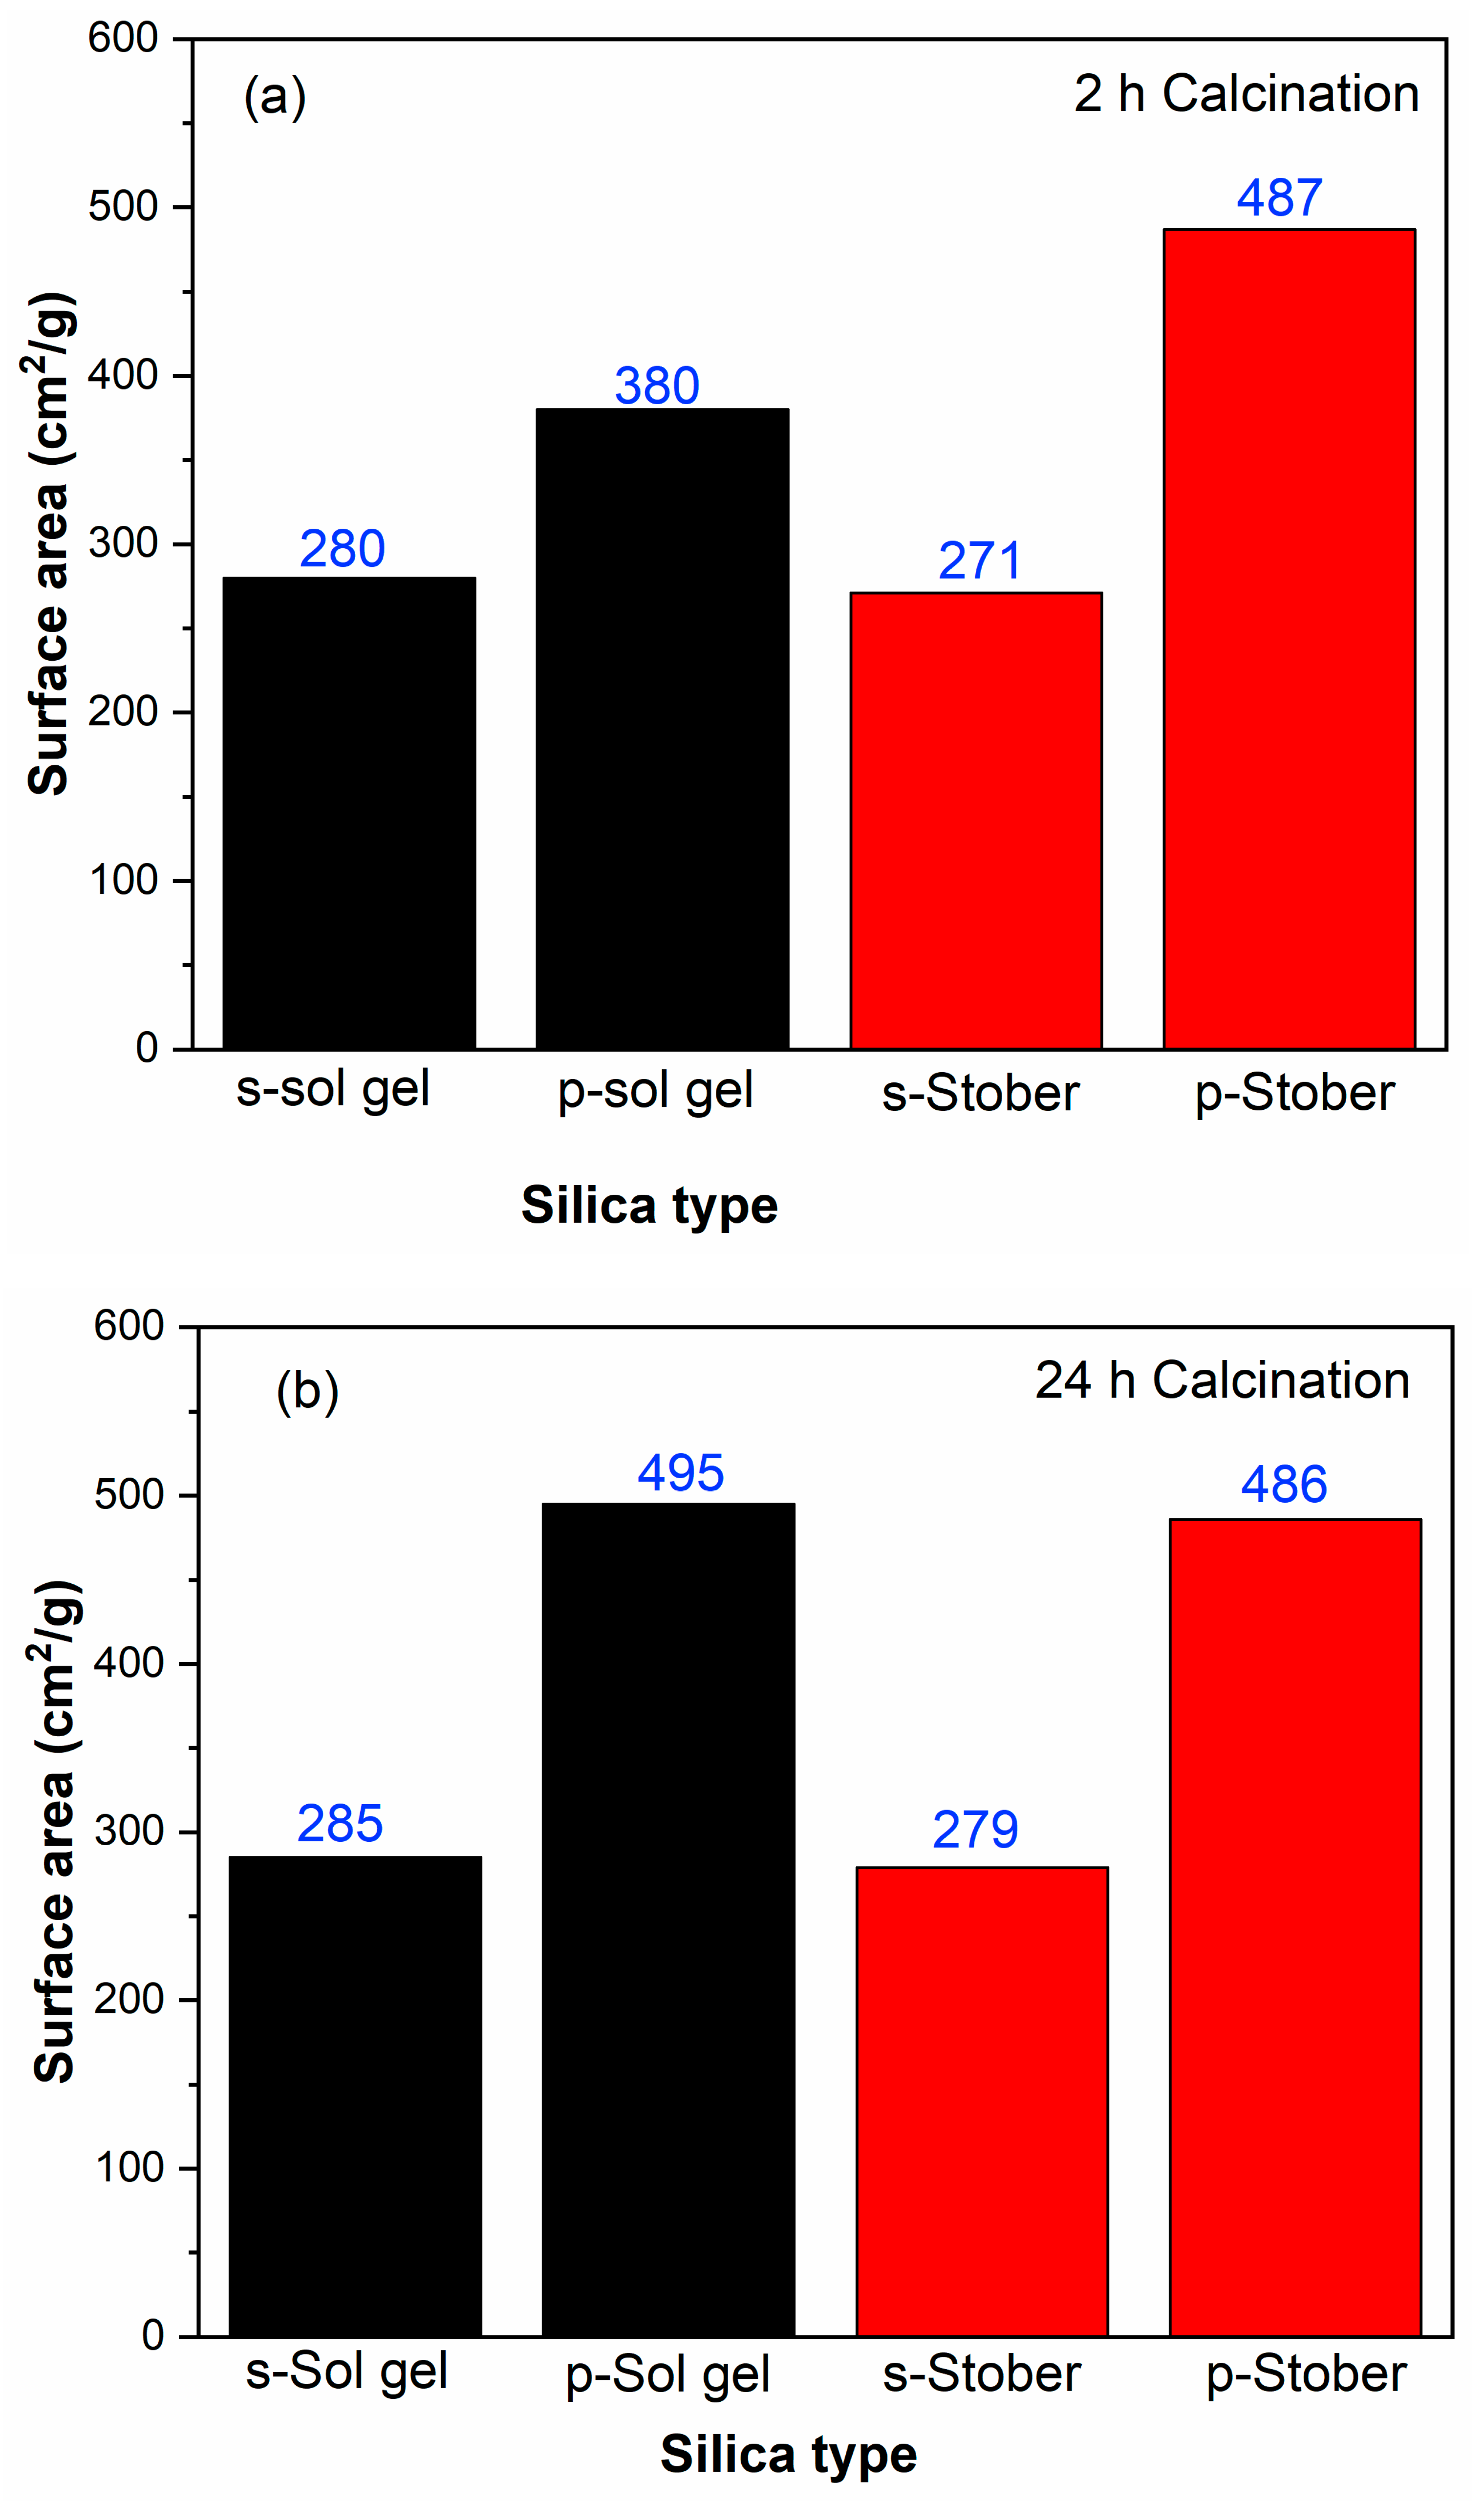
Figure 8.
Effects of silica synthesis method and the sulfonation thereof on the total pore volumes at different calcination times (a) 2 h and (b) 24 h.
Figure 8.
Effects of silica synthesis method and the sulfonation thereof on the total pore volumes at different calcination times (a) 2 h and (b) 24 h.
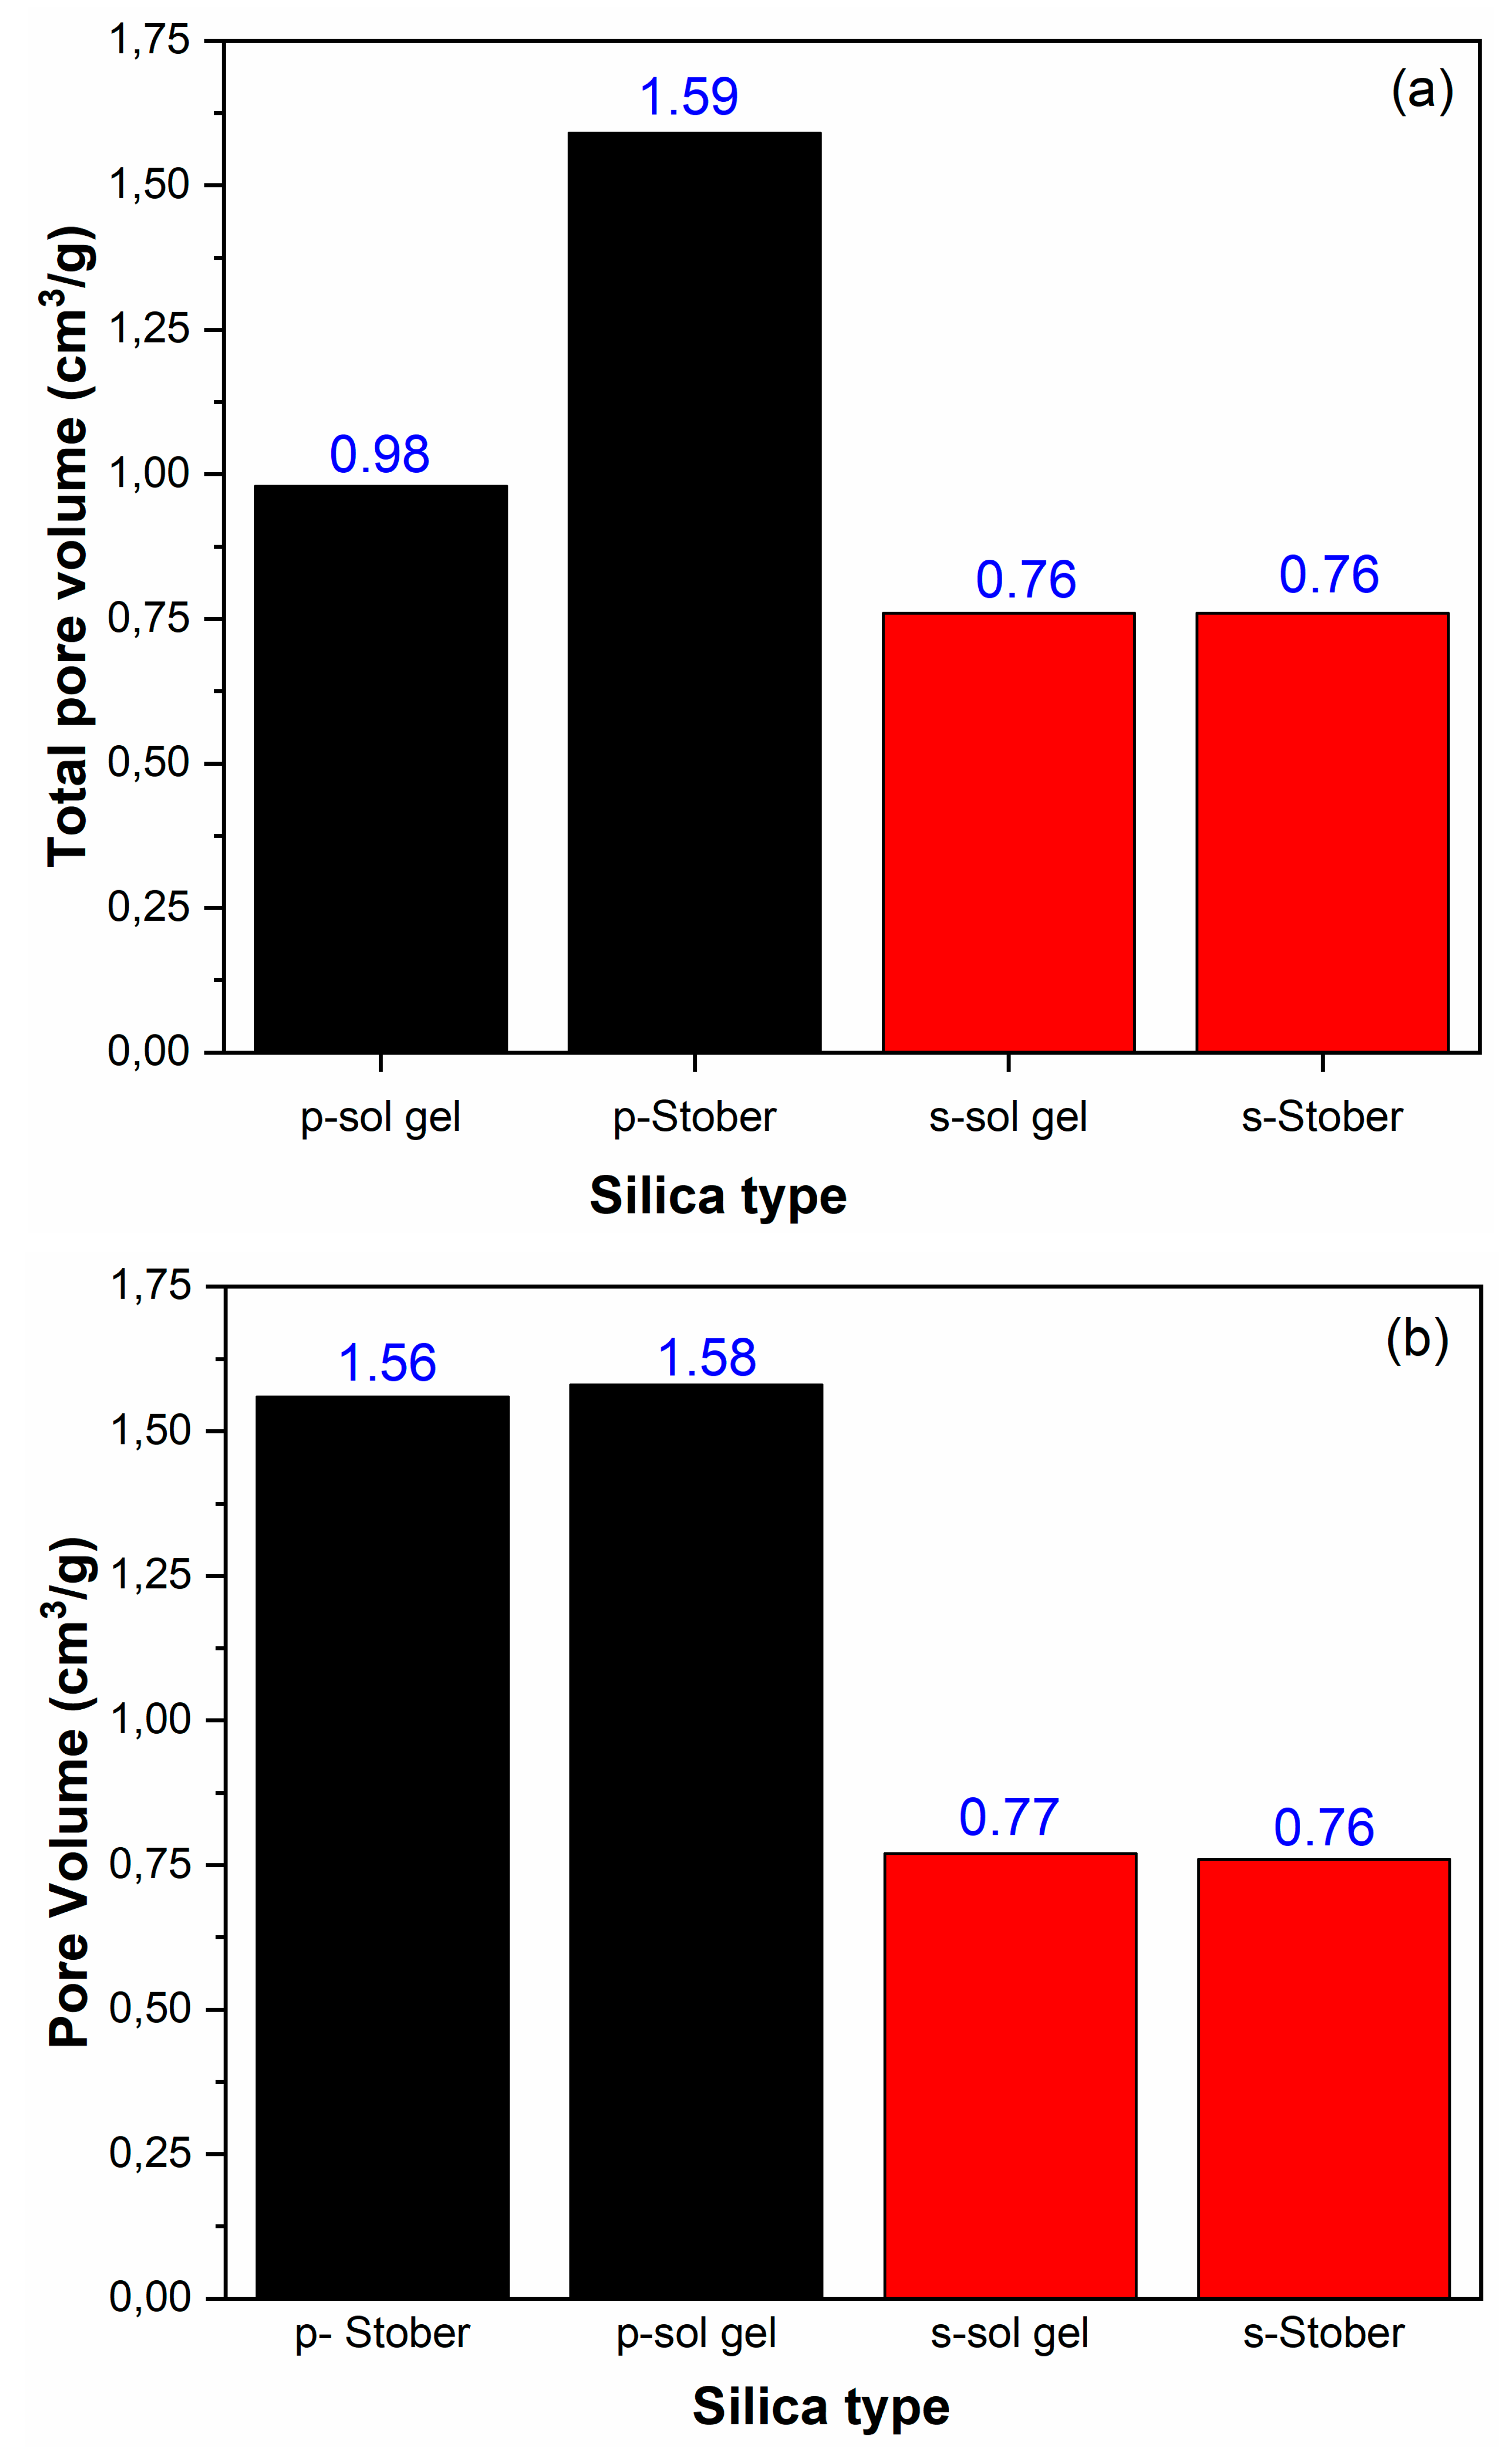
Figure 9.
Cyclic voltammogrammes of (a). Bare FTO and SiO2 nanoparticles prepared by Stober and Sol-gel methods, (b,c). SiO2 and s-SiO2 nanoparticles prepared by Stober method for 2 and 24h, (d). Nyquist plot of SiO2 and s-SiO2 nanoparticles prepared by the Stober method.
Figure 9.
Cyclic voltammogrammes of (a). Bare FTO and SiO2 nanoparticles prepared by Stober and Sol-gel methods, (b,c). SiO2 and s-SiO2 nanoparticles prepared by Stober method for 2 and 24h, (d). Nyquist plot of SiO2 and s-SiO2 nanoparticles prepared by the Stober method.
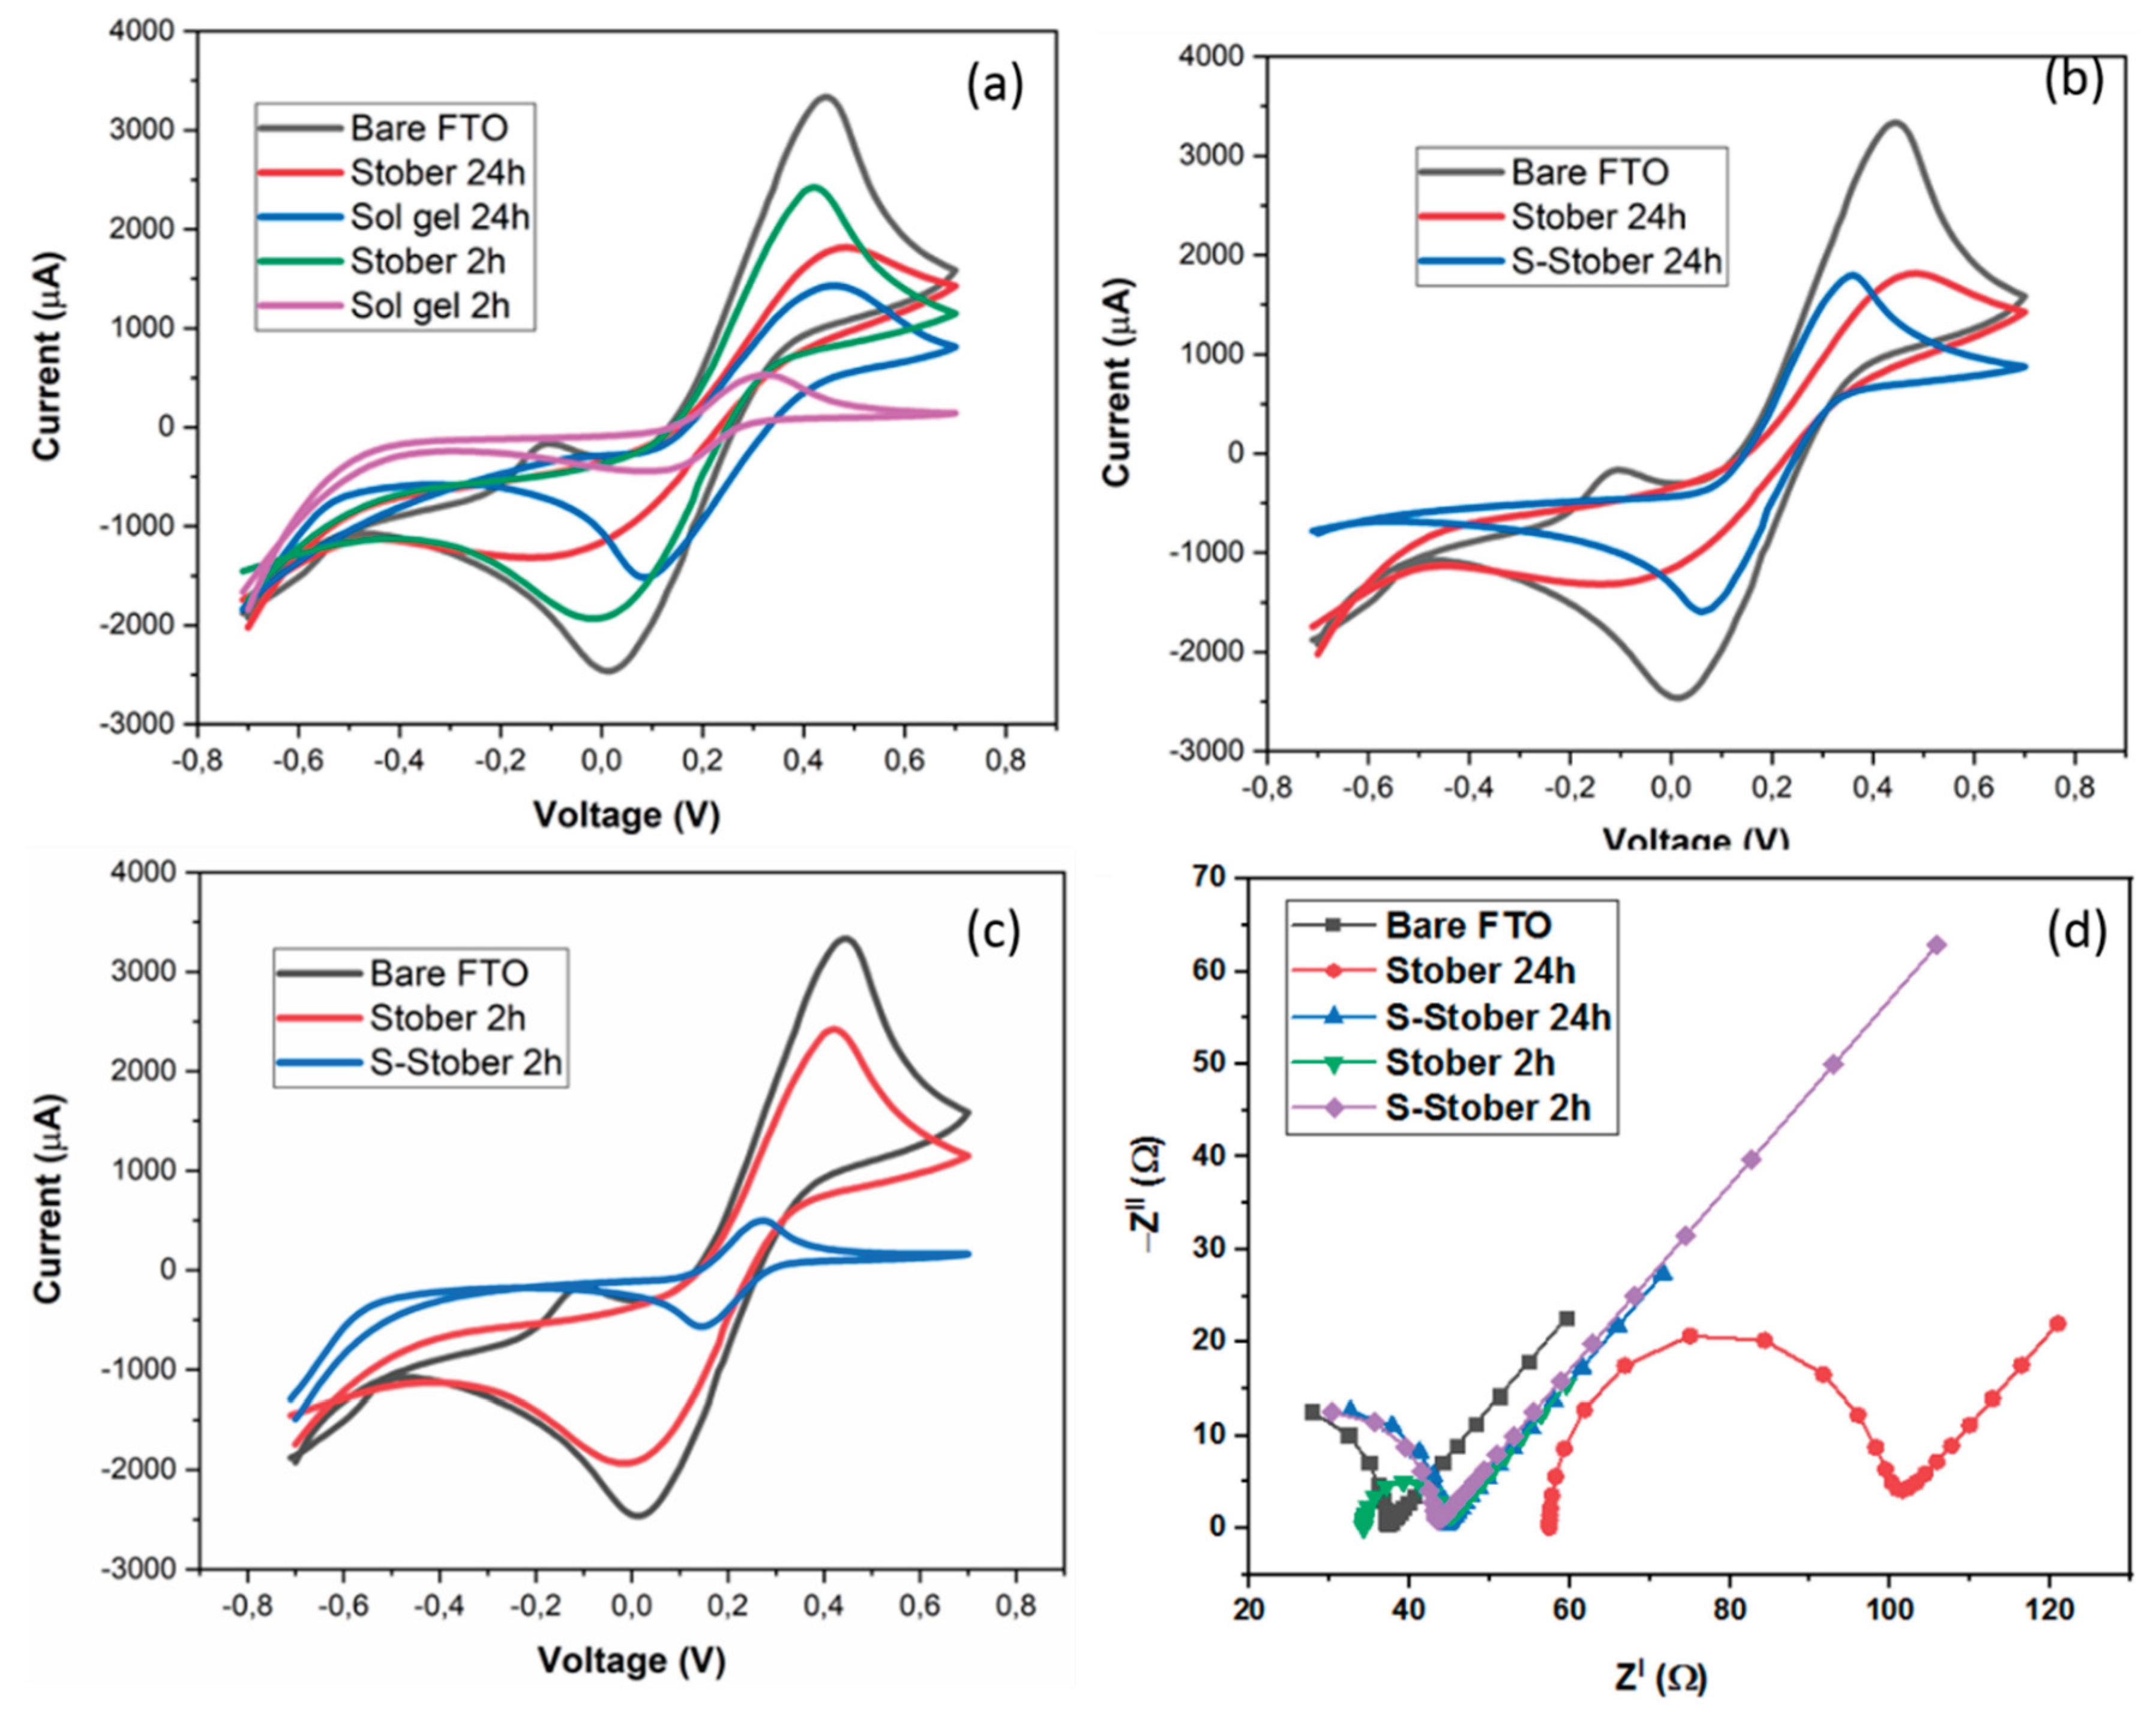

Table 1.
BET results for the comparison of physical parameters of the synthesised silica particles through the two different methods after 2 h calcination.
Table 1.
BET results for the comparison of physical parameters of the synthesised silica particles through the two different methods after 2 h calcination.
| Bet surface area (m2/g) | Total pore volume (cm3/g) | Average pore diameter (nm) | |
|---|---|---|---|
| s-SiO2(sol gel) | 280 | 0.76 | 21.00 |
| SiO2 (sol gel) | 398 | 0.98 | 10.67 |
| s-SiO2 (Stober) | 271 | 0.76 | 20.89 |
| SiO2 (Stober) | 487 | 1.59 | 12.45 |
Table 2.
BET results to demonstrate the differences in the sulfonated versus pristine silica and silica synthesised from the sol gel versus the Stober method. All the nanoparticles were calcinated for 24 h.
Table 2.
BET results to demonstrate the differences in the sulfonated versus pristine silica and silica synthesised from the sol gel versus the Stober method. All the nanoparticles were calcinated for 24 h.
| Bet surface area (m2/g) | Total pore volume (cm3/g) | Average pore diameter (nm) | |
|---|---|---|---|
| s-SiO2(Sol gel) | 285 | 0.77 | 21.02 |
| SiO2(Sol gel) | 495 | 1.58 | 12.10 |
| s-SiO2 (Stober) | 279 | 0.76 | 21.52 |
| SiO2 (Stober) | 486 | 1.56 | 12.21 |
Disclaimer/Publisher’s Note: The statements, opinions and data contained in all publications are solely those of the individual author(s) and contributor(s) and not of MDPI and/or the editor(s). MDPI and/or the editor(s) disclaim responsibility for any injury to people or property resulting from any ideas, methods, instructions or products referred to in the content. |
© 2025 by the authors. Licensee MDPI, Basel, Switzerland. This article is an open access article distributed under the terms and conditions of the Creative Commons Attribution (CC BY) license (http://creativecommons.org/licenses/by/4.0/).
Copyright: This open access article is published under a Creative Commons CC BY 4.0 license, which permit the free download, distribution, and reuse, provided that the author and preprint are cited in any reuse.


