
Submitted:
26 September 2025
Posted:
29 September 2025
You are already at the latest version
Abstract
The discharge of dye-laden effluents remains an environmental challenge since conventional treatments remove color but not the organic load. This study systematically compared anodic oxidation (AO), electro-Fenton (EF), and photoelectro-Fenton (PEF) processes for three representative industrial dyes, such as Coriasol Red CB, Brown RBH, and Blue VT, and their ternary mixture, using boron-doped diamond (BDD) and Ti/IrO₂–SnO₂–Sb₂O₅ (MMO) anodes. Experiments were conducted in a batch reactor with 50 mM Na₂SO₄ at pH =3.0 and current densities of 20–60 mA cm⁻². Kinetic analysis showed that AO-BDD was most effective at low pollutant loads, EF-BDD became superior at medium loads due to efficient H₂O₂ electrogeneration, and PEF-MMO dominated at higher loads by fast UVA photolysis of surface Fe(OH)²⁺ complexes. In a ternary mixture of 120 mg L⁻¹ of dyes, EF-BDD and PEF-MMO achieved >98 % decolorization in 22–23 min with pseudo-first order rate constants of 0.111–0.136 min⁻¹, whereas AO processes remained slower. COD assays revealed partial mineralization of 60–80 %, with EF-BDD providing the most consistent reduction and PEF-MMO minimizing treatment time. These findings confirm that decolorization overestimates efficiency, and electrode selection must be tailored to dye structure and effluent composition. Process-selection rules allow concluding that EF-BDD is the best robust dark option, and PEF-MMO, when UVA is available, offers practical guidelines for cost-effective electrochemical treatment of textile wastewater.
Keywords:
Anodic oxidation
; Boron-doped diamond electrode
; COD removal
; Electro-Fenton
; Industrial dye wastewater treatment
; Photoelectro-Fenton
1. Introduction
The fast and sustained growth of the textile and dyeing industry has led to the discharge of substantial volumes of wastewater containing synthetic dyes. These effluents are typically characterized by intense coloration, chemical recalcitrance, and a complex matrix of auxiliary chemicals, including salts, surfactants, and organic additives [1,2]. The most commonly used dyes, like azo, anthraquinone, and phthalocyanine derivatives, are designed to be highly stable, a property that, while desirable in their application, makes them notoriously resistant to conventional biodegradation pathways [3,4,5]. As a result, the discharge of untreated or partially treated dye-laden wastewater into aquatic environments causes severe ecological disturbances, including inhibition of photosynthesis due to light attenuation, disruption of aquatic food chains, and bioaccumulation of mutagenic or carcinogenic compounds [2].
Traditional treatment strategies such as coagulation–flocculation, activated sludge systems, adsorption on activated carbon, and membrane-based separation processes have demonstrated varying degrees of success but share common limitations [6,7,8]. These methods often focus on phase transfer rather than degradation, producing concentrated sludge or secondary waste streams that require further handling. Moreover, membrane fouling, high operational costs, and limited capacity to treat recalcitrant dyes under extreme conditions (e.g., high salinity or low biodegradability) compromise their long-term sustainability [9]. These limitations have intensified the search for advanced oxidation processes (AOPs), which are capable of achieving mineralization of a wide range of organic pollutants through the in situ generation of highly reactive species, primarily hydroxyl radicals (•OH) that can non-selectively attack complex molecular structures [10,11]. Hybrid electrochemical trains (e.g., sulfate-radical EAOPs coupled to electrocoagulation) are also being explored for dyeing wastewater [12].
In this context, electrochemical advanced oxidation processes (EAOPs) have emerged as particularly attractive technologies due to their environmental compatibility, operational simplicity, and compatibility with renewable energy sources [12,13]. These processes operate under ambient temperature and pressure without the need for external chemical dosing, making them suitable for decentralized applications. Among them, anodic oxidation (AO) and electro-Fenton (EF) are the most extensively studied. AO generates hydroxyl radicals at the anode surface, providing boron-doped diamond (BDD) with the highest flux of physisorbed BDD(•OH) due to its wide potential window for O2 discharge. In contrast, mixed metal oxides (MMO) anodes such as Ti/IrO2–SnO2–Sb2O5 produce much smaller amounts of reactive physisored M(OH) but favor the indirect oxidation via active chlorine species [14,15]. In EF, hydrogen peroxide (H2O2) is electrochemically produced at the cathode and reacts with added Fe2+ in the bulk solution to generate •OH via the classical Fenton reaction, offering homogeneous oxidation in the solution bulk [12,16,17,18].
A further development is the photoelectro-Fenton (PEF) process, in which UVA irradiation enhances the regeneration of Fe2+ from Fe3+, accelerates the breakdown of intermediates, and promotes additional •OH generation through the photolysis of H2O2 and iron complexes [17,19]. This synergy typically improves the degradation capacity and mineralization rate, particularly for substrates with lower reactivity toward •OH. Importantly, hydrated DSA films strongly adsorb Fe(III)–hydroxy and –OOH complexes, whose UVA photolysis regenerates Fe2+ and sustains a local catalytic cycle. However, on BDD, where adsorption is weaker, the kinetics gain from irradiation is comparatively modest [20].
Despite the increasing number of studies on AO, EF, and PEF, controversies remain regarding their relative performance. Some reports highlight the superior mineralization capacity of AO-BDD due to its strong oxidizing surface [21], whereas others emphasize the homogeneous advantages of EF or the photo-enhancement of PEF in complex matrices [22]. A further source of divergence is the dye structure since azo dyes tend to form Fe(III) complexes that enhance photo-Fenton efficiency, whereas anthraquinones, due to their extended π-systems, are often more rapidly degraded at BDD surfaces, limiting the relative advantage of PEF [14,15]. Note that most previous works have evaluated single dyes in simplified matrices as a first approach to assess the behavior of industrial effluents that contain mixtures where dyes compete simultaneously for reactive species and photons [16].
The present study aims to perform a systematic comparison of AO, EF, and PEF processes under strictly controlled and equal electrochemical conditions. Three representative commercial dyes, such as Coriasol Red CB (azo), Brown RBH (azo), and Blue VT (anthraquinone), as well as their ternary mixture, were selected as models. The guiding hypothesis is that dye structure, electrode composition, and photon input jointly determine the kinetic performance and mineralization efficiency. By combining color removal, COD reduction, and energy-efficiency analysis, the study provides mechanistic insights and practical process-selection rules. The main findings show that EF-BDD is the most robust dark option, and PEF-MMO provides the fastest treatment under UVA irradiation with azo-rich effluents. This underscores the importance of tailoring EAOPs to both molecular structure and effluent complexity.
2. Materials and Methods
2.1. Chemicals and Reagents
The colorants used in this study were commercial industrial dyes provided without specific chemical identification, here referred to as Coriasol Red CB, Brown RBH, and Blue VT. Stock solutions of each dye were prepared at 1000 mg L−1 in deionized water, and experimental solutions were diluted to 40, 80, and 120 mg L−1. A ternary mixture (1:1:1) of a total of 120 mg L−1 was also tested. Sodium sulfate (Na2SO4, analytical grade, Karal) was used as the supporting electrolyte at 50 mM. For the EF and PEF assays, ferrous sulfate heptahydrate (FeSO4·7H2O, analytical grade, J.T. Baker) was added at 0.5 mM. All solutions were adjusted to pH 3.0 with sulfuric acid (H2SO4, 1.0 M) and prepared in raw water.
2.2. Electrochemical System and Experimental Setup
All experiments were carried out in a thermostated batch reactor of 250 mL at 25 ± 1 °C under continuous magnetic stirring (500 rpm). Six electrode configurations were evaluated: (i) AO: BDD anode/graphite cathode (BDD–G) and Ti/IrO2–SnO2–Sb2O5 anode/graphite cathode (MMO–G); (ii) EF: BDD anode/BDD cathode (BDD–BDD) and MMO anode /MMO cathode (MMO–MMO); and (iii) PEF: the same electrode pairs under UVA irradiation.
All electrodes had a geometric surface area of 4 cm2 and were placed vertically at a 1.0 cm interelectrode distance. A constant current density (j) of 20, 40, or 60 mA cm−2 was applied using a BK Precision 1688B power source. Air was bubbled through the solution at 1.5 L min−1 to ensure oxygen availability for in situ H2O2 generation at the cathode.
For PEF, the reactor was irradiated with a 6 W black-light UVA lamp (λmax ≈ 360 nm, emission band 355–370 nm) positioned 2.5 cm above the liquid surface, delivering an irradiance of 7.5 W m−2 (±5%), as measured with a calibrated radiometer. Continuous air bubbling and the low lamp power limited any temperature rise to <1.0 °C during 60-minute runs.
The overall configuration of the system is illustrated in Figure 1.
2.3. Analytical Methods
Color removal was monitored by UV–Vis spectrophotometry (Cintra 1010, GBC Scientific) at the maximum absorption wavelength of each dye: 496 nm for Coriasol CB Red, 508 nm for Brown RBH, and 602 nm for Blue VT. For the ternary mixture, overall decolorization was determined from the integrated absorbance between 400–700 nm.
The apparent decolorization rate constant (kd, min−1) was calculated by assuming pseudo-first-order kinetics of absorbance decay [23] as follows
where A0 and A are the initial absorbance and that of a time t. A linear regression with the square regression coefficient (R2) > 0.95 was required to validate the kinetic fit.
Mineralization was assessed from the decay of chemical oxygen demand (COD) using the closed reflux colorimetric method (Standard Methods 5220D, APHA 1999). The percent of COD removal was then found from the COD vs. time profiles. This parameter was obtained only for representative conditions (one or two configurations per dye or mixture) to minimize the generation of hazardous dichromate waste and analytical burden; and so, selected cases capture the mechanistically informative extremes of surface- vs bulk-radical pathways.
2.4. Experimental Design and Comparison Strategy
AO, EF, and PEF processes were compared under analogous conditions. For each dye and the ternary mixture, experiments were conducted at three current densities and two electrode configurations per process. Evaluated metrics included decolorization efficiency (% R), pseudo-first-order constant (kd), time to 90% removal, COD reduction, and energy efficiency. Comparisons were made for each process (electrode-dependent) and between processes.
3. Results and Discussion
3.1. Decolorization Performance of Single Dyes
3.1.1. Coriasol CB Red
The decolorization of Coriasol CB Red was systematically investigated under six electrode configurations, encompassing AO, EF, and PEF combined with two electrode pairs for each process. The complete kinetics dataset, including apparent rate constants, percentage removals, and treatment times, is presented in Table S1H here; only the most representative trends are discussed.
At a low pollutant load of 40 mg L−1, the BDD/graphite configuration (AO–BDD) achieved quick decolorization, reaching 83.5% removal in 10 min with kd = 0.1708 min−1 at j = 60 mA cm−2. This good efficiency is attributed to the high surface flux of physisorbed BDD(OH) from Eq. 2, which is favored on the BDD due to its large oxygen evolution overpotential [14].
At higher pollutant loads of 80–120 mg L−1, mass-transfer limitations diminished the relative advantage of diamond anodes, whereas mixed-metal oxide electrodes (AO–MMO) exhibited comparable performance. The hydrated surface of AO–MMO facilitated the adsorption of azo chromophores from the bulk and promoted their oxidation with M(●OH).
In EF assays, replacing graphite with a diamond cathode enhanced H2O2 electrogeneration via oxygen reduction by Eq. 3, enabling homogeneous •OH production in bulk solution through the classical Fenton reaction (Eq. 4). However, radical scavenging by excess of Fe2+ from Eq. 5 partly limited the efficiency at low loads.
When UVA irradiation was introduced in PEF, MMO electrodes exhibited the highest rate constants at all concentrations. This improvement can be attributed not only to the photolysis of Fe(OH)2+ complexes formed in solution but also to their partial adsorption onto the
The hydrated oxide surface of MMO electrodes, where they are also photolyzed, is a phenomenon that did not take place with BDD. So, Fe(OH)2+ absorbs photons and undergoes photoreduction according to Eq. 6, regenerating Fe2+ and yielding more oxidant OH. In parallel, secondary pathways can generate hydroperoxyl (HO2•) and superoxide (O2•−) radicals, further contributing to the oxidative environment. The continuous cycling between Fe3+ and Fe2+ ensures a sustained Fenton reaction with persistent production of highly reactive oxygen species (ROS) that accelerate the degradation of organic pollutants [24].
The comparative kinetics for all EAOPsis are summarized in Figure 2, showing the corresponding pseudo-first-order fits in the inset panel. It confirms the good linearity of the model, supporting the mechanistic interpretation. These results highlight a crossover: AO–BDD is optimal at low load, whereas PEF–MMO dominates at medium to high concentrations, thanks to the synergetic effect of UVA-assisted regeneration of Fe2+ on MMO surfaces.
To complement color removal, COD experiments were selectively performed under two representative conditions: AO–BDD at a low load of 40 mg L−1 and PEF–MMO at a high load of both at 120 mg L−1. These two cases were chosen to capture the extremes of process performance, i.e., rapid decolorization dominated by surface •OH versus extended mineralization via photo-assisted bulk surface radical chemistry. Conducting COD assays for all experiments was avoided because of their higher analytical cost, the generation of secondary chemical waste, and the need to prioritize the most mechanistically informative conditions. The outcomes, shown in Figure 3, confirm that AO–BDD rapidly removed color, but it only achieved partial mineralization. In contrast, PEF–MMO sustained higher COD removal efficiencies, supporting the critical role of photo-assisted Fenton chemistry for achieving deeper oxidation. The mineralization improvement can be associated with the rapid photolysis of the final Fe(III)-carboxylate species (Fe(OOC-R)2+) by Eq. (7), which also occurred at the MMO surface with adsorbed ones.
Overall, these findings confirm that electrode selection and process configuration dictate whether surface-bound or bulk radicals dominate, with direct implications for treatment scalability and sustainability.
3.1.2. Brown RBH
Brown RBH represents an intermediate case between the strongly conjugated azo dye Coriasol CB Red and the anthraquinonic Blue VT, making it a valuable probe to evaluate how electrode composition and photon input shift the balance between surface-driven and homogeneous oxidation. The complete kinetic dataset is provided in Table S2.
At 40 mg L−1, AO–BDD achieved 97.3% color removal in 16 min with kd = 0.2257 min−1 at j = 20 mA cm−2, whereas AO–MMO was nearly five-fold slower with k = 0.0530 min−1. The superior performance of diamond arises from its dense monolayer of physisorbed hydroxyl radicals formed from Eq. 2, exhibiting the hydrated MMO surface, thus a lower radical surface density, limiting its oxidative capacity [14]. This trend persisted at higher pollutant loads: at 80 and 120 mg L−1, AO–BDD sustained lower rate constants of 0.0821 and 0.0457 min−1, two- to four-fold higher than MMO (0.0226 and 0.0118 min−1, respectively). Thus, for Brown RBH, diamond-driven surface •OH clearly dominates even under diffusion-limited conditions.
EF with a diamond cathode roughly doubled the rate constants compared to MMO ones, owing to the higher H2O2 electrogeneration efficiency from Eq. 3. Yet, at 40 mg L−1, neither EF configuration surpassed AO–BDD. The homogeneous radicals generated via the Fenton reaction by Eq. 4 were partially quenched by the excess Fe2+ by Eq. 5, limiting their contribution, giving low radical demand. At higher loads, however, EF–BDD became the kinetically dominant “dark” treatment with kd = 0.0900 min−1 at 120 mg L−1, highlighting the importance of bulk radical generation once surface attack becomes diffusion-limited [12].
UVA irradiation dramatically altered the electrode hierarchy. The PEF–MMO couple delivered the fastest kinetics across concentrations with kd = 0.0697–0.0900 min−1 at 20 mA cm−2, despite its lower H2O2 yield compared to BDD. This can be explained by the strong adsorption of Fe(OH)2+ complexes on the hydrated MMO surface, whose photolysis regenerated Fe2+ and released •OH from Eq. 6. For BDD, this Fe(III) complex adsorption is much weaker, and photon input provided only marginal improvements.
Comparative kinetic behavior is shown in Figure 4, where experimental data align well with pseudo-first-order fits that showed good linearity in the inset panel. These results reveal that for Brown RBH, AO–BDD dominated at low loads, EF–BDD gains prominence under heavier loads, and PEF–MMO clearly outperforms both processes when photon-assisted surface chemistry is enabled.
In terms of mineralization, COD assays were selectively performed under representative conditions, focusing on AO–BDD at 40 mg L−1 and PEF–MMO at 120 mg L−1, both at j = 60 mA cm−2. These conditions were chosen to contrast the surface-dominated pathway of diamond electrodes with the photon-assisted Fenton cycle on mixed oxides. The results, shown in Figure 5, confirm that AO–BDD ensured quick decolorization, but failed short in COD removal. In contrast, PEF–MMO not only sustained high color removal but also achieved significantly higher mineralization, underscoring the key role of UVA-assisted Fe cycling at high pollutant loads [25]. Conducting COD analyses beyond these representative cases was avoided due to the high analytical demand and generation of chemical waste, consistent with the rationale applied to Red CB.
In summary, Brown RBH highlights the structural sensitivity of EAOPs: (i) at low load, direct •OH attack on diamond dominates; (ii) at intermediate and high load, homogeneous radicals gain importance, with EF–BDD leading among dark processes; and (iii) under UVA irradiation, the hydrated MMO surface becomes uniquely efficient due to Fe(III)–complex photolysis via Eq. 6 and 7. The subtle differences in dye molecular structure then dictate whether AO, EF, or PEF should be prioritized for efficient treatment.
3.1.3. Blue VT
Blue VT is an anthraquinone dye of lower molecular weight than Red CB and Brown RBH and exhibits the highest intrinsic reactivity toward surface-generated hydroxyl radicals. This characteristic makes it an ideal probe to evaluate whether the electrode- and photon-dependent effects observed for azo dyes persist under conditions where the chromophore itself reacts very rapidly. The complete kinetic matrix (kd, color removal, and treatment time) is summarized in Table S3. Figure 6 and Figure 7 highlight representative decolorization and COD removal behaviors, respectively.
At medium and high loads of 80 and 120 mg L−1, anodic oxidation on BDD consistently outperformed the MMO anode. For instance, AO–BDD reached kd = 0.1217 min−1 for 80 mg L−1 and kd = 0.1013 min−1 for 120 mg L−1, achieving >95% color removal within 40–60 min. In contrast, AO–MMO remained approximately three- to four-fold slower, primarily constrained by its lower density of physisorbed M(•OH). These results confirm that the diamond surface sustaining a dense monolayer of physisorbed BDD(OH) from Eq. 2 provides greater kinetics under both moderate and high pollutant loads [12].
In the EF process, replacing the MMO cathode with diamond electrodes increased H2O2 production via the two-electron reduction of dissolved O2 from Eq. 3, allowing EF–BDD to achieve kd = 0.0923 min−1 for 120 mg L−1. However, the improvement over AO–BDD was rather modest because the homogeneous Fenton reaction (Eq. 4) competed with scavenging by excess of Fe2+ (Eq. 5), whereas Blue VT was already highly reactive toward surface •OH. Photon assistance in PEF was beneficial only in the MMO configuration. At 80 mg L−1 and 60 mA cm−2, PEF–MMO provided kd = 0.2589 min−1, surpassing EF–MMO and closely approaching AO–BDD. At 120 mg L−1, the effect was even more pronounced and PEF–MMO attained >98% removal with kd = 0.2920 min−1, outperforming both AO and EF pathways. This advantage arises from the strong adsorption of Fe(OOH)2+ complexes onto the hydrated MMO surface, which undergo efficient UVA photolysis to generate more oxidant OH by Eq. 6 that sustains a local photo-Fenton cycle. Using BDD electrodes, the adsorption of such complexes is weak, and photon input conferred no measurable benefit compared to dark EF, in agreement with previous findings.
The COD removal trends shown in Figure 7 confirm the above mechanistic insights. EF–BDD for 40 mg L−1 at 60 mA cm−2 achieved ~56% COD reduction after 60 min, whereas AO–BDD for 80 mg L−1at 60 mA cm−2 removed ~47%. These values are lower than color removal and indicate partial mineralization consistent with the fast but incomplete breakdown of anthraquinonic intermediates. The higher performance of EF compared to AO corroborates the importance of bulk •OH contribution to mineralization, especially when intermediate aromatic fragments are accumulated.
In summary, Blue VT confirms the strong reactivity of anthraquinone dyes toward direct anodic oxidation on BDD at medium load, whereas under high radical demand, photo-Fenton chemistry at MMO electrodes becomes kinetically superior. This structure–process relationship contrasts with the azo dyes studied earlier: Red CB favored PEF–MMO at high loads, Brown RBH balanced between EF–BDD and PEF–MMO, and Blue VT favored AO–BDD except when radical demand was maximal. These results highlight the necessity of tailoring electrode composition and photon input to the electronic structure of the target pollutant, and reinforce the value of integrating COD removal metrics alongside color removal to evaluate true process efficiency.
This mechanistic understanding provides the rationale for advancing from single-dye systems to more complex effluents. Accordingly, the next section explores whether the same trends are preserved in a ternary mixture of industrial dye Coriasol Red CB, Brown RBH, and Blue VT, where competition for reactive species and photon flux may alter degradation kinetics, process hierarchies, and mineralization performance.
3.2. Treatment of the Ternary Mixture
Real textile effluents usually discharge complex mixtures of azo and anthraquinone dyes that compete for reactive species, photons, and electrode surface sites. Single-dye kinetics can misrepresent real-effluent performance due to competitive adsorption and photon sharing. To address this gap, the three colorants individually studied in Section 3.1 [Coriasol Red CB (azo), Brown RBH (azo), and Blue VT (anthraquinone)] were combined in equimolar proportion with a total content of 120 mg L−1 and treated under the same six EAOP configurations at 60 mA cm−2. The corresponding first-order rate constants for decoloration, ultimate color removal efficiencies, and time to 90% decolorization are summarized in Table S4. The full decolorization profiles are depicted in Figure 8. These conditions are aligned with recent pilot-scale evaluations of mixed dye streams [16]. Complementary mineralization was assessed through COD decay at higher loading (200 mg L−1) for the most representative processes (EF-BDD and PEF-MMO), as shown in Figure 9.
Both anodic oxidation routes, i.e., AO–BDD and AO–MMO, attained high ultimate color removal (~96%) but required nearly 60 min to reach completion, confirming that competitive adsorption of three chromophores limits the access of reactive species to the electrode surface. Even though BDD is known for its higher BDD(•OH) density, diffusion constraints dominate under mixture conditions. This behavior highlights an important limitation when treating multicomponent systems, since the coexistence of several dyes or organic molecules intensifies competition for adsorption sites and reactive species, thereby slowing the overall degradation rate. Consequently, their kinetic constants from 0.064 to 0.104 min−1 are almost two-fold lower than those of EF/PEF, which benefit from homogeneous radical generation in the bulk solution. These findings underscore the need to optimize process design when dealing with real wastewater matrices, where complex mixtures of pollutants are the norm rather than the exception
Among the dark processes, EF-BDD exhibited the highest performance (kd = 0.1105 min−1, 23 min for 90% color removal and 99.6% efficiency, outperforming AO-BDD despite similar ultimate removal. This reflects the added contribution of bulk •OH radicals generated.
Via Fenton’s reaction, which becomes increasingly relevant as diffusion to the anode limits surface oxidation. In contrast, EF-MMO with kd = 0.060 min−1 lagged behind AO-BDD, since its lower H2O2 yield and slower surface reactivity could not offset the radical demand imposed by three chromophores. Importantly, COD analysis confirmed this trend: EF-BDD removed ~70% of the initial organic load after 60 min (Figure 9), underscoring its superior mineralization ability compared to MMO-based configurations.
Photo-assisted processes revealed marked differences between electrode materials. PEF-MMO achieved the highest kd = 0.136 min−1 and matched EF-BDD in 22 min of 90% color removal, with ultimate decolorization >98%. This two-fold enhancement over EF-MMO is consistent with efficient photolysis of Fe(OH)2+ complexes adsorbed on the hydrated MMO surface, as stated above. Conversely, PEF-BDD showed only a modest improvement with kd = 0.071 min−1, in line with the weak adsorption of Fe(III) species previously observed for single dyes. COD analysis further corroborated the advantage of PEF-MMO: nearly 90% COD removal was achieved in 60 min (Figure 9), surpassing EF-BDD in mineralization despite similar decolorization kinetics.
It should be emphasized that COD analysis was deliberately restricted to representative conditions, rather than applied to all treatments, to balance mechanistic insight with sustainability concerns. This selectivity highlights that color removal alone cannot be equated with full mineralization. Synergistic and antagonistic effects between chromophores must also be emphasized. The two azo dyes increased the pool of Fe(III)–azo complexes that absorb near-UV light, boosting the radical generation efficiency in PEF-MMO. Conversely, Blue VT and its intermediates partially quenched the UV-driven radical flux on BDD, explaining why PEF-BDD remained a slower pathway. These observations confirm that electrode–dye interactions strongly modulate the apparent benefits of photo-assistance in complex mixtures. This agrees with comparative EAOP studies on multi-dye matrices [26].
Overall, EF-BDD provided the most robust performance in the absence of light, delivering rapid decolorization and significant COD removal. When UV is available, PEF-MMO equaled or surpassed EF-BDD in both kinetics and mineralization, demonstrating that mixed-oxide anodes—often considered less efficient than diamond—can outperform BDD in photo-Fenton operation once the effluent contains UVA-absorbing azo species. This evidence highlights that treatment strategies for real effluents should not rely solely on single-dye benchmarks: a configuration that dominates under individual conditions (e.g., AO-BDD for Blue VT) may underperform in mixtures where competitive and photonic interactions prevail. Thus, a two-tier strategy can be envisaged for practical applications: (i) EF-BDD as a baseline technology in the absence of UV sources, and ii) PEF-MMO under sunlight or LED irradiation, particularly in effluents enriched with azo dyes from textile and leather industries.
3.3. Energetic Analysis
The energy performance of the evaluated configurations was determined from the energy consumption per unit chemical oxygen demand removed mass (ECCOD, kWh·(g COD)−1). This parameter enables a direct comparison of the efficiency of the processes in terms of the energy invested per unit of contaminant effectively mineralized, avoiding the overestimation of efficiency in systems where decolorization does not necessarily translate into COD removal. ECCOD was calculated according to the following expression [21]:
where the factor 2.7 × 10⁻⁷ corresponds to the factor of conversion of W s to kWh, Ecell is the potential difference between the anode and cathode (V), I is the applied current (A), t is the electrolysis time (s), PUVA is the UVA lamp power (W), Vs is the solution volume (L), and ΔCOD is the experimental COD decay (g L-1). For EF experiments, the lamp contribution was considered zero, while in PEF, its energy input was included.
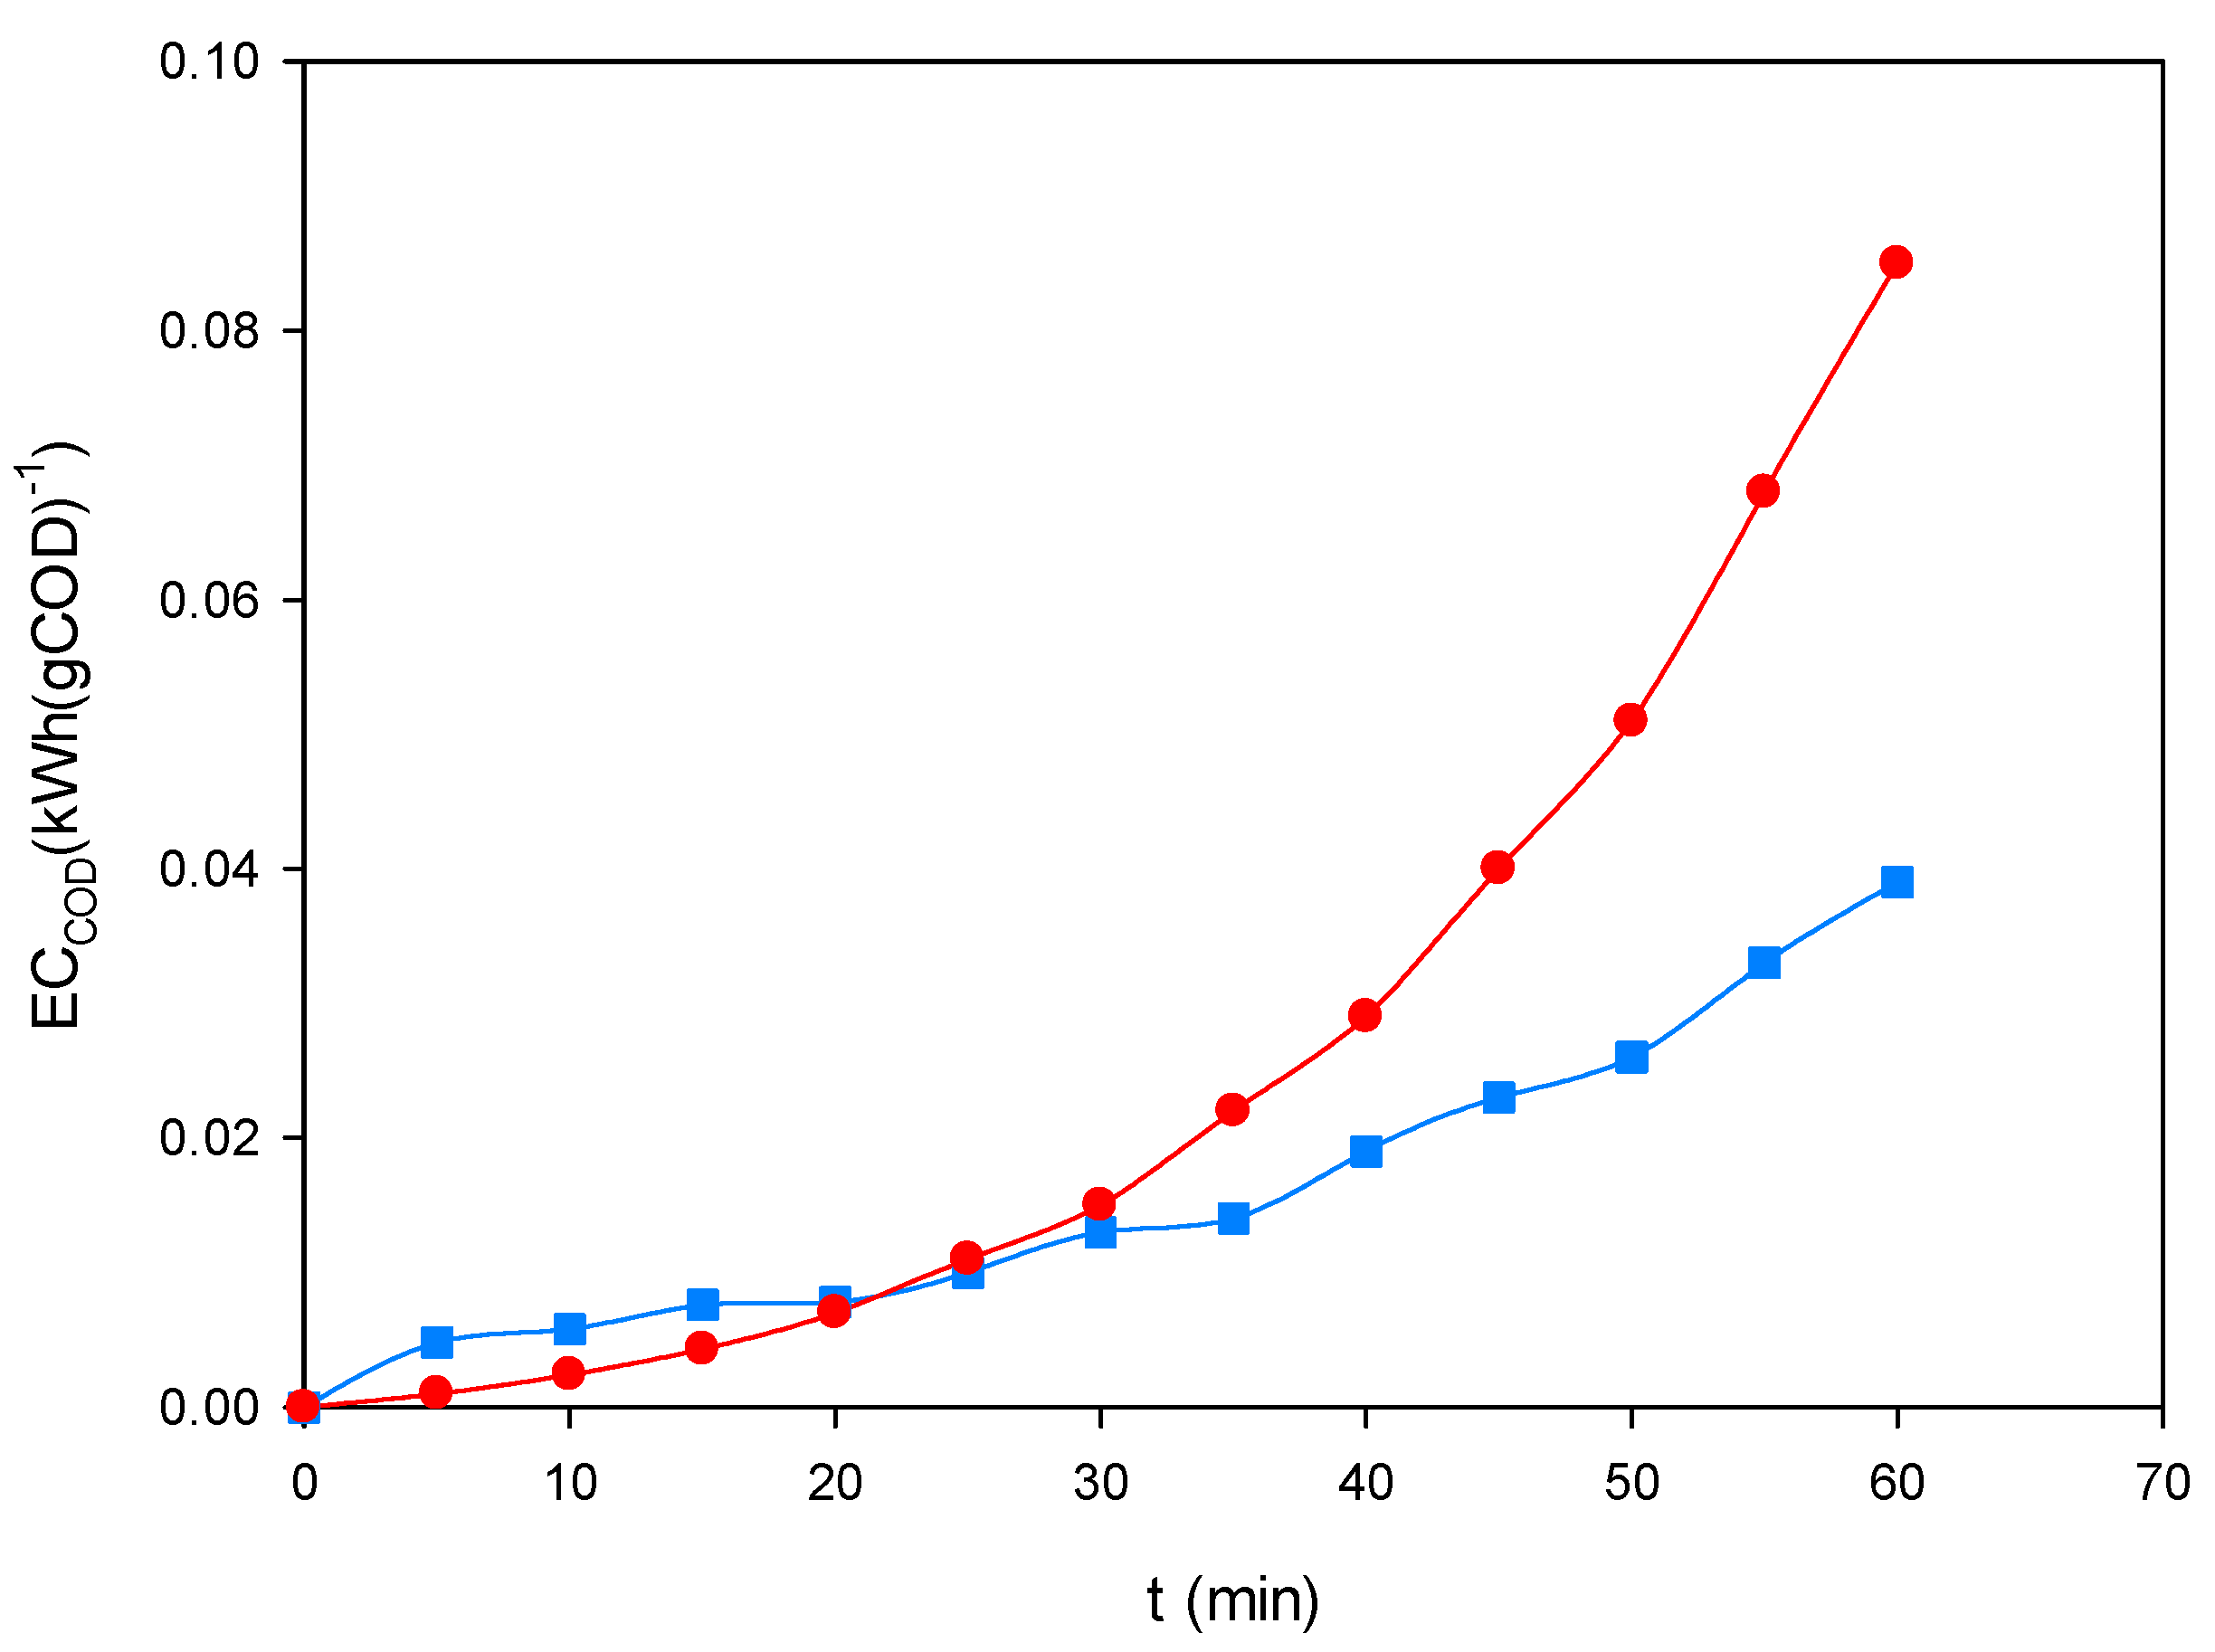
Figure 10 shows the temporal evolution of ECCOD during the treatment of the ternary dye mixture (200 mg L−1, pH 3.0) under EF-BDD and PEF-MMO at 60 mA cm−2. In both cases, the energy consumption per unit of COD removed progressively increased with time, as expected from the dominance of degradation of more recalcitrant intermediates in the later stages of electrolysis. EF-BDD (■) displayed a more stable and moderate rise, reflecting consistent and predictable energy demand. In contrast, PEF-MMO (●) exhibited a sharper increase at longer treatment times, associated with the sustained photolysis of ferric complexes adsorbed on the hydrated MMO surface.
Despite this acceleration in ECCOD, PEF-MMO achieved shorter treatment times for high levels of mineralization, which explains its overall advantage when UVA irradiation is available. In the absence of light, EF-BDD was confirmed as the most robust process, whereas under irradiation, PEF-MMO emerged as the most cost-efficient alternative by achieving higher COD removal in shorter times, even when accounting for the additional energy input of the UVA lamp.
The comparison between COD removal profiles (Figure 9) and ECCOD evolution (Figure 10) demonstrates that decolorization alone is not a sufficient efficiency criterion. Only energy normalization against COD removal allows clear identification of the most sustainable processes. From this perspective, EF-BDD represents the best option under dark conditions, while PEF-MMO is the most energy-efficient choice in scenarios with UVA irradiation using artificial lamps or sunlight.
4. Conclusions and Perspectives
This work comparatively evaluated the performance of six EAOP configurations for the treatment of a ternary mixture of several industrial dyes. The results demonstrated that all tested routes achieved high decolorization efficiencies (>95%), but with marked differences in kinetics and mineralization. AO-BDD and AO-MMO removed color effectively but required nearly one hour to reach completion, confirming their limitation for real effluents where multiple chromophores compete for active sites and oxidants. In contrast, EF-BDD stood out as the most robust dark process, combining fast decolorization with times for 90% removal of 23 min with significant COD removal of about 70% after 60 min. This highlights the key role of homogeneous •OH when its demand exceeds diffusion to the anode surface. It must be stressed that decolorization does not necessarily imply mineralization, and COD assays selectively applied proved essential to uncover this distinction. While EF-BDD represents a robust baseline when UV irradiation is unavailable, PEF-MMO provides a cost-effective and sustainable option whenever sunlight or artificial UVA can be harnessed. Together, these findings reinforce that the selection of EAOP configurations must simultaneously account for technical performance, economic feasibility, and long-term sustainability to enable real-world deployment in industrial dye effluents.
Looking forward, the integration of EAOPs within a circular economy framework offers promising opportunities. Beyond direct treatment costs, the reuse of treated effluents in textile processes can significantly reduce freshwater demand, whereas compliance with stringent discharge regulations avoids economic penalties. Additionally, the valorization of iron-rich sludge as pigments or secondary materials could further improve sustainability. Future work should therefore focus on coupling EAOPs with resource recovery schemes and renewable energy sources, aligning with Sustainable Development Goals (SDGs) 6 (Clean Water and Sanitation) and 12 (Responsible Consumption and Production).
Supplementary Materials
The following supporting information can be downloaded at the website of this paper posted on Preprints.org.
Acknowledgments
This work was supported by SECRETARÍA DE CIENCIA, HUMANIDADES, TECNOLOGÍA E INNOVACIÓN, grant LN-2025-I-16. M.A. Sandoval also gratefully acknowledges additional support from the Instituto Tecnológico Nacional de México (TecNM) through the PICDTI Project No. 22721.25-PD.
References
- Islam, Md. M., Aidid, A. R., Mohshin, J. N., Mondal, H., Ganguli, S., & Chakraborty, A. K. (2025). A critical review on textile dye-containing wastewater: ecotoxicity, health risks, and remediation strategies for environmental safety. Clean. Chem. Eng. 11, 100165. [CrossRef]
- Parida, V. K., Singh, N., Priyadarshini, M., Kumari, P., Datta, D., & Tambi, A. (2025). Insights into the synthetic dye contamination in textile wastewater: impacts on aquatic ecosystems and human health, and eco-friendly remediation strategies for environmental sustainability. J. Ind. Eng. Chem. 150, 247-264. [CrossRef]
- Alegbe, E. O., & Uthman, T. O. (2024). A review of history, properties, classification, applications and challenges of natural and synthetic dyes. Heliyon 10, e33646. [CrossRef]
- Benkhaya, S., M’ rabet, S., & El Harfi, A. (2020). A review on classifications, recent synthesis and applications of real industrial dye. Inorg. Chem. Commun. 115, 107891. [CrossRef]
- Alsantali, R. I., Raja, Q. A., Alzahrani, A. Y. A., Sadiq, A., Naeem, N., Mughal, E. U., Al-Rooqi, M. M., El Guesmi, N., Moussa, Z., & Ahmed, S. A. (2022). Miscellaneous azo dyes: a comprehensive review on recent advancements in biological and industrial applications. Dyes Pigments 199, 110050. [CrossRef]
- Ewuzie, U., Saliu, O. D., Dulta, K., Ogunniyi, S., Bajeh, A. O., Iwuozor, K. O., & Ighalo, J. O. (2022). A review on treatment technologies for printing and dyeing wastewater (PDW). J. Water Process Eng. 50, 103273. [CrossRef]
- Khan, M. D., Singh, A., Khan, M. Z., Tabraiz, S., & Sheikh, J. (2023). Current perspectives, recent advancements, and efficiencies of various dye-containing wastewater treatment technologies. J. Water Process Eng. 53, 103579. Elsevier Ltd. [CrossRef]
- Najim, A. A., Radeef, A. Y., & Jabbar, Z. H. (2025). Recent trends in physio-chemo technologies and their role in dyes removal: effectiveness, benefits, and limitations. Chem. Eng. Res. Design, 219, 198–221. [CrossRef]
- Singh, A., Pal, D. B., Mohammad, A., Alhazmi, A., Haque, S., Yoon, T., Srivastava, N., & Gupta, V. K. (2022). Biological remediation technologies for dyes and heavy metals in wastewater treatment: new insight. Bioresource Technol. 343, 126154. [CrossRef]
- Ismail, G. A., & Sakai, H. (2022). Review on effect of different type of dyes on advanced oxidation processes (AOPs) for textile color removal. Chemosphere 291, 132906. [CrossRef]
- Sahu, A., & Poler, J. C. (2024). Removal and degradation of dyes from textile industry wastewater: benchmarking recent advancements, toxicity assessment and cost analysis of treatment processes. J. Environ. Chem. Eng. 12, 113754. [CrossRef]
- Chanikya, P., Nidheesh, P. V., Syam Babu, D., Gopinath, A., & Suresh Kumar, M. (2021). Treatment of dyeing wastewater by combined sulfate radical based electrochemical advanced oxidation and electrocoagulation processes. Sep. Purif. Technol. 254, 117570. [CrossRef]
- Ganiyu, S. O., Martínez-Huitle, C. A., & Rodrigo, M. A. (2020). Renewable energies driven electrochemical wastewater/soil decontamination technologies: a critical review of fundamental concepts and applications. Appl. Catal. B: Environ. 270, 118857. [CrossRef]
- Nidheesh, P. V., Zhou, M., & Oturan, M. A. (2018). An overview on the removal of synthetic dyes from water by electrochemical advanced oxidation processes. Chemosphere 197, 210–227. [CrossRef]
- Rodríguez-Narváez, O. M., Picos, A. R., Bravo-Yumi, N., Pacheco-Alvarez, M., Martínez-Huitle, C. A., & Peralta-Hernández, J. M. (2021). Electrochemical oxidation technology to treat textile wastewaters. Curr. Opin. Electrochem. 29, 100806. [CrossRef]
- Panizza, M. & Cerisola, G. (2009). Direct and mediated anodic oxidation of organic pollutants. Chem. Rev. 109, 6541-6569. [CrossRef]
- Bravo-Yumi, N., Pacheco-Álvarez, M. O., Olvera-Vargas, H., Brillas, E., & Peralta-Hernández, J. M. (2024). Electrochemical treatment on a pilot scale of a mixture with high concentrations of dyes from the tanning/textile industry. J. Electroanal. Chem. 972, 118616. [CrossRef]
- Can-Güven, E. (2021). Advanced treatment of dye manufacturing wastewater by electrocoagulation and electro-Fenton processes: effect on COD fractions, energy consumption, and sludge analysis. J. Environ. Manage. 300, 113784. [CrossRef]
- Li, W., Song, G., Sun, J., & Zhou, M. (2024). Electrochemical advanced oxidation processes towards carbon neutral wastewater treatment: A review. Chem. Eng. J. 480, 148044. [CrossRef]
- Martínez-Huitle, C. A., Rodrigo, M. A., Sirés, I., & Scialdone, O. (2023). A critical review on latest innovations and future challenges of electrochemical technology for the abatement of organics in water. Appl. Catal. B: Environ. 328, 122430. [CrossRef]
- Pacheco-Álvarez, M., Fuentes-Ramírez, R., Brillas, E., & Peralta-Hernández, J. M. (2023). Assessing the electrochemical degradation of reactive orange 84 with Ti/IrO2–SnO2–Sb2O5 anode using electrochemical oxidation, electro-Fenton, and photoelectro-Fenton under UVA irradiation. Chemosphere 339, 139666. [CrossRef]
- Herrera-Chávez, S., Pacheco-Álvarez, M., Kadier, A., Brillas, E., Peralta-Hernández, J.M. (2024). Efficient electrochemical advanced degradation of Red CL and Red WB dyes from the tanning industry using a boron-doped diamond anode. Chemosphere, 363, 142825. [CrossRef]
- Cotillas, S., Clematis, D., Cañizares, P., Carpanese, M. P., Rodrigo, M. A., & Panizza, M. (2018). Degradation of dye Procion Red MX-5B by electrolytic and electro-irradiated technologies using diamond electrodes. Chemosphere 199, 445–452. [CrossRef]
- Brillas, E. (2020). A review on the photoelectro-Fenton process as efficient electrochemical advanced oxidation for wastewater remediation. Treatment with UV light, sunlight, and coupling with conventional and other photo-assisted advanced technologies. Chemosphere 250, 126198. [CrossRef]
- Kaur, P., Park, Y., Imteaz, Sillanpaa, M. (2023). Synthesis of non-active electrode (TiO2/GO/Ag) for the photoelectro-Fenton oxidation of micropollutants in wastewater. Int. J. Environ. Sci. Technol. 20, 639–652. [CrossRef]
- Magdaleno, A. L., Brillas, E., Garcia-Segura, S., & dos Santos, A. J. (2024). Comparison of electrochemical advanced oxidation processes for the treatment of complex synthetic dye mixtures. Sep. Purif. Technol. 345, 127295. [CrossRef]
Figure 1.
Schematic representation of the electrochemical reactor used in this work.
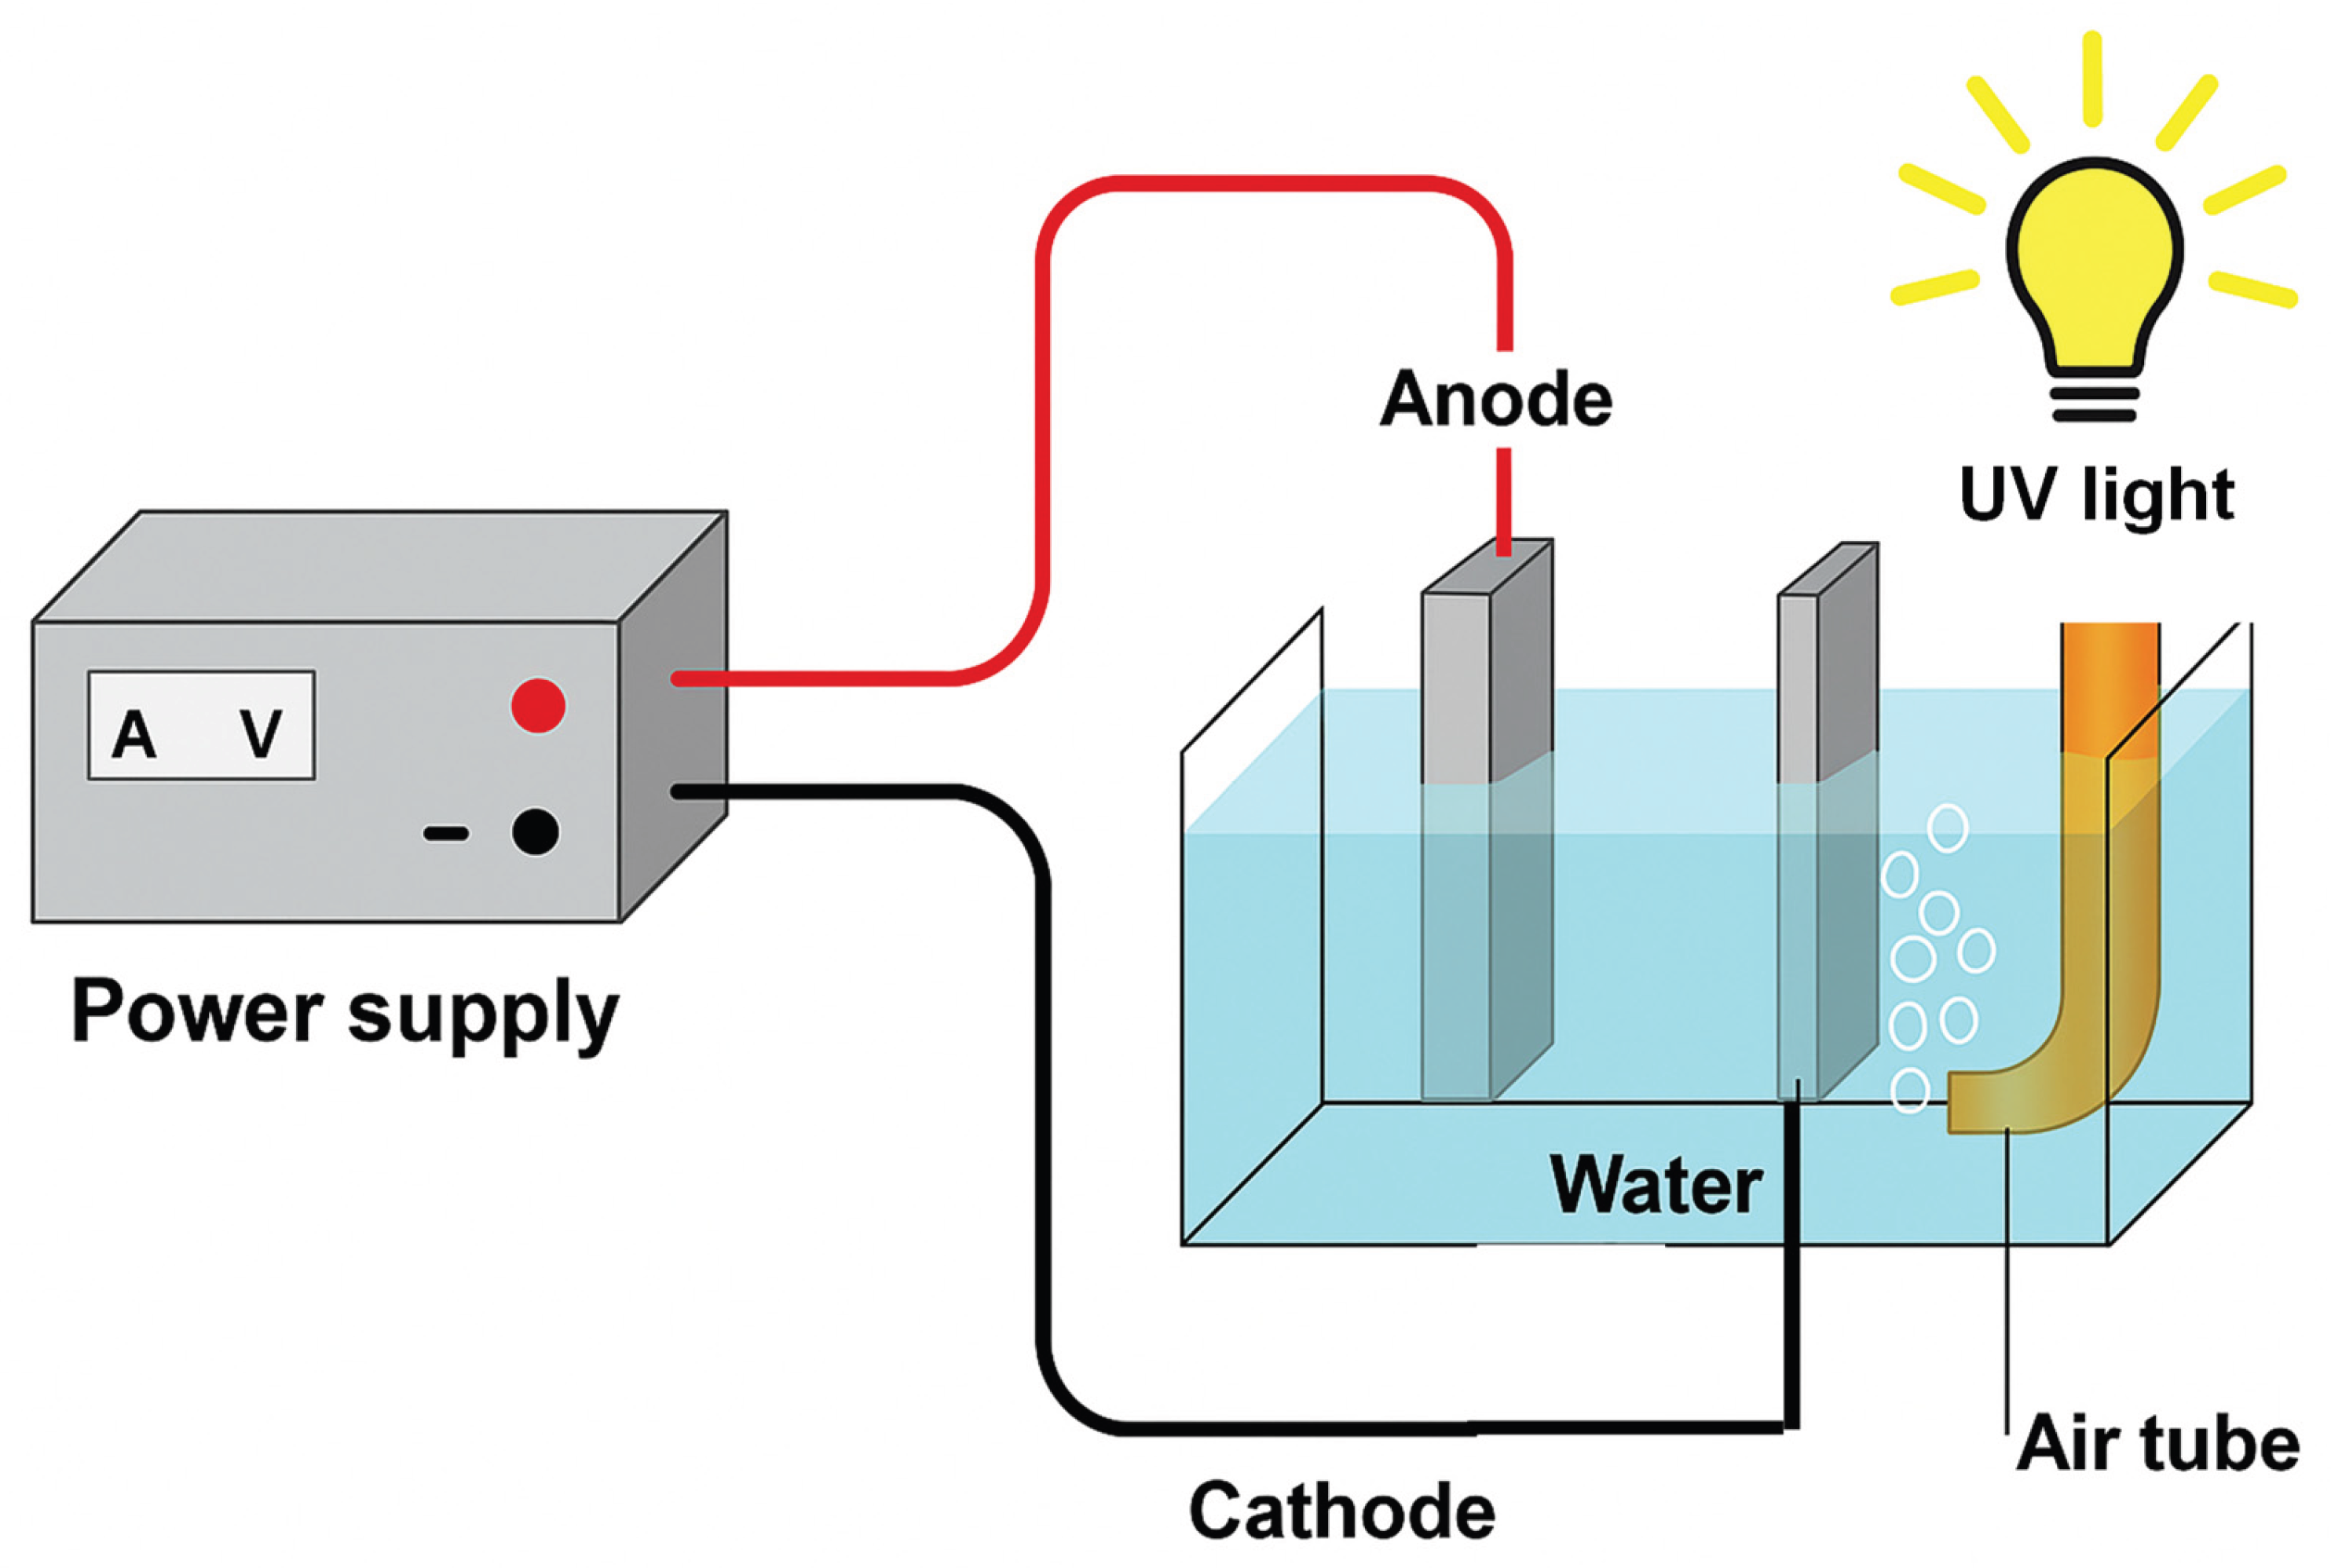
Figure 2.
Decolorization of Coriasol CB Red under representative EAOP configurations. (■) AO-BDD, 40 mg L-1, (♦) AO-MMO, 80 mg L-1, (▲) EF-BDD, 120 mg L-1, and (●) PEF-BDD, 80 mgL-1. The inset shows the corresponding linearized plots of Ln(A0/A) vs. time.
Figure 2.
Decolorization of Coriasol CB Red under representative EAOP configurations. (■) AO-BDD, 40 mg L-1, (♦) AO-MMO, 80 mg L-1, (▲) EF-BDD, 120 mg L-1, and (●) PEF-BDD, 80 mgL-1. The inset shows the corresponding linearized plots of Ln(A0/A) vs. time.
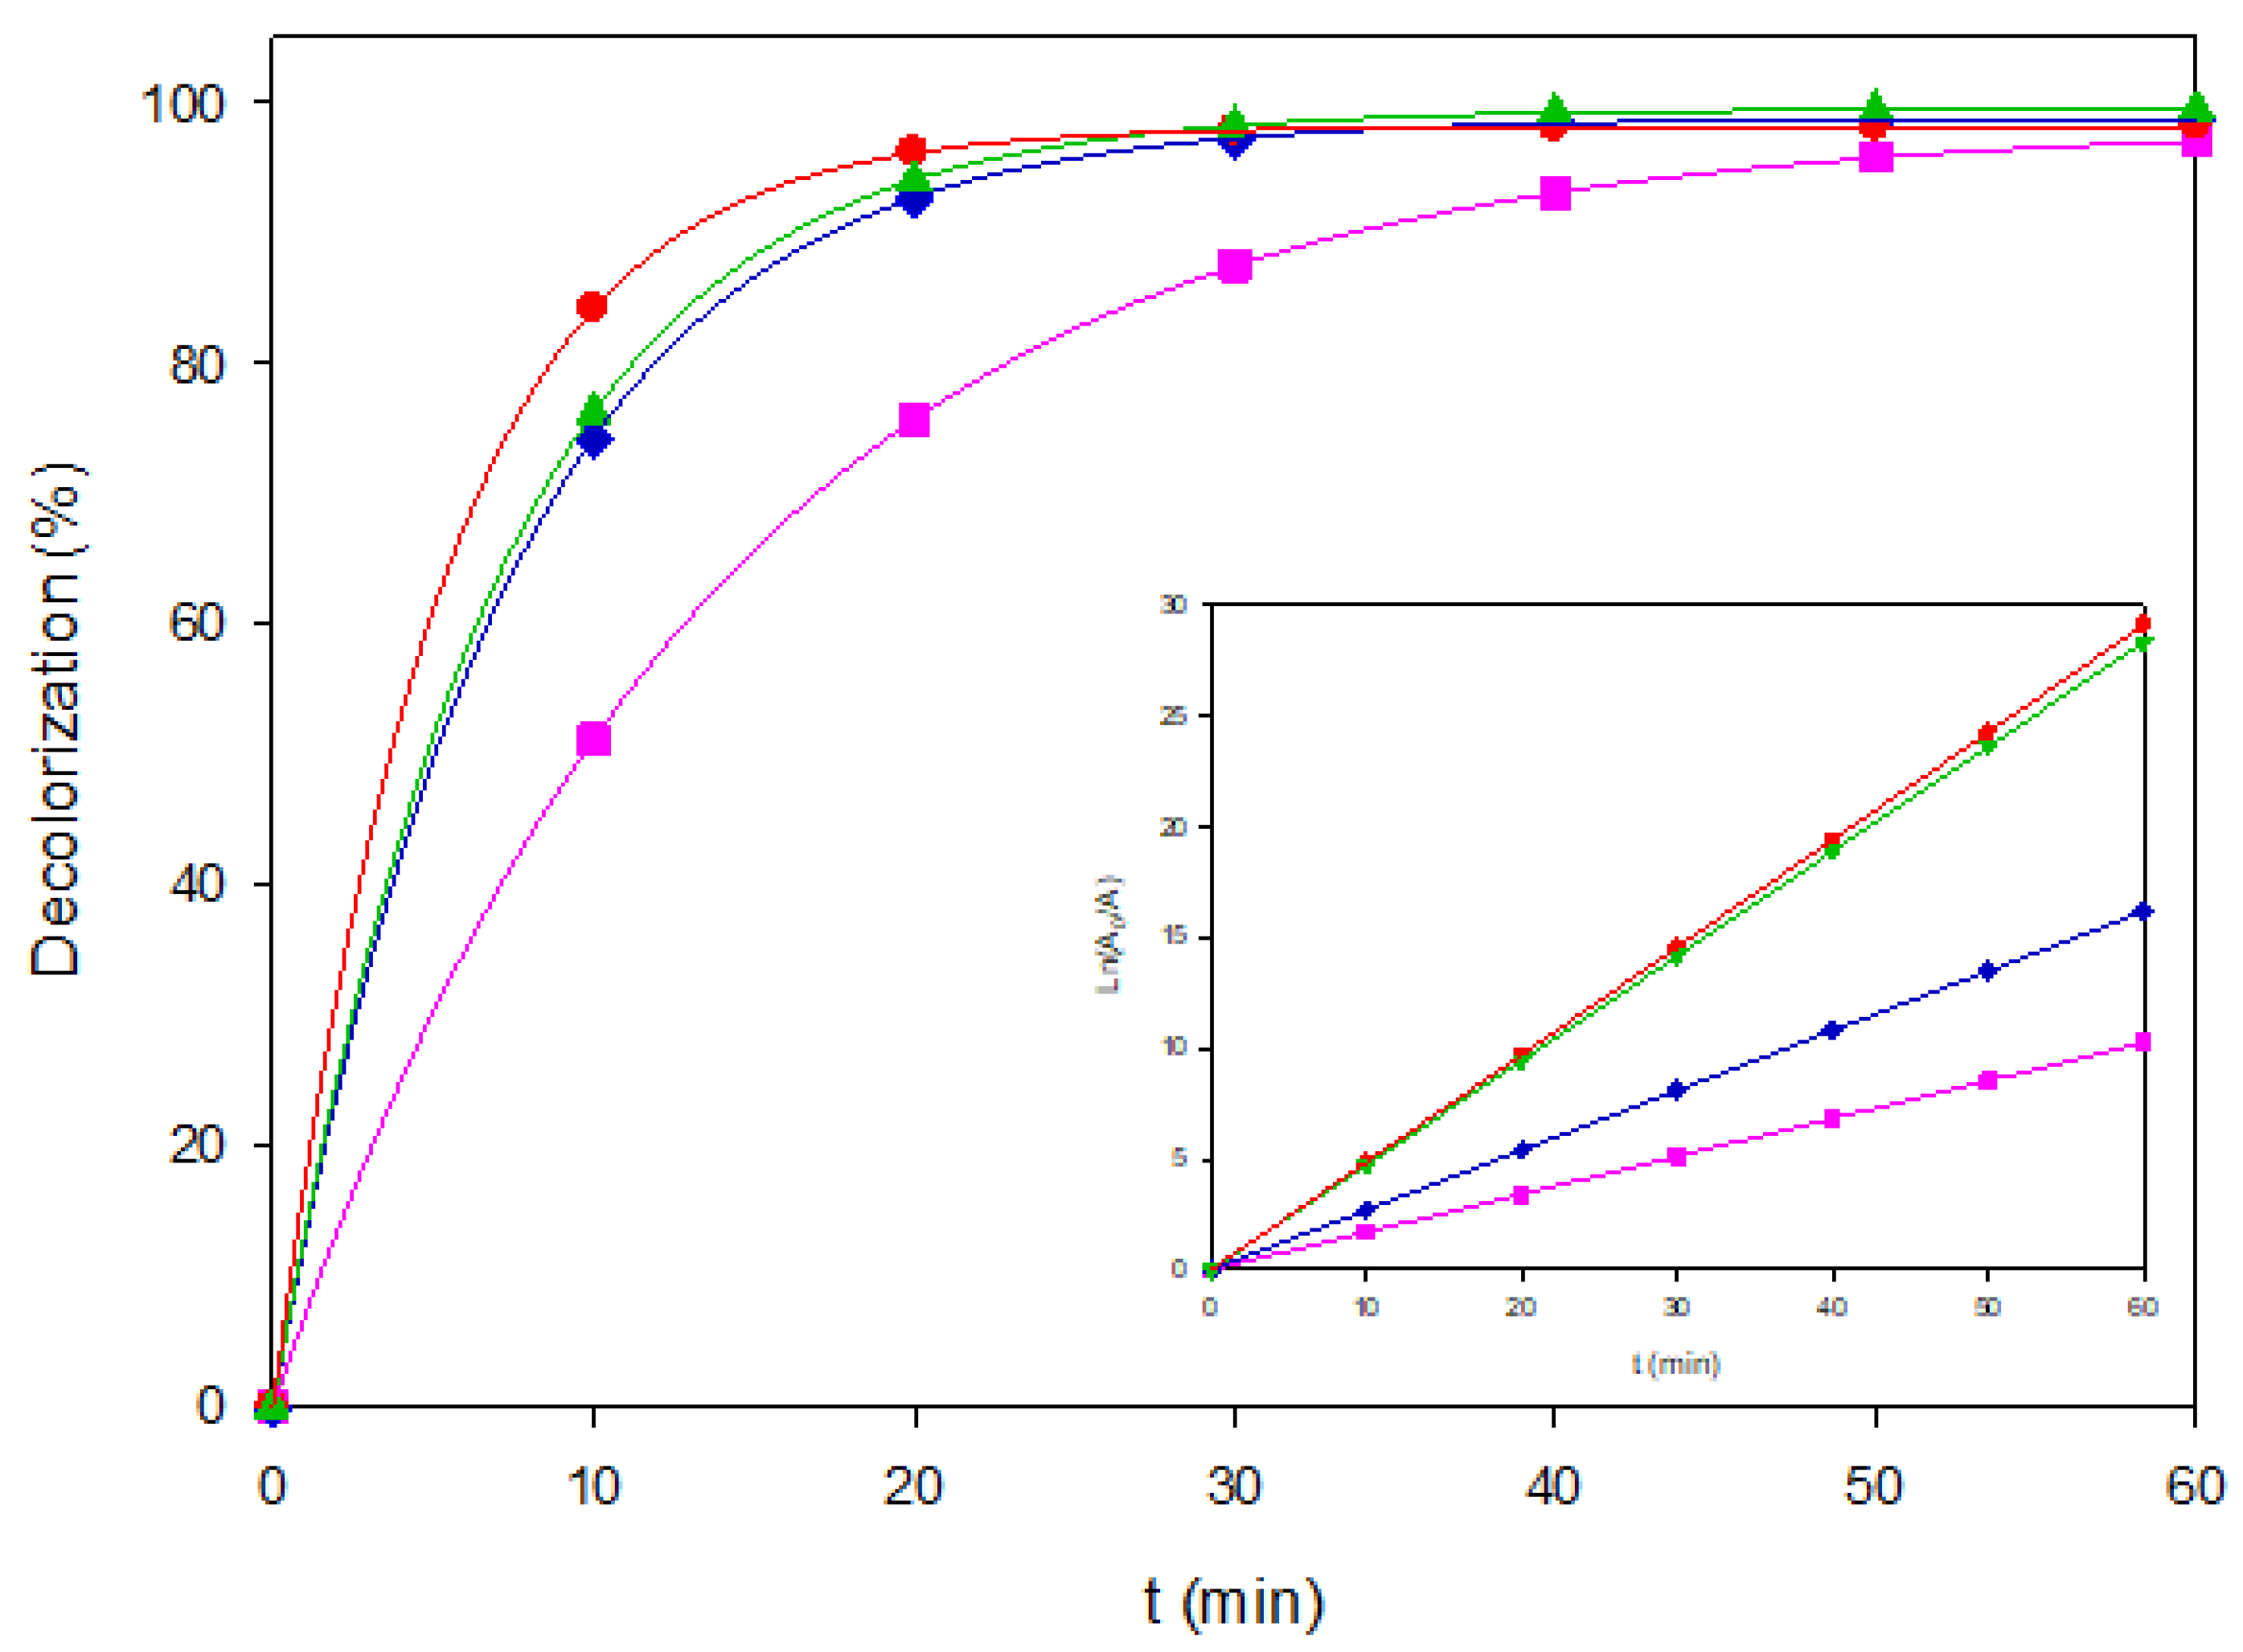
Figure 3.
COD removal of Coriasol CB Red under two representative EAOP conditions: (▲) AO–BDD at 40 mg L−1 and 60 mA cm−2, and (●) PEF–MMO at 120 mg L−1 and 60 mA cm−2.
Figure 3.
COD removal of Coriasol CB Red under two representative EAOP conditions: (▲) AO–BDD at 40 mg L−1 and 60 mA cm−2, and (●) PEF–MMO at 120 mg L−1 and 60 mA cm−2.
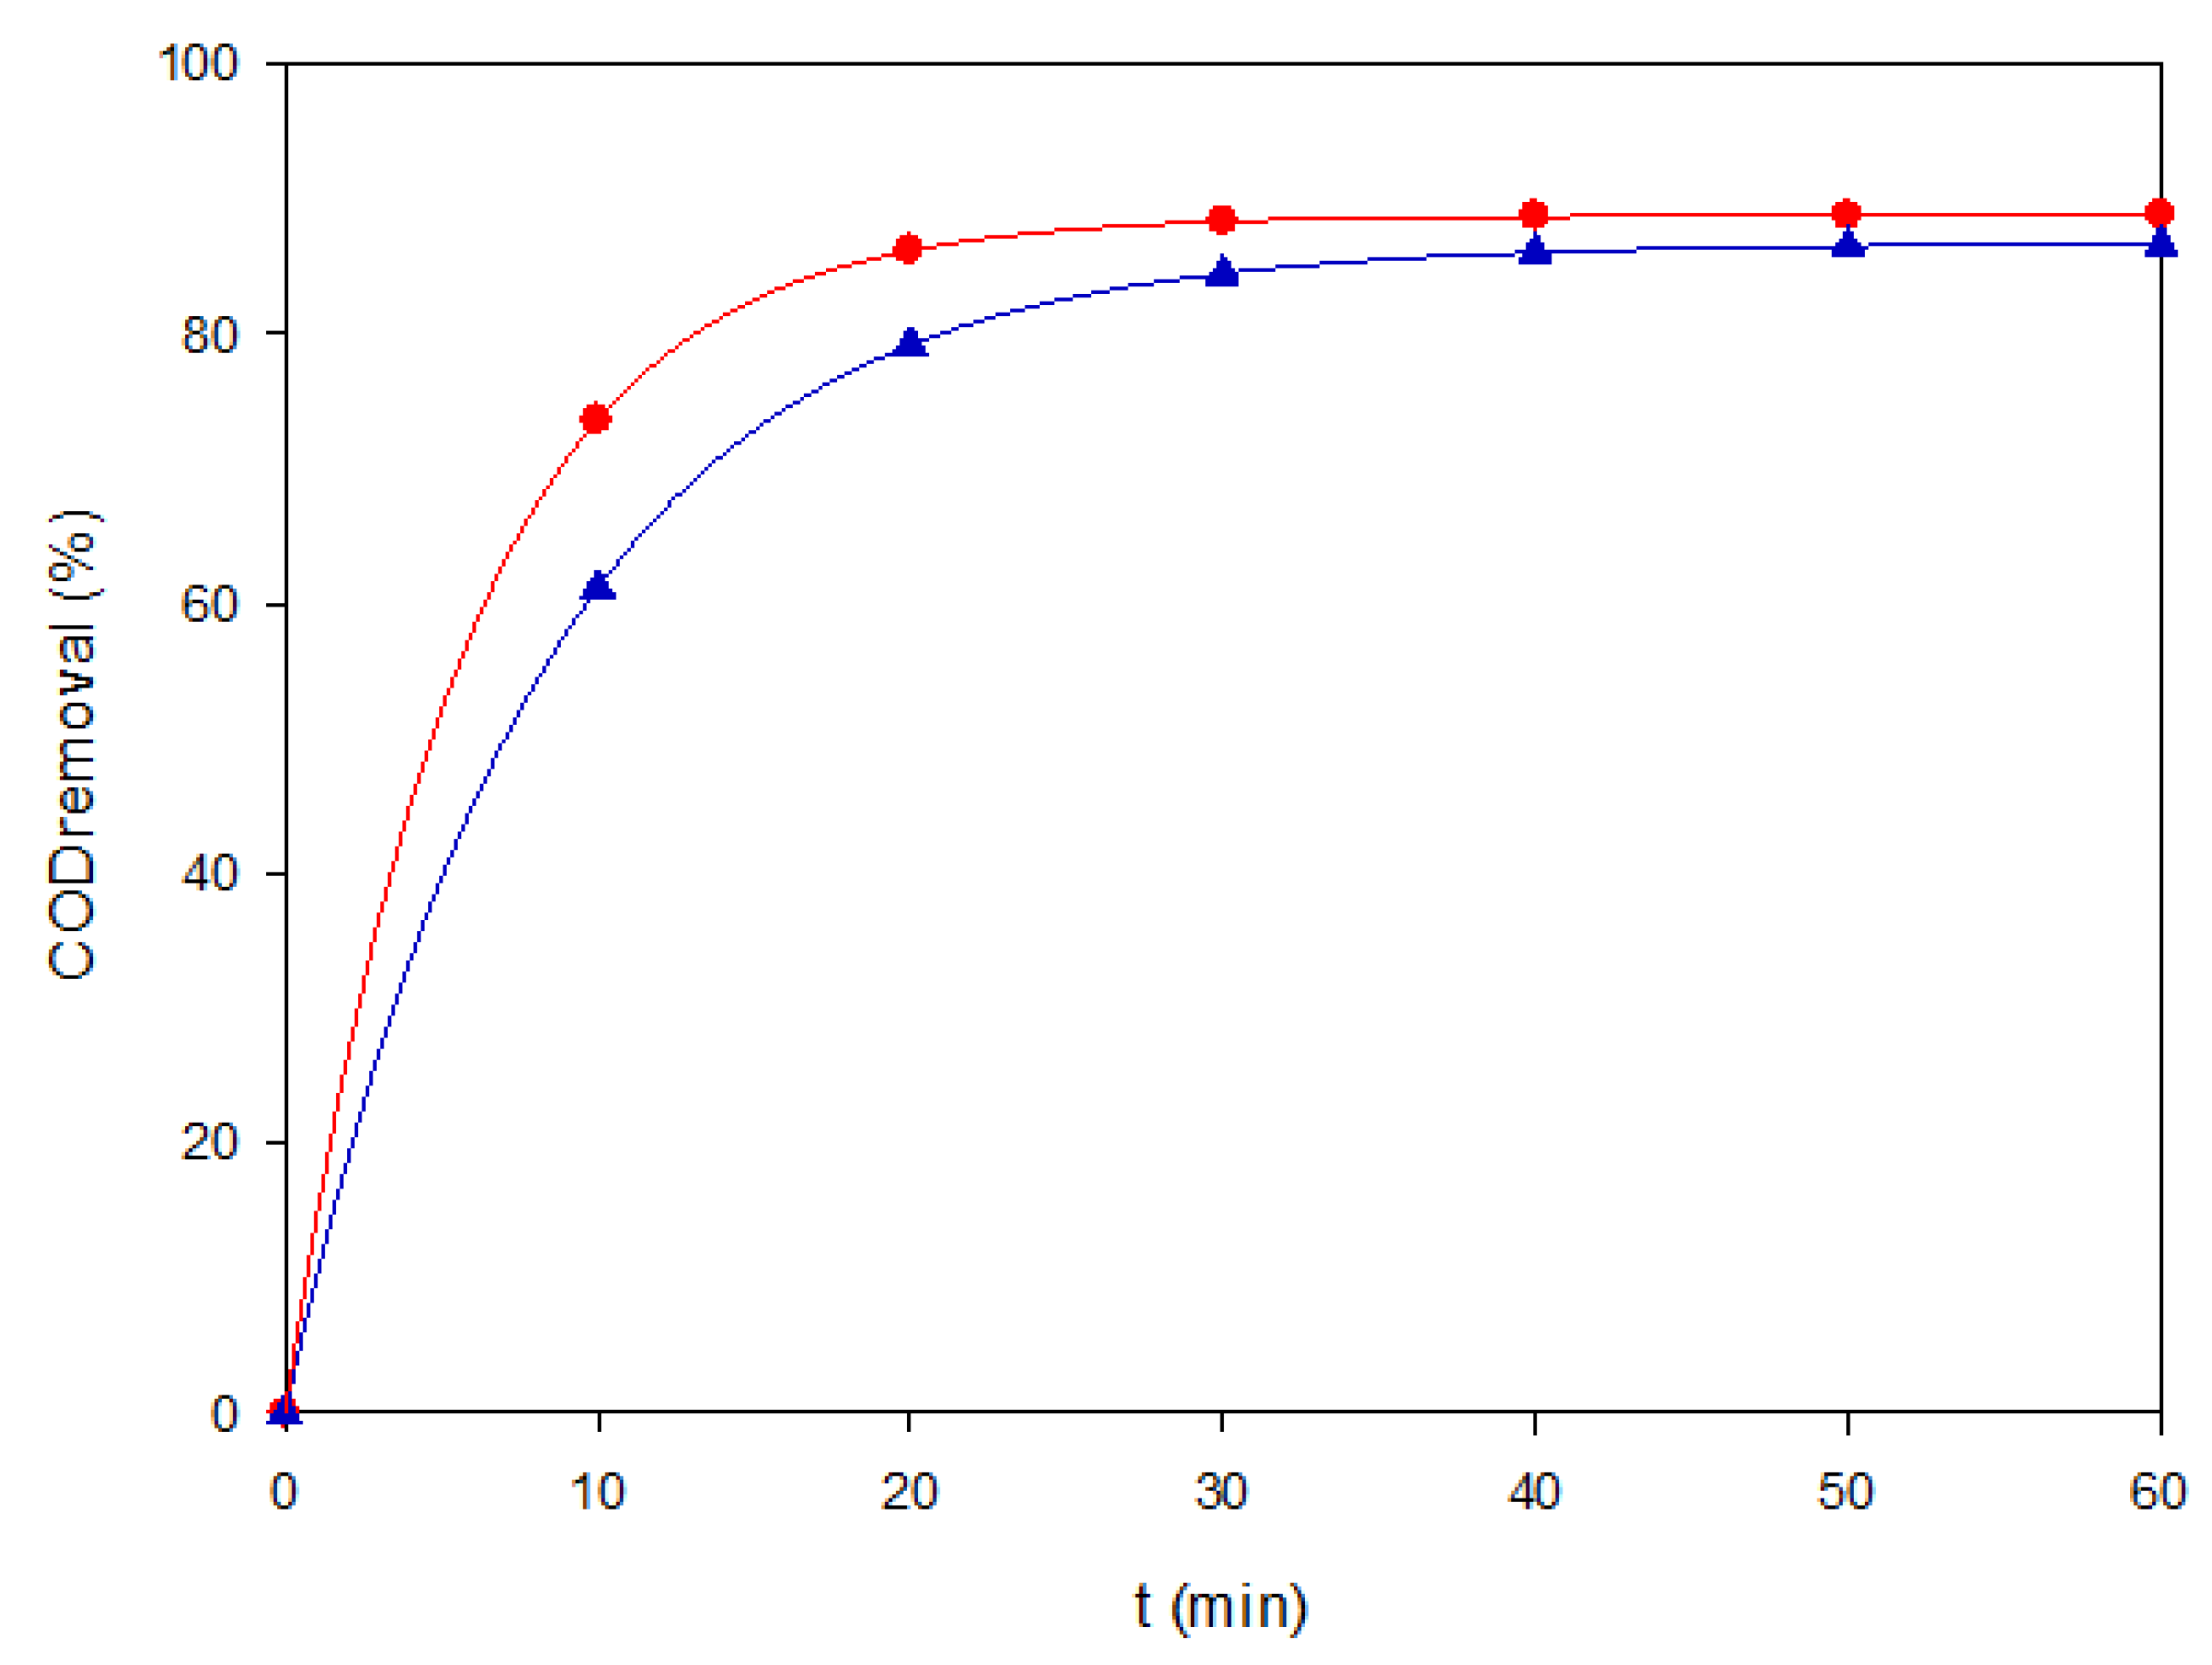
Figure 4.
Decolorization of Brown RBH under representative EAOP configurations. (▼) AO-BDD, 40 mg L-1, (■) AO-MMO, 80 mg L-1, (▼) EF-BDD, 120 mg L-1, and (●) PEF-MMO, 80 mgL-1. The inset panel shows the corresponding linearized plots of Ln(A0/A) vs. time.
Figure 4.
Decolorization of Brown RBH under representative EAOP configurations. (▼) AO-BDD, 40 mg L-1, (■) AO-MMO, 80 mg L-1, (▼) EF-BDD, 120 mg L-1, and (●) PEF-MMO, 80 mgL-1. The inset panel shows the corresponding linearized plots of Ln(A0/A) vs. time.
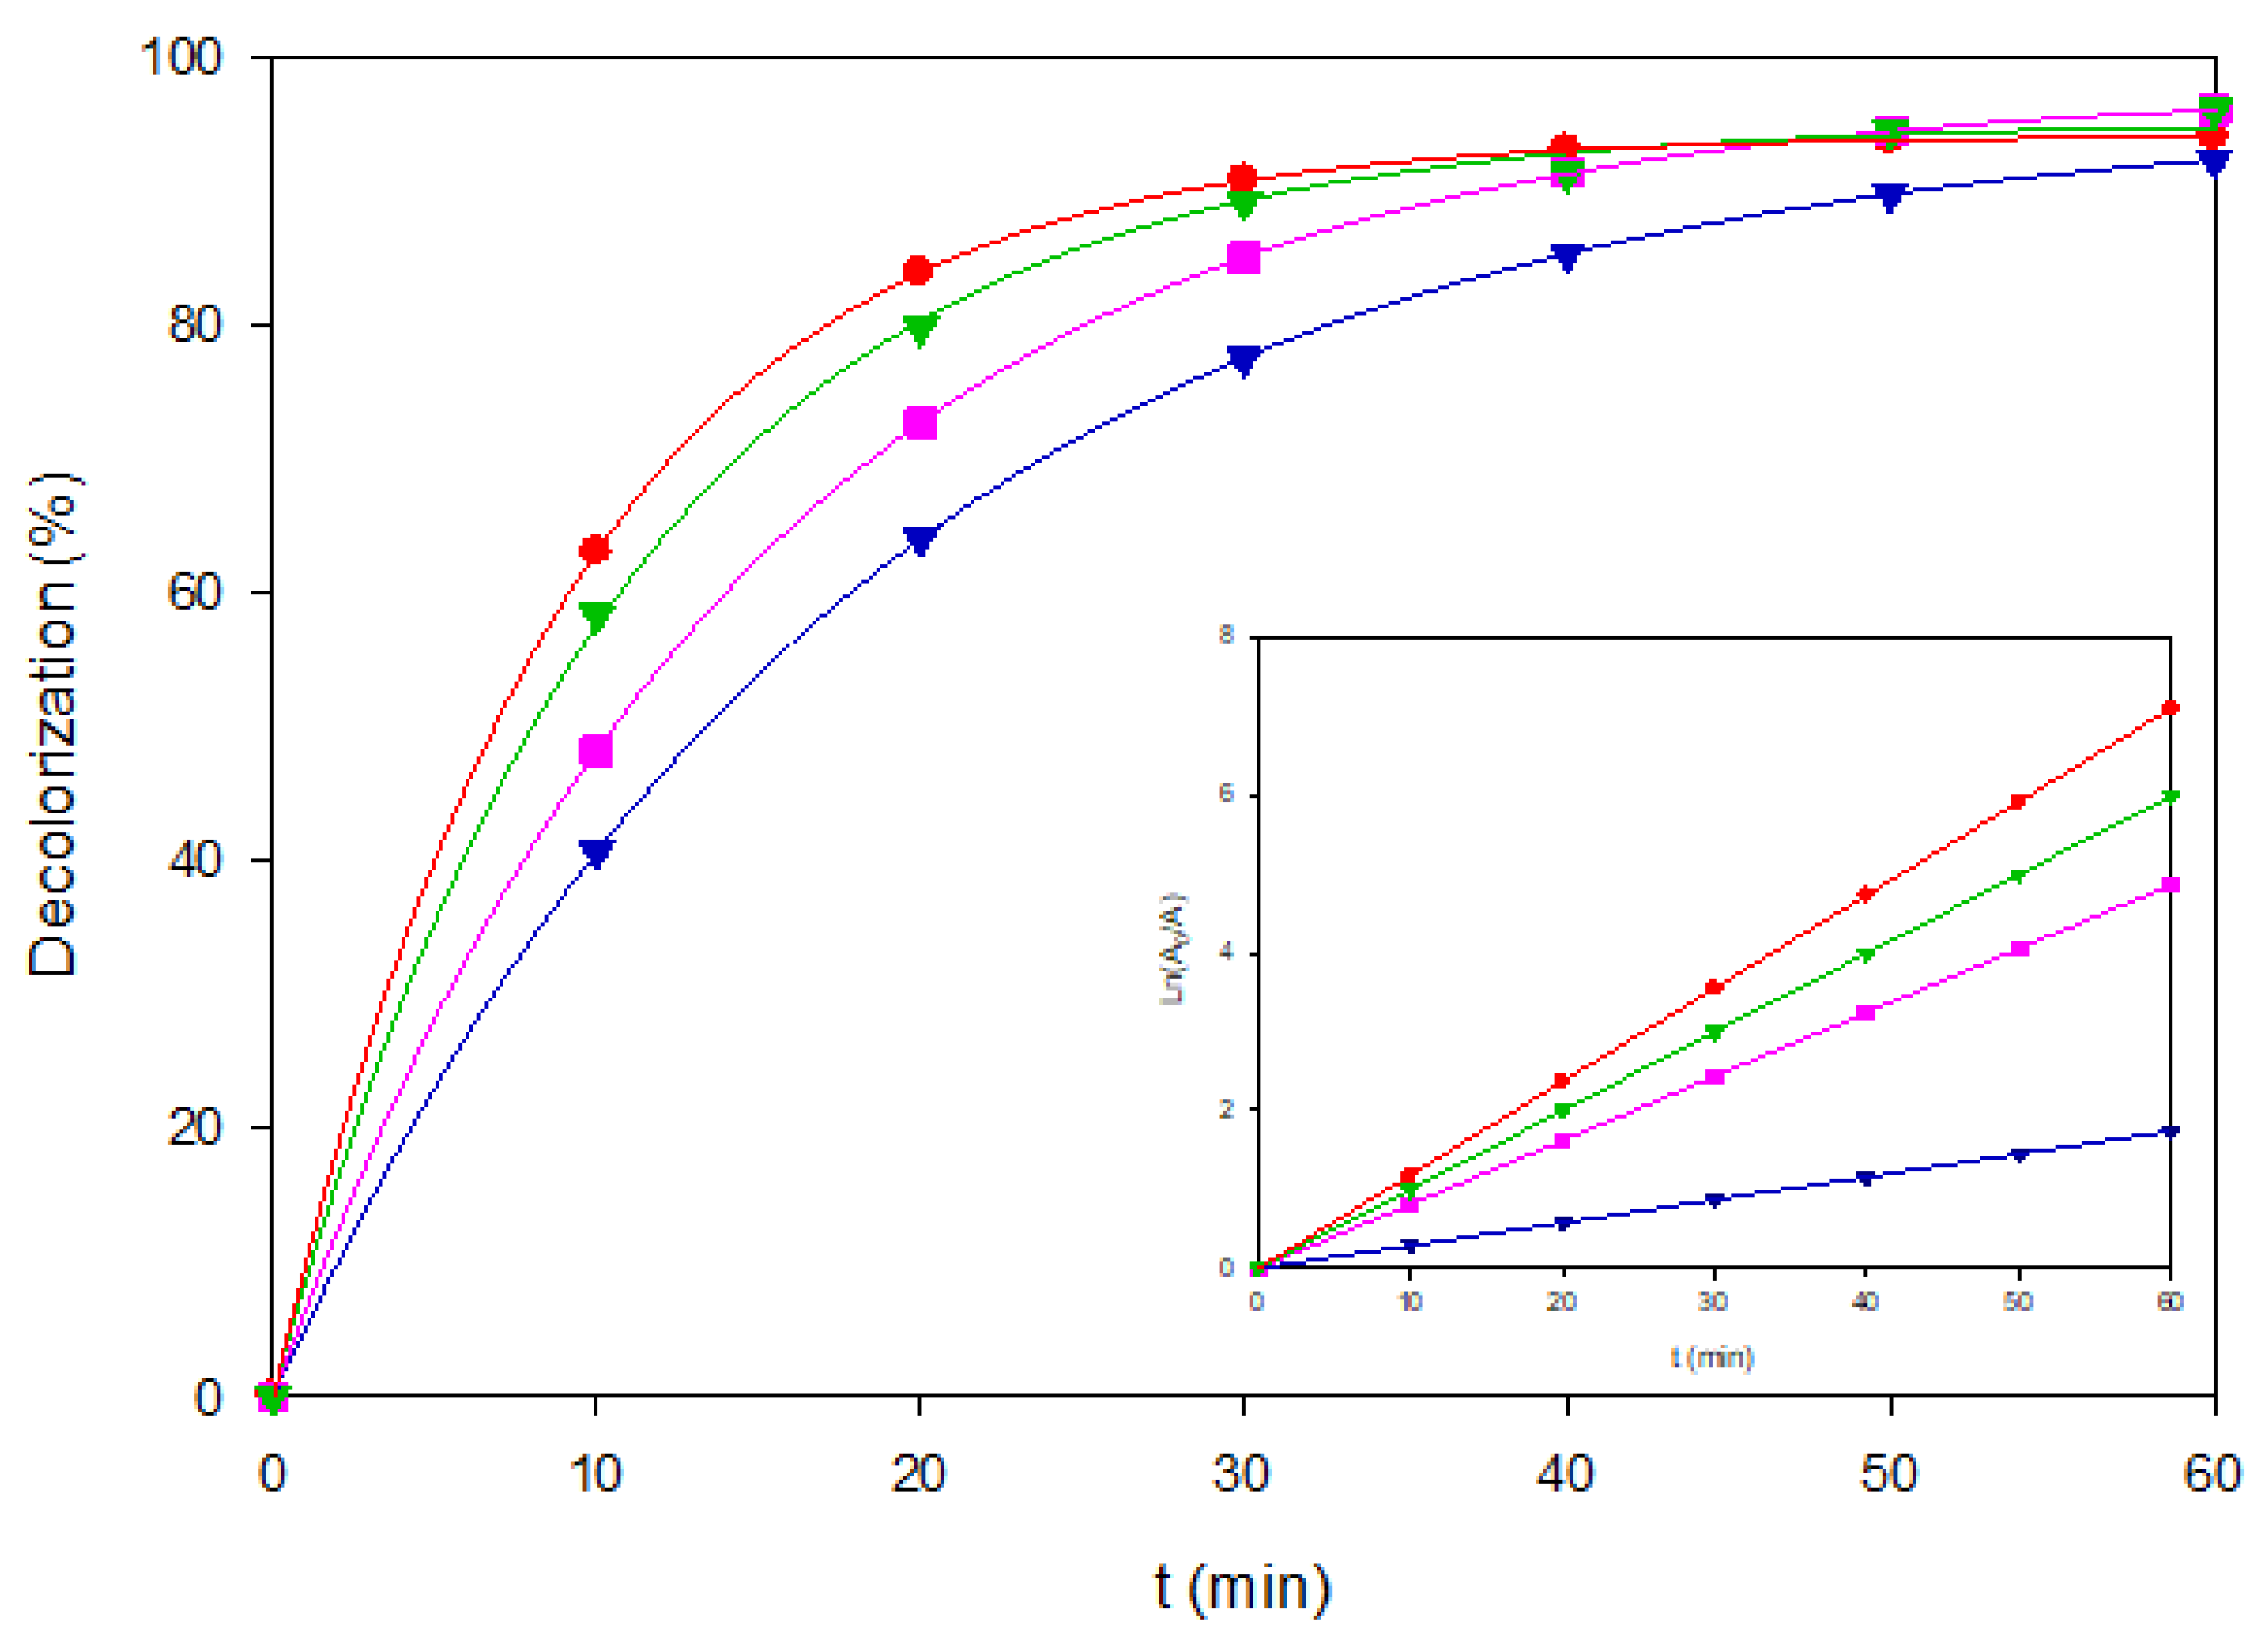
Figure 5.
COD removal of Brown RBH under two representative EAOP conditions: (■) EF–BDD at 120 mg L−1 and 60 mA cm−2, and (●) PEF–MMO at 80 mg L−1 and 60 mA cm−2.
Figure 5.
COD removal of Brown RBH under two representative EAOP conditions: (■) EF–BDD at 120 mg L−1 and 60 mA cm−2, and (●) PEF–MMO at 80 mg L−1 and 60 mA cm−2.
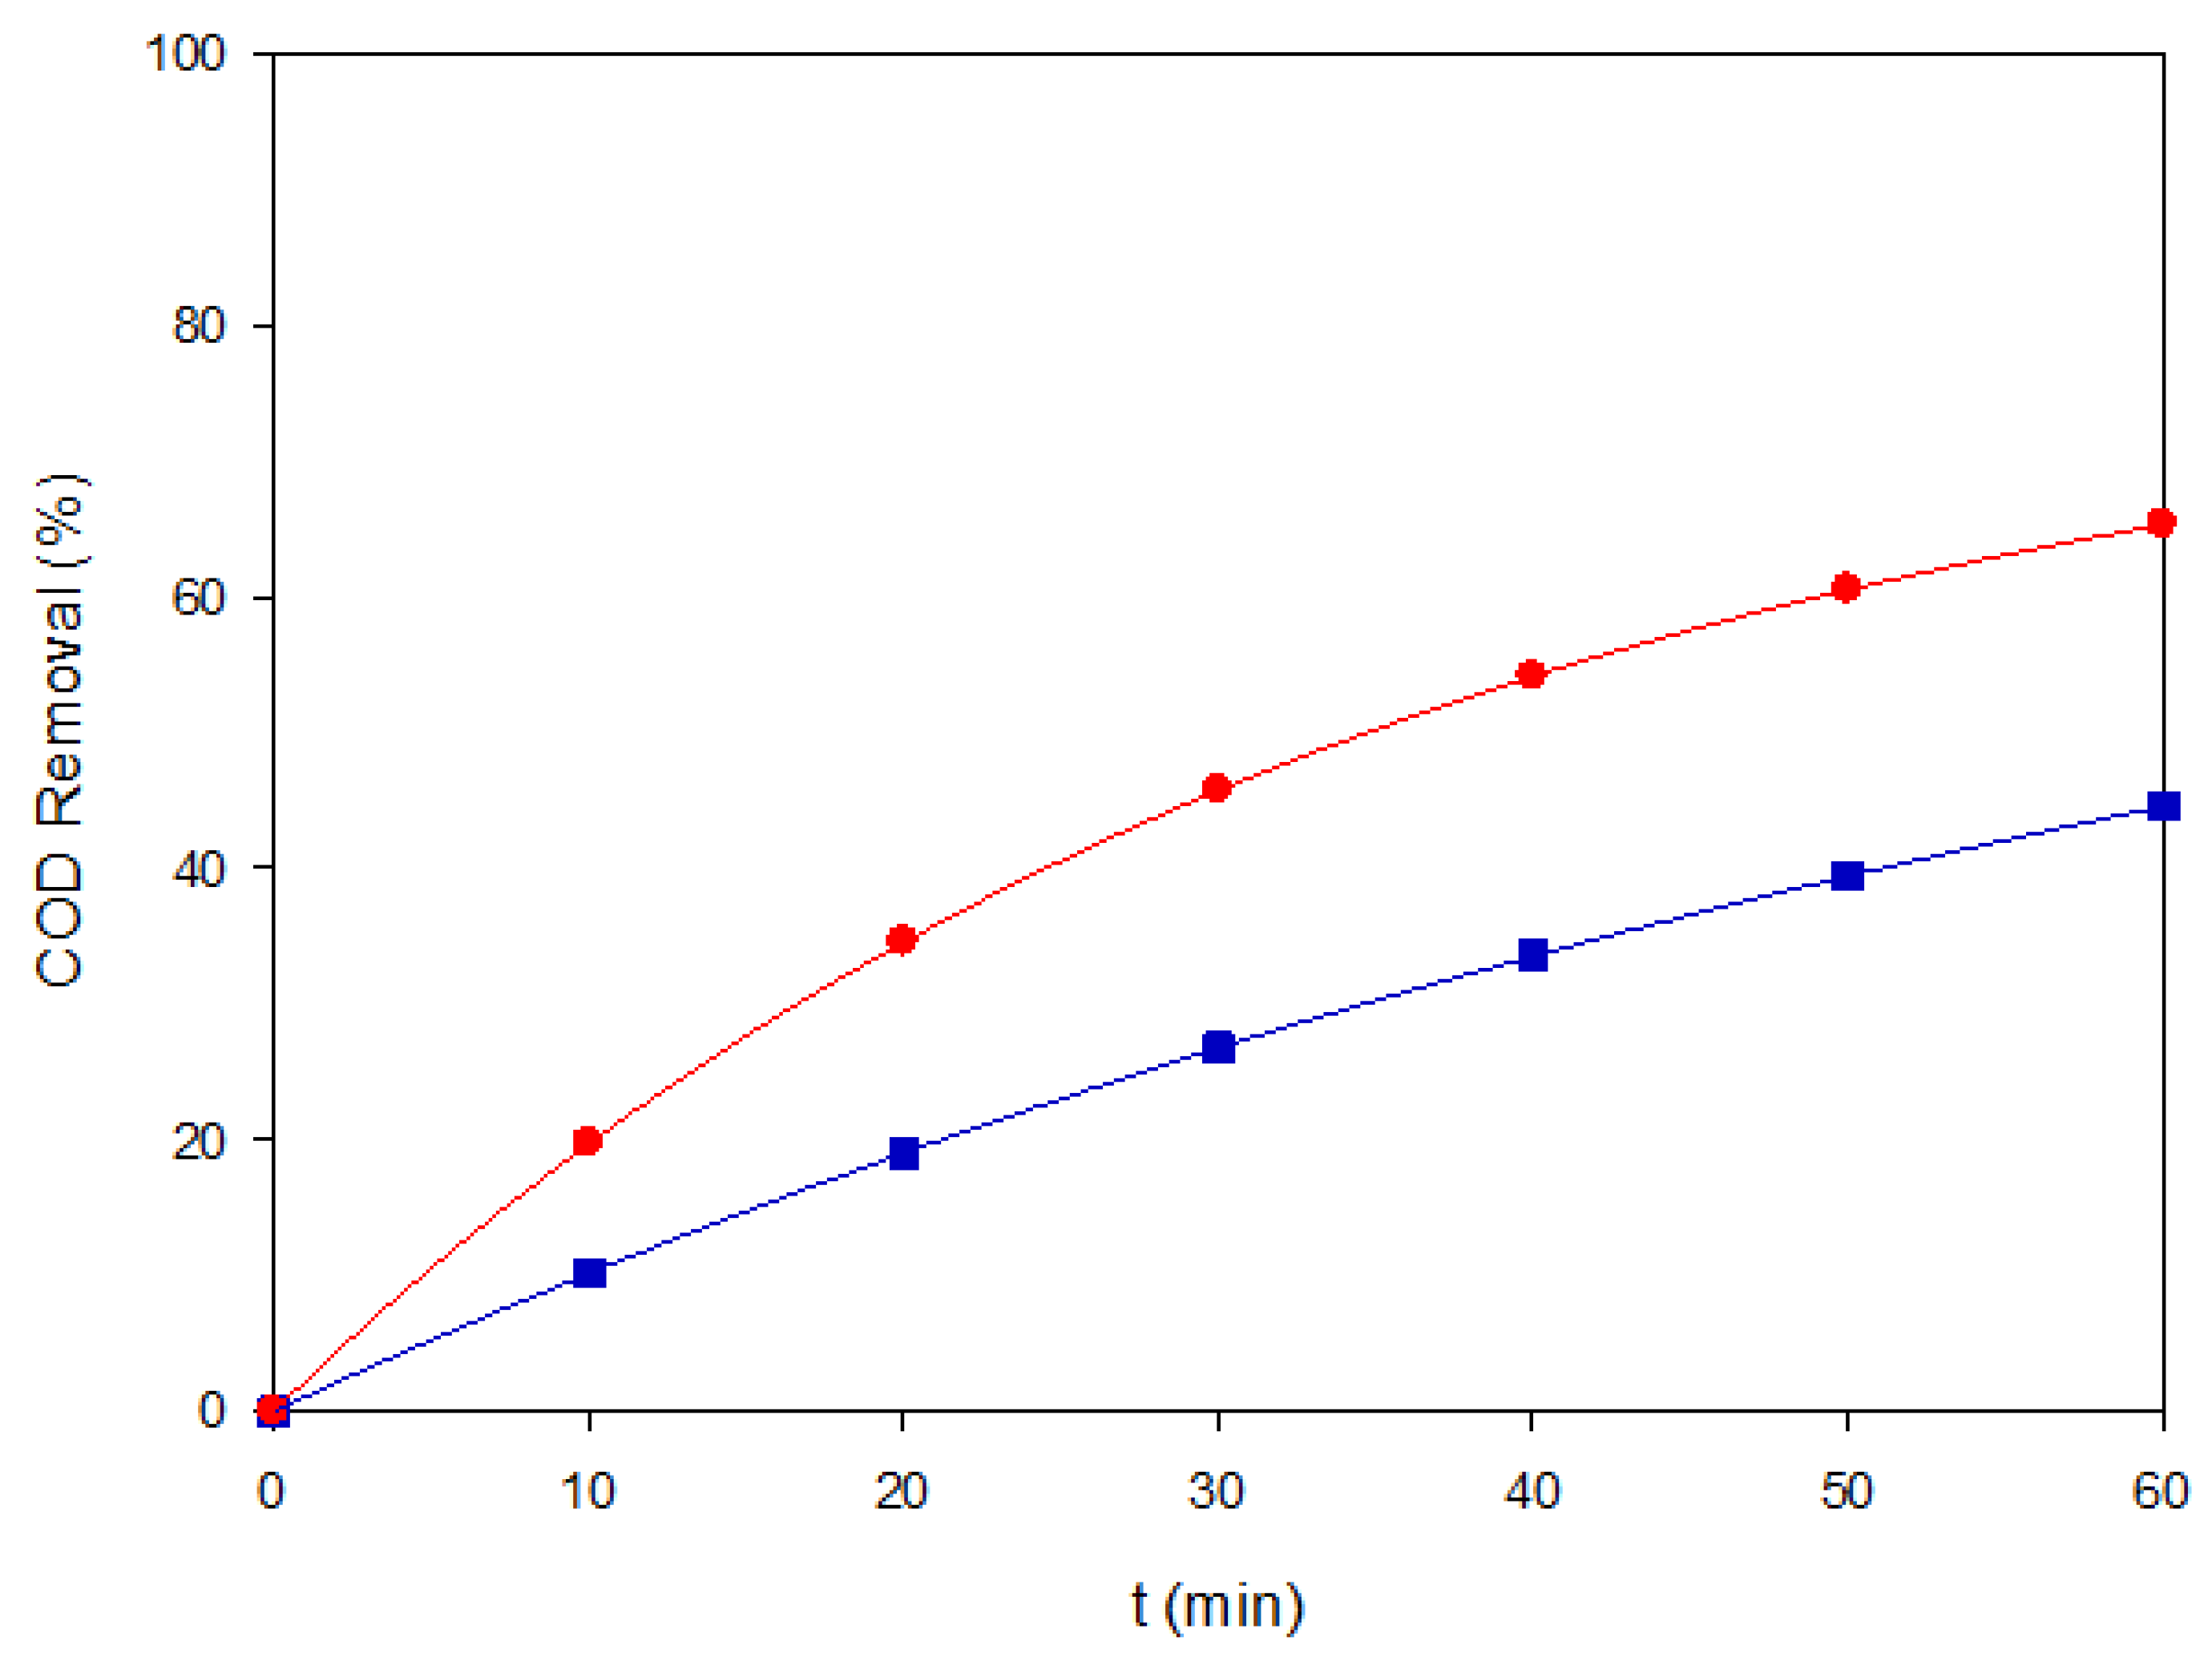
Figure 6.
Decolorization of Blue VT under representative EAOP configurations. (■) AO-BDD, 80 mg L-1, (▼) AO-MMO, 80 mg L-1, (♦) EF-BDD, 120 mg L-1, (●) PEF-MMO, 80 mg L-1. The inset shows the corresponding linearized plots of Ln(A0/A) vs. time).
Figure 6.
Decolorization of Blue VT under representative EAOP configurations. (■) AO-BDD, 80 mg L-1, (▼) AO-MMO, 80 mg L-1, (♦) EF-BDD, 120 mg L-1, (●) PEF-MMO, 80 mg L-1. The inset shows the corresponding linearized plots of Ln(A0/A) vs. time).
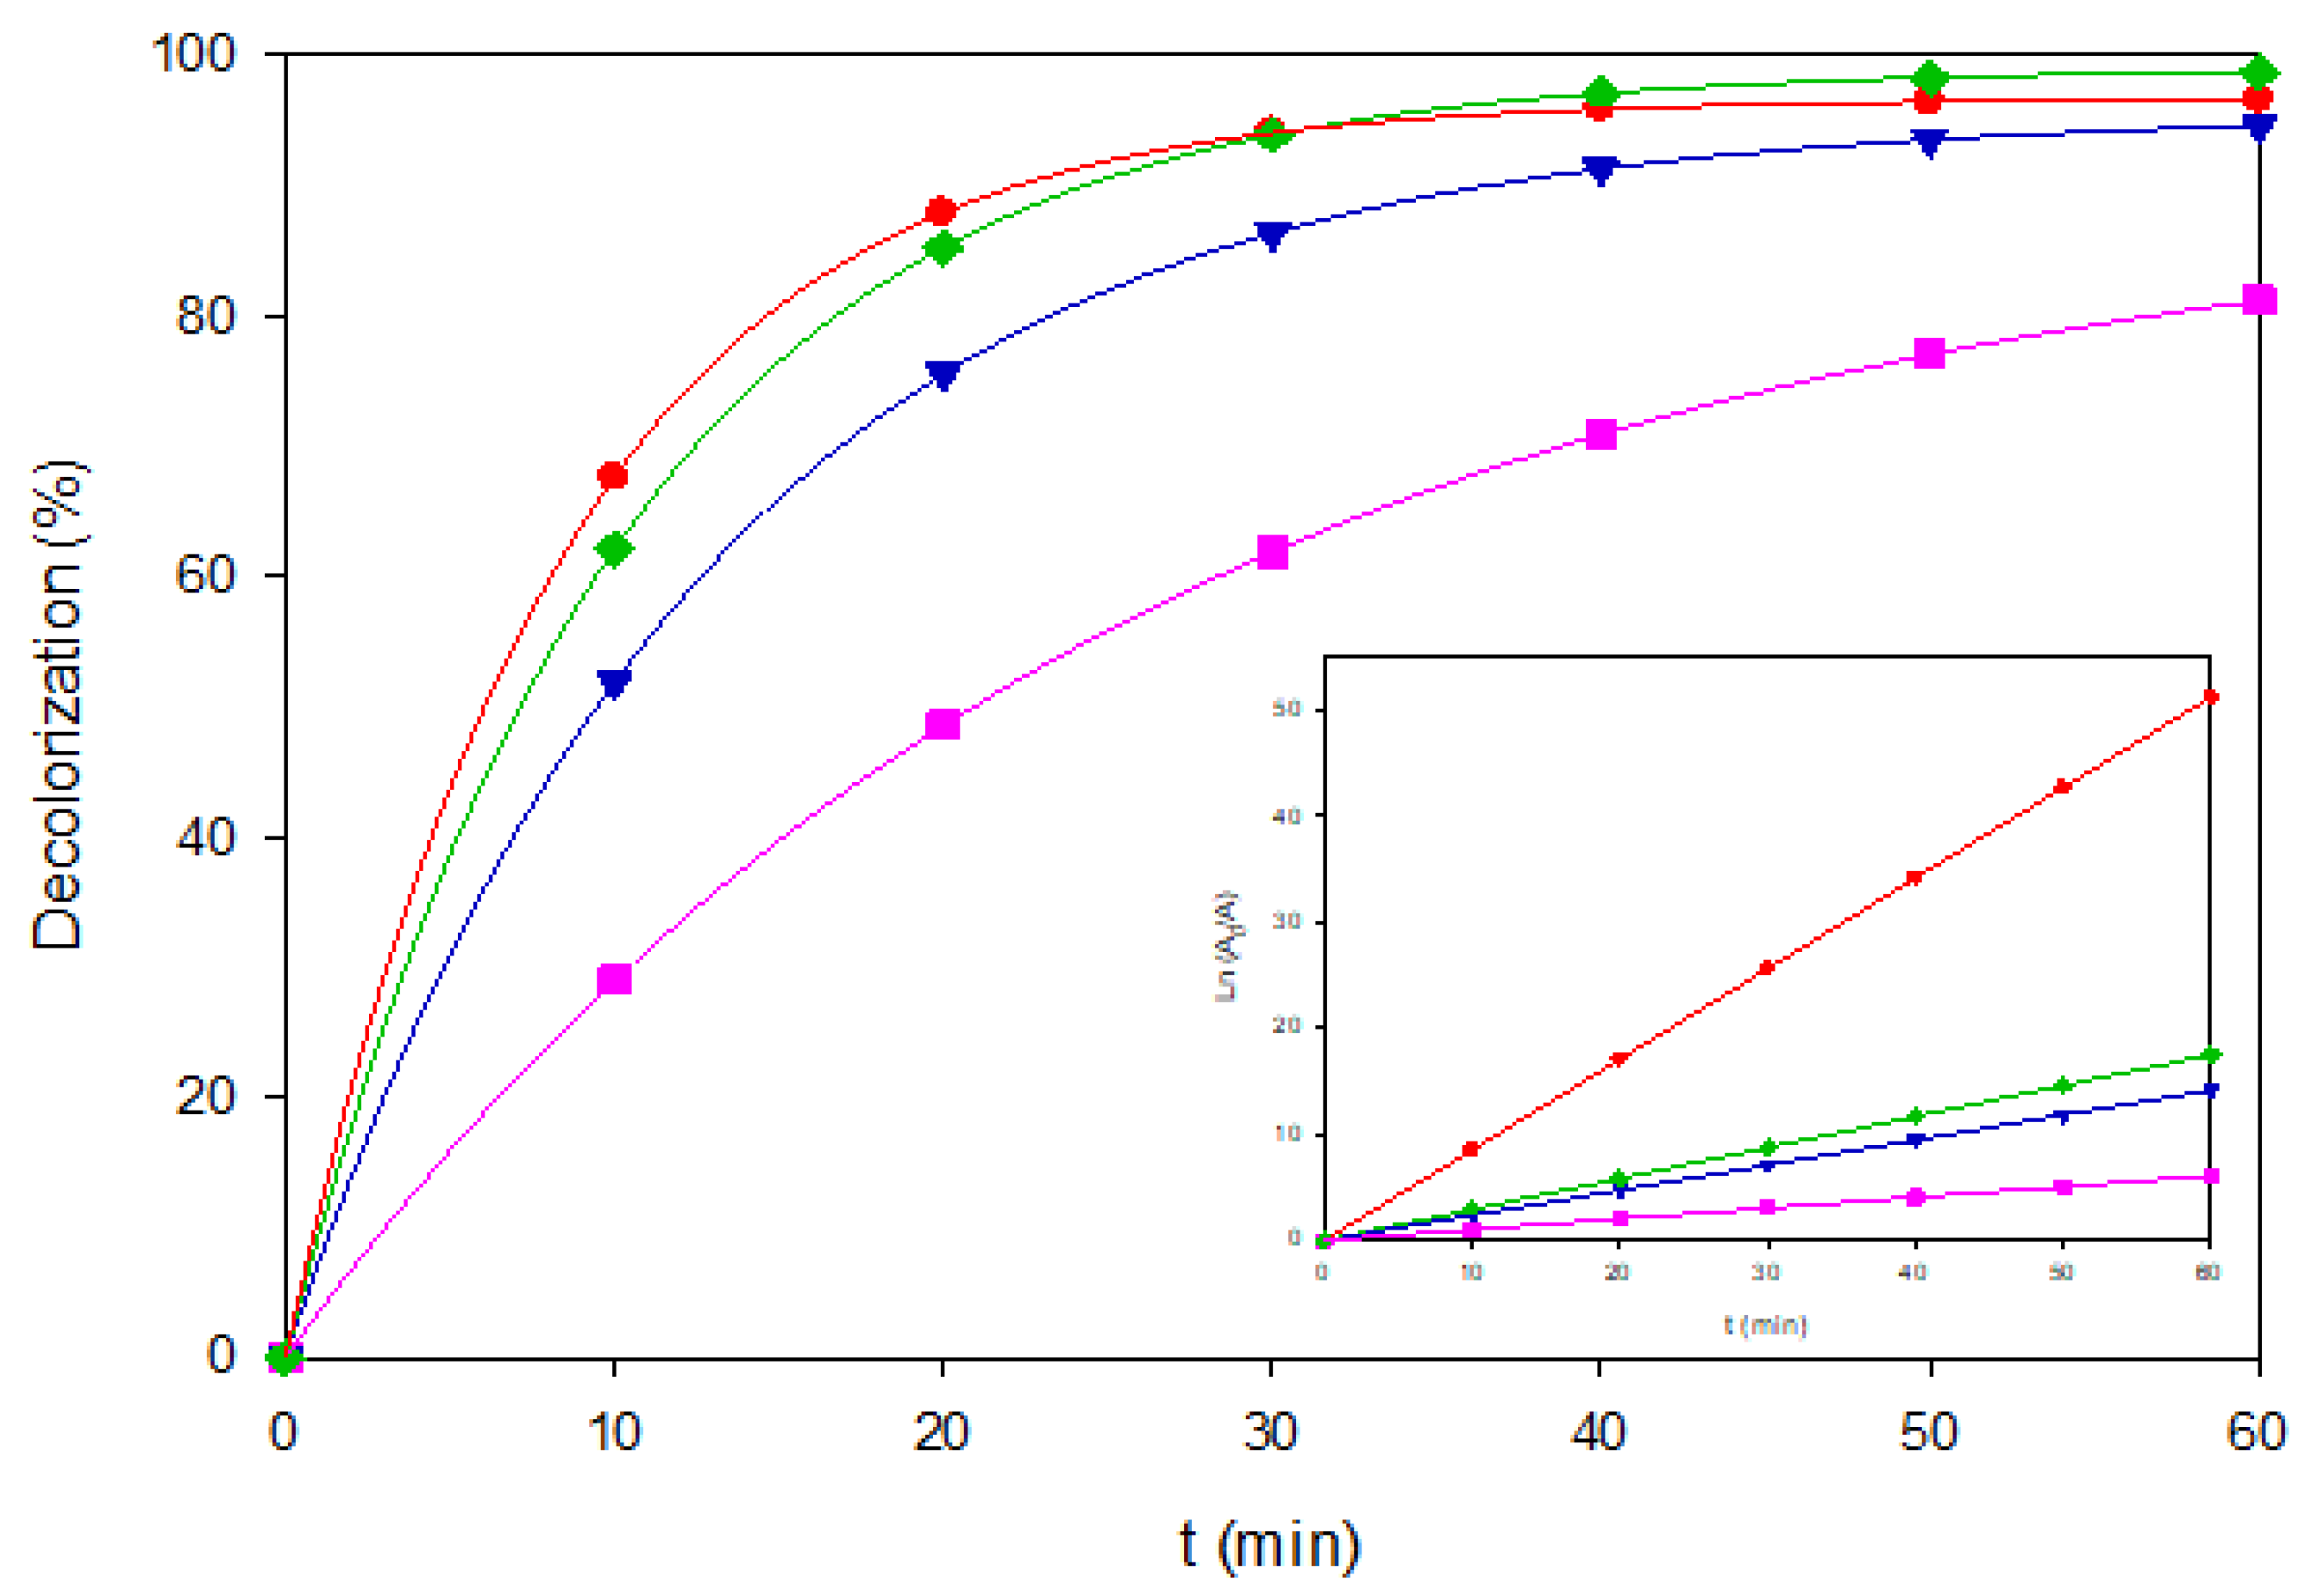
Figure 7.
COD removal of Blue VT under two representative EAOP conditions: (■) AO–MMO at 80 mg L−1 and 60 mA cm−2, and (●) EF–BDD at 40 mg L−1 and 60 mA cm−2.
Figure 7.
COD removal of Blue VT under two representative EAOP conditions: (■) AO–MMO at 80 mg L−1 and 60 mA cm−2, and (●) EF–BDD at 40 mg L−1 and 60 mA cm−2.
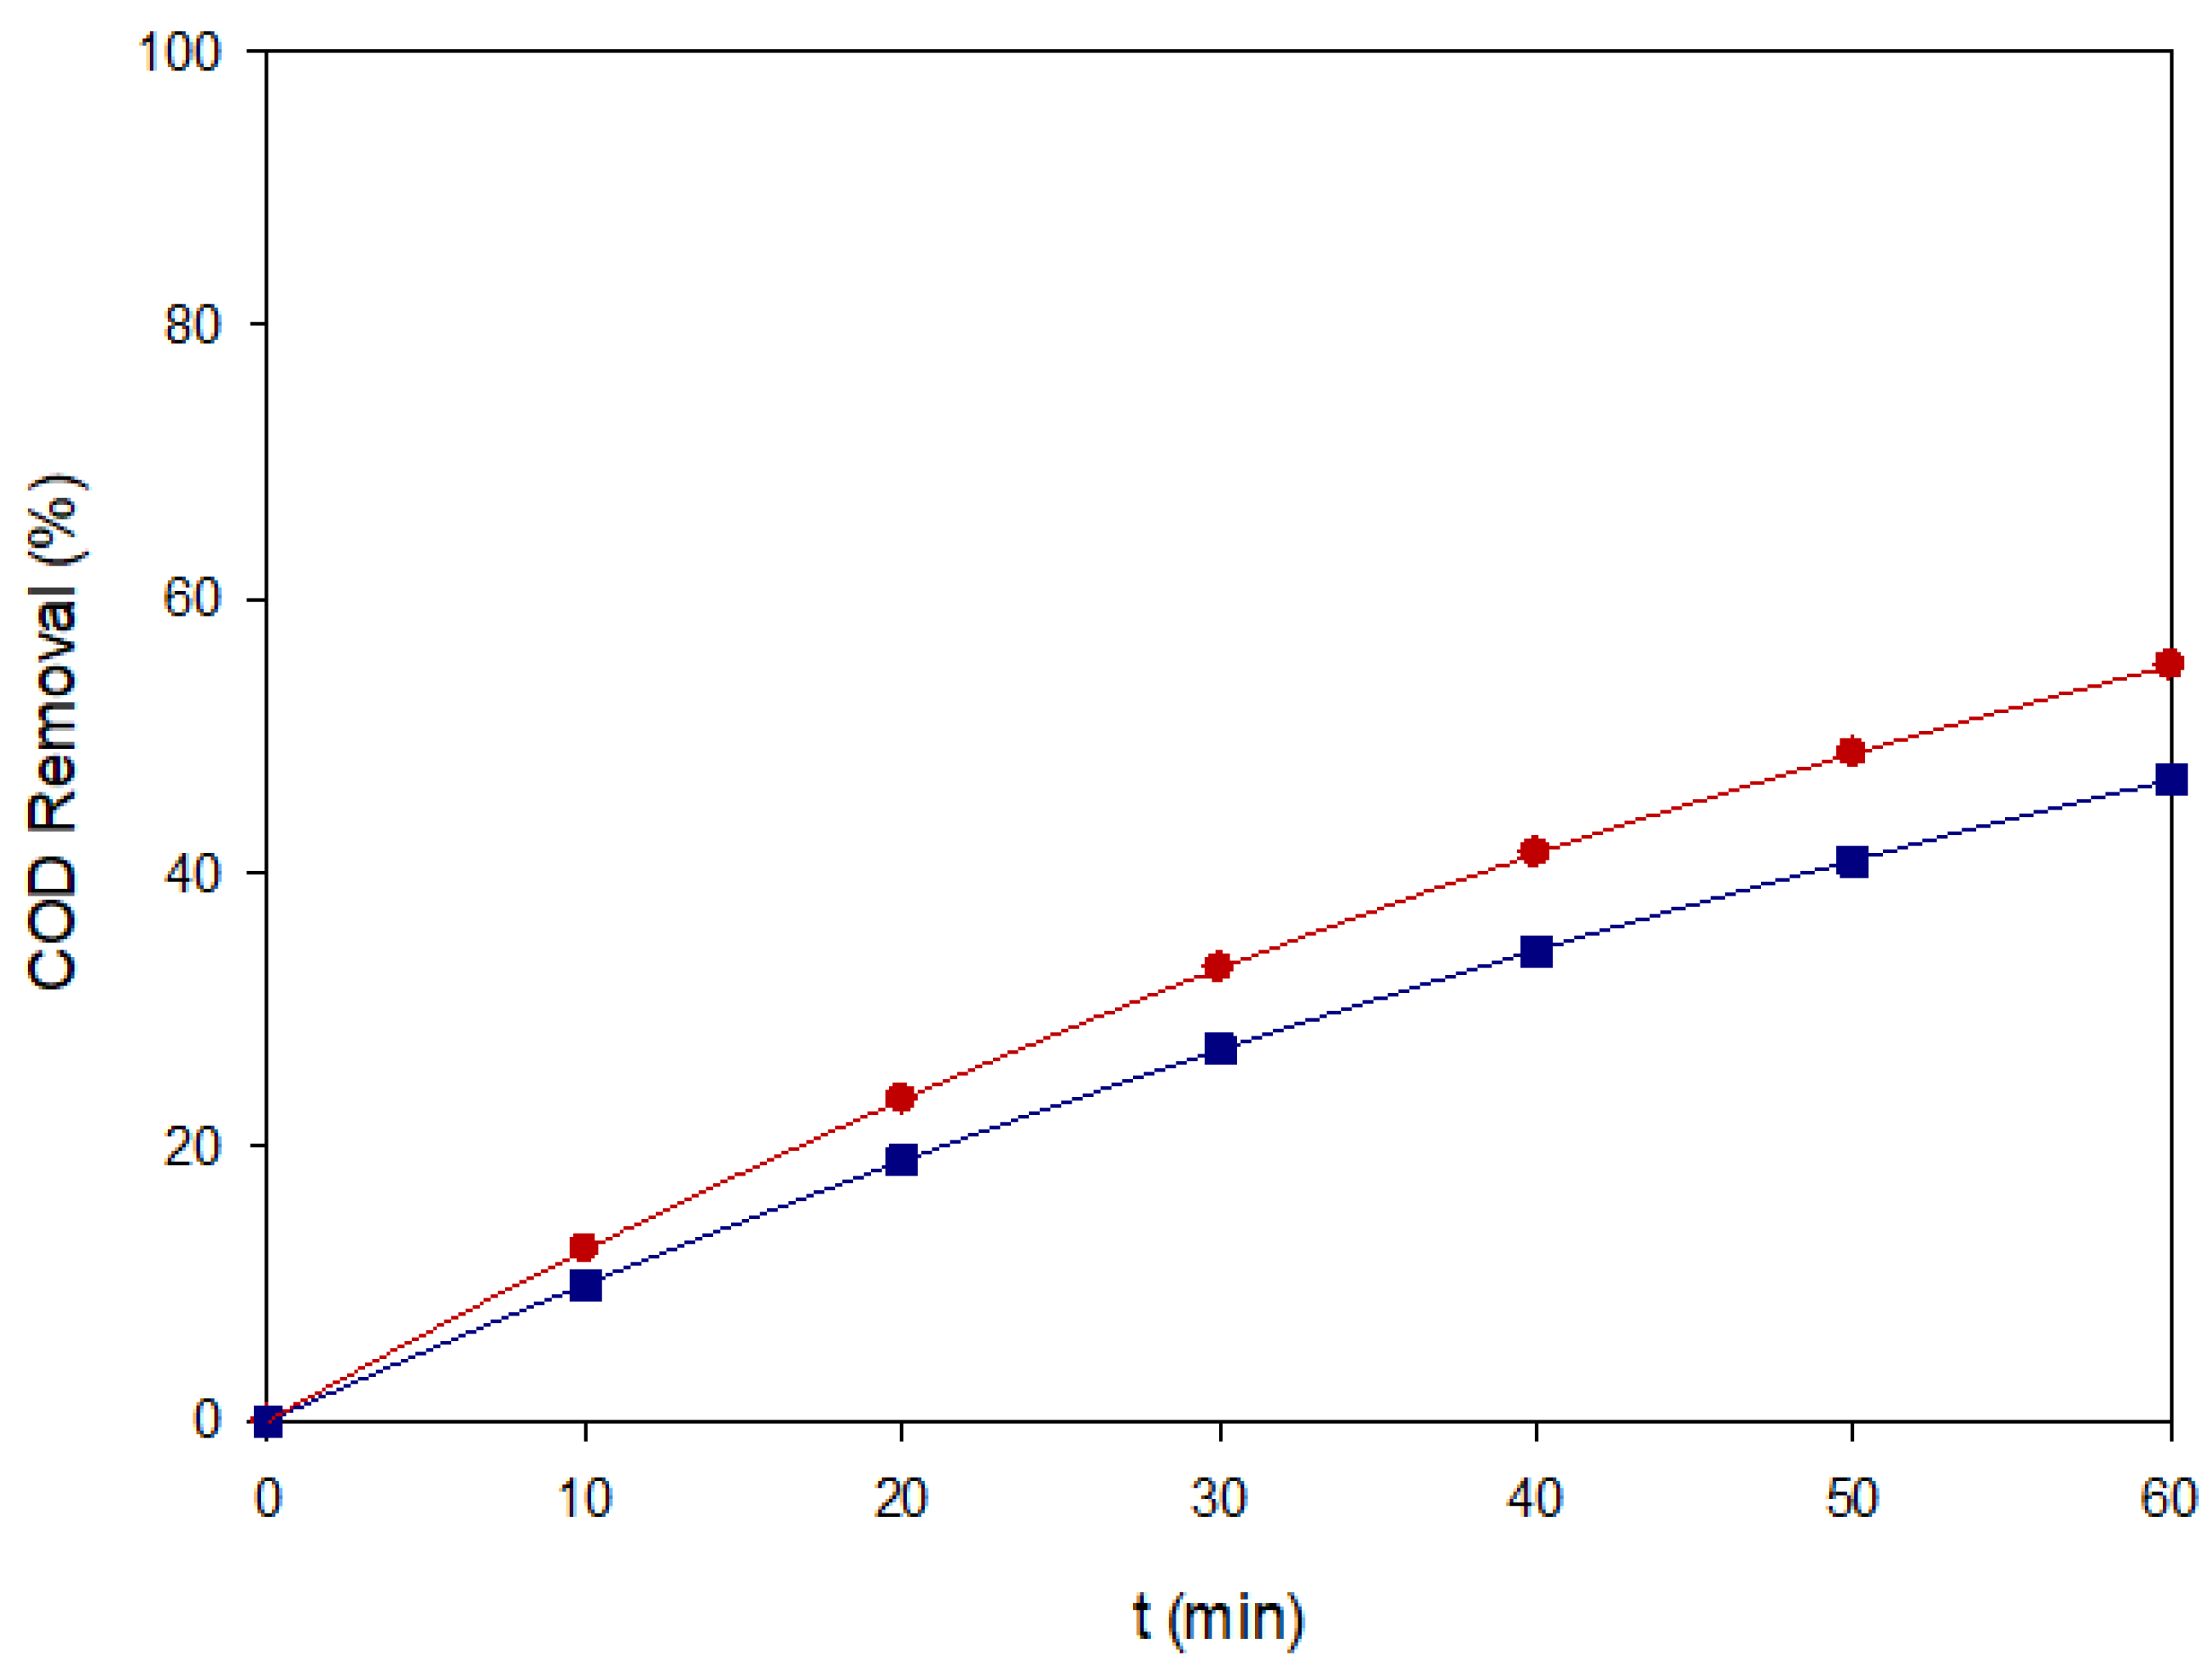
Figure 8.
Decolorization profiles of the ternary dye mixture (120 mg L−1, pH 3.0) treated by different EAOPs at 60 mA cm−2: AO-BDD (+), AO-MMO (◊), EF-BDD (♦), EF-MMO (▼), PEF-BDD (■), and PEF-MMO (●). The inset shows the corresponding Ln(A0/A) vs. time. Plots.
Figure 8.
Decolorization profiles of the ternary dye mixture (120 mg L−1, pH 3.0) treated by different EAOPs at 60 mA cm−2: AO-BDD (+), AO-MMO (◊), EF-BDD (♦), EF-MMO (▼), PEF-BDD (■), and PEF-MMO (●). The inset shows the corresponding Ln(A0/A) vs. time. Plots.
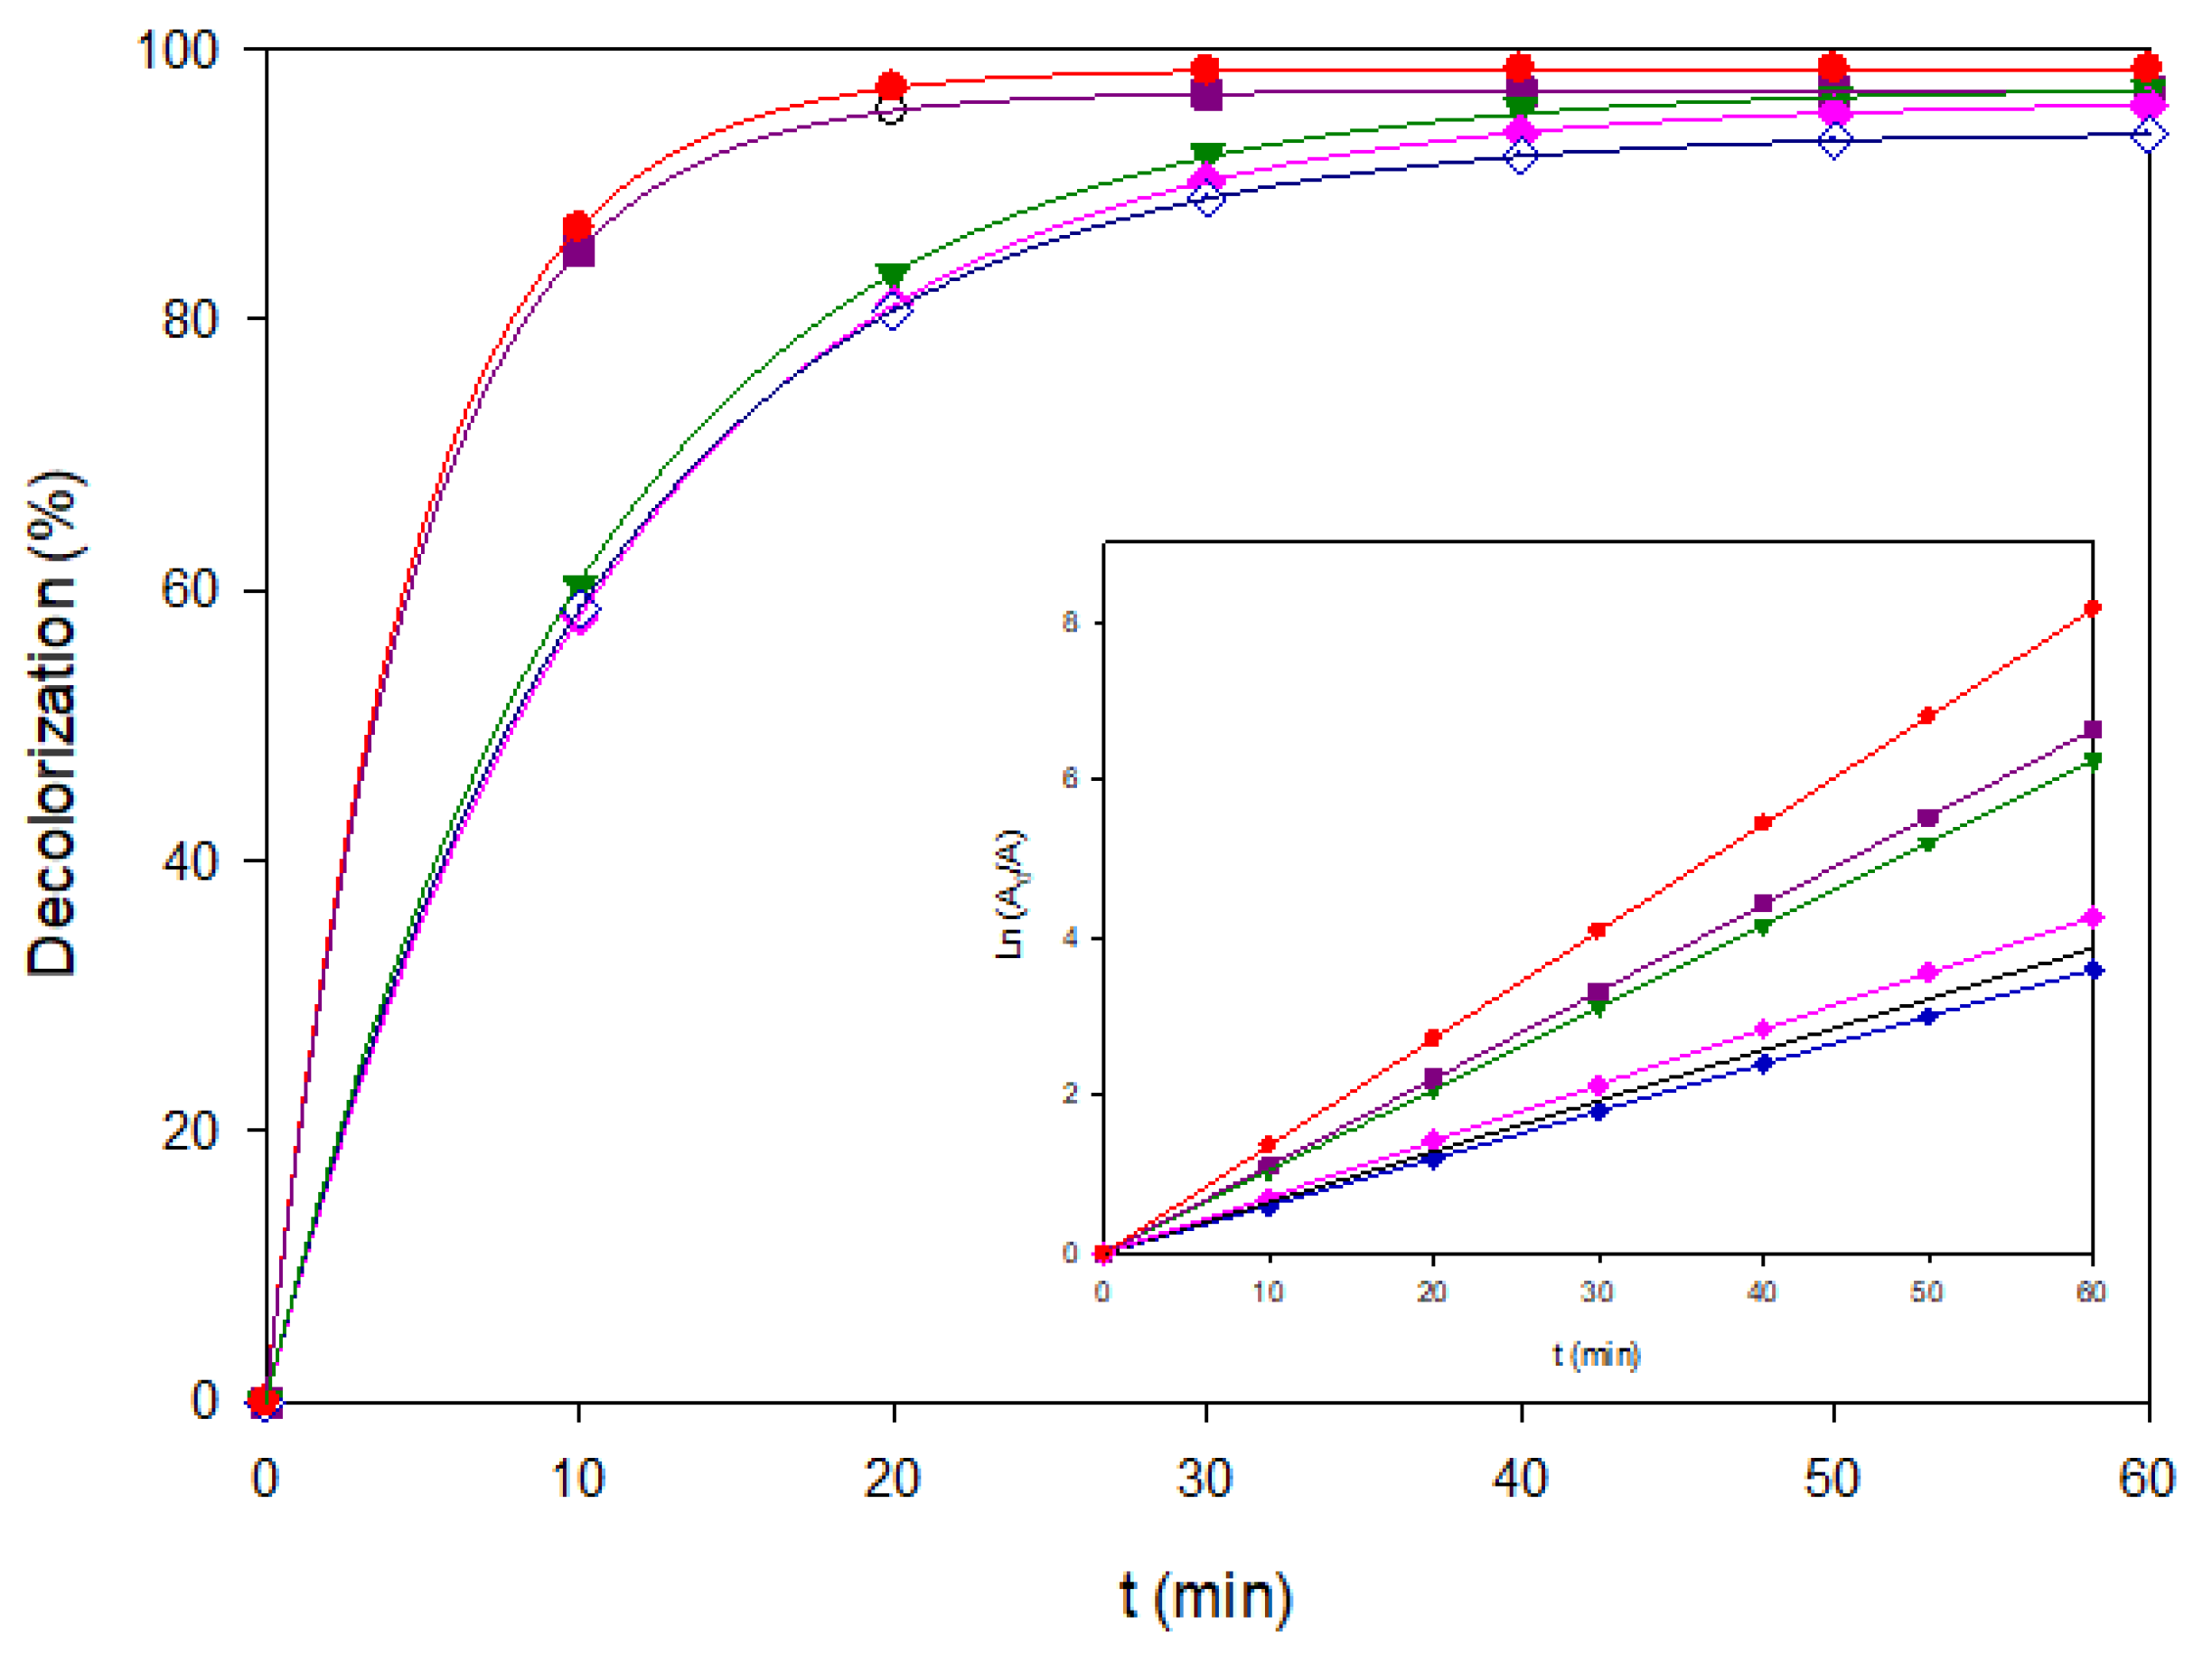
Figure 9.
COD removal of the ternary dye mixture (200 mg L−1, pH 3.0) under EF-BDD (■) and PEF-MMO (●) at 60 mA cm−2.
Figure 9.
COD removal of the ternary dye mixture (200 mg L−1, pH 3.0) under EF-BDD (■) and PEF-MMO (●) at 60 mA cm−2.
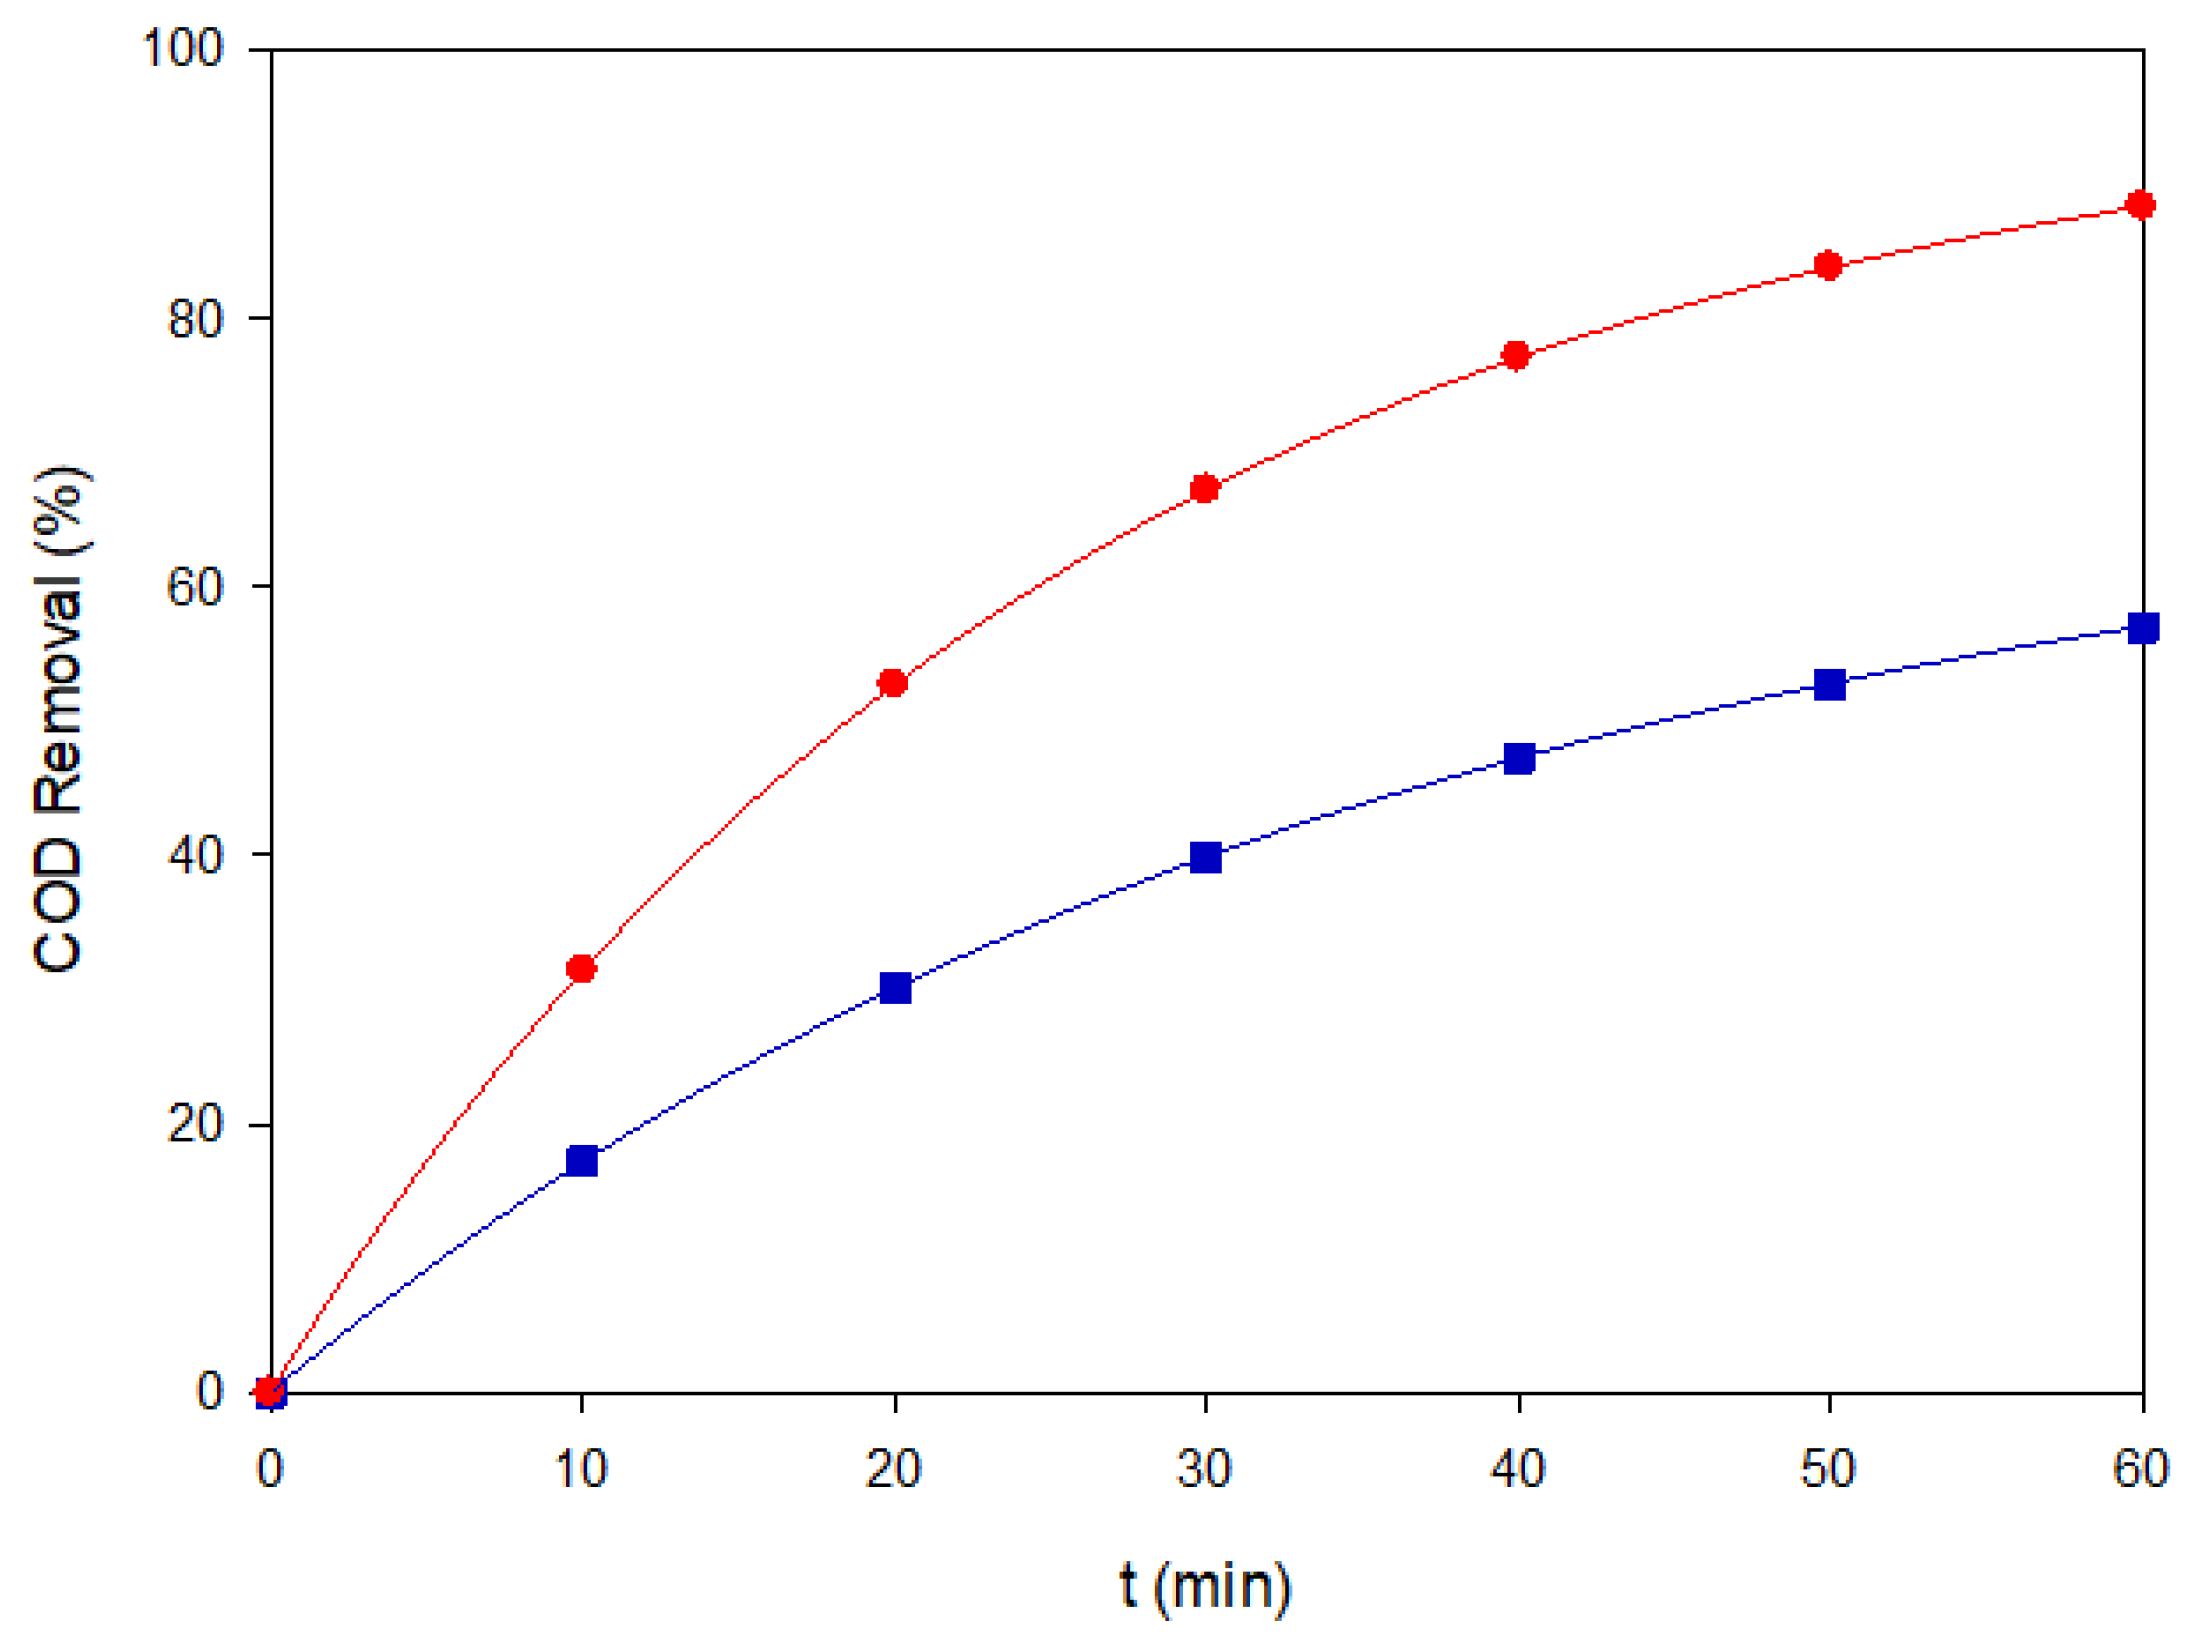
Figure 10.
Evolution of normalized energy consumption (ECCOD, kWh·gCOD−1) during the treatment of the ternary dye mixture (200 mg L−1, pH 3.0) by EF-BDD (■) and PEF-MMO (●) at 60 mA cm−2.
Figure 10.
Evolution of normalized energy consumption (ECCOD, kWh·gCOD−1) during the treatment of the ternary dye mixture (200 mg L−1, pH 3.0) by EF-BDD (■) and PEF-MMO (●) at 60 mA cm−2.
Disclaimer/Publisher’s Note: The statements, opinions and data contained in all publications are solely those of the individual author(s) and contributor(s) and not of MDPI and/or the editor(s). MDPI and/or the editor(s) disclaim responsibility for any injury to people or property resulting from any ideas, methods, instructions or products referred to in the content. |
© 2025 by the authors. Licensee MDPI, Basel, Switzerland. This article is an open access article distributed under the terms and conditions of the Creative Commons Attribution (CC BY) license (http://creativecommons.org/licenses/by/4.0/).
Copyright: This open access article is published under a Creative Commons CC BY 4.0 license, which permit the free download, distribution, and reuse, provided that the author and preprint are cited in any reuse.


