
Submitted:
25 September 2025
Posted:
26 September 2025
You are already at the latest version
Abstract
Disturbance gradients strongly influence biodiversity, stand structure, and regeneration dynamics in Shorea robusta (Sal) forests. This study provides the first empirical assessment of such impacts in Dharmapur National Park, Bangladesh, one of the last remaining Sal Forest remnants in the region. Despite its ecological importance, the disturbance ecology of Dharmapur has remained unexamined. To quantify disturbance effects, 105 plots (20 × 20 m) were established across low (LD), moderate (MD), and high disturbance (HD) categories, classified using a composite Disturbance Index. Within each plot, trees (DBH ≥ 5 cm), saplings, and seedlings were inventoried, and diversity, structure, regeneration, and community composition were analyzed using diversity indices, non metric multidimensional scaling (NMDS), and PERMANOVA. A total of 39 tree species (29 genera, 20 families) were recorded. Species richness declined from 35 species in LD plots to 17 in HD plots, while Shannon diversity decreased from 2.36 to 2.12 (p < 0.001). Basal area dropped from 25.7 to 13.4 m² ha⁻¹ and tree density from 802 to 397 individuals ha⁻¹ between LD and HD plots. Regeneration of S. robusta remained relatively strong, but late successional and shade tolerant associates declined sharply. NMDS ordination (stress = 0.14) revealed significant compositional turnover, with HD plots dominated by S. robusta and disturbance tolerant taxa. Overall, disturbance gradients in Dharmapur’s Sal forests reduce diversity, simplify structure, and constrain regeneration of non Sal species, emphasizing the urgent need for disturbance sensitive management and restoration strategies.
Keywords:
Shorea robusta
; Sal forest
; disturbance gradient
; biodiversity
; stand structure
; regeneration dynamics
; community composition
1. Introduction
Disturbances are fundamental drivers of forest ecosystem dynamics, influencing structure, composition, and function across spatial and temporal scales [1,2]. They may be natural—such as fire, storms, floods, droughts, and insect outbreaks—or anthropogenic, including logging, grazing, agricultural encroachment, and infrastructure development [3,4]. The disturbance regime—defined by its type, frequency, intensity, and spatial extent—plays a decisive role in shaping successional trajectories, species diversity, and regeneration processes [5,6]. In tropical and subtropical forests, where biodiversity is high and ecological interactions are complex, disturbance gradients often generate habitat mosaics that influence species coexistence, functional diversity, and ecosystem resilience [7,8].
The Intermediate Disturbance Hypothesis (IDH) predicts that species diversity peaks at intermediate disturbance levels, where competitive exclusion is reduced but environmental conditions remain suitable for a broad range of species [8,9]. Empirical studies in tropical forests confirm that low to moderate-disturbances can enhance structural heterogeneity and promote regeneration of both pioneer and shade-tolerant taxa [10,11]. Conversely, chronic or high-intensity disturbances often result in biodiversity loss, structural simplification, and impaired regeneration [12,13,14].
Shorea robusta Gaertn. f. (Sal) is a dominant, gregarious dipterocarp in tropical moist and dry deciduous forests of South and Southeast Asia, forming extensive monodominant stands from eastern Pakistan through India, Nepal, Bhutan, and Bangladesh to Myanmar [15,16]. Sal forests are ecologically significant for carbon storage, soil stabilization, and provision of habitat for diverse flora and fauna [17,18], and economically valued for durable timber, resin, and non-timber forest products [14]. In Bangladesh, Sal forests are concentrated in the central and northern districts, notably Madhupur and Bhawal, with smaller patches such as Dharmapur National Park. Recent work in Kadigarh National Park documented 87 species across 70 genera and 34 families [19], highlighting the ecological significance of relatively intact Sal Forest remnants. These forests lie within the Indo-Burma biodiversity hotspot, recognized for high species richness and endemism [20]. However, they face severe anthropogenic pressures, including illegal logging, fuelwood extraction, grazing, agricultural expansion, and settlement encroachment [13,21,22].
Disturbance gradients—from relatively undisturbed core zones to heavily impacted edges—are common in South Asian protected areas [3]. In less disturbed stands, Sal forests often exhibit multi-layered canopies, high basal area, and diverse age-class distributions, including large, old trees [23]. In contrast, heavily disturbed stands may be dominated by younger cohorts, reduced basal area, and lower canopy cover, often with increased prevalence of disturbance-tolerant or invasive species [13,21]. In the Madhupur Sal forests, species richness declined from 125 species in low-disturbance sites to only 19 in highly disturbed sites, with basal area and mature tree density decreasing along the gradient, while S. robusta’s relative abundance increased due to its coppicing ability and tolerance of canopy openings [13]. Similar patterns have been observed in northeastern India, where disturbance intensity shifted girth-class distributions toward smaller diameter classes [23].
Natural regeneration, through both seed and vegetative coppicing, is a key indicator of forest health and sustainability [22]. Moderate canopy openings can facilitate seedling establishment by increasing light availability, whereas excessive disturbance can damage seedlings, compact soils, and reduce seed sources [18,24]. Experimental evidence from Bangladesh further shows that seed germination and early growth are optimal under moderate shading but decline under both deep shade and full sunlight [25], underscoring the importance of canopy conditions for regeneration. In Bangladesh, S. robusta regeneration is often prolific in moderately disturbed sites but declines sharply in heavily degraded areas where seed trees are scarce and competition from invasive species is intense [21,22].
While disturbance impacts have been extensively studied in the larger Sal Forest tracts of Madhupur and Bhawal [13,21], no empirical studies have addressed Dharmapur National Park. Despite its smaller area, Dharmapur represents an important remnant of Sal Forest in northeastern Bangladesh, supporting significant biodiversity and providing ecosystem services to surrounding communities. Like other protected areas in the region, it faces pressures from illegal resource extraction, grazing, and encroachment. Understanding how disturbance gradients affect plant diversity, stand structure, and regeneration in Dharmapur is critical for evidence-based management.
This study addresses this knowledge gap by examining the effects of disturbance gradients on key ecological attributes of S. robusta forests in Dharmapur National Park. Specifically, it aims to:
- Quantify changes in plant species diversity by assessing variations in richness, composition, and diversity indices along the gradient;
- Evaluate stand structural attributes, including tree density, basal area, canopy cover, and diameter-class distribution; and
- Analyze natural regeneration through measurements of seedling and sapling densities of S. robusta and associated species.
By integrating floristic, structural, and regeneration data, this research provides a comprehensive assessment of disturbance impacts, contributing to a deeper understanding of disturbance ecology in tropical monodominant forests and informing conservation and restoration strategies for Sal forests in Bangladesh and beyond.
2. Materials and Methods
2.1. Study Area
This study was conducted in Dharmapur National Park, located in Biral Upazila, Dinajpur District, northern Bangladesh (25°32′23″ N, 88°32′52″ E) [26]. The Park covers 704.70 ha and contains one of the last remaining patches of Shorea robusta Gaertn. f. (Sal) forest in the region (Figure 1). The climate is tropical monsoon, with a mean annual temperature of approximately 29 °C and an average annual rainfall of about 2,200 mm, most of which occurs between June and September (Figure 2). The upland soils of Dinajpur are predominantly silty clay loams derived from Pleistocene terrace sediments of the Barind Tract. These soils are moderately acidic (pH 5.5–6.0) and relatively low in organic matter, with properties comparable to those found in other Sal Forest habitats in northern Bangladesh.
The vegetation is dominated by S. robusta, accompanied by Lannea coromandelica (Jika), Ardisia solanacea (Bonjam), and Cassia fistula (Sonalu), with an understory of shrubs such as (Datmajani) Glycosmis pentaphylla (Retz.) DC., (Sarpagandha) Rauvolfia serpentina (L.) Benth. ex Kurz, (Kalkasunda) Senna occidentalis (L.) Link, and (Anaigota) Ziziphus xylopyrus (Retz.) Willd. Climbing plants include (Makal) Trichosanthes tricuspidata Lour., (Akundi) Stephania japonica (Thunb.) Miers, (Kumarilata) Smilax ovalifolia Roxb. ex D.Don, (Jhumka Lata) Passiflora foetida L., and (Ishwarmul) Aristolochia indica L. Dharmapur National Park experiences varying degrees of anthropogenic disturbance, including fuelwood collection, livestock grazing, illicit felling, and agricultural encroachment. These pressures create a distinct disturbance gradient, ranging from relatively undisturbed core zones to heavily impacted forest edges.
2.2. Disturbance Gradient Classification
Forest stands were classified into three disturbance categories following established protocols for South Asian Sal (Shorea robusta) forests [13,21,27]. Low-Disturbance (LD) sites were characterized by minimal human access, intact canopy cover, and little evidence of recent logging or grazing. Moderate-Disturbance (MD) sites exhibited selective tree removal, occasional grazing, and moderate canopy openings. High-Disturbance (HD) sites were subject to frequent human activity, high canopy openness, visible stumps, and signs of fuelwood extraction. Disturbance factors within each study plot were identified using a semi-structured, close-ended questionnaire administered to local stakeholders, combined with direct field surveys [28,29]. Based on these data, nine disturbance factors were documented: grazing, cut stump density, canopy cover, fuelwood collection, non-timber forest products (NTFPs) collection, litter collection, forest fire, settlement distance, and road distance that was calculated as:
| Grazing intensity (%) | = | Biomass of forage consumed | × 100 | ||||||||||||||||||||||||
| Total biomass of available forage | |||||||||||||||||||||||||||
| Cut stumps (%) | = | Basal area of cut stumps | × 100 | ||||||||||||||||||||||||
| Total BA (cut stump + standing) | |||||||||||||||||||||||||||
| Tree canopy cover openness (%) | = | Area not covered by canopy | × 100 | ||||||||||||||||||||||||
| Total plot area | |||||||||||||||||||||||||||
| Fuelwood collection (%) | = | Biomass of fuelwood removed | × 100 | ||||||||||||||||||||||||
| Total biomass (fuelwood + standing) | |||||||||||||||||||||||||||
| NTFPs collection (%) | = | NTFPs disturbance area | × 100 | ||||||||||||||||||||||||
| Total study area | |||||||||||||||||||||||||||
| Litter collection (%) | = | Weight of collected litter | × 100 | ||||||||||||||||||||||||
| Total weight of litter in the area | |||||||||||||||||||||||||||
| Forest fire (%) | = | Area of burred | × 100 | ||||||||||||||||||||||||
| Total area | |||||||||||||||||||||||||||
| Settlement distance (%) | = | 1 - | Distance from the settlement | × 100 | |||||||||||||||||||||||
| Max distance – Min distance | |||||||||||||||||||||||||||
| Road distance (%) | = | 1 - | Distance from the road | × 100 | |||||||||||||||||||||||
| Max distance – Min distance | |||||||||||||||||||||||||||
Grazing was defined as the removal of plant biomass by herbivorous animals and was assessed in terms of grazer abundance, biomass removal intensity, and grazing frequency, with grazing intensity classified as low (0–25%), moderate (25–50%), or high (>50%) to evaluate herbivore pressure and its ecological impacts [30]. Cut stump density was calculated as the number of cut stems per unit area divided by the total stem density, expressed as a percentage, and categorized as low (0–7%), moderate (8–14%), or high (>14%). Tree canopy cover openness (%) was calculated as the percentage of ground area covered by tree canopy and classified as low (66–100%), moderate (40–65%), or high (<40%) [28]. Fuelwood collection was evaluated based on the quantity removed, collection frequency, and number of collectors, and was classified as low (0–2%), moderate (2–5%), or high (>5%). Non-timber forest products (NTFPs) collection was assessed by calculating the percentage of harvested material and measuring litter removal in affected areas, with thresholds of low (0–15%), moderate (15–30%), and high (>30%). Litter collection was quantified as the total mass, or volume where weighing was not feasible, of material removed from the plot and was classified using the same thresholds as NTFPs collection. Forest fire disturbance was evaluated based on the proportion of area affected and fire frequency, and classified as low (0–20%), moderate (20–50%), or high (>50%). Finally, distance from human settlements and roads was measured as the minimum distance from each plot to the nearest road or settlement (range: 50–800 m) and categorized as low (0–33%), moderate (33–66%), or high (>66%).
Each disturbance factor was assigned a categorical score: 1 for low, 2 for moderate, and 3 for high, based on percentage thresholds adapted from Shankar [31] and Chapagain [27]. Scores for all disturbance factors in a plot were summed to obtain a cumulative value, expressed as the Disturbance Index (DI, %), representing the overall disturbance level of the plot.
| Disturbance Index (%) | = | Cumulative score of disturbance factors of a plot | × 100 |
| Maximum disturbance score of a plot |
Plots were then categorized into three disturbance intensity gradients based on DI values: least disturbed (LD, 0–40%), moderately disturbed (MD, 41–60%), and highly disturbed (HD, >60%). The workflow of this assessment, from field data collection to final classification of plots, is illustrated in Figure 3.
2.3. Sampling Design
A stratified systematic sampling approach was used to examine ecological variation across the disturbance gradient, following best-practice recommendations for ecological field surveys in heterogeneous landscapes [32,33]. The Park was divided into three strata—low, medium, and high-disturbance—based on vegetation cover and human activity indicators. Within each stratum, the first plot location was randomly selected, and subsequent plots were placed at fixed intervals to ensure even spatial coverage. Plot allocation was proportional to the area of each disturbance category, enabling balanced representation and robust statistical comparison. This sampling intensity (~0.6% of the park area) is consistent with tropical forest inventory standards [34].
In total, 105 plots (35 per disturbance category) were established, each measuring 20 m × 20 m (0.04 ha), resulting in a cumulative sampled area of 4.2 ha. Plot size followed standard tropical forest inventory protocols designed to balance efficiency and representativeness [34,35]. Each plot was subdivided into nested subplots for different vegetation layers: the tree layer (all woody stems ≥ 5 cm DBH, measured at 1.3 m), the sapling layer (woody stems 1–4.9 cm DBH, recorded in a central 5 m × 5 m subplot), and the seedling layer (woody stems < 1 cm DBH and ≥ 30 cm height, counted in four 1 m × 1 m quadrats placed at the plot corners).
2.4. Vegetation Data Collection
Species identification was conducted in the field using the Encyclopedia of Flora and Fauna of Bangladesh [36] and subsequently verified against herbarium specimens housed at the Bangladesh National Herbarium. Plant nomenclature was standardized according to The Plant List [37], ensuring that all species names and author citations conformed to currently accepted taxonomic classifications.
For each tree, diameter at breast height (DBH, measured at 1.3 m above ground) and total height were recorded. Stand structural attributes included tree density (individuals ha−1), basal area (m2 ha−1), diameter class distribution (5 cm intervals), and canopy cover (%). Canopy cover was estimated using a convex spherical densiometer following Lemmon [38] and Jennings et al. [39]. Basal area was derived from DBH, and DBH-based allometric approaches have been widely applied in Bangladesh to estimate leaf area and biomass [41,42], underscoring the reliability of these parameters for evaluating forest structure and function.
Phytosociological parameters — density, basal area, frequency, relative density (RD), relative frequency (RF), relative basal area (RBA), and Importance Value Index (IVI) were calculated following Curtis and McIntosh [43], Misra [44], Curtis [45], Xue et al. [46]. Species contributing cumulatively to 50% of the total IVI at a site were classified as dominant, while the remainder were considered associates.
| Density (%) | = | Number of individuals of a species in all quadrats | × 100 | |||||||||||||||||
| Total number of quadrats | ||||||||||||||||||||
| Basal area (m2) | = | π | DBH 2 | |||||||||||||||||
| 4 | ||||||||||||||||||||
| Frequency (%) | = | Number of quadrats in which the species occurs | × 100 | |||||||||||||||||
| Total number of quadrats | ||||||||||||||||||||
| Relative frequency (RF%) | = | Number of occurrences of a species | × 100 | |||||||||||||||||
| Number of occurrences of all the species | ||||||||||||||||||||
| Relative density (RD%) | = | Number of individuals of a species | × 100 | |||||||||||||||||
| Number of individuals of all the species | ||||||||||||||||||||
| Relative basal area (RBA%) | = | Basal area of a species | × 100 | |||||||||||||||||
| Total basal area of all species | ||||||||||||||||||||
IVI = RD + RF + RBA
Diameter class distributions were constructed to assess stand structure and regeneration status. The distribution of stems across DBH classes was compared with the expected inverse-J pattern typical of regenerating tropical forests. Statistical distributions such as normal, log-normal, and Weibull have been shown to effectively model diameter and height structures in tropical plantations [47], providing a robust framework for interpreting stand dynamics under varying disturbance intensities.
2.5. Diversity Indices
Plant diversity was quantified using species richness (S), the Shannon–Wiener diversity index (H′), Pielou’s evenness index (J′), and Simpson’s dominance index (D), following Magurran [48] and recent forestry applications (e.g., Mansingh et al. [49]). These indices were calculated separately for trees, saplings, and seedlings to assess diversity patterns across life stages.
2.6. Natural Regeneration Assessment
Regeneration status of S. robusta and associated species was evaluated using Shankar’s [31] criteria: good regeneration (seedlings > saplings > adults), fair regeneration (seedlings ≥ saplings ≤ adults), poor regeneration (only saplings present), and no regeneration (absence of seedlings and saplings). Seedling and sapling densities were compared across disturbance categories to assess regeneration potential, following approaches used in recent tropical forest regeneration studies [22,24].
2.7. Data Analysis
All data were tested for normality using the Shapiro–Wilk test and for homogeneity of variances using Levene’s test. Differences in diversity indices, stand structure, and regeneration among disturbance categories were analyzed using one-way ANOVA, followed by Tukey’s HSD post hoc test [50]. When assumptions of parametric tests were not met, non-parametric Kruskal–Wallis tests were applied.
Relationships between the Disturbance Index (DI) and diversity or structural variables were examined using Pearson’s correlation and simple linear regression. Multivariate patterns in species composition were explored using non-metric multidimensional scaling (NMDS) with Bray–Curtis dissimilarity. NMDS was selected because it was a rank-based ordination method well suited to zero-inflated, non-normal ecological data and did not assume linear relationships. Differences in species composition among disturbance categories were tested using PERMANOVA (permutational multivariate analysis of variance), a non-parametric, distance-based approach appropriate for multivariate ecological datasets that provided both significance testing and effect size estimates [51]. All statistical analyses were conducted in R version 4.5.1 [52] using the vegan package [53].
3. Results
3.1. Disturbance Index and Contributing Factors
The composite Disturbance Index (DI) varied markedly across forest categories, confirming clear gradients of anthropogenic pressure in Dharmapur National Park (Table 1). DI values increased from 33.3% in low-disturbance (LD) plots to 51.8% in moderate-disturbance (MD) plots and 77.7% in high-disturbance (HD) plots. Among disturbance factors, grazing, cut stump density, and proximity to settlements and roads contributed most strongly to the DI, with their relative influence intensifying along the gradient. For example, grazing accounted for 17.6% of the DI in LD plots but rose to 45.7% in HD plots, while canopy cover reduction declined sharply from 74.3% in LD to only 31.6% in HD plots. Similarly, fuelwood and non-timber forest product (NTFP) collection, litter removal, and fire incidence were disproportionately higher in MD and HD plots compared to LD plots. These patterns confirm that HD plots are subject to multiple overlapping pressures, particularly grazing, fuelwood extraction, and proximity to human settlements and roads, which collectively drive structural simplification and biodiversity loss.
3.2. Species Richness and Composition
Species richness and diversity declined significantly along the disturbance gradient (Table 2). Low-disturbance (LD) plots supported the highest richness, with 35 species, followed by moderate-disturbance (MD) plots with 25 species, while high-disturbance (HD) plots contained only 17 species. Diversity indices showed a similar trend, with Shannon–Wiener values and Simpson’s dominance decreasing from LD to HD, confirming a progressive erosion of diversity under increasing disturbance pressure (Table 2).
Across all disturbance categories, a total of 39 tree species, representing 29 genera and 20 families, were recorded in Dharmapur National Park (Table 3). The composition of species varied markedly across the gradient. LD plots were characterized by diverse assemblages of late-successional and shade-tolerant species such as Terminalia bellirica, Dillenia indica, and Dipterocarpus turbinatus, alongside the dominant Shorea robusta. In contrast, HD plots were dominated by S. robusta and disturbance-tolerant species such as Lagerstroemia indica, with many shade-tolerant associates absent. Several species, including Elaeocarpus serratus and Semecarpus anacardium, were restricted to LD plots, indicating their sensitivity to disturbance. MD plots retained a transitional composition, with a mixture of both late-successional and disturbance-tolerant taxa, reflecting intermediate ecological conditions.
3.3. Diversity Indices
Diversity indices exhibited consistent and statistically significant changes along the disturbance gradient (Table 2). The Shannon–Wiener index (H′) declined from 2.36 ± 0.07 in LD plots to 2.24 ± 0.05 in MD plots and 2.12 ± 0.05 in HD plots (F = 4.25, p < 0.001), indicating a progressive loss of species diversity with increasing disturbance. In contrast, Pielou’s evenness (J′) increased slightly from 0.31 ± 0.02 in LD plots to 0.38 ± 0.01 in HD plots (F = 17.12, p = 0.006), suggesting that as overall richness declined, the remaining species were more evenly distributed, though largely dominated by disturbance-adapted taxa. Similarly, Simpson’s dominance index (D) decreased from 0.24 ± 0.01 in LD plots to 0.15 ± 0.02 in HD plots (F = 3.78, p = 0.001), reflecting the reduced contribution of rare species and the increasing prevalence of a few tolerant species. Collectively, these indices confirm that disturbance intensity eroded both richness and diversity while simultaneously homogenizing species composition across the forest stands.
3.4. Stand Structure
Stand structural attributes varied significantly along the disturbance gradient (Table 2). LD plots exhibited the highest mean tree density (802 ± 86 individuals ha−1) and basal area (25.7 ± 3.8 m2 ha−1), followed by MD plots (585 ± 61 individuals ha−1; 18.6 ± 2.1 m2 ha−1), while HD plots recorded the lowest values (397 ± 36 individuals ha−1; 13.4 ± 1.8 m2 ha−1; F = 48.42, p < 0.001; Figure 4). Diameter class distributions further highlighted these differences: LD plots displayed a clear inverse-J pattern, indicative of continuous recruitment across size classes (Figure 5). MD plots showed a transitional structure, with a noticeable reduction in the representation of large stems (> 50 cm DBH). In contrast, HD plots were heavily skewed toward smaller stems (< 20 cm DBH), reflecting recent harvesting, canopy opening, and limited recruitment into mature size classes. The scarcity of large trees in HD plots suggests selective removal of high-value timber species, contributing to structural simplification under high-disturbance pressure.
3.5. Relationships Between Disturbance Index and Forest Attributes
The Disturbance Index (DI) was correlated with key diversity and structural variables. Pearson’s correlation analysis revealed significant negative relationships between DI and species richness (r = –0.53, p < 0.001), Shannon–Wiener index (H′) (r = –0.72, p < 0.001), basal area (r = –0.42, p < 0.001), and tree density (r = –0.53, p < 0.001). In contrast, DI showed a positive correlation with Pielou’s evenness (r = 0.34, p < 0.05), indicating that as disturbance increased, species assemblages became more evenly distributed but were dominated by disturbance-tolerant taxa.
Simple linear regression models further confirmed these trends, with DI explaining 57% of the variation in Shannon–Wiener index (H′) (R2 = 0.57, p < 0.001) in Figure 6 and 41% of the variation in tree density (R2 = 0.41, p < 0.001), respectively. These results demonstrate that increasing disturbance intensity is a strong predictor of reduced richness and structural simplification in Dharmapur National Park.
3.6. Regeneration
Natural regeneration of S. robusta and associated species varied markedly across the disturbance gradient (Table 3). In LD plots, regeneration was healthy, with abundant seedlings and saplings of S. robusta as well as co-dominant species such as T. bellirica and Neolamarckia cadamba. MD plots exhibited reduced regeneration of non-Sal species, although S. robusta remained relatively well represented. In contrast, HD plots showed the lowest regeneration overall, with S. robusta seedlings and saplings persisting but most associated species absent. Seedling densities were highest in LD plots and lowest in HD plots, while sapling densities were suppressed in HD plots but remained relatively high in both LD and MD plots (Figure 7). Regeneration status, assessed for all tree species (Figure 8) and for dominant species (Figure 9), confirmed this gradient: LD plots exhibited good regeneration, characterized by the sequence seedlings > saplings > adults; MD plots showed fair regeneration, with seedlings ≥ saplings ≤ adults; and HD plots displayed poor regeneration, with few seedlings and saplings, mostly of S. robusta. This pattern indicates that while S. robusta regeneration remained relatively resilient under disturbance, the regeneration of associated species was severely constrained at higher disturbance intensities.
3.7. Community Similarity and Composition
Pairwise similarity indices (Table 4) revealed substantial compositional turnover along the disturbance gradient. Jaccard similarity between LD and HD plots was 0.69, while Bray–Curtis similarity was 0.82, both lower than the corresponding LD–MD comparisons (0.75 and 0.87, respectively). Non-metric multidimensional scaling (NMDS) ordination (stress = 0.14) further illustrated these differences, clearly separating plots along the disturbance gradient (Figure 10). LD plots clustered tightly and were characterized by diverse assemblages including late-successional species, whereas HD plots formed a distinct cluster dominated by S. robusta and other disturbance-tolerant taxa. MD plots overlapped partially with both LD and HD, reflecting their transitional composition. Results of PERMANOVA confirmed that species composition differed significantly among disturbance categories (p < 0.01), underscoring the strong influence of disturbance intensity on community assembly patterns.
4. Discussion
This study demonstrates that disturbance gradients in Dharmapur National Park exert strong influences on tree species diversity, stand structure, and regeneration dynamics in Shorea robusta forests. The significant decline in species richness and diversity indices with increasing disturbance intensity is consistent with findings from other South Asian Sal forests. In the Madhupur Sal forests of Bangladesh, Rahman et al. [13] reported a sharp reduction in species richness from 125 species in low-disturbance sites to only 19 in highly disturbed sites. Similarly, Chapagain et al. [27] found that Nepalese Sal forests under protected regimes maintained higher species richness and basal area compared to community-managed forests exposed to greater disturbance. Beyond species counts, tree diversity has also been shown to enhance forest productivity in Bangladesh’s central region [54], suggesting that the erosion of diversity observed in Dharmapur may not only reduce ecological resilience but also compromise long-term productivity. These parallels and contrasts indicate that Dharmapur’s forests are following a broader regional trajectory of biodiversity and functional loss under chronic anthropogenic pressure.
4.1. Stand Structure and Forest Dynamics
The structural simplification observed in Dharmapur, with tree density and basal area declining from LD to HD plots, mirrors patterns reported in northeastern India and Nepal. Rabha [23] documented that disturbance shifted girth-class distributions toward smaller stems in Sal forests of Assam, while Behera et al. [55] observed similar reductions in basal area and canopy cover in the Eastern Ghats under human disturbance. The inverse-J diameter distribution observed in LD plots of Dharmapur indicates continuous recruitment, but the skew toward small stems in HD plots reflects selective logging and canopy opening. Hossain et al. [21] similarly noted that chronic fuelwood extraction and grazing in Bangladesh’s central Sal forests reduced basal area and disrupted natural stand dynamics. Such structural erosion compromises ecosystem functions, including carbon storage and habitat provision [6].
4.2. Regeneration Dynamics
Regeneration analyses highlight the resilience of S. robusta but the vulnerability of associated species. While S. robusta seedlings and saplings persisted across all disturbance categories, co-dominants such as Terminalia bellirica and Neolamarckia cadamba declined sharply in MD and HD plots. This aligns with Shankar’s [31] regeneration framework and with recent findings from Jubair et al. [22], who reported that regeneration of non-Sal species in Bangladesh was severely constrained under chronic disturbance. In Nepal, Gautam and Mandal [56] similarly found that disturbance reduced regeneration of shade-tolerant associates, while S. robusta maintained dominance due to its coppicing ability and tolerance of canopy openings. Sharma et al. [14] further confirmed that across South Asia, disturbance gradients shift regeneration trajectories toward disturbance-tolerant taxa, increasing the risk of Sal-dominated monocultures.
4.3. Community Composition and Beta Diversity
Community similarity analyses in Dharmapur revealed substantial compositional turnover, with LD and HD plots showing the lowest similarity. NMDS ordination confirmed distinct clustering of HD plots dominated by S. robusta and disturbance-tolerant species, while LD plots clustered around diverse assemblages of late-successional taxa. These results are consistent with Chapagain et al. [27], who reported significant beta diversity across disturbance gradients in Nepalese Sal forests, and with Behera et al. [55], who found that disturbance homogenized species composition in Indian Sal forests. Such compositional divergence indicates that disturbance not only reduces alpha diversity but also reshapes community assembly processes, with implications for functional diversity and ecosystem resilience [7].
4.4. Regional and Management Implications
Taken together, our findings reinforce a consistent regional pattern: increasing disturbance intensity leads to (i) reduced species richness and diversity, (ii) simplified stand structure, (iii) weakened regeneration of non-Sal species, and (iv) compositional shifts toward disturbance-tolerant dominance. While S. robusta’s resilience ensures its persistence, the decline of associated species and structural complexity suggests reduced ecological stability. Without intervention, Dharmapur’s forests risk long-term homogenization into Sal-dominated stands with diminished biodiversity and ecosystem services.
Effective management should therefore prioritize reducing chronic disturbances such as fuelwood extraction, grazing, and canopy opening, while promoting mixed-species regeneration and structural heterogeneity. Lessons from Nepal’s community forestry [27] and India’s joint forest management [55] suggest that participatory approaches, combined with stricter enforcement against illegal extraction [57], can help sustain both biodiversity and local livelihoods. For Dharmapur, integrating community-based conservation with restoration of degraded patches could be critical to maintaining ecological integrity.
5. Conclusion
This study provides the first empirical assessment of disturbance impacts on Shorea robusta forests in Dharmapur National Park, Bangladesh, and demonstrates that disturbance gradients fundamentally reshape forest diversity, structure, and regeneration. Across a continuum from low- to high-disturbance, significant declines in species richness, diversity indices, tree density, and basal area were recorded, accompanied by structural simplification and compositional shifts. Although S. robusta maintained relatively strong regeneration across all disturbance categories, associated late-successional and shade-tolerant species declined sharply under moderate- and high-disturbance, reducing regeneration potential and increasing the risk of long-term homogenization into Sal-dominated stands. Community similarity analyses and NMDS ordination further confirmed substantial species turnover between low- and high-disturbance plots, underscoring the sensitivity of non-Sal taxa to chronic anthropogenic pressures such as fuelwood extraction, grazing, and canopy opening.
These findings are consistent with regional studies in Bangladesh, Nepal, and India, highlighting a broader South Asian pattern in which disturbance gradients not only reduce alpha diversity but also alter community assembly and regeneration trajectories. The implications are clear: without intervention, Dharmapur’s forests risk losing structural complexity, functional diversity, and ecological resilience. To counter this trajectory, management must prioritize reducing chronic disturbances, protecting mature trees, and promoting mixed-species regeneration through enrichment planting of late-successional associates. Strengthening community-based management and instituting long-term ecological monitoring will be essential to sustain biodiversity and forest health. At the policy level, stricter enforcement of forest laws, formalized community participation, and integration of Sal Forest conservation into national climate and biodiversity strategies are urgently needed.
In sum, Dharmapur’s Sal forests stand at a critical juncture. Disturbance-sensitive management, supported by robust policy frameworks, offers a pathway to safeguard biodiversity, restore ecological integrity, and ensure the continued provision of vital ecosystem services for future generations.
Funding
This research received no external funding.
Acknowledgements
The author expresses sincere gratitude to the Forest Department of Bangladesh for granting research permission and providing logistical support during fieldwork in Dharmapur National Park. Special thanks are extended to the Range Officers, Beat Officers, and field staff for their cooperation and assistance in facilitating access to the study sites. The author is also deeply indebted to the local communities living around Dharmapur National Park, whose knowledge of the forest landscape and willingness to share insights greatly enriched the field investigation. Their cooperation, along with the tireless efforts of field assistants, was invaluable in data collection under often challenging conditions. The author gratefully acknowledges the guidance and constructive suggestions received from academic mentors and colleagues during the design and implementation of this study.
Conflicts of Interest
The authors declare no conflicts of interest.
References
- He, J.; Li, W.; Zhao, Z.; Zhu, L.; Du, X.; Xu, Y.; Sun, M.; Zhou, J.; Ciais, P.; Wigneron, J.-P.; Liu, R.; Lin, G.; Fan, L. Recent advances and challenges in monitoring and modeling of disturbances in tropical moist forests. Front. Remote Sens. 2024, 5, 1332728. [Google Scholar] [CrossRef]
- Lindner, M.; Seidl, R.; Grünig, M.; Bauhus, J.; Willig, J.; Hlásny, T.; Nabuurs, G.-J.; Patacca, M.; Peltoniemi, M.; Espelta, J.M.; et al. Managing Forest Disturbances in a Changing Climate; European Forest Institute: Joensuu, Finland, 2025. [Google Scholar] [CrossRef]
- Lolila, N.J.; Shirima, D.D.; Mauya, E.W. Tree species composition along environmental and disturbance gradients in tropical sub-montane forests, Tanzania. PLoS ONE 2023, 18, e0282528. [Google Scholar] [CrossRef]
- Pugh, T.A.M.; Lindeskog, M.; Smith, B.; Poulter, B.; Arneth, A.; Haverd, V.; Calle, L. Role of forest regrowth in global carbon sink dynamics. Proc. Natl. Acad. Sci. USA 2019, 116, 4382–4387. [Google Scholar] [CrossRef] [PubMed]
- Turner, B.L.; Lambin, E.F.; Reenberg, A. The emergence of land change science for global environmental change and sustainability. Proc. Natl. Acad. Sci. USA 2007, 104, 20666–20671. [Google Scholar] [CrossRef] [PubMed]
- Seidl, R.; Thom, D.; Kautz, M.; Martin-Benito, D.; Peltoniemi, M.; Vacchiano, G.; Wild, J.; Ascoli, D.; Petr, M.; Honkaniemi, J.; et al. Forest disturbances under climate change. Nat. Clim. Change 2017, 7, 395–402. [Google Scholar] [CrossRef] [PubMed]
- Chazdon, R.L. Second Growth: The Promise of Tropical Forest Regeneration in an Age of Deforestation; University of Chicago Press: Chicago, IL, USA, 2014. [Google Scholar] [CrossRef]
- Connell, J.H. Diversity in tropical rain forests and coral reefs: High diversity of trees and corals is maintained only in a nonequilibrium state. Science 1978, 199, 1302–1310. [Google Scholar] [CrossRef]
- Molino, J.-F.; Sabatier, D. Tree diversity in tropical rain forests: A validation of the intermediate disturbance hypothesis. Science 2001, 294, 1702–1704. [Google Scholar] [CrossRef]
- Bongers, F.; Poorter, L.; Hawthorne, W.D.; Sheil, D. The intermediate disturbance hypothesis applies to tropical forests, but disturbance contributes little to tree diversity. Ecol. Lett. 2009, 12, 798–805. [Google Scholar] [CrossRef]
- Sapkota, I.P.; Tigabu, M.; Oden, P.C. Species diversity and regeneration of old-growth seasonally dry Shorea robusta forests following gap formation. J. For. Res. 2025, 20, 7–14. [Google Scholar] [CrossRef]
- Laurance, W.F.; Camargo, J.L.C.; Luizão, R.C.C.; Laurance, S.G.; Pimm, S.L.; Bruna, E.M.; Stouffer, P.C.; Williamson, G.B.; Benítez-Malvido, J.; Vasconcelos, H.L.; et al. The fate of Amazonian forest fragments: A 32-year investigation. Biol. Conserv. 2011, 144, 56–67. [Google Scholar] [CrossRef]
- Rahman, M.; Nishat, A.; Vacik, H. Anthropogenic disturbances and plant diversity of the Madhupur Sal forests (Shorea robusta C.F. Gaertn) of Bangladesh. Int. J. Biodivers. Sci. Manag. 2009, 5, 162–173. [Google Scholar] [CrossRef]
- Sharma, A.; Bhardwaj, D.R.; Thakur, C.L.; Katoch, N.; Sharma, J.P. Floristic diversity and dominance patterns of Sal (Shorea robusta Gaertn. f.) forests in North Western Himalayas: Implications for conservation and sustainable management. Front. For. Glob. Change 2025, 8, 1524808. [Google Scholar] [CrossRef]
- Champion, H.G.; Seth, S.K. A Revised Survey of the Forest Types of India; Government of India: New Delhi, India, 1968; p. 404. [Google Scholar]
- Pandey, S.K.; Shukla, R.P. Plant diversity in managed Sal (Shorea robusta Gaertn.) forests of Gorakhpur, India: Species composition, regeneration and conservation. Biodivers. Conserv. 2003, 12, 2295–2319. [Google Scholar] [CrossRef]
- Gautam, K.H.; Devoe, N.N. Ecological and anthropogenic niches of Sal (Shorea robusta Gaertn. f.) forest and prospects for multiple-product forest management—A review. Forestry 2006, 79, 81–101. [Google Scholar] [CrossRef]
- Saha, S.; Howe, H.F. Species composition and fire in a dry deciduous forest. Ecology 2003, 84, 3118–3123. [Google Scholar] [CrossRef]
- Das, N. Tree species diversity, composition and structure in the tropical moist deciduous forest of Kadigarh National Park, Mymensingh, Bangladesh. Asian J. For. 2024, 8, 41–49. [Google Scholar] [CrossRef]
- Myers, N.; Mittermeier, R.A.; Mittermeier, C.G.; Da Fonseca, G.A.B.; Kent, J. Biodiversity hotspots for conservation priorities. Nature 2000, 403, 853–858. [Google Scholar] [CrossRef] [PubMed]
- Hossain, M.A.; Pavel, M.A.A.; Harada, K.; Beierkuhnlein, C.; Jentsch, A.; Uddin, M.B. Tree species diversity in relation to environmental variables and disturbance gradients in a northeastern forest in Bangladesh. J. For. Res. 2019, 30, 2143–2150. [Google Scholar] [CrossRef]
- Jubair, A.N.M.; Rahman, M.S.; Sarmin, I.J.; Raihan, A. Tree diversity and regeneration dynamics toward forest conservation and environmental sustainability: A case study from Nawabganj Sal Forest, Bangladesh. J. Agric. Sustain. Environ. 2023, 2, 1–22. [Google Scholar] [CrossRef]
- Rabha, D. Species composition and structure of Sal (Shorea robusta Gaertn. f.) forests along disturbance gradients of Western Assam, Northeast India. Trop. Plant Res. 2014, 1, 16–21. [Google Scholar]
- Sapkota, I.P.; Tigabu, M.; Oden, P.C. Spatial distribution, advanced regeneration and stand structure of Nepalese Sal (Shorea robusta) forests subject to disturbances of different intensities. For. Ecol. Manag. 2009, 257, 1966–1975. [Google Scholar] [CrossRef]
- Das, N. Effects of light intensity on seed germination and early growth of Spondias mombin seedlings in Bangladesh. Cell Biol. Dev. 2023, 7, 82–88. [Google Scholar] [CrossRef]
- Price, J.; Forstenhäusler, N.; Graham, E.; Osborn, T.J.; Warren, R. Report on the observed climate, projected climate, and projected biodiversity changes for Dharmapur under differing levels of warming; Wallace Initiative, University of East Anglia: Norwich, UK, 2024; Available online: https://wallaceparcs.uea.ac.uk/Bangladesh/Dharmapur.pdf (accessed on 6 September 2025).
- Chapagain, U.; Chapagain, B.P.; Nepal, S.; Manthey, M. Impact of disturbances on species diversity and regeneration of Nepalese Sal (Shorea robusta) forests managed under different management regimes. Earth 2021, 2, 826–844. [Google Scholar] [CrossRef]
- Korhonen, L.; Korhonen, K.T.; Rautiainen, M.; Stenberg, P. Estimation of forest canopy cover: A comparison of field measurement techniques. Silva Fenn. 2006, 40, 577–588. [Google Scholar] [CrossRef]
- Ratovonamana, R.Y.; Rajeriarison, C.; Roger, E.; Kiefer, I.; Ganzhorn, J.U. Impact of livestock grazing on forest structure, plant species composition and biomass in southwestern Madagascar. J. Arid Environ. 2013, 95, 34–42. [Google Scholar] [CrossRef]
- Holechek, J.L.; Pieper, R.D.; Herbel, C.H. Range Management: Principles and Practices, 3rd ed.; Prentice Hall: Upper Saddle River, NJ, USA, 1998. [Google Scholar]
- Shankar, U. A case of high tree diversity in a Sal (Shorea robusta)-dominated lowland forest of Eastern Himalaya: Floristic composition, regeneration and conservation. Curr. Sci. 2001, 81, 776–786. Available online: http://www.jstor.org/stable/24106397 (accessed on 6 September 2025).
- Thiele, J.; Schulte Auf’M Erley, G.; Glemnitz, M.; Gabriel, D. Efficiency of spatial sampling designs in estimating abundance and species richness of carabids at the landscape level. Landsc. Ecol. 2023, 38, 919–932. [Google Scholar] [CrossRef]
- Hankin, D.G.; Mohr, M.S.; Newman, K.B. Stratified sampling. In Sampling Theory; Oxford University Press: Oxford, UK, 2019; pp. 68–91. [Google Scholar] [CrossRef]
- Phillips, O.L.; Vásquez Martínez, R.; Núñez Vargas, P.; Lorenzo Monteagudo, A.; Chuspe Zans, M.-E.; Galiano Sánchez, W.; Peña Cruz, A.; Timaná, M.; Yli-Halla, M.; Rose, S. Efficient plot-based floristic assessment of tropical forests. J. Trop. Ecol. 2003, 19, 629–645. [Google Scholar] [CrossRef]
- Condit, R. Tropical Forest Census Plots; Springer: Berlin/Heidelberg, Germany, 1998. [Google Scholar] [CrossRef]
- Ahmed, Z.U.; Begum, Z.N.T.; Hassan, M.A.; Khondker, M.; Kabir, S.M.H.; Ahmad, M.; Ahmed, A.T.A.; Rahman, A.K.A.; Haque, E.U. (Eds.) Encyclopedia of Flora and Fauna of Bangladesh; Asiatic Society of Bangladesh: Dhaka, Bangladesh, 2008–2009; Vols. 1–28. [Google Scholar]
- World Flora Online. WFO Plant List, December 2023 release. World Flora Online Consortium. Available online: https://wfoplantlist.org/ (accessed on 6 September 2025).
- Lemmon, P.E. A spherical densiometer for estimating forest overstory density. For. Sci. 1956, 2, 314–320. [Google Scholar] [CrossRef]
- Jennings, S. Assessing forest canopies and understorey illumination: Canopy closure, canopy cover and other measures. Forestry 1999, 72, 59–74. [Google Scholar] [CrossRef]
- Das, N. Allometric modeling for leaf area and leaf biomass estimation of Swietenia mahagoni in the north-eastern region of Bangladesh. J. For. Environ. Sci. 2014, 30, 351–361. [Google Scholar] [CrossRef]
- Das, N. Modeling develops to estimate leaf area and leaf biomass of Lagerstroemia speciosa in West Vanugach Reserve Forest of Bangladesh. ISRN For. 2014, 2014, 486478. [Google Scholar] [CrossRef]
- Curtis, J.T.; McIntosh, R.P. An upland forest continuum in the prairie-forest border region of Wisconsin. Ecology 1951, 32, 476–496. [Google Scholar] [CrossRef]
- Misra, R. Ecology Workbook; Oxford & IBH Publishing Co.: New Delhi, India, 1968.
- Curtis, J.T. The Vegetation of Wisconsin: An Ordination of Plant Communities; University of Wisconsin Press: Madison, WI, USA, 1959. [Google Scholar]
- Xue, J.; Wang, L.; Liu, S.; Song, W.; Zhang, J.; Ding, S. Global high-resolution forest disturbance type dataset. Earth Syst. Sci. Data 2025, 17, 1–25. [Google Scholar] [CrossRef]
- Das, N.; Mahapatra, C.K.; Biswas, S.K.; Das, P.; Majumdar, A. Suitability of the normal, log-normal and Weibull distributions for modeling diameter and height distributions of Swietenia mahagoni plantations in Bangladesh. J. Biol. Nat. 2018, 8, 146–155. [Google Scholar]
- Magurran, A.E. Measuring Biological Diversity; Blackwell Publishing: Malden, MA, USA, 2004. [Google Scholar]
- Mansingh, A.; Pradhan, A.; Sahoo, S.R.; Cherwa, S.S.; Mishra, B.P.; Rath, L.P.; Ekka, N.J.; Panda, B.P. Tree diversity, population structure, biomass accumulation, and carbon stock dynamics in tropical dry deciduous forests of Eastern India. BMC Ecol. Evol. 2025, 25, 48. [Google Scholar] [CrossRef] [PubMed]
- Zar, J.H. Biostatistical Analysis, 5th ed.; Prentice Hall/Pearson: Upper Saddle River, NJ, USA, 2010; p. 944. ISBN 9780131008465. [Google Scholar]
- Anderson, M.J. A new method for non-parametric multivariate analysis of variance. Austral Ecol. 2001, 26, 32–46. [Google Scholar] [CrossRef]
- R Core Team. R: A Language and Environment for Statistical Computing; R Foundation for Statistical Computing: Vienna, Austria, 2025; Available online: https://www.R-project.org/ (accessed on 11 August 2025).
- Oksanen, J.; Simpson, G.L.; Blanchet, F.G.; Kindt, R.; Legendre, P.; Minchin, P.R.; O’Hara, R.B.; Solymos, P.; Stevens, M.H.H.; Szoecs, E.; et al. vegan: Community Ecology Package (Version 2.7-1) [R package]. 2025. Available online: https://CRAN.R-project.org/package=vegan (accessed on 11 August 2025).
- Das, N.; Sarker, S.K. Tree species diversity and productivity relationship in the central region of Bangladesh. J. For. 2015, 2, 24–33. [Google Scholar] [CrossRef]
- Behera, M.C.; Sahoo, U.K.; Mohanty, T.L.; Prus, P.; Smuleac, L.; Pascalau, R. Species composition and diversity of plants along human-induced disturbances in tropical moist Sal forests of Eastern Ghats, India. Forests 2023, 14, 1931. [Google Scholar] [CrossRef]
- Gautam, T.P.; Mandal, T.N. Effect of disturbance on plant species diversity in moist tropical Sal forests of eastern Nepal. Our Nat. 2018, 16, 14–25. [Google Scholar] [CrossRef]
- Islam, K.K.; Sato, N. Deforestation, land conversion and illegal logging in Bangladesh: The case of the Sal (Shorea robusta) forests. iForest 2012, 5, 171–178. [Google Scholar] [CrossRef]
Figure 1.
Study area map showing forest plots classified as least disturbed, moderately disturbed, and highly disturbed in Dharmapur National Park, Bangladesh.
Figure 1.
Study area map showing forest plots classified as least disturbed, moderately disturbed, and highly disturbed in Dharmapur National Park, Bangladesh.
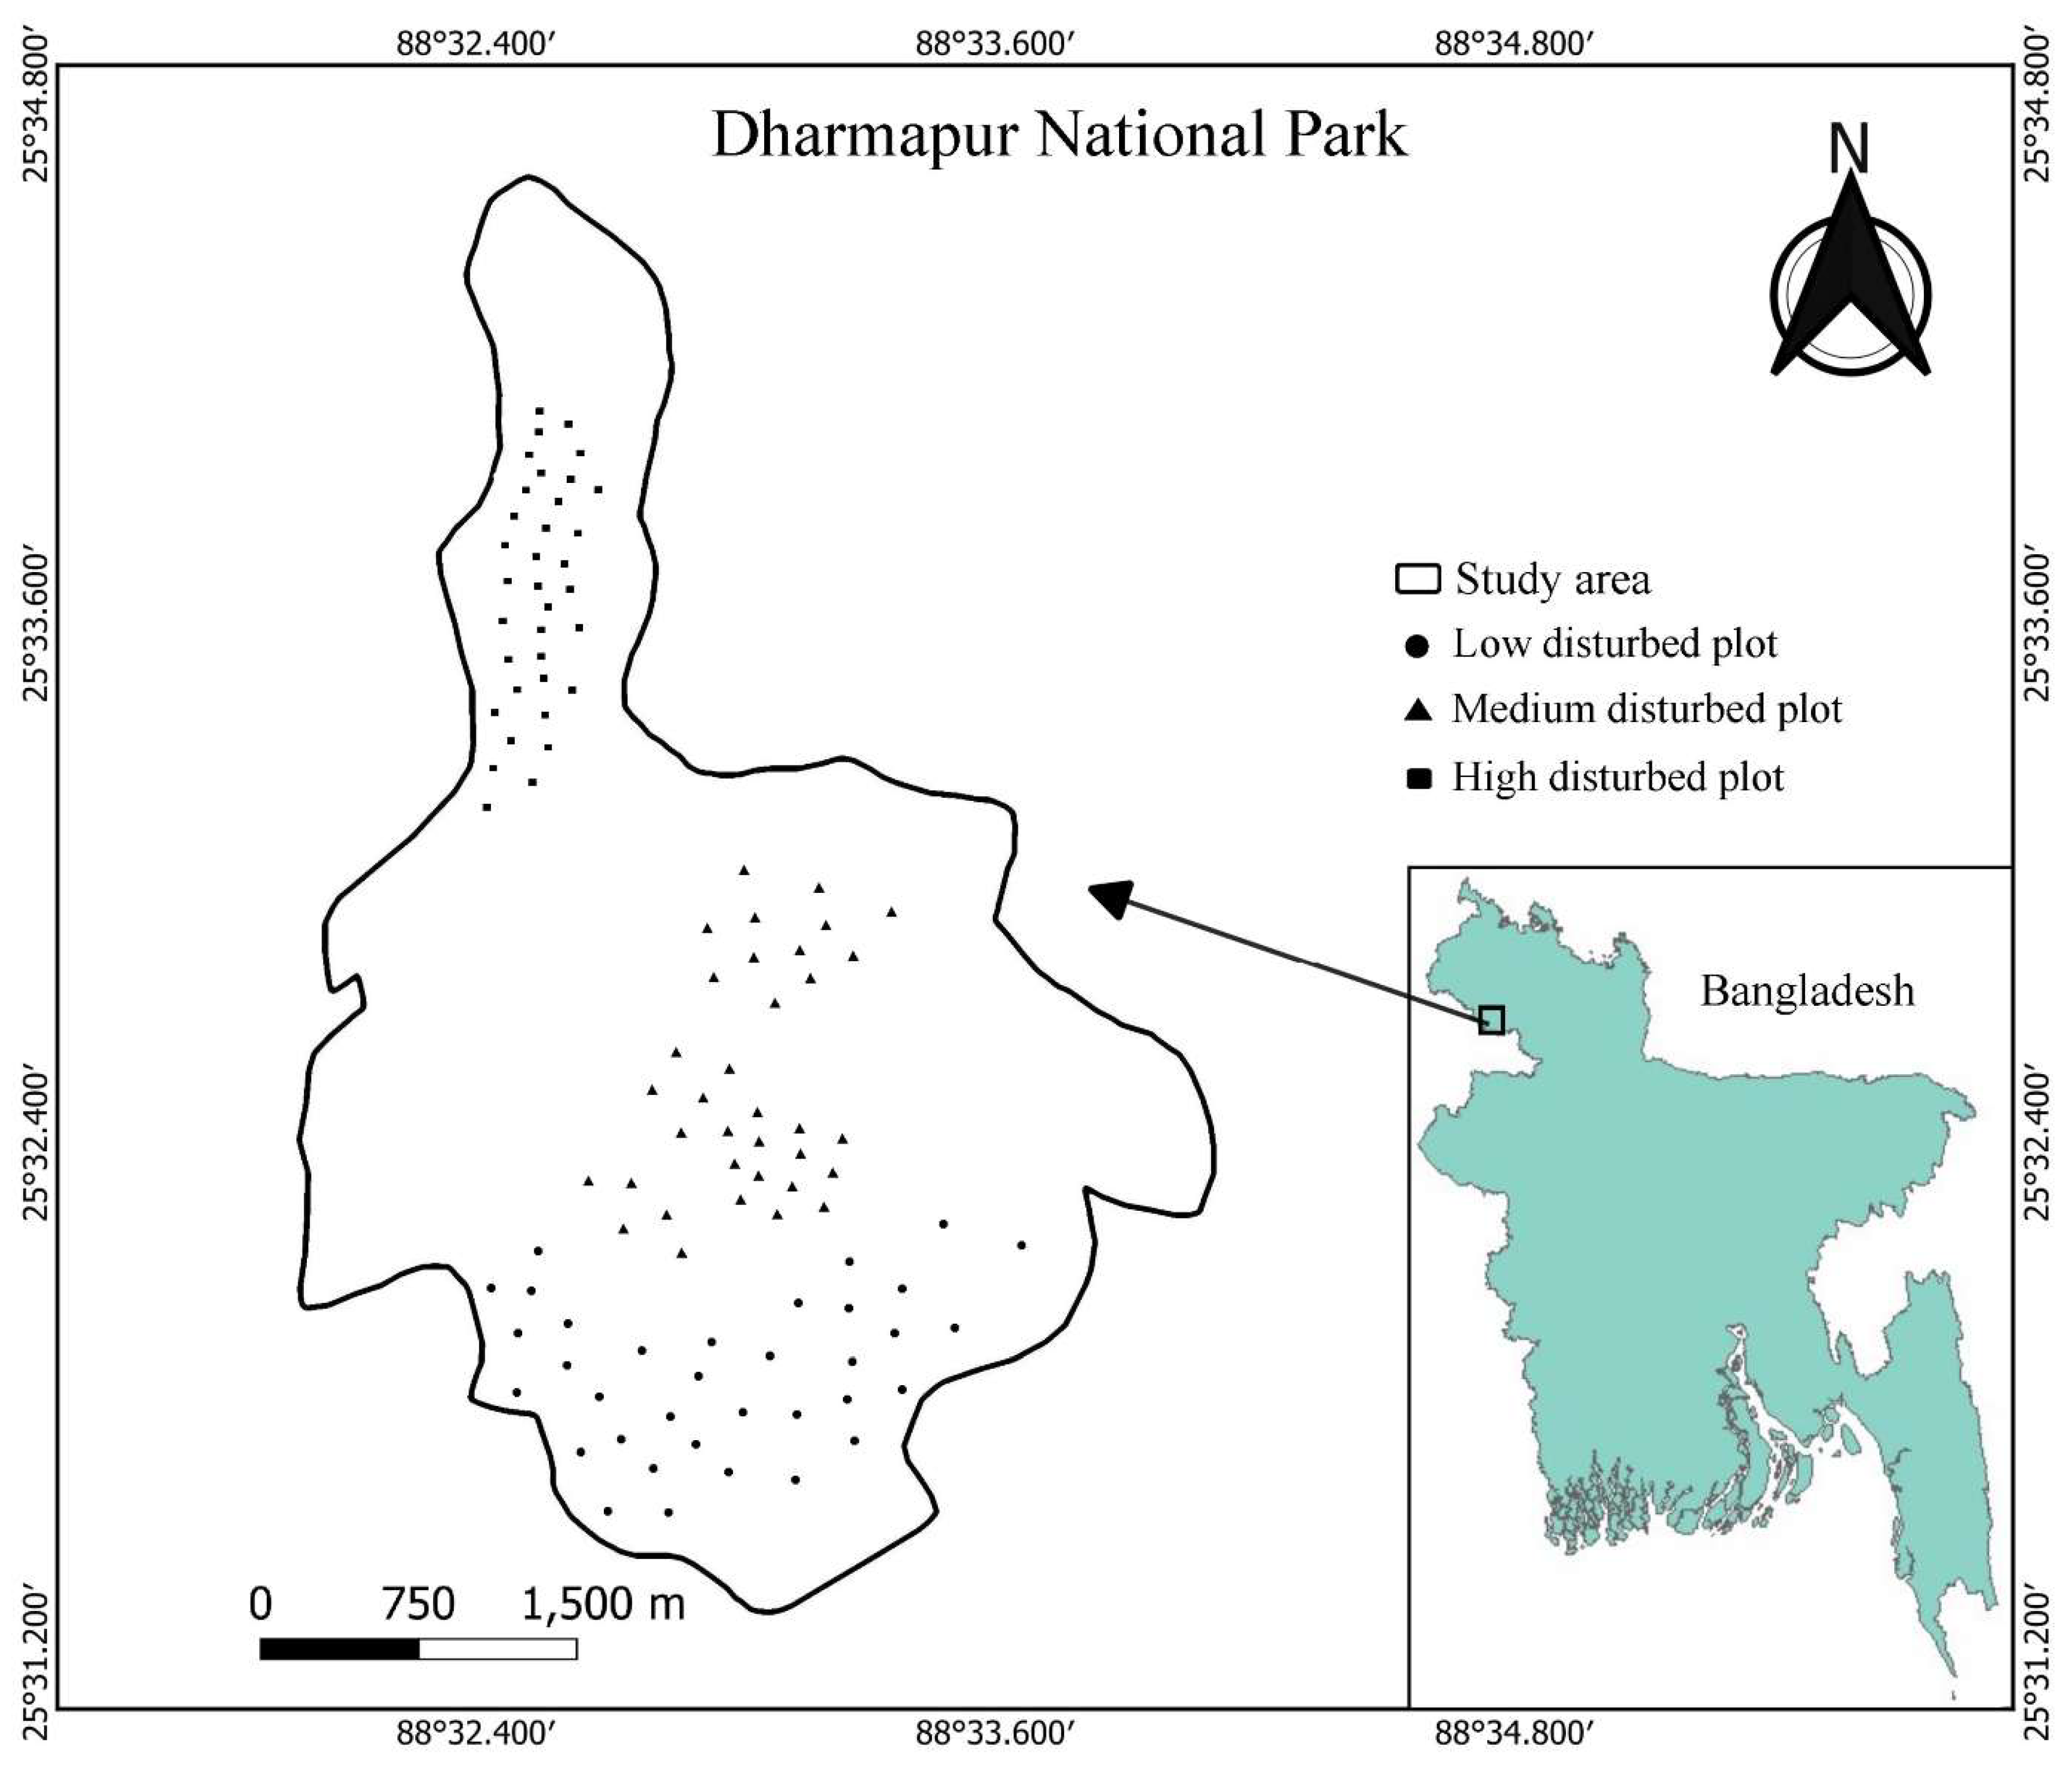
Figure 2.
Monthly climate variables (temperature, precipitation, relative humidity, rainfall days, sunshine hours, and wind speed) in Dinajpur District, Bangladesh (2023–2024).
Figure 2.
Monthly climate variables (temperature, precipitation, relative humidity, rainfall days, sunshine hours, and wind speed) in Dinajpur District, Bangladesh (2023–2024).
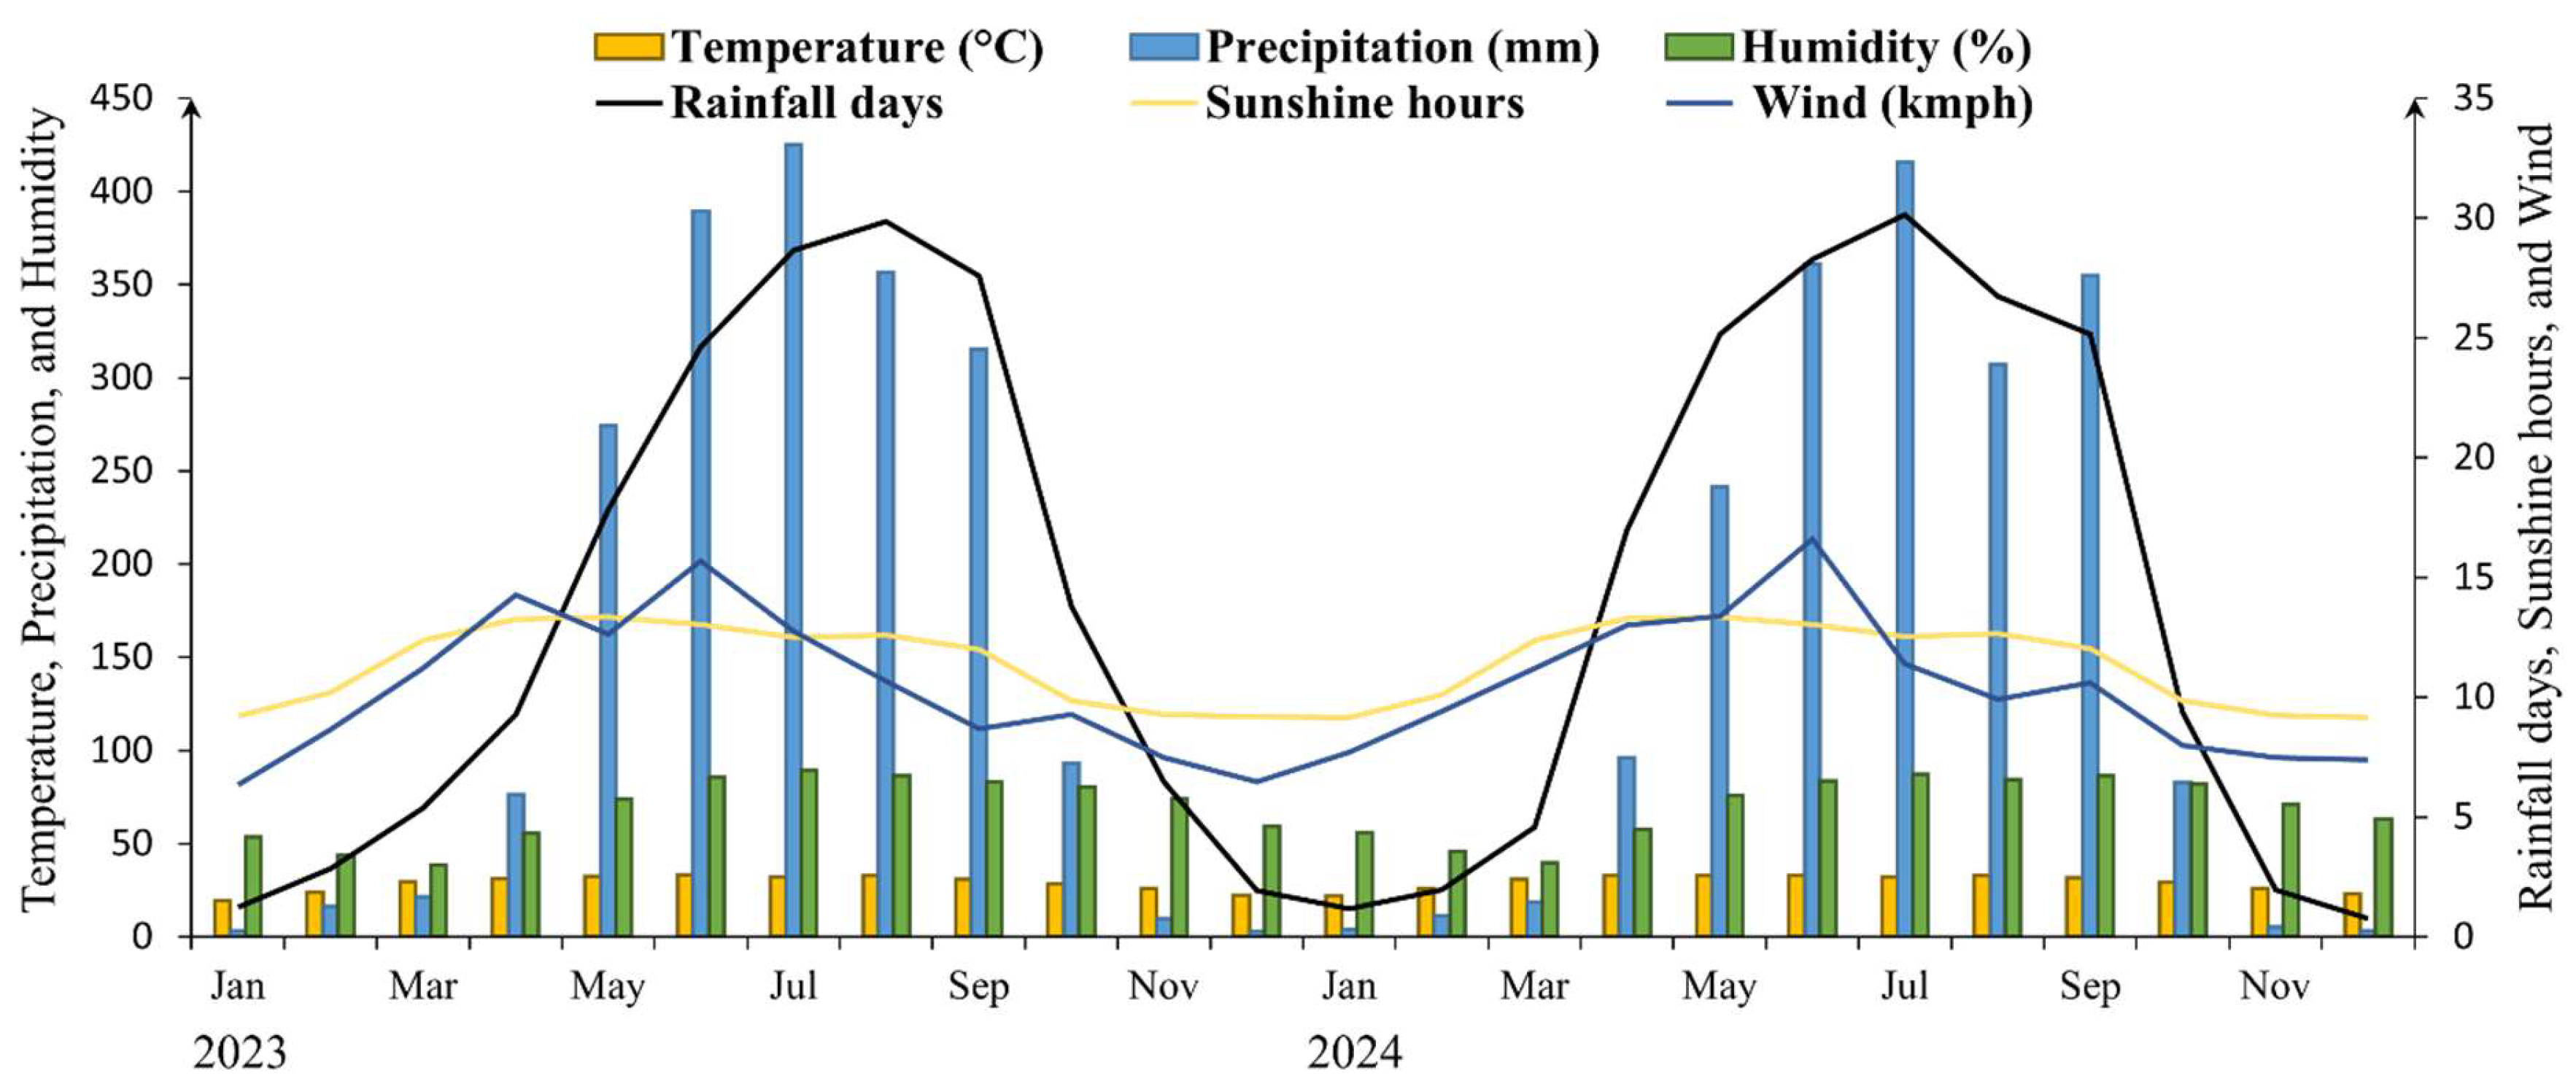
Figure 3.
Workflow of the disturbance factor assessment, illustrating the sequential steps from field data collection to the classification of forest plots as least disturbed (LD), moderately disturbed (MD), or highly disturbed (HD) based on the Disturbance Index (DI, %).
Figure 3.
Workflow of the disturbance factor assessment, illustrating the sequential steps from field data collection to the classification of forest plots as least disturbed (LD), moderately disturbed (MD), or highly disturbed (HD) based on the Disturbance Index (DI, %).
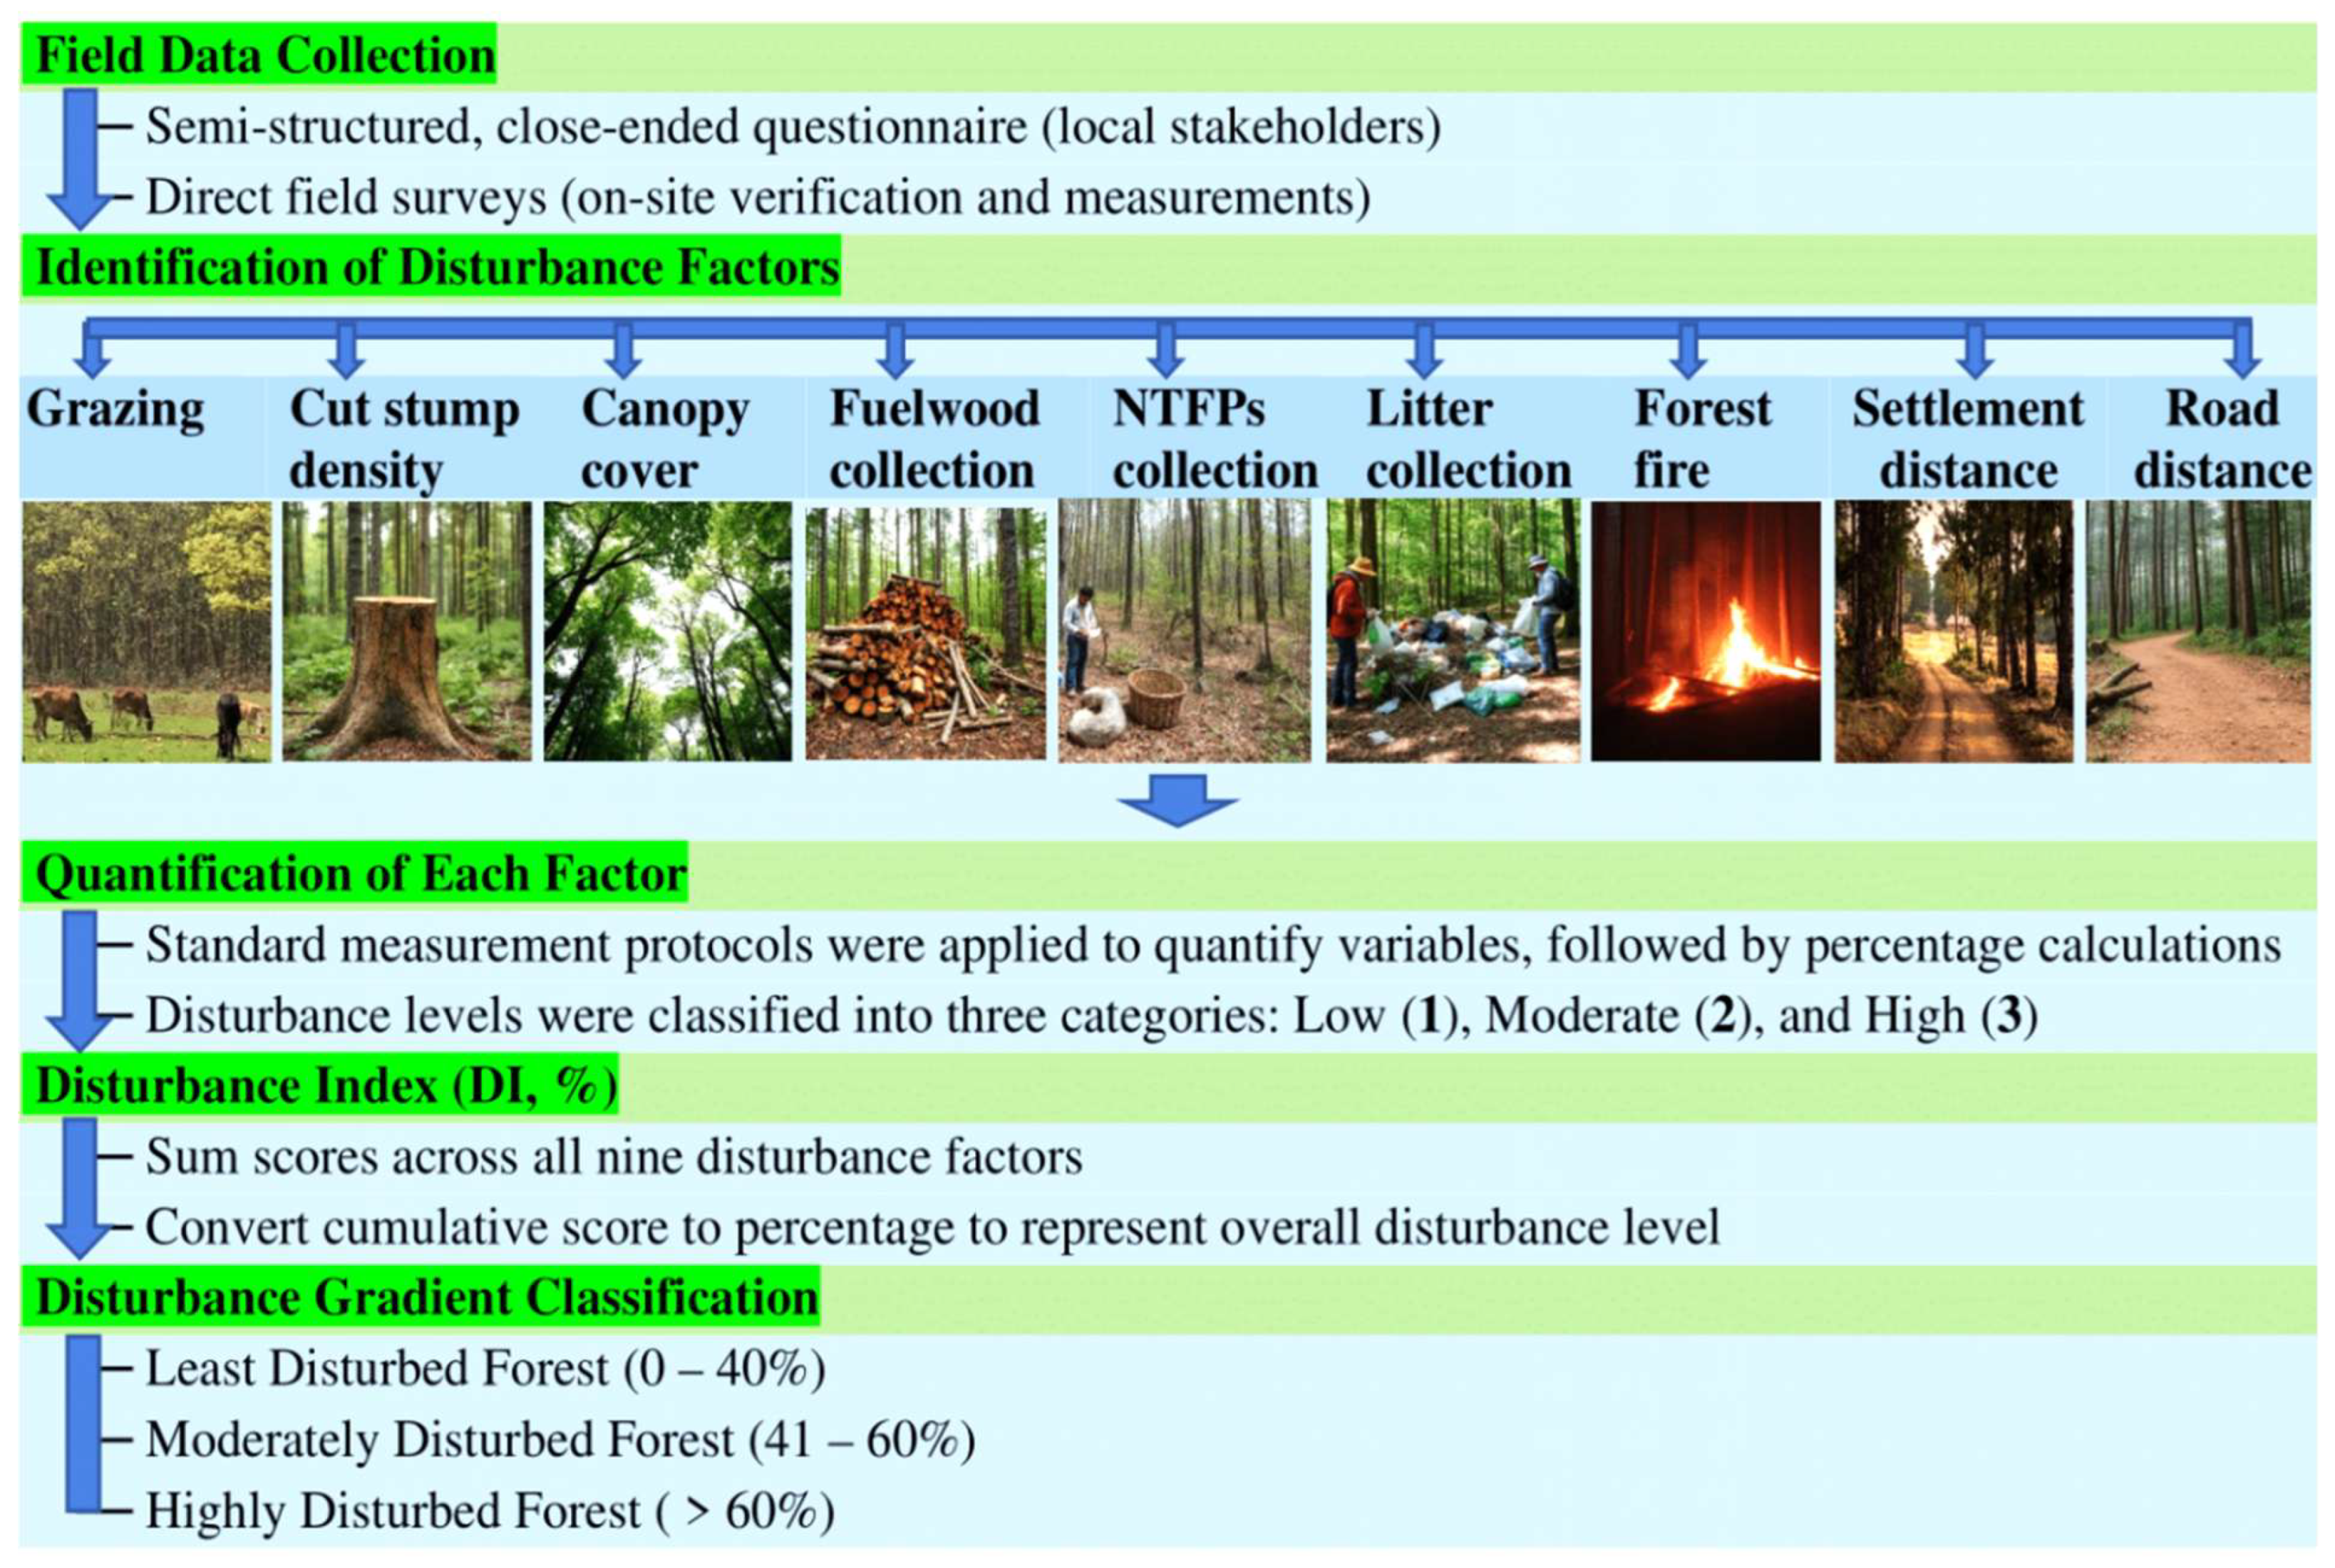
Figure 4.
Mean tree density (individuals ha−1) and basal area (m2 ha−1) across low-disturbance (LD), moderate-disturbance (MD), and high-disturbance (HD) forest categories in Dharmapur National Park.
Figure 4.
Mean tree density (individuals ha−1) and basal area (m2 ha−1) across low-disturbance (LD), moderate-disturbance (MD), and high-disturbance (HD) forest categories in Dharmapur National Park.
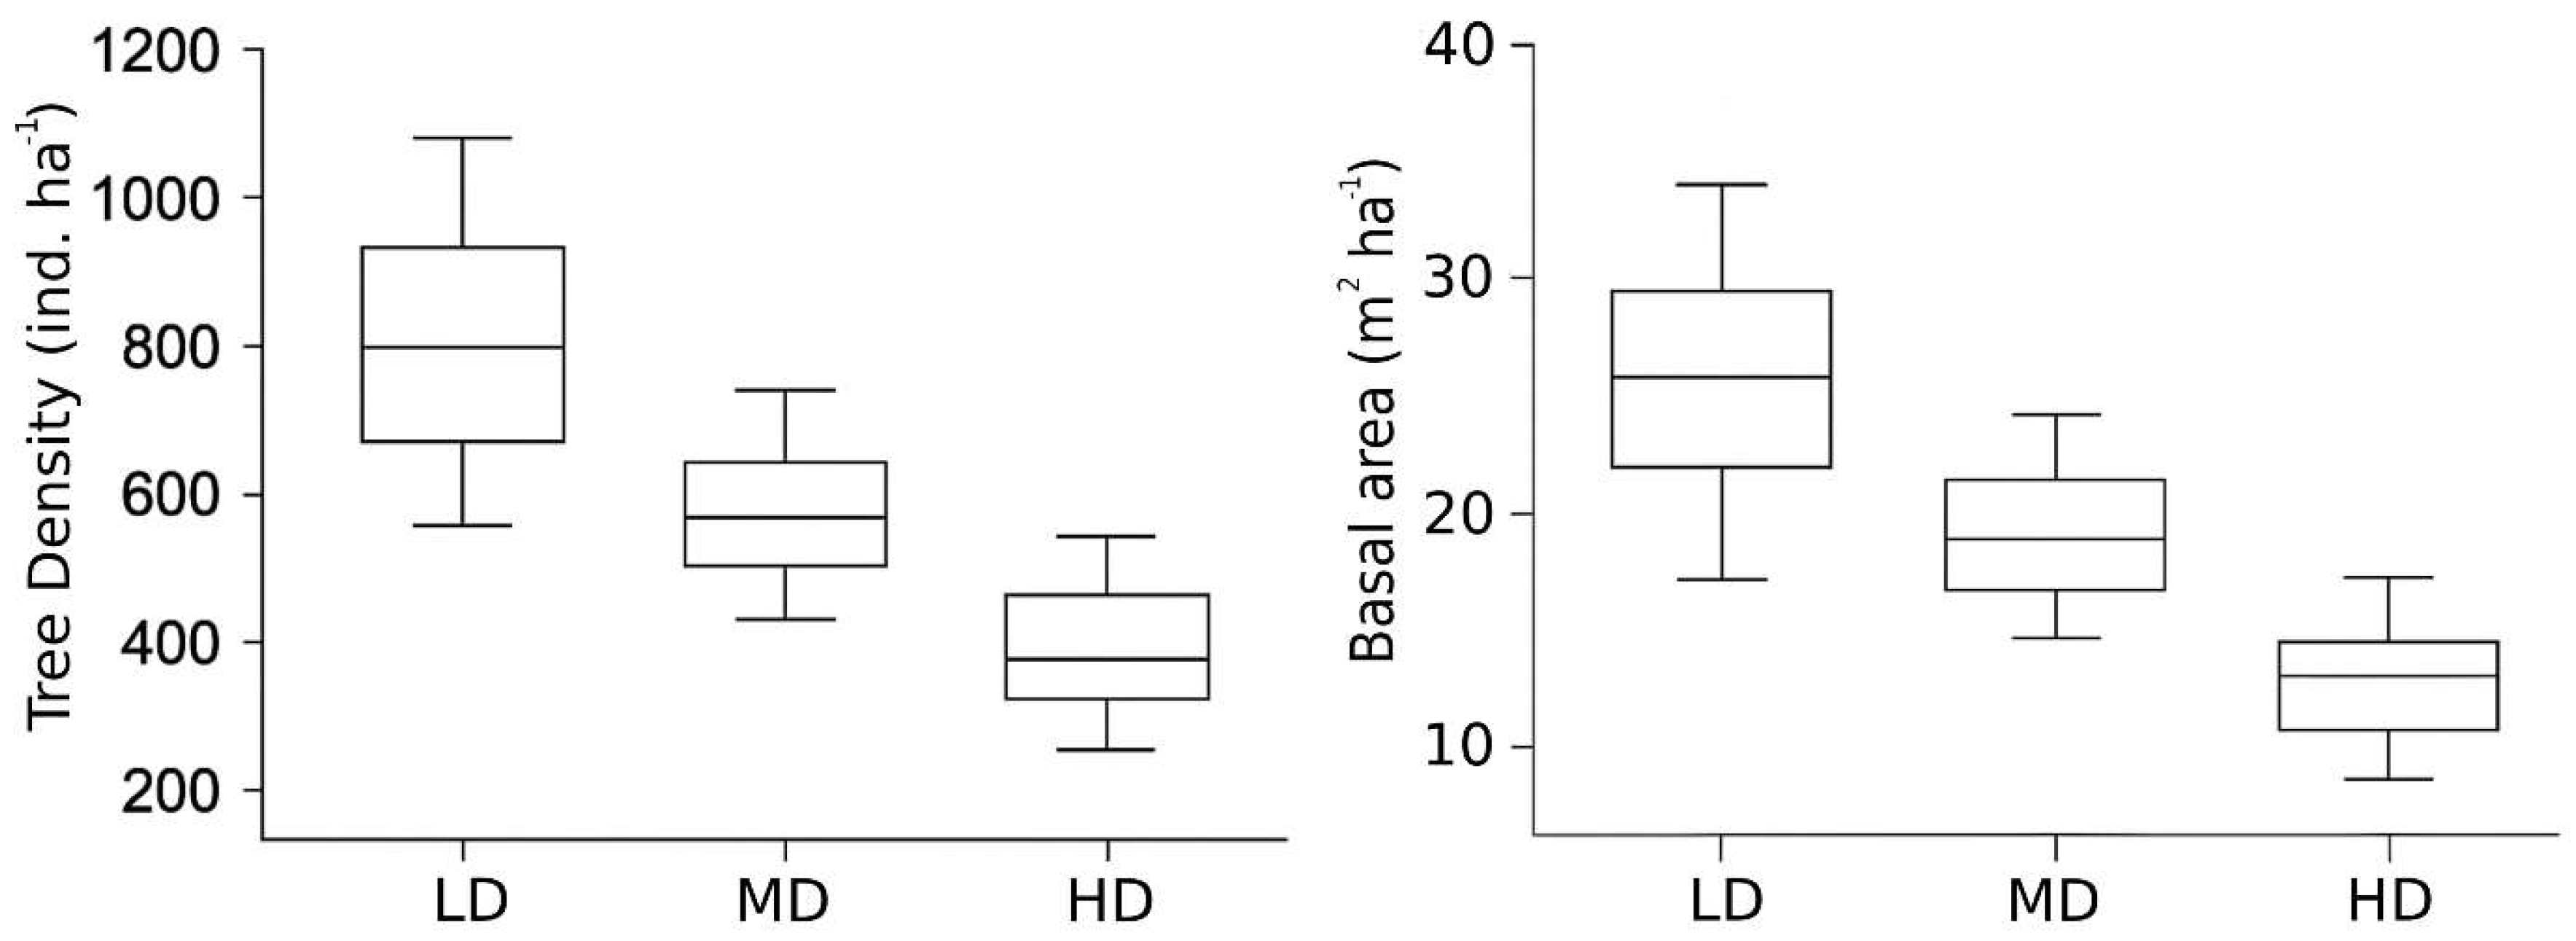
Figure 5.
Diameter class distributions of trees across disturbance categories (LD, MD, HD) in Dharmapur National Park. The inverse J pattern in LD plots indicates continuous recruitment.
Figure 5.
Diameter class distributions of trees across disturbance categories (LD, MD, HD) in Dharmapur National Park. The inverse J pattern in LD plots indicates continuous recruitment.
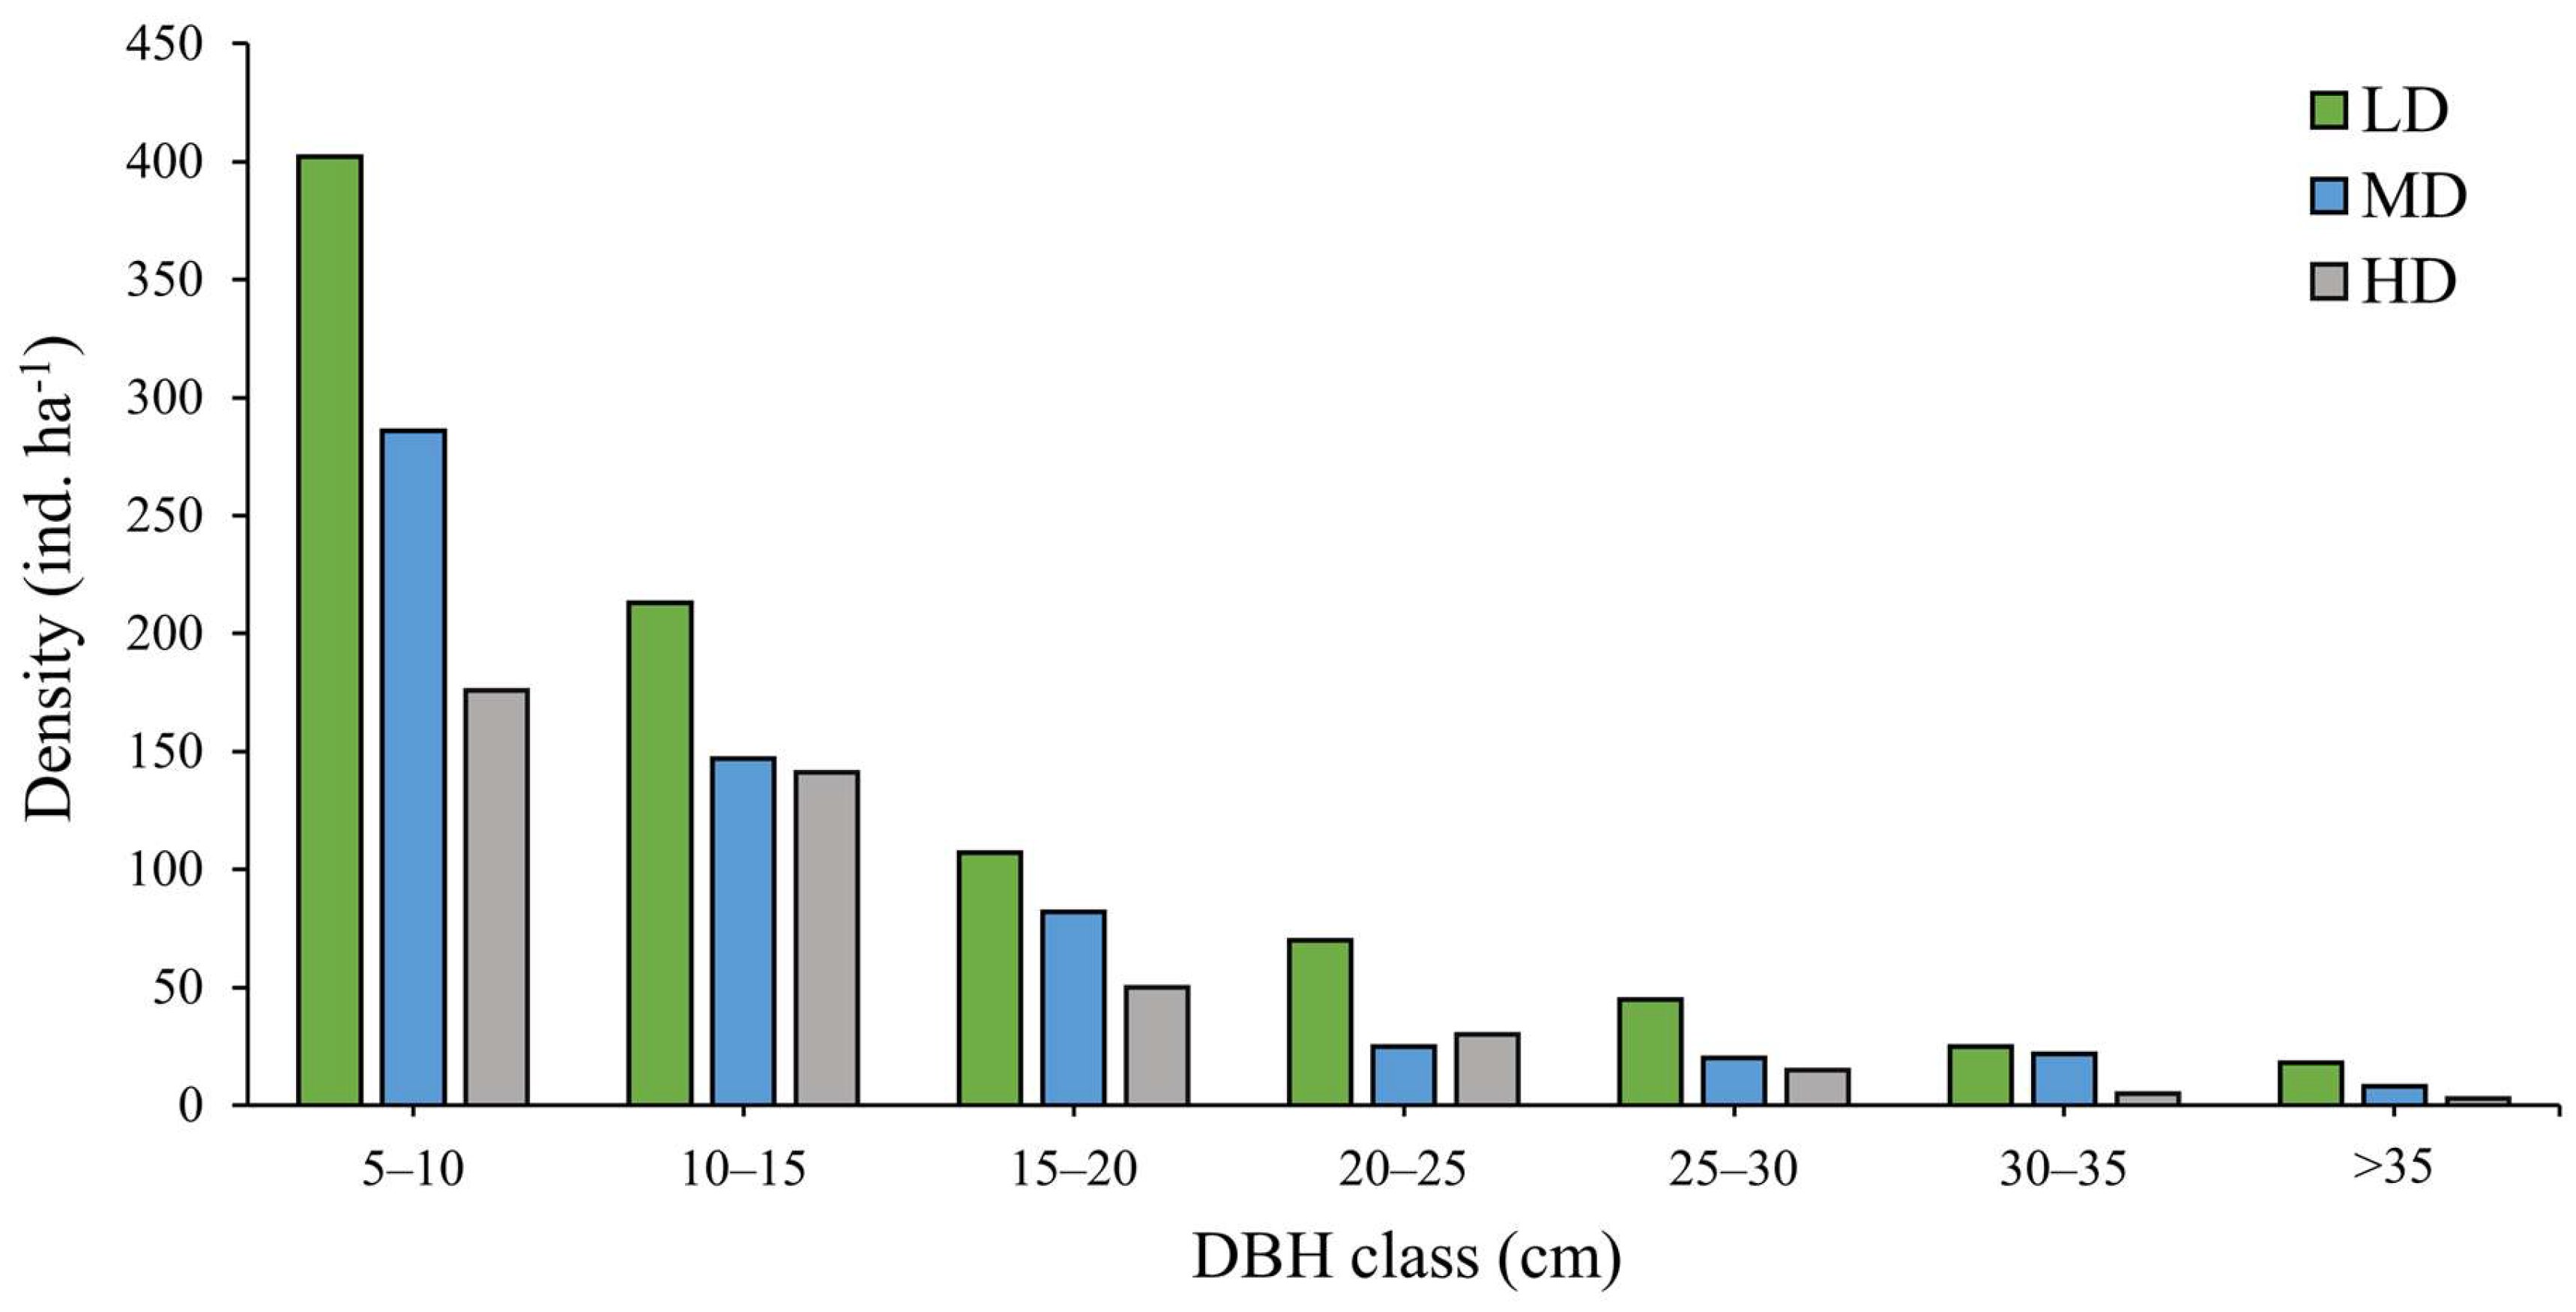
Figure 6.
Relationship between the Shannon–Wiener diversity index (H′) and the Disturbance Index (DI, %) in Dharmapur National Park. The solid line represents the fitted linear regression model, and the shaded area indicates the 95% confidence interval.
Figure 6.
Relationship between the Shannon–Wiener diversity index (H′) and the Disturbance Index (DI, %) in Dharmapur National Park. The solid line represents the fitted linear regression model, and the shaded area indicates the 95% confidence interval.
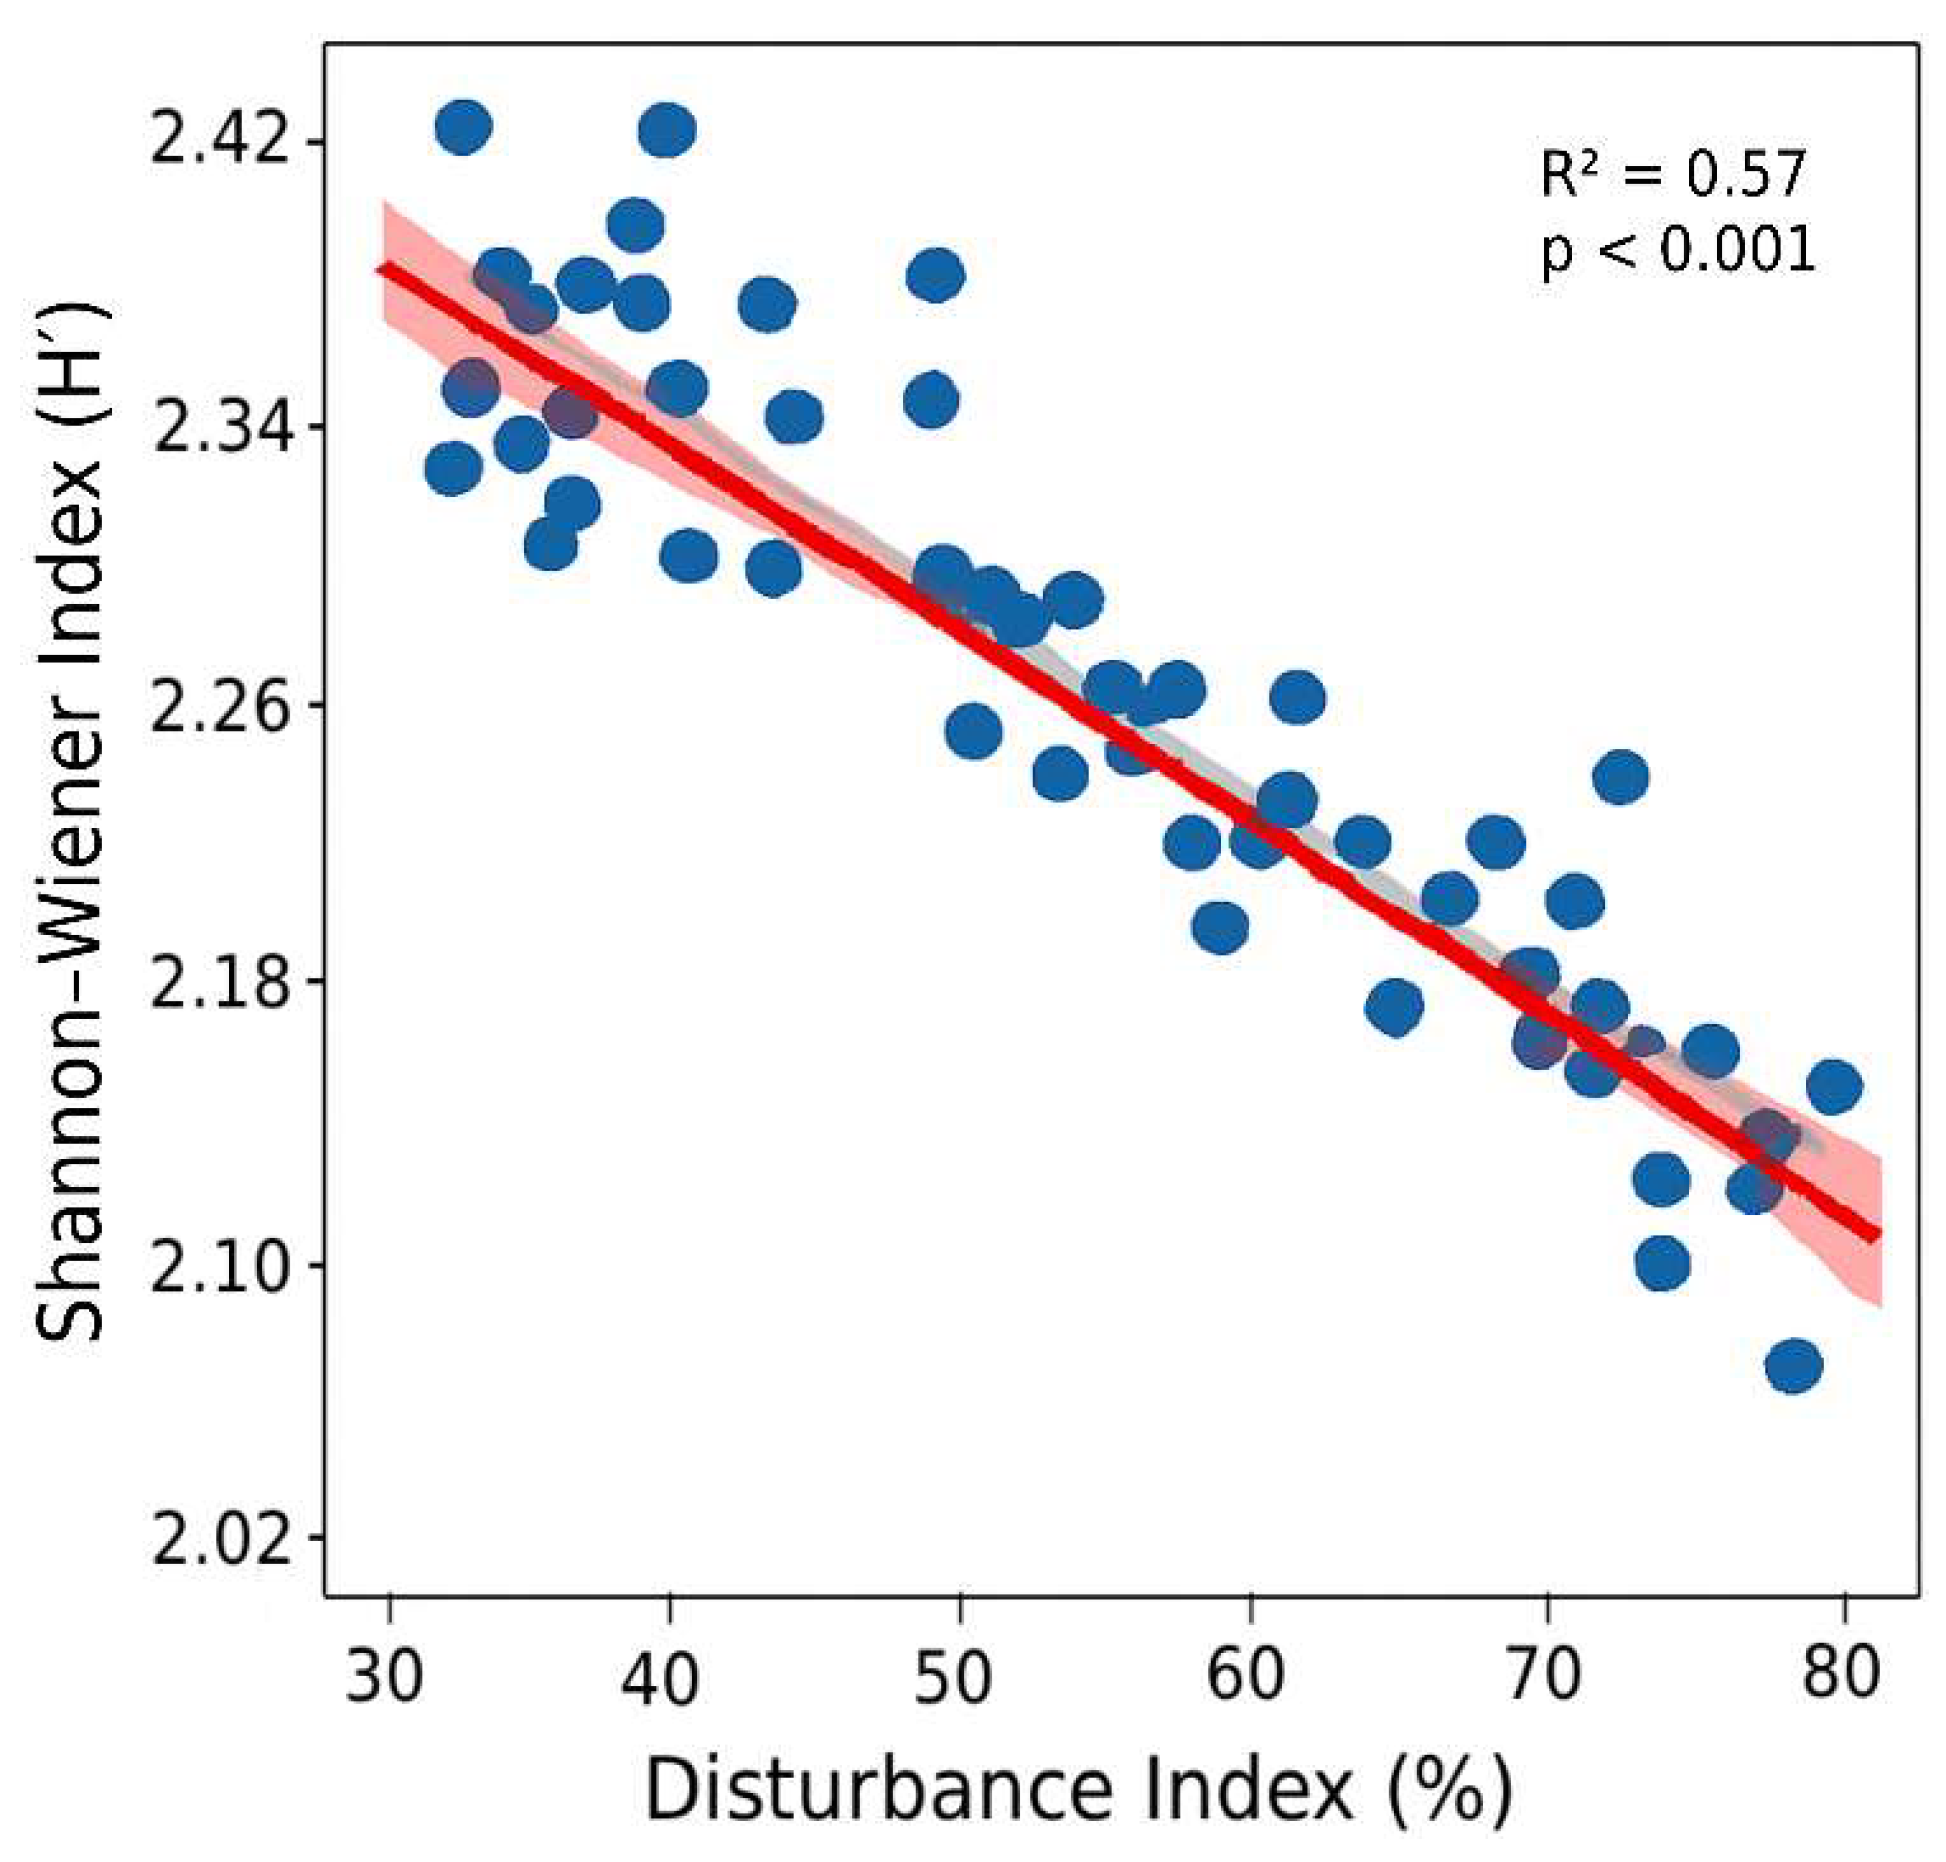
Figure 7.
Seedling and sapling densities (individuals ha−1) of Shorea robusta and associated species across disturbance categories (LD, MD, HD). Error bars represent standard errors.
Figure 7.
Seedling and sapling densities (individuals ha−1) of Shorea robusta and associated species across disturbance categories (LD, MD, HD). Error bars represent standard errors.
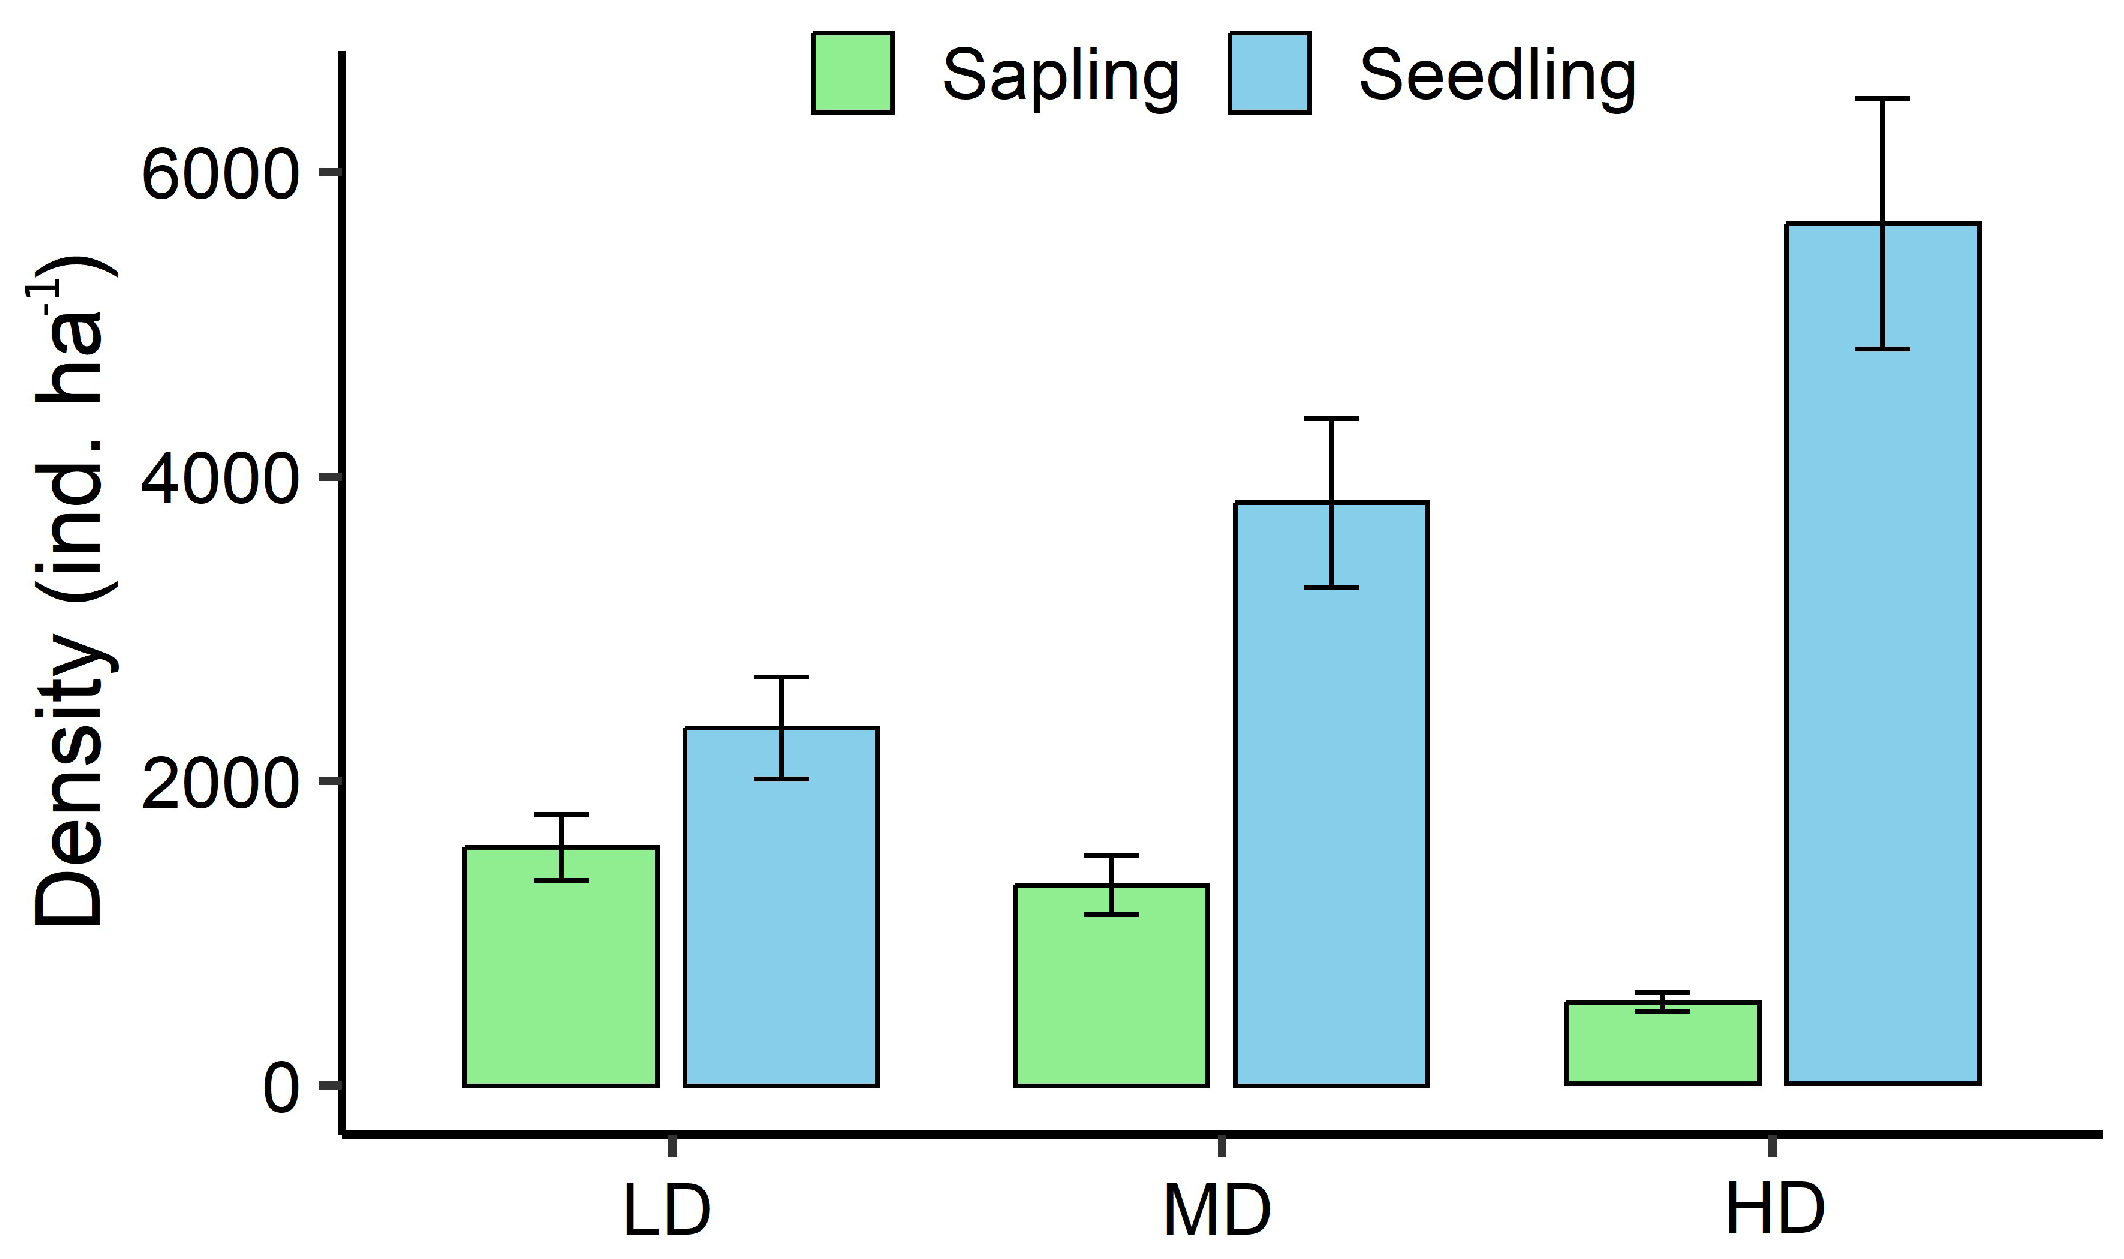
Figure 8.
Regeneration status of all tree species across disturbance categories (LD, MD, HD), based on the relative abundance of seedlings, saplings, and adults.
Figure 8.
Regeneration status of all tree species across disturbance categories (LD, MD, HD), based on the relative abundance of seedlings, saplings, and adults.
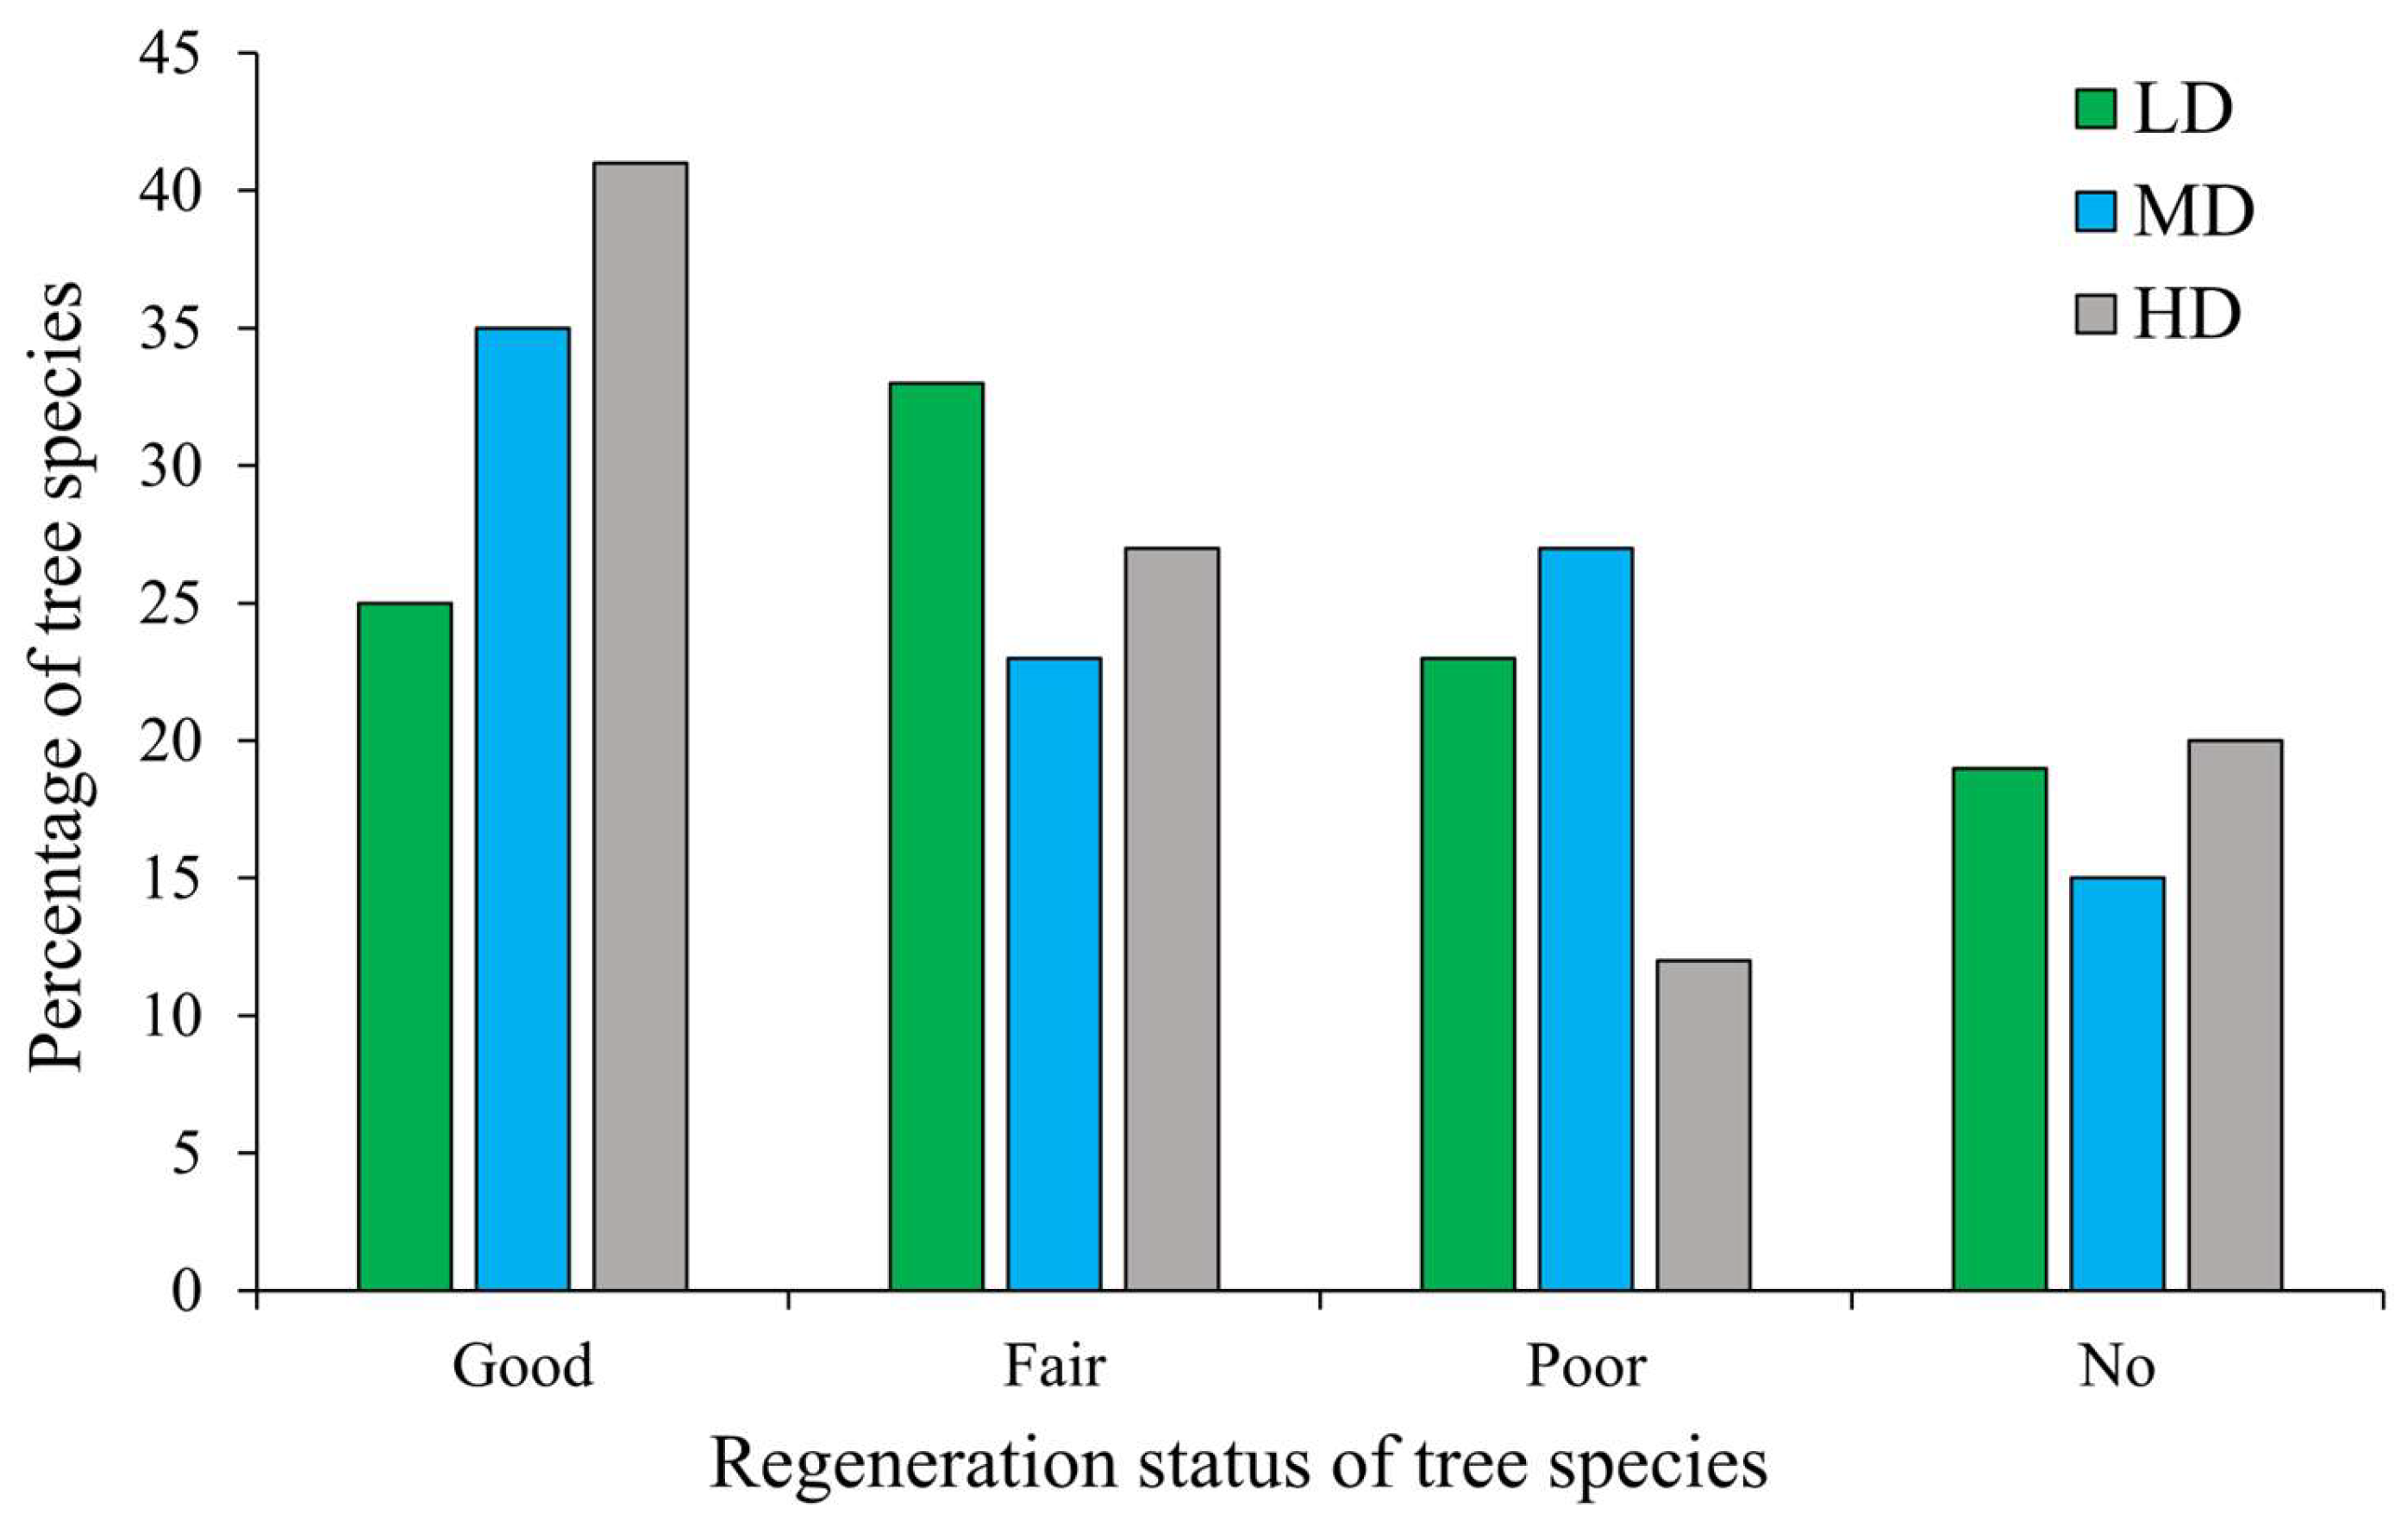
Figure 9.
Regeneration status of dominant tree species across disturbance categories (LD, MD, HD), showing relative proportions of seedlings and saplings.
Figure 9.
Regeneration status of dominant tree species across disturbance categories (LD, MD, HD), showing relative proportions of seedlings and saplings.
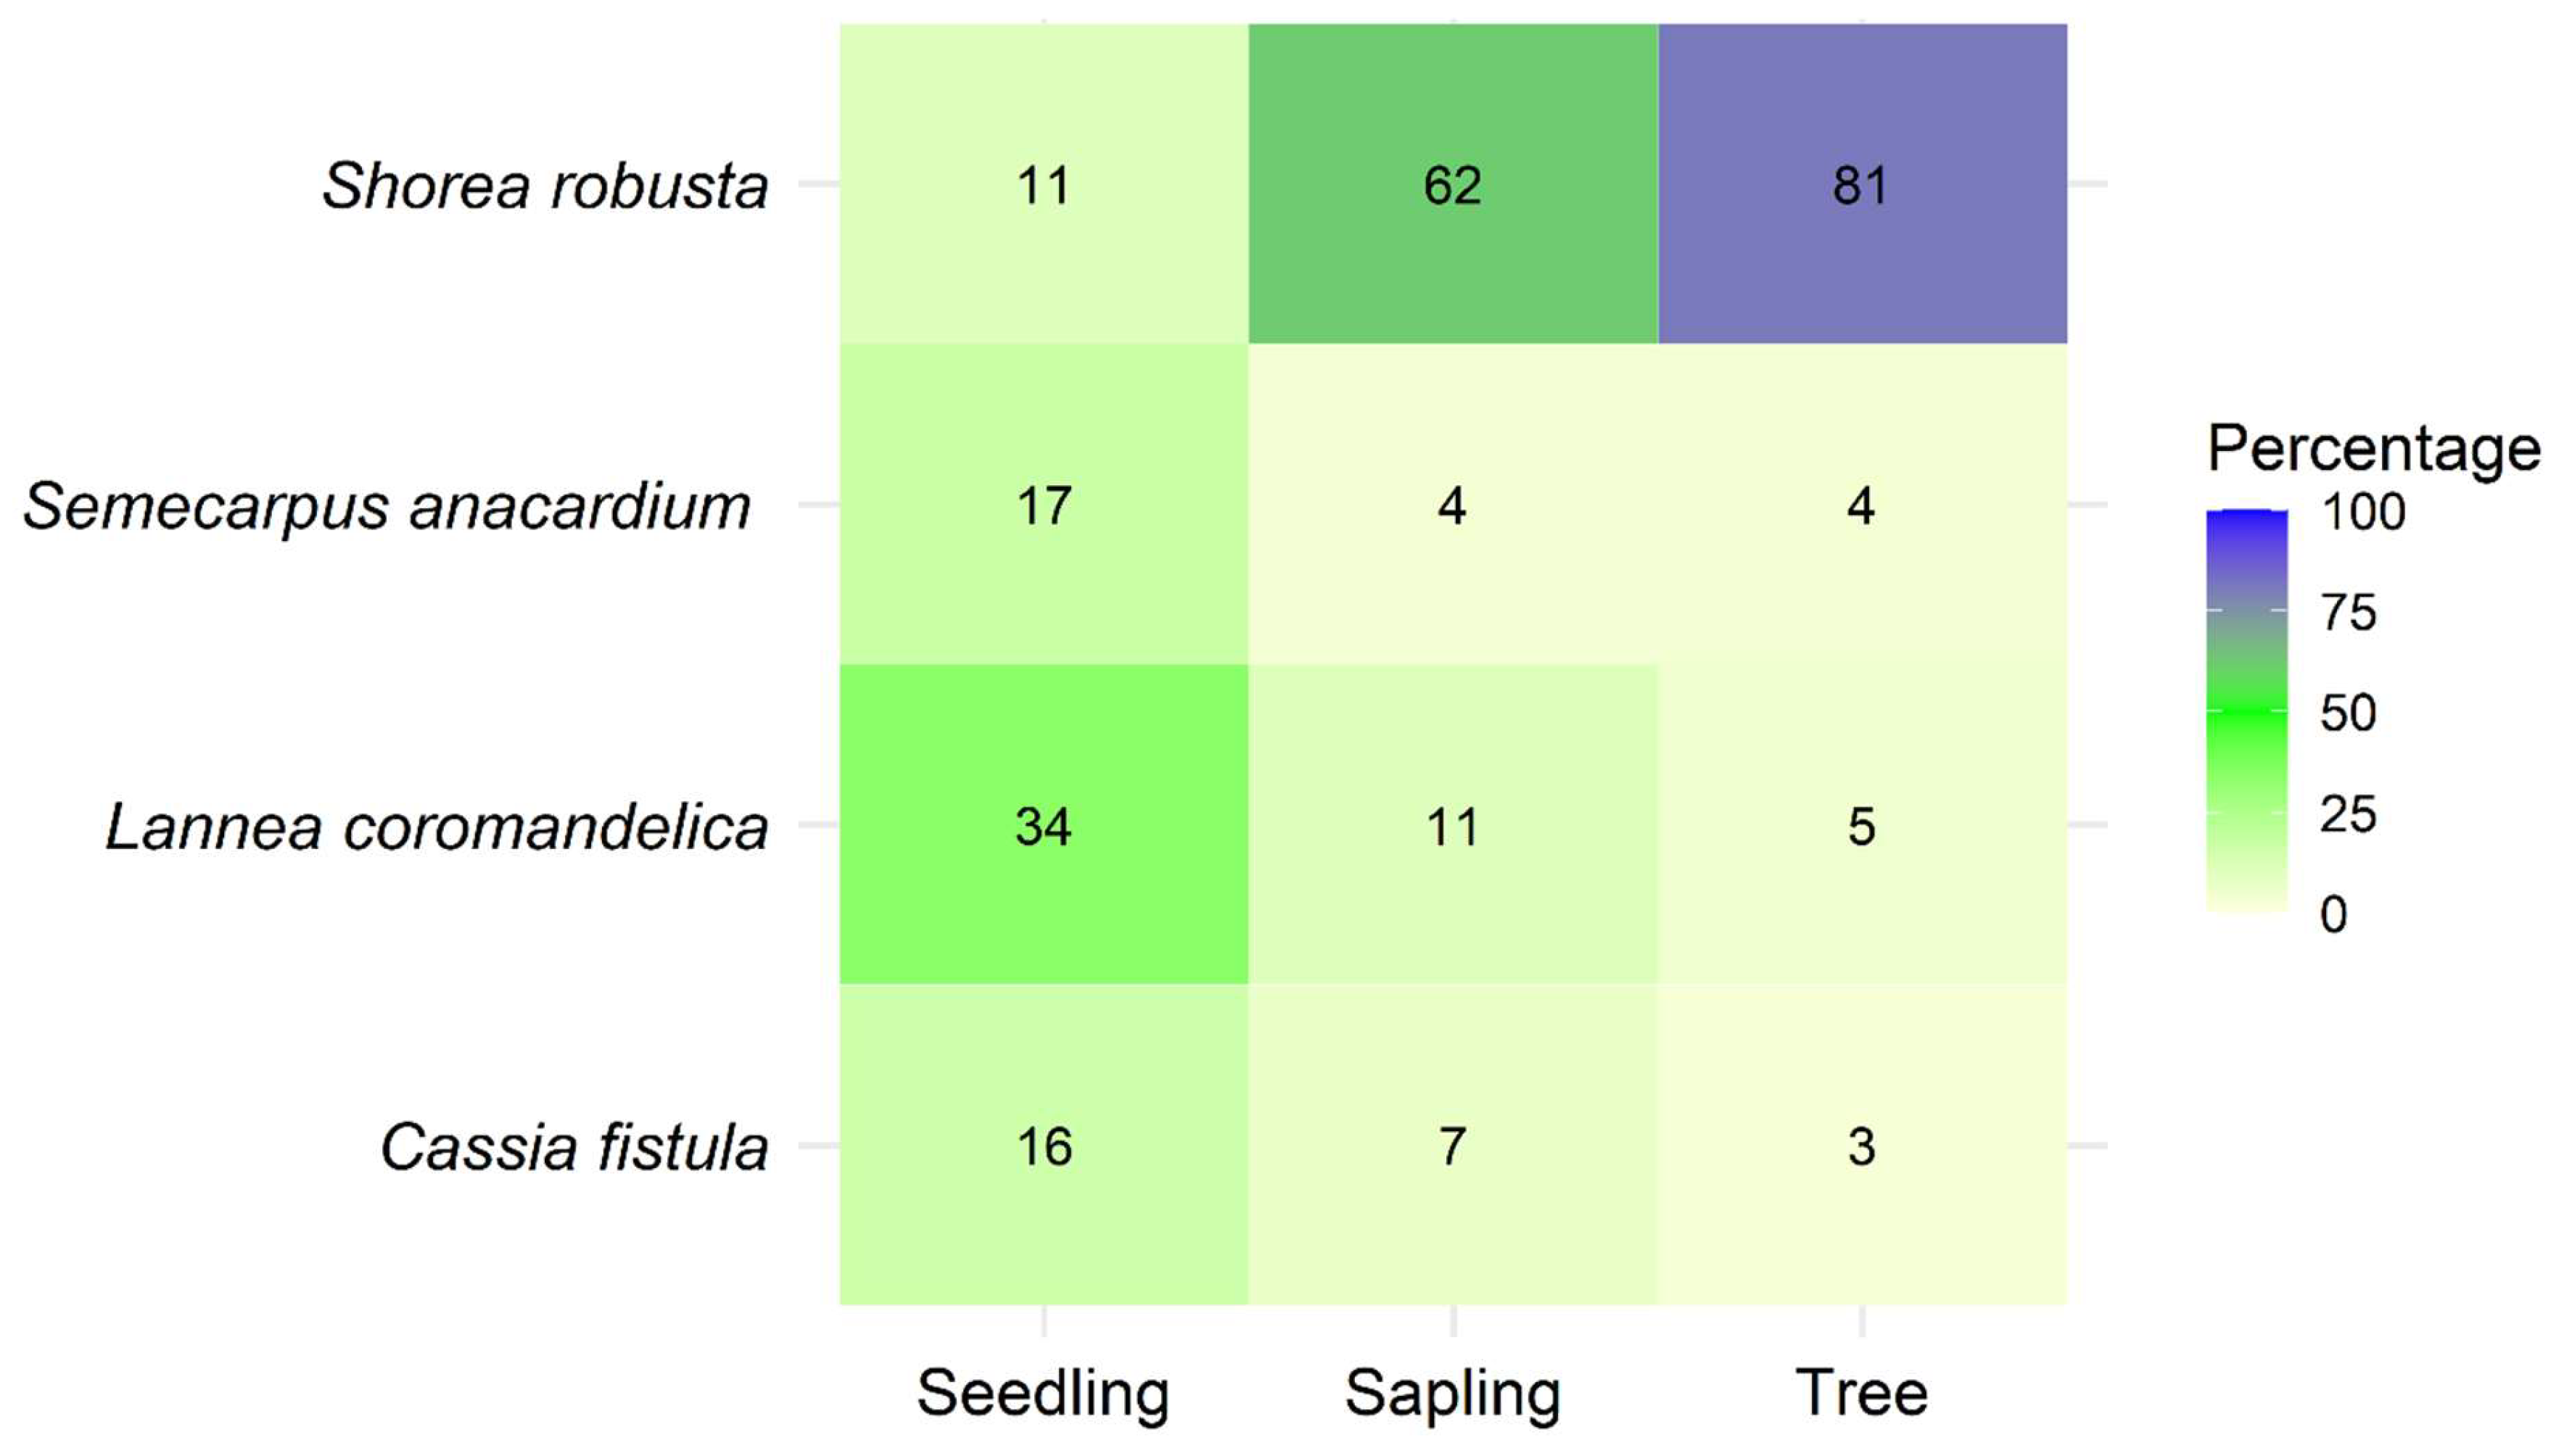
Figure 10.
Non-metric multidimensional scaling (NMDS) ordination of tree species composition in low-disturbance (LD), moderate-disturbance (MD), and high-disturbance (HD) stands in Dharmapur National Park, Bangladesh. Species composition differed significantly among disturbance categories (PERMANOVA, p < 0.01).
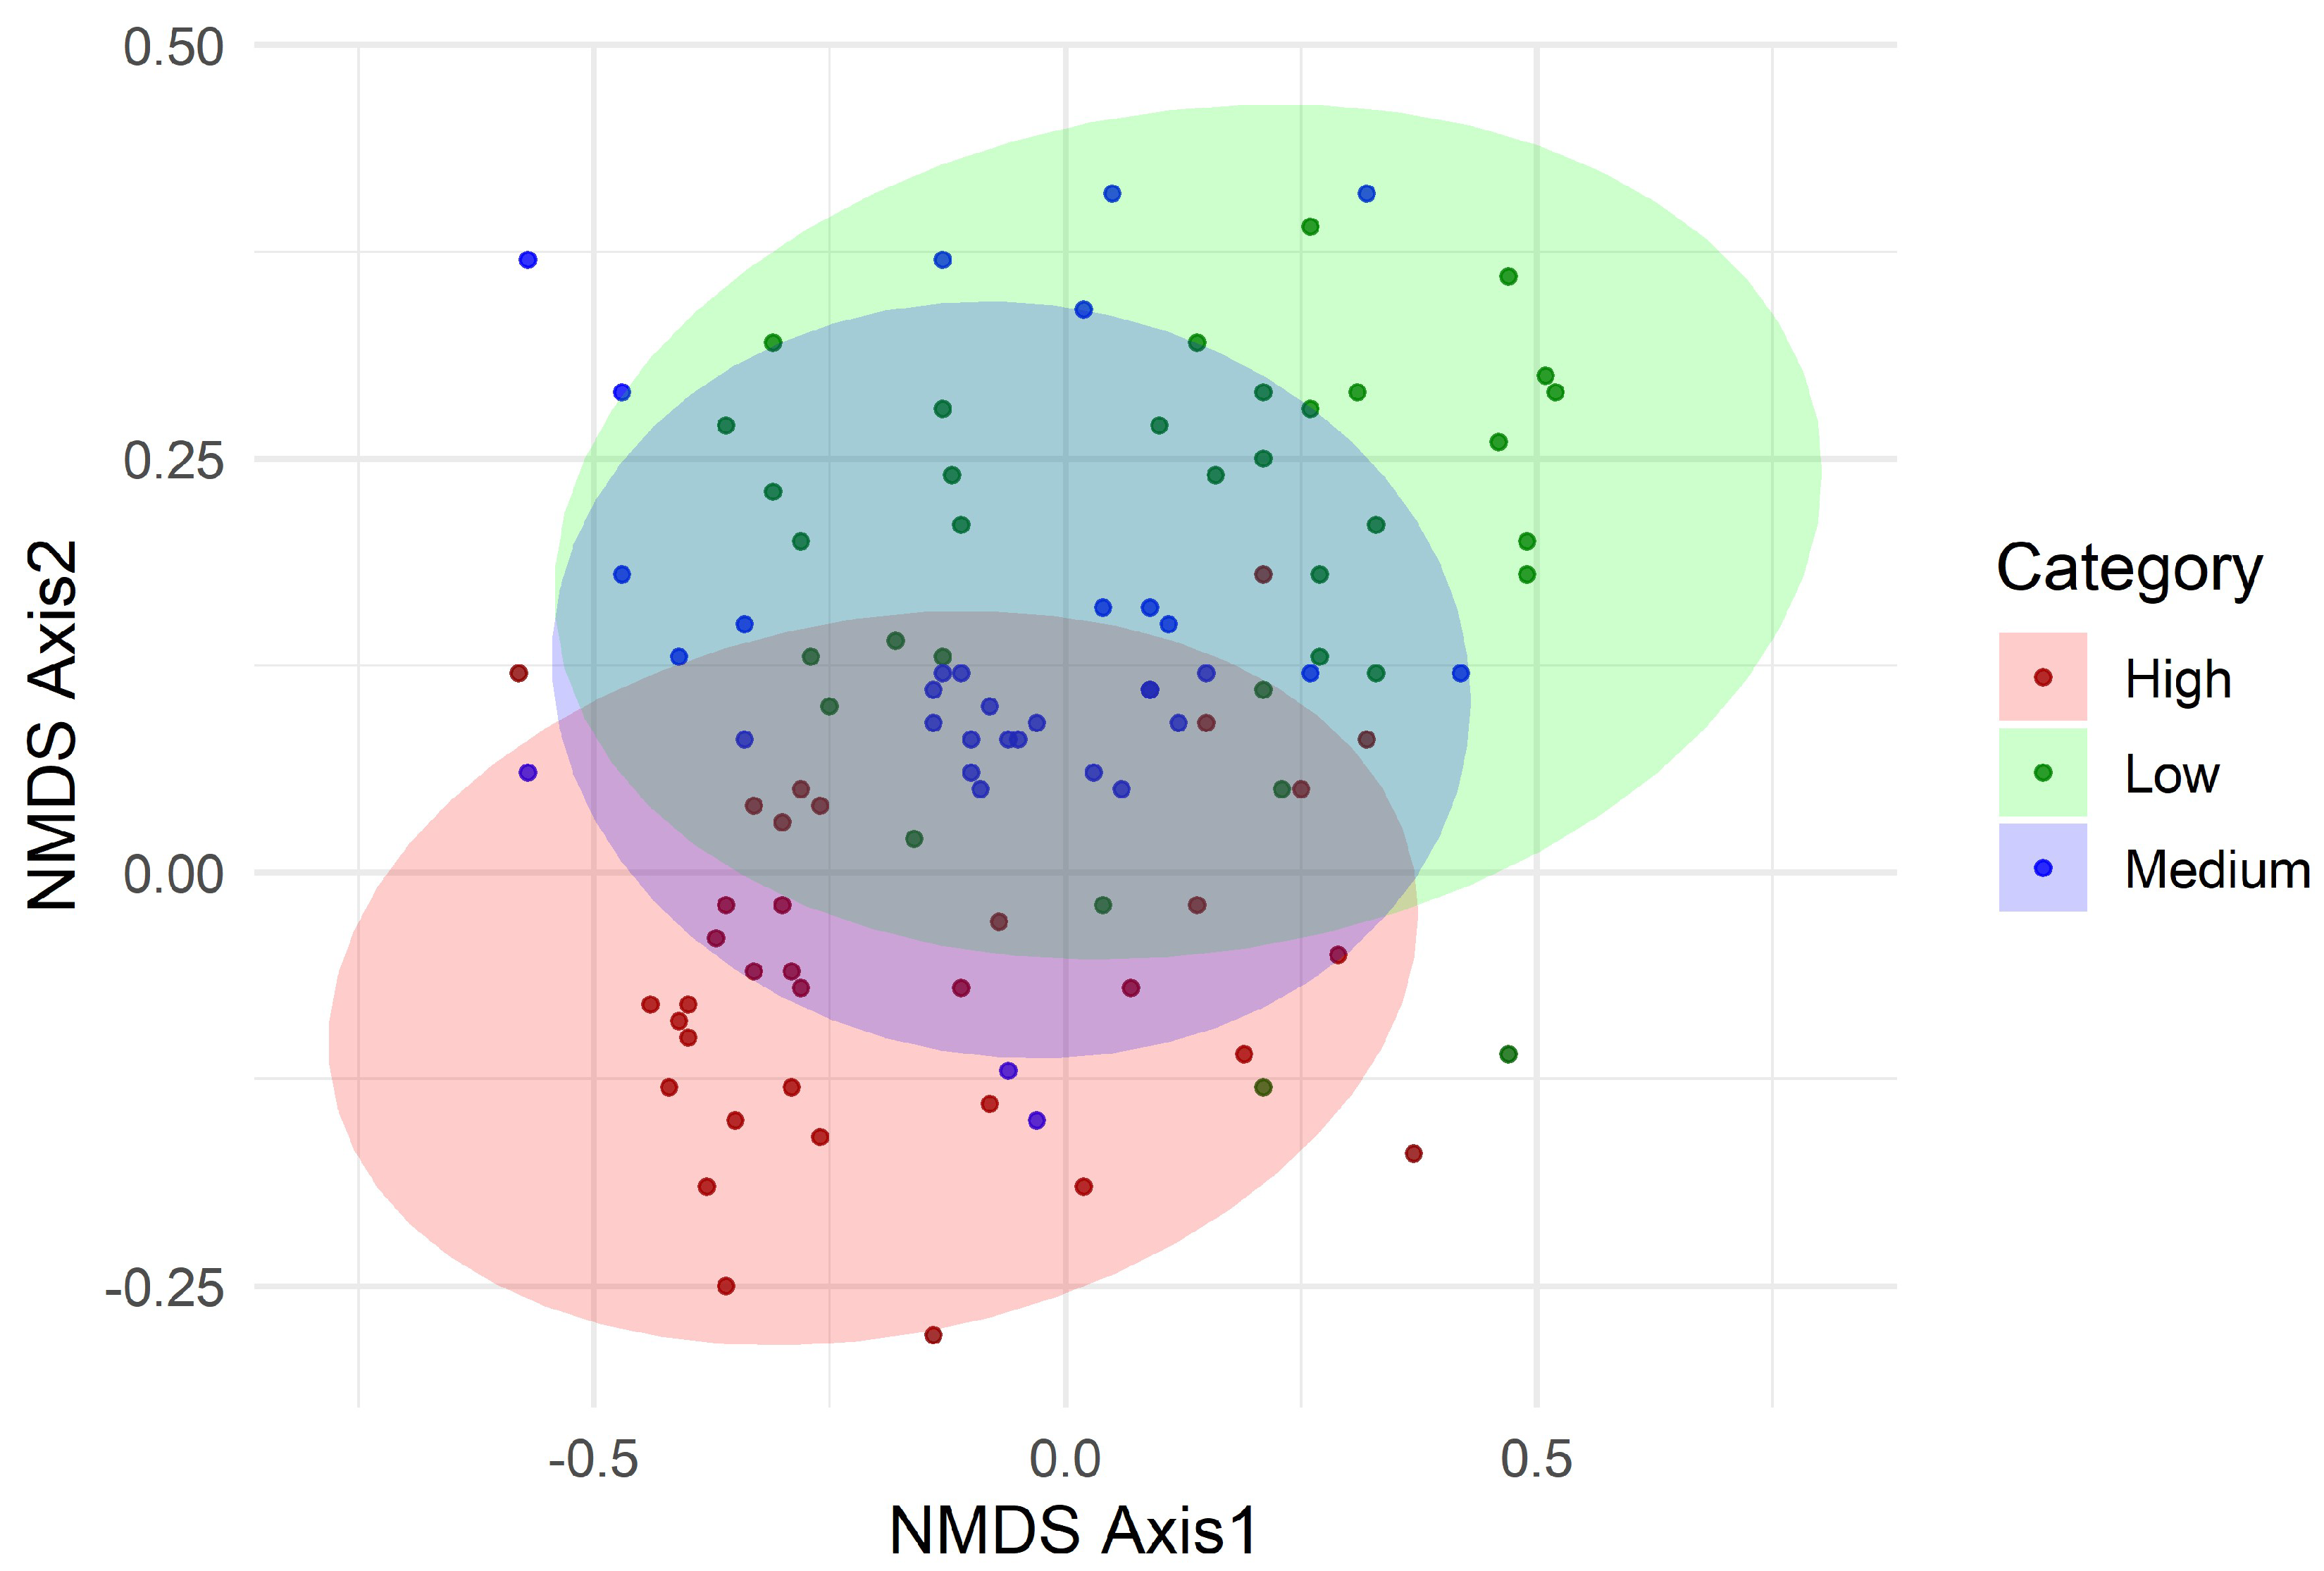

Table 1.
Disturbance Index (DI, %) and relative contributions of disturbance factors across low-disturbance (LD), moderate-disturbance (MD), and high-disturbance (HD) forest categories in Dharmapur National Park, Bangladesh.
Table 1.
Disturbance Index (DI, %) and relative contributions of disturbance factors across low-disturbance (LD), moderate-disturbance (MD), and high-disturbance (HD) forest categories in Dharmapur National Park, Bangladesh.
| Disturbance category | Disturbance Index (%) | Disturbance Factors (%) | ||||||||
|---|---|---|---|---|---|---|---|---|---|---|
| Grazing | Cut stump density | Canopy cover | Fuelwood collection | NTFPs collection | Litter collection | Forest fire | Settlement distance | Road distance | ||
| LD | 33.3 | 17.6 | 3.5 | 74.3 | 1.2 | 7.8 | 12.5 | 13.6 | 26.5 | 29.1 |
| MD | 51.8 | 32.3 | 11.4 | 56.1 | 1.9 | 9.3 | 14.3 | 12.9 | 36.7 | 48.4 |
| HD | 77.7 | 45.7 | 17.2 | 31.6 | 4.4 | 21.7 | 26.8 | 15.1 | 69.2 | 71.6 |
Table 2.
Species richness, diversity indices, and stand structural attributes across low-disturbance (LD), moderate-disturbance (MD), and high-disturbance (HD) forest categories in Dharmapur National Park.
Table 2.
Species richness, diversity indices, and stand structural attributes across low-disturbance (LD), moderate-disturbance (MD), and high-disturbance (HD) forest categories in Dharmapur National Park.
| Parameter | LD | MD | HD | F-value | p-value |
|---|---|---|---|---|---|
| Number of Species | 35 | 25 | 17 | - | - |
| Number of Family | 19 | 15 | 10 | - | - |
| Number of Genera | 27 | 21 | 15 | - | - |
| Shannon–Wiener index (H′) | 2.36 ± 0.07 | 2.24 ± 0.05 | 2.12 ± 0.05 | 4.25 | <0.001 |
| Pielou’s evenness (J′) | 0.31 ± 0.02 | 0.34 ± 0.02 | 0.38 ± 0.01 | 17.12 | 0.006 |
| Simpson’s dominance (D) | 0.24 ± 0.01 | 0.20 ± 0.01 | 0.15 ± 0.02 | 3.78 | 0.001 |
| Tree density | 802 ± 86.3 | 585 ± 61.4 | 397 ± 36.2 | 48.42 | <0.001 |
| Basal Area | 25.7 ± 3.8 | 18.6 ± 2.1 | 13.4 ± 1.8 | 22.57 | <0.001 |
Table 3.
Tree species recorded across disturbance categories in Dharmapur National Park, showing presence/absence and distribution patterns.
Table 3.
Tree species recorded across disturbance categories in Dharmapur National Park, showing presence/absence and distribution patterns.
| Name of species |
Family |
Disturbance Category | ||||||||
|---|---|---|---|---|---|---|---|---|---|---|
| LD | MD | HD | ||||||||
| TD (ind. ha-1) |
BA (m2 ha-1) |
IVI | TD (ind. ha-1) |
BA (m2 ha-1) |
IVI | TD (ind. ha-1) |
BA (m2 ha-1) |
IVI | ||
| Acacia auriculiformis A.Cunn. ex Benth. | Fabaceae | 36 | 2.31 | 34.1 | 14 | 1.14 | 25.01 | 8 | 1.2 | 10.13 |
| Ardisia solanacea Roxb. | Primulaceae | 2 | 0.16 | 1.01 | - | - | - | - | - | - |
| Artocarpus heterophyllus Lam. | Moraceae | 20 | 1.15 | 12.59 | 24 | 1.61 | 20.56 | 16 | 1.19 | 17.8 |
| Artocarpus lacucha Buch.-Ham. | Moraceae | 6 | 0.16 | 3.99 | 4 | 0.19 | 2.32 | 4 | 0.24 | 4.2 |
| Bauhinia acuminata L. | Fabaceae | 28 | 1.23 | 15.95 | - | - | - | - | - | - |
| Bombax ceiba L. | Malvaceae | 6 | 0.16 | 3.13 | 12 | 0.62 | 13.27 | 6 | 0.34 | 7.81 |
| Butea monosperma (Lam.) Taub. | Fabaceae | - | - | - | - | - | - | 4 | 0.22 | 4.24 |
| Cassia fistula L. | Fabaceae | 18 | 0.6 | 12.19 | 14 | 0.76 | 11.56 | 8 | 0.53 | 6.43 |
| Cassia javanica L. | Fabaceae | 2 | 0.04 | 0.93 | - | - | - | - | - | - |
| Cassia roxburghii DC. | Fabaceae | 6 | 0.43 | 5.05 | 2 | 0.04 | 5.35 | - | - | - |
| Dillenia indica L. | Dilleniaceae | 8 | 0.37 | 11.09 | 4 | 0.07 | 3.37 | - | - | - |
| Dipterocarpus turbinatus C.F.Gaertn. | Dipterocarpaceae | 60 | 3.39 | 37.49 | 15 | 1.95 | 13.67 | - | - | - |
| Elaeocarpus serratus L. | Elaeocarpaceae | - | - | - | 11 | 0.13 | 6.37 | 6 | 0.3 | 7.6 |
| Ficus benghalensis L. | Moraceae | 2 | 0.12 | 3.15 | - | - | - | - | - | - |
| Ficus benjamina L. | Moraceae | 4 | 0.1 | 2.24 | - | - | - | - | - | - |
| Ficus hispida L.f. | Moraceae | 38 | 6.34 | 37.25 | 24 | 4.12 | 29.93 | 4 | 0.43 | 5.47 |
| Ficus rumphii Bl. | Moraceae | 22 | 1.04 | 14.13 | 10 | 0.33 | 8.27 | - | - | - |
| Flacourtia indica (Burm.f.) Merr. | Salicaceae | 24 | 0.58 | 18.33 | 34 | 1.02 | 26.76 | - | - | - |
| Gmelina arborea Roxb. | Lamiaceae | 54 | 2.93 | 44.99 | - | - | - | 4 | 0.29 | 4.86 |
| Hydrolea zeylanica (L.) Vahl | Hydroleaceae | 6 | 0.31 | 4.35 | 24 | 0.71 | 18.35 | - | - | - |
| Lagerstroemia indica L. | Lythraceae | 40 | 2.28 | 31.99 | 32 | 1.4 | 24.38 | 38 | 1.86 | 32.93 |
| Lannea coromandelica (Houtt.) Merr. | Anacardiaceae | 18 | 1.23 | 24.9 | 20 | 0.99 | 14.41 | 10 | 0.29 | 12.32 |
| Litsea monopetala (Roxb.) Pers. | Lauraceae | 2 | 0.01 | 1.38 | - | - | - | - | - | - |
| Madhuca indica J.F. Gmel. | Sapotaceae | 8 | 0.1 | 6.16 | 6 | 0.13 | 4.1 | - | - | - |
| Mangifera indica L. | Anacardiaceae | 22 | 1.08 | 21.35 | 22 | 0.91 | 8.73 | - | - | - |
| Neolamarckia cadamba (Roxb.) Bosser | Rubiaceae | 32 | 5.98 | 38 | 24 | 5.47 | 34.11 | - | - | - |
| Phyllanthus acidus (L.) Skeels | Phyllanthaceae | 4 | 0.17 | 1.83 | - | - | - | - | - | - |
| Phyllanthus emblica L. | Phyllanthaceae | 20 | 1.12 | 11.16 | - | - | - | - | - | - |
| Semecarpus anacardium L.f. | Anacardiaceae | - | - | - | 2 | 0.07 | 1.19 | 2 | 0.05 | 1.02 |
| Shorea robusta Gaertn. f. | Dipterocarpaceae | 316 | 16.11 | 325.32 | 212 | 11.59 | 216.93 | 154 | 6.38 | 142.67 |
| Spondias pinnata (L.f.) Kurz | Anacardiaceae | 38 | 1.39 | 16.37 | 22 | 1.17 | 17.96 | 14 | 0.49 | 15.07 |
| Syzygium jambos L. (Alston) | Myrtaceae | 18 | 1.14 | 13.93 | - | - | - | 8 | 0.42 | 6.3 |
| Terminalia arjuna (Roxb.) Wight & Arn. | Combretaceae | 24 | 0.8 | 9.36 | 12 | 0.26 | 7.89 | - | - | - |
| Terminalia bellirica (Gaertn.) Roxb. | Combretaceae | 32 | 1.57 | 17.65 | 8 | 0.39 | 6.8 | 8 | 0.12 | 5.97 |
| Terminalia chebula Retz. | Combretaceae | 54 | 2.43 | 33.47 | - | - | - | - | - | - |
| Terminalia reticulata Engl. | Combretaceae | 58 | 3.12 | 47.92 | - | - | - | - | - | - |
| Trema orientale (L.) Blume | Cannabaceae | 6 | 0.11 | 3.22 | 4 | 0.16 | 2.2 | 4 | 0.2 | 3.41 |
| Trewia nudiflora L. | Euphorbiaceae | - | - | - | 4 | 0.22 | 2.92 | - | - | - |
| Ziziphus mauritiana Lam. | Rhamnaceae | 8 | 0.21 | 2.58 | - | - | - | - | - | - |
Table 4.
Pairwise similarity indices (Jaccard and Bray–Curtis) of tree species composition among low-disturbance (LD), moderate-disturbance (MD), and high-disturbance (HD) forest categories in Dharmapur National Park.
Table 4.
Pairwise similarity indices (Jaccard and Bray–Curtis) of tree species composition among low-disturbance (LD), moderate-disturbance (MD), and high-disturbance (HD) forest categories in Dharmapur National Park.
| Disturbance Category | Jaccard Index | Bray-Curtis Index | |||||
|---|---|---|---|---|---|---|---|
| LD | MD | HD | LD | MD | HD | ||
| LD | 1 | 1 | 0.87 | 0.82 | |||
| MD | 0.75 | 1 | 1 | 0.80 | |||
| HD | 0.69 | 0.72 | 1 | 1 | |||
Disclaimer/Publisher’s Note: The statements, opinions and data contained in all publications are solely those of the individual author(s) and contributor(s) and not of MDPI and/or the editor(s). MDPI and/or the editor(s) disclaim responsibility for any injury to people or property resulting from any ideas, methods, instructions or products referred to in the content. |
© 2025 by the authors. Licensee MDPI, Basel, Switzerland. This article is an open access article distributed under the terms and conditions of the Creative Commons Attribution (CC BY) license (http://creativecommons.org/licenses/by/4.0/).
Copyright: This open access article is published under a Creative Commons CC BY 4.0 license, which permit the free download, distribution, and reuse, provided that the author and preprint are cited in any reuse.


