Preprint
Article

This version is not peer-reviewed.

Assessing Anthropogenic Drivers and Biodiversity Indicators of Miombo Woodland Degradation Across Development Stages in the Lubumbashi Charcoal Production Basin, DR Congo

Submitted:

10 March 2025

Posted:

11 March 2025

You are already at the latest version

Abstract

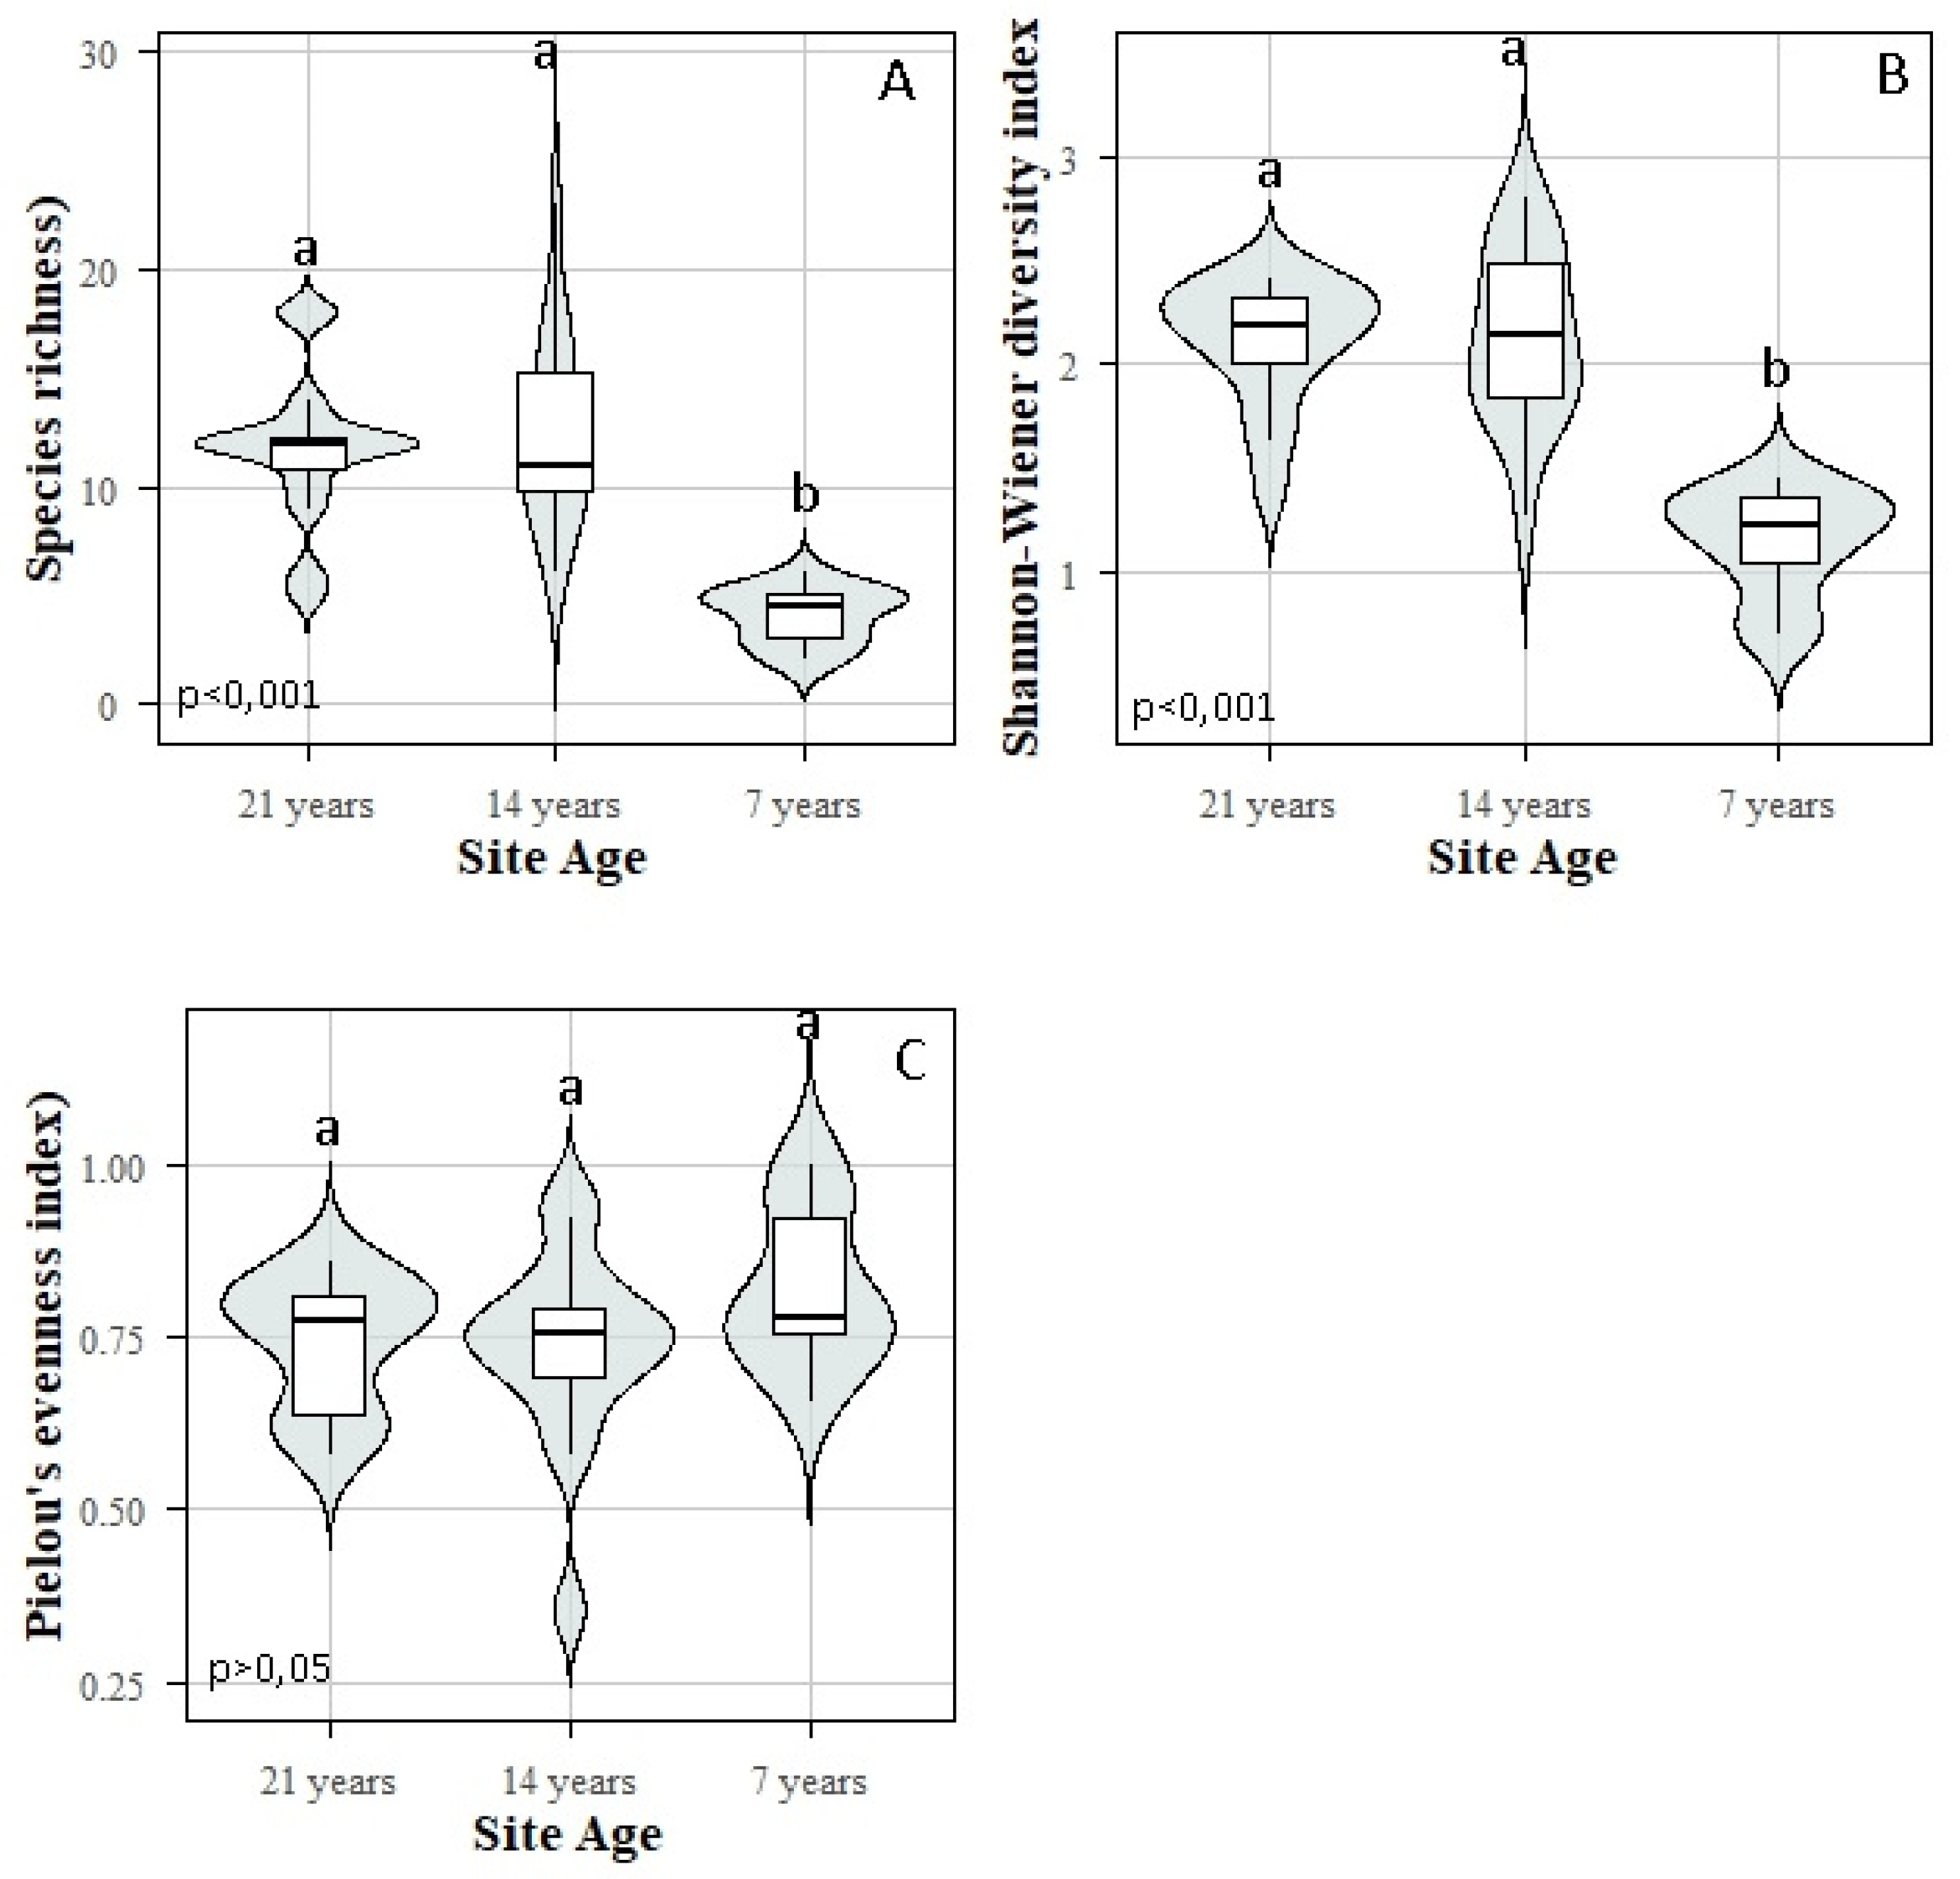
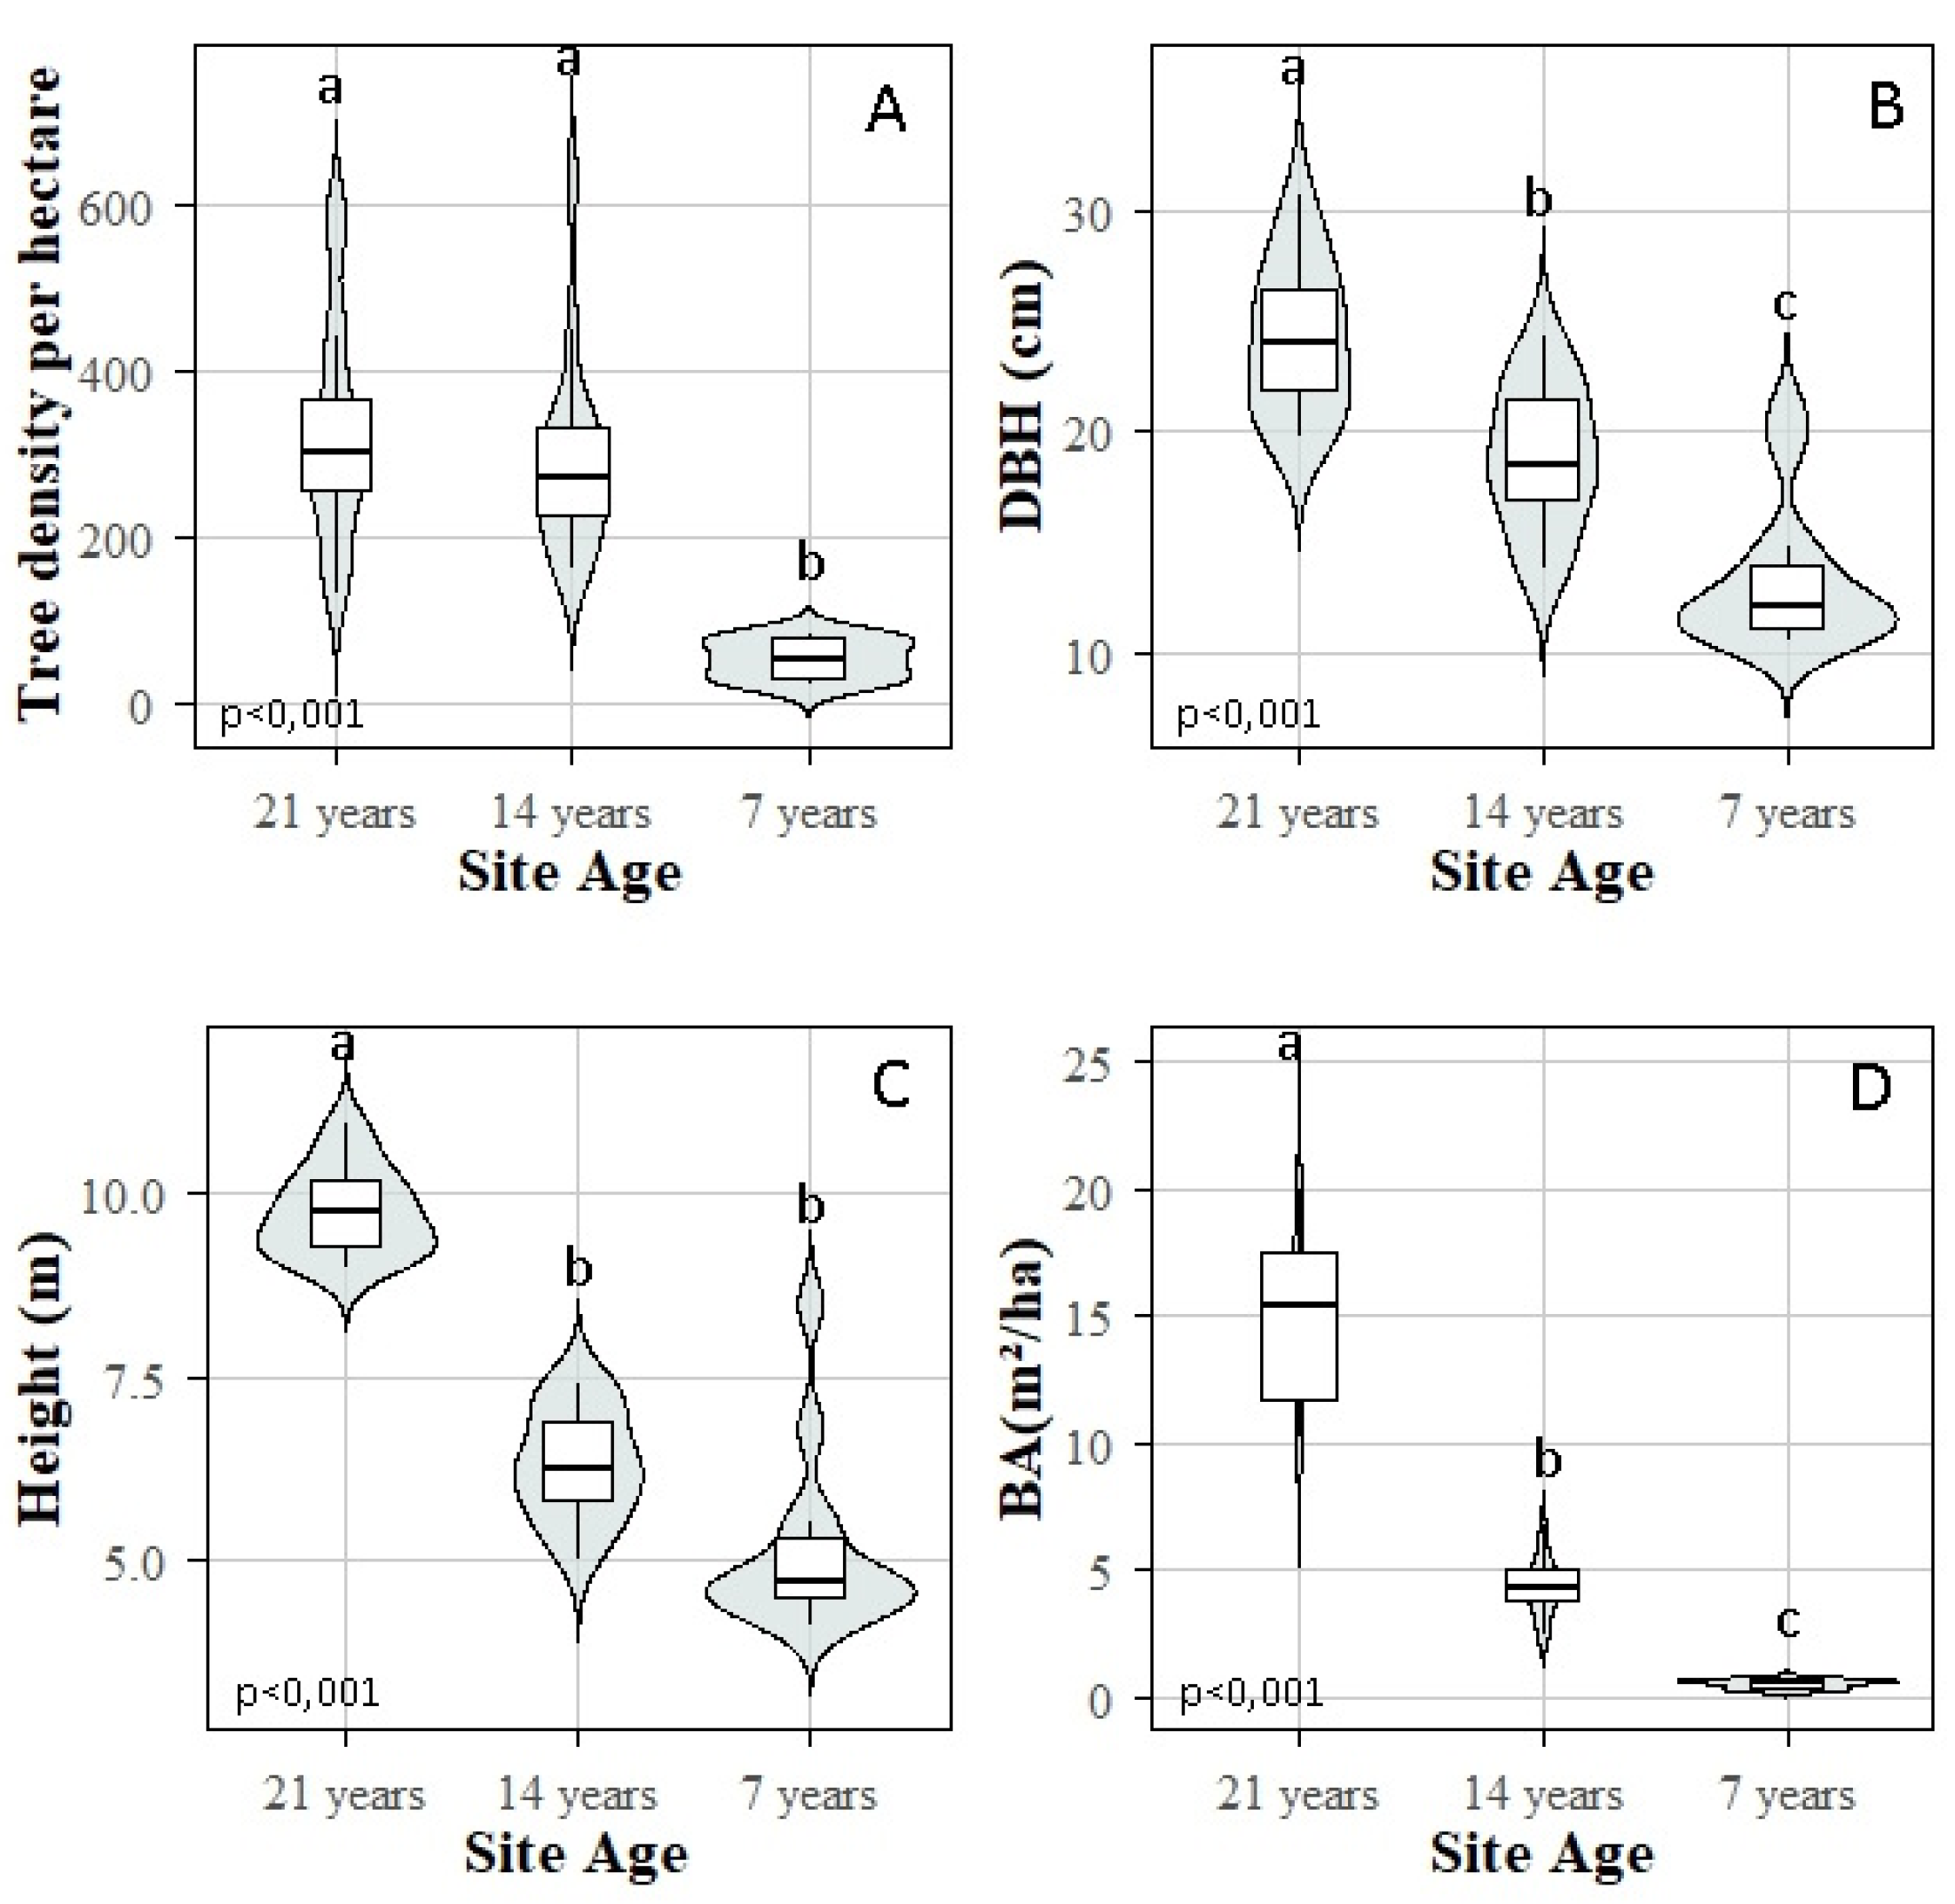
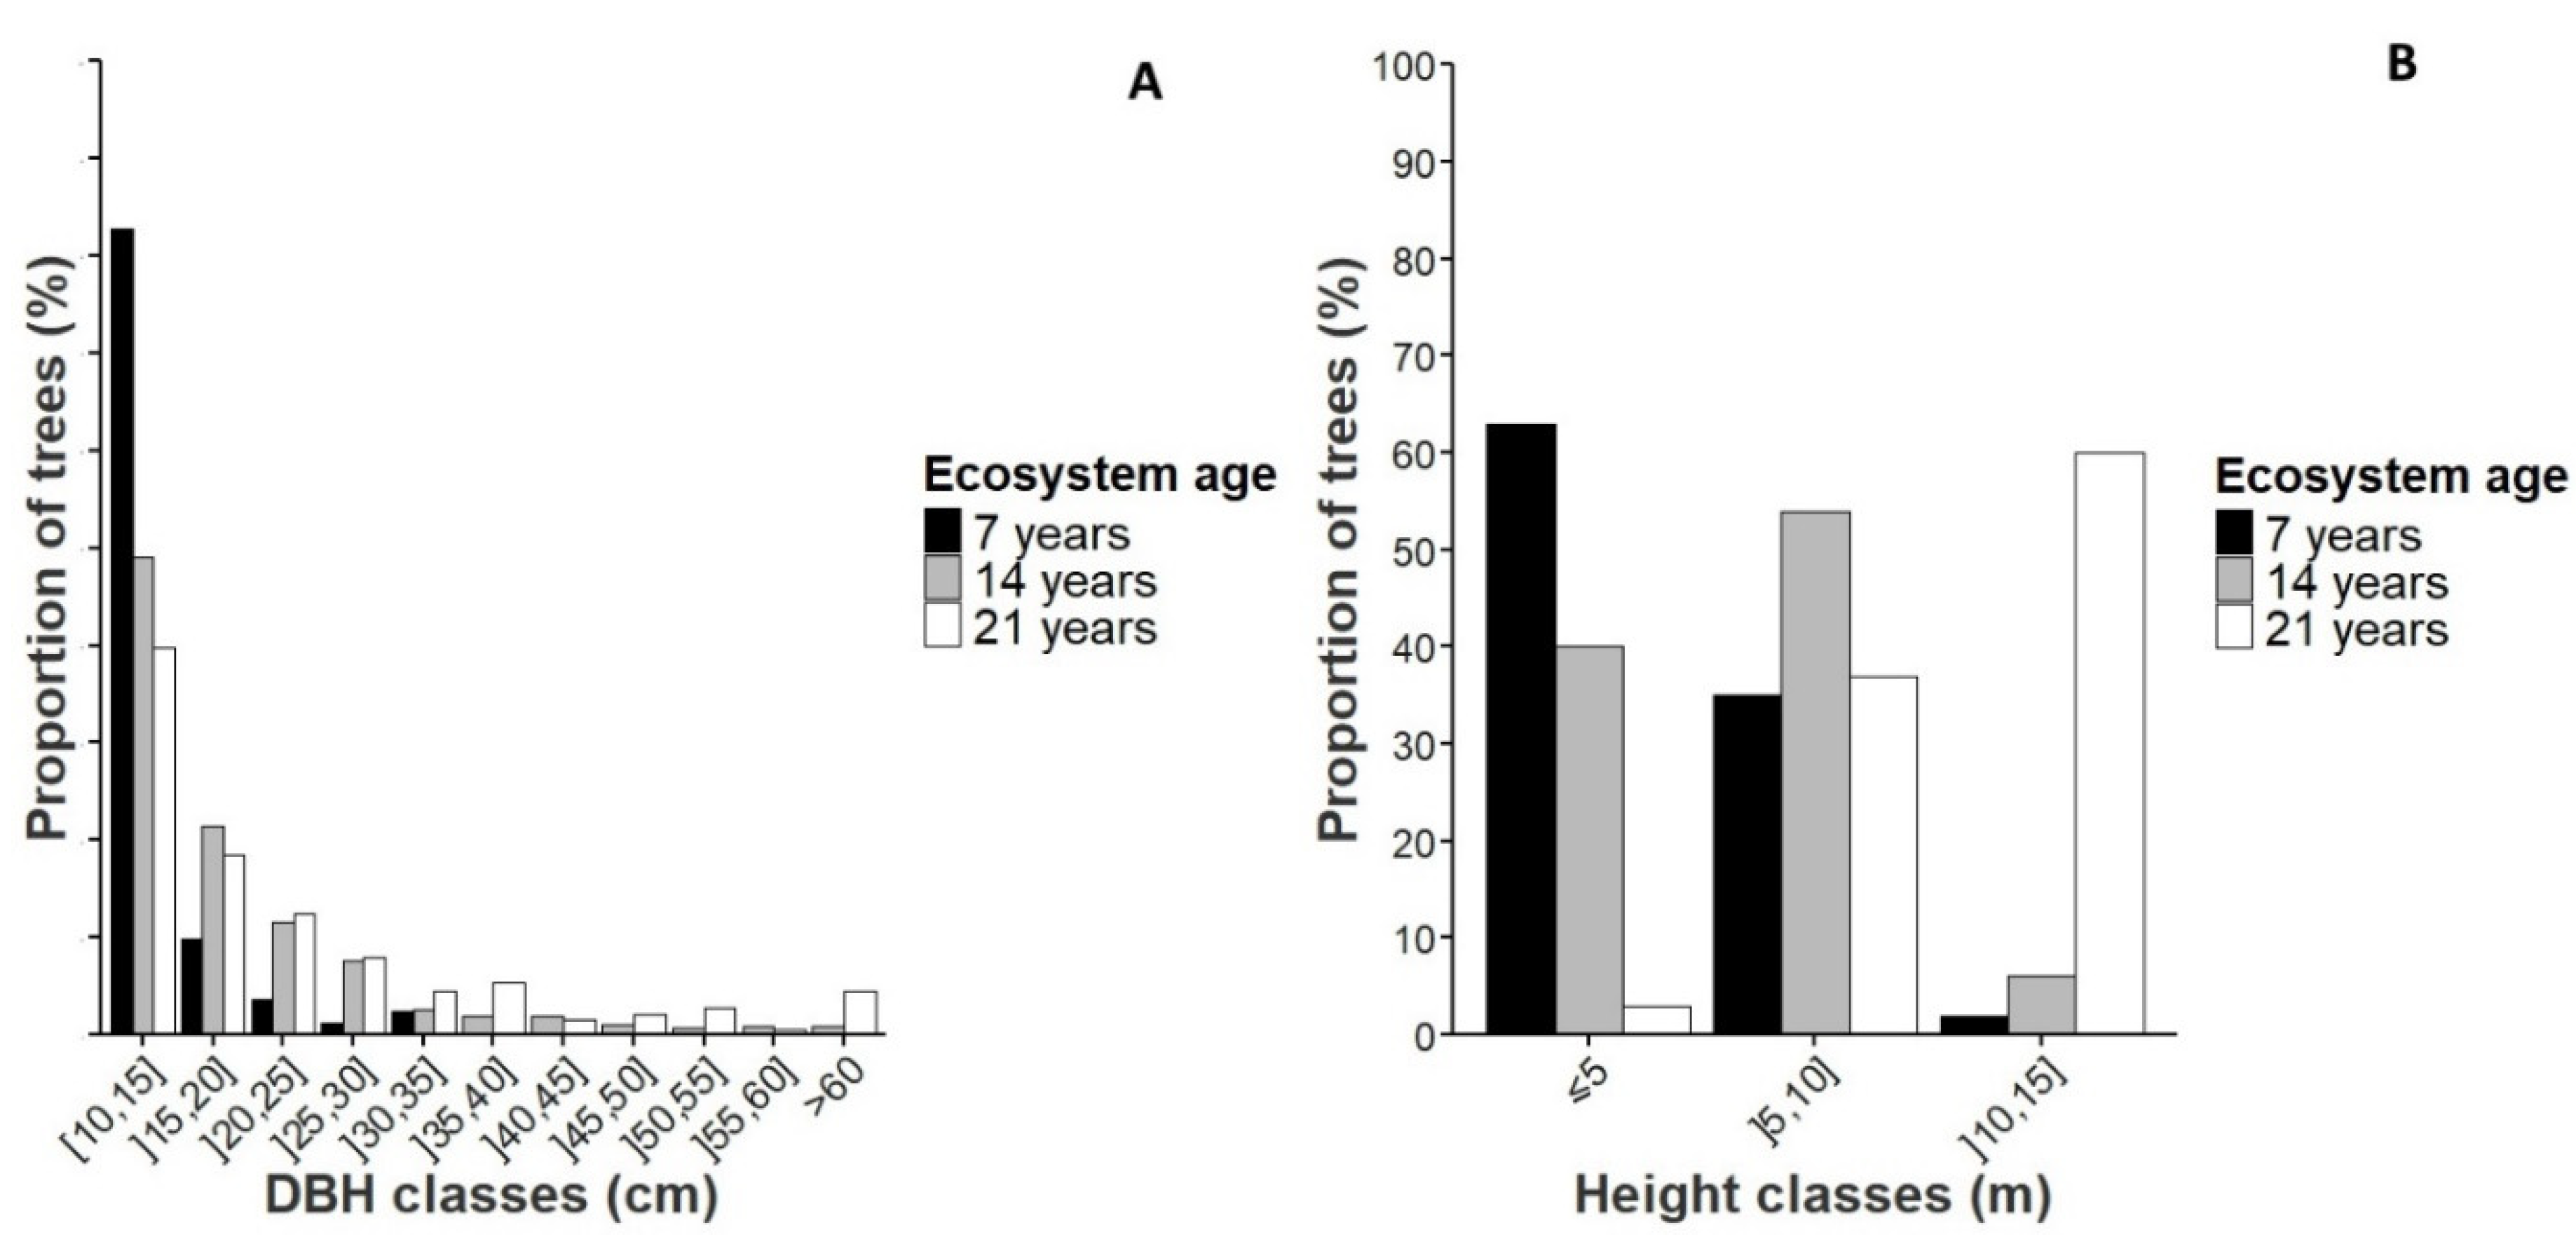
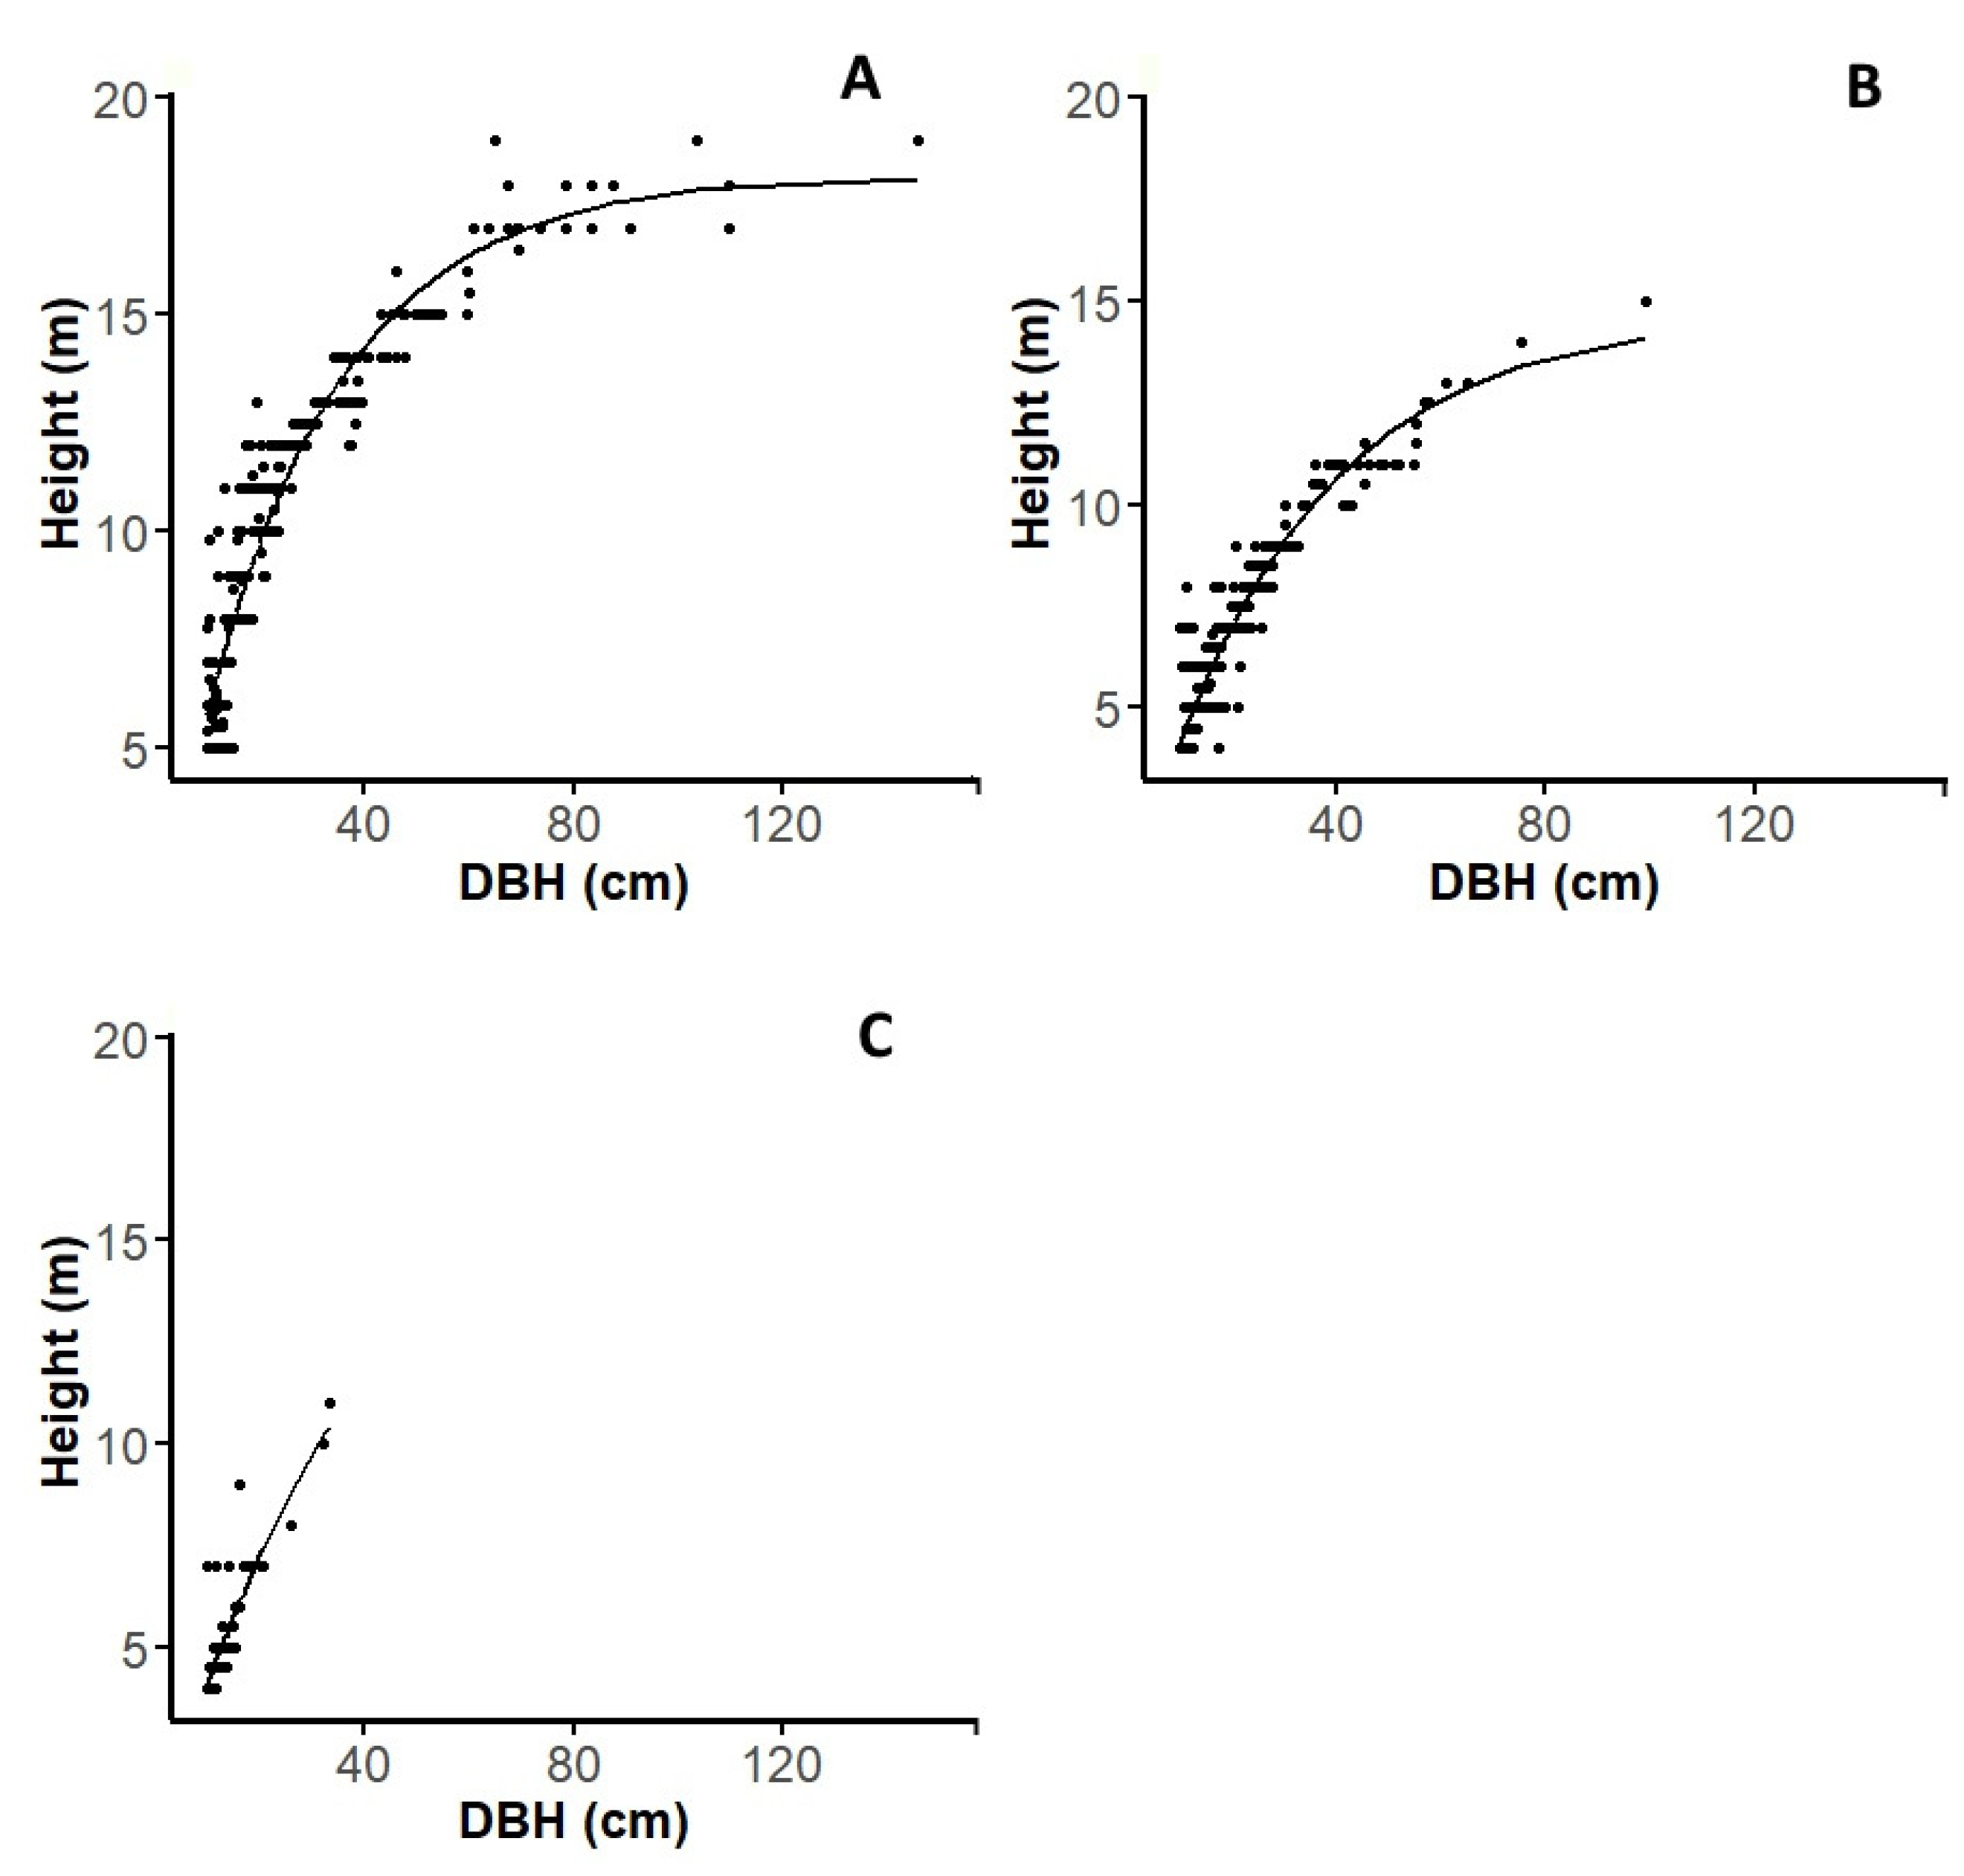
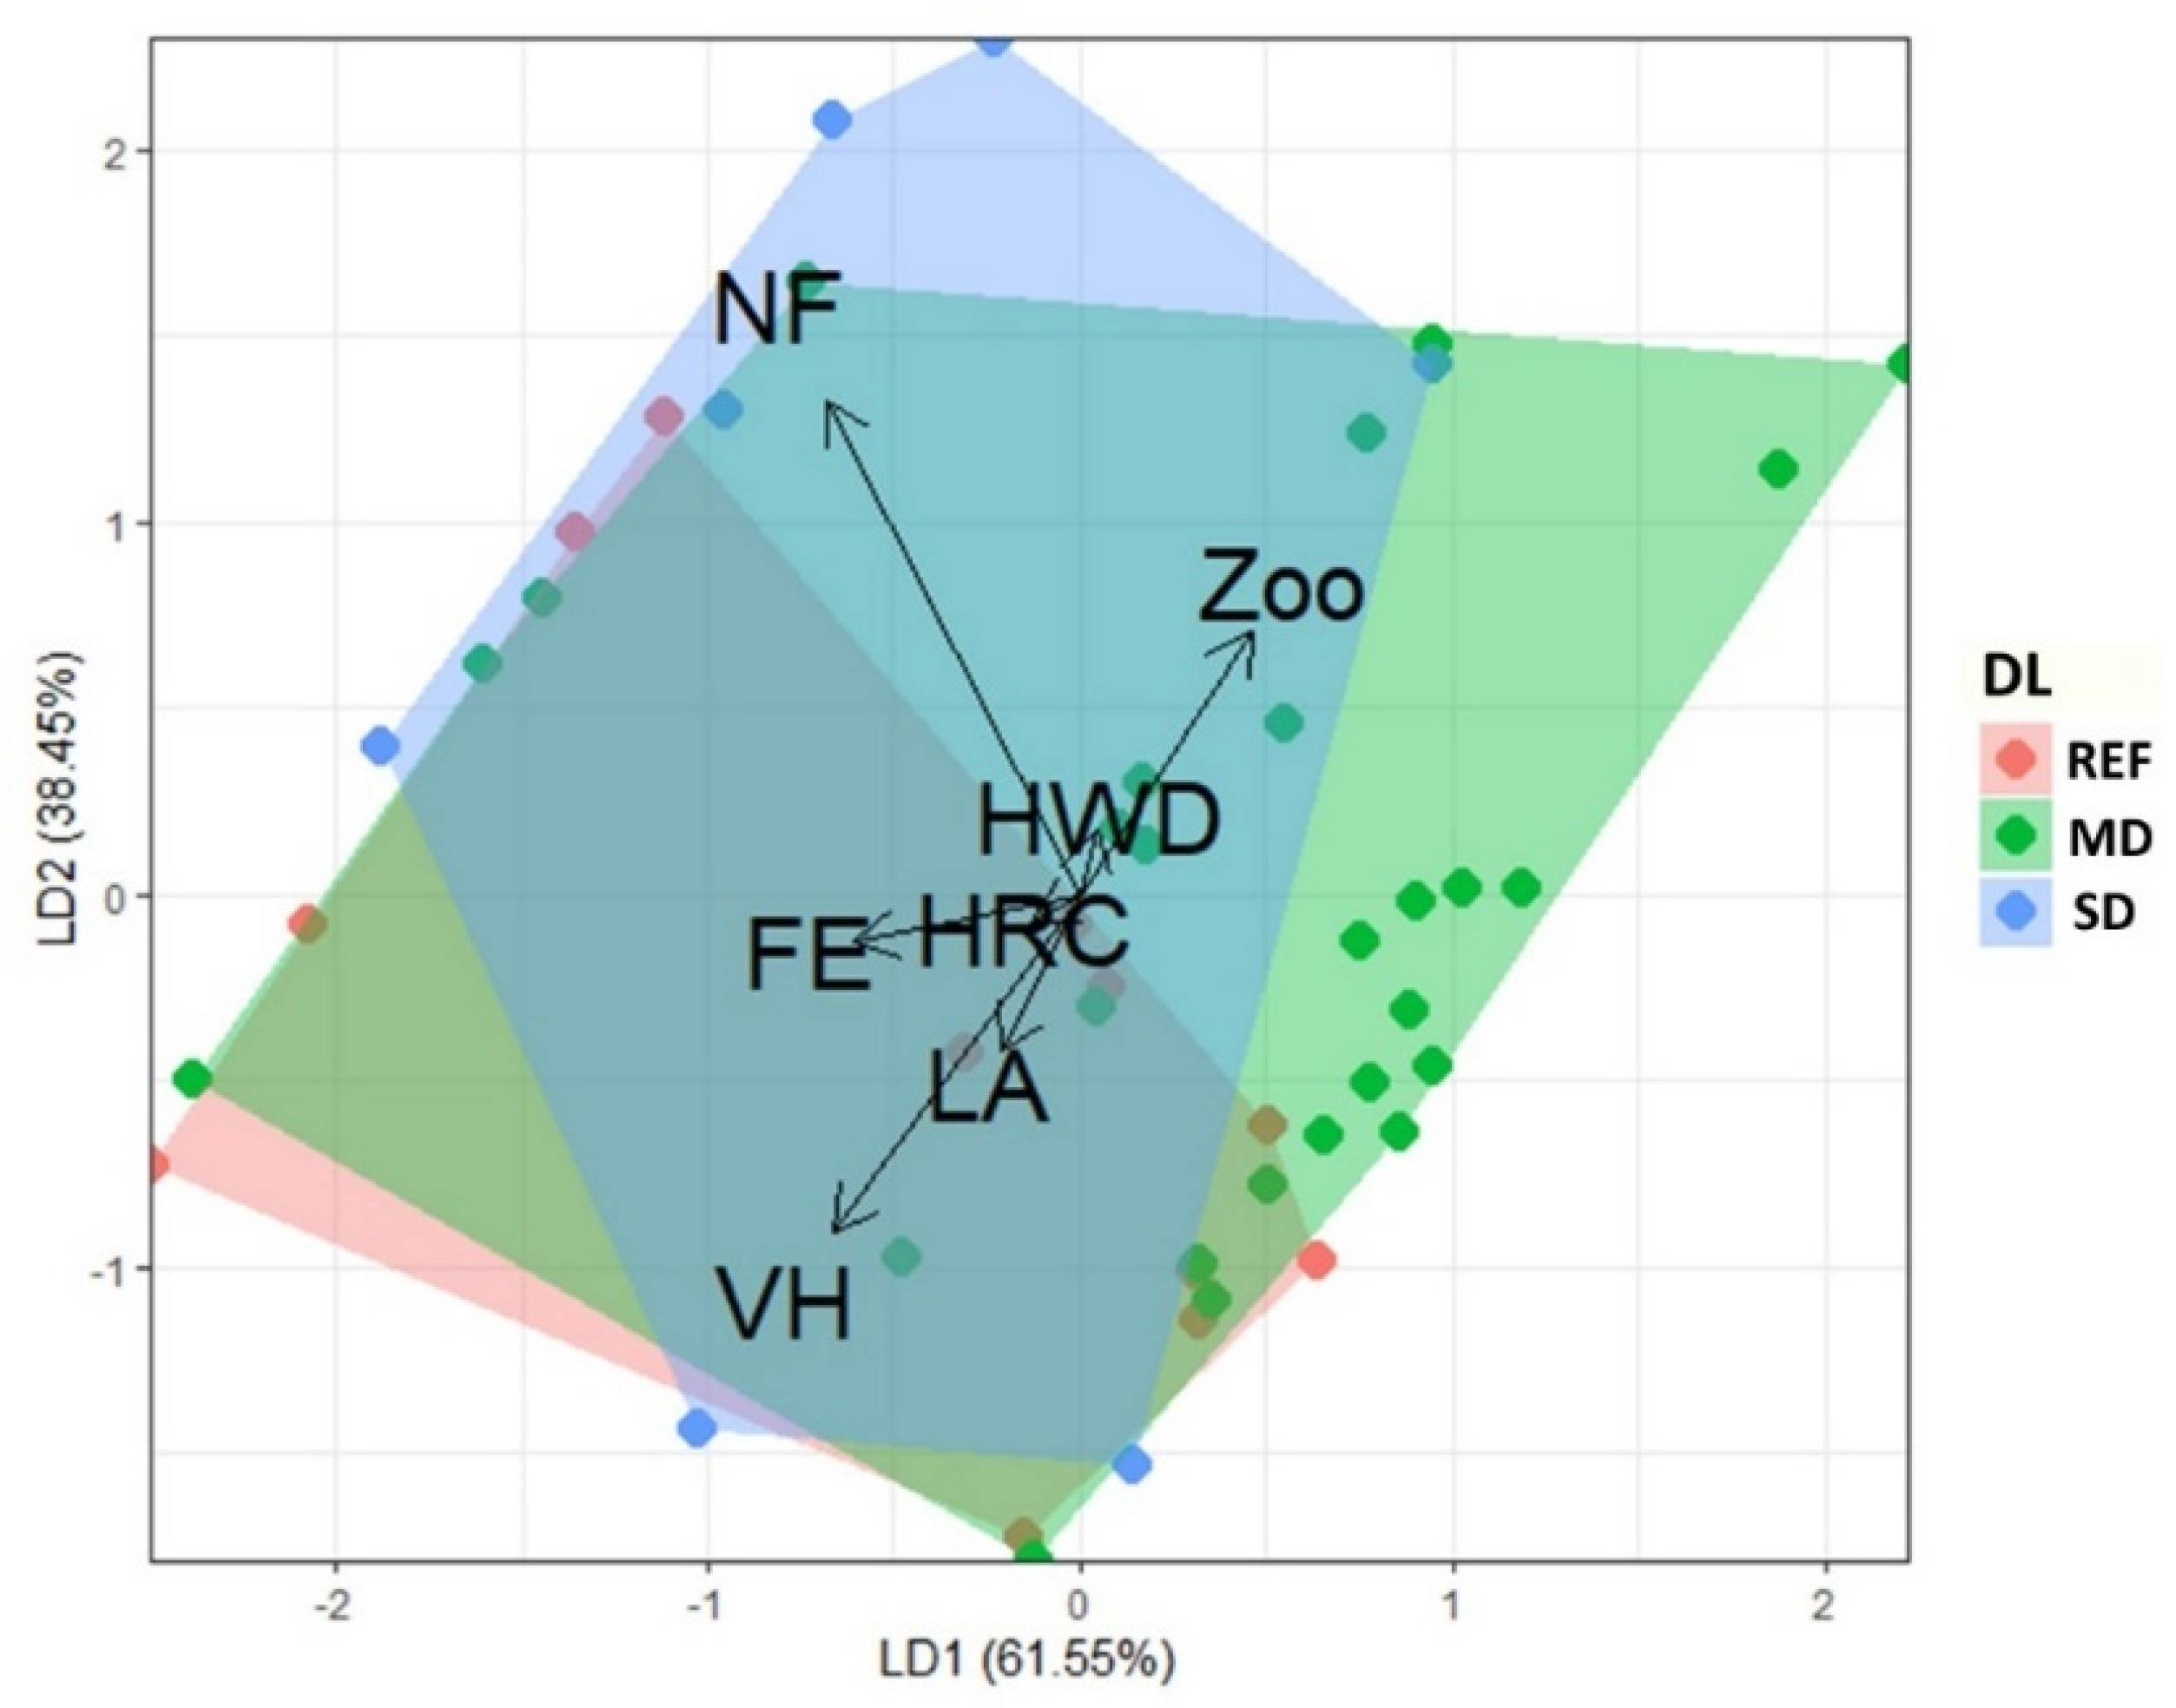
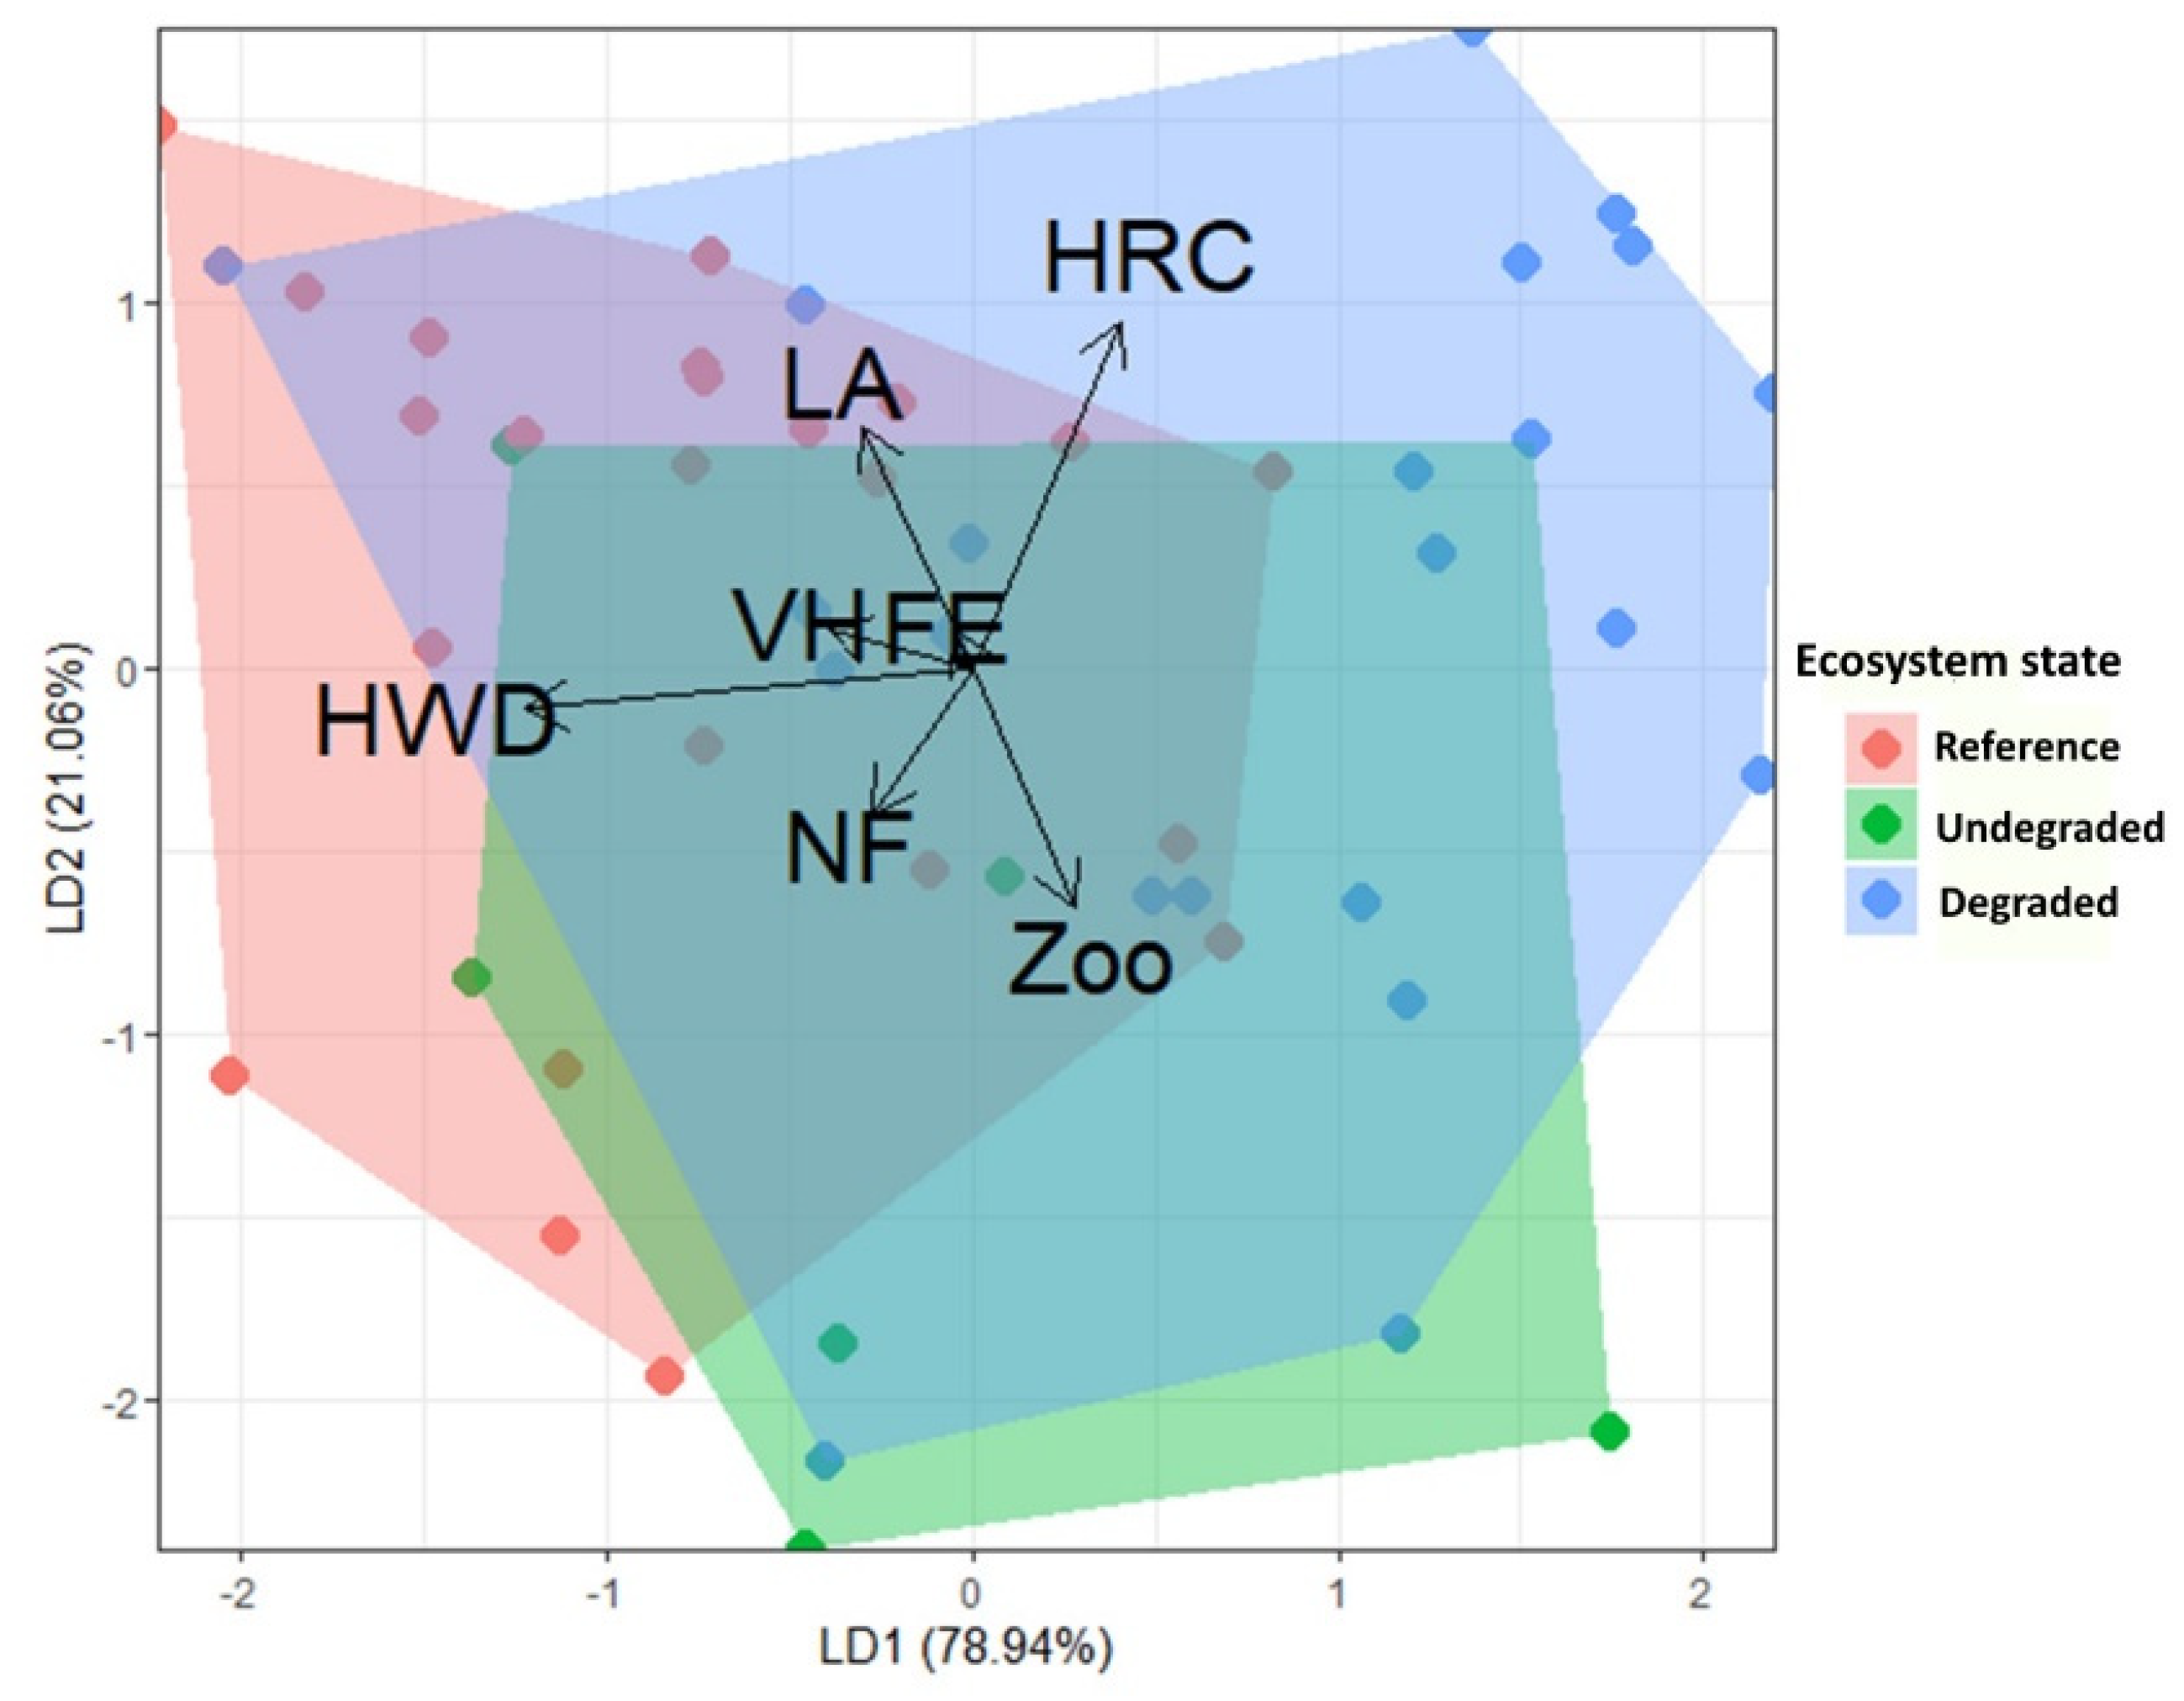
Miombo woodlands in the Lubumbashi Charcoal Production Basin (LCPB) provide critical ecosystem services and harbor biodiversity essential to both rural and urban populations. However, increasing energy demands intensify anthropogenic pressures, threatening their long-term sustainability. This study evaluates the principal anthropogenic drivers and biodiversity disturbance indicators across three developmental stages (7, 14, and 21 years) of miombo woodlands within the LCPB. Transect-based inventories assessed disturbance gradients, while plot-based surveys examined floristic composition and structure. Functional trait data were obtained from specialized online ecological databases. Results indicate that forest degradation within the LCPB is primarily driven by charcoal-related wood harvesting, fire events, and agricultural expansion, whereas exotic species invasion, debarking, and artisanal mining exert comparatively minor impacts. Disturbance patterns did not correlate significantly with proximity to villages, despite logging, fire, and agriculture being strongly interrelated. Analysis of the developmental stages revealed significant variations in biodiversity and dendrometric indicators. The highly degraded 7-year-old stage exhibited low floristic diversity, dominated by species such as Isoberlinia angolensis (abundance = 22), Julbernardia paniculata (18), and Brachystegia wangermeeana (6), and had poor structural metrics (90 individuals, 51 trees/ha, average DBH of 11.56 cm, average height of 4.47 m). The intermediate 14-year-old stage showed increased species diversity, notably B. wangermeeana (83), Brachystegia spiciformis (56), and Albizia adianthifolia (48), alongside improved structural values (456 individuals, 285 trees/ha, average DBH of 18.83 cm, average height of 6.31 m). The least degraded 21-year-old stage had the highest floristic diversity and structural values, with dominant species Marquesia macroura (88), Diplorhynchus condylocarpon (64), and Julbernardia globiflora (71), totaling 519 individuals, 323 trees/ha, average DBH of 24.20 cm, and average height of 9.64 m. Furthermore, ecosystem condition influenced functional traits, with disturbed areas favoring zoochorous dispersal and natural regeneration, but reducing wood density and nitrogen fixation. These findings underscore severe threats to LCPB woodlands and emphasize the importance of forest degradation stages in woodland development and resilience. Immediate action is recommended to regulate wood harvesting strictly, criminalize uncontrolled fires, monitor agriculture, and protect degraded areas to foster miombo woodland regeneration.

Keywords: 
;  ;  ;  ;  

1. Introduction

Forests play a crucial role in maintaining environmental balance, supporting biodiversity, and regulating the global climate through the ecosystem services they provide to communities [1]. However, they are increasingly threatened by deforestation and degradation due to anthropogenic pressures [2]. Forest degradation refers to the alteration of an ecosystem’s condition, composition, and structure, leading to a decline in its ability to deliver essential ecosystem services [3]. This phenomenon is particularly severe in biodiversity-rich tropical regions, with distinct regional drivers such as wildfires in the Amazon [4] et and logging in Southeast Asia [5].
In sub-Saharan Africa, where forests cover approximately 16% of the land and sustain the livelihoods of over two-thirds of the population [6], ecosystem fragmentation and land conversion accelerate forest degradation [7]. The consequences include biodiversity loss, soil degradation, and disrupted hydrological cycles, exacerbating food insecurity [8]. This issue is particularly critical in the miombo woodlands, which cover about 2 million km² across central and southern Africa, representing 10% of the continent’s forest cover [9,10]. Dominated by the genera Brachystegia, Julbernardia, and Isoberlinia (Ribeiro et al., 2020), these dry forests extend across Angola, Burundi, Malawi, Mozambique, southeastern Democratic Republic of the Congo (DRC), Tanzania, Zambia, and Zimbabwe [8,11]. They provide critical ecosystem services and support biodiversity essential to local communities [12].
The DRC has approximately 145 million hectares of forests, distributed across dense humid forests, montane forests, miombo woodlands, and savanna-forest mosaics. However, anthropogenic activities, particularly agricultural expansion and mining, are severely compromising ecosystem sustainability [13,14]. Miombo woodlands, which cover 11% of the national territory, are the dominant ecosystem in the mining region of Katanga in the southeast [15,16].
Around Lubumbashi, rapid urbanization and rising energy demand have led to intensive charcoal production and agricultural expansion, driving severe deforestation and structural forest degradation [15,17,18,19]. Between 1990 and 2022, Miombo cover in the charcoal production basin (LCPB) of Lubumbashi declined from 77.98% to 40.01%, largely replaced by savanna [20]. This decline has critical ecological and socio-economic implications, including reduced charcoal supply, increased energy costs, soil degradation, accelerated erosion, and disrupted hydrological cycles [21,18,22]. Given these challenges, a comprehensive assessment of anthropogenic drivers and degradation indicators is essential, particularly in the context of rapid urban expansion around Lubumbashi [17,23,19]. Such an analysis is crucial for informing environmental policies aimed at preserving tree biodiversity and promoting sustainable Miombo management in the LCPB and the broader Katanga mining region.
Previous studies in the region have primarily relied on medium-resolution remote sensing to evaluate human-driven land-use changes [24,19,25,20]. Other research has focused on floristic diversity and stand structure using field inventories [16,26,27,28,29]. However, no study has simultaneously assessed both disturbance factors and degradation indicators through forest inventories in this region. Field inventories are recognized as an effective method for detailed assessments of human impacts on forests, particularly in tropical ecosystems [30]. Refs. [31,32] in Madagascar demonstrated that forest inventories accurately identify degradation factors and indicators, offering a robust alternative to models and indirect datasets. This method is essential for developing sustainable forest management policies [33].
This study aims to identify anthropogenic drivers of disturbance and analyze floristic, dendrometric, and functional traits associated with Miombo degradation in the LCPB of Lubumbashi, based on three degradation stages (7, 14, and 21 years). Given Lubumbashi’s high charcoal demand, driven by limited electricity production and distribution [34], we hypothesize that wood harvesting for charcoal production is the primary driver of degradation. Additionally, we expect that logging intensity decreases with distance from villages, where human pressure is typically lower. Furthermore, we anticipate that degradation stage—reflecting ecosystem age and maturity—significantly influences floristic composition and dendrometric structure, with progressive increases in diversity, density, and the proportion of mature individuals as ecosystems recover. Finally, we hypothesize that increasing degradation favors species with fast-growth strategies and efficient dispersal mechanisms, to the detriment of conservative species with slow-growth strategies.

2. Materials and Methods
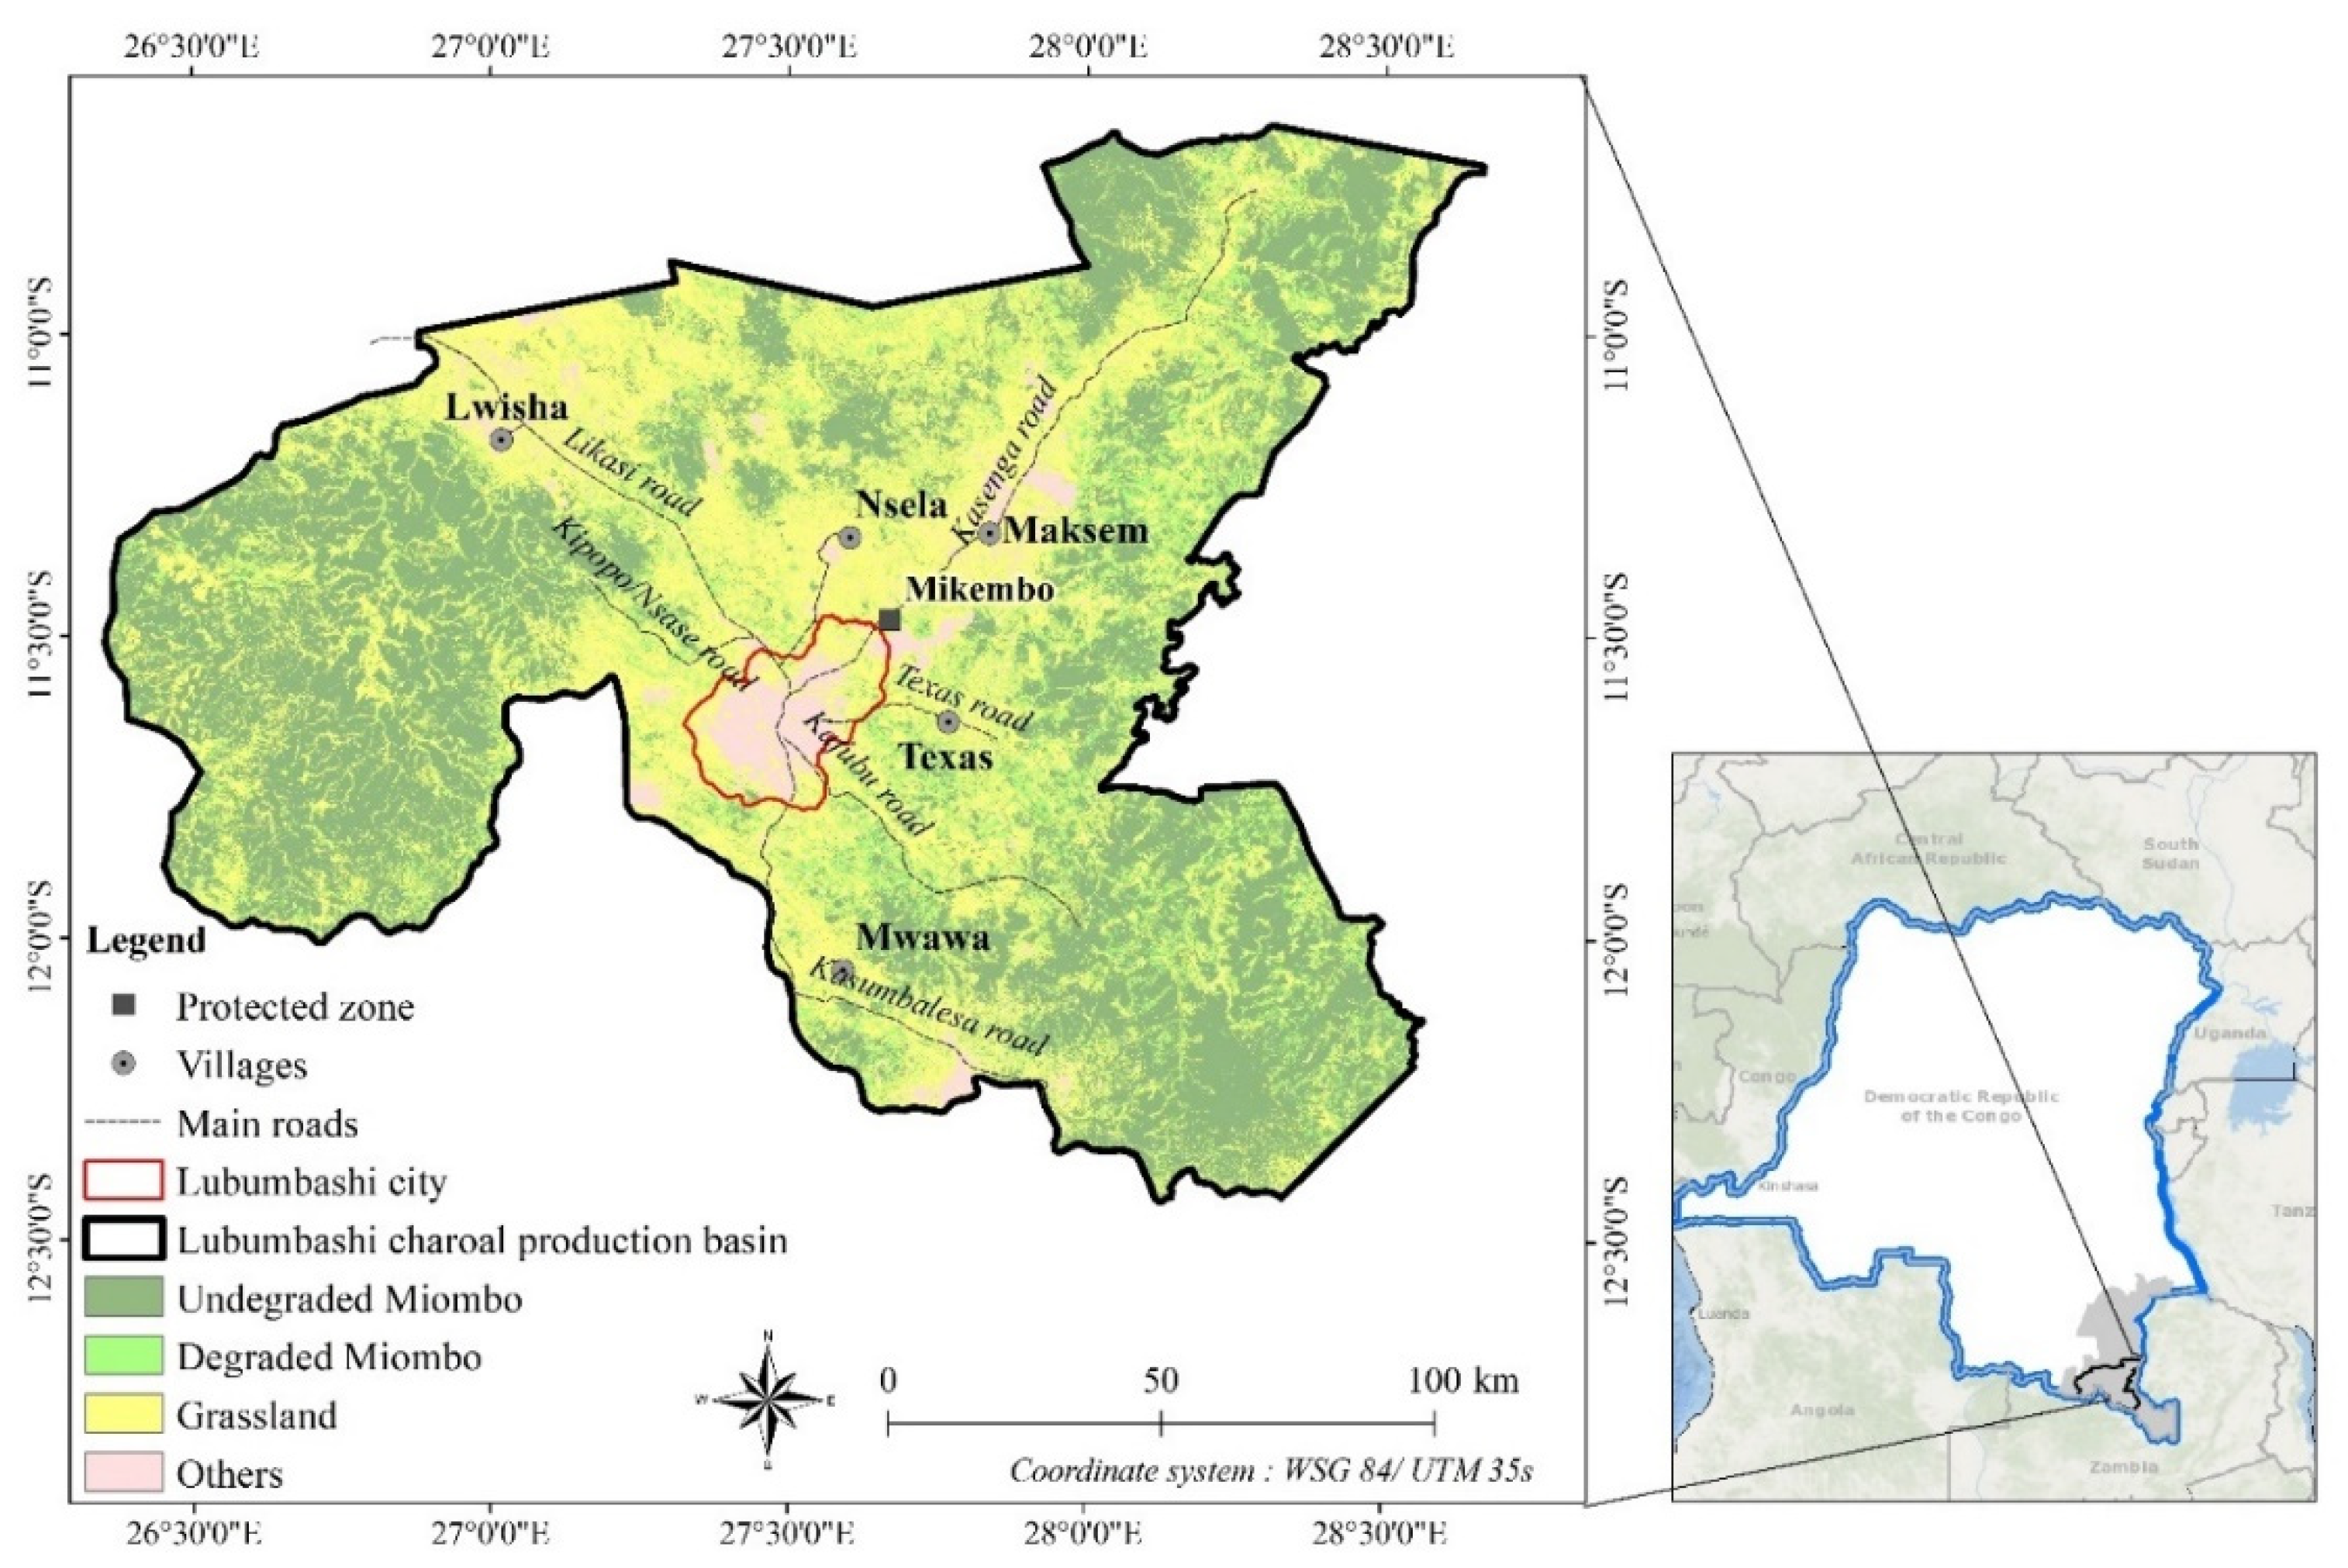
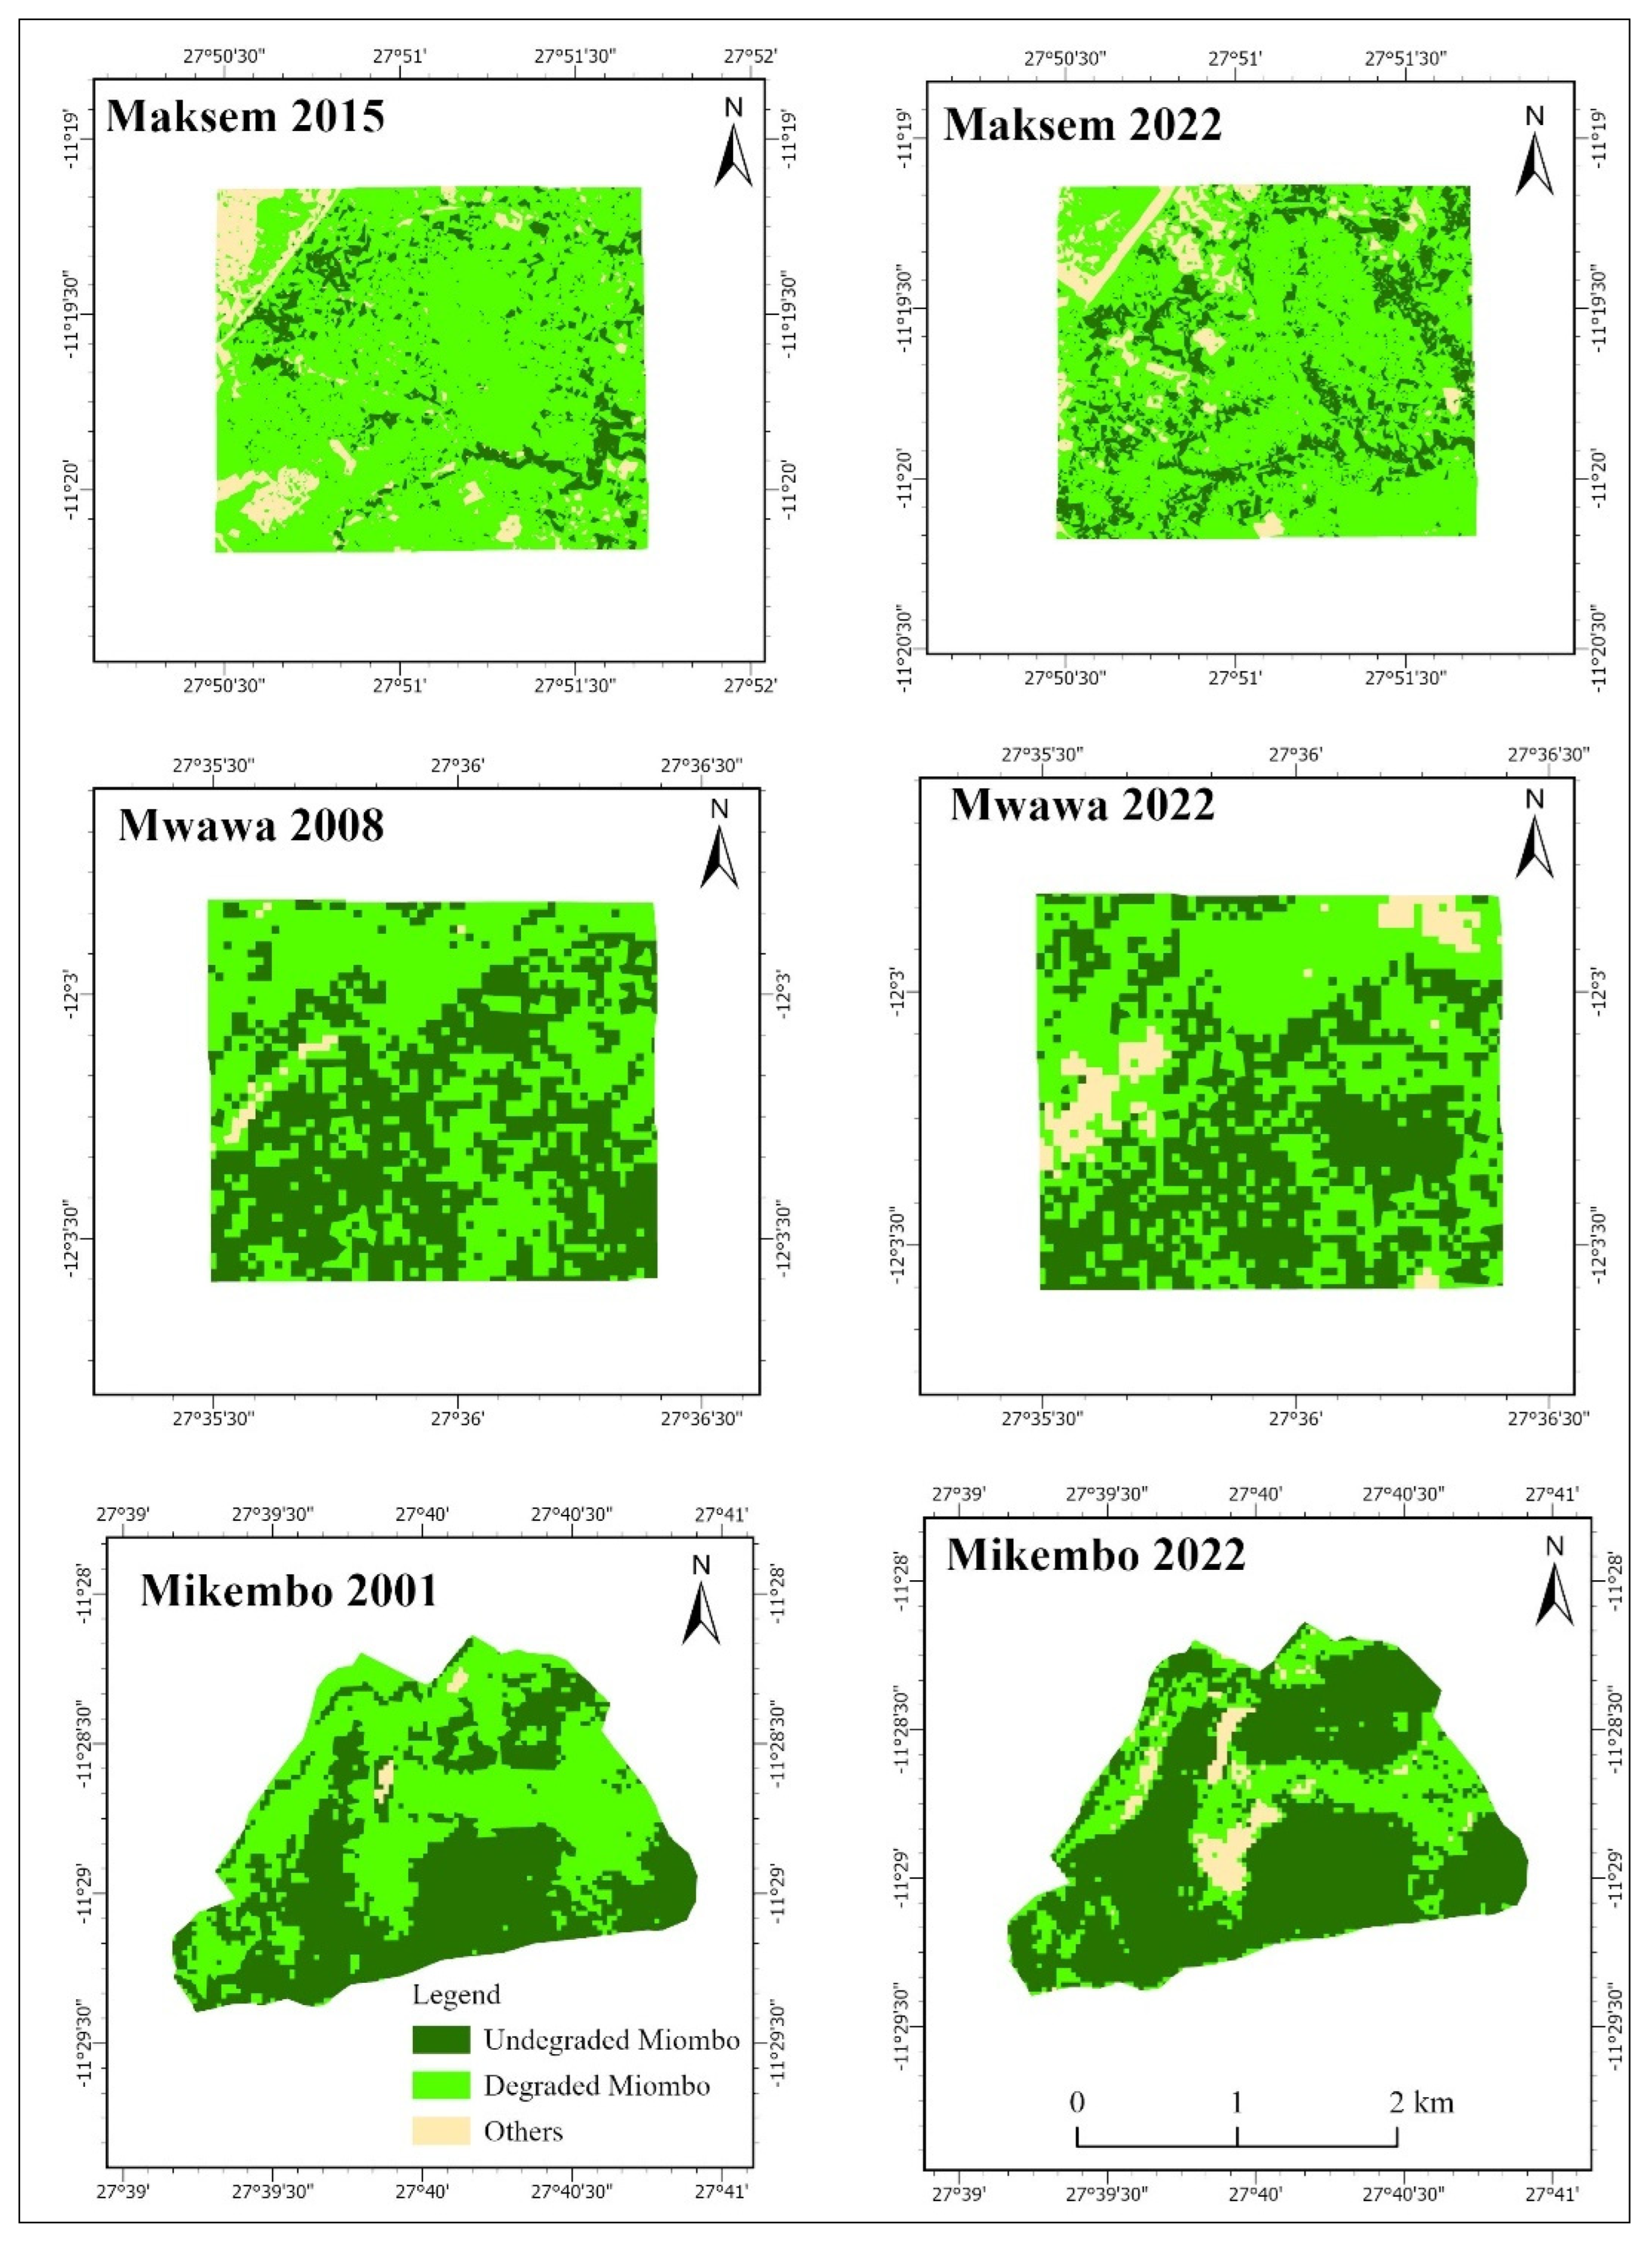
2.1. Study Area

The LCPB (Figure 1) covers 26,603.4 km² in southeastern DRC, within the Upper Katanga province, between latitudes 10°39′7.47"-12°26′37.61"S and longitudes 26°20′54.95"-28°40′13.55"E [20]. The region has an average elevation of 1,200 m and experiences a Cw climate (monsoon-influenced humid subtropical) according to Köppen’s classification, characterized by distinct wet and dry seasons [35]. The mean annual temperature was 20°C in the second half of the 20th century, but recent studies have documented a warming trend [36].
The vegetation is dominated by open miombo woodlands, interspersed with natural savannas. However, increasing anthropogenic activities have triggered a progressive conversion of miombo woodlands into wooded savanna, followed by shrub savanna, and ultimately grassland savanna [15]. The region’s population, experiencing continuous growth, primarily engages in agriculture, residential livestock farming, charcoal production, trade, and artisanal mining [17,18,37,38].

2.2. Study Site Selection

The selection of study sites followed a structured and rigorous approach to ensure representativity and relevance in the analysis. Among 63 villages identified as charcoal supply sources, five key villages (Lwisha, Maksem, Mwawa, Nsela, and Texas) were selected based on explicit criteria, including supply frequency, advanced degradation levels, and connectivity with other localities within the BPCB (Table 1). These villages are strategically distributed across the north, northwest, east, and south, ensuring comprehensive geographic coverage of affected areas.
The selection method was based on semi-structured surveys conducted between February and July 2022 at 14 charcoal sales depots in Lubumbashi, allowing for the identification of the most frequently exploited villages [20]. Additionally, to provide a reference site free from direct anthropogenic pressures, the Mikembo protected area was included in the study.
For floristic and dendrometric indicators, the sites were classified into three degradation stages based on ecosystem age, determined through local knowledge and land cover analysis (Table 1, Figure 2). The Maksem forest, isolated from major anthropogenic pressures since 2015, represents the initial degradation stage (approximately 7 years of regeneration). The Mwawa forest, protected since 2008, corresponds to a moderate stage, with about 14 years of regeneration. Meanwhile, the Mikembo forest, under protection since 2002, represents an advanced regeneration stage with over 21 years of recovery [39].

2.3. Data Collection

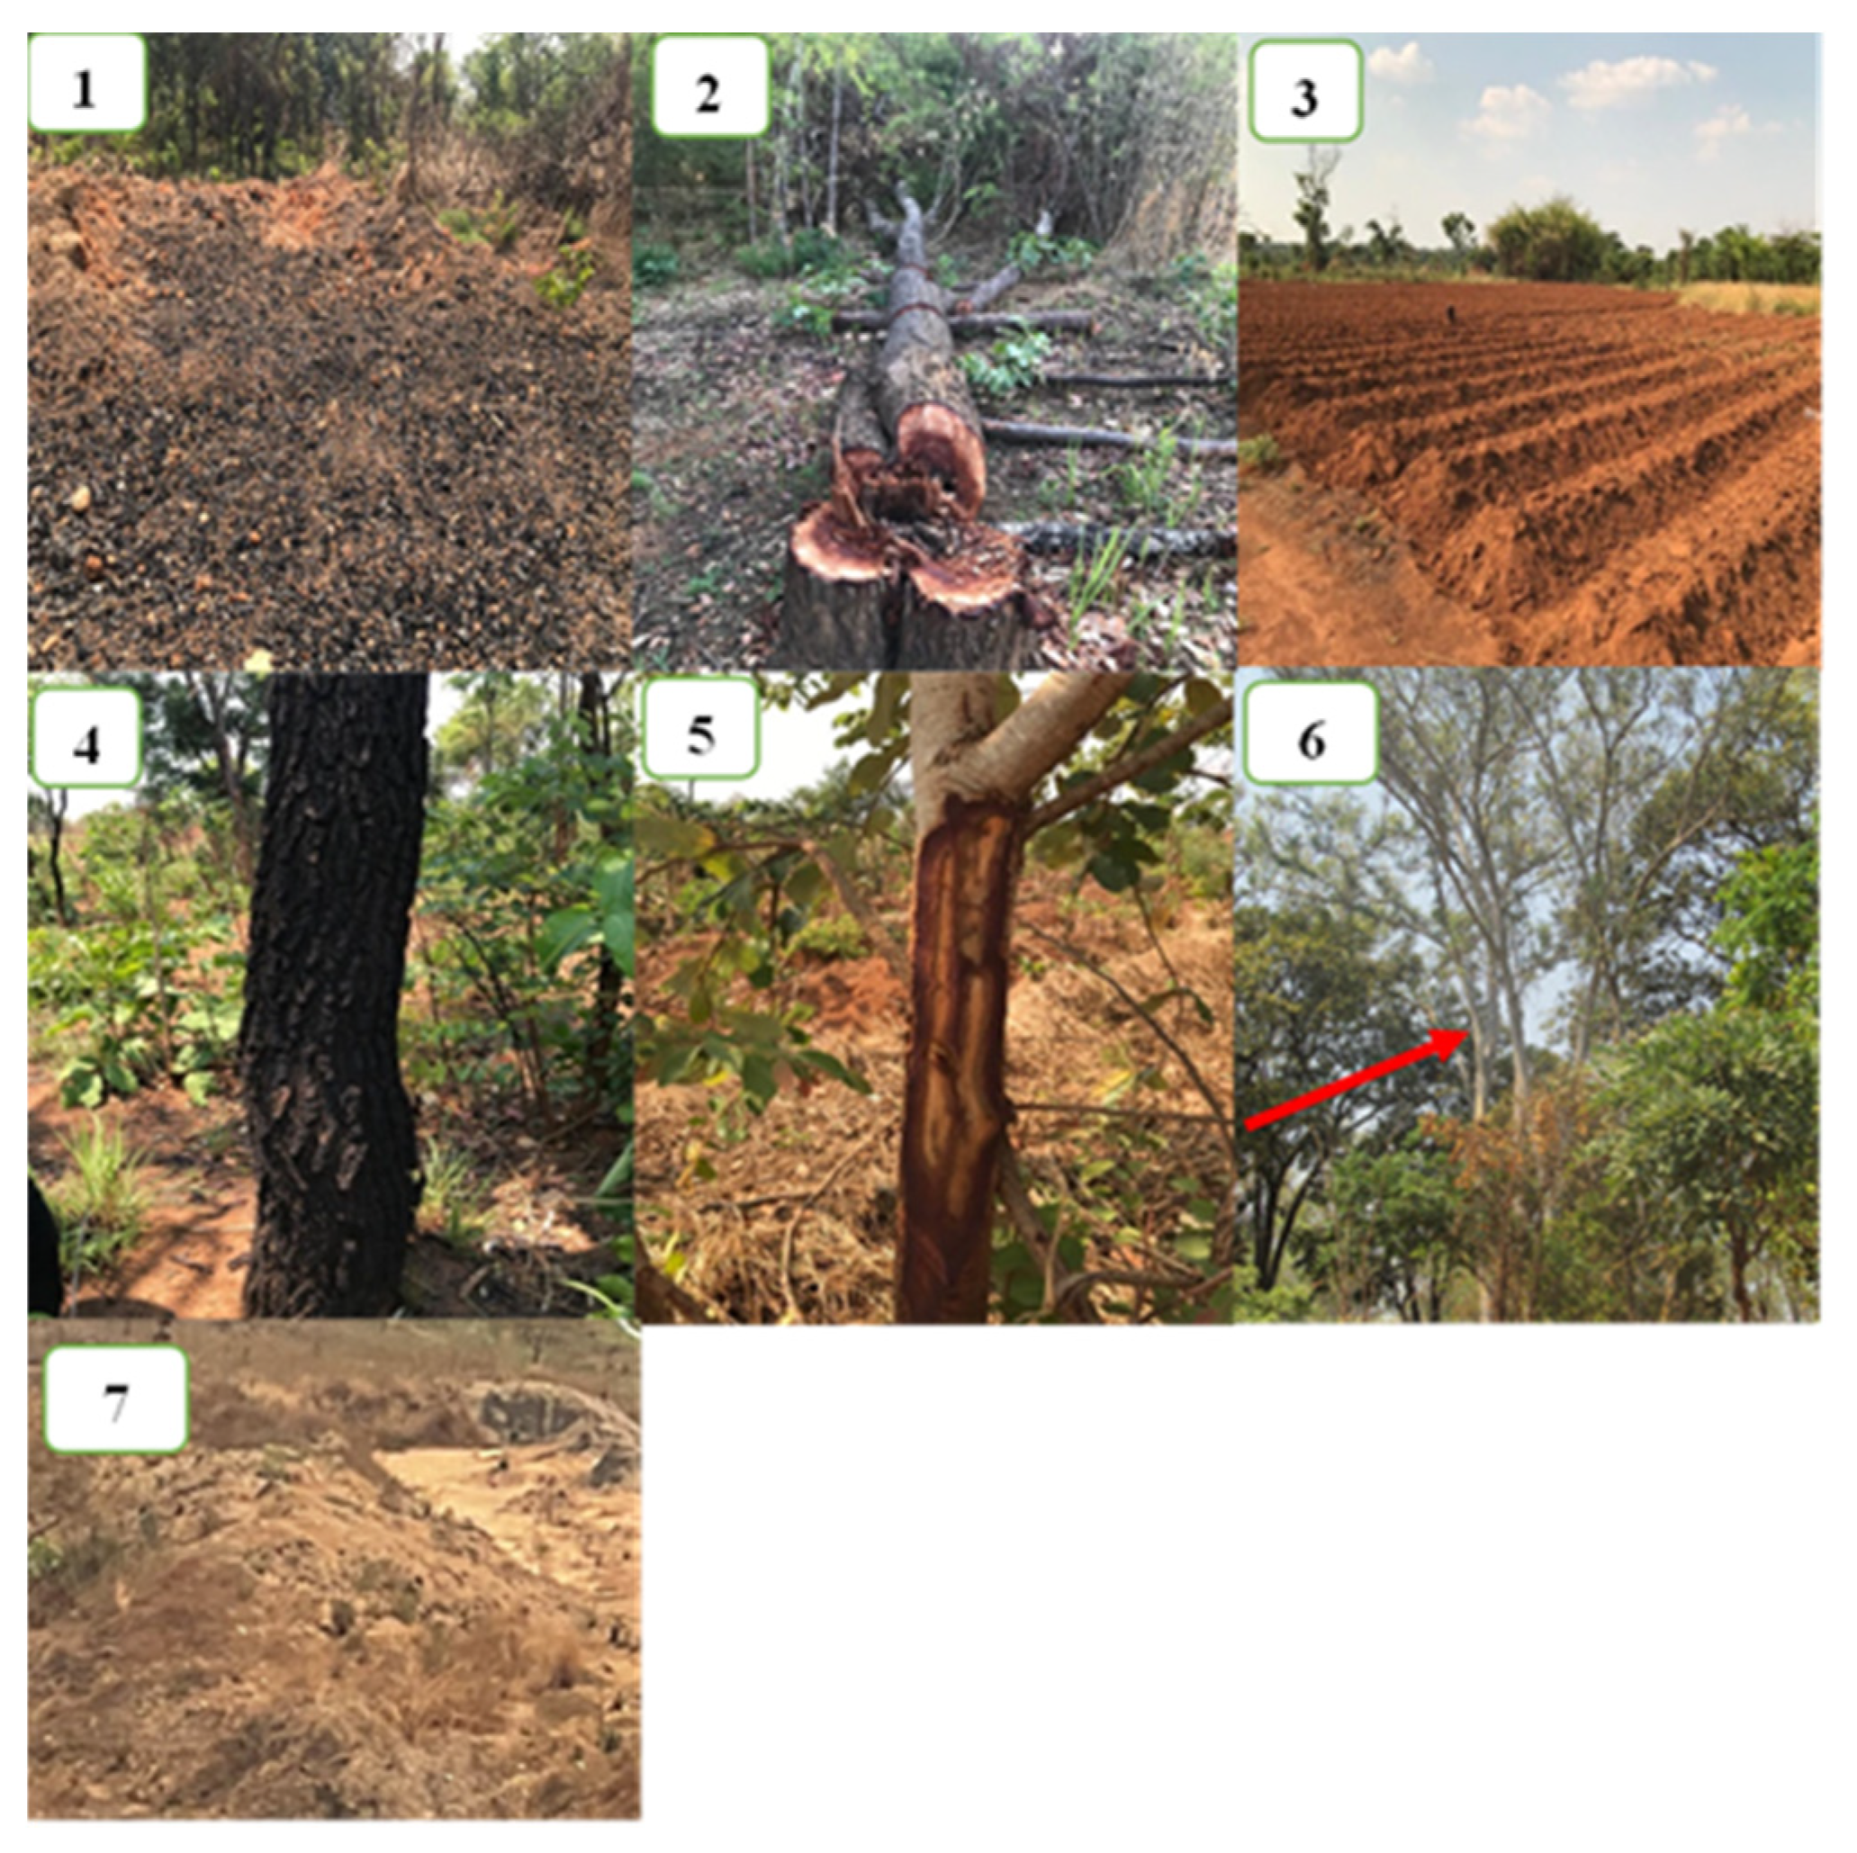
2.3.1. Identification of Disturbance Factors in the LCPB

The adopted approach was based on field inventories of disturbance indicators in the miombo woodlands, following the model of Ref. [31]. A typology of potential disturbance indicators (Table 2, Figure 3) was developed using existing literature [13,17]. To ensure local relevance, informal interviews were conducted with key stakeholders in the five selected villages of the LCPB [40].
The primary stakeholders, including local leaders, charcoal producers, and farmers, who represent the villages’ major economic activities, were selected based on specific criteria and recruited through local recommendations. A semi-structured interview guide was used to systematically address disturbance factors and assess the relative importance of each indicator. Six interviews per village were conducted to ensure representativity and diversity of local perspectives, including men, women, and youth. This participatory approach helped validate and refine the selected indicators for the study.
A field inventory of disturbance factors was conducted in 80 sampling units (plots), each measuring 10 m wide × 1,000 m long. This configuration was specifically chosen to effectively capture disturbance gradients over long distances. In each village, 16 plots were systematically distributed along four 4-km transects, oriented along the cardinal directions (north, south, east, and west) from the village centroid. Along each transect, plots were established at distances of 1 km (]0,1]), 2 km (]1,2]), 3 km (]2,3]), and 4 km (]3,4]) (Figure S1). The 4-km distance threshold was determined based on preliminary surveys with local stakeholders, who identified it as representative. This is further supported by studies indicating that anthropogenic pressure is most intense within a 3 to 5 km radius around rural settlements [41]. The methodology was adapted from Ref. [31] due to similarities between the study ecosystems.
Comprehensive field inventories were conducted between May and September 2022. Data were recorded in presence-absence format for each indicator in the sampling plots. Precise geolocation was ensured using a GPS device.

2.3.2. Collection of Floristic and Dendrometric Data

Data were collected between April and June 2023 across three miombo woodland study sites, following the recommendations of Ref. [42]. Floristic inventories were conducted in 16 systematically distributed rectangular plots, each measuring 20 m × 50 m (1,000 m²). A rectangular plot design was chosen to optimize species detection [33]. The plots were spaced 100 m apart and arranged along two 20 m-wide, 500 m-long transects, oriented north-south and east-west. This spacing and layout were selected to effectively capture the spatial variability of vegetation while considering logistical constraints [42].
Within each plot, the circumference at breast height (CBH) was measured at 1.3 m above ground using a forestry tape, and tree height was recorded with a Forest PRO II laser rangefinder [29]. To ensure accuracy, these instruments were calibrated through repeated measurements, improving data reliability. The diameter at breast height (DBH) was calculated as CBH/π, and a DBH threshold of 10 cm was applied to exclude young recruits and shrubs, retaining only established individuals that significantly contribute to forest structure and dynamics [43,44,26].

2.3.3. Collection of Functional Trait Data

Species were identified using floristic references such as Flora of Zambia, Flora of Zimbabwe, World Flora (https://www.zambiaflora.com, khttps://treesa.org, https://powo.science.kew.org) and Trees and Shrubs of Haut-Katanga [16]. In cases of taxonomic ambiguity, species identification was validated by local experts and botanical specialists. Additionally, the geolocation of each plot was recorded using a GPS, ensuring precise spatial data.
Functional trait data were extracted from trees-sa.co.za and powo.science.kew.org (Flora Zambesiaca database). Seven traits, selected for their relevance to forest degradation, were categorized into four groups: growth strategy and light competition (vegetation height, wood density), resource acquisition and utilization (leaf area, nitrogen fixation), reproduction and regeneration (dispersal mode, regeneration capacity), and fruit edibility [45]. Zoochory was chosen as the reference dispersal mode, being the most prevalent in the study area. Vegetation height and leaf area were recorded as continuous quantitative variables, while the other traits were binary-coded (0 or 1) to indicate trait presence or absence. This approach provides an integrated framework to assess species responses to forest degradation and functional adaptations in miombo woodlands.

2.4. Data Analysis

2.4.1. Analysis of Disturbance Factors

Villages were considered as replicates to identify the most influential factor driving miombo degradation in the LCPB using Principal Component Analysis (PCA). This method, applied to presence-absence data [46,47,48], was chosen to reduce data dimensionality, enhance interpretability, and minimize information loss [49]. The analysis began with constructing a correlation matrix, ensuring its determinant indicated sufficient structure for extracting meaningful axes. The Kaiser-Meyer-Olkin (KMO) index was then assessed to confirm the adequacy of a factorial solution. A correlation circle visualization illustrated each variable’s contribution to the main PCA axes [48].
The influence of distance on the presence or absence of disturbance factors was analyzed using binary logistic regression [50], a method specifically suited for binary response variables (0 = absence, 1 = presence) in relation to a continuous predictor (distance). This approach allows for the estimation of the probability of disturbance factor occurrence as a function of distance from villages, providing a more precise assessment of spatial patterns. Additionally, a Chi-square (χ²) test of independence was applied to examine associations between different disturbance factors, using a contingency table structure and a significance threshold of 0.05 [51].

2.4.2. Analysis of Floristic and Dendrometric Parameters

Floristic inventories allowed for the determination of species richness and individual abundance at each site. Diversity was assessed using the Shannon-Wiener index (H, Equation 1), which accounts for both species abundance and evenness, while species distribution evenness was measured using Pielou’s equitability index (E, Equation 2) [52]. The effect of ecosystem age on multiple parameters—number of individuals per plot, tree density per hectare, species richness, diversity (H), and evenness (E)—was tested using ANOVA. When data did not meet normality assumptions, the Kruskal-Wallis test was used. A significance threshold of P = 0.05 was applied for all statistical tests. Normality was verified using the Shapiro-Wilk test, and the choice between ANOVA and non-parametric tests was based on these results. Post hoc tests (Tukey HSD for ANOVA and Dunn’s test for Kruskal-Wallis) were performed for significant results to identify specific differences between groups.
Species composition was characterized using the Importance Value Index (IVI, Equation 3), integrating relative dominance, relative density, and relative frequency [33,42]. Relative dominance represents the proportion of total basal area occupied by a given species. Relative density expresses the number of individuals of species i relative to the total sampled individuals, while relative frequency refers to the percentage of plots in which a species occurs relative to the total number of plots [53].
The horizontal structure of the stands was described through tree density (number of trees per hectare, Equation 4) and basal area (G, Equation 5), which represents the total cross-sectional area occupied by tree trunks at breast height [54]. The height-diameter relationship was modeled using nonlinear asymptotic regression, accounting for height growth limitations. DBH and height classes were analyzed in 5 cm intervals to assess stand structure [55]. The effect of different ecosystem types on DBH, height, density, and basal area was evaluated using ANOVA, or Kruskal-Wallis for non-normal data, with a P = 0.05 threshold [42]. All statistical analyses were conducted in R software (version 4.3.1).
H ' = i = 1 n p i ln p i
Where H' is the Shannon diversity index, n represents the number of species, and pi is the proportion of individuals of a given species within a plot, calculated as the number of individuals of that species divided by the total number of individuals in the plot.
E = H H m a x = H l n S
Where E is Pielou’s equitability index, Hmax is the maximum Shannon diversity index, and S represents the total number of species identified in the study area.
I V I = ( R D o + R D e + R F )   3
Where IVI is the Importance Value Index, RDo represents relative dominance, RDe is relative density, and RF is relative frequency.
D = N S  
Où D est la densité d’arbres par hectare, N est le nombre d’arbres par placette et S la superficie de la placette exprimée en ha.
G = i = 1 n π D i 2 4
Where G is the basal area and D is the diameter at breast height (1.30 m above the ground).

2.4.3. Functional Trait Analysis

Leaf area (LA) was calculated based on the oval or elliptical shape of the leaflets, considering the total number of leaflets per leaf, using Equation 6:
S = i = 1 n π 4 × L i × l i
Where S represents the total leaf area, Lᵢ is the maximum length of the ith leaflet, and lᵢ is its width.
Since most functional trait data were binary (presence/absence), linear models were used for analysis. A preliminary assessment examined the feasibility of merging the two degradation levels (moderately and severely degraded) based on the absence of significant differences in functional traits between them. This approach aimed to simplify subsequent analyses by allowing the use of linear models.
Two classification approaches were adopted. The first categorized species by degradation level, distinguishing moderately degraded ecosystems (14 years) from severely degraded ecosystems (7 years), while defining a reference group composed of species common to both. The second classified species based on ecosystem state, distinguishing undisturbed ecosystems (21 years, mature forests) from disturbed ecosystems (7 and 14 years), with a reference group including species present in both categories.
The effects of ecosystem state and disturbance level on quantitative traits (vegetation height and leaf area) were evaluated using ANOVA, applying a Box-Cox transformation to meet normality and variance homogeneity assumptions. The influence of these factors on binary traits was assessed through a logistic regression model, determining whether the probability of a given functional trait significantly varied according to ecosystem state and disturbance level [50].
To further explore species group differentiation, a Linear Discriminant Analysis (LDA) was performed following Ref. [56]. This approach helped visualize the relationships between species groups based on trait presence/absence under different ecosystem conditions and disturbance levels. Multicollinearity among variables was checked using the Variance Inflation Factor (VIF < 5), corresponding to a maximum Pearson correlation coefficient of 0.7 between variables.

3. Results

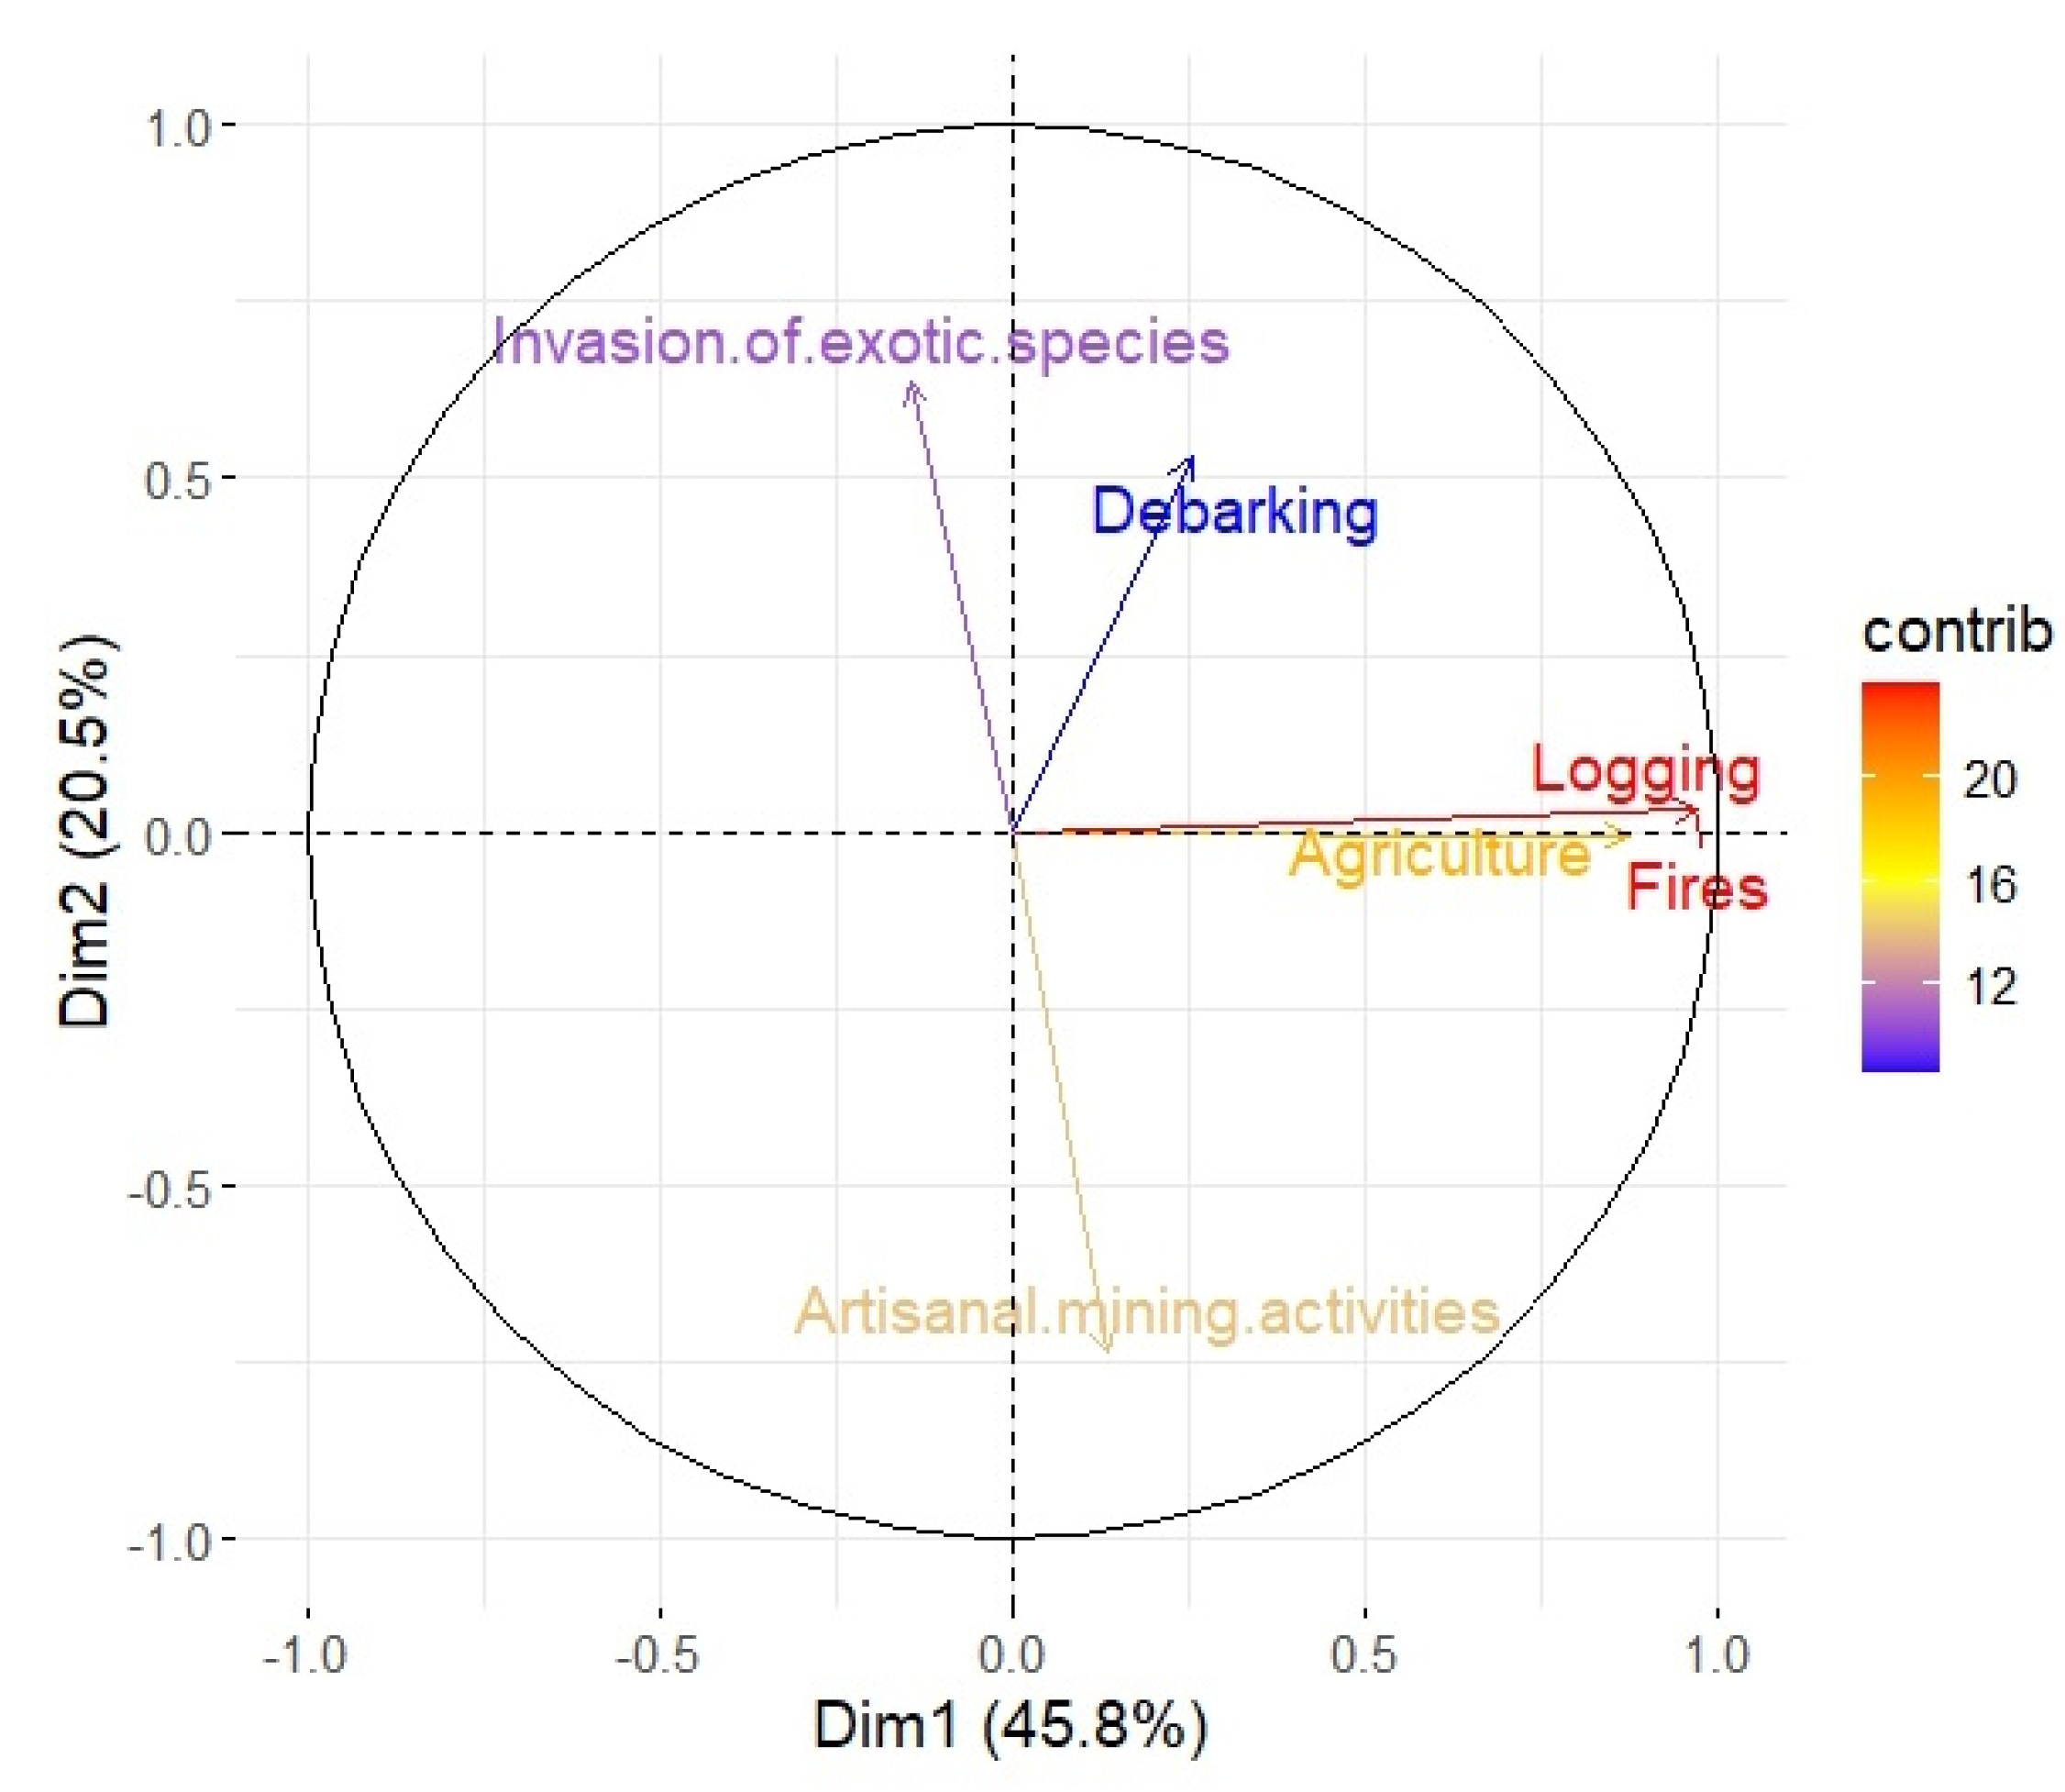
3.1. Degradation Factors Affecting Woodland Biodiversity in the LCPB

Table 3 highlights that wood harvesting and fires are the primary sources of disturbance in the sampling units, as reflected by their high occurrence rates, followed closely by agriculture. In contrast, the invasion of exotic species, bark stripping, and artisanal mining activities (AMA) are the least frequently observed disturbance factors.
The Principal Component Analysis (PCA) (Figure 4) reveals a clear structuring of disturbance factors, with the first two axes explaining 66.37% of the total variance. Two distinct groups of factors emerge. On the first axis (Dimension 1), logging (cor = 0.97, p < 0.001), fires (cor = 0.97, p < 0.001), and agriculture (cor = 0.87, p < 0.001) are strongly correlated. Their significant contribution to the variance indicates that they are widespread across most sampling units and represent the main drivers of forest degradation in the region. On the second axis (Dimension 2), exotic species invasion (cor = 0.63, p < 0.001), debarking (cor = 0.52, p < 0.001), and artisanal mining activities (cor = -0.73, p < 0.001) are more closely associated. Their positioning along this axis suggests that they play a more localized and secondary role in the disturbance dynamics.
These findings emphasize that logging (particularly for charcoal production), fires, and agricultural expansion are the key drivers of woodland degradation in the LCPB. In contrast, exotic species invasion, bark stripping, and artisanal mining activities appear to exert localized and less widespread pressures, with their impact being confined to specific areas.
Regarding the analysis of the effect of distance from villages on the spatial distribution of degradation factors, the results of the binary logistic regressions, detailed in Table S1, indicate that none of the studied degradation factors show significant p-values (p > 0.05). This suggestes that distance from the village does not significantly influence their occurrence. Specifically, logging, fire, and agriculture exhibit high estimates but with considerable uncertainty (large standard errors), indicating a lack of strong association with distance. The invasion of exotic species and debarking shows negative coefficients, suggesting a slight decreasing trend with increasing distance, though these trends are not statistically significant. These findings suggest that disturbance factors do not systematically vary with distance from villages, potentially reflecting a random spatial distribution of disturbances.
However, interaction analysis among these factors reveals a highly significant association (p < 0.001) between logging, fires, and agriculture. This strong correlation suggests a synergistic relationship where logging and agricultural practices promote fire use, thereby intensifying pressure on vegetation. Conversely, invasion of exotic species, debarking, and artisanal mining activities do not show statistically significant associations with other factors (p > 0.05), indicating that they operate independently and are not systematically linked to the major forest degradation processes (Table 4).

3.2. Floristic Composition and Diversity

A total of 1,065 individuals were recorded across the three study sites, representing 63 species, 40 genera, and 23 families. Fabaceae emerged as the most abundant family, comprising 34.92% of the species, while Brachystegia was the most represented genus (9.52% of recorded species). The analysis of the three ecosystems—low degradation (21 years), moderate degradation (14 years), and severe degradation (7 years)—revealed significant differences in floristic richness and structure. The low-degradation ecosystem contained 519 individuals, distributed among 36 species, 25 genera, and 15 families, with Brachystegia as the dominant genus and a tree density of 323 trees/ha. The moderately degraded ecosystem had 456 individuals, representing 48 species, 33 genera, and 20 families, also dominated by Brachystegia, with a tree density of 285 trees/ha. In contrast, the severely degraded ecosystem exhibited a younger forest structure, with only 90 individuals, distributed among 23 species, 15 genera, and 7 families, where Uapaca and Vitex were dominant, with a tree density of 51 trees/ha.
Statistical analyses showed highly significant differences in species richness among the studied ecosystems (F = 41.61, p < 0.001). The Tukey HSD test indicated that the difference was not significant between the low- and moderately degraded ecosystems, but significant differences were observed between these two and the severely degraded ecosystem (Figure 5). These results suggest that degradation levels (age ecosystem) significantly impact species richness, with a marked decline in the most degraded ecosystem.
Floristic diversity, measured using the Shannon-Wiener index, was high and comparable between the low- and moderately degraded ecosystems, with mean values of 2.11 and 2.13, respectively. However, the severely degraded ecosystem exhibited significantly lower diversity (1.14, F = 41.97, p < 0.001). Species evenness, assessed using Pielou’s index, showed values of 0.74, 0.73, and 0.81 for the low, moderate, and severely degraded ecosystems, respectively, with no significant differences (F = 2.40, p > 0.05). These findings indicate that while degradation strongly affects species diversity, its impact on evenness remains limited, suggesting a relatively balanced distribution of individuals within the different communities.
Structural analysis of species revealed notable variations among the three ecosystems, particularly in Importance Value Index (IVI) and species abundance, as presented in Tables S2 and S3. In the low-degradation ecosystem, species with the highest IVI values were Marquesia macroura (abundance 88), Diplorhynchus condylocarpon (64), and Julbernardia globiflora (71). In the moderately degraded ecosystem, Brachystegia wangermeeana (83), Brachystegia spiciformis (56), and Albizia adianthifolia (48) exhibited the highest IVI values. In contrast, in the severely degraded ecosystem, dominant species included Isoberlinia angolensis (22), Julbernardia paniculata (18), and B. wangermeeana (6). These results confirm that floristic composition and structure evolve with ecosystem age and degradation level, with each successional stage characterized by specific dominant species.

3.3. Dendrometric Parameters

The structural analysis of the tree stands revealed significant differences in tree density across the studied ecosystems (χ² = 28.99, p < 0.001). Post hoc tests indicated that there was no significant difference between the low-degradation and moderately degraded ecosystems, but both were significantly different from the severely degraded ecosystem (Figure 6). Significant differences were also observed in diameter at breast height (DBH) and tree height based on degradation level. The mean DBH values were 24.21 ± 3.41 cm, 18.83 ± 3.21 cm, and 11.56 ± 3.25 cm for the low-, moderate-, and severe-degradation ecosystems, respectively, with highly significant differences among them (F = 41.61, p < 0.001). The diameter class distribution followed an inverse J-shape, with young individuals (10–15 cm DBH) predominating in severely degraded (82.71%) and moderately degraded ecosystems (49.12%), whereas in the low-degradation ecosystem, this proportion was lower (39.80%). Conversely, larger trees (>15 cm DBH) were more abundant in the 21-year-old ecosystem, indicating a more mature forest structure (Figure 7).
Regarding tree height, the average values were 9.64 ± 2.24 m for the low-degradation ecosystem, 6.31 ± 0.74 m for the moderately degraded ecosystem, and 4.47 ± 1.5 m for the severely degraded ecosystem. All comparisons showed highly significant differences among ecosystems (χ² = 35.25, p < 0.001), confirming that the three ecosystems are statistically distinct in terms of tree height. In the severely degraded ecosystem, trees shorter than 5 m accounted for 65% of individuals, whereas in the low- and moderately degraded ecosystems, most trees ranged between 5 and 10 m. The low-degradation ecosystem also contained taller trees (>15 m, 10% of individuals), reflecting the greater maturity of this older ecosystem (Figure 7).
The basal area analysis showed mean values of 13.42 ± 5.21 m²/ha, 0.65 ± 0.44 m²/ha, and 0.73 ± 0.44 m²/ha for the low-, moderate-, and severely degraded ecosystems, respectively. Comparisons also revealed highly significant differences (χ² = 39.97, p < 0.001), indicating statistically significant structural variations among the ecosystems. These results suggest that tree density per hectare is low (<100) in severely degraded ecosystems, whereas in moderate and low-degraded ecosystems, it is closer to 300 trees per hectare. Additionally, DBH, tree height, and basal area all reflect a marked structural variation according to degradation level, with mature individuals (larger DBH, taller height, and higher basal area) more abundant in the low-degradation ecosystem.
These results suggest that tree density per hectare is low (< 100 trees/ha) in a highly degraded ecosystem, whereas it remains high (around 300 trees/ha) in moderately and slightly degraded ecosystems. The findings also indicate that DBH, tree height, and basal area exhibit marked structural variations in tree stands depending on the level of degradation. In less degraded ecosystems, a higher proportion of mature individuals (larger DBH, greater height, and higher basal area) is observed, reflecting better structural integrity.
The diameter-height relationship, analyzed through asymptotic regression, revealed notable differences among ecosystems (Figure 8). In the low-degradation ecosystem (21 years), the asymptote parameter a (18.22) and the coefficient b (0.038) indicated that trees had reached relatively large sizes, with a positive but slower diameter-height relationship (p < 0.001). In the moderately degraded ecosystem (14 years), the intercept a (14.74) was lower, though the relationship remained significant, with a weaker coefficient b (0.03), suggesting a slower height growth rate. In the severely degraded ecosystem (7 years), the relationship remained significant (p < 0.001), but the coefficient b (0.02) was even lower, indicating reduced height growth as diameter increased (Table S4). These results demonstrate that the diameter-height relationship evolves with ecosystem age and degradation level. The younger (severely degraded) ecosystem exhibits faster height growth with a steeper relationship, whereas in the older (low-degradation) ecosystem, height growth slows down, and trees invest more in diameter expansion.

3.4. Functional Trait Analysis

No significant differences were observed in vegetation height (F = 1.90, p > 0.05) or leaf area (F = 1.91, p > 0.05) between the moderately degraded and severely degraded ecosystems. Logistic regression results for other functional traits (Table S5) indicate that none of the coefficients associated with moderate or severe degradation were significant (p < 0.05) for the traits analyzed. Therefore, no notable differences were detected between the moderately and severely degraded ecosystems compared to the reference group, a pattern confirmed by linear discriminant analysis (LDA, Figure 9).
Regarding ecosystem state, ANOVA revealed no significant differences for vegetation height (F = 3.03, p > 0.05) or leaf area (F = 0.58, p > 0.05). The results of the logistic regression model for other traits (Table S5) indicate that zoochorous dispersal had an intercept coefficient of 1.15 (p = 0.042) for the disturbed group, suggesting an expression probability approximately 3.16 times higher (exp(1.15)) than in the reference group. Conversely, the undisturbed group showed no significant differences. For wood density, a significant negative intercept (–1.53, p < 0.01) in the disturbed group indicates a reduced probability (odds ratio ≈ 0.17) compared to the reference group, while the undisturbed group showed no significant variation (p > 0.05). Regeneration capacity was significantly lower in the undisturbed group (coefficient = –1.81, p < 0.05), whereas the disturbed group did not differ significantly from the reference (p > 0.05). For nitrogen fixation, the disturbed group exhibited a significant negative coefficient (–1.64, p < 0.05), corresponding to an odds ratio of approximately 0.19, whereas the undisturbed group showed no significant variation (p > 0.05). Lastly, fruit edibility did not vary significantly across ecosystem states, suggesting that this trait remains unaffected by degradation.
Overall, these findings indicate that ecosystem state influences functional traits. Species in highly disturbed environments tend to favor zoochorous dispersal and exhibit lower probabilities for high wood density and nitrogen fixation. In contrast, the undisturbed ecosystem is characterized by a lower probability of species with high regeneration capacity but a higher probability of species with greater tree density. Fruit edibility remains unchanged regardless of ecosystem conditions, as illustrated by linear discriminant analysis (LDA, Figure 10).

4. Discussion

4.1. Methodological Approach

Permanent or temporary plots and transects are widely used to assess vegetation diversity and anthropogenic impacts on tropical forests, particularly in miombo woodlands [26,29,30]. These methods provide a practical and effective framework for evaluating species composition, structural parameters, spatial distribution, and disturbance factors [31,32].
However, these approaches have certain limitations, including potential biases related to transect placement or plot size, which may affect the representativeness of results [57]. To minimize these biases, standardized protocols and stratified sampling designs are recommended [58]. Increasing sampling effort and ensuring homogeneous sampling units improve the capture of vegetation variability [59]. Additionally, orienting transects perpendicular to ecological gradients enhances efficiency. In this study, two transects were established from the centroid of each village, aligned with the four cardinal directions to maximize ecological coverage. Although time-consuming and labor-intensive, these methods remain reliable for biodiversity assessments and anthropogenic impact analysis. While alternatives such as remote sensing and ecological modeling offer broader spatial analyses [60], field inventories remain essential for precise, localized evaluations of forest dynamics [57].
Inventories were conducted in five villages selected through semi-structured surveys, along with a protected area within the LCPB. Although this number of villages may seem limited, it introduces methodological constraints, particularly in terms of statistical robustness and representativity [61]. Furthermore, survey data can be influenced by local perceptions, which may vary based on individual experiences and expectations [62]. To mitigate these limitations, villages were selected based on a geographically balanced distribution, covering key cardinal directions to reflect the socio-environmental diversity of the LCPB. They were chosen for their exposure to anthropogenic degradation levels comparable to those observed across Lubumbashi’s rural areas. This selection ensures better comparability of degradation dynamics and allows for a more precise analysis of underlying processes. However, this approach may limit the exploration of alternative degradation trajectories.
Additionally, seasonal variations can affect forest inventory data collection, particularly in terms of disturbance factors and floristic and dendrometric indicators [63]. n Miombo woodlands, where species experience seasonal water stress, many trees adopt avoidance strategies by shedding their leaves during the dry season [64]. To minimize this effect on species identification and floristic diversity assessments, data collection was conducted before the peak defoliation period.

4.2. Miombo Degradation Factors in the LCPB

Our findings highlight wood extraction, primarily for charcoal production, as the primary driver of Miombo woodland disturbance in the LCPB. This pressure is exacerbated by vegetation fires and agricultural expansion, aligning with previous studies [17,24,20], which identified these factors as key drivers of Miombo degradation across the Katangan Copperbelt. Similarly, Ref. [65] found that charcoal production surpasses agricultural expansion as the leading cause of deforestation in Zambia, a context ecologically comparable to the LCPB. In Tanzania, Ref. [66] also reported charcoal production, fires, and agriculture as major deforestation drivers, consistent with our findings.
The dominance of wood harvesting for charcoal production is closely linked to Lubumbashi's growing energy demand [67], driven by rural-urban migration and internal population growth [23,38] and intensified by the mining boom since 2002 [68]. With limited electricity production and distribution [34], local communities rely heavily on miombo woodlands, progressively converting forests into savannas [17,20]. Studies in Malawi [69] and Zambie [70] confirm that charcoal production often exceeds agricultural expansion as a driver of forest degradation. In the LCPB, wood harvesting is also linked to artisanal timber exploitation [25] and non-timber forest product (NTFP) collection [71].
Vegetation fires, primarily caused by shifting cultivation, charcoal production leaks, hunting, and smoking activities, significantly contribute to miombo degradation in the LCPB. These findings align with Ref. [72], who reported similar trends in the LCPB. Although fire is a natural part of miombo succession, high fire frequency disrupts forest regeneration by destroying seedlings and saplings [15]. Ref. [73] confirmed these effects in Kundelungu National Park, near the LCPB, and similar impacts have been recorded in fire-prone ecosystems like the Okavango Delta in Angola [74].
Agriculture also emerges as a major driver of woodland degradation in the LCPB. It is widely recognized as one of the most significant contributors to tropical deforestation [75]. Intensive agricultural practices—land clearing, expansion, monocultures, and excessive pesticide and fertilizer use—reduce biodiversity and accelerate soil erosion [76]. In the DR Congo, agriculture is cited by the Ref. [13] as the leading cause of deforestation and degradation in the Katanga region, where the LCPB is located. It is also considered the primary deforestation driver in most Miombo-dominated countries [77].
Although less impactful, invasion of exotic species still poses a threat to miombo woodlands in the LCPB. Whether introduced intentionally or accidentally, these species alter microhabitats and compete with native flora, as confirmed by Ref. [78] in Lubumbashi. By modifying soil composition, invasive species impose additional pressures on native ecosystems [79]. Similar issues have been documented in Zambia, where Ref. [80] identified IAS as a persistent environmental and economic threat.
Bark harvesting, mainly for traditional medicine, also contributes to forest degradation [81]. While valued for its medicinal properties, bark removal weakens trees, inhibits growth, and increases susceptibility to disease and pests [82]. Over time, this practice can lead to tree mortality and accelerate forest fragmentation [83].
Beyond industrial mining, artisanal mining in the LCPB, located within the Katangan Copperbelt, significantly contributes to deforestation and ecosystem degradation [84,24]. Unregulated and unsustainable mining leads to road construction, land clearing, and the establishment of mining camps, increasing the risk of landslides and habitat destruction [68]. Similar trends have been reported in Zimbabwe, where Ref. [85] documented severe environmental degradation and deforestation due to small-scale mining in Mzingwane District.
Analysis of degradation factor distribution reveals that distance from villages does not significantly influence their occurrence, suggesting that human-induced degradation extends far beyond inhabited areas in the LCPB. The sharp decline in miombo forest cover within the study area [20] has forced local communities to exploit forest resources at increasing distances, particularly wood and medicinal bark. Moreover, due to the high cost of mineral fertilizers, farmers abandon plots after two to three growing seasons and clear new forest land [21].
Our findings reveal a strong association between wood harvesting, fire, and agriculture, consistent with Ref. [86], who reported similar patterns in Tapia forests in Madagascar. Charcoal-driven tree felling is often followed by agricultural land conversion using slash-and-burn techniques, accelerating deforestation [20,87]. Additionally, Ref. [88] confirm that wood extraction in Miombo woodlands increases fire frequency, disrupting natural fire regimes. These forests play a crucial role in fire regulation by maintaining soil moisture and reducing fuel accumulation [12].

4.3. Floristic and Dendrometric Indicators of Miombo Degradation in the LCPB

Floristic analysis revealed a dominance of Fabaceae across all three studied ecosystems (7, 14, and 21 years old). This prevalence, previously observed in the Katangan miombo [44] and across the broader miombo ecoregion [89], is attributed to their nitrogen-fixing ability, a key adaptation to the region’s nutrient-poor soils [90]. Their ecological plasticity and resilience to frequent disturbances, such as recurrent fires and human exploitation, further reinforce their persistence in these highly anthropized ecosystems [91].
Our results indicate that Brachystegia is the most abundant genus in the Lubumbashi region, consistent with previous findings in Katanga [15,28] and the miombo ecoregion [10,89]. Species richness peaks in the 14-year-old ecosystem, likely due to moderate disturbance fostering the establishment of heliophilous species [92]. In contrast, the heavily degraded 7-year-old ecosystem exhibits low species richness, reflecting recent anthropogenic pressures. The Shannon-Wiener diversity index (H') exceeds 2 in the 21- and 14-year-old ecosystems, indicating moderate to high diversity [93]. However, the heavily degraded ecosystem has a much lower diversity (H' = 1.14), characteristic of an early regeneration stage dominated by pioneer species. These patterns align with trends observed in other miombo woodlands across southern Africa, notably in Zambia [94] and central-southern Angola [53].
Although diversity differs significantly between ecosystems, evenness remains stable, suggesting that ecological succession processes have not yet led to pronounced species dominance. These findings support prior studies indicating that highly degraded miombo forests exhibit lower biodiversity in rural Lubumbashi [29]. They also align with Ref. [95], who suggested that species richness recovery requires over 20 years of abandonment, corresponding to the least degraded miombo stands.
The Importance Value Index (IVI) analysis highlights differences in species composition across the studied ecosystems, all characteristic of Zambezian humid miombo woodlands [94]. In the least degraded ecosystem, M. macroura and D. condylocarpon dominate, owing to their resilience to disturbances and fire tolerance, along with their low commercial exploitation [26]. Their dominance suggests that this mature ecosystem experienced past disturbances before abandonment [39], allowing for the establishment of species characteristic of regenerating environments [26,96]. The prevalence of J. globiflora, a key miombo genus, further supports the post-disturbance regeneration hypothesis.
The moderately degraded ecosystem is characterized by the dominance of B. wangermeeana and B. spiciformis, which are key miombo species [10], alongside A. adianthifolia, a pioneer species tolerant to disturbance [97]. The co-occurrence of mature-forest species with disturbance-adapted taxa suggests an ongoing secondary succession process, where regeneration mechanisms sustain floristic diversity.
In the heavily degraded ecosystem, species with high IVI values belong to the dominant regional genera, reflecting rapid regeneration capacity. This resilience is driven by functional traits favoring dispersal and rapid reproduction, typical of pioneer species that efficiently recolonize disturbed environments. The marked presence of Uapaca genus, well adapted to open, high-light environments, indicates recent anthropogenic disturbances [94]. These species may also be favored by local communities due to their economic, medicine, and nutritional importance. Similar patterns were observed in Mozambique, where Uapaca kirkiana is identified as an indicator of forest degradation [96]. The low IVI values in younger ecosystems suggest high floristic heterogeneity, highlighting a vegetation in transition with ongoing species recruitment. These results confirm the IVI's reliability as an indicator of degraded forest structure and composition, revealing the regeneration and resilience dynamics of Miombo woodlands.
Tree density was highest in the least degraded ecosystem, protected from anthropogenic pressures, and aligns with values reported in Mikembo [26] and Kiswishi [27,28], a quasi-protected ecosystem similar to the 21-year-old miombo stand. These results emphasize the importance of conservation efforts in maintaining high tree densities [98]. However, the difference between the least and moderately degraded ecosystems was not significant, likely due to increased pioneer species recruitment in recovering areas [99]. In contrast, the heavily degraded ecosystem exhibited lower tree density, characteristic of a recently abandoned forest requiring extended regeneration [90,95].
Dendrometric analysis revealed a higher proportion of mature trees (larger diameters and greater heights) in the least degraded ecosystem, attributed to longer regeneration and growth periods [95]. Conversely, the moderately and heavily degraded ecosystems, subjected to more recent disturbances, lack an equilibrium favoring large-diameter individuals [29]. This explains why the diameter-height relationship analysis showed that tree height increases with diameter but at a slower rate in older ecosystems than in younger ones.
Finally, higher basal area values in the least degraded ecosystem reflect the presence of mature trees with greater biomass, while lower values in the moderately and heavily degraded ecosystems indicate ongoing regeneration. These findings reinforce the critical role of ecosystem age and degradation level in biomass accumulation and forest structure, as documented by Ref. [94] in Zambie.

4.4. Impact de la Dégradation Forestière sur les Traits Fonctionnels

Functional trait analysis provides insights into how plant communities respond to environmental disturbances [100]. Our results indicate no significant differences in functional traits between moderate and severely degraded ecosystems, suggesting that species in these environments share similar architectural and physiological traits that enhance their adaptability to degraded conditions. This finding implies that beyond a certain disturbance threshold, degradation does not necessarily lead to a continuous decline in ecosystem functions but rather to a quasi-stable functional state, where the ecosystem maintains a reduced but relatively stable level of functioning over time [101].
In contrast, undisturbed ecosystems are characterized by a low probability of species with high regeneration capacity and a high representation of species with dense wood. Conversely, disturbed ecosystems exhibit a higher probability of zoochorous species and a lower probability of dense-wood and nitrogen-fixing species. This pattern is driven by pioneer species dominance in degraded environments, where fast growth and efficient dispersal strategies are favored over wood density investment, allowing rapid colonization of newly deforested areas [102]. Additionally, disturbances disrupt key symbiotic interactions essential for nitrogen fixation, reducing the presence of nitrogen-fixing species, a trend consistent with findings by Ref. [103].
In undisturbed ecosystems, stable environmental conditions promote conservative life-history strategies [104]. Species prioritize high wood density, enhancing longevity and resistance to environmental stress, albeit at the cost of lower regeneration capacity. This trade-off between durability and regeneration speed is a well-documented adaptation mechanism in mature forests and aligns with findings by Ref. [102], reinforcing the link between functional community structure and habitat stability.

4.5. Implications for Forest Management

The degradation of miombo woodlands in the LCPB is primarily driven by anthropogenic activities, including logging for charcoal production, fires, agriculture, invasion of exotic species, debarking, and artisanal mining. Among these, logging, fires, and agriculture exert the most significant pressure, forming a synergistic impact on forest decline. These pressures not only accelerate deforestation [20,72] but also degrade forests, leading to a decline in species richness, floristic diversity, tree density, diameter at breast height (DBH), tree height, and basal area. The reduction in tree density weakens miombo woodlands' carbon storage capacity, reducing their role as carbon sinks and raising atmospheric CO₂ levels [105]. This degradation disrupts ecosystem services, compromises climate regulation, and threatens local livelihoods [90].
To conserve remaining miombo woodlands and restore degraded areas in the LCPB [20], specific forest regulations tailored to miombo ecosystems are essential. The current national forestry code, primarily designed for dense tropical forests, requires revision to incorporate miombo-specific management measures, including the regulation of exploitable species and the prohibition of destructive practices. In Tanzania, for example, legal frameworks have been established to criminalize unsustainable practices [106]. Additionally, a reforestation strategy targeting degraded areas should actively involve local communities through training programs on native species propagation, supported by financial mechanisms from mining and forestry taxes. Successful community-based forest management projects, such as the Ngel Nyaki Forest Reserve in Nigeria, illustrate the potential for restoration through reforestation initiatives [107].
Furthermore, promoting sustainable agricultural practices is crucial to reduce shifting cultivation and its impact on miombo woodlands. Sustainable farming techniques enhance soil fertility and provide viable economic alternatives, as demonstrated by Ref. [108] in Madagascar’s Vakinankaratra region. Given the governance challenges in managing miombo forests in Lubumbashi [109], it is essential to strengthen provincial reforestation services by providing adequate financial and technical resources. Special attention should be given to wildfire management and shifting agriculture, as effective strategies can promote natural miombo regeneration [15]. Ref. [110] identified successful fire management strategies in eastern Tanzania’s miombo woodlands, including community awareness, firebreaks, legal enforcement, and fire management planning.
In the context of Lubumbashi’s rapid urban expansion, expanding protected areas—both public and private—and implementing an integrated land-use strategy are critical for reducing pressure on forests. A relevant example is the Mikembo Sanctuary, where a previously degraded ecosystem has been protected for over 21 years, allowing for successful natural regeneration [39]. Similarly, the establishment of national parks in Gabon, such as Lopé National Park, has significantly contributed to forest conservation efforts [111].

5. Conclusions

This study identified the anthropogenic drivers of woodland degradation and characterized the floristic and dendrometric indicators of miombo degradation in the LCPB by assessing three ecosystems of different ages using transect and plot inventories. The findings highlight that logging, fires, and agriculture are the primary disturbance factors, followed by invasion of exotic species, debarking, and artisanal mining activities. The distribution of these disturbance indicators is not influenced by proximity to villages. Additionally, the strong association between logging, fires, and agriculture underscores the need for an integrated management approach.
The study also confirms the significant influence of ecosystem age on floristic composition, stand structure, and population dynamics in the LCPB. Younger ecosystems exhibit lower species diversity, reduced tree density, a predominance of small trees, and an unbalanced distribution of diameter and height classes. In contrast, older ecosystems contain a higher proportion of mature individuals, distinct floristic compositions at advanced successional stages, and a more stable structural distribution. The results further indicate that forest degradation leads to a decline in traits associated with high wood density, reflecting a conservative strategy in undisturbed ecosystems, while favoring species with high regeneration capacity. These findings emphasize the role of ecosystem age in shaping miombo regeneration and succession dynamics.
Although this study provides crucial insights into the key anthropogenic factors and degradation indicators in the LCPB, its horizontal analysis is limited. The results can inform forest policy reforms, including bans on destructive practices such as uncontrolled fires and fatal bark stripping, along with the implementation of appropriate taxation measures. Supporting farmers to reduce shifting agriculture and expanding protected areas in degraded zones are critical steps for miombo regeneration. Future studies incorporating remote sensing or longitudinal ecosystem monitoring will be necessary to refine degradation assessments and evaluate conservation efforts, ultimately guiding adaptive forest management strategies in response to increasing anthropogenic pressures.

Supplementary Materials

The following supporting information can be downloaded at the website of this paper posted on Preprints.org.

Author Contributions

Conceptualization: HKM, YUS & JB; Data curation: HKM, DNN, JYM, YUS & JB; Formal analysis: HKM, JYM; Funding acquisition: JB; Investigation: HKM; Methodology: HKM, JYM, OLR, QP, YUS & JB; Project administration: YUS & JB; Resources: HKM & YUS; Software: HKM, JYM; Supervision: YUS & JB; Validation: HKM, YUS & JB; Writing - original draft: HKM & YUS; Writing - review & editing: HKM, FM, OLR, YUS, & JB.

Funding

The research was funded by the project CHARLU (ARES-CCD, Belgium)

Data Availability Statement

The data related to the present study will be available upon request from the interested party.

Acknowledgments

The authors acknowledge the Academy of Research and Higher Education (ARES) and the Research Project for Development: “Strengthening the capacity for sustainable management of miombo woodlands by assessing the environmental impact of charcoal production and improving practices towards forest resources (PRD CHARLU)” for financial support for this study through the doctoral scholarship awarded to Dieu-donné Ntambwe Nghonda and Héritier Khoji Muteya.

Conflicts of Interest

The authors declare no conflicts of interest.

References

  1. Jhariya, M.K.; Banerjee, A.; Meena, R.S.; Yadav, D.K. Agriculture, Forestry and Environmental Sustainability: A Way Forward. In Sustainable Agriculture, Forest and Environmental Management; Jhariya, M.K., Banerjee, A., Meena, R.S., Yadav, D.K., Eds.; Springer: Singapore, 2019; ISBN 9789811368301. [Google Scholar]
  2. Hansen, M.C.; Potapov, P.V.; Moore, R.; Hancher, M.; Turubanova, S.A.; Tyukavina, A.; Thau, D.; Stehman, S.V.; Goetz, S.J.; Loveland, T.R.; et al. High-Resolution Global Maps of 21st-Century Forest Cover Change. Science 2013, 342, 850–853. [Google Scholar] [CrossRef] [PubMed]
  3. FAO FRA 2015 Termes et Définitions; document de travail de l’évaluation des ressources forestières; Organisation des Nations-Unies pour l’Alimentation et l’Agriculture: Rome, 2012.
  4. Lapola, D.M.; Pinho, P.; Barlow, J.; Aragão, L.E.O.C.; Berenguer, E.; Carmenta, R.; Liddy, H.M.; Seixas, H.; Silva, C.V.J.; Silva-Junior, C.H.L.; et al. The Drivers and Impacts of Amazon Forest Degradation. Science 2023, 379, eabp8622. [Google Scholar] [CrossRef] [PubMed]
  5. Tsujino, R.; Yumoto, T.; Kitamura, S.; Djamaluddin, I.; Darnaedi, D. History of Forest Loss and Degradation in Indonesia. Land Use Policy 2016, 57, 335–347. [Google Scholar] [CrossRef]
  6. FAO Évaluation des ressources forestières mondiales 2020; FAO ;, 2021; ISBN 978-92-5-134306-7.
  7. Zhao, Z.; Li, W.; Ciais, P.; Santoro, M.; Cartus, O.; Peng, S.; Yin, Y.; Yue, C.; Yang, H.; Yu, L.; et al. Fire Enhances Forest Degradation within Forest Edge Zones in Africa. Nat. Geosci. 2021, 14, 479–483. [Google Scholar] [CrossRef]
  8. Ribeiro, N.S.; Syampungani, S.; Matakala, N.M.; Nangoma, D.; Ribeiro-Barros, A.I. Miombo Woodlands Research Towards the Sustainable Use of Ecosystem Services in Southern Africa. In Biodiversity in Ecosystems - Linking Structure and Function; Lo, Y.-H., Blanco, J.A., Roy, S., Eds.; InTech, 2015; pp. 475–491 ISBN 978-953-51-2028-5.
  9. Ryan, C.M.; Williams, M. How Does Fire Intensity and Frequency Affect Miombo Woodland Tree Populations and Biomass? Ecological Applications 2011, 21, 48–60. [Google Scholar] [CrossRef]
  10. Ribeiro, N.S.; Silva de Miranda, P.L.; Timberlake, J. Biogeography and Ecology of Miombo Woodlands. In Miombo Woodlands in a Changing Environment: Securing the Resilience and Sustainability of People and Woodlands. In Miombo Woodlands in a Changing Environment: Securing the Resilience and Sustainability of People and Woodlands; Ribeiro, N.S., Katerere, Y., Chirwa, P.W., Grundy, I.M., Eds.; Springer International Publishing: Cham, 2020; ISBN 978-3-030-50104-4. [Google Scholar]
  11. Nduwarugira, D.; Mpawenayo, B.; Roisin, Y. The Role of High Termitaria in the Composition and Structure of the Termite Assemblage in Miombo Woodlands of Southern Burundi. Insect Conservation and Diversity 2017, 10, 120–128. [Google Scholar] [CrossRef]
  12. Chidumayo, E.N.; Gumbo, D.J. The Environmental Impacts of Charcoal Production in Tropical Ecosystems of the World: A Synthesis. Energy for Sustainable Development 2013, 17, 86–94. [Google Scholar] [CrossRef]
  13. Ministère de l’Environnement, Conservation de la Nature et Tourisme Synthèse Des Études Sur Les Causes de La Déforestation et de La Dégradation Des Forêts En République Démocratique Du Congo; Version finale; 2012.
  14. Potapov, P.V.; Turubanova, S.A.; Hansen, M.C.; Adusei, B.; Broich, M.; Altstatt, A.; Mane, L.; Justice, C.O. Quantifying Forest Cover Loss in Democratic Republic of the Congo, 2000–2010, with Landsat ETM+ Data. Remote Sensing of Environment 2012, 122, 106–116. [Google Scholar] [CrossRef]
  15. Malaisse, F. How to Live and Survive in Zambezian Open Forest (Miombo Ecoregion). Les presses agronomiques de Gembloux Gembloux 2010, 23, 91–97. [Google Scholar]
  16. Meerts, P.; Hasson., M. Arbres et arbustes du Haut-Katanga; Jardin Botanique de Meise, 2017. [Google Scholar]
  17. Useni, S.Y.; Malaisse, F.; Cabala, K.S.; Munyemba, K.F.; Bogaert, J. Le rayon de déforestation autour de la ville de Lubumbashi (HautKatanga, R.D. Congo): synthèse. Tropicultura 2017, 35, 215–221. [Google Scholar]
  18. Kabulu, D.J.-P.; Vranken, I.; Bastin, J.-F.; Malaisse, F.; Nyembwe, N.S.; Useni, S.Y.; Ngongo, L.M.; Bogaert, J. Approvisionnement En Charbon de Bois Des Ménages Lushois : Quantités, Alternatives et Conséquences. In Anthropisation des paysages katangais; Bogaert, J., Colinet, G., Mahy, G., Eds.; Presses Universitaires de Liège: Liège, Belgique, 2018; pp. 297–311. [Google Scholar]
  19. Khoji, M.H.; N’Tambwe, D.-D.; Malaisse, F.; Waselin, S.; Sambiéni, K.R.; Cabala, K.S.; Munyemba, K.F.; Bastin, J.-F.; Bogaert, J.; Useni, S.Y. Quantification and Simulation of Landscape Anthropization around the Mining Agglomerations of Southeastern Katanga (DR Congo) between 1979 and 2090. Land 2022, 11, 850. [Google Scholar] [CrossRef]
  20. Khoji, M.H.; N’Tambwe, N.D.-D.; Mwamba, K.F.; Strammer, H.; Munyemba, K.F.; Malaisse, F.; Bastin, J.-F.; Useni, S.Y.; Bogaert, J. Mapping and Quantification of Miombo Deforestation in the Lubumbashi Charcoal Production Basin (DR Congo): Spatial Extent and Changes between 1990 and 2022. Land 2023, 12, 1852. [Google Scholar] [CrossRef]
  21. Kasongo, L.M.E.; Mwamba, M.T.; Tshipoya, M.P.; Mukalay, M.J.; Useni, S.Y.; Mazinga, K.M.; Nyembo, K.L. Réponse de La Culture de Soja (Glycine Max L. (Merril) à l’apport Des Biomasses Vertes de Tithonia Diversifolia (Hemsley) A. Gray Comme Fumure Organique Sur Un Ferralsol à Lubumbashi, R.D. Congo. Journal of Applied Biosciences 2013, 63, 4727–4735. [Google Scholar] [CrossRef]
  22. Igini, M. Deforestation in Africa: Causes, Effects, and Solutions Available online:. Available online: https://earth.org/deforestation-in-africa/ (accessed on 10 December 2024).
  23. Useni, S.Y.; Cabala, K.S.; Halleux, J.M.; Bogaert, J.; Munyemba, K.F. Caractérisation de la croissance spatiale urbaine de la ville de Lubumbashi (Haut-Katanga, R.D. Congo) entre 1 989 et 201 4. Tropicultura 2018, 36, 99–108. [Google Scholar]
  24. Cabala, K.S.; Useni, S.Y.; Amisi, M.Y.; Bogaert, J.; Munyemba, K.F. Analyse structurale de la dynamique forestiere dans la région de I’Arc Cuprifére Katangais en République Démocratique du Congo: II. Analyse complémentaire de la fragmentation forestiere. Pattern Analysis of Forest Dynamics of the Katangese Copper Belt Region in the Democratic Republic of the Congo: II. Complementary Analysis on Forest Fragmentation 2018, 36. [Google Scholar]
  25. Mpanda, M.M.; Khoji, M.H.; N’Tambwe, N.D.-D.; Sambiéni, K.R.; Malaisse, F.; Cabala, K.S.; Bogaert, J.; Useni, S.Y. Uncontrolled Exploitation of Pterocarpus Tinctorius Welw. and Associated Landscape Dynamics in the Kasenga Territory: Case of the Rural Area of Kasomeno (DR Congo). Land 2022, 11, 1541. [Google Scholar] [CrossRef]
  26. Ilunga, M.J.; drouet, T.; Lejolly, J.; Ngongo, L.M.; Ngoy, S.M.; Meerts, P. Les Dispositifs Permanents Du «Sanctuaire Mikembo» (Haut-Katanga), Des Outils Pour Le Monitoring de La Forêt Claire Katangaise Anthropisée. In Anthropisation des paysages katangais; Bogaert, J., Colinet, G., Mahy, G., Eds.; Presses Universitaires de Liège: Liège, Belgique, 2018; pp. 101–109. [Google Scholar]
  27. Nkulu, F.Y.; Mwamba, C.T.; Kimonge, I.M.; Djibu, K. Contribution à l’estimation de la biomasse aérienne des forêts Miombo du Haut Katanga : Etude préliminaire (RD Congo). 2018, 24.
  28. Useni, S.Y.; Khoji, M.H.; Langunu, S.; EBUY, A.J.; Munyemba, K.F. Structure des peuplements ligneux des formations végétales d’un paysage protégé en zone périurbaine de la ville de Lubumbashi (RD Congo). Geo-Eco-Trop 2019, 44, 1–44. [Google Scholar]
  29. N’tambwe, N.D.; Khoji, M.H.; Salomon, W.; Cuma, M.F.; Malaisse, F.; Ponette, Q.; Useni, S.Y.; Masengo, K.W.; Bogaert, J. Floristic Diversity and Natural Regeneration of Miombo Woodlands in the Rural Area of Lubumbashi, D.R. Congo. Diversity 2024, 16, 405. [Google Scholar] [CrossRef]
  30. Hessenmöller, D.; Elsenhans, A.-S.; Schulze, E.D. Sampling Forest Tree Regeneration with a Transect Approach. Annals of Forest Research 2013, 56, 3–14. [Google Scholar] [CrossRef]
  31. Rakotondrasoa, L.O.; Ayral, A.; Stein, J.; Rajoelison, G.L.; Ponette, Q.; Malaisse, F.; Ramamonjisoa, B.; Raminosoa, N.; Verheggen, F.; Poncelet, M.; et al. Analyse des facteurs anthropiques de dégradation des bois de tapia (Uapaca bojeri) d’Arivonimamo. In Les vers à soie malgaches. Enjeux écologiques et socio-économiques; Verheggen, F., Bogaert, J., Haubruge, E., Eds.; Les Presses Agronomiques de Gembloux: Gembloux, Belgique, 2013; p. 151. [Google Scholar]
  32. Rakotondrasoa, L.O.; Malaisse, F.; Rajoelison, G.L.; Gaye, J.; Razafimanantsoa, T.M.; Rabearisoa, M.R.; Ramamonjisoa, B.S.; Raminosoa, N.; Verheggen, F.; Poncelet, M.; et al. Identification des indicateurs de dégradation de la forêt de tapia (Uapaca bojeri) par une analyse sylvicole. Tropicultura 2013, 31, 10–19. [Google Scholar]
  33. Thiombiano, A.; Glele, K.; Bayen, P.; Boussim, J.I.; Mahamane, A. Méthodes et disposotifs d’inventaires en Afrique de l’Oeust : Etat des lieux et propositions pour une harminisation. Annales des Sciences Agronomiques - spécial Projet Undesert-UE 2016, 20, 15–31. [Google Scholar]
  34. Banza, W.B.B.; Kiseya, T.F.; Bouillard, P. Spatial Distribution of Electrical Infrastructures: Impact of Urban Sprawl in Lubumbashi, DR Congo. Asian Journal of Industrial Engineering 2016, 8, 10–17. [Google Scholar] [CrossRef]
  35. Kottek, M.; Grieser, J.; Beck, C.; Rudolf, B.; Rubel, F. World Map of the Köppen-Geiger Climate Classification Updated. metz 2006, 15, 259–263. [Google Scholar] [CrossRef] [PubMed]
  36. Kalombo Evaluation Des Éléments Du Climat En R.D.C.; Omn.univ.europ.; Editions Universitaires Européennes.; Saarbrücken (Allemagne), 2016.
  37. Kasongo, L.M.E.; Baert, G.; Ngongo, L.M.; Verdoodt, A.; Van Ranst, E. Esquise Des Pédopaysages Du Katanga et Aperçu Sur Les Potentialités Agricoles et Activités Minières. In Anthropisation despaysages katangais; Bogaert, J., Colinet, G., Mahy, G., Eds.; Presses Universitaires de Liège: Liège, Belgique, 2018; pp. 127–156. [Google Scholar]
  38. United Nations World Population Prospects; UN DESA/POP/2022/TR/NO. 3., 2022.
  39. Kalambulwa, N.A.; Kakule, M.S.; Mumba, T.U.; Lobho, L.J. Dynamics of the Forest Landscape in the Mikembo Sanctuary: 20 Years after Its Creation as a Flora and Fauna Conservation Reserve, Upper-Katanga, DR Congo. Environment & Ecosystem Science 2023, 7, 54–60. [Google Scholar] [CrossRef]
  40. Le Polain de Waroux, Y. Environmental Degradation and Economic Development in the Argan Woodlands of Aoulouz (Morocco). Science et Changements Planetaires - Secheresse 2013, 24, 29–38. [Google Scholar] [CrossRef]
  41. Giliba, R.A.; Mafuru, C.S.; Paul, M.; Kayombo, C.J.; Kashindye, A.M.; Chirenje, L.I.; Musamba, E.B. Human Activities Influencing Deforestation on Meru Catchment Forest Reserve, Tanzania. Journal of Human Ecology 2011, 33, 17–20. [Google Scholar] [CrossRef]
  42. Ameja, L.G.; Ribeiro, N.; Sitoe, A.A.; Guillot, B. Regeneration and Restoration Status of Miombo Woodland Following Land Use Land Cover Changes at the Buffer Zone of Gile National Park, Central Mozambique. Trees, Forests and People 2022, 9, 100290. [Google Scholar] [CrossRef]
  43. Dallmeier, F. Long-Term Monitoring of Biological Diversity in Tropical Forest Areas: Methods for Establishment and Inventory of Permanent Plots; Man and Biosphere Digest 11, United Nations Educational, Scientific and Cultural Organization., Ed.; UNESCO: United Nations Educational, Scientific and Cultural Organisation: Paris, 1992. [Google Scholar]
  44. Ilunga, M.J.; Bauman, D.; Drouet, T.; Vleminckx, J.; Jacobs, A.; Lejoly, J.; Meerts, P.; Shutcha, M.N. Fine-Scale Habitats Influence Tree Species Assemblage in a Miombo Forest. Journal of Plant Ecology 2017, 10, 958–969. [Google Scholar] [CrossRef]
  45. Zambrano, J.; Garzon-Lopez, C.X.; Yeager, L.; Fortunel, C.; Cordeiro, N.J.; Beckman, N.G. The Effects of Habitat Loss and Fragmentation on Plant Functional Traits and Functional Diversity: What Do We Know so Far? Oecologia 2019, 191, 505–518. [Google Scholar] [CrossRef]
  46. Thuiller, W. Patterns and Uncertainties of Species’ Range Shifts under Climate Change. Global Change Biology 2004, 10, 2020–2027. [Google Scholar] [CrossRef]
  47. Hirst, C.N.; Jackson, D.A. Reconstructing Community Relationships: The Impact of Sampling Error, Ordination Approach, and Gradient Length. Diversity and Distributions 2007, 13, 361–371. [Google Scholar] [CrossRef]
  48. Jolliffe, I.T.; Cadima, J. Principal Component Analysis: A Review and Recent Developments. Philosophical Transactions of the Royal Society A: Mathematical, Physical and Engineering Sciences 2016, 374, 20150202. [Google Scholar] [CrossRef]
  49. Greenacre, M.; Groenen, P.J.F.; Hastie, T.; D’Enza, A.I.; Markos, A.; Tuzhilina, E. Principal Component Analysis. Nat Rev Methods Primers 2022, 2, 1–21. [Google Scholar] [CrossRef]
  50. Zuur, A.F.; Ieno, E.N.; Walker, N.; Saveliev, A.A.; Smith, G.M. Mixed Effects Models and Extensions in Ecology with R.; Springer New York: New York, NY, 2009. [Google Scholar]
  51. Causton, D.R. An Introduction to Vegetation Analysis: Principles, Practice and Interpretation; Springer Science & Business Media, 2012; ISBN 978-94-011-9737-3.
  52. Macron, E. Mesures de La Biodiversité; UMR Écologie des forêts de Guyane, 2016. [Google Scholar]
  53. Gonçalves, F.M.P.; Revermann, R.; Gomes, A.L.; Aidar, M.P.M.; Finckh, M.; Juergens, N. Tree Species Diversity and Composition of Miombo Woodlands in South-Central Angola: A Chronosequence of Forest Recovery after Shifting Cultivation. International Journal of Forestry Research 2017, 2017, e6202093. [Google Scholar] [CrossRef]
  54. Burju, T.; Hundera, K.; Kelbessa, E. Floristic Composition and Structural Analysis of Jibat Humid Afromontane Forest, West Shewa Zone, Oromia National Regional State, Ethiopia. Ethiopian Journal of Education and Sciences 2013, 8, 11–34. [Google Scholar]
  55. Savadogo, S.; Sambare, O.; Ouedraogo, I.; Thiombiano, A. Espèces exotiques indicatrices de dégradation des bois sacrés au Burkina Faso. Geo-Eco-Trop 2020, 44, 409–426. [Google Scholar]
  56. Borcard, D.; Gillet, F.; Legendre, P. Canonical Ordination. In Numerical Ecology with R; Borcard, D., Gillet, F., Legendre, P., Eds.; Springer International Publishing: Cham, 2018; ISBN 978-3-319-71404-2. [Google Scholar]
  57. Han, S. The Use of Transects for Resilient Design: Core Theories and Contemporary Projects. Landscape Ecol 2021, 36, 1567–1582. [Google Scholar] [CrossRef]
  58. Hirche, A.; Salamani, M.; BOUGHANI, M.; Ratiba, H.; Zina, K.; Slimani, H.; Nedjraoui, D. Guide Technique Écologie Pour La Collecte, l’analyse Des Données et Le Calcul Des Indicateurs Écologiques Suivant l’approche Harmonisée; Observatoire du Sahara et du Sahel: OSS, Tunis, 2015; ISBN 978-9973-856-9-3. [Google Scholar]
  59. Magurran, A.E. Measuring Biological Diversity. Current Biology 2021, 31, R1174–R1177. [Google Scholar] [CrossRef]
  60. Dupuis, C.; Lejeune, P.; Michez, A.; Fayolle, A. How Can Remote Sensing Help Monitor Tropical Moist Forest Degradation?—A Systematic Review. Remote Sensing 2020, 12, 1087. [Google Scholar] [CrossRef]
  61. Doss, C.R.; Doss, C. Analyzing Technology Adoption, Challenges and Limitations of Micro Studies. Agricultural economics 2006, 34, 207–219. [Google Scholar]
  62. Toussaint, M. La Figure de l’enquêteur Dans Le Quartier de La Villeneuve de Grenoble. Les Politiques Sociales 2021, 1–2, 151–159. [Google Scholar] [CrossRef]
  63. Barima, S.S.Y.; Barbier, N.; Ouattara, B.; Bogaert, J. Relation entre la composition floristique et des indicateurs de la fragmentation du paysage dans une région de transition forêt-savane ivoirienne. Biotechnol. Agron. Soc. Environ. 2010, 14, 617–625. [Google Scholar]
  64. Vinya, R.; Malhi, Y.; Brown, N.D.; Fisher, J.B.; Brodribb, T.; Aragão, L.E.O.C. Seasonal Changes in Plant–Water Relations Influence Patterns of Leaf Display in Miombo Woodlands: Evidence of Water Conservative Strategies. Tree Physiology 2019, 39, 104–112. [Google Scholar] [CrossRef]
  65. Sedano, F.; Mizu-Siampale, A.; Duncanson, L.; Liang, M. Influence of Charcoal Production on Forest Degradation in Zambia: A Remote Sensing Perspective. Remote Sensing 2022, 14, 3352. [Google Scholar] [CrossRef]
  66. Doggart, N.; Meshack, C. The Marginalization of Sustainable Charcoal Production in the Policies of a Modernizing African Nation. Front. Environ. Sci. 2017, 5, 27. [Google Scholar] [CrossRef]
  67. Péroches, A.; Nge, O.A.; Gazull, L.; Dubliez, E. Programme de Consommation Durable et Substitution Partielle Au Bois-Énergie. Rapport d’étude Sur La Filière Bois-Énergie de La Ville de Lubumbashi; CIRAD, 2021. [Google Scholar]
  68. Amisi, M.; Vranken, I.; Nkulu, M.F.J.; Lubala, T.R.F.; Kyanika, D.; Tshibang, N.S.; Mastaki, U.F.; Bulambo, J.-P.; Bogaert, J. L’activité Minière Au Katanga et La Perception de Ses Impacts à Lubumbashi. In Anthropisation des Paysages Katangais; Bogaert, J., Colinet, G., Mahy, G., Eds.; Presses Universitaires de Liège: Liège, Belgium, 2018; pp. 267–279. [Google Scholar]
  69. Katumbi, N.; Nyengere, J.; Mkandawire, E. Drivers of Deforestation and Forest Degradation in Dzalanyama Forest Reserve in Malawi. 2015, 6, 889–893. [Google Scholar]
  70. Sedano, F.; Silva, J.A.; Machoco, R.; Meque, C.H.; Sitoe, A.; Ribeiro, N.; Anderson, K.; Ombe, Z.A.; Baule, S.H.; Tucker, C.J. The Impact of Charcoal Production on Forest Degradation: A Case Study in Tete, Mozambique. Environ. Res. Lett. 2016, 11, 094020. [Google Scholar] [CrossRef]
  71. N’tambwe, N.D.; Khoji, M.H.; Biloso, M.A.; Malaisse, F.; Useni, S.Y.; Masengo, K.W.; Bogaert, J. Socio-Economic Value and Availability of Plant-Based Non-Timber Forest Products (NTFPs) within the Charcoal Production Basin of the City of Lubumbashi (DR Congo). Sustainability 2023, 15, 14943. [Google Scholar] [CrossRef]
  72. Useni, S.Y.; Mpanda, M.M.; Khoji, M.H.; Cirezi, C.N.; Malaisse, F.; Bogaert, J. Vegetation Fires in the Lubumbashi Charcoal Production Basin (The Democratic Republic of the Congo): Drivers, Extent and Spatiotemporal Dynamics. Land 2023, 12, 2171. [Google Scholar] [CrossRef]
  73. Useni, S.Y.; Mpanda, M.M.; Malaisse, F.; Kazaba, K.P.; Bogaert, J. The Spatiotemporal Changing Dynamics of Miombo Deforestation and Illegal Human Activities for Forest Fire in Kundelungu National Park, Democratic Republic of the Congo. Fire 2023, 6, 1–21. [Google Scholar] [CrossRef]
  74. Van Wilgen, B.W.; De Klerk, H.M.; Stellmes, M.; Archibald, S. An Analysis of the Recent Fire Regimes in the Angolan Catchment of the Okavango Delta, Central Africa. fire ecol 2022, 18, 13. [Google Scholar] [CrossRef]
  75. Fisher, B.; Edwards, D.P.; Giam, X.; Wilcove, D.S. The High Costs of Conserving Southeast Asia’s Lowland Rainforests. Frontiers in Ecology and the Environment 2011, 9, 329–334. [Google Scholar] [CrossRef]
  76. Gullison, R.E.; Frumhoff, P.C.; Canadell, J.G.; Field, C.B.; Nepstad, D.C.; Hayhoe, K.; Avissar, R.; Curran, L.M.; Friedlingstein, P.; Jones, C.D.; et al. Tropical Forests and Climate Policy. Science 2007, 316, 985–986. [Google Scholar] [CrossRef]
  77. Masolele, R.N.; Marcos, D.; De Sy, V.; Abu, I.-O.; Verbesselt, J.; Reiche, J.; Herold, M. Mapping the Diversity of Land Uses Following Deforestation across Africa. Scientific Reports 2024, 14. [Google Scholar] [CrossRef]
  78. Useni, S.Y.; Malaisse, F.; Cabala, K.S.; Kalumba, M.A.; Amisi, M.; Nkuku, K.C.; Bogaert, J.; Munyemba, K.F. Tree Diversity and Structure on Green Space of Urban and Peri-Urban Zones: The Case of Lubumbashi City in the Democratic Republic of Congo. Urban Forestry & Urban Greening 2019, 41, 67–74. [Google Scholar] [CrossRef]
  79. Steinlein, T. Invasive Alien Plants and Their Effects on Native Microbial Soil Communities. In Progress in Botany: Vol. 74; Lüttge, U., Beyschlag, W., Francis, D., Cushman, J., Eds.; Springer: Berlin, Heidelberg, 2013; ISBN 978-3-642-30967-0. [Google Scholar]
  80. Siachoono, S.M.; Syampungani, S.; Mundike, J. Invasive Alien Species in Zambia. Invasive Alien Species 2021, 1, 313–329. [Google Scholar] [CrossRef]
  81. Kimpouni, V.; Lenga-Sacadura, M.-Y.; Mamboueni, J.C.; Mikoko, E.N. Phytodiversite Et Pharmacopée Traditionnelle De La Communauté Kaamba De Madingou (Bouenza - Congo). ESJ 2018, 14, 191. [Google Scholar] [CrossRef]
  82. Kozanayi, W.; Wynberg, R.; Hoffman, M.T. Does Tenure Influence Sustainable Use? The Ecological Impacts of Harvesting Baobab (Adansonia Digitata). African Journal of Ecology 2022, 60, 1246–1256. [Google Scholar] [CrossRef]
  83. Ribeiro, N.S.; Snook, L.K.; Nunes de Carvalho Vaz, I.C.; Alves, T. Gathering Honey from Wild and Traditional Hives in the Miombo Woodlands of the Niassa National Reserve, Mozambique: What Are the Impacts on Tree Populations? Global Ecology and Conservation 2019, 17, e00552. [Google Scholar] [CrossRef]
  84. Megevand, C.; Mosnier, A.; Hourticq, J.; Sanders, K.; Doetinchem, N.; Streck, C. Dynamiques de deforestation dans le basin du Congo: reconcilier la croissance economique et la protection de la foret; The World Bank: Washington, D.C, 2013; ISBN 978-0-8213-9838-8. [Google Scholar]
  85. Ncube-Phiri, S.; Ncube, A.; Mucherera, B.; Ncube, M. Artisanal Small-Scale Mining: Potential Ecological Disaster in Mzingwane District, Zimbabwe. Jàmbá: Journal of Disaster Risk Studies 2015, 7, 11. [Google Scholar] [CrossRef]
  86. Rakotondrasoa, O.L.; Ayral, A.; Rajoellison, L.G.; Ponette, Q.; Malaisse, F.; Ramamonjisoa, B.S.; Raminosoa, N.; Verheggen, F.J.; Poncelet, M.; Haubruge, É.; et al. Analyse Des Facteurs Anthropiques de Dégradation Des Bois de Tapia (Uapaca Bojeri) d’Arivonimamo. In Les vers à soie malgaches : Enjeux écologiques et socio-économiques; Verheggen, F., Bogaert, J., Haubruge, É., Eds.; Les Presses Agronomiques de Gembloux: Gembloux (Belgique), 2013; pp. 151–162. [Google Scholar]
  87. Hick, A.; Hallin, M.; Tshibungu, A.; Mahy, G. La Place de l’arbre Dans Les Systèmes Agricoles de La Région de Lubumbashi. In Anthropisation des paysages katangais; Bogaert, J., Colinet, G., Mahy, G., Eds.; Presses Universitaires de Liège – Agronomie-Gembloux: Gembloux, Belgique, 2018. [Google Scholar]
  88. McDowell, N.; Allen, C.D.; Anderson-Teixeira, K.; Brando, P.; Brienen, R.; Chambers, J.; Christoffersen, B.; Davies, S.; Doughty, C.; Duque, A.; et al. Drivers and Mechanisms of Tree Mortality in Moist Tropical Forests. New Phytologist 2018, 219, 851–869. [Google Scholar] [CrossRef] [PubMed]
  89. Dewees, P.A.; Campbell, B.M.; Katerere, Y.; Sitoe, A.; Cunningham, A.B.; Angelsen, A.; Wunder, S. Managing the Miombo Woodlands of Southern Africa: Policies, Incentives and Options for the Rural Poor. Journal of Natural Resources Policy Research 2010, 2, 57–73. [Google Scholar] [CrossRef]
  90. Ryan, C.M.; Pritchard, R.; McNicol, I.; Owen, M.; Fisher, J.A.; Lehmann, C. Ecosystem Services from Southern African Woodlands and Their Future under Global Change. Philosophical Transactions of the Royal Society B: Biological Sciences 2016, 371, 20150312. [Google Scholar] [CrossRef]
  91. Gomes, A.L.; Revermann, R.; Meller, P.; Gonçalves, F.M.P.; Aidar, M.P.M.; Lages, F.; Finckh, M. Functional Traits and Symbiotic Associations of Geoxyles and Trees Explain the Dominance of Detarioid Legumes in Miombo Ecosystems. New Phytologist 2021, 230, 510–520. [Google Scholar] [CrossRef]
  92. Deconchat, M.; Balent, G. Effets Des Perturbations Du Sol et de La Mise En Lumière Occasionnées Par l’exploitation Forestière Sur La Flore à Une Échelle Fine. Ann. For. Sci. 2001, 58, 315–328. [Google Scholar] [CrossRef]
  93. Giliba, R.A.; Boon, E.K.; Kayombo, C.J.; Musamba, E.B.; Kashindye, A.M.; Shayo, P.F. Species Composition, Richness and Diversity in Miombo Woodland of Bereku Forest Reserve, Tanzania. Journal of Biodiversity 2011, 2, 1–7. [Google Scholar] [CrossRef]
  94. Kalaba, F.K.; Quinn, C.H.; Dougill, A.J.; Vinya, R. Floristic Composition, Species Diversity and Carbon Storage in Charcoal and Agriculture Fallows and Management Implications in Miombo Woodlands of Zambia. Forest Ecology and Management 2013, 304, 99–109. [Google Scholar] [CrossRef]
  95. Montfort, F.; Nourtier, M.; Grinand, C.; Maneau, S.; Mercier, C.; Roelens, J.-B.; Blanc, L. Regeneration Capacities of Woody Species Biodiversity and Soil Properties in Miombo Woodland after Slash-and-Burn Agriculture in Mozambique. Forest Ecology and Management 2021, 488, 119039. [Google Scholar] [CrossRef]
  96. Manjate, M.J.; Massuque, J.Z. Composição Florística e Estrutura Da Vegetação Da Savana de Miombo Em Dois Ambientes Distintos No Distrito de Sanga, Norte de Moçambique. RICA 2019, 10, 77–89. [Google Scholar] [CrossRef]
  97. Mukumary, S.D.; Proces, P.; Dubiez, E.; Marien, J.-N.; Peltier, R.; Bellefontaine, R. Caractérisation partielle de la régénération naturelle d’Albizia adianthifolia sur le plateau Batéké (République Démocratique du Congo). VertigO - la revue électronique en sciences de l’environnement 2015. [Google Scholar] [CrossRef]
  98. Achour, A.; Aroui, A.; Defaa, C.; El Mousadik, A.; Msanda, F. Effet de La Mise En Défens Sur La Richesse Floristique et La Densité Dans Deux Arganeraies de Plaine. Actes du Premier Congrès International de l’ Arganier 2011, 60–69. [Google Scholar]
  99. Clovis, K.O.; Louis, Z.; Claude, G.; Valery, N.N.; Bernard-Aloys, N. Diversité Floristique Et Structurale De Deux Forêts Communautaires Sous Exploitation Au Cameroun: Cas De Kompia Et Nkolenyeng. ESJ 2018, 14, 245. [Google Scholar] [CrossRef]
  100. Boersma, K.S.; Dee, L.E.; Miller, S.J.; Bogan, M.T.; Lytle, D.A.; Gitelman, A.I. Linking Multidimensional Functional Diversity to Quantitative Methods: A Graphical Hypothesis--Evaluation Framework. Ecology 2016, 97, 583–593. [Google Scholar] [CrossRef] [PubMed]
  101. Delaporte, A. Vers une compréhension fonctionnelle des dépérissements forestiers : étude du cas du hêtre (Fagus sylvatica L.) en forêt de Fontainebleau. Thèse de Doctorat, Ecologie, Environnement. Université Paris Sud - Paris XI: France, 2015.
  102. Hawes, J.E.; Vieira, I.C.G.; Magnago, L.F.S.; Berenguer, E.; Ferreira, J.; Aragão, L.E.O.C.; Cardoso, A.; Lees, A.C.; Lennox, G.D.; Tobias, J.A.; et al. A Large-Scale Assessment of Plant Dispersal Mode and Seed Traits across Human-Modified Amazonian Forests. Journal of Ecology 2020, 108, 1373–1385. [Google Scholar] [CrossRef]
  103. DeLuca, T.H.; Zackrisson, O.; Gundale, M.J.; Nilsson, M.-C. Ecosystem Feedbacks and Nitrogen Fixation in Boreal Forests. Science 2008, 320, 1181–1181. [Google Scholar] [CrossRef]
  104. Adamidis, G.C.; Kazakou, E.; Fyllas, N.M.; Dimitrakopoulos, P.G. Species Adaptive Strategies and Leaf Economic Relationships across Serpentine and Non-Serpentine Habitats on Lesbos, Eastern Mediterranean. PLoS ONE 2014, 9, e96034. [Google Scholar] [CrossRef]
  105. Bulusu, M.; Martius, C.; Clendenning, J. Carbon Stocks in Miombo Woodlands: Evidence from over 50 Years. Forests 2021, 12, 862. [Google Scholar] [CrossRef]
  106. Blache, A. De la « Fortress Conservation » aux nouveaux modèles de gestion participative de la biodiversité en Tanzanie. vertigo 2020, 20. [Google Scholar] [CrossRef]
  107. Borokini, T.I.; Babalola, F.D.; Amusa, T.O.; Ivande, S.T.; Wala, Z.J.; Jegede, O.O.; Tanko, D.; Ihuma, J.O. Community-Based Forest Resources Management in Nigeria: Case Study of Ngel Nyaki Forest Reserve, Mambilla Plateau, Taraba State, Nigeria. JTFE 2012, 2. [Google Scholar] [CrossRef]
  108. Ranaivoarisoa, H.F.; Ramananarivo, S.; Ramananarivo, R.; Aubert, S. L’agriculture Durable, Element de Strategie Pour Le Developpement Rural Communal Cas De La Commune d’Ampitatafika- District d’Antanifotsy- Region Du Vakinankaratra.; ISDA: Montpellier, France, June 28 2010; p. 14. [Google Scholar]
  109. N’tambwe, N.D.; Khoji, M.H.; Kasongo, B.W.N.; Sambiéni, K.R.; Malaisse, F.; Useni, S.Y.; Masengo, K.W.; Bogaert, J. Towards an Inclusive Approach to Forest Management: Highlight of the Perception and Participation of Local Communities in the Management of Miombo Woodlands around Lubumbashi (Haut-Katanga, D.R. Congo). Forests 2023, 14, 1–21. [Google Scholar] [CrossRef]
  110. Katani, J.Z.; Madoffe, S.S.; Amanzi, N.S.; Rija, A.A.; Midtgaard, F.; Mbeyale, G.; Zahabu, E.; Tarimo, B.C. Assessment of Fire Prevalence and Reduction Strategies in Miombo Woodlands of Eastern Tanzania. Tanzania Journal of Forestry and Nature Conservation 2014, 84. [Google Scholar]
  111. Ndong, S.N.; Mouloungi, A.G.K.; Ze, S.O. Gouvernance des forêts et enjeux de création des parcs nationaux au Gabon : cas du parc national de la Lopé. Revue forestière française 2019, 71, 493–506. [Google Scholar] [CrossRef]
Figure 1. Geographic location of the LCPB in the Haut-Katanga province, DRC, showing the selected charcoal-producing villages and the main charcoal transportation routes. The land cover classification was derived from a 2022 Sentinel-1 image using the Random Forest algorithm in Google Earth Engine.
Preprints 151808 g001
Figure 2. Spatiotemporal evolution map of land cover in the Maksem site (2015–2022), Mwawa site (2010–2022), and Mikembo site (2002–2022), derived from the classification of Landsat images from 2002, 2010, 2015, and 2022 using the Random Forest algorithm. Abandoned areas have undergone regeneration across all three study sites.
Preprints 151808 g002
Figure 3. Illustrations of vegetation degradation factors in the BPCB of Lubumbashi. With 1: charcoal kilns, 2: a cut tree trunk, 3: a cultivated field, 4: fire marks on a tree, 5: a debarked tree trunk, 6: an Eucalyptus grandis individual in the miombo woodlands, 7: an abandoned site after artisanal mining activities (© Héritier Khoji, 2022).
Preprints 151808 g003
Figure 4. Principal Component Analysis (PCA) of disturbance factors affecting woodland vegetation in the BPCB of Lubumbashi. The first two axes explain a combined 66.37% of the total variance. Logging, fires, and agriculture strongly contribute to the first axis, whereas invasion of exotic species, bark stripping, and artisanal mining activities are mainly associated with the second axis.
Preprints 151808 g004
Figure 5. The impact of ecosystem age (degradation level) on species richness (A), Shannon-Weaver diversity index (B), and Pielou’s evenness index (C). There is no significant difference in species richness and the Shannon-Weaver diversity index between the low-degradation (21 years) and moderately degraded (14 years) ecosystems. However, both ecosystems differ significantly from the severely degraded ecosystem (7 years). Pielou’s evenness index does not show significant variation across the three ecosystems.
Preprints 151808 g005
Figure 6. The impact of ecosystem age (degradation level) on tree density (A), diameter at breast height (DBH, B), height (C), and basal area (D). Severely degraded ecosystems exhibit very low mean tree density (<100 trees/ha), whereas in more mature ecosystems, tree density approaches 300 trees/ha. The mean DBH is around 24 cm in the mature ecosystem, compared to 18 cm in the moderately degraded and 11 cm in the severely degraded ecosystem. The average tree height is 9.5 m in the mature ecosystem, while in the moderately and severely degraded ecosystems, it is approximately 6 m and 4.5 m, respectively. Finally, the mean basal area is around 15 m²/ha in the mature ecosystem, compared to 4 m²/ha in the moderately degraded and less than 1 m²/ha in the severely degraded ecosystem.
Preprints 151808 g006
Figure 7. Diameter (cm, A) and height (m, B) distribution of trees in 21-year-old (slightly degraded), 14-year-old (moderately degraded), and 7-year-old (severely degraded) ecosystems. Data were collected from 16 plots of 1000 m² per site. All three ecosystems exhibit an inverted J-shaped DBH distribution, with a higher proportion of small-diameter trees in the moderately and severely degraded ecosystems. In contrast, the slightly degraded ecosystem has a greater proportion of large-diameter trees, despite the presence of young individuals. Regarding tree height, the severely degraded ecosystem is dominated by trees below 5 m, while the moderately degraded ecosystem has a majority of individuals in the 5–10 m height class. In the slightly degraded ecosystem, the structure is more balanced, with a higher proportion of trees exceeding 10 m.
Preprints 151808 g007
Figure 8. Asymptotic regression illustrating the diameter-height relationship of trees in 21-year-old (slightly degraded), 14-year-old (moderately degraded), and 7-year-old (severely degraded) ecosystems, based on inventories conducted in 16 plots of 1000 m² per site. The severely degraded ecosystem exhibits faster height growth and a stronger diameter-height relationship, whereas in the older, slightly degraded ecosystem, growth slows, and trees allocate more resources to trunk expansion rather than height increase.
Preprints 151808 g008
Figure 9. Linear Discriminant Analysis (LDA) illustrating the relationships between species groups based on the presence or absence of specific traits under different disturbance levels. The abbreviations are as follows: DL (disturbance level), MD (moderately degraded), SD (severely degraded). The functional traits include FE (fruit edibility), HRC (high regeneration capacity), HWD (high wood density), LA (leaf area), NF (nitrogen fixation), VH (vegetation height), and Zoo (zoochory). The analysis does not identify any traits that distinguish between the two disturbance levels.
Preprints 151808 g009
Figure 10. Linear Discriminant Analysis (LDA) illustrating the relationships between species groups defined based on the presence or absence of specific functional traits under the influence of ecosystem condition. The functional traits are abbreviated as follows: FE (fruit edibility), HRC (high regeneration capacity), HWD (high wood density), LA (leaf area), NF (nitrogen fixation), VH (vegetation height), and Zoo (zoochory). The analysis highlights functional differences between ecosystems. The non-degraded ecosystem is characterized by a low probability of HRC and a high probability of HWD. In contrast, the degraded ecosystem exhibits a lower probability of HWD and NF, while showing a higher probability of Zoo.
Preprints 151808 g010
Table 1. Geographic coordinates, number of households, degradation level, distance from Lubumbashi, road conditions connecting the village to Lubumbashi, and main activities in the selected villages within the Charcoal Production Basin (BPCB) of Lubumbashi. With GC : geographic coordinates; H: households; DL : degradation level; DFL : distance from Lubumbashi; RC : Road condition; MA: main activities; With SD: slightly degraded; MD: moderately degraded; HD: highly degraded; VG: very good; G: good; LG: less good; 1: agriculture); 2: charcoal production; 3: small-scale trade; 4: artisanal mining; ADF: analysis of disturbance factors; ADI: analysis of disturbance indicators.
Villages GC H DL DFL RC MA ADF ADI
Lwisha 11°10’ S ; 27°01’ E 2760 MD 86 km VG 1, 2, 3, 4 X
Maksem 11°19’ S ; 27°50’ E 356 HD 72 km VG 1, 2, 3 X X
Mwawa 12°03’ S ; 27°35’ E 115 MD 60 km G 1, 2, 3 X X
Nsela 11°20’ S ; 27°36’ E 129 HD 30 km LG 1, 2, 3, 4 X
Texas 11°39’ S ; 27°46’ E 179 HD 30 km LG 1, 2, 3 X
Mikembo 11°28’ S ; 27°40’ E 0 SD 30 km VG - - X
Table 2. Disturbance factors and indicators recorded in the LCPB of Lubumbashi, based on informal surveys conducted with five randomly selected individuals from each study village.
Degradation factor Indicator
1 Logging Presence of tree stumps or trunks with resprouts, signs of charcoal production activities, including the presence of kilns.
2 Agriculture Presence of cultivated fields or fallow land.
3 Vegetation fires Observation of blackened marks on trees or charred trunks.
4 Debarking Presence of bark harvesting marks on a tree trunk.
5 Invasion of exotic species Inventory of exotic species, including Eucalyptus sp., Pinus sp., Acacia sp., and others.
6 Artisanal mining activities Presence of small-scale mining sites and artisanal miner camps
Table 3. Presence-absence of disturbance factors in vegetation surrounding charcoal-producing villages within the BPCB of Lubumbashi (DR Congo). Wood harvesting, fires, and agriculture were the most frequently encountered disturbance factors.
Degradation factor Presence-Absence (%)
Logging 90,00
Fires 90,00
Agriculture 83,75
Invasion of exotic species 37,50
Debarking 21,25
Artisanal mining activities 5,00
Table 4. Association analysis of vegetation disturbance factors in the charcoal production basin of Lubumbashi, using the χ² independence test based on presence-absence data. A strong association is observed between logging, fires, and agriculture, whereas invasion of exotic species (IES), debarking, and artisanal mining activities (AMA) act independently. NS : Non-significant, ***= p<0,001.
Logging Fires Agriculture IES Debarking
Fires 69,27*** - - - -
Agriculture 39,22*** 39,22*** - - -
IES 0,15 NS 0,14 NS 0,15 NS - -
Debarking 1,19 NS 1,19 NS 0,84 NS 0,04 NS -
AMA 0,05 NS 0,04 NS 0,04 NS 1,12 NS 0,19 NS
Disclaimer/Publisher’s Note: The statements, opinions and data contained in all publications are solely those of the individual author(s) and contributor(s) and not of MDPI and/or the editor(s). MDPI and/or the editor(s) disclaim responsibility for any injury to people or property resulting from any ideas, methods, instructions or products referred to in the content.
Copyright: This open access article is published under a Creative Commons CC BY 4.0 license, which permit the free download, distribution, and reuse, provided that the author and preprint are cited in any reuse.
Prerpints.org logo

Preprints.org is a free preprint server supported by MDPI in Basel, Switzerland.

Subscribe

Disclaimer

Terms of Use

Privacy Policy

Privacy Settings

© 2025 MDPI (Basel, Switzerland) unless otherwise stated