
Submitted:
26 September 2025
Posted:
26 September 2025
You are already at the latest version
Abstract
Soil organic carbon (SOC) can be effective in evaluating cropping systems and their sustainability. Diversifying crops within intensive farming systems enhances the en-vironmental sustainability of agriculture. The effect of diversification in the soil-plant system can be assessed at different scales, and the field represents the first assessment level. For this purpose, both measured and modelled point data must be extrapolated to the corresponding field and subsequently extended to the broader territory in which they are situated. This study seeks to evaluate the influence of diversified cropping systems on SOC content at territorial level. In Northern Italy, two crop management approaches — one incorporating diversification and one without — were analyzed. The ECOSSE model was employed to simulate changes in SOC content over a 30-year period of diversification, compared with monocropping. The results of the model, first run in available soil profiles, were upscaled to the field to which they belong; then, using a machine learning approach, data were interpolated at the landscape scale, extending the information to several land units with fairly uniform soil, climate, and management conditions. Achieving a thorough assessment of the impact of crop diversification at landscape scale represents a valuable tool to support decisions for agricultural policy makers and planners.
Keywords:
Soil organic carbon
; Crop diversification
; Sustainable management
; Soil mapping
; Ecosse model
; Machine learning
1. Introduction
Agricultural systems, along with the challenges they pose for sustainable development, are generally complex. Among soil properties, soil organic carbon (SOC) represents an important feature that can be effective in evaluating soil quality under different cropping systems, and is considered as a general indicator for assessing soil quality [1]. Surface soils hold a significant amount of the carbon (C) that is actively cycled worldwide, exceeding the total C stored in both the atmosphere and vegetation [2,3,4]. With changes in global climate and land use accelerating at unprecedented rates [5,6], there is a need to project SOC dynamics under changing environmental conditions. Information about SOC is crucial for sustainable soil management, aiming to lower agricultural production costs and to produce large crop yields, also contributing to environmental protection [7]. Such information is also especially significant in the context of the Sustainable Development goal target 15.3, which aims to achieve Land Degradation Neutrality (LDN), as established by the United Nations Convention to Combat Desertification (UNCCD; http://www.unccd.int).
Agricultural soils experience temporal variations in SOC, influenced also by management strategies including cropping systems, fertilization, residue handling, and tillage regimes [8,9,10]. The effects of cultivation practices and crop rotations are considered as the main factors driving changes in SOC content and thereby influencing the sustainability of farming systems [11]. Crop diversification, consisting in cultivating multiple crops within a single area, can be achieved by introducing a new crop species or variety, or by modifying the existing cropping system. Often, this involves incorporating additional crops into the current rotation, but encompasses also the reduction of external inputs. Cover crops are widely accepted as sustainable crop management practices that minimize soil and water losses, enhance organic matter content, and improve biodiversity and fertility in degraded agricultural soils [12], reducing also the impact of agriculture on climate change [13]. In intensive agricultural systems, crop diversification contributes to the environmental sustainability of farming systems. Increasing the diversity of crops on farms has been associated with co-benefits such as higher yields, better yield quality, and greater resilience and stability of the agricultural system [14,15,16], and can represent a strategy designed to enhance agricultural revenue and thereby reduce poverty [17]. Diversified farming systems have proven to provide benefits on food production [18,19], reduction in ground water depletion [20,21], promotion of carbon sequestration [22], and biodiversity conservation [18,19,22,23,24]. Kamau et al. [25] found that nearly 47% of the world’s land can support profitable crop diversification strategies.
In assessing how crop diversification impacts soil-water-atmosphere systems, field scale is the first step. Both measured and modeled point data must be extrapolated to their corresponding fields to obtain a comprehensive understanding of the effects of crop diversification on farm yields, soil, and the environment.
A landscape-scale assessment of agriculture is necessary to improve regional planning and to guide the prioritization of detailed evaluation of agricultural economic and environmental aspects. It is essential to extrapolate data from local contexts to larger scales, and mapping can help to group homogeneous portions of territory. Maps can help policymakers in identifying territorial impacts in terms of agro-environmental, social and economic effects. Aiming to increase the impact of agricultural practices on sustainable regional development, the assessment should consider the location and the diversity of cropping systems [26]. In particular, the effect of diversification in the soil-plant system can be assessed at different scales, and much more than single values, SOC variation over time is the crucial aspect for understanding the effect of diversification. Upscaling consists in an increase in scale extent and commonly involves an expansion in spatial coverage accompanied by a lower resolution. Cross-scaling is suitable when the dynamics of processes at a given scale are indirectly influenced by processes occurring at other scales [27].
The use of machine learning (ML) techniques has grown significantly during the past years in a variety of scientific domains. In soil science research non-linear models can be more effective at capturing the complexity of soil-environment interactions [28]. Thus, pedometrics has employed statistical models designed to infer the spatial and temporal distribution of soil from data [29].
In the framework of the H2020 Diverfarming project (http://www.diverfarming.eu/index.php/en/) - that intended to promote sustainable diversified cropping systems with low-input innovative farming practices, adopting a multi-disciplinary approach across Europe - the aim of this work was to assess how diversified cropping systems can influence SOC content at territorial level, to better understand their potentials to support more sustainable outcomes. A case study from Northern Italy is presented, where experimental data were upscaled from field to landscape.
2. Materials and Methods
2.1. Study Area
The research was conducted on a farm situated in the Po Valley, Cremona province, Lombardy Region, Northern Italy, an intensive arable land located in the Mediterranean North agroclimatic zone (farm center: 45°04'58"N 10°26'01"E), at about 30 m a.s.l. Here, highly specialized professional farms for cereals, horticulture and livestock production are present; current agricultural management practices are characterized by intensive production systems. The area is representative of a cereal-based cropping system, where tomato–durum wheat rotation is the most common farm management. Durum wheat is rainfed, while tomato is irrigated.
The soil in the experimental area has a silty loam texture. The conventional management consists of a 3-yrs tomato-durum wheat rotation (tomato-tomato-durum wheat), with uncovered soil periods between crop cycles. Current management practices include intense tillage, mineral fertilization, and integrated pest management.
In 2017-2018 a leguminous crop (pea for food) was introduced in the rotation as diversification strategy, introducing also tomato after pea harvest as multiple cropping. Digestate or pig slurry was applied in combination with chemical fertilizers. The diversified crop rotation was then durum wheat-industrial tomato-pea for food/industrial tomato as multiple cropping.
2.2. Field Data Collection and Mapping
The dataset consists of 24 soil point samples collected in the experimental field from the 0-30 cm layer in October 2017 before the start of the experiment; the samples were analyzed for total organic carbon (TOC) by an elemental analyzer (LECO TOC Analyzer, mod. RC-612).
Field maps can be a support to farmers and consultants to understand the response of crop management at field level. Usually, a probabilistic (geostatistical) approach is preferable to a deterministic estimator, because it treats uncertainty explicitly. In our case it has been verified that, given the small number of measured points and the limited spatial variability of TOC, a deterministic interpolator provides good spatial estimates with an acceptable global map error. Among deterministic interpolation methods, Inverse Distance Weighting (IDW) is the most commonly applied due to its simplicity and accessibility. It relies on the principle that unsampled point values can be approximated through a weighted average of nearby sampled points, either within a threshold distance or from a set number of closest observations, usually between 10 and 30. Weights are conventionally assigned as an inverse power of distance [30,31]. The estimated map of measured point data at field scale was drawn applying IDW interpolation method to the measured data at time zero.
2.3. Simulation at Field Scale
Originally developed for the simulation of highly organic soils, the ECOSSE model accounts for all principal processes of soil C turnover [32]. These processes are simulated by simplified equations requiring only commonly available input data, which facilitates the model’s adaptation from field-scale applications to use as a national-level tool with minimal loss of accuracy. It is able to simulate how land-use, management and climate change impact C dynamics [33]. In this work it was run to predict SOC (expressed as TOC) change in soils after a long period of diversification, compared with the same period of conventional farming. Model predictions were performed running the model with point data corresponding to available soil profiles, to have a comprehensive view of the effect of crop diversification. For the simulation we chose a projected climate scenario obtained by the Agri4Cast platform (ETHZ, Intermediate realization of climate change with markedly different precipitations patterns) [34]. In the field we compared 30 years (from 2018 to 2047) of the conventional farming system and 30 years of diversification. These simulations gave us the variation of TOC in each measured point, and this point dataset was then spatialized to the field extent with IDW for a better visual comparison.
2.4. Upscaling at Landscape Scale
Assessing the effects of crop diversification at the landscape scale is essential for informing agricultural planning. Generalization, the standard technique for translating higher-resolution maps to coarser scales, consists of aggregating areas with shared characteristics, largely guided by formal understanding and intuitive reasoning [35]. For upscaling, the support (landscape area of interest) was defined as a continuous area surrounding the experimental site with similar pedological and climatic features. The definition of the landscape extent was driven mainly by the Soil Region - an area across which soils are relatively uniform - to which the experimental field belongs, and by the Municipalities (NUTS3) interested in the studied diversification. In our case the landscape area comprises three provinces - Mantua, Cremona and Brescia - in Lombardy Region. The climate was assumed to be the same as the experimental field. In Figure 1 the graphic representation of the adopted procedure is reported.
The simulation with ECOSSE model, conveniently modified to run simultaneously in several spatially distributed points (MULTIECOSSE), was then extended to a set of soil profiles with the same land use (intensive agriculture) in a quite homogeneous landscape surrounding the experimental area. The information from all the complete soil profiles available for the study area was retrieved from the European Soil Database v. 2.0 (https://esdac.jrc.ec.europa.eu/content/european-soil-database-v20-vector-and-attribute-data). The simulation was performed under two different scenarios: “present”, using the information about the current climate, and “30 years”, considering the modelled results in the next 30 years using again the ETHZ climate scenario. Point model results for TOC variation were then interpolated at landscape scale using a ML approach – the ‘ranger’ function in R, a fast implementation of Random Forests particularly suitable for high dimensional data. Then, a set of 15 covariates (auxiliary information), described in Table 1, was used in the ML algorithm application. The covariates were selected based on their correlation degree, and then converted to principal components to reduce covariance and dimensionality, and also to fill in all missing pixels. The resulting principal components are related with the target variable by means of the ‘ranger’ function, a fast implementation of Random Forests, particularly suited for high dimensional data. The output is a prediction map with an associated error map.
3. Results and Discussion
The map of the measured TOC content in sampling points in the 0-30 cm layer at the beginning of the experiment, spatialized by means of IDW, is reported in Figure 2. In Figure 3 the maps of modelled TOC variation after 30 years in the 0-30 cm layer in the two considered scenarios – conventional and diversified management - for the experimental field show how the diversification could mitigate the C loss from the soils of the area. Such maps, based on spatial interpolation, can be readily updated as new data become available, and can serve as effective tools for monitoring soil-plant system dynamics in relation to the crop management adopted by the farmer. They can be considered as a tool to check the positive or negative impact of a specific crop diversification management on the field for the amount of TOC in the soil. If the effect of the soil-plant system in a portion of the field is not as the farmer expects, one or more agronomic practices can be changed only in that sector, applying in this way a precision agriculture method. This can enhance the sustainability of farming, e.g reducing inputs where they are not necessary.
Upscaling involves extrapolating values over a larger space, thus scaling efforts necessarily involve managing the transfer of information among different levels. Switching from the field scale to landscape scale means lowering the geometric precision to achieve a broader sight of the territory. A basic upscaling method consists of extending measurements obtained at a single location to a broader area, but any spatial variability is not considered in this way. If multiple point locations representing the spatial variability are available, they may be aggregated into homogeneous spatial zones – by types of crops and rotations, soils and management [45]. Approaches simply based on land use maps can be considered an efficient first-order approximation, but quantitative approaches for preserving the quality of the original information are recommended whenever feasible. A more accurate approach should consider the spatial variability of soil and management. Errors might be avoided if upscaling is based on a representative set of known points instead of aggregated data, thus the availability of reliable soil data in the target area is very important for the success of the upscaling procedure. Nevertheless, there are good reasons to perform upscaling with block support (areal representation of data), because some information like management data from regional statistics or agronomic models (scenarios) is often available only with block support [45].
According to Hengl et al. [46], using ML instead of linear regression can considerably improve output data quality. In Figure 4, the maps of modelled TOC in the 0-30 cm layer at landscape scale - both for conventional and diversified management - are shown, and in Figure 5 the maps of the correspondent standard estimation error are reported, to corroborate the goodness of the estimation. Looking at these maps, how the diversification could mitigate the C loss from the soils of the area is quite clear. The differences in soil C loss are perhaps not substantial, but coupling crop diversification with legumes with other conservative practices can be effective not only in mitigating soil C loss, but also in enhancing soil C sequestration.
Our findings corroborate those of several other authors. In their work, Nicholls et al. [47] found that crop diversification practices such as rotation, intercropping, and multiple cropping favors ecological interactions that help in sustaining soil fertility, nutrient cycling and retention, water storage, pest and disease control, and pollination, thereby reducing reliance on external inputs, mitigating the effects of - and promoting the adaptation to - climate change. Poeplau and Don [48] considered the use of cover crops as promising and sustainable method for climate change mitigation, given their relatively high rates of carbon sequestration and the large spatial extent of areas suitable for cultivation. Laamrani et al. [11] concluded that conservation tillage combined with the inclusion of cover crops within crop rotations produced positive effects on topsoil C and may represent appropriate management strategies for enhancing soil fertility and sustainability in agricultural lands. Novara et al. [12] concluded that cover crops represent a positive contribution to the sustainability of agriculture. Locatelli et al. [49] simulated the impact of crop diversification and tillage on SOC dynamics in Brazil up to the year 2070, suggesting that diversified cropping systems may constitute a promising strategy for enhancing SOC sequestration, while also providing important insights for the improvement of current management practices.
Research by Yan et al. [50] contributed to gaining insight into the long-term performance of diversified cropping systems under real-world conditions and climate change, providing actionable information for optimizing crop productivity alongside soil quality in sustainable agriculture. In our research, the maps elaborated at landscape scale represent an additional tool for stakeholders to understand if the crop management diversification has a positive impact on soil, land, biodiversity and economic aspect in a territory or if some changes in techniques or different types of crops should be applied. In particular, they can show how the application of different crop diversification management can influence a large region. In evaluating the maps it should be considered that a longer period of observation might be necessary to better define the effect of diversification on soil properties.
4. Conclusions
Several researchers have demonstrated that the adoption of crop diversification in intensive agricultural systems can represent an important step towards sustainability. The maps obtained in this work show the effect of the studied diversification considering two periods: the present and 30 years onward, predicted by the ECOSSE model. In particular, landscape maps individuate the territory with similar climatic, soil and land use characteristics. The results confirm that a spatial assessment with maps both at field and at landscape scale can help stakeholders to get a quick overview of the impact of crop diversification management on farms and on the territory, and to identify issues and opportunities for crop diversification in improving sustainable management, towards a more resilient agriculture. Adopting crop diversification together with other conservative practices can be effective not only in mitigating soil C loss, but also in enhancing soil C sequestration.
The tested procedure, bringing together a model for simulating C dynamics, an interpolation method to extend the results to the field extent, and a ML approach to upscale the model result to a broader landscape, has proven to be effective in emphasizing the effect of crop diversification with legumes on soil C loss in the long period at different scales. Since a longer period of time might be necessary to better define the effect of diversification on soil properties, further investigation is desirable.
Author Contributions
Conceptualization, R.F., C.P., S.V. and C.D.B.; methodology, A.M., C.D.B. and C.P.; data curation, R.F. and C.D.B.; mapping, A.M. and C.P.; writing—original draft preparation, C.P.; writing—review and editing, C.D.B.; supervision, R.F. All authors have read and agreed to the published version of the manuscript.
Funding
This research was funded by European Union’s Horizon 2020 Research and Innovation Programme, DIVERFARMING project, grant agreement No 728003.
Data Availability Statement
Data available in a publicly accessible repository. The original data presented in the study are openly available in Zenodo at https://zenodo.org/records/3685753
Acknowledgments
The authors wish to thank Prof. Marianna Cerasuolo and Dr Khadiza Begum for performing the simulations with ECOSSE.
Conflicts of Interest
The authors declare no conflicts of interest. The funders had no role in the design of the study; in the collection, analyses, or interpretation of data; in the writing of the manuscript; or in the decision to publish the results.
Abbreviations
The following abbreviations are used in this manuscript:
| SOC | Soil Organic Carbon |
| TOC | Total Organic Carbon |
| IDW | Inverse Distance Weighting |
| ML | Machine Learning |
References
- Stolbovoy, V.; Montanarella, L.; Filippi, N.; Jones, A.; Gallego, J.; Grassi, G. Soil sampling protocol to certify the changes of organic carbon stock in mineral soil of the European Union. Version 2. EUR 21576 EN/2. 56 pp. Office for Official Publications of the European Communities, Luxembourg, 2007. ISBN: 978-92-79-05379-5. Available online: URL https://esdac.jrc.ec.europa.eu/ESDB_Archive/eusoils_docs/other/EUR21576_2.pdf (Accessed September 2025).
- Janzen, H.H. Carbon cycling in earth systems - a soil science perspective. Agric. Ecosyst. Environ., 2004, 104, 399–417. https://doi.org/10.1016/j.agee.2004.01.040. [CrossRef]
- Lal, R. Soil carbon sequestration impacts on global climate change and food security. Science, 2004, 304, 1623–1627. DOI: 10.1126/science.1097396. [CrossRef]
- Scharlemann, J.P.; Tanner, E.V.; Hiederer, R.; Kapos, V. Global soil carbon: Understanding and managing the largest terrestrial carbon pool. Carbon Manag., 2014, 5, 81–91. https://doi.org/10.4155/cmt.13.77. [CrossRef]
- Biskaborn, B.K.; Smith, S.L.; Noetzli, J.; Matthes, H.; Vieira, G.; Streletskiy, D.A.; Schoeneich, P.; Romanovsky, V.E.; Lewkowicz, A.G.; Abramov, A.; Allard, M.; Boike, J.; Cable, W.L.; Christiansen, H.H.; Delaloye, R.; Diekmann, B.; Drozdov, D.; Etzelmüller, B.; Grosse, G.; Guglielmin, M.; Ingeman-Nielsen, T.; Isaksen, K.; Ishikawa, M.; Johansson, M.; Johannsson, H.; Joo, A.; Kaverin, D.; Kholodov, A.; Konstantinov, P.; Kröger, T.; Lambiel, C.; Lanckman, J.P.; Luo, D.; Malkova, G.; Meiklejohn, I.; Moskalenko, N.; Oliva, M.; Phillips, M.; Ramos, M.; Sannel, A.B.K.; Sergeev, D.; Seybold, C.; Skryabin, P.; Vasiliev, A.; Wu, Q.; Yoshikawa, K.; Zheleznyak, M.; Lantuit, H. Permafrost is warming at a global scale. Nat Commun, 2019, 10, 264. https://doi.org/10.1038/s41467-018-08240-4. [CrossRef]
- Winkler, K.; Fuchs, R.; Rounsevell, M.; Herold, M. Global land use changes are four times greater than previously estimated. Nat Commun, 2021, 12, 2501. https://doi.org/10.1038/s41467-021-22702-2. [CrossRef]
- Bouasria, A.; Namr, K.I.; Rahimi, A.; Ettachfini, E.M. Geospatial Assessment of Soil Organic Matter Variability at Sidi Bennour District in Doukkala Plain in Morocco. J. Ecol. Eng., 2021, 22(11), 120–130. https://doi.org/10.12911/22998993/142935. [CrossRef]
- Dolan, S.; Clapp, C.; Allmaras, R.; Baker, J.; Molina, J. Soil organic carbon and nitrogen in a Minnesota soil as related to tillage, residue and nitrogen management. Soil Tillage Res, 2006, 89,:221–231. https://doi.org/10.1016/j.still.2005.07.015. [CrossRef]
- Van Wesemael, B.; Paustian, K.; Meersmans, J.; Goidts, E.; Barancikova, G.; Easter, M. Agricultural management explains historic changes in regional soil carbon stocks. Proc Natl Acad Sci USA, 2010, 107(33), 14926–14930. https://doi.org/10.1073/pnas.1002592107. [CrossRef]
- Knotters, M.; Teuling, K.; Reijneveld, A.; Lesschen, J.P.; Kuikman, P. Changes in organic matter contents and carbon stocks in Dutch soils, 1998–2018. Geoderma, 2022, 414, 115751. https://doi.org/10.1016/j.geoderma.2022.115751. [CrossRef]
- Laamrani, A.; Voroney, P.R.; Berg, A.A.; Gillespie, A.W.; March, M.; Deen, B.; Martin, R.C. Temporal Change of Soil Carbon on a Long-Term Experimental Site with Variable Crop Rotations and Tillage Systems. Agronomy, 2020, 10, 840. https://doi.org/10.3390/agronomy10060840. [CrossRef]
- Novara, A.; Cerda, A.; Barone, E.; Gristina, L. Cover crop management and water conservation in vineyard and olive orchards. Soil Tillage Res., 2021, 208, 104896. https://doi.org/10.1016/j.still.2020.104896. [CrossRef]
- Keesstra, S.; Nunes, J.; Novara, A.; Finger, D.; Avelar, D.; Kalantari, Z.; Cerdà, A. The superior effect of nature based solutions in land management for enhancing ecosystem services. Sci. Total Environ., 2018, 610–611, 997–1009. https://doi.org/10.1016/j.scitotenv.2017.08.077. [CrossRef]
- Tilman, D.; Balzer, C.; Hill, J.; Befort, B.L. Global food demand and the sustainable intensification of agriculture. Proc. Natl. Acad. Sci. USA, 2011, 108, 20260–20264. https://doi.org/10.1073/pnas.1116437108. [CrossRef]
- Isbell, F.; Adler, P.R.; Eisenhauer, N.; Fornara, D.; Kimmel, K.; Kremen, C.; Letourneau, D.K.; Liebman, M.; Polley, H.W.; Quijas, S.; Scherer-Lorenzen, M. Benefits of increasing plant diversity in sustainable agroecosystems. J. Ecol., 2017, 105, 871-879. https://doi.org/10.1111/1365-2745.12789. [CrossRef]
- Finn, J.A.; Suter, M.; Haughey, E.; Hofer, D.; Lüscher, A. Greater gains in annual yields from increased plant diversity than losses from experimental drought in two temperate grasslands. Agric. Ecosyst. Environ., 2018, 258, 149–153. https://doi.org/10.1016/j.agee.2018.02.014. [CrossRef]
- Danso-Abbeam, G. Crop diversification and multidimensional poverty in rural Ghana: the empirical linkages. Sustain. Fut., 2025, 10, 101122. https://doi.org/10.1016/j.sftr.2025.101122. [CrossRef]
- Beillouin, D.; Ben-Ari, T.; Malézieux, E.; Seufert, V.; Makowski, D. Positive but variable effects of crop diversification on biodiversity and ecosystem services. Glob. Chang. Biol., 2021, 27, 4697–4710. https://doi.org/10.1111/gcb.15747. [CrossRef]
- Zhao, J.; Chen, J.; Beillouin, D.; Lambers, H.; Yang, Y.; Smith, P.; Zeng, Z.; Olesen, J.E.; Zang, H. Global systematic review with meta-analysis reveals yield advantage of legume-based rotations and its drivers. Nat Commun, 2022, 13, 4926. https://doi.org/10.1038/s41467-022-32464-0. [CrossRef]
- Yang, X.; Steenhuis, T.S.; Davis, K.F.; van der Werf, W.; Ritsema, C.J.; Pacenka, S.; Zhang, F.; Siddique, K.H.M.; Du, T. Diversified crop rotations enhance groundwater and economic sustainability of food production. Food Energy Secur, 2021, 10, e311. https://doi.org/10.1002/fes3.311. [CrossRef]
- Wang, S.; Xiong, J.; Yang, B.; Yang, X.; Du, T.; Steenhuis, T.S.; Siddique, K.H.M.; Kang, S. Diversified crop rotations reduce groundwater use and enhance system resilience. Agric. Water Manag., 2023, 276, 108067. https://doi.org/10.1016/j.agwat.2022.108067. [CrossRef]
- Tamburini, G.; Bommarco, R.; Wanger, T.C.; Kremen, C.; van der Heijden, M.G.A.; Liebman, M.; Hallin, S. Agricultural diversification promotes multiple ecosystem services without compromising yield. Sci. Adv., 2020, 6, eaba1715. https://www.science.org/doi/10.1126/sciadv.aba1715.
- Himmelstein, J.; Ares, A.; Gallagher, D.; Myers, J. A meta-analysis of intercropping in Africa: impacts on crop yield, farmer income, and integrated pest management effects. Int. J. Agric. Sustain., 2016, 15, 1–10. https://doi.org/10.1080/14735903.2016.1242332. [CrossRef]
- Jones, S.K.; Sánchez, A.C.; Juventia, S.D.; Estrada-Carmona, N. A global database of diversified farming effects on biodiversity and yield. Sci. Data, 2021, 8, 1–6. https://doi.org/10.1038/s41597-021-01000-y. [CrossRef]
- Kamau, H.; Roman, S.; Biber-Freudenberger, L. Nearly half of the world is suitable for diversified farming for sustainable intensification. Commun. Earth Environ., 2023, 4, 446. https://doi.org/10.1038/s43247-023-01062-3. [CrossRef]
- Chopin, P.; Blazy, J.C.; Guindé, L.; Tournebize, R.; Doré, T. A novel approach for assessing the contribution of agricultural systems to the sustainable development of regions with multi-scale indicators: application to Guadeloupe. Land Use Policy, 2017, 62, 132-142. https://doi.org/10.1016/j.landusepol.2016.12.021. [CrossRef]
- Cheung, W.W.L.; Rondinini, C.; Avtar, R.; van den Belt, M.; Hickler, T.; Metzger, J.P.; Scharlemann, J.P.W.; Velez-Liendo, X.; Yue, T.X. Linking and harmonizing scenarios and models across scales and domains. In: IPBES: The methodological assessment report on scenarios and models of biodiversity and ecosystem services; Ferrier, S., Ninan, K.N., Leadley, P., Alkemade, R., Acosta, L.A., Akçakaya, H.R., Brotons, L., Cheung, W.W.L., Christensen, V., Harhash, K.A., Kabubo-Mariara, J., Lundquist, C., Obersteiner, M., Pereira, H.M., Peterson, G., Pichs-Madruga, R., Ravindranath, N., Rondinini, C., Wintle, B.A., Eds.; Secretariat of the Intergovernmental Science-Policy Platform for Biodiversity and Ecosystem Services, Bonn, Germany, 2016. Available online: URL https://files.ipbes.net/ipbes-web-prod-public-files/downloads/pdf/2016.methodological_assessment_report_scenarios_models.pdf (Accessed August 2025).
- Huang, H.; Yang, L.; Zhang, L.; Pu, Y.; Yang, C.; Wu, Q.; Cai, Y.; Shen, F.; Zhou, C. A review on digital mapping of soil carbon in cropland: progress, challenge, and prospect. Environ. Res. Lett., 2022, 17, 123004. https://doi.org/10.1088/1748-9326/aca41e. [CrossRef]
- McBratney, A.; de Gruijter, J.; Bryce, A. Pedometrics timeline. Geoderma, 2019, 338, 568–575. https://doi.org/10.1016/j.geoderma.2018.11.048. [CrossRef]
- Burrough, P.A. Principles of geographical information systems for land resources assessment. Clarendon Press, Oxford, 1986.
- Watson, D.F. Contouring: a guide to the analysis and display of spatial data. Pergamon Press, Oxford, 1992.
- Smith, J.; Gottschalk, P.; Bellarby, J.; Richards, M.; Nayak, D.; Coleman, K.; Hillier, J.; Flynn, H.; Wattenbach, M.; Aitkenhead, M.; Yeluripurti, J.; Farmer, J.; Smith, P. Model to Estimate Carbon in Organic Soils – Sequestration and Emissions (ECOSSE). User-Manual, 2010. Available online: URL https://www.abdn.ac.uk/staffpages/uploads/soi450/ECOSSE%20User%20manual%20310810.pdf (Accessed September 2025).
- Begum, K.; Zornoza, R.; Farina, R.; Lemola, R.; Alvaro-Fuentes, J.; Cerasuolo, M. Modeling soil carbon under diverse cropping systems and farming management in contrasting climatic regions in Europe. Front. environ. sci., 2022, 10, 819162, doi: 10.3389/fenvs.2022.819162. [CrossRef]
- Duveiller, G.; Donatelli, M.; Fumagalli, D.; Zucchini, A.; Nelson, R.; Baruth, B. A dataset of future daily weather data for crop modelling over Europe derived from climate change scenarios. Theor Appl Climatol, 2017, 127, 573–585. https://doi.org/10.1007/s00704-015-1650-4. [CrossRef]
- Heuvelink, G.B.M.; Webster, R. Modelling soil variation: past, present and future. Geoderma, 2001, 100, 269-301. https://doi.org/10.1016/S0016-7061(01)00025-8. [CrossRef]
- Olaya, V. Basic Land-Surface Parameters. In: Geomorphometry: Concepts, Software, Applications. Developments in Soil Science, Hengl, T., Reuter, H.I., Eds.; Elsevier, 2006;. Volume 33, pp. 141-169.
- Wilson, J.P., Gallant, J.C., Eds. Terrain analysis - principles and applications. John Wiley & Sons, Inc., New York, 2000.
- Anders, N.S.; Seijmonsbergen, A.C.; Bouten, W. Multi-Scale and Object-Oriented Image Analysis of High-Res LiDAR Data for Geomorphological Mapping in Alpine Mountains. In: Proceedings of Geomorphometry, Zurich, Switzerland, 31 August-2 September 2009, 61-65.
- Prima, O.D.A.; Echigo, A.; Yokoyama, R.; Yoshida, T. Supervised landform classification of Northeast Honshu from DEM-derived thematic maps. Geomorphology, 2006, 78(3–4), 373-386. https://doi.org/10.1016/j.geomorph.2006.02.005. [CrossRef]
- Yokoyama, R;, Shirasawa, M.; Pike, R.J. Visualizing topography by openness: A new application of image processing to digital elevation models. Photogramm. Eng. Remote Sens., 2002, 68(3), 257-265.
- Boehner, J.; Koethe, R.; Conrad, O.; Gross, J.; Ringeler, A.; Selige, T. Soil Regionalisation by Means of Terrain Analysis and Process Parameterisation. In: Soil Classification 2001, Micheli, E., Nachtergaele, F., Montanarella, L., Eds.; European Soil Bureau, Research Report No. 7, EUR 20398 EN, Luxembourg, 2002, pp.213-222.
- Boehner, J.; Selige, T. Spatial prediction of soil attributes using terrain analysis and climate regionalisation. In: SAGA - Analysis and Modelling Applications, Boehner, J., McCloy, K.R., Strobl, J., Eds., Goettinger Geographische Abhandlungen, Goettingen, 2006., 115, 13-28.
- Gallant, J.C.; Dowling, T.I. A multiresolution index of valley bottom flatness for mapping depositional areas. Water Resour. Res., 2003, 39(12), 1347-1359, doi: 10.1029/2002WR001426. [CrossRef]
- Hansen, M.C.; Potapov, P.V.; Moore, R.; Hancher, M.; Turubanova, S.A.; Tyukavina, A.; Thau, D.; Stehman, S.V.; Goetz, S.J.; Loveland, T.R.; Kommareddy, A.; Egorov, A.; Chini, L.; Justice, C.O.; Townshend, J.R.G. High-Resolution Global Maps of 21st-Century Forest Cover Change. Science, 2013, 342, 850–53, doi: 10.1126/science.1244693. [CrossRef]
- Ewert, F.; van Ittersum, M.K.; Heckelei, T.; Therond, O.; Bezlepkina, I.; Andersen, E. Scale changes and model linking methods for integrated assessment of agri-environmental systems. Agr Ecosyst Environ, 2011, 142, 6-17. https://doi.org/10.1016/j.agee.2011.05.016. [CrossRef]
- Hengl, T.; Mendes de Jesus, J.; Heuvelink, G.B.M.; Ruiperez Gonzalez, M.; Kilibarda, M.; Blagotić, A.; Shangguan, W.; Wright, M.N.; Geng, X.; Bauer-Marschallinger, B.; Guevara, M.A.; Vargas, R.; MacMillan, R.A.; Batjes, N.H.; Leenaars, J.G.B.; Ribeiro, E.; Wheeler, I.; Mantel, S.; Kempen, B. SoilGrids250m: Global gridded soil information based on machine learning. PLoS ONE, 2017, 12(2), e0169748. https://doi.org/10.1371/journal.pone.0169748. [CrossRef]
- Nicholls, C.I.; Altieri, M.A.; Vazquez, L. Agroecology: Principles for the Conversion and Redesign of Farming Systems. J. Ecosys. Ecograph., 2016, S5, 010. doi:10.4172/2157-7625.S5-010. [CrossRef]
- Poeplau, C.; Don, A. Carbon sequestration in agricultural soils via cultivation of cover crops-A meta-analysis. Agr Ecosyst Environ, 2015, 200, 33–41. https://doi.org/10.1016/j.agee.2014. 10.024. [CrossRef]
- Locatelli, J.L.; Del Grosso, S.; Silva Santos, R.; Hong, M.; Gurung, R.; Stewart, C.E.; Cherubin, M.R.; Bayer, C.; Cerri, C.E.P. Modeling soil organic matter changes under crop diversification strategies and climate change scenarios in the Brazilian Cerrado. Agric. Ecosyst. Environ., 2025, 379, 109334. https://doi.org/10.1016/j.agee.2024.109334. [CrossRef]
- Yan, Z.; Xu, Y.; Chu, J.; Guillaume, T.; Bragazza, L.; Li, H.; Shen, Y.; Yang, Y.; Zeng, Z.; Zang, H. Long-term diversified cropping promotes wheat yield and sustainability across contrasting climates: Evidence from China and Switzerland. Field Crops Res., 2025, 322, 109764. https://doi.org/10.1016/j.fcr.2025.109764. [CrossRef]
Figure 1.
Scheme of the multi-scale spatial analysis.
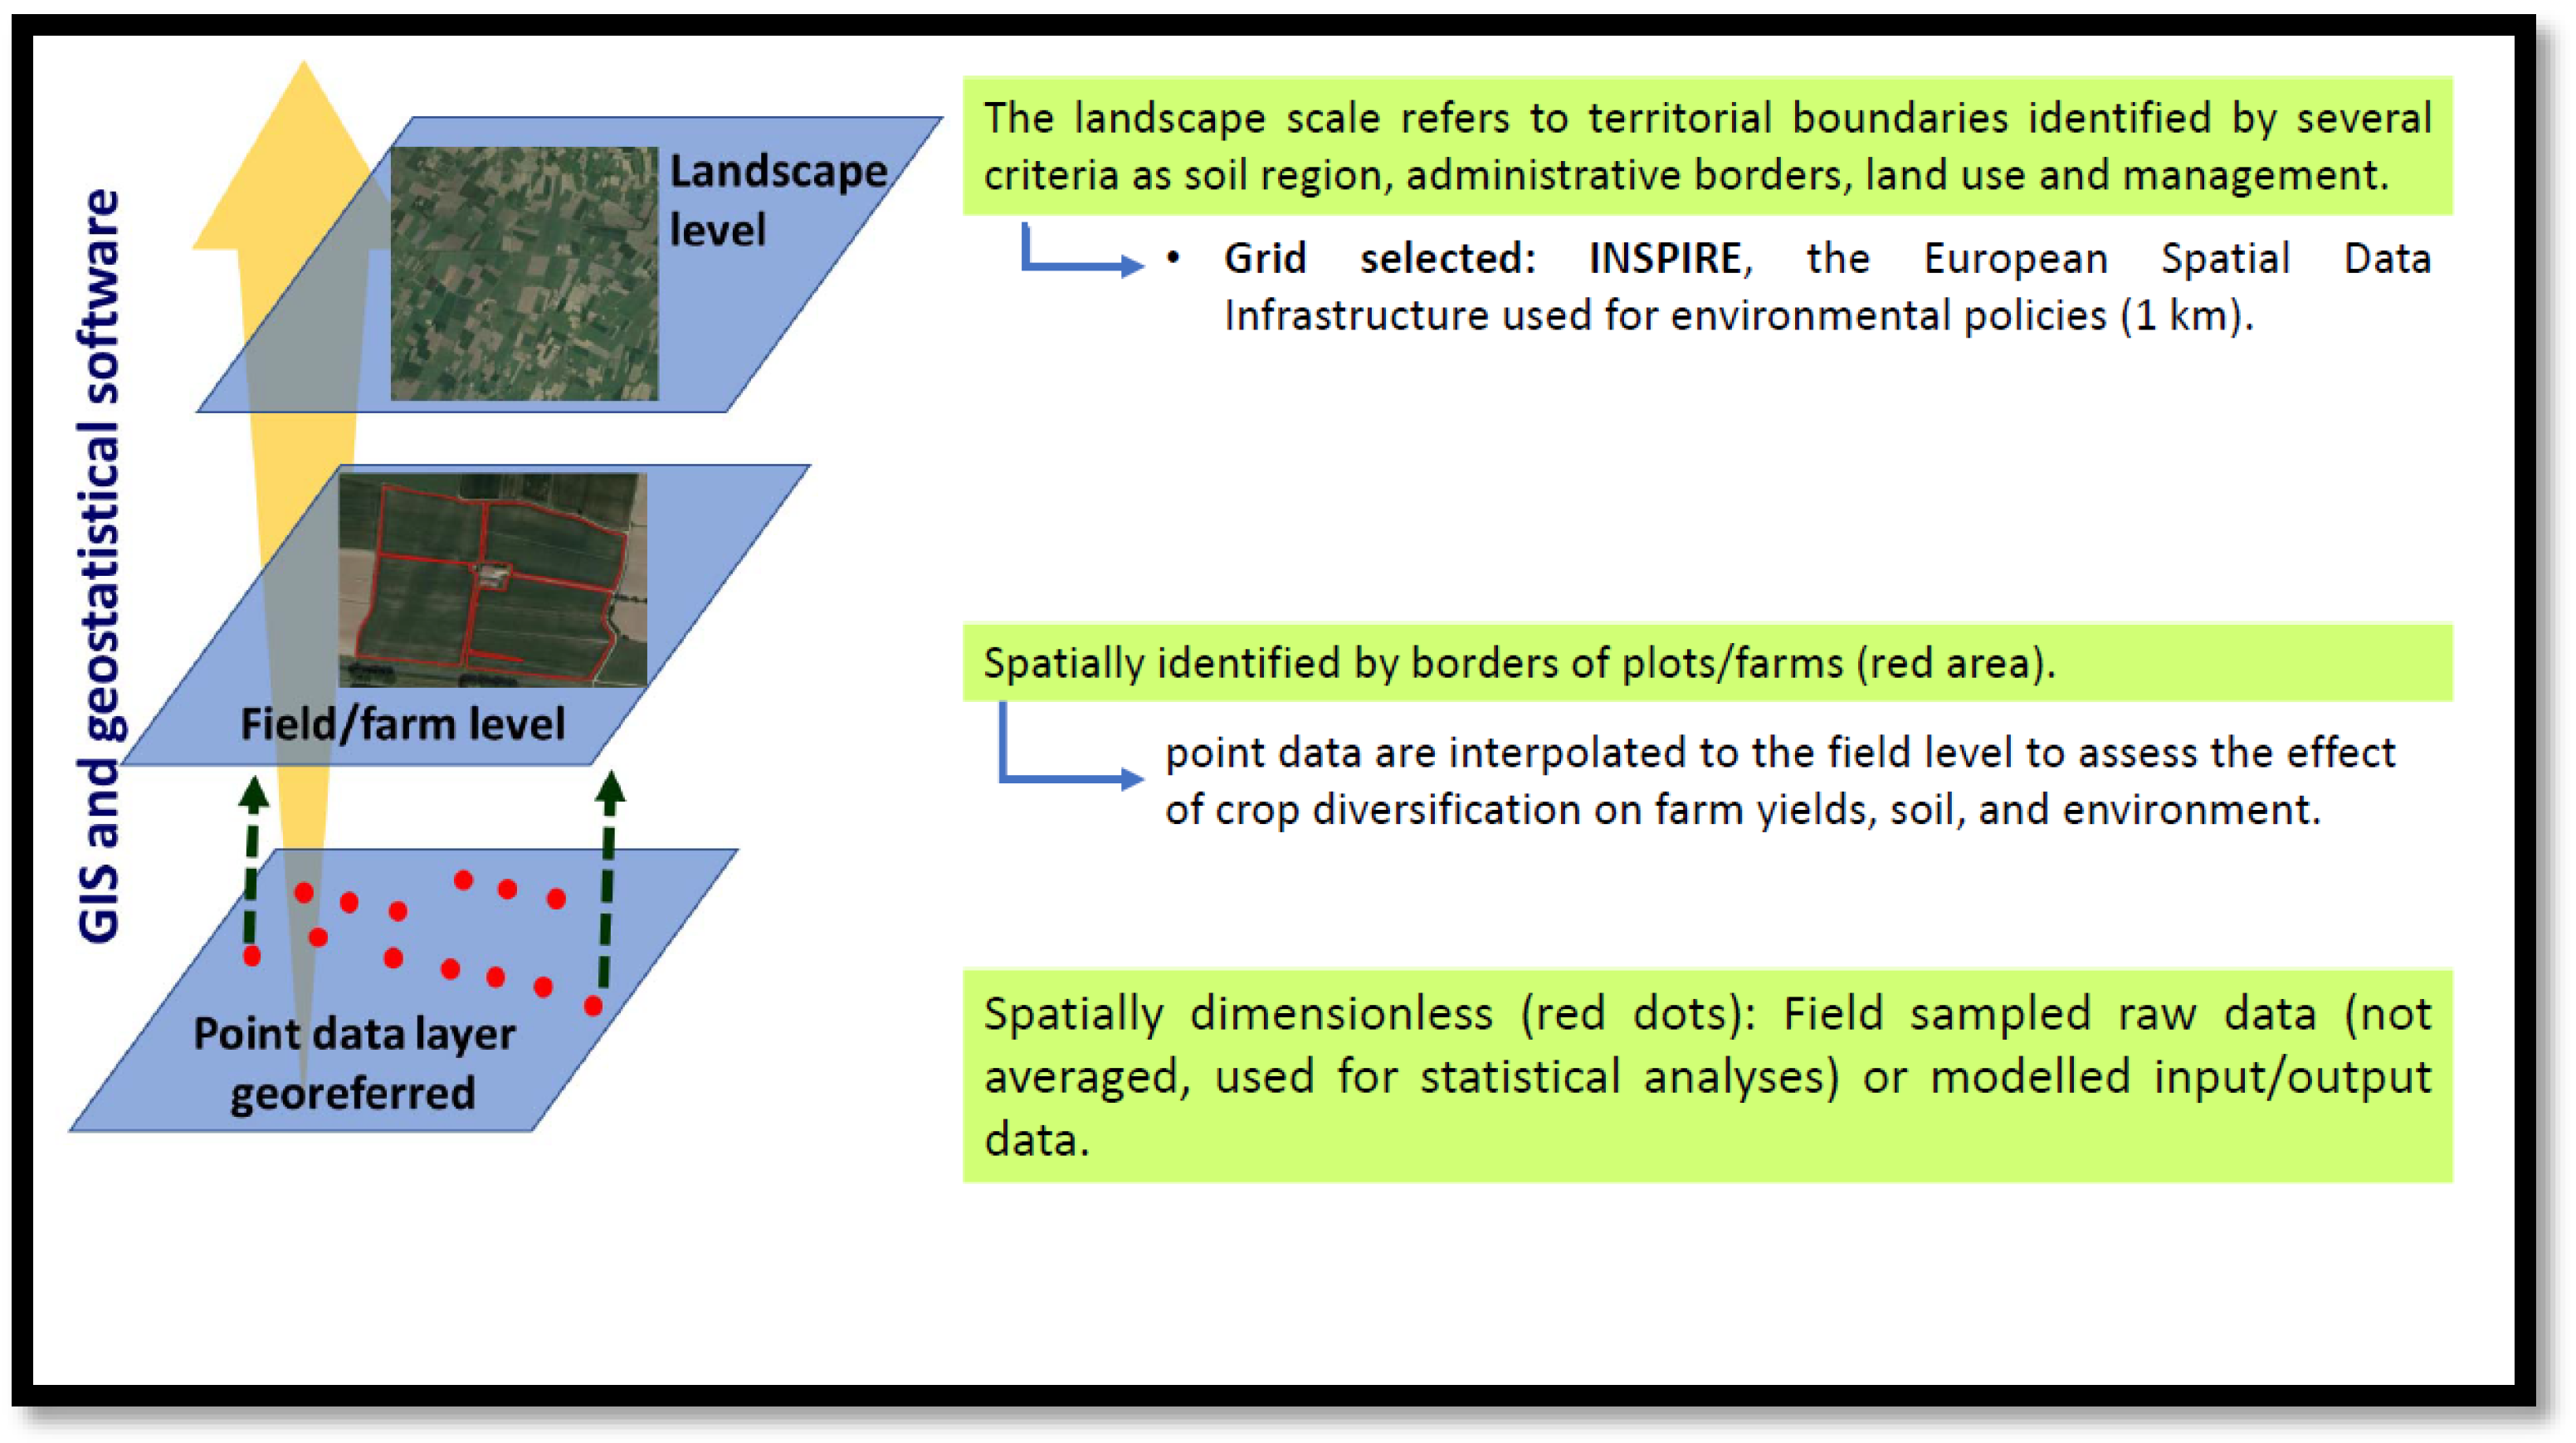
Figure 2.
Map of the measured Total Organic Carbon content in the 0-30 cm layer at the beginning of the experiment, spatialized by Inverse Distance Weighting.
Figure 2.
Map of the measured Total Organic Carbon content in the 0-30 cm layer at the beginning of the experiment, spatialized by Inverse Distance Weighting.
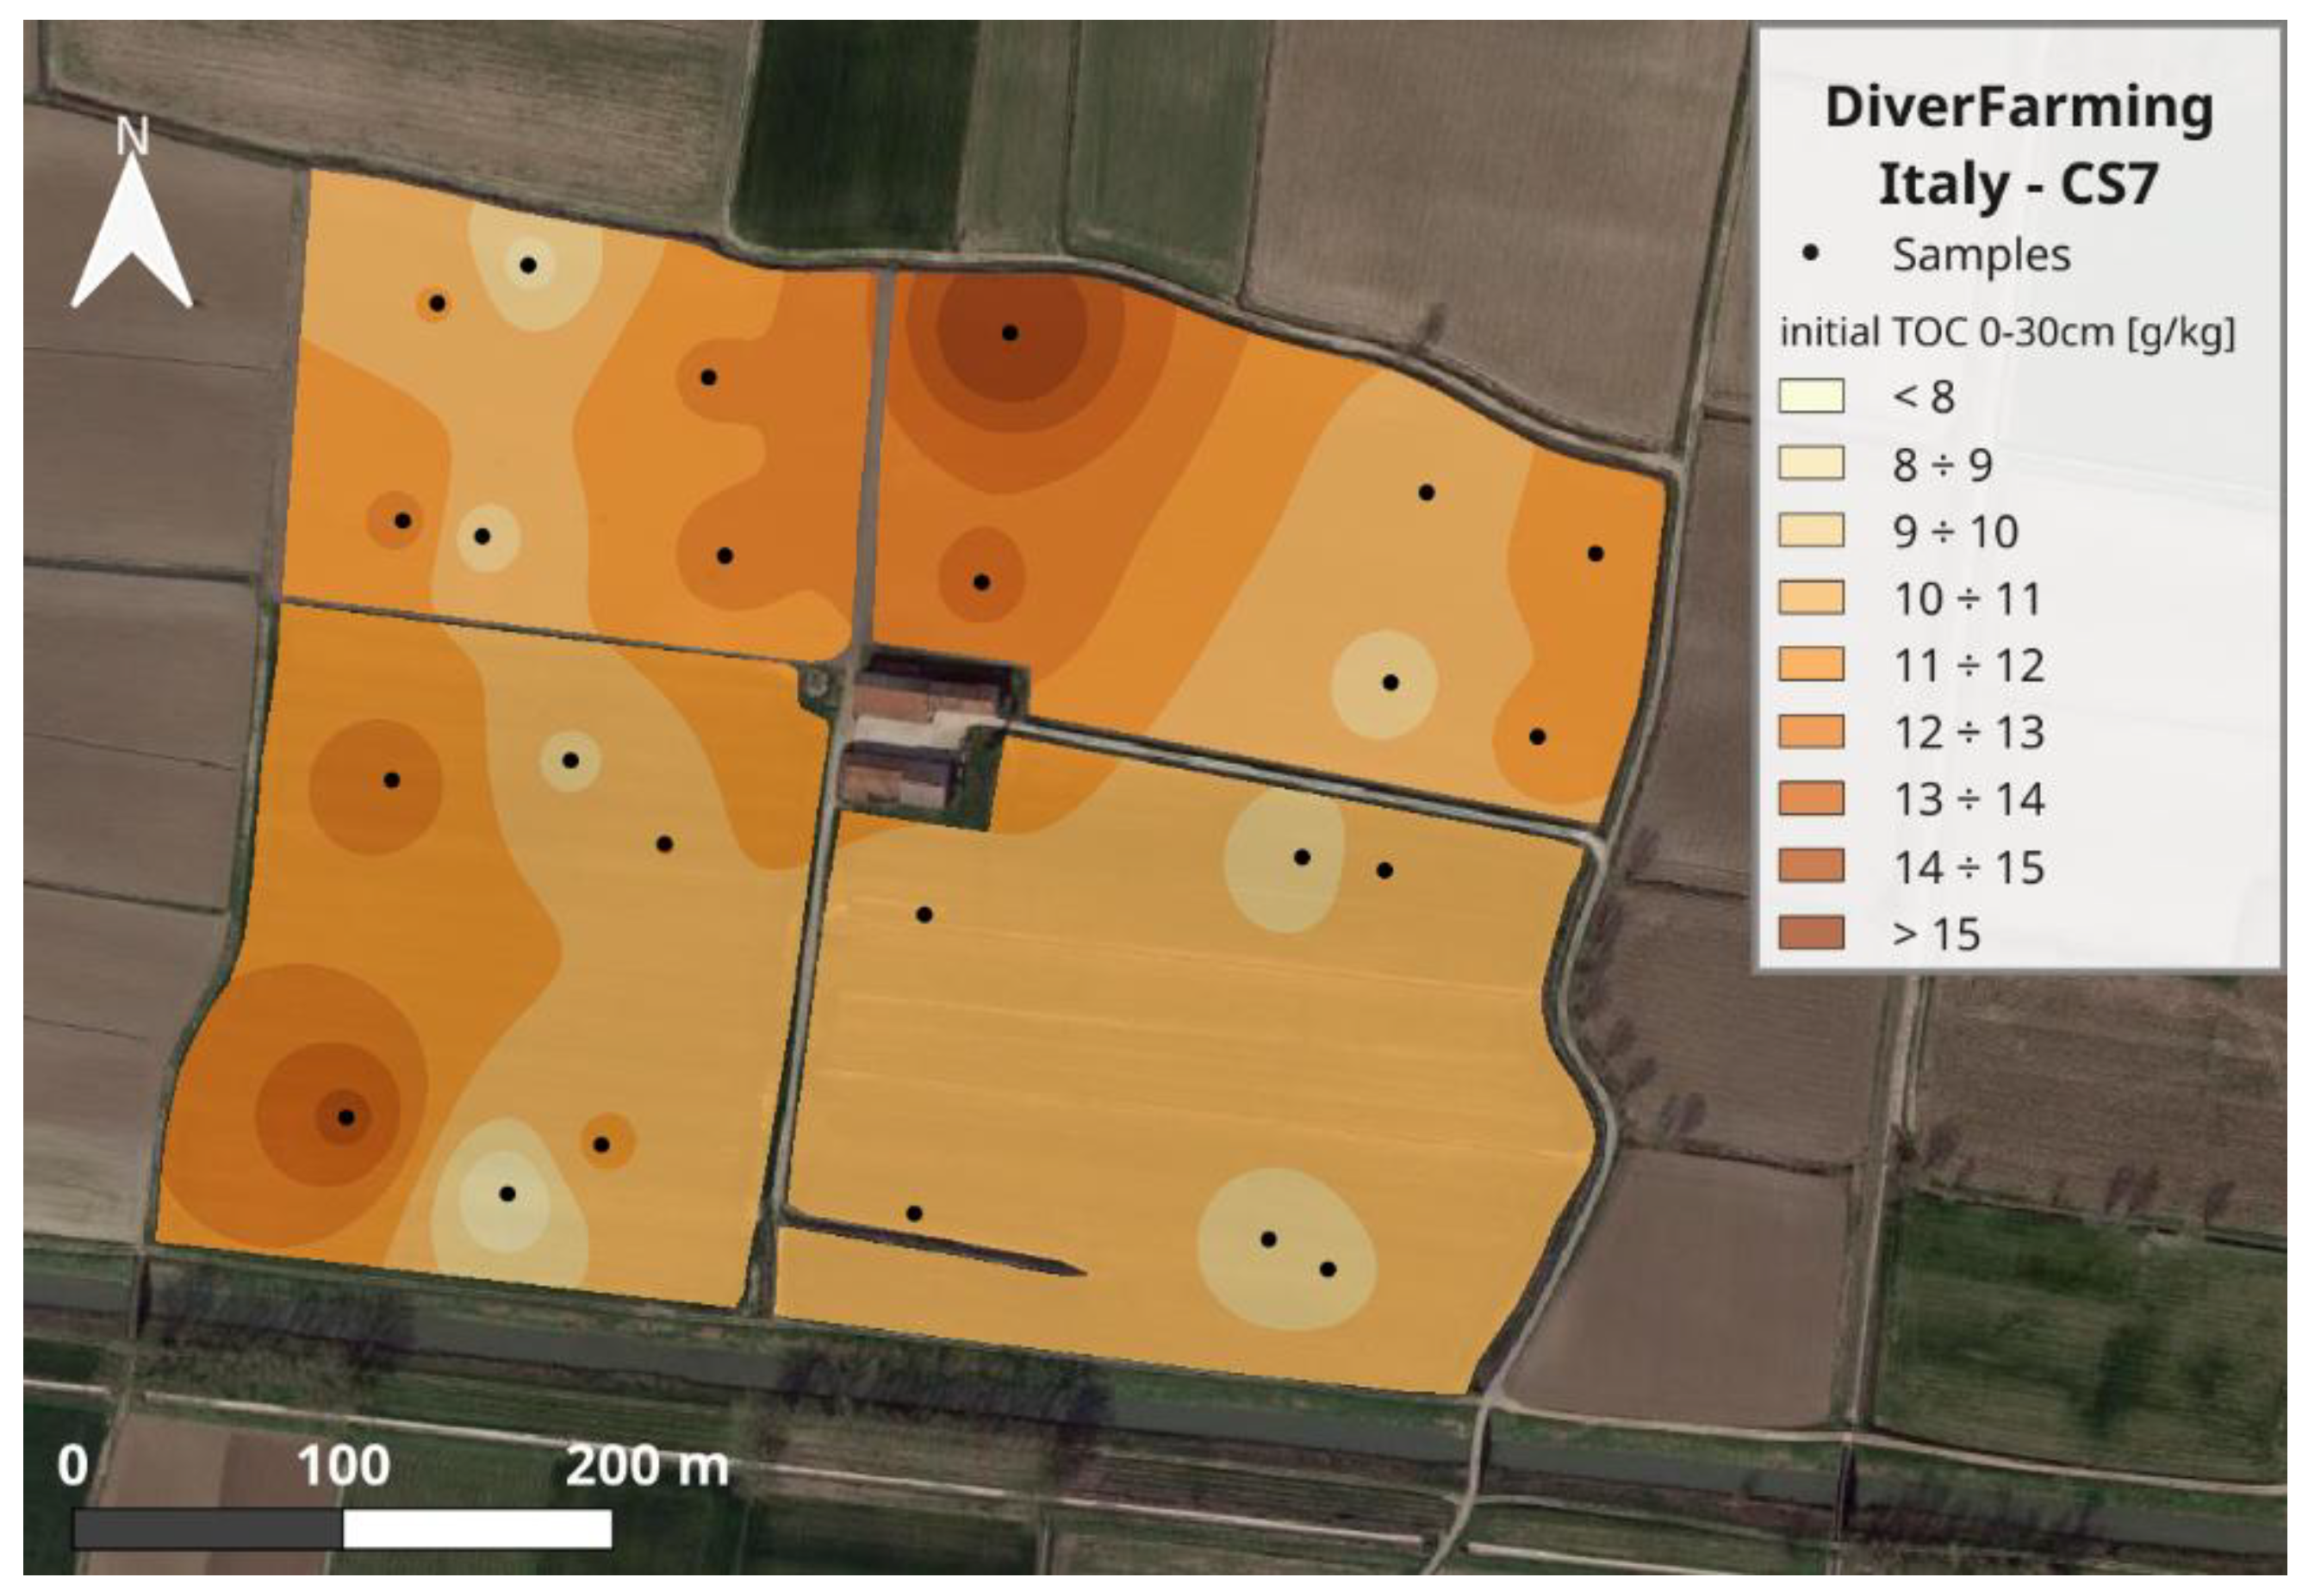
Figure 3.
Maps of the modelled Total Organic Carbon variation in the 0-30 cm layer after 30 years of: a) conventional management; b) crop diversification. Spatialization is performed by Inverse Distance Weighting.
Figure 3.
Maps of the modelled Total Organic Carbon variation in the 0-30 cm layer after 30 years of: a) conventional management; b) crop diversification. Spatialization is performed by Inverse Distance Weighting.
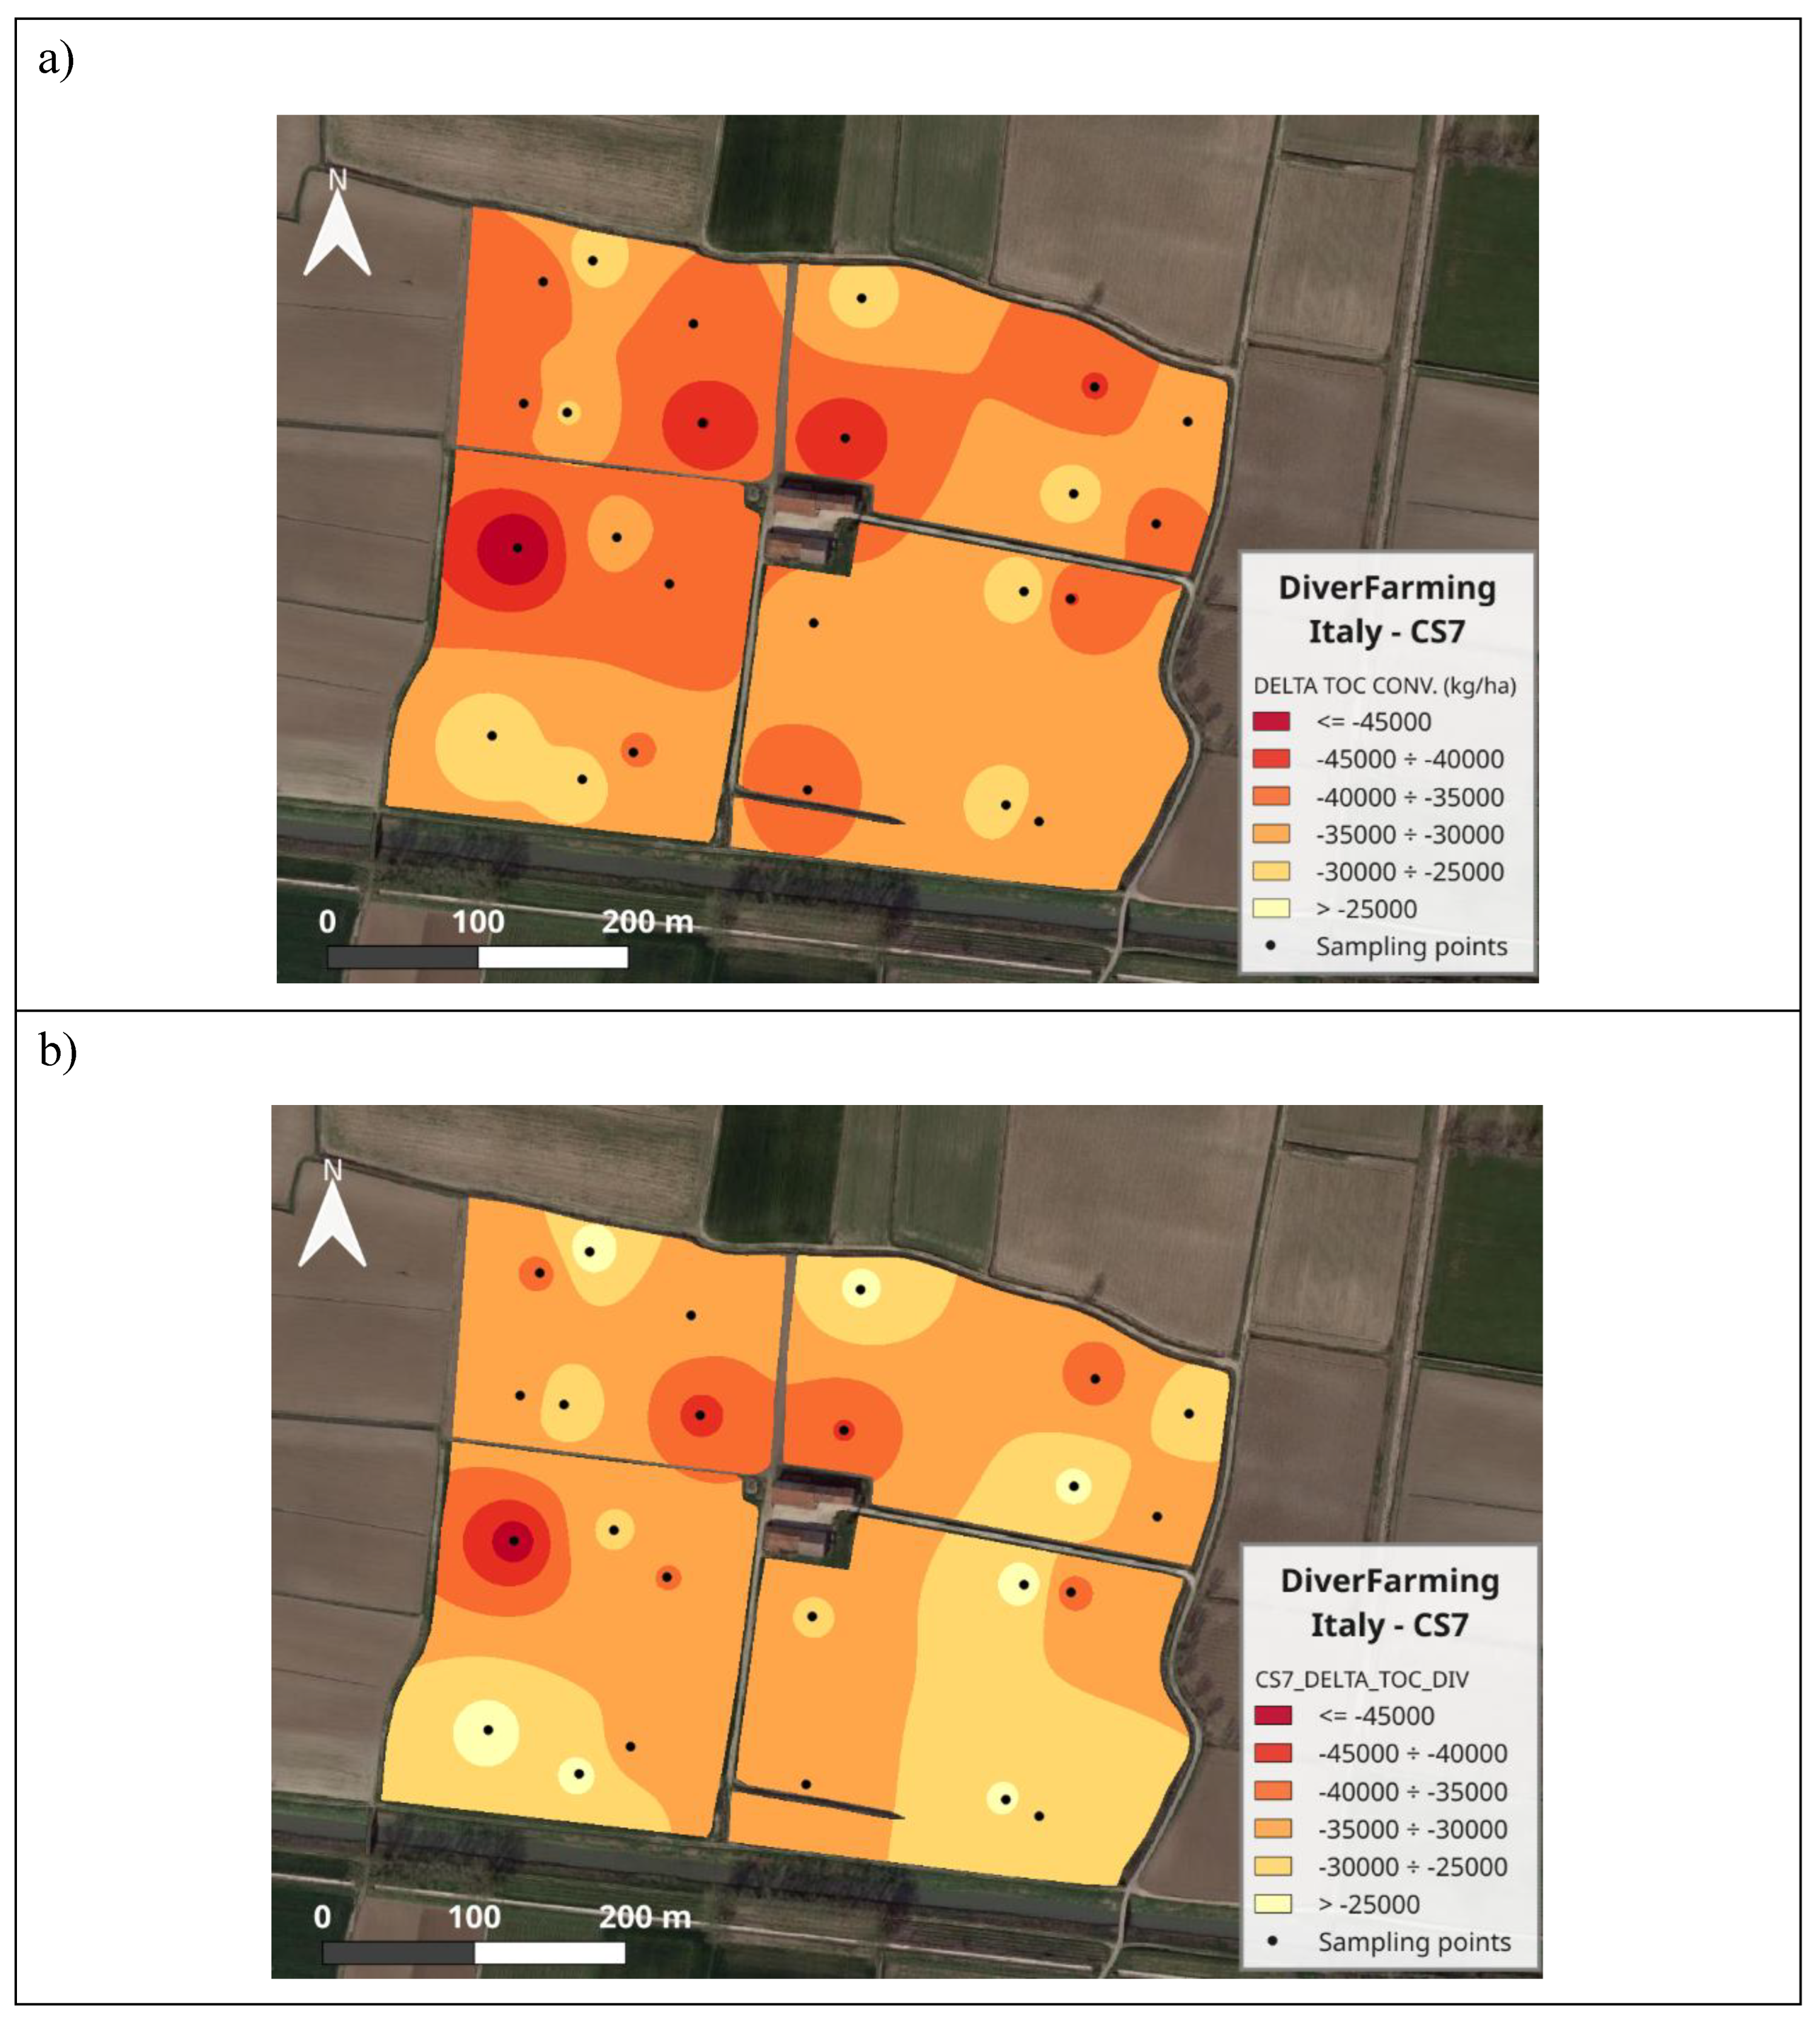
Figure 4.
Maps of the simulated Total Organic Carbon content in the 0-30 cm layer at landscape scale after 30 years of: a) conventional management; b) crop diversification.
Figure 4.
Maps of the simulated Total Organic Carbon content in the 0-30 cm layer at landscape scale after 30 years of: a) conventional management; b) crop diversification.
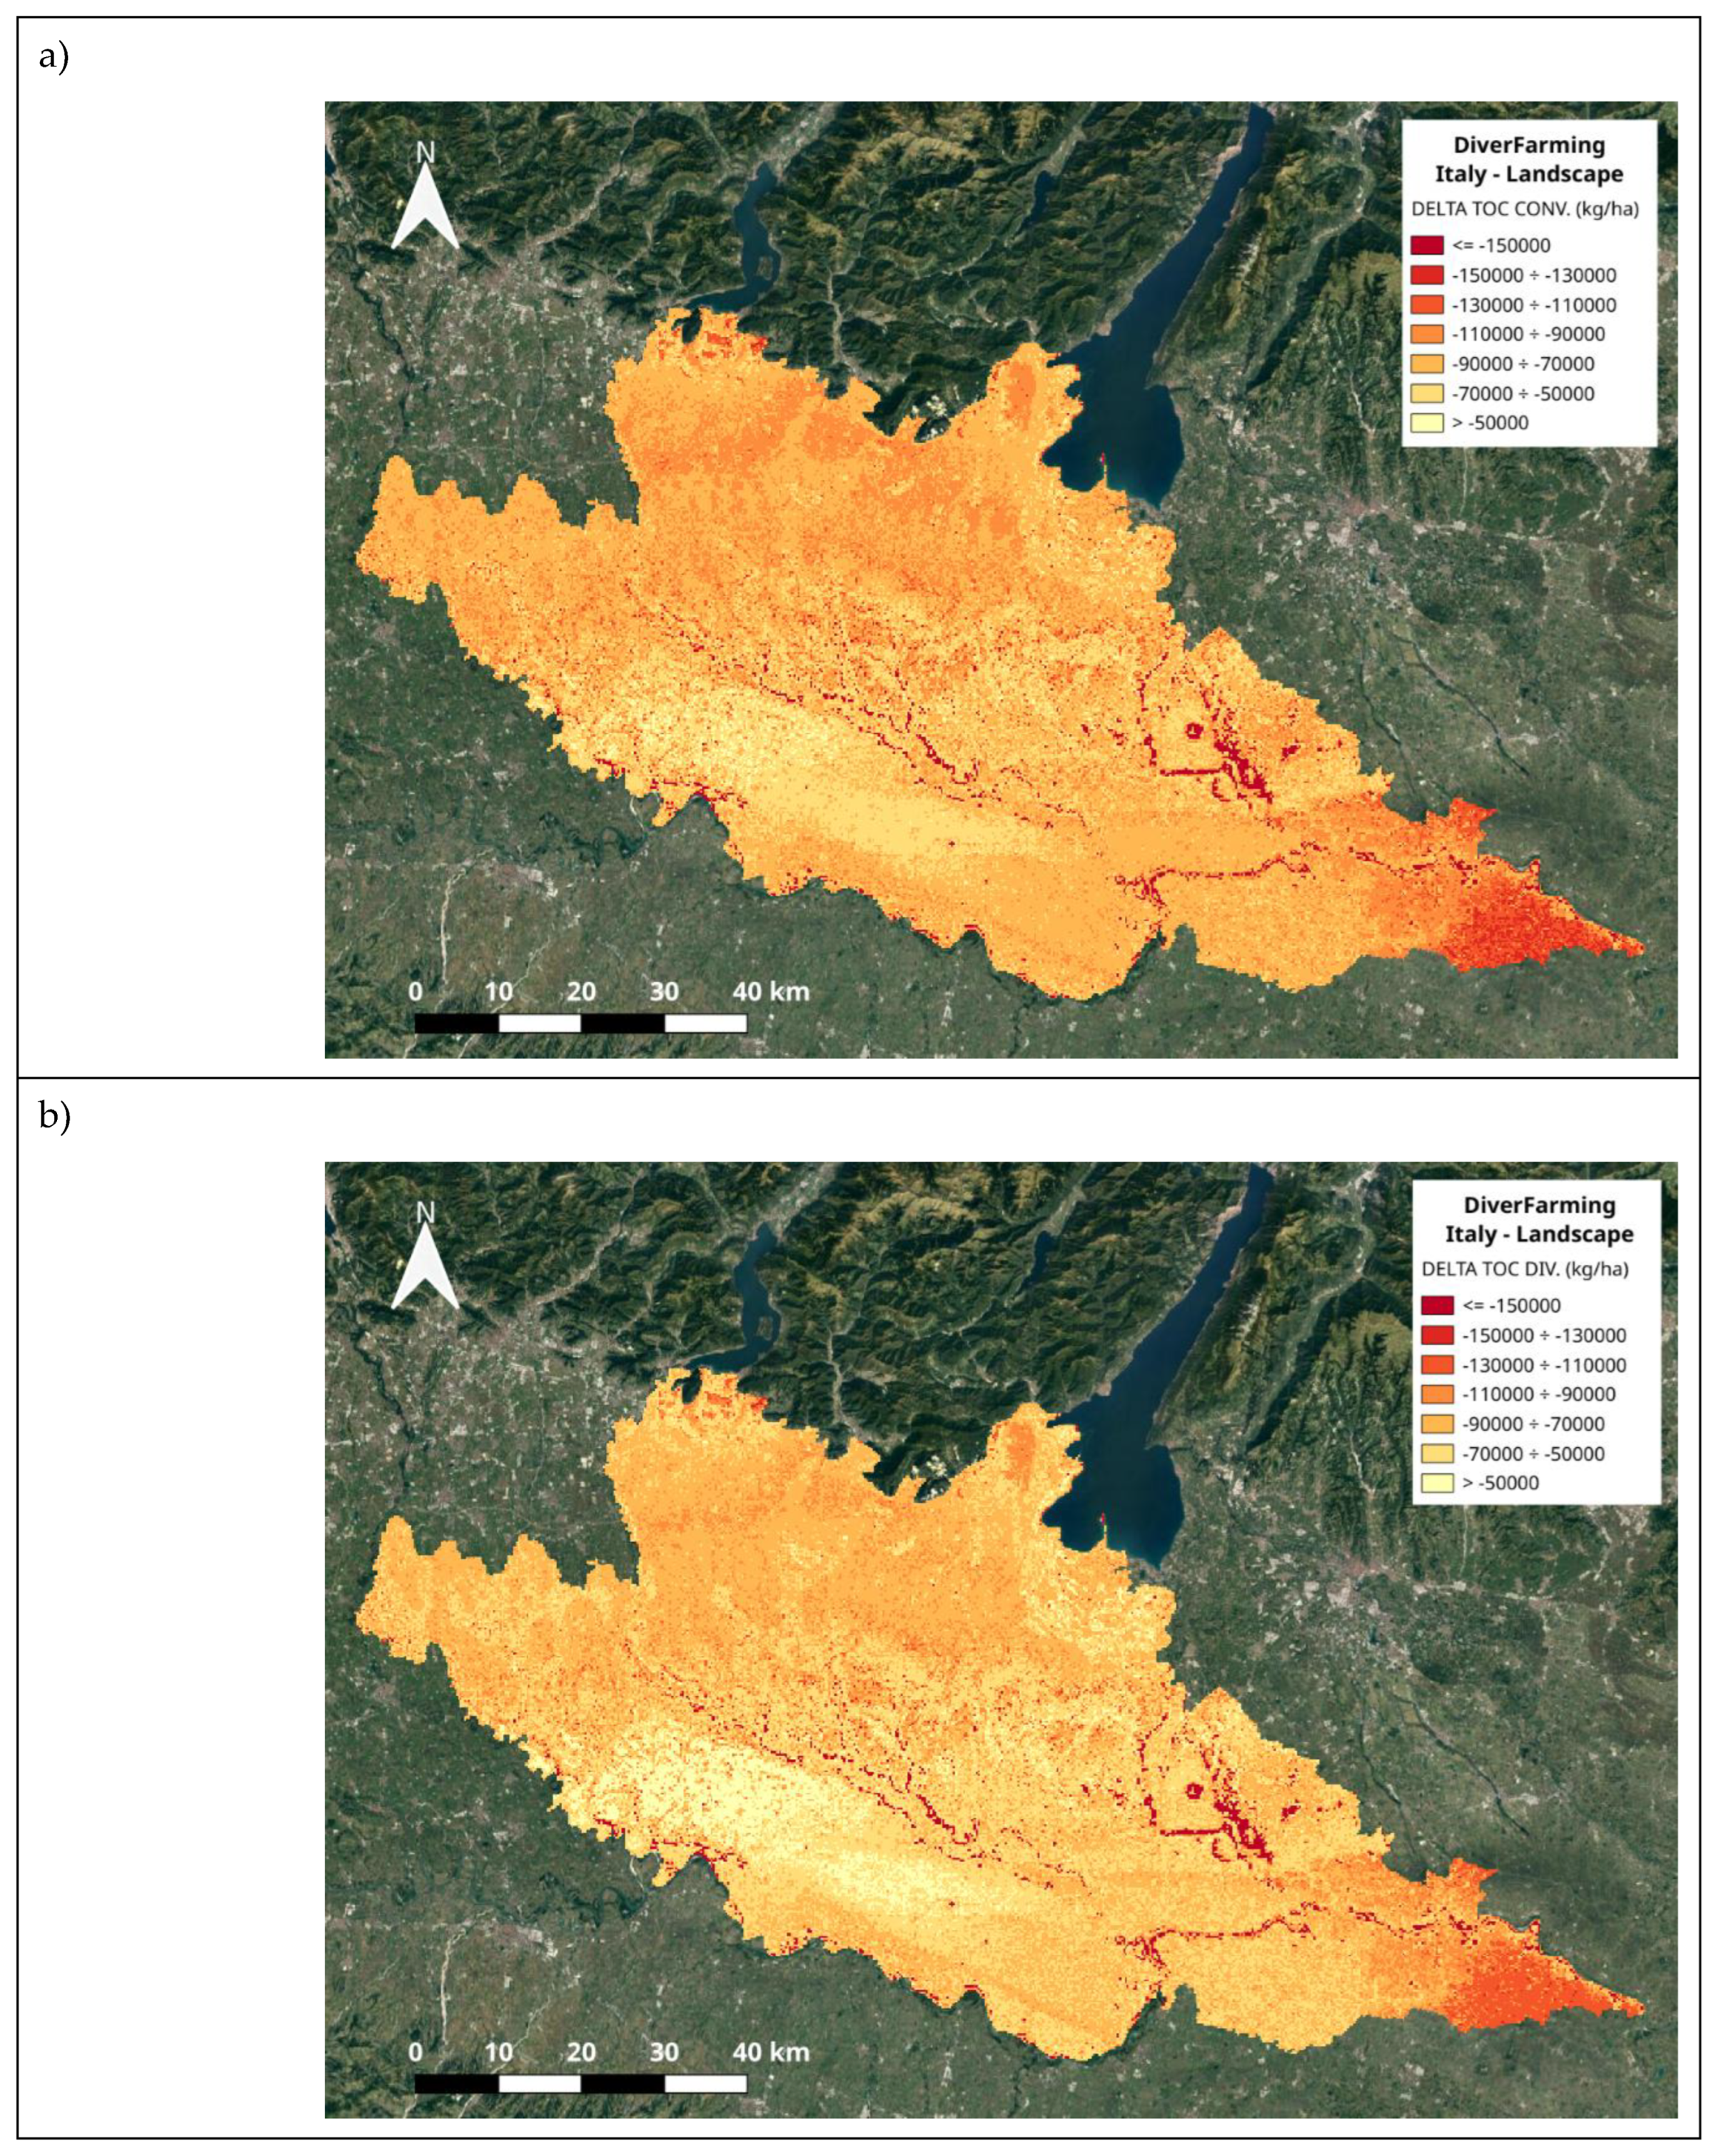
Figure 5.
Maps of the standard estimation error of modelled Total Organic Carbon content in the 0-30 cm layer at landscape scale after 30 years of: a) conventional management; b) crop diversification.
Figure 5.
Maps of the standard estimation error of modelled Total Organic Carbon content in the 0-30 cm layer at landscape scale after 30 years of: a) conventional management; b) crop diversification.
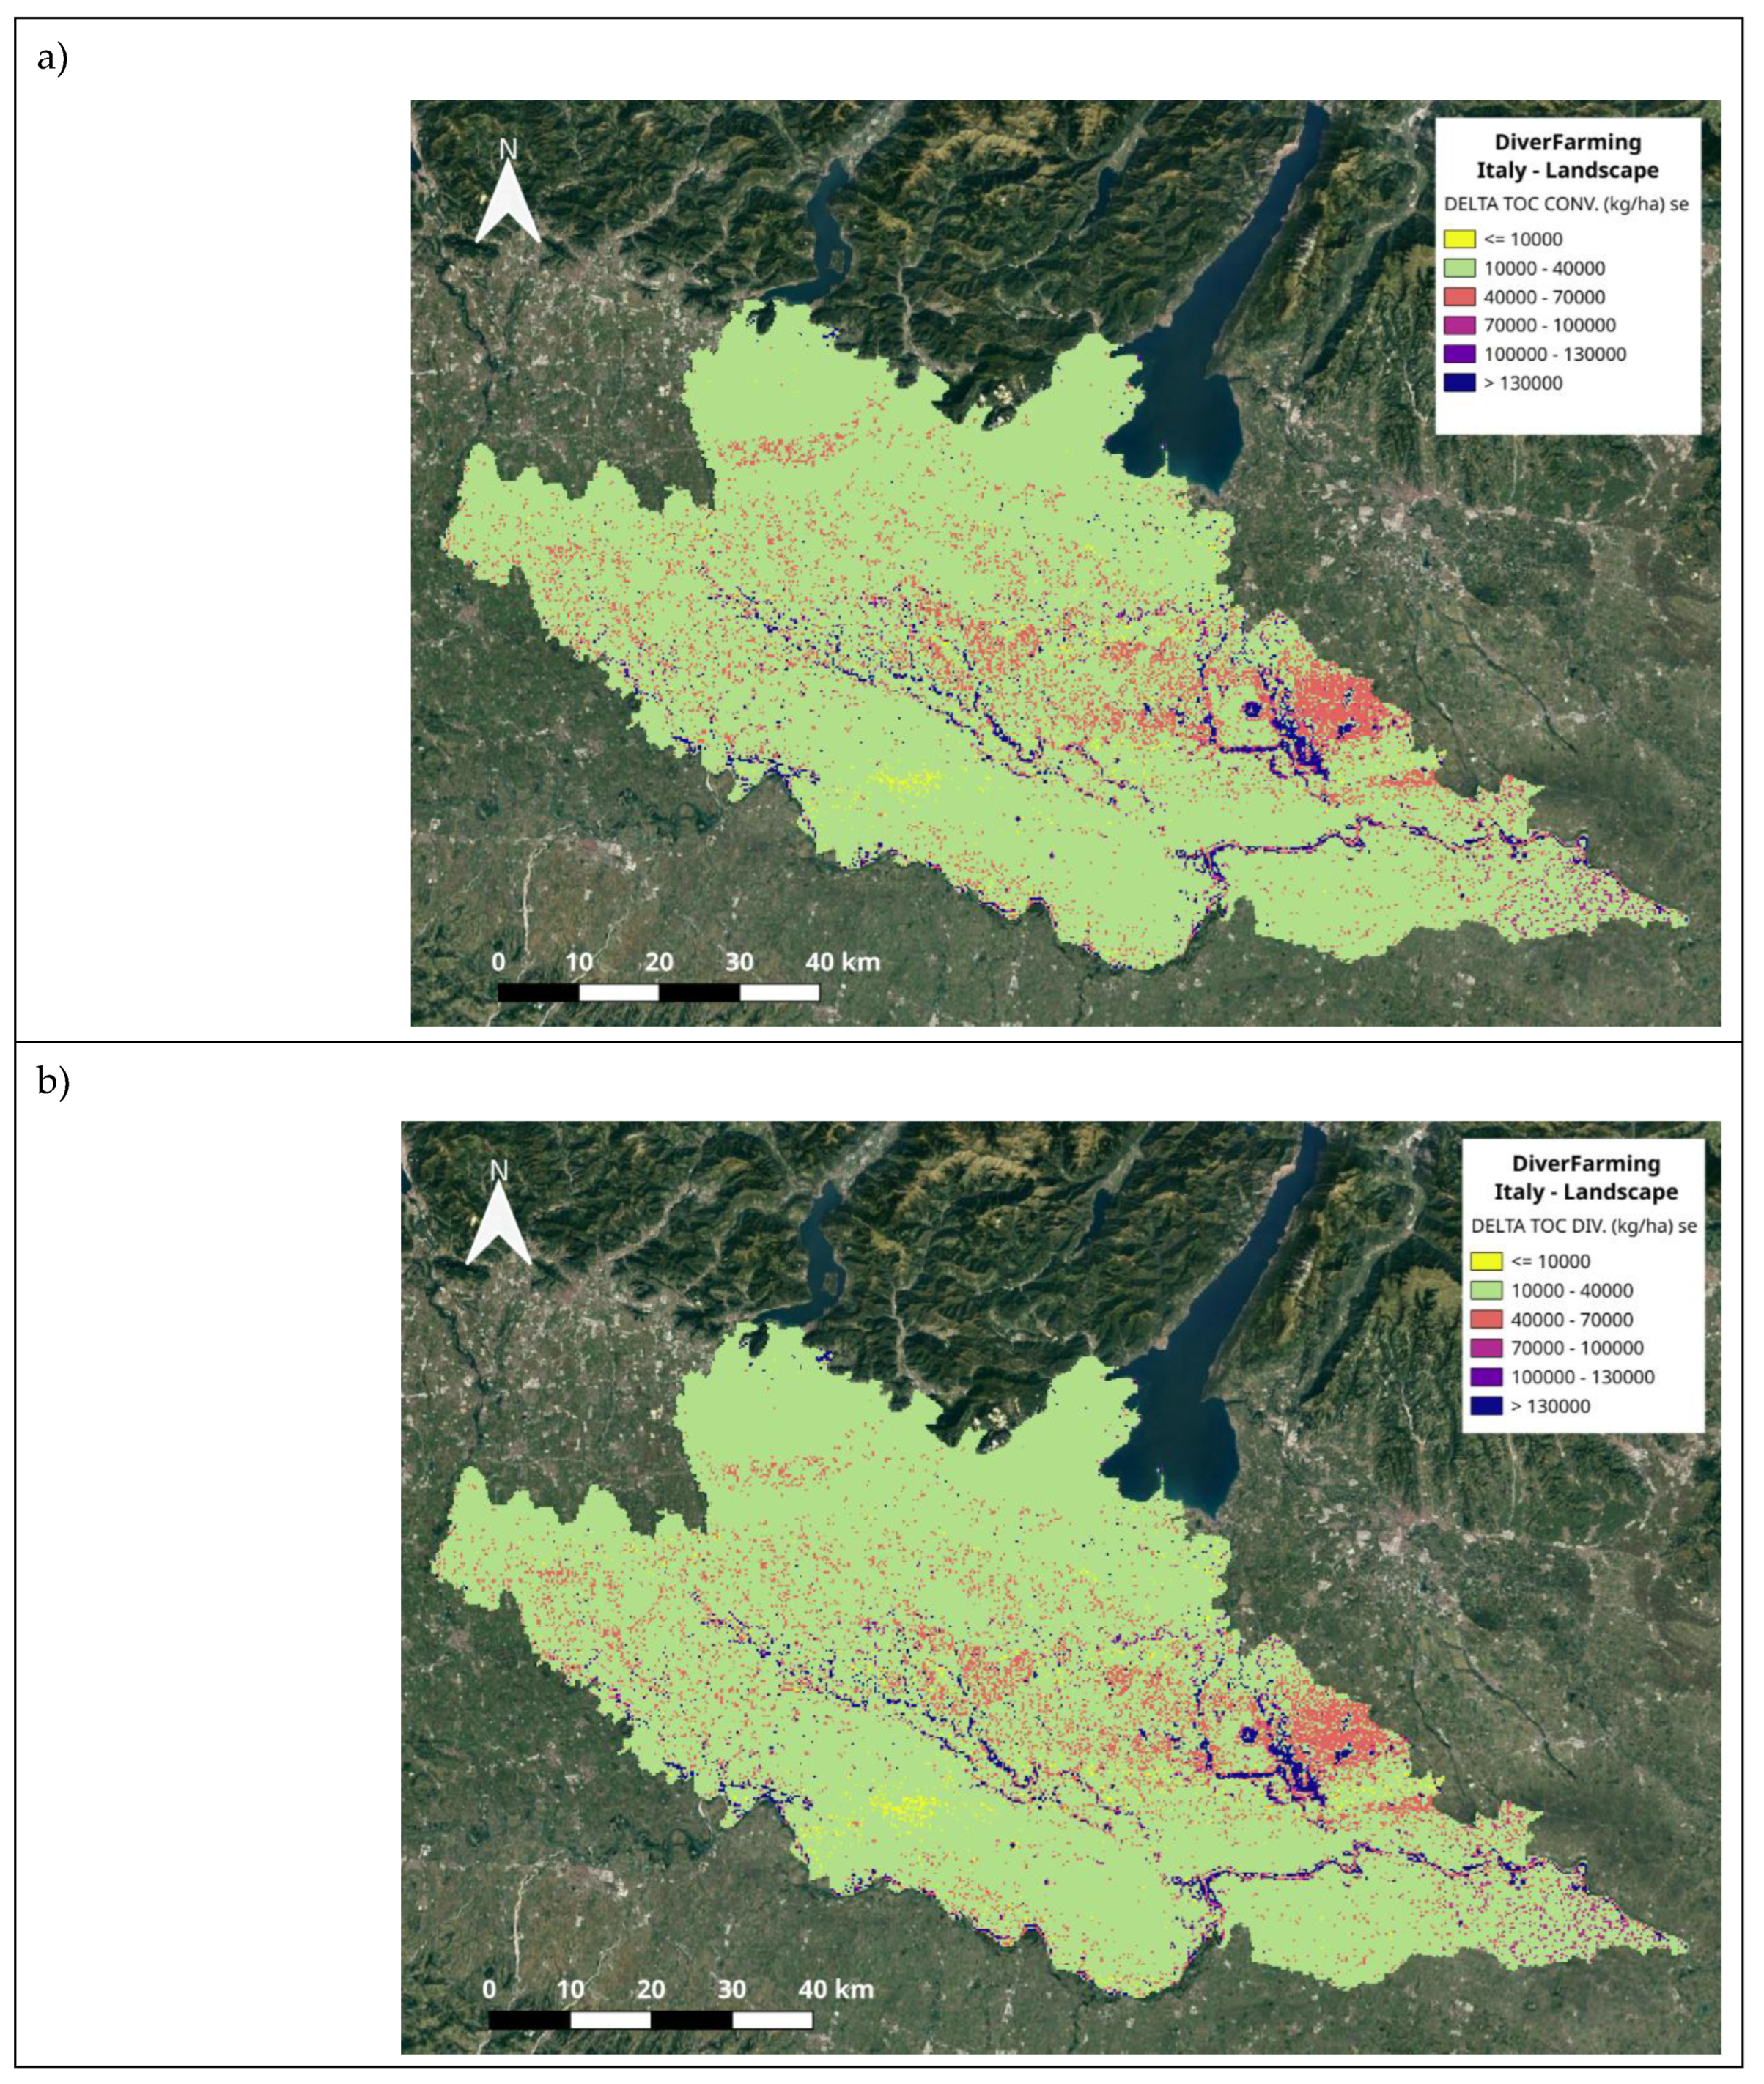

Table 1.
Covariates used for Machine Learning application.
| Predictor | Description | Reference |
|---|---|---|
| DEM |
Digital elevation model, 25 m |
https://land.copernicus.eu/user-corner/publications/eu-dem-flyer/at_download/file |
| CPROF |
Profile curvature |
[36] |
| DEVMEAN | Deviation from the mean value – Relations of each grid cell to its neighbourhood |
[37] |
| OPENN, OPENP | Topographic openness, indicates the degree of dominance (positive) or enclosure (negative) at a specific site, and is linked to the extent of the visible landscape from a given point | [38,39,40] |
| SLOPE |
Slope |
[36] |
| TWI | The ‘SAGA Wetness Index’ is similar to the ‘Topographic Wetness Index’, but it relies on a modified catchment area computation that does not treat flow as a thin film. For cells located on valley floors with minimal vertical distance to a channel, it predicts higher and more realistic potential soil moisture than the conventional TWI calculation |
[41,42] |
| VBF | Combination of a ‘multiresolution index of valley bottom flatness’ (MRVBF) and the complementary ‘multiresolution index of the ridge top flatness’ (MRRTF) |
[43] |
| VDEPTH | Valley depth, determined as the difference between the elevation and an interpolated ridge level | [36] |
| NIR | Landsat8 OLI band 4, 30 m | [44] |
| RED | Landsat8 OLI band 3, 30 m | [44] |
| SW1 | Landsat8 OLI band 5, 30 m | [44] |
| SW2 | Landsat8 OLI band 7, 30 m | [44] |
| TREECOVER |
Tree cover in 2000, defined as the canopy closure of all vegetation exceeding 5 meters in height, 30 m |
[44] |
| BARESOIL | Global bare ground cover obtained from annual seamless composites of Landsat 7 ETM+ per band, using the median reflectance of all cloud- and shadow-free observations during the growing season, 30 m | [44] |
Disclaimer/Publisher’s Note: The statements, opinions and data contained in all publications are solely those of the individual author(s) and contributor(s) and not of MDPI and/or the editor(s). MDPI and/or the editor(s) disclaim responsibility for any injury to people or property resulting from any ideas, methods, instructions or products referred to in the content. |
© 2025 by the authors. Licensee MDPI, Basel, Switzerland. This article is an open access article distributed under the terms and conditions of the Creative Commons Attribution (CC BY) license (http://creativecommons.org/licenses/by/4.0/).
Copyright: This open access article is published under a Creative Commons CC BY 4.0 license, which permit the free download, distribution, and reuse, provided that the author and preprint are cited in any reuse.


