
Submitted:
12 August 2025
Posted:
13 August 2025
You are already at the latest version
Abstract
Soil organic carbon (SOC) stocks is one of the most important indicators of soil health and C sequestration. Understanding how conservation practices affect the SOC stocks in the agricultural soils is important for soil carbon sequestration and climate change mitigation. However, limited studies have been conducted to investigate the SOC dynamics under different conservation practices and their interactions with climatic variables, as well as the relative importance of each explainable factor. In this study, we evaluated the response of SOC stocks to different conservation measures (e.g., no-tillage, reduced tillage, deep tillage, and straw return) based on collected field data (871 observations) with a meta-analysis method. Additionally, we further investigated how SOC dynamics are affected by the conservation practices with various climatic variables and soil properties (e.g., soil pH, bulk density, depth, initial SOC, and texture) and duration period. The results show that the change rate of the SOC stock in the Mollisol region of Northeast China significantly increased from 1980 to 2022, with an average annual increase rate of 0.16-14.17%. The SOC stock change was significantly affected by the conservation practices. Moreover, the changes in SOC stock due to conservation practices were found to be greatly affected by various climatic variables, soil properties, and duration period. In addition, the initial SOC stock was identified as the most important factor for SOC stock, with the relative importance values of 33.4%, 29.4%, 29.0%, and 34.1%, respectively. Our findings provide some recommendations for enhancing SOC sequestration in agricultural regions by implementing conservation practices.
Keywords:
SOC stocks
; conservation practices
; meta-analysis
; random forest
; Mollisol region
1. Introduction
Agricultural soil is one of the most active carbon pools in the global terrestrial ecosystem, and it has short carbon sequestration period and large carbon storage [1]. As an important factor of soil health and C sequestration, soil organic carbon (SOC) storage is getting increasingly attention due to its potential in removing greenhouse gases from the atmosphere [2]. As growing studies demonstrated, farm management practices play an important role in mitigating the threat of climate change and ensuring food security by sequestering carbon [3,4]. Additionally, it has been identified that grain production could be increased by 30% through improving soil management practices and fertilizer applications based on the global yield gap analysis results [5]. Therefore, in order to obtain the effective and sustainable conservation practices for successful SOC sequestration in the farmland, it is essential to clarify the mechanisms of SOC dynamics with the changes in diverse management practices over time and space.
Conservation practices are defined as the practices that increase the productivity of croplands, including multiple cropping, fertilizer application, irrigation, and crop rotation regimes[6]. Cropping is the soil preparation method which causes soil disturbance, such as no tillage and traditional tillage [7]; Fertilizer application is the most common conservation practice, which can significantly modify plant growth and important soil properties such as microbial composition and functions [8] ; Irrigation is a management practice which can apply water at the optimum time according to crop needs [9]; Crop rotation is a crop plantation system compared with monoculture. Numerous studies have demonstrated the positive effect of management practices such as reduced tillage and cover cropping on the build-up of SOC and the improvement of grain yield through long-term experimental fields [10,11] . However, some studies have indicated the weaker effects or opposing results. For example, Pittelkow [12] claimed that if conservation agriculture is not properly conducted, no yield gains would be got in the short term and in irrigated regions. Rosinger [13] clearly showed that soil texture and physico-chemical attributes were the most significant shaping factor for SOC sequestration potential, rather than the conservation practices. Since soil carbon stocks is subject to many factors, including soil properties, local environment and management practices, the effect of conservation practices on SOC stocks remains variable according to different climate conditions, topographic features, and soil attributes.
Previous studies have focused on the effects of different conservation practices on SOC stocks by designing various management practices in experiment fields or using the meta-analyses method [14,15,16], with the failure to link so many conservation practices in improving soil carbon sequestration and improving grain yield, and had led to a lack of understanding of the synergies of how conservation practices and environment conditions affect soil carbon sequestration in the cropland. Moreover, previous meta-analyses studies have not involved deriving the hiding relationships between SOC storage and the explanatory variables (e.g., conservation practices and climatic changes.), and leaves the questions of how conservation practices affects SOC, how climate change affects SOC, and the interactions of the practices and climatic conditions on SOC. Machine learning have recently emerged as a powerful tool for deriving the associations and patterns from complex datasets, and it can handle the “big-data” with greater flexibility compared with traditional statistical analysis methods. Meanwhile, its independence on experimental designs and prior assumptions can overcome the limitations of meta-analysis methods. Therefore, if the combination of meta-analysis and machine learning models can help to understand how conservation practices affect soil carbon storage changes, and few studies have revealed the hidden relationships between cropland SOC stocks and the management practices under climate change background over a long-time scale.
As one of the four major black soil areas all over the world, the Mollisol region of Northeast China has been praised as the “Corn Belt” of China, accounting for 41% national maize production [17]. However, traditional intensive cultivation had resulted in severe soil degradation and threat the national food security. In recent years, conservation practices such as no-tillage and residue cover were applied to improve soil carbon storage, but the effect of different conservation practices on the SOC stocks in agricultural soils is not clear in this region.
Therefore, the main objective of this study was to (1) Quantify the SOC stock changes under different management practices; (2) evaluate the effect of tillage practices (no-tillage, deep tillage, and reduced tillage) and straw return on SOC stocks with different climate conditions, soil properties and time period; (3) quantitatively identify the contributions of different environmental factors on SOC sequestration in the Mollisol region of Northeast China by using random forest (RF) models.
2. Materials and Methods
2.1. Literature Review and Data Collection
To investigate the effects of conservation practices on SOC stocks in the Mollisol region of Northeast China, the relevant articles were searched in the available databases including Web of Science (https://www.webofscience.com/), Elsevier (http://www.sciencedirect.com/), and China National Knowledge Infrastructure (https://www.cnki.net/) with the key words “Northeast China”, and “black soil region” or “Mollisol region”, and “organic carbon” or “soil carbon”, and “straw” or “crop cover”, and “chemical fertilizer” or “manure fertilizer”, and “conservation tillage”, and “no-tillage”, and “deep tillage”, and “reduced tillage”. These experiments should meet the following criteria: (1) all studies were conducted on the farmland of Northeast China; (2) provide the means and standard deviation of SOC content or stocks with three or more duplicates; (3) provide the test information clearly, such as location, time, experiment replicates, and soil properties. Based on the above criteria, 100 articles with 871 paired observations for the period between 1980 and 2022 were used in this study, and groups of data were available for comparison and summary.
2.2. Data Preparation
For each prepared article, the SOC stock and the following parameters related to the conservation practices and environmental variables were identified, including the location (latitude and longitude), MAT, MAP, soil pH, bulk density, soil depth, initial SOC stock, texture, management practices (no-tillage (NT), reduced tillage (RT), deep tillage (DT), and straw return (SR), and the duration period. If some key environmental information or soil properties were lacking in a study, other published articles were also searched to supplement relevant information from the same site and similar years. Meanwhile, the missing data also can be collected from the World Soil Database and Meteorological Database based on the latitude and longitude information. For each observation collected in this study, the mean and SD values of SOC stocks were obtained from tables or extracted from figures using GetData Graph Digitizer 2.26 software (version: 2.6). If only SE is shown in the literature, it can be converted to SD by:
When SD or SE is not available in a study, the SD is assigned as 1/10 of the mean [18].
To reveal the SOC stock response to different conservation practices affected by the environmental factors, the collected data were classified into different groups according to the data distribution characteristics of explanatory factors for each conservation practice. There was no consistent classification standards for each environmental factor. In addition, the data used in RF models need to be compiled to the consistent forms, including SOC stock, MAT, MAP, soil pH, bulk density, soil depth, initial SOC stock, soil texture, and duration period for the above seven conservation practices. Notably, soil texture is regarded as a category value, and other variables were continuous data values.
2.3. Data Analysis
Firstly, the carbon sequestration rate was calculated as following:
Where and are the SOC stocks with conservation practices versus the control respectively, and is the time after applying management practices.
Then, a standard meta-analysis method was conducted to evaluated the effect of conservation practices on soil organic carbon stocks [19]. In this paper, a random effects model was chosen to investigate the impact of conservation practices on SOC. The logarithm (lnRR) was used to represent the impact of farm management on SOC changes, and it was calculated as the effect size as follows:
Where and are the mean SOC values with farm management and no farm management, respectively. The variance () of was calculated as follows:
where and are the SD for farm management and on management, and and are the sample sizes for the SOC stock treatment and the control, respectively.
The overall response ratio of the SOC treatment and control was evaluated by the random effect model, with the weight of each observation. The weight factor () and the mean effect size () were calculated as follows:
where is the weighted effect size, represents the th observation.
The 95% CI was calculated as:
where is the SE of , and it was calculated as:
The meta-analysis was performed in MetaWin 3.08 software. A bootstrap approach with 999 iterations was employed to calculate the mean values and their 95% confidence interval (CI). If the 95% CI overlapped 0, the explanatory factor did not effect SOC stock; if not, the explanatory had a significant effect on SOC stock.
2.4. Machine Learning
The RF model is an integrated machine learning algorithm and it is employed to predict the SOC stocks to different conservation practices associated with climatic variables and soil properties in this study. The advantages of RF model include high accuracy, reduced overfitting, no feature normalization requirement, and good noise immunity [20]. In addition, RF model can calculate the relative importance of each explainable factor (e.g., conservation practices, climatic variables, and soil properties. and reveal the underlying rules between predictors and explainable factors. Here, the RF model was used to quantify the relative importance of explanatory factors on SOC dynamics collected from the published articles. Several explanatory factors including MAT, MAP, soil pH, bulk density, soil depth, initial SOC, soil texture, and duration period, were selected to establish the RF models for each conservation practice. The datasets were divided into two parts including training sets (70%), and test sets (30%), and the predictive performance of the model was evaluated by the determination coefficient (R2) and root mean square error (RMSE). RF model was conducted by using the randomForest package in R software (R Development Core Team, 2008).
3. Results
3.1. SOC Stocks Changes and Sequestration Rate in 1980-2022
Tillage practices generally increased SOC stock and sequestration rate in the Mollisol region of Northeast China during 1980-2022, except the NT practice in 20-40 cm depth (Table 1). The increased SOC stock under straw return practices was higher than that with different tillage measures. For 0-20 cm soil depth, SR increased SOC stock by 14.17±1.56 % compared with S0. Compared with PT, the increase of SOC stock in NT and DT and RT systems was 8.05±1.17%, 4.51±1.52%, and 7.43±1.69%, respectively. The SOC sequestration rate changes were not as similar as the SOC stock changes in response to different tillage practices at 0-20 and 20-40 cm depths. The greatest increasing of 0.80±0.38 g kg-1 yr-1 was observed when RT was practiced at the 20-40 cm depth, followed by the increasing of 0.71±0.10 g kg-1 yr-1 when SR was practiced at the 0-20 cm depth. The increase in SOC sequestration rate presented no obvious trends between 0-20 and 20-40 cm depths.
3.2. Responses of SOC Stock to the Management Practices and Environmental Variables
3.2.1. Tillage Management
The SOC stock response to no tillage management and its environmental factors are presented in Figure 1a. The significantly positive responses of SOC stock to no tillage were observed in MAT, MAP (500-600 mm and >600 mm), pH (<7), BD (<1.3 g cm-3 and >1.5 g cm-3), SD (0-5 cm), ISOC, Texture (sandy), and Duration (1-5y and 5-15y). The largest increase in SOC stock reached 13.9% in BD ( >1.5 g cm-3) group, and followed by the 15.5% SOC stock increase in SD (0-5 cm) group. The increase in SOC stock has no raised trend with the increasing of MAT, while the larger increase reached 9.29% in the MAT (<3°C) group. No distinct variations were exhibited between different groups in MAP for the response of SOC stock to the adoption of no tillage management, and the effect size ranged from 6.1% (500-600 mm) to 7.7% (>600 mm). Regarding soil properties, the significantly increase in SOC were observed in the relevant groups of initial SOC (3.4%-8.1%), SD (15.5%), BD (8.6%-13.9%), pH (6.5%), and soil texture (8.3%), respectively.
The SOC stock response to reduced tillage management and its environmental factors are presented in Figure 1b. The significantly positive responses of SOC stock to reduced tillage were observed in MAT, MAP (<500 mm and 500-600 mm), pH, BD, SD, ISOC (10-20 g kg-1, 20-30 g kg-1, and >30 g kg-1), Texture, and Duration (<5y and 5-10y). The largest increase in SOC stock reached 17.1% in soil texture (clay) group, and followed by 14.8% in soil pH (<6.7) group and 14.4% in soil BD (<1.2 g cm-3) group, respectively. The duration period have no distinct variations in different groups for the response of SOC to the adoption of reduced tillage, and the effect size was 9.8% in the group (<5y) and 10.1% in the group (5-10y), respectively. The SOC stock significantly increased by 8.4% and 12.1% in MAT >3 °C and <3 °C groups, while it increased by 8.8% and 9.6% in MAP 500-600 mm and <500 mm groups, respectively.
After reduced tillage management, the increase in SOC stock gradually decreased with the increasing of the initial SOC stock, and it increased by 12.3%, 7.8%, and 4.6% in the 10-20 kg-1, 20-30 kg-1, and >30 kg-1 group, respectively. In addition, a positive relationship was observed between soil depth and the response of SOC to reduced tillage management, with the effect size 8.1% and 9.2% in >20 cm and 0-20 cm group, respectively.
The SOC stock response to deep tillage management and its environmental variables are presented in Figure 1. The significantly positive responses of SOC stock to deep tillage were observed in MAT (<3 °C and 3-6 °C), MAP (<500 mm and 500-600 mm), pH (<7), BD (<1.3 g cm-3 and >1.5 g cm-3), SD (0-20 cm and 20-40 cm), ISOC, Texture (loam), and Duration. Regarding climatic factors, the increase in SOC stock raised with the increasing of MAT, and it increased by 3.4% and 8.1% in the <3°C and 3-6°C group, respectively. Meanwhile, there was little variation between the MAP groups on the SOC stock response to deep tillage management, with the effect size 5.8% and 6.4% in the <500 mm and 500-600 mm group, respectively. For soil properties, the largest increase in SOC stock reached 9.9% in BD ( >1.5 g cm-3) group, and followed by 8.1% in the soil texture (loam) group, while the smallest increase in SOC stock reached 2.4% in in the soil texture (sandy) group. After deep tillage management, the increase in SOC stock raised with the increasing of the duration period, and it increased from 5.3% to 9.3% in the <5y and >5y group, respectively.
3.2.2. Straw Return
The SOC stock response to straw return management and its environmental factors are shown in Figure 1d. Except the MAT group (<3°C) and SD group (>40 cm), a significantly positive relationship was identified between all other environmental variables and the response of SOC stock to straw return management. The largest increase in SOC stock reached 75.5% in soil pH (>8) group, and followed by 72.6% in initial SOC stock (<5 g kg-1) group, which were maximal increasing values across all the conservation practices in this study. Climatic factors, i.e., MAT and MAP, indicated positive increased effect on SOC response to straw return management with the increasing of the two factors. For instance, the increase in SOC stock raised from 6.6% to 14.3% in the <500 mm and 500-600 mm MAP group, respectively. Meanwhile, the increase in SOC stock raised with the increasing of soil pH values, and the effect size was 5.8%, 10.7%, and 75.5% in the <6, 6-8, and >8 group, respectively. After straw return management, the larger increase in SOC stock reached 12.4% in BD (<1.3g cm-3) group, 20.6% and 17.8% in soil depth (0-5 cm and 30-40 cm) group, 16.5% in soil texture (loam) group respectively, and there was no distinct variations among other groups for the above environmental factors. Regarding the duration period, the largest increase in SOC stock has no raised trend with the increasing of duration period, while it reached 22.2% in the <1y group, and followed by 11.7% in the >11y group and 8.8% in the 2-10y group, respectively.
3.3. SOC Stock Prediction Using RF Model
Eight environmental factors, including MAT, MAP, soil pH, bulk density, soil depth, initial SOC, texture, and duration period, were selected to establish the RF models for SOC stock prediction. As shown in Figure 2, the fit coefficient between the observed and predicted SOC for the test dataset was 0.73, 0.83, 0.95, and 0.86, and the corresponding RMSE was 2.59 g kg-1, 2.34 g kg-1, 1.87 g kg-1, and 2.48 g kg-1 for NT, RT, DT, and SR practices, respectively. The scatter plots were all distributed around the 1:1 line for the four management practices. It was indicated that the RF models had high prediction accuracy and good performance.
3.3. Relative Importance of Explanatory Factors
The relative importance of each environmental variable for the increasing of SOC stock in response to different management practices was presented in Figure 3. The initial SOC stock was identified as the most important factor for SOC stock, with the relative importance values of 33.4%, 29.4%, 29.0%, and 34.1%, respectively. MAT also had a important impact on the SOC stock under the four management practices, with the importance scores ranged from 12.2% to 14.9%. In addition, BD showed important impact on the enhancing of SOC stock under NT and SR practice, with the importance scores of 14.4% and 14.2%, respectively. Soil texture had the smallest impact on the SOC across different practices, with the scores 4.0%, 5.5%, 4.0%, and 5.3% for NT, RT, DT, and SR, respectively.
4. Discussion
4.1. Changes in SOC Stock Under Different Management Practices
The overall SOC stock change in response to different management practices ranged from 4.51% to 14.17% (Table 1). This result was similar to previous studies, which showed the ranges of 5-19 % with tillage practices [10,21], and 11-16 % with straw return practices[14,22]. The largest SOC stock change was observed in SR (14.17%) at 0-20 cm depth, followed by SR (11.21%) at 20-40 cm depth. This is because straw cover contributes to biomass production and microbial activities, which can promote soil aggregation and enhance water holding capacity, thus it has a significant effect on soil C input [23]. The maximum SOC sequestration rate was observed in RT (0.80 g kg-1 yr-1) at 20-40 cm depth, followed by SR (0.71 g kg-1 yr-1) at 0-20 cm depth and DT (0.68 g kg-1 yr-1) at 20-40 cm depth. It was indicated that DT and RT had great potential to improve SOC sequestration rate at the deeper soil depths. The results also presented that NT enhanced SOC stock by 8.05%, and followed by RT (7.43%) and DT (4.51%) at the 0-20 cm depth. Conservation tillage measures, such as no-tillage and reduced tillage, can reduce soil disturbance and increase straw C input and enhance SOC sequestration [24,25]. In addition, the DT practice showed more potential to increase SOC stock at the 20-40 cm depth than that at the 0-20 cm depth. That is because that deep tillage tills deeper and bury the straw in the topsoil into the 20-40 cm deep layer. Meanwhile, DT can facilitate the root development and increase root-derived C input into the deep soil layer, thus it enhances more C storage relative to the topsoil C stock [26].
4.2. Effect of Climatic Factors on SOC Stock
Climatic factors, such as MAT and MAP, can influence SOC accumulation and storage through affect the decomposition rate of organic matter, biomass production, and microbial activities [27]. The Mollisol region of Northeast China is mostly located in the high-latitude areas, and the heat resource is the main constraint factor for soil C sequestration. The results in this study demonstrated that climatic factors had more effect on the increasing of SOC stock under straw return practice than that under the tillage practices. The result was consistent with the previous studies such as Liu et al. and Qin et al. [28,29]. With the increase of temperature and precipitation, the microbial decomposition of straw cover increases and enhances SOC sequestration, meanwhile high rainfall also promote crop residue C input into the soil. Compared with other environmental factors (e.g., soil properties and duration period), climatic factors did not show distinct advantage for the enhancing of SOC storage in the response of SOC to the tillage and straw return practices. Since the climatic conditions varied differently across the Mollisol region of Northeast China, and the increasing of SOC stock also depend on the balance of water and heat resources. The unbalance of MAT and MAP in such high-latitude regions generally become the constraint factors for soil C accumulation in the study area.
4.3. Effect of Soil Properties on SOC Stock
Soil properties, e.g., soil pH, BD, depth, initial SOC, and texture, all affected the SOC stocks under different tillage and straw return practices. Regarding to straw return practice, all soil properties across different groups showed significantly positive effect on the increasing of SOC stock, except the >40 cm group in soil depth. Therefore, it is suggested that straw return is an effective conservation practice which is suitable for most soil conditions in the Mollisol region of Northeast China. A significant improvement of SOC stock can be observed in the case of the soil pH >8 and ISOC<5 g kg-1 category that has shown an increasing of SOC stock by 75.5% and 72.6%, respectively. The SOC sequestration under straw return practice increased with the increasing with soil pH values, as the microbial activity may be restricted in the acidic soil conditions and influencing the decomposition process of organic matter [30].
The soil BD can reflect soil structure and function of soil microbial communities, and generally the BD of clay soil is the highest, while that of sandy soil is the lowest, and that of loam soil falls in between [31]. The NT and DT showed more effective on SOC stock with high BD than that with low BD. Our results also found that straw return is more effective in enhancing SOC stock in loam soils, and it was consistent with the results in Wang [32]. In addition, the relative lower effect on SOC sequestration was found in the clay group. Since clay soil has finer soil particles than sandy and loam soils, and it tend to preserve rich organic matter and C storage [33].
Soil depth provides different effect on SOC stock in response to these management practices. In our work, NT and RT had more impact upon SOC than DT practice. Our results also indicated that NT had a significantly positive effect (15.5%) on SOC stock compared to conventional tillage in the Mollisol region of Northeast China, especially at the 0-5 cm depth. That is because the reduced tillage practices offers less disturbance in the surface of soil compared with conventional tillage, and provide more opportunity to store C and reduce C mineralization to the atmosphere [34]. Compared with the tillage practices, straw return adds crop residue to the soil directly and takes time to improve soil C sequestration, therefore it had more effect on the increasing of SOC stock than the tillage practices, especially at the 0-5 cm depth.
Based on the RF model results, the relative importance of initial SOC on the increasing of SOC stock under different tillage and straw return practices was the maximum across all the environmental factors. Furthermore, all the tillage and straw return practices enhanced more SOC stock under low initial SOC than under high SOC in our work. The consistent result was found in Georgiou and Wang [35,36]. It was easy to understand that the soil with low initial SOC stock had more increasing potential to change to the high SOC soil compared with the soils of relative high initial SOC, under the same management practices.
4.4. Effect of Duration Period on SOC Stock
The duration period of the management practices upon agricultural soils demonstrated various effect on soil C sequestration in this study. Previous studies stated that the soil properties require several decades to respond to the management practices [37,38]. However, in our study, it can be observed that the management practices have a positive effect on SOC stock with much shorter period, with the increasing of SOC 4.6% under NT practice and 9.8% under RT practice and 9.3% under DT practice, all in the case of short term (<5y) respectively. Our results was similar to the previous studies [39,40], in which the results demonstrated that the management practices would take 3-7 years to achieve the changes in soil C stocks. That is because that SOC sequestration is a dynamic process with new C input and old C output, and whatever the decomposition of organic matter and SOC mineralization both require several years to result in any noticeable changes, especially in the high-latitude regions. Interestingly, our meta-analysis found that the response of SOC stock to straw return was all significant for the <1y, 2-10y, and >11y period, and the maximum effect size (22.2%) was reached when the period was shorter than 1 year. Soil erosion caused by high-intensity agricultural practices and extreme weather conditions is considered as the primary factor affecting soil C storage and soil degradation in Northeast China [41]. The straw cover can help to protect soil from the water and wind erosion in the initial periods of straw return implementation. This explains the significantly positive effect of straw return on SOC stock in such short period in our results. However, the low temperature and cold climate in Northeast China will make the straw decomposition process slow down [42], therefore a decrease in the effect of straw return on the increasing of SOC stock was observed over time.
5. Conclusions
In this study, the combination of meta-analysis and RF model was demonstrated to be a powerful approach for investigating the response of SOC stock in agricultural soils to different conservation practices and their interactions with climatic conditions and soil properties. The findings showed that the conservation practices (e.g., no-tillage, reduced tillage, deep tillage, and straw return) caused a 0.16-14.17% increase in SOC stock in the Mollisol region of Northeast China. The results from meta-analysis confirmed that the conservation practices can significantly enhanced the SOC stock. Straw return practice was proven to reach the maximum increase in SOC stock, especially for the soil with lower initial SOC storage. The SOC stock changed not only with climatic variables and soil properties, but also with different duration periods. The results from the RF models indicated that the initial SOC was the most important factor affecting SOC stock, and SOC stock increased with the increasing of initial SOC stock. In the future, the optimized management practice need to be commended for different environmental conditions and agricultural regions, and it would provide a effective method to achieve the 4‰target through the conservation practices.
Author Contributions
Conceptualization, Zhang Y.; methodology, Zhang Y.; software, Long Y.; validation, Long Y.; formal analysis, Long Y.; investigation, Long Y.; resources, Zhang Y.; data curation, Long Y.; writing—original draft preparation, Zhang Y.; writing—review and editing, Zhang Y.; visualization, Long Y.; supervision, Long Y.; project administration, Long Y.; funding acquisition, Zhang Y. All authors have read and agreed to the published version of the manuscript.
Funding
This research was funded by the National Natural Science Foundation of China [grant number 42301074].
Data Availability Statement
The dataset is available upon request from the authors.
Conflicts of Interest
The authors declare no conflicts of interest.
References
- Odebiri, O., Mutanga, O., Odindi, J., Naicker, R. Modelling soil organic carbon stock distribution across different land-uses in South Africa: A remote sensing and deep learning approach. ISPRS Journal of Photogrammetry and Remote Sensing. 2022, 188, 351-362. [CrossRef]
- Lal, R., Smith, P., Jungkunst, H.F., Mitsch, W.J., Skorupa, A. The carbon sequestration potential of terrestrial ecosystems. Journal of Soil and Water Conservation. 2018, 73(6), 145A-152A. [CrossRef]
- Purakayastha, T.J., Bera, T., Bhaduri, D., Sarkar, B., Mandal, S., Wade, P., Kumari, S., Biswas, S., Menon, M., Pathak, H., Tsang, D.C.W. A review on biochar modulated soil condition improvements and nutrient dynamics concerning crop yields: pathways to climate change mitigation and global food security. Chemosphere . 2019, 227 ,345-365. [CrossRef]
- Amelung, W., Bossio, D., de Vries, W., Kögel-Knabner, I., Lehmann, J., Amundson, R., Bol, R., Collins, C., Lal, R., Leifeld, J., Minasny, B., Pan, G., Paustian, K., Rumpel, C., Sanderman, J., van Groenigen, J.W., Mooney, S., van Wesemael, B., Wander, M., Chabbi, A. Towards a global-scale soil climate mitigation strategy. Nature Communications. 2020, 11(1), 5427. [CrossRef]
- Pradhan, P., Fischer, G., van Velthuizen, H., Reusser, D.E., Kropp, J.P. Closing yield gaps: how sustainable can we be? PLoS ONE. 2015, 10 (6), e0129487. [CrossRef]
- Mauser, W., Klepper, G., Zabel, F., Delzeit, R., Hank, T., Putzenlechner, B., Calzadilla, A. Global biomass production potentials exceed expected future demand without the need for cropland expansion. Nature Communications. 2015, 6, 1-11. [CrossRef]
- Daigh, A.L.M., Dick, W.A., Helmers, M.J., Lal, R., Lauer, J.G., Nafziger, E., Pederson, C. H., Strock, J., Villamil, M., Mukherjee, A., Cruse, R. Yields and yield stability of no-till and chisel-plow fields in the Midwestern US Corn Belt. Field Crops Research. 2018, 218, 243-253. [CrossRef]
- Wang, Q., Ma, M., Jiang, X., Guan, D., Li, J. Influence of 37 years of nitrogen and phosphorus fertilization on composition of rhizosphere arbuscular mycorrhizal fungi communities in black soil of northeast China. Frontiers in Microbiology. 2020, 11, 539669. [CrossRef]
- Bounajra, A., Guemmat, K.E., Mansouri, K., Akef, F. Towards efficient irrigation management at field scale using new technologies: A systematic literature review. Agricultural Water Management. 2024, 295, 108758. [CrossRef]
- Bai, X., Huang, Y., Ren, W., Coyne, M., Jacinthe, P.A., Tao, B., Hui, D., Yang, J., Matocha, C. Responses of soil carbon sequestration to climate-smart agriculture practices: A meta-analysis. Global Change Biology. 2019, 25(8), 2591-2606. [CrossRef]
- Dupla, X., Lemaître, T., Grand, S., Gondret, K., Charles, R., Verrecchia, E., Boivin, P. On-Farm Relationships Between Agricultural Practices and Annual Changes in Organic Carbon Content at a Regional Scale. Frontiers in Environmental. Science . 2022, 314. [CrossRef]
- Pittelkow, C.M., Liang, X., Linquist, B.A., van Groenigen, K.J., Lee, J., Lundy, M.E., van Gestel, N., Six, J., Venterea, R.T., van Kessel, C. Productivity limits and potentials of the principles of conservation agriculture. Nature. 2014, 517, 365-368. [CrossRef]
- Rosinger, C., Keiblinger, K., Bieber, M., Bernardini, L.G., Huber, S., Mentler, A., Sae-Tun, O., Scharf, B., Bodner, G. On-farm soil organic carbon sequestration potentials are dominated by site effects, not by management practices. Geoderma . 2023, 433, 116466. [CrossRef]
- Das, S., Chatterjee, S., Rajbanshi, J. Responses of soil organic carbon to conservation practices including climate-smart agriculture in tropical and subtropical regions: A meta-analysis. Science of the Total Environment. 2022, 805, 150428. [CrossRef]
- Liu, S., Wu, B., Niu, B., Xu, F., Yin, L., Wang, S. Regional suitability assessment for different tillage practices in Northeast China: A machine learning aided meta-analysis. Soil & Tillage Research. 2024, 240, 106094. [CrossRef]
- Pu, Y., Yang, L., Zhang, L., Huang, H., Zhang, G., Zhou, C. Major contributions of agricultural management practices to topsoil organic carbon distribution and accumulation in croplands of East China over three decades. Agriculture, Ecosystems and Environment . 2024, 359, 108749. [CrossRef]
- Wang, S., Huang, X., Zhang, Y., Yin, C., Richel, A. The effect of corn straw return on corn production in Northeast China: an integrated regional evaluation with meta-analysis and system dynamics. Resources Conservation and Recycling. 2021, 167, 105402. [CrossRef]
- Gattinger, A., Muller, A., Haeni, M., Skinner, C., Fliessbach, A., Buchmann, N., Mader, P., Stolze, M., Smith, P., Scialabba, N.E.H., Niggli, U. Enhanced top soil carbon stocks under organic farming. Proceedings of National Academy of Science of the U.S.A. 2012,109 (44), 18226-18231.
- Hedges, L.V., Gurevitch, J., Curtis, P.S. The meta-analysis of response ratios in experimental ecology. Ecology. 1999, 80, 1150-1156.
- Lei, C., Deng, J., Cao, K., Xiao, Y., Ma, L., Wang, W., Ma, T., Shu, C. A comparison of random forest and support vector machine approaches to predict coal spontaneous combustion in gob. Fuel. 2019, 239, 297-311. [CrossRef]
- Lin, B., Li, R., Yang, M., Kan, Z., Virk, A.L., Bohoussou, Y., Zhao, X., Dang, Y.P., Zhang, H. Changes in cropland soil carbon through improved management practices in China: A meta-analysis. Journal of Environmental Management. 2023, 329, 117065. [CrossRef]
- Huang, T., Yang, N., Lu, C., Qin, X., Siddique, K.H.M., 2021. Soil organic carbon, total nitrogen, available nutrients, and yield under different straw returning methods. Soil Tillage Research. 2021, 214, 105171. [CrossRef]
- Beehler, J., Fry, J., Negassa, W., Kravchenko, A. Impact of cover crop on soil carbon accrual in topographically diverse terrain. Journal of Soil Water Conservation. 2017, 72 (3), 272-279. [CrossRef]
- Chen, H., Dai, Z., Veach, A.M., Zheng, J., Xu, J., Schadt, C.W. Global meta-analyses show that conservation tillage practices promote soil fungal and bacterial biomass. Agriculture Ecosystems & Environment . 2020, 293, 106841. [CrossRef]
- Zheng, F., Wu, X., Zhang, M., Liu, X., Song, X., Lu, J., Wang, B., van Groenigen, K.J., Li, S. Linking soil microbial community traits and organic carbon accumulation rate under long-term conservation tillage practices. Soil and Tillage Research. 2022, 220, 105360. [CrossRef]
- Mu, X.Y., Zhao, Y.L., Liu, K., Ji, B.Y., Guo, H.B., Xue, Z.W., Li, C.H. Responses of soil properties, root growth and crop yield to tillage and crop residue management in a wheat-maize cropping system on the North China Plain. European Journal of Agronomy. 2016, 78, 32-43.
- Zhao, W., Zhang, R., Cao, H., Tan, W. Factor contribution to soil organic and inorganic carbon accumulation in the loess plateau: structural equation modeling. Geoderma. 2019, 352 (March), 116-125. [CrossRef]
- Liu, W., Liu, W., Kan, Z., Chen, J., Zhao, X., Zhang, H. Effects of tillage and straw management on grain yield and SOC storage in a wheat-maize cropping system. European Journal of Agronomy. 2022, 137, 126530. [CrossRef]
- Qin, W., Niu, L., You, Y., Cui, S., Chen, C., Li, Z. Effects of conservation tillage and straw mulching on crop yield, water use efficiency, carbon sequestration and economic benefits in the Loess Plateau region of China: A meta-analysis. Soil and Tillage Research. 2024, 238, 106025. [CrossRef]
- Akhtar, K., Wang, W., Khan, A., Ren, G., Zaheer, S., Sial, T.A., Feng, Y., Yang, G. Straw mulching with fertilizer nitrogen: an approach for improving crop yield, soil nutrients and enzyme activities. Soil use and management. 2019, 35, 526-535. [CrossRef]
- Xin, J., Yan, L., Cai, H. Response of soil organic carbon to straw return in farmland soil in China: A meta-analysis. Journal of Environmental Management. 2024, 359, 121051. [CrossRef]
- Wang, Y., Wu, P., Mei, F., Ling, Y., Qiao, Y., Liu, C., Leghari, S.J., Guan, X., Wang, T. Does continuous straw returning keep China farmland soil organic carbon continued increase? A meta-analysis. Journal of Environmental Management. 2021, 288, 112391 . [CrossRef]
- Hassink, J. The capacity of soils to preserve organic C and N by their association with clay and silt particles. Plant Soil . 1997, 191, 77-87. [CrossRef]
- Sheehy, J., Regina, K., Alakukku, L., Six, J. Impact of no-till and reduced tillage on aggregation and aggregate-associated carbon in northern european agroecosystems. Soil Tillage Res. 2015, 150, 107-113. [CrossRef]
- Georgiou, K., Jackson, R.B., Vindušková, O., Abramoff, R.Z., Ahlström, A., Feng, W., Harden, J.W., Pellegrini, A.F.A., Polley, H.W., Soong, J.L., Riley, W.J., Torn, M.S. Global stocks and capacity of mineral-associated soil organic carbon. Nature Communications. 2022, 13. [CrossRef]
- Wang, X., Xu, X., Qiu, S., Zhao, S., He, P. Deep tillage enhanced soil organic carbon sequestration in China: A meta-analysis. Journal of Cleaner Production. 2023, 399, 136686. [CrossRef]
- Fujisaki, K., Perrin, A.S., Garric, B., Balesdent, J., Brossard, M. Soil organic carbon changes after deforestation and agrosystem establishment in Amazonia: an assessment by diachronic approach. Agriculture Ecosystems & Environment. 2017, 245, 63-73. [CrossRef]
- Brahma, B., Pathak, K., Lal, R., Kurmi, B., Das, M., Nath, P.C., Nath, A.J., Das, A.K. Ecosystem carbon sequestration through restoration of degraded lands in Northeast India. Land Degradation Development. 2018, 29 (1), 15-25. [CrossRef]
- Sommer, R., Bossio, D. Dynamics and climate change mitigation potential of soil organic carbon sequestration. Journal of Environmental Management. 2014, 144, 83-87. [CrossRef]
- Schreiner-McGraw, A.P., Ransom, C.J., Veum, K.S., Wood, J.D., Sudduth, K.A., Abendroth, L.J. Quantifying the impact of climate smart agricultural practices on soil carbon storage relative to conventional management. Agricultural and Forest Meteorology. 2024, 344, 109812. [CrossRef]
- Wang, H., Zhang, C., Yao, X., Yun, W., Ma, J., Gao, L., Li, P. Scenario simulation of the tradeoff between ecological land and farmland in black soil region of Northeast China. Land Use Policy. 2022, 114, 105991. [CrossRef]
- Xing, S., Zhang, G., Chen, S., Zhang, N., Wang, C. Response of soil erosion resistance to straw incorporation amount in the black soil region of Northeast China. Journal of Environmental Management. 2024, 357, 120801. [CrossRef]
Figure 1.
Response of SOC stock to different tillage managements and environmental variables. (a) no tillage (NT), (b) reduced tillage (RT), (c) deep tillage (DT), (d) straw return (SR). The numbers in the graph represent the number of comparisons (controls+treatments). The points and error bars represent the mean and 95% confidence intervals. Abbreviations: SOC, soil organic carbon, MAT, mean annual temperature (°C), MAP, mean annual precipitation (mm), BD, bulk density (g cm-3), SD, soil depth (cm), ISOC, initial soil organic carbon stock (g kg-1).
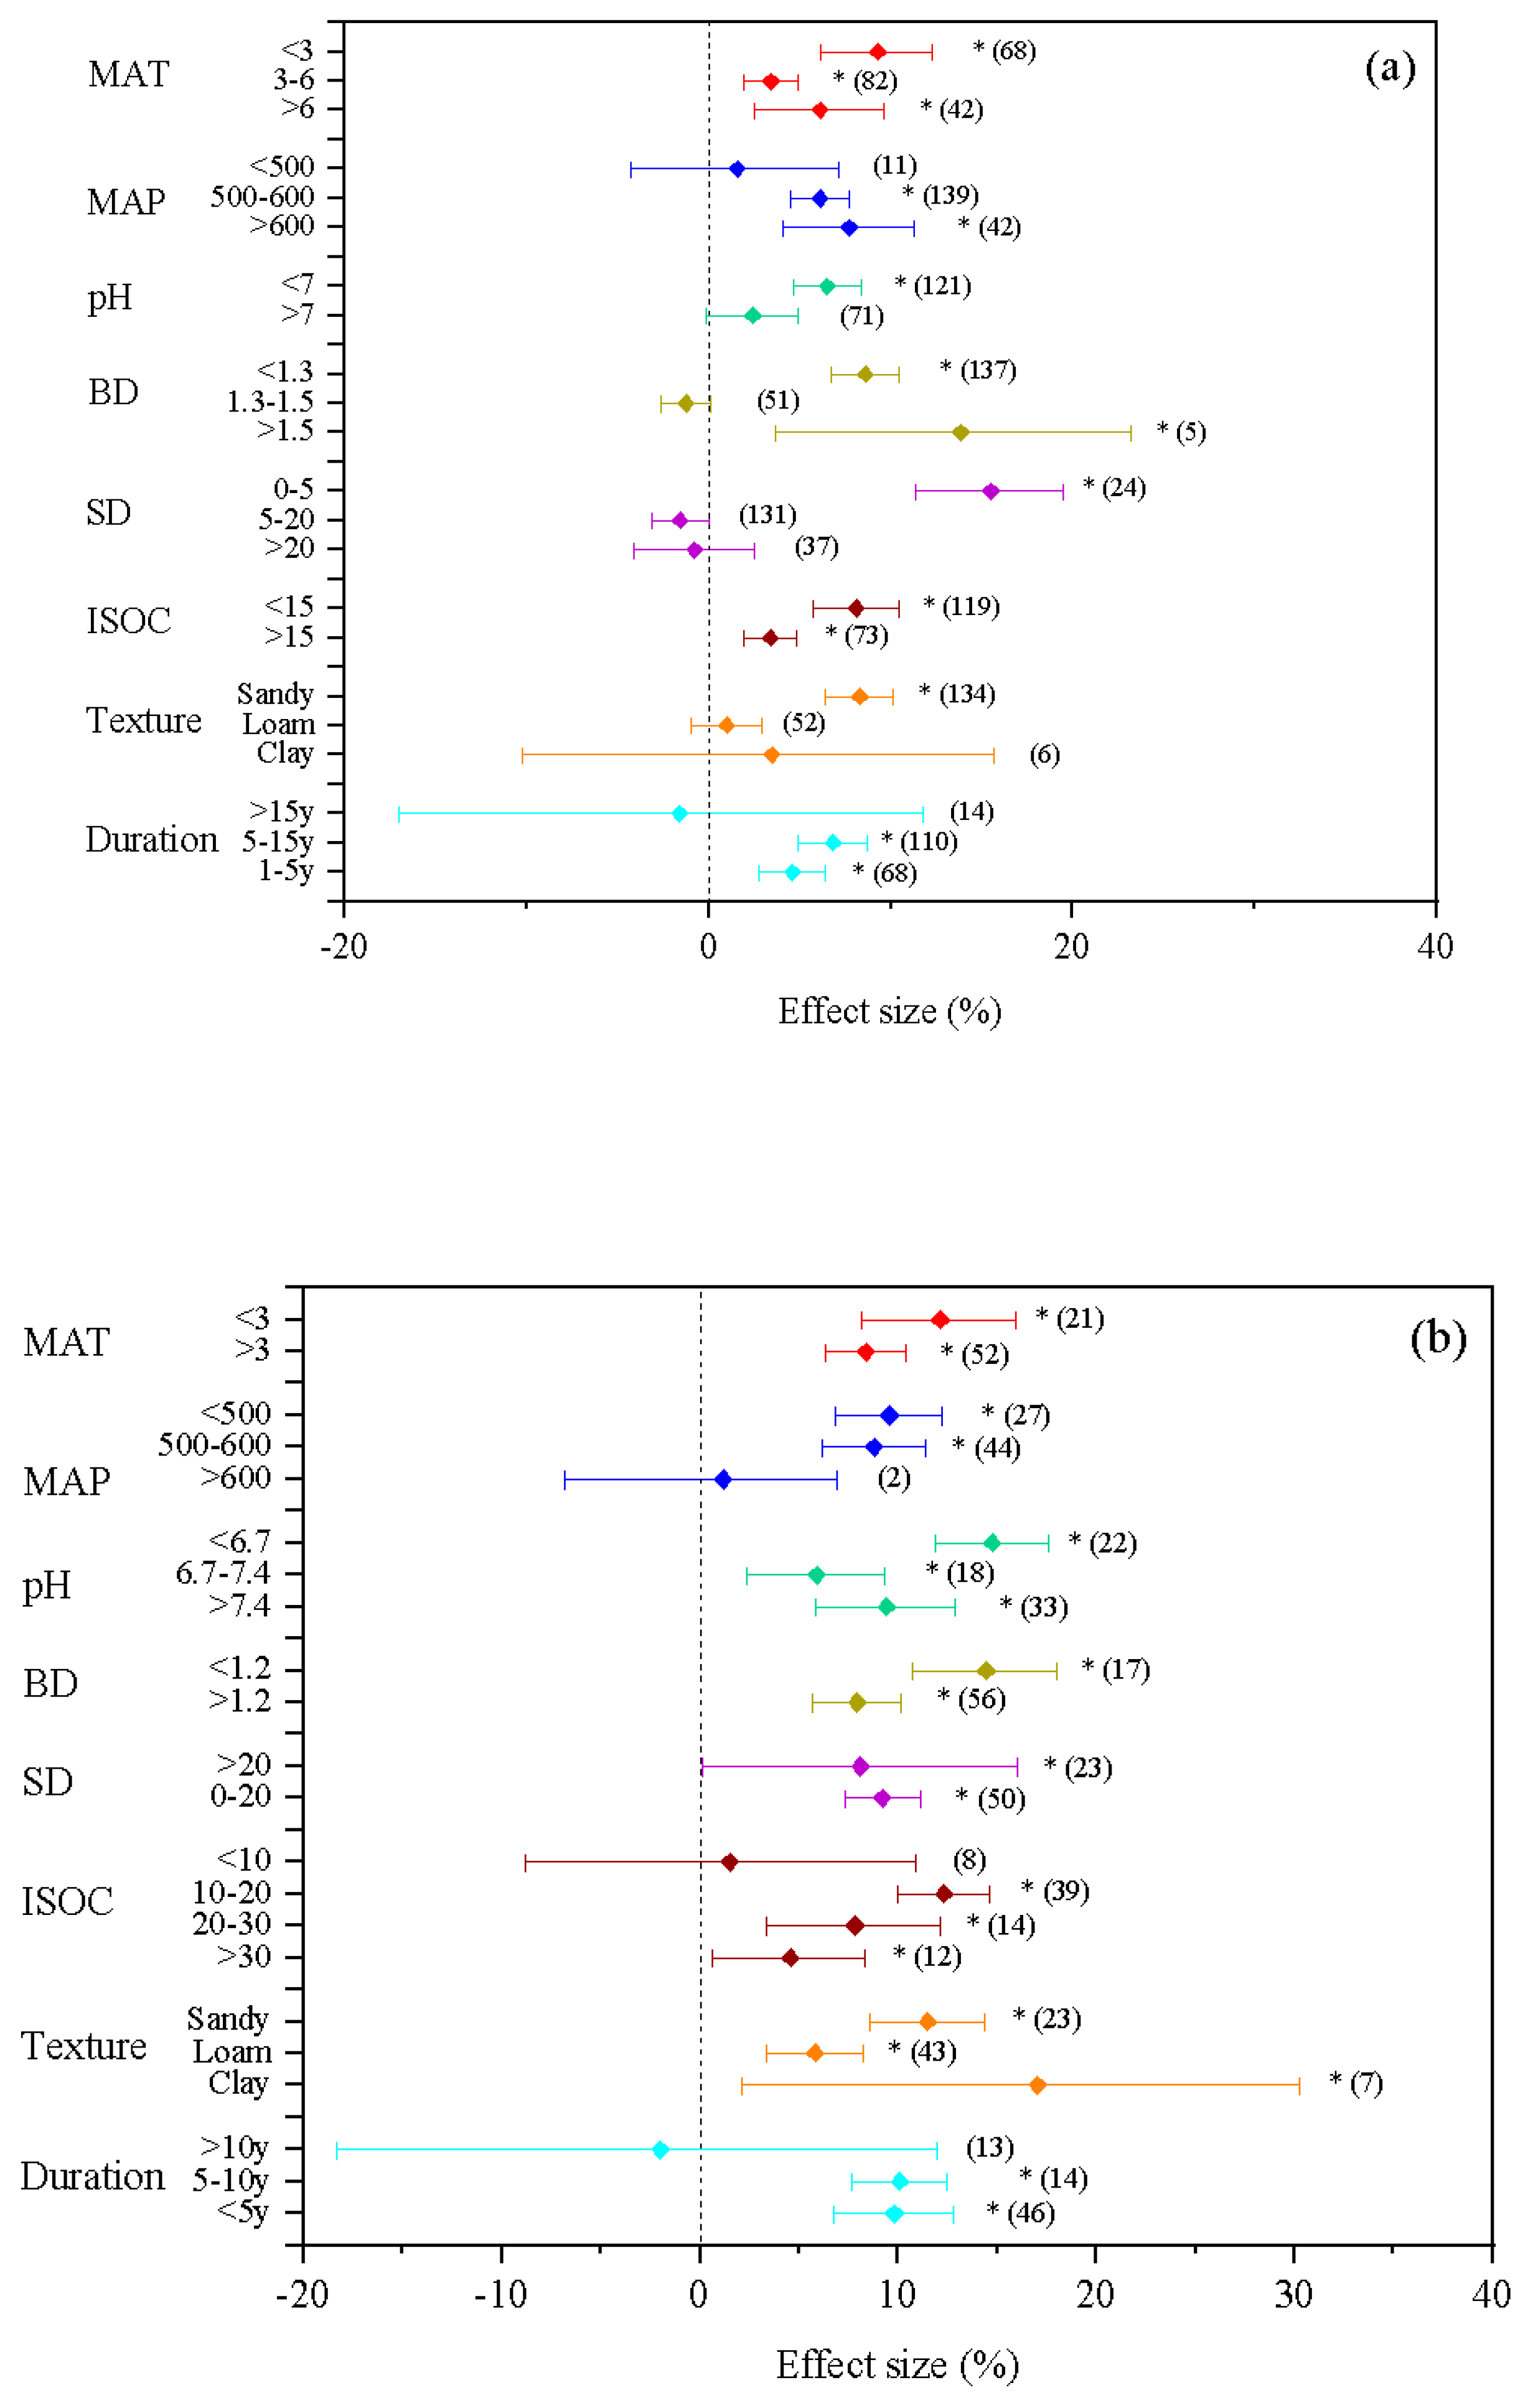
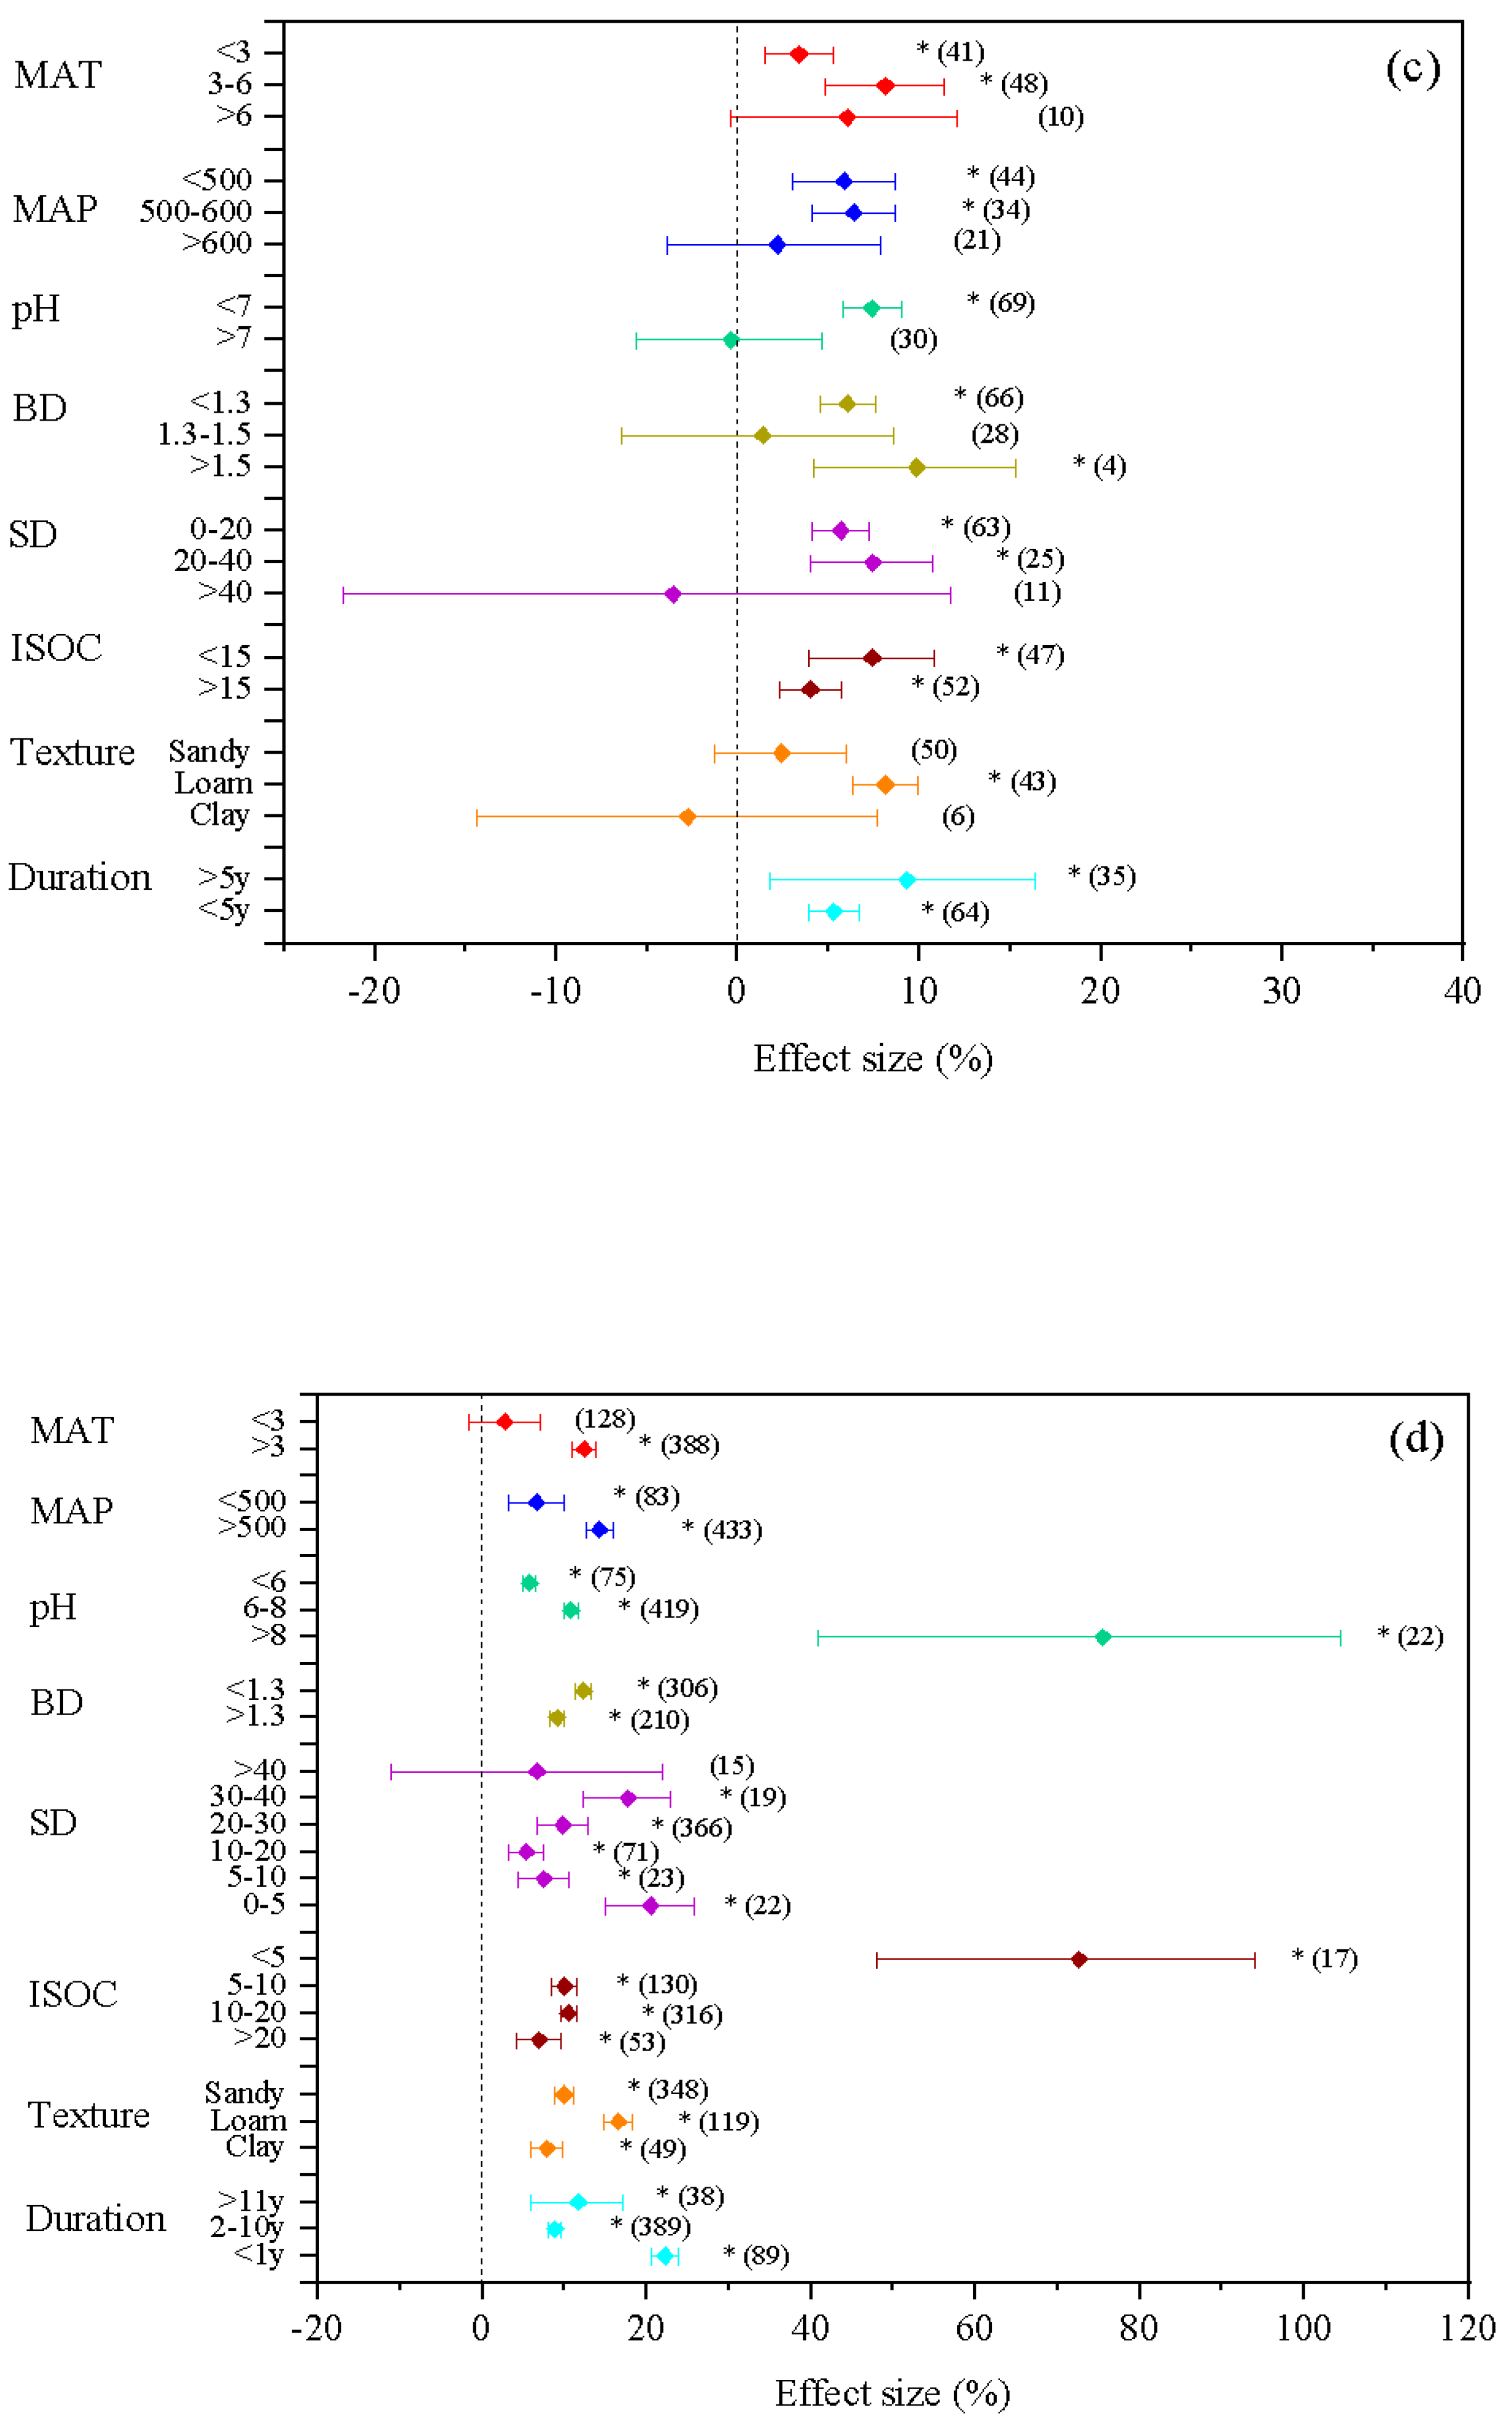
Figure 2.
Scatter plots of the predicted SOC versus observed SOC by the RF model under different management practices. (a) no tillage (NT), (b) reduced tillage (RT), (c) deep tillage (DT), and (d) straw return (SR).
Figure 2.
Scatter plots of the predicted SOC versus observed SOC by the RF model under different management practices. (a) no tillage (NT), (b) reduced tillage (RT), (c) deep tillage (DT), and (d) straw return (SR).
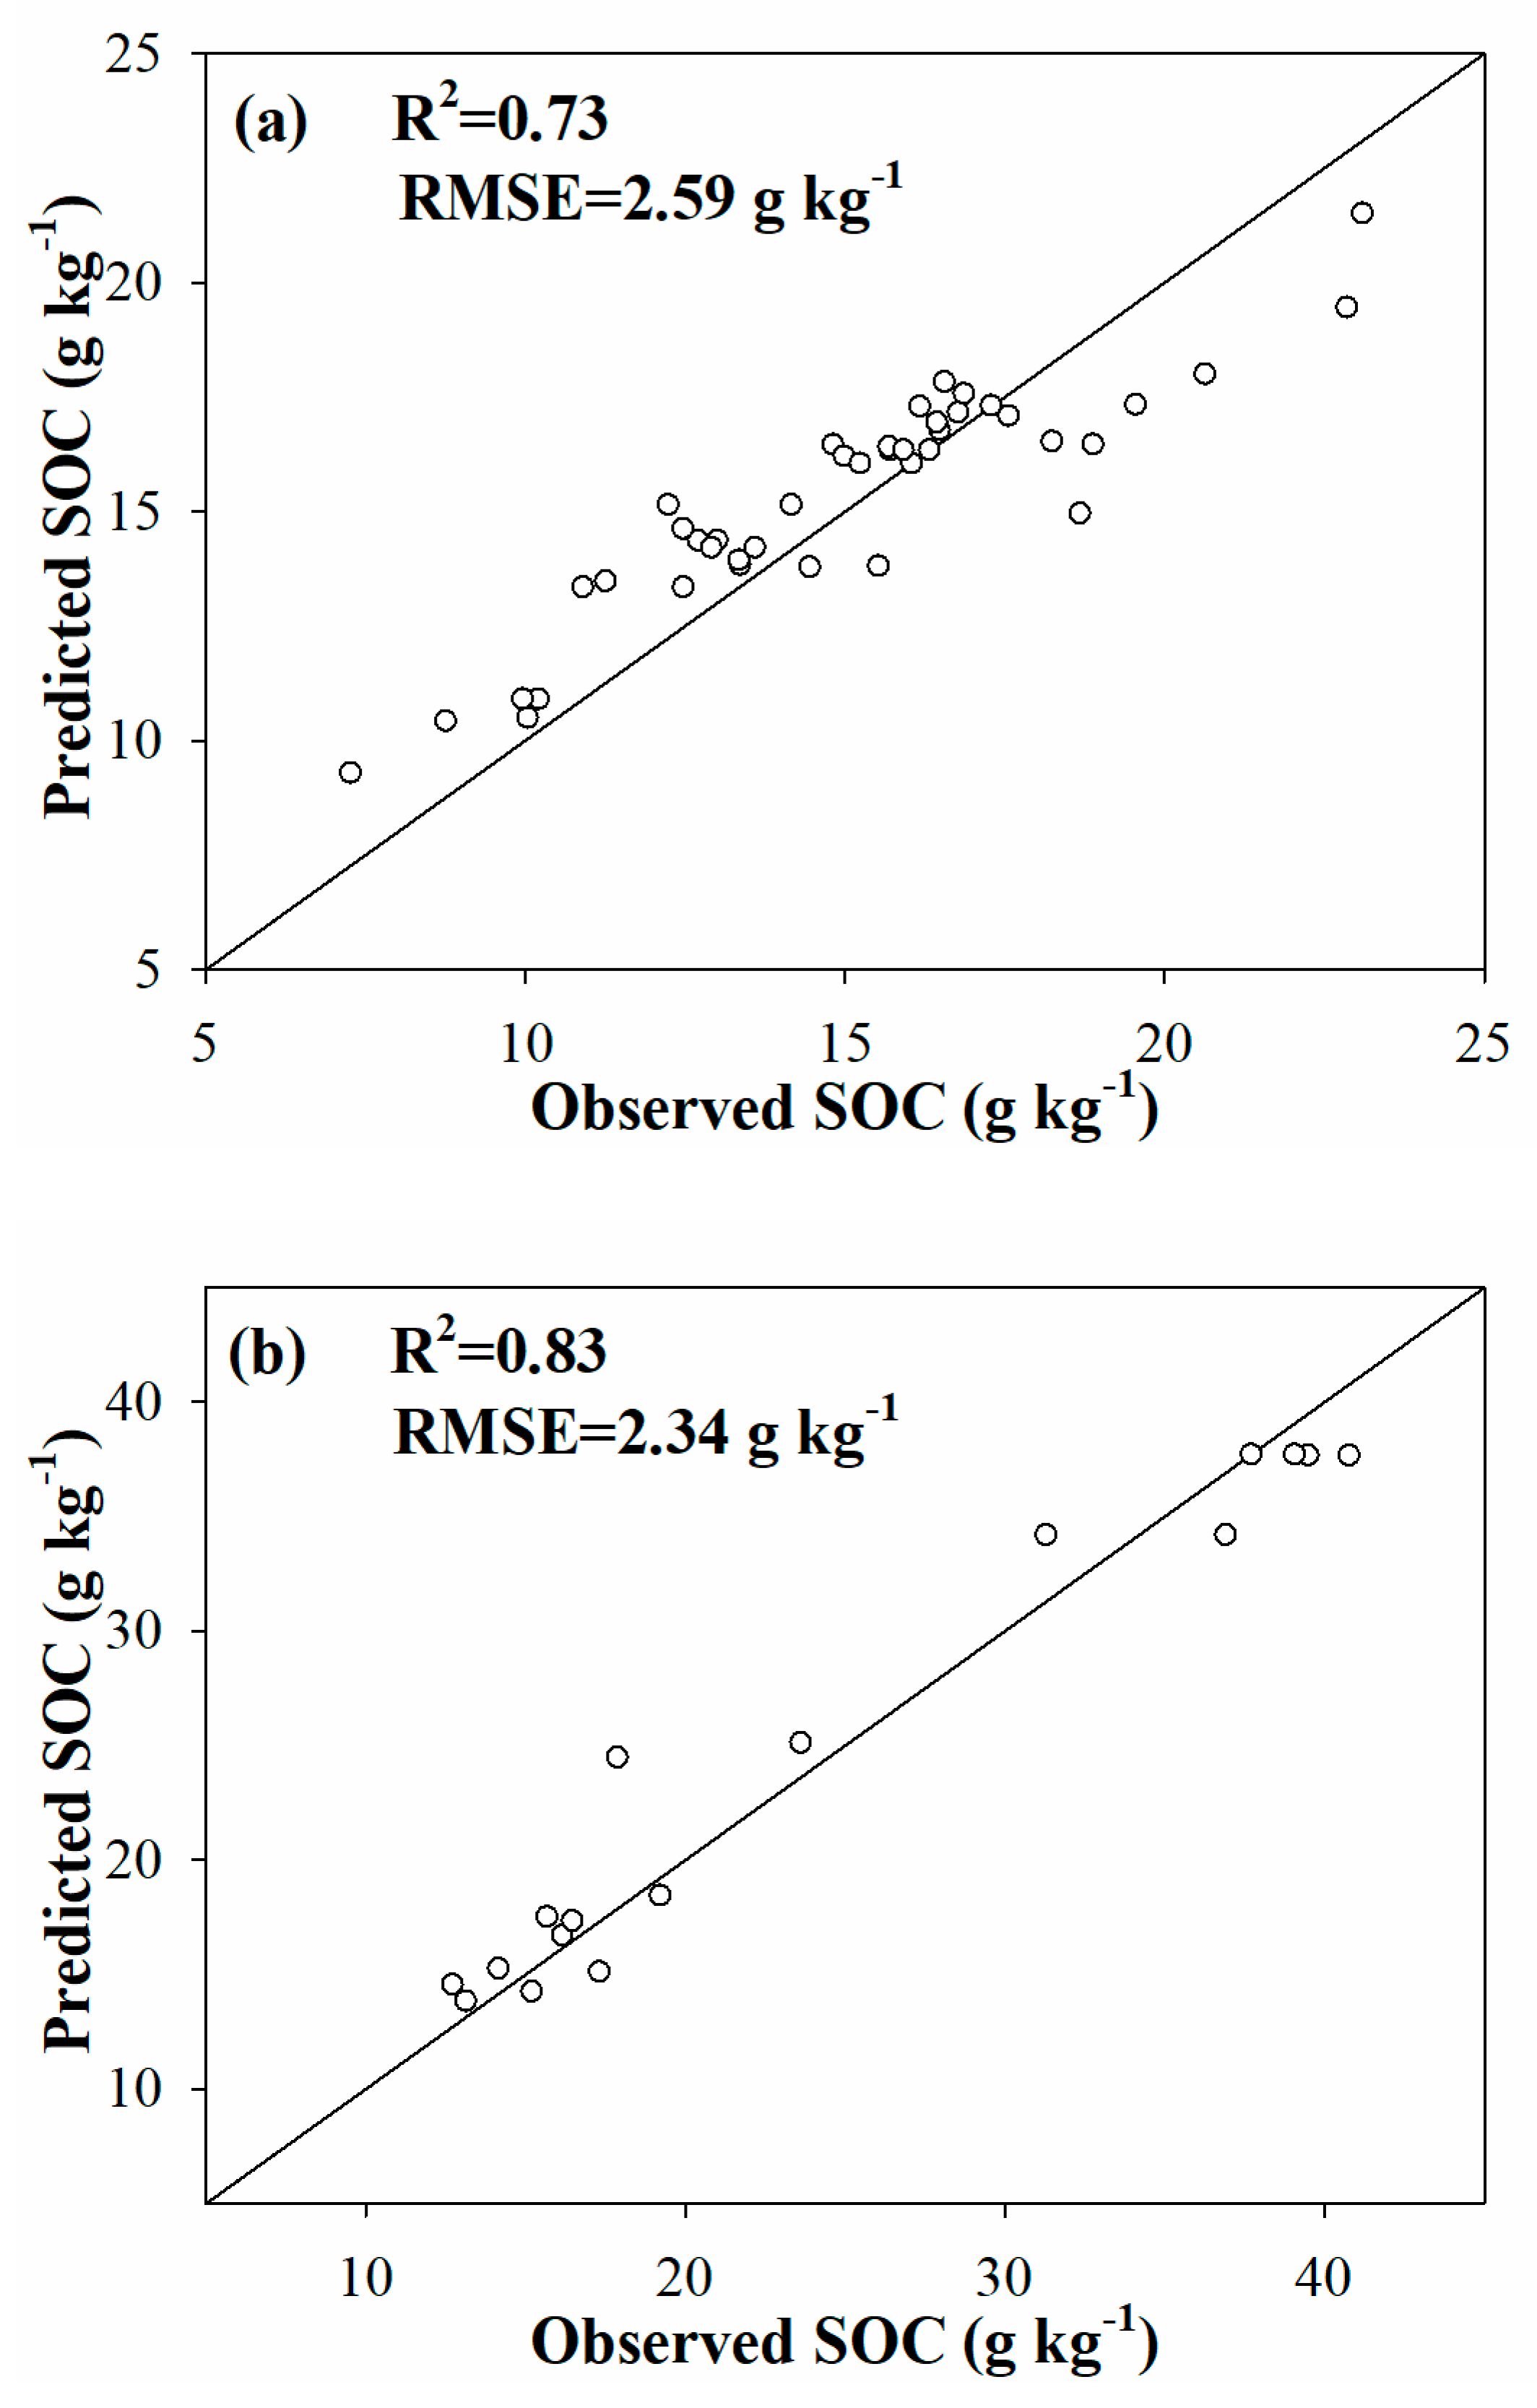

Figure 3.
Relative importance of the environmental factors under different management practices. (a) no tillage (NT), (b) reduced tillage (RT), (c) deep tillage (DT), and (d) straw return (SR).
Figure 3.
Relative importance of the environmental factors under different management practices. (a) no tillage (NT), (b) reduced tillage (RT), (c) deep tillage (DT), and (d) straw return (SR).
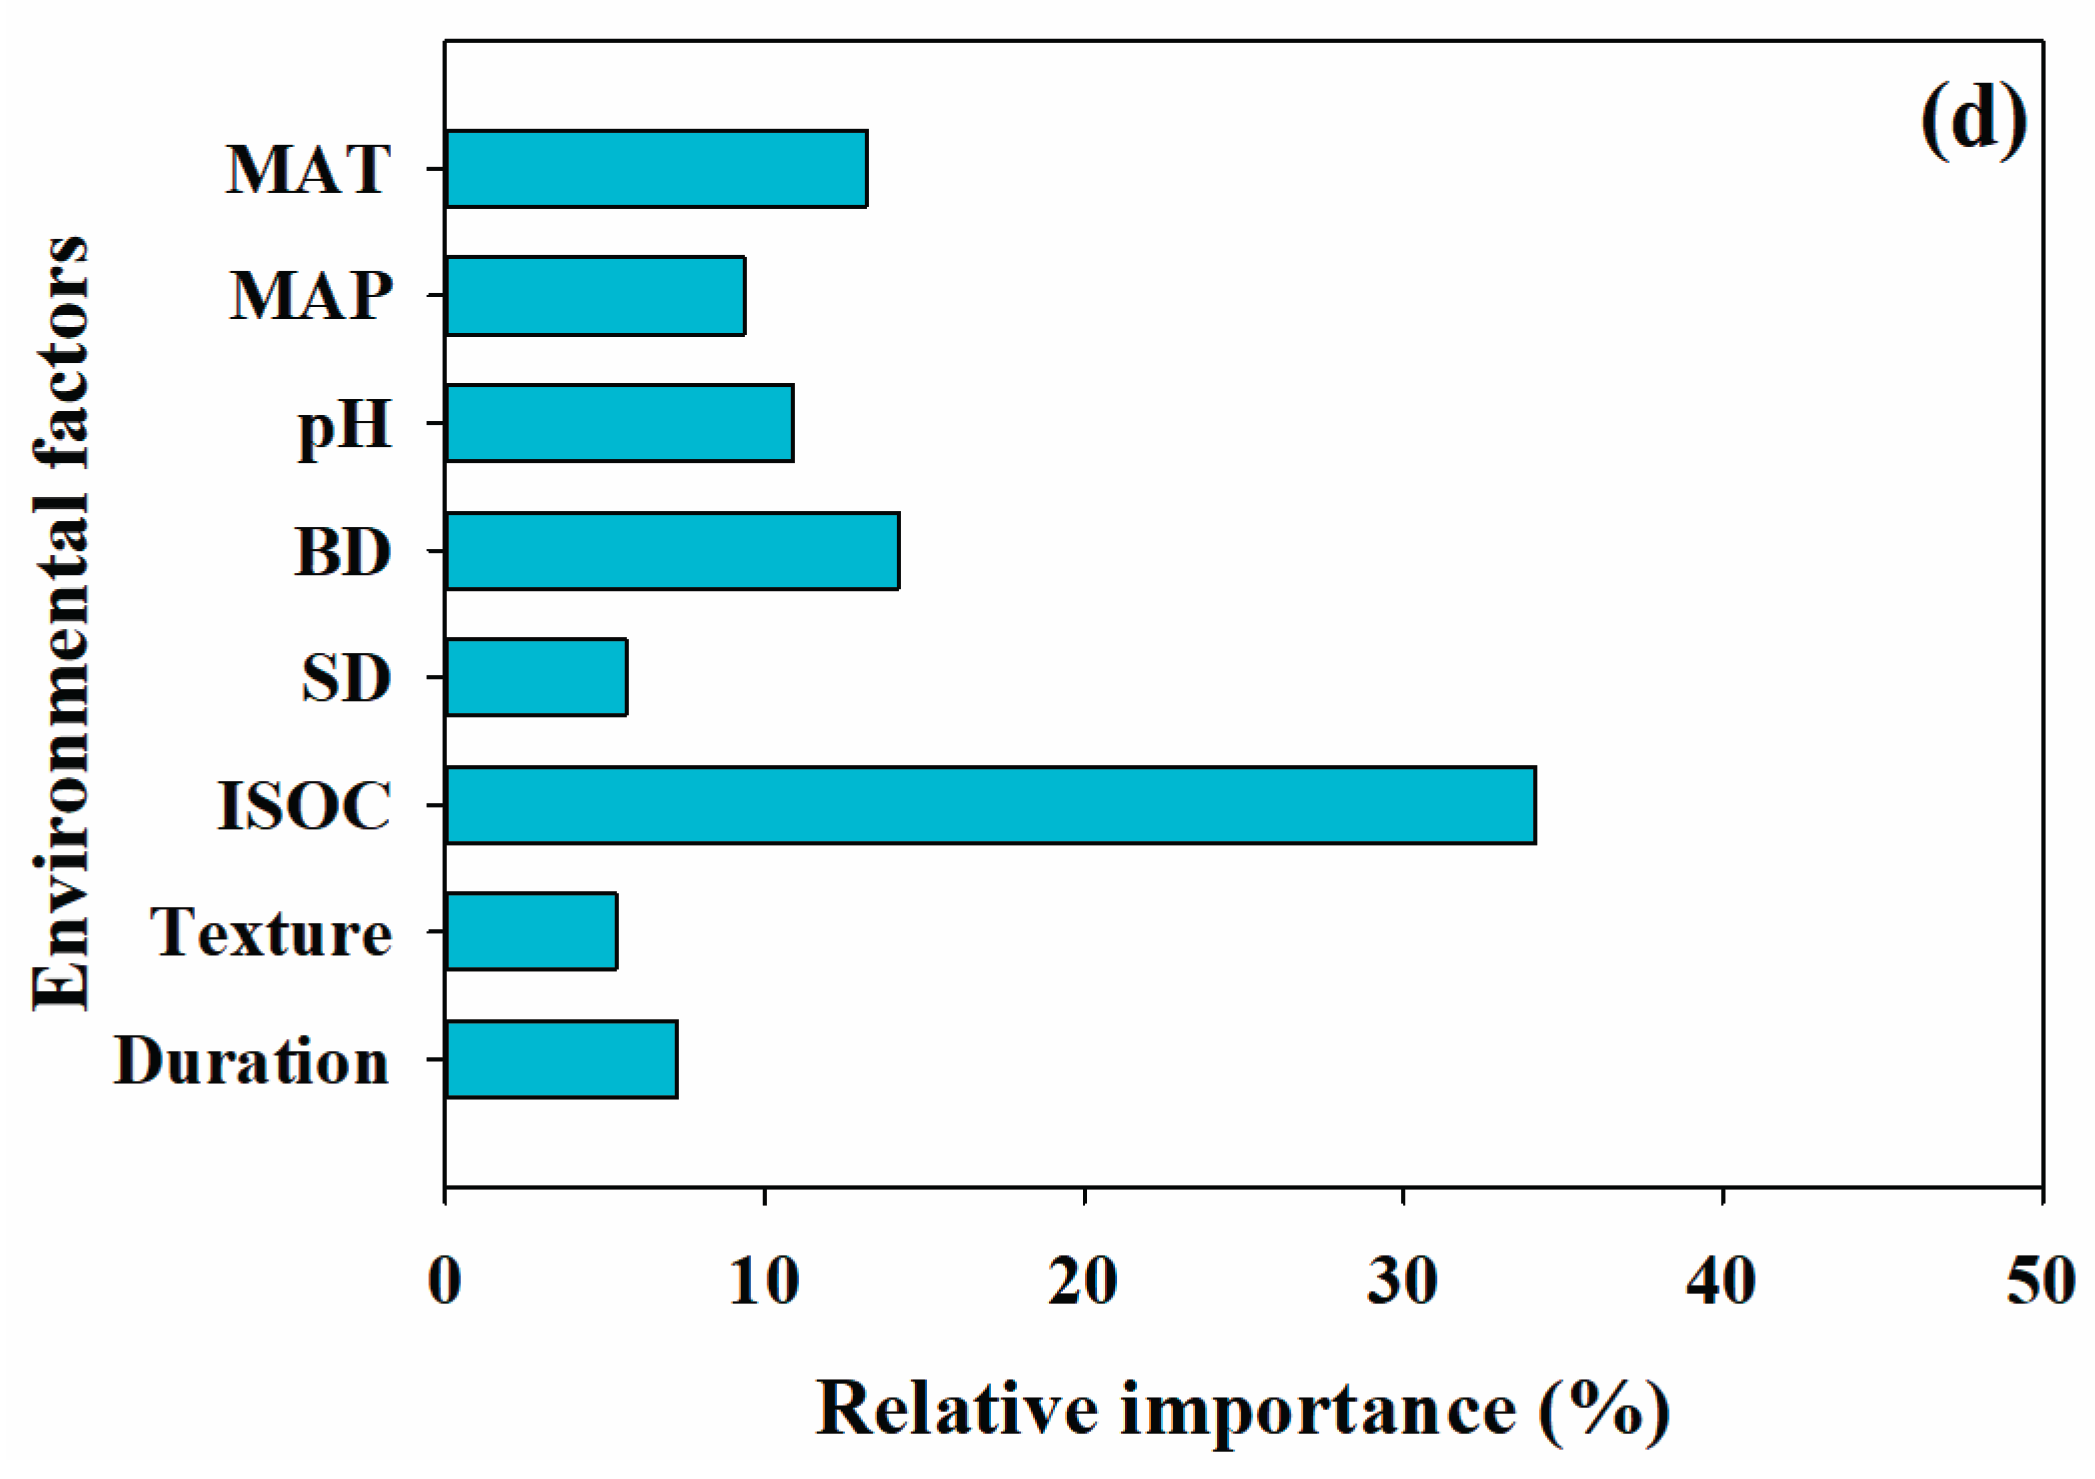

Table 1.
Averaged change in SOC stock and sequestration rate under different conservation practices at 0-20 and 20-40 cm soil depths in Northeast China.
Table 1.
Averaged change in SOC stock and sequestration rate under different conservation practices at 0-20 and 20-40 cm soil depths in Northeast China.
| Conservation practices | Soil depth (cm) | SOC stock (g kg-1) | SOC sequestration rate (g kg-1 yr-1) | ||||
|---|---|---|---|---|---|---|---|
| n | Mean change (%) | SE | n | Mean | SE | ||
| PT to NT | 0-20 | 154 | 8.05 | 1.17 | 154 | 0.28 | 0.08 |
| 20-40 | 35 | 0.16 | 2.06 | 35 | 0.01 | 0.04 | |
| PT to RT | 0-20 | 50 | 7.43 | 1.69 | 50 | 0.41 | 0.11 |
| 20-40 | 20 | 9.37 | 4.40 | 20 | 0.80 | 0.38 | |
| PT to DT | 0-20 | 61 | 4.51 | 1.52 | 61 | 0.31 | 0.18 |
| 20-40 | 24 | 7.28 | 2.71 | 24 | 0.68 | 0.33 | |
| S0 to SR | 0-20 | 380 | 14.17 | 1.56 | 380 | 0.71 | 0.10 |
| 20-40 | 117 | 11.21 | 1.18 | 117 | 0.39 | 0.08 | |
Note: PT, plow tillage; NT, no tillage; RT, reduced tillage; DT, deep tillage; S0, no straw retained; SR, straw return. n represents the pairs of mean and standard deviation values for the data samples; SE, data standard error.
Disclaimer/Publisher’s Note: The statements, opinions and data contained in all publications are solely those of the individual author(s) and contributor(s) and not of MDPI and/or the editor(s). MDPI and/or the editor(s) disclaim responsibility for any injury to people or property resulting from any ideas, methods, instructions or products referred to in the content. |
© 2025 by the authors. Licensee MDPI, Basel, Switzerland. This article is an open access article distributed under the terms and conditions of the Creative Commons Attribution (CC BY) license (http://creativecommons.org/licenses/by/4.0/).
Copyright: This open access article is published under a Creative Commons CC BY 4.0 license, which permit the free download, distribution, and reuse, provided that the author and preprint are cited in any reuse.


