1. Introduction
Atmospheric aerosols are important, though yet uncertain, drivers in modulating the radiation balance of the atmosphere by scattering and absorbing (Sun's short-wave radiation and Earth's long-wave radiation), the so-called "direct aerosol effect" and by acting as cloud condensation nuclei (CCN) or as ice nuclei (IN) and, thus, affecting cloud properties and precipitation (modification of clouds' microphysical properties, lifetime, albedo, precipitation cycle, ice content, etc.), the so called "indirect aerosol effect” [
1,
2,
3,
4]. According to Forster et al. (2021) [
1] climate forcing by both direct and indirect aerosol effects, offsets about a third of greenhouse gas forcing and contributes the largest uncertainty to total anthropogenic forcing. A synopsis of the aerosol direct effect is provided by Haywood and Boucher (2000) [
5].
The Sixth Assessment Report (AR6) of the Intergovernmental Panel on Climate Change (IPCC) [
2] attributes a cooling aerosol effect in the Earth’s effective radiative forcing (ERF) (called in this paper as RF, for simplicity) of the order of –1.3 [–2.0 to –0.6] W m
-2 over the period 1750 to 2014 [
2]. This large uncertainty [–2.0 to –0.6] W m
-2, although reduced in the last years in current estimates of aerosol forcing, arises from the incomplete knowledge concerning the vertical distribution of the physico-chemical properties of aerosols over the globe, as well as the incomplete knowledge on aerosol-cloud interactions, especially the cloud microphysical properties. The aerosol-cloud interaction producing an ERF equal to –0.3 [–0.6 to 0.0] W m
-2) [
2] involves the interactions of aerosol particles with liquid or ice clouds to change the cloud microphysical properties and suppress precipitation [
6,
7], thus, modifying their lifetime and changing their ice content [
8,
9,
10,
11].
The Mediterranean Basin is a crossroad of air masses with different chemical characteristics originating from different sources and continents, where they meet up and mix within the troposphere [
12]. The mountainous sites are often influenced by aerosol sources from the planetary boundary layer (PBL), and/or from long-range transported air masses, thus, an experimental site in these regions may reside within the PBL at certain time periods of the day/season or in the free troposphere (FT) [
13,
14]. Moreover, the African continent, especially the Saharan desert, is considered as the largest dust-producing region in the world [
15,
16]. It is well documented that desert dust aerosols originated from Sahara are frequently lifted in the atmosphere and can be transported over long distances under specific weather conditions [
17,
18]. Similarly, due to large wildfires in the Southern Europe in summer and fall periods, smoke particles may be found in tropospheric air masses over Greece [
19]. Thus, the experimental stations located in the Mediterranean area are frequently influenced by the presence of Saharan dust, smoke or mixed dust-smoke aerosols [
20,
21,
22,
23,
24,
25,
26].
The total direct radiative effect of mineral dust (coarse and fine modes) although updated to −0.11 ± 0.3 W/m
2 [
27], still presents a high uncertainty [
20]. Therefore, it is of particular importance to study the effect of desert dust particles (pure or mixed with other aerosol types) in the Earth radiative budget, by measuring the optical properties of dust aerosols aloft. The lidar technique is a very efficient tool to provide the vertical profiles of the aerosol optical and microphysical properties with very high spatial (typically 7.5 m) and temporal resolution (typically 1-1.5 minutes) up to heights of the order of 6-10 km a.s.l. [
23,
24,
26,
28,
29,
30,
31,
32].
In this paper, we present in
Section 2 the experimental site, the instrumentation and the modelling tools used to follow the evolution of the dust events, while
Section 3 presents the vertical profiles of the aerosol optical properties and the relevant radiative effects of the dusty and smoky air masses passing over our station. Finally,
Section 4 presents our discussion and conclusions.
2. Experimental Site, Instrumentation, and Modelling Tools
The experimental site, the instrumentation and the modelling tools are presented in the following subsections.
2.1. Experimental Site
The data presented in this paper were obtained in the frame of a short experimental campaign (23-30 September 2021) within the National Research Network for Climate Change and Its Effects – CLIMPACT project, which is an interdisciplinary consortium comprising of 28 members from the academic and research communities in Greece and Cyprus. This consortium is dedicated to addressing issues related to Climate Change (CC) and the associated climate risks, natural disasters, as well as social and economic impacts (
https://climpact.gr, last accessed on 15 September 2025).
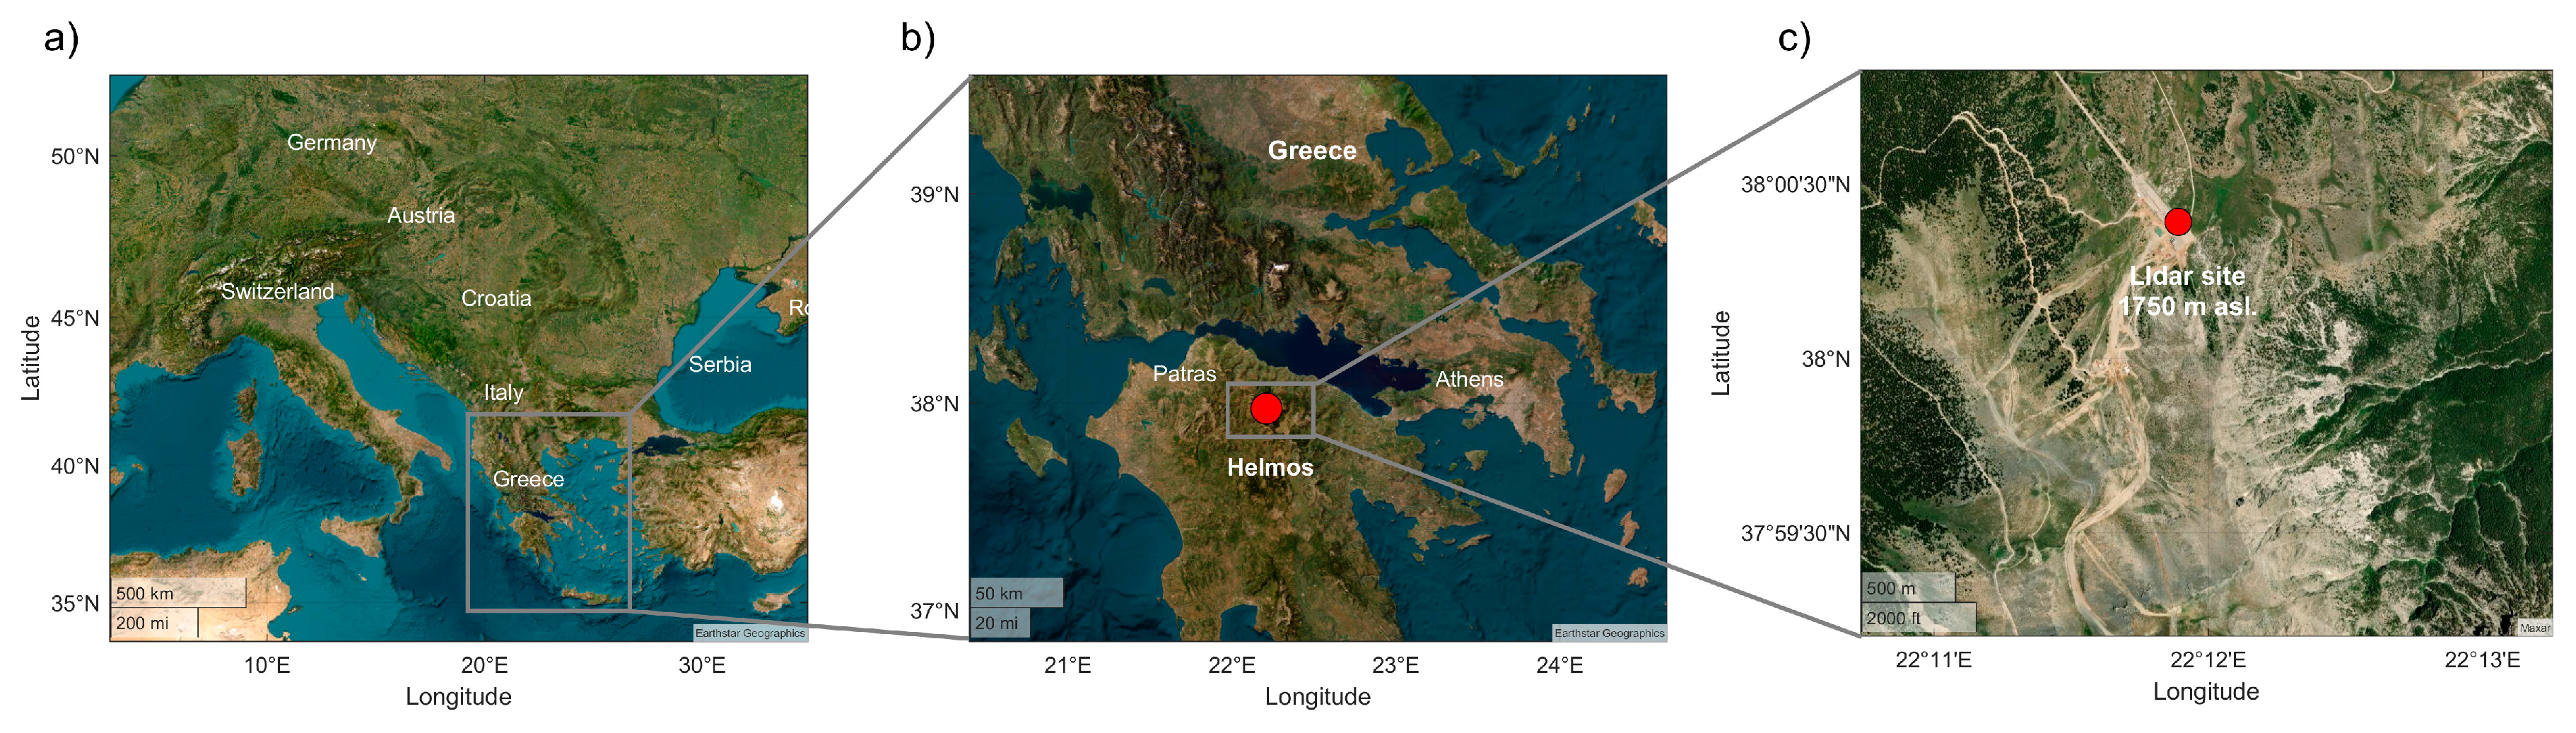
This experimental campaign was organized at a remote site located at the Helmos (Aroania) mountain at the Kalavryta ski center (KSC) at an altitude of 1750 m a.s.l., (37.984° N, 22.1969° E) nearby the Helmos Atmospheric Aerosol and Climate Change Station (HAC)
2 permanent research station (cf.
Figure 1) [
14]. This site lies in the crossroads of air masses coming from different near- and long-range aerosol sources (continental, Saharan desert, and biomass burning areas, etc.) [
8,
13,
33].
2.2. NTUA Mobile Lidar System
The mobile single-wavelength (532 nm) depolarization Aerosol lIdAr System (AIAS) was deployed at the KSC from 23 to 30 September 2021. AIAS is based on a Nd:YAG laser emitting linearly polarized pulses of 98 mJ at 532 nm with a 10 Hz pulse repetition rate. The elastically backscattered lidar signals at 532 nm are collected by a 200 mm diameter Cassegrainian telescope and separated into parallel and vertical components before being fed to photomultiplier tubes (PMTs) and then digitized using a combination of analogue and photon-counting signal digitizers. The spatial vertical resolution is equal to 7.5 m and the temporal resolution of the acquired lidar signals is 1.5 min. The full overlap height of AIAS is reached at 250 m above ground level (a.g.l.). The technical characteristics of the AIAS lidar system, which is designed in compliance with EARLINET quality assurance tests and standards [
34], are provided by Papayannis et al. (2020) [
35] and Mylonaki et al. (2021) [
36]. The altitude range sampled by AIAS, over ground, was between 400 and 6000 m, covering the Planetary Boundary Layer and the lower free troposphere [
10]. The spatio-temporal evolution of the vertical profiles of the aerosol optical properties was captured by AIAS to provide the aerosol backscatter coefficient (b
aer) and the particle linear depolarization ratio (PLDR) at 532 nm. The collected data are processed using the Single Calculus Chain (SCC), the centralized processing tool developed within EARLINET/ACTRIS [
37].
2.3. METAL-WRF Dust Modelling
The atmospheric conditions and the transport of dust towards the experimental site are simulated with METAL-WRF model [
38]. This model is an extended version of WRF-Chem, that includes also separate prognostic variables for 9 different dust minerals (illite, kaolinite, smectite, calcite, quartz, hematite, feldspar, gypsum, and iron). The emission of dust particles is parameterized by the GOCART-AFWA scheme [
39], including the parameterization of gravitational settling and wet scavenging of dust. The dust particles are represented in five size bins with effective radii of 0.73, 1.4, 2.4, 4.5 and 8 μm, respectively. More details on the model development can be found in Solomos et al. (2023) [
38]. The horizontal grid space of the model is set at 12 km × 12 km, with 32 vertical hybrid-sigma levels stretching from the surface to the top of the atmosphere (50hPa). The initial and boundary conditions are provide by the ERA5 reanalysis dataset [
40] and the simulation period is from 20 to 30 September 2021. The physical parameterizations for the model runs are shown in
Table 1.
2.4. MODIS Satellite
The Moderate Resolution Imaging Spectroradiometer (MODIS) on-board the Terra and Aqua satellites is an operational satellite sensor which, among others, provides Aerosol Optical Depth (AOD) retrievals at 500 nm twice daily (under cloud-free conditions) on a near–global basis with high spatial resolution over ocean and land [
50]. Besides AOD, MODIS provides additional aerosol parameters (e.g., Ångström exponent, refractive index), which will not be used in the frame of this paper. Their retrieval is more precise over dark surfaces (in visible wavelengths) over land [
51] and ocean [
52].
2.5. HYSPLIT Air Mass Trajectory Model
The Hybrid Single-Particle Lagrangian Integrated Trajectory model (HYSPLIT), developed by NOAA’s Air Resources Laboratory (ARL) (
https://www.ready.noaa.gov (accessed on 15 September 2025) [
53], was used to retrieve the atmospheric transport of the Saharan dust particles over our experimental site. For the analysis of the air mass backward trajectories, we used the “normal” method, along with the GDAS1 (Global Data Analysis System) meteorological data. The vertical motion used to calculate the trajectories was the model vertical velocity. The initial values used to run the model were the coordinates of the AIAS lidar system at the Helmos site (cf. sub-section 2.1) and the altitude (asl.) of the dust and smoke aerosol layers observed. The duration of the backward air mass trajectories was set to 120 h, a typical duration characterizing dust air masses in the Eastern Mediterranean region [
24].
2.6. LibradTran Radiative Transfer Model
The shortwave (SW, 280–2500 nm) and longwave (LW, 2.5–40 µm) irradiances at the top-of-atmosphere (TOA) and the bottom-of-atmosphere (BOA) levels have been simulated using the libRadtran radiative transfer model version 2.0.2. [
54] based on the the
uvspec program which calculates the radiation field in the Earth's atmosphere using
disort radiative transfer equation. A set of four simulations was carried out per case of the studied dust events: The first set (SW-LW) of calculations was necessary to estimate clear-sky conditions with background/baseline aerosol conditions (rural type aerosol inside the boundary layer, background aerosol above 2 km, and a visibility of 50 km). The second set of simulations corresponds to the aerosol-loaded atmosphere, where the vertical profiles of the aerosol layers were used as additional inputs. The following equations apply:
where, ΔF, is the difference between the downwelling and upwelling flux, F↓ and F↑ (net flux) at a height z.
Therefore, the radiative forcing (RF) and the net radiative forcing (NRF) can be estimated as follows:
In the following sections we focus on two long-range transport events of Saharan dust particles occurred in the period 27-30 September 2021: the first of pure Saharan dust (27.09.2021) and the second of desert dust mixed with biomass burning particles (30.09.2021).
3. Observations – Experimental results
3.1. Synoptic Meteorological Conditions of the Dust Event (27-30 September 2021)
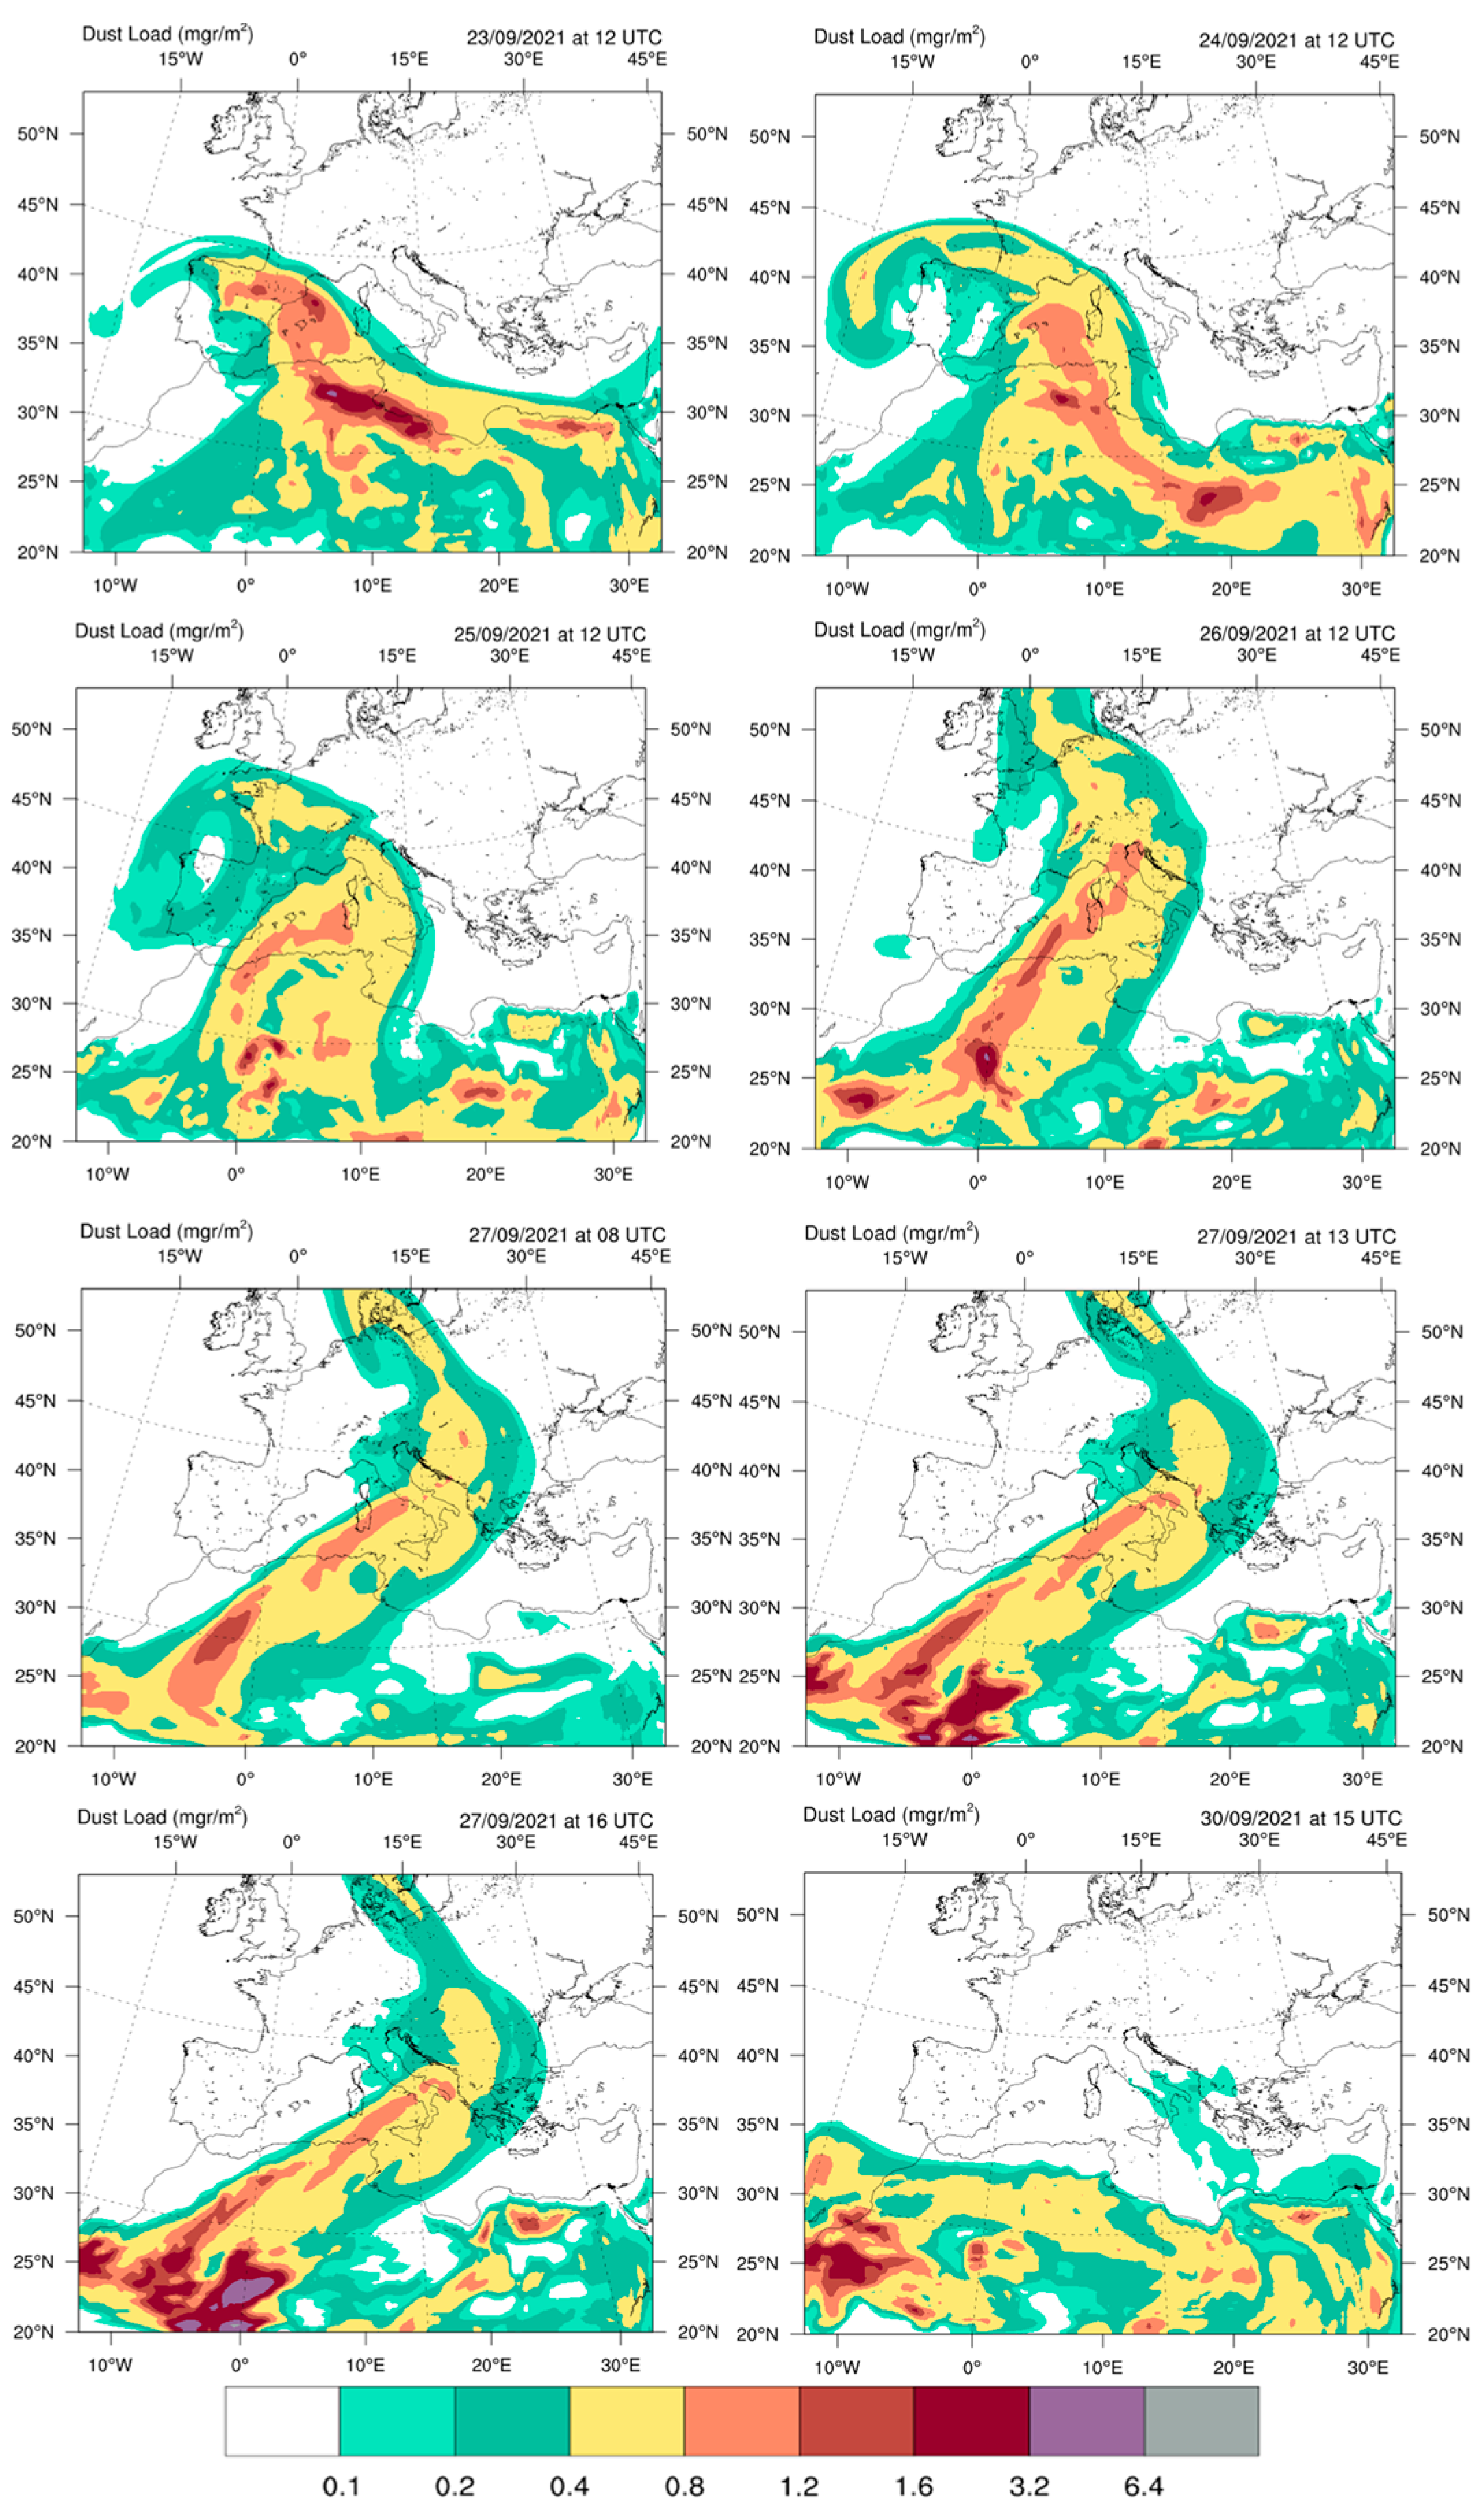
The synoptic situation during the study period is described by the METAL-WRF results, regarding the meteorological fields and the dust parameters. The main reason for Saharan dust mobilization and transport towards Europe was the establishment of a persisting anticyclone over the central Mediterranean throughout the modeling period. As shown in
Figure 2, the dust plume was not directly advected from Africa towards Greece and Helmos station. Rather, it was initially transported from the western parts of the Saharan desert, then travelled towards Spain, France, and Italy (23-26 September 2021) and moved eastwards towards Greece on 27-30 September 2021, when it was detected at Helmos station.
3.2. HYSPLIT Backward Trajectory Analysis (27 and 30 September 2021)
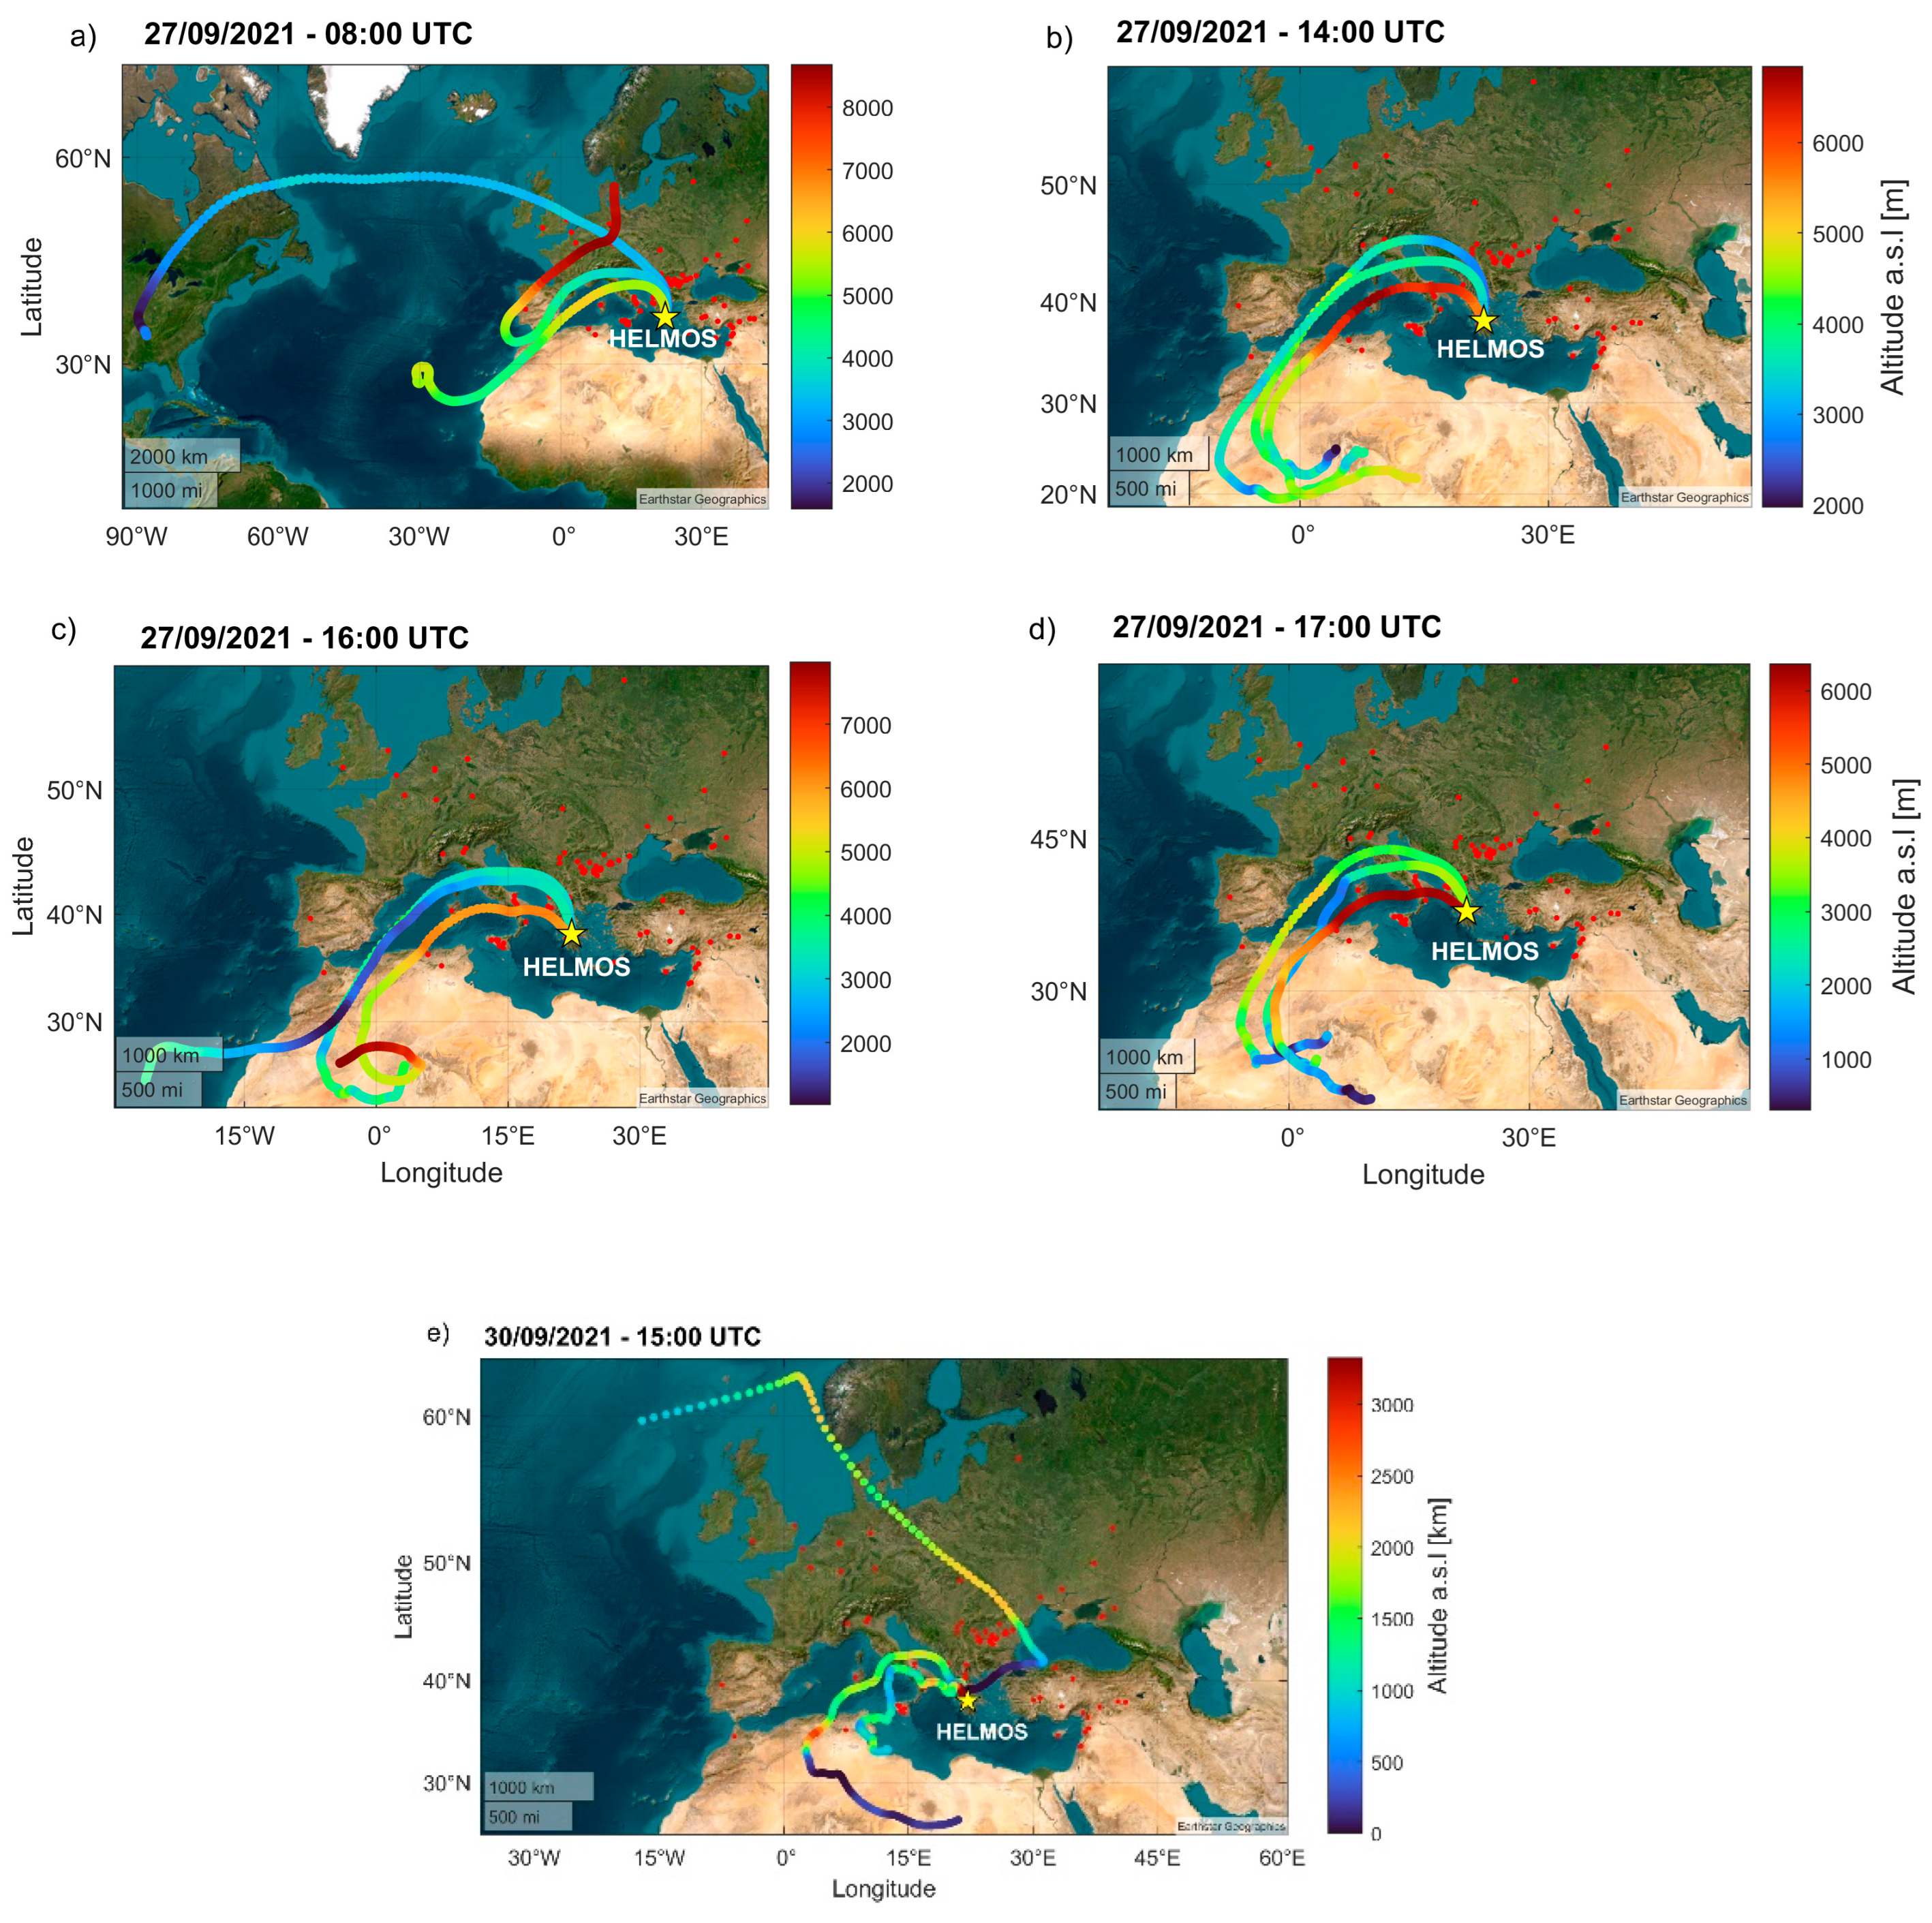
The trajectories of the sampled air masses arriving Helmos (denoted by a yellow asterisk in
Figure 3) were also verified using an air mass backward trajectory analysis based on the HYSPLIT model (
https://www.ready.noaa.gov, last access: 15 September 2025) for 27 and 30 September 2021. As shown in
Figure 3a, the air masses which arrived over Helmos on 27 September at 08:00 UTC had two main characteristics: the long-range ones which arrived at ~4 km height (a.s.l.) (cf. Fig. 3a, dark magenta color) originated from the eastern United States of America 192 hours before; the near-range ones mainly followed a similar pattern, due to a persisting anticyclonic system established over the central Mediterranean region, as shown in
Section 3.1. Thus, the air masses off the western Saharan region were advected over Spain, southern France, overpassing Italy before arriving over Helmos between 4 and 6 km height (cf. Fig. 3a). Later on the same day (14:00-17.00 UTC) the anticyclonic system shifted to north-eastern latitudes having as source region the central-western Saharan deserst. The dust plume raised at ~4.5-6 km height a.s.l. during its overpass over the Mediterranean Sea, mainly for the air masses arriving at 14:00 and 17:00 UTC over Helmos on 27 September (cf.
Figure 3b,
Figure 3d).
Concerning the air masses arriving over Helmos between ground and 2.9 km height a.s.l. on 30 September at 15:00 UTC, they originated from the Atlantic Ocean, east of Greenland, then they overpassed Central Europe, the Balkans and Turkey, within heights below 2 km, being enriched with smoke particles from wildfires in Romania (cf. red dots in
Figure 3e). The air masses arriving around 3.5 km height a.s.l. at the Helmos site, on the same day and hour, they had previously overpassed the Saharan desert, within heights below 500 m, being enriched with desert aerosols (cf.
Figure 3e).
3.3. MODIS Satellite Data
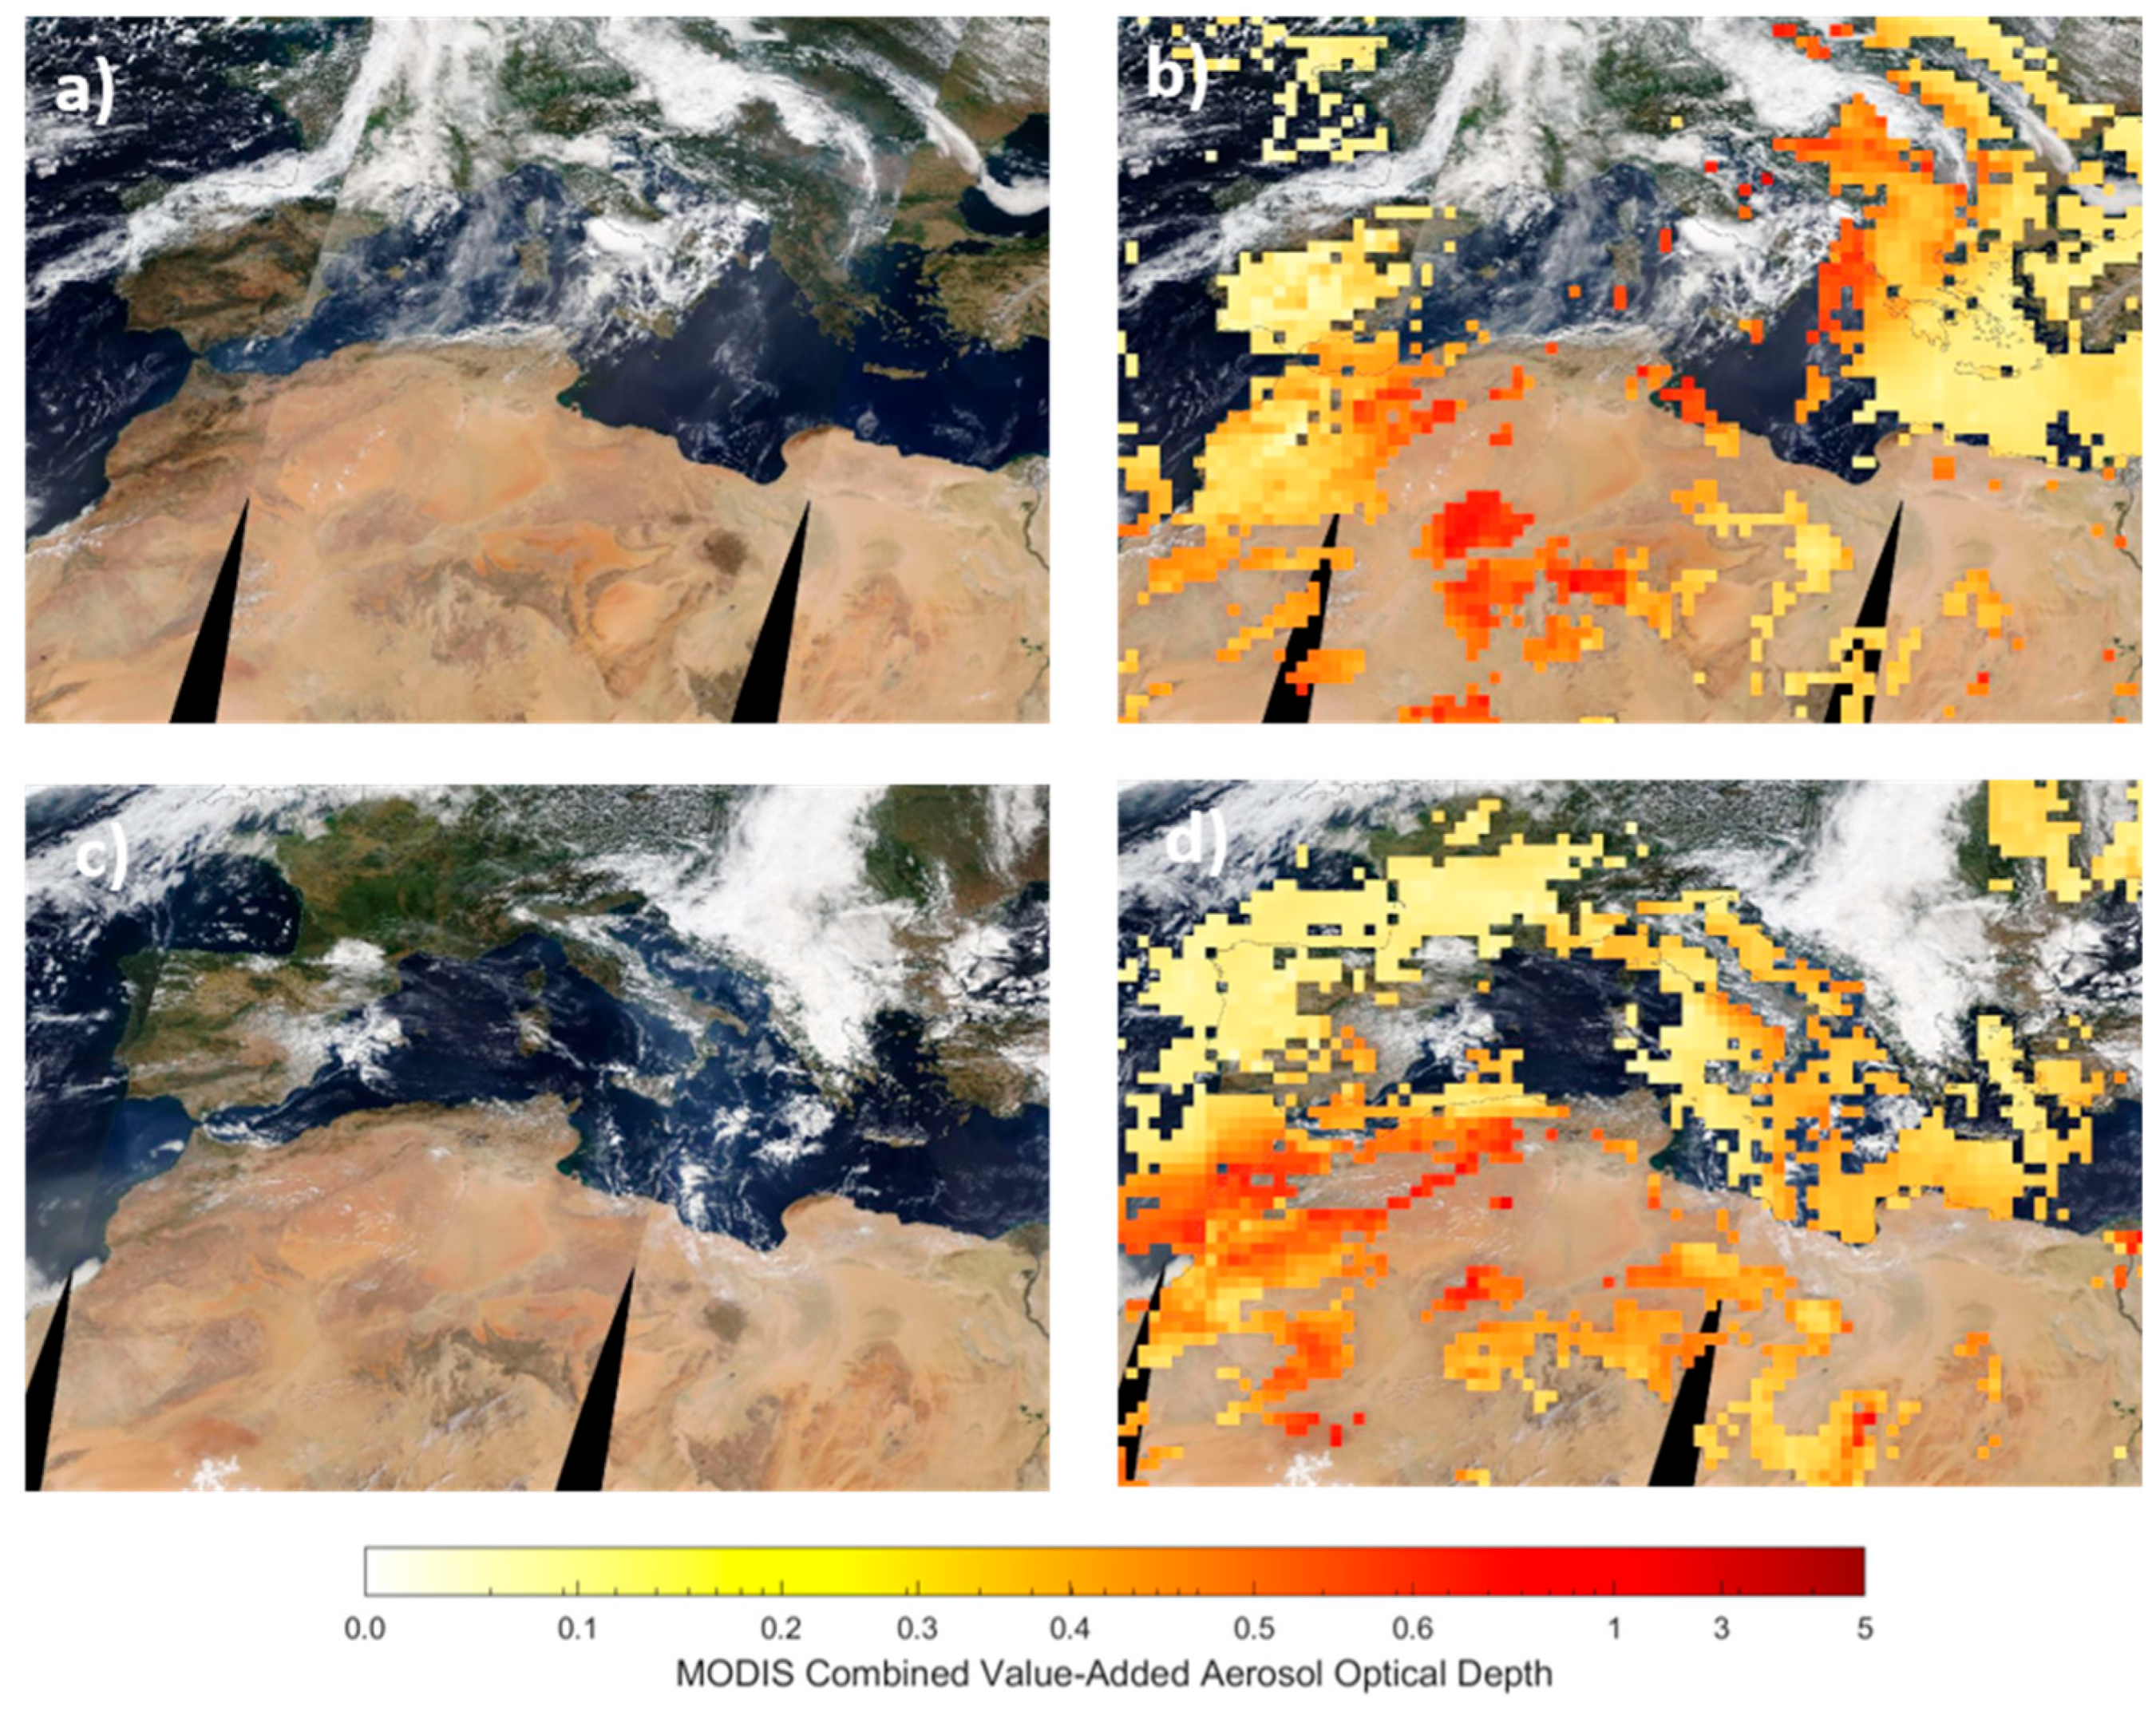
Figure 4 presents the MODIS “True Image” alongside the Combined Value-Added Aerosol Optical Depth normalized at 550 nm (AODMODIS) product from both Terra and Aqua satellites for the two selected days of the dust event (27 and 30 September 2021). The color scale layering represents the values of AODMODIS at 500 nm, in the scale of 0 (yellow) to 5 (dark red). During 27 September the MODIS AODMODIS values over Helmos were around 0.1–0.2 ((
Figure 4a-d) and similar ones (0.5-0.1) on 30 September.
3.4. Laser Aerosol Remote Sensing Observations
3.4.1. Case 1 - Saharan Dust Transport Event (27/09/2021)
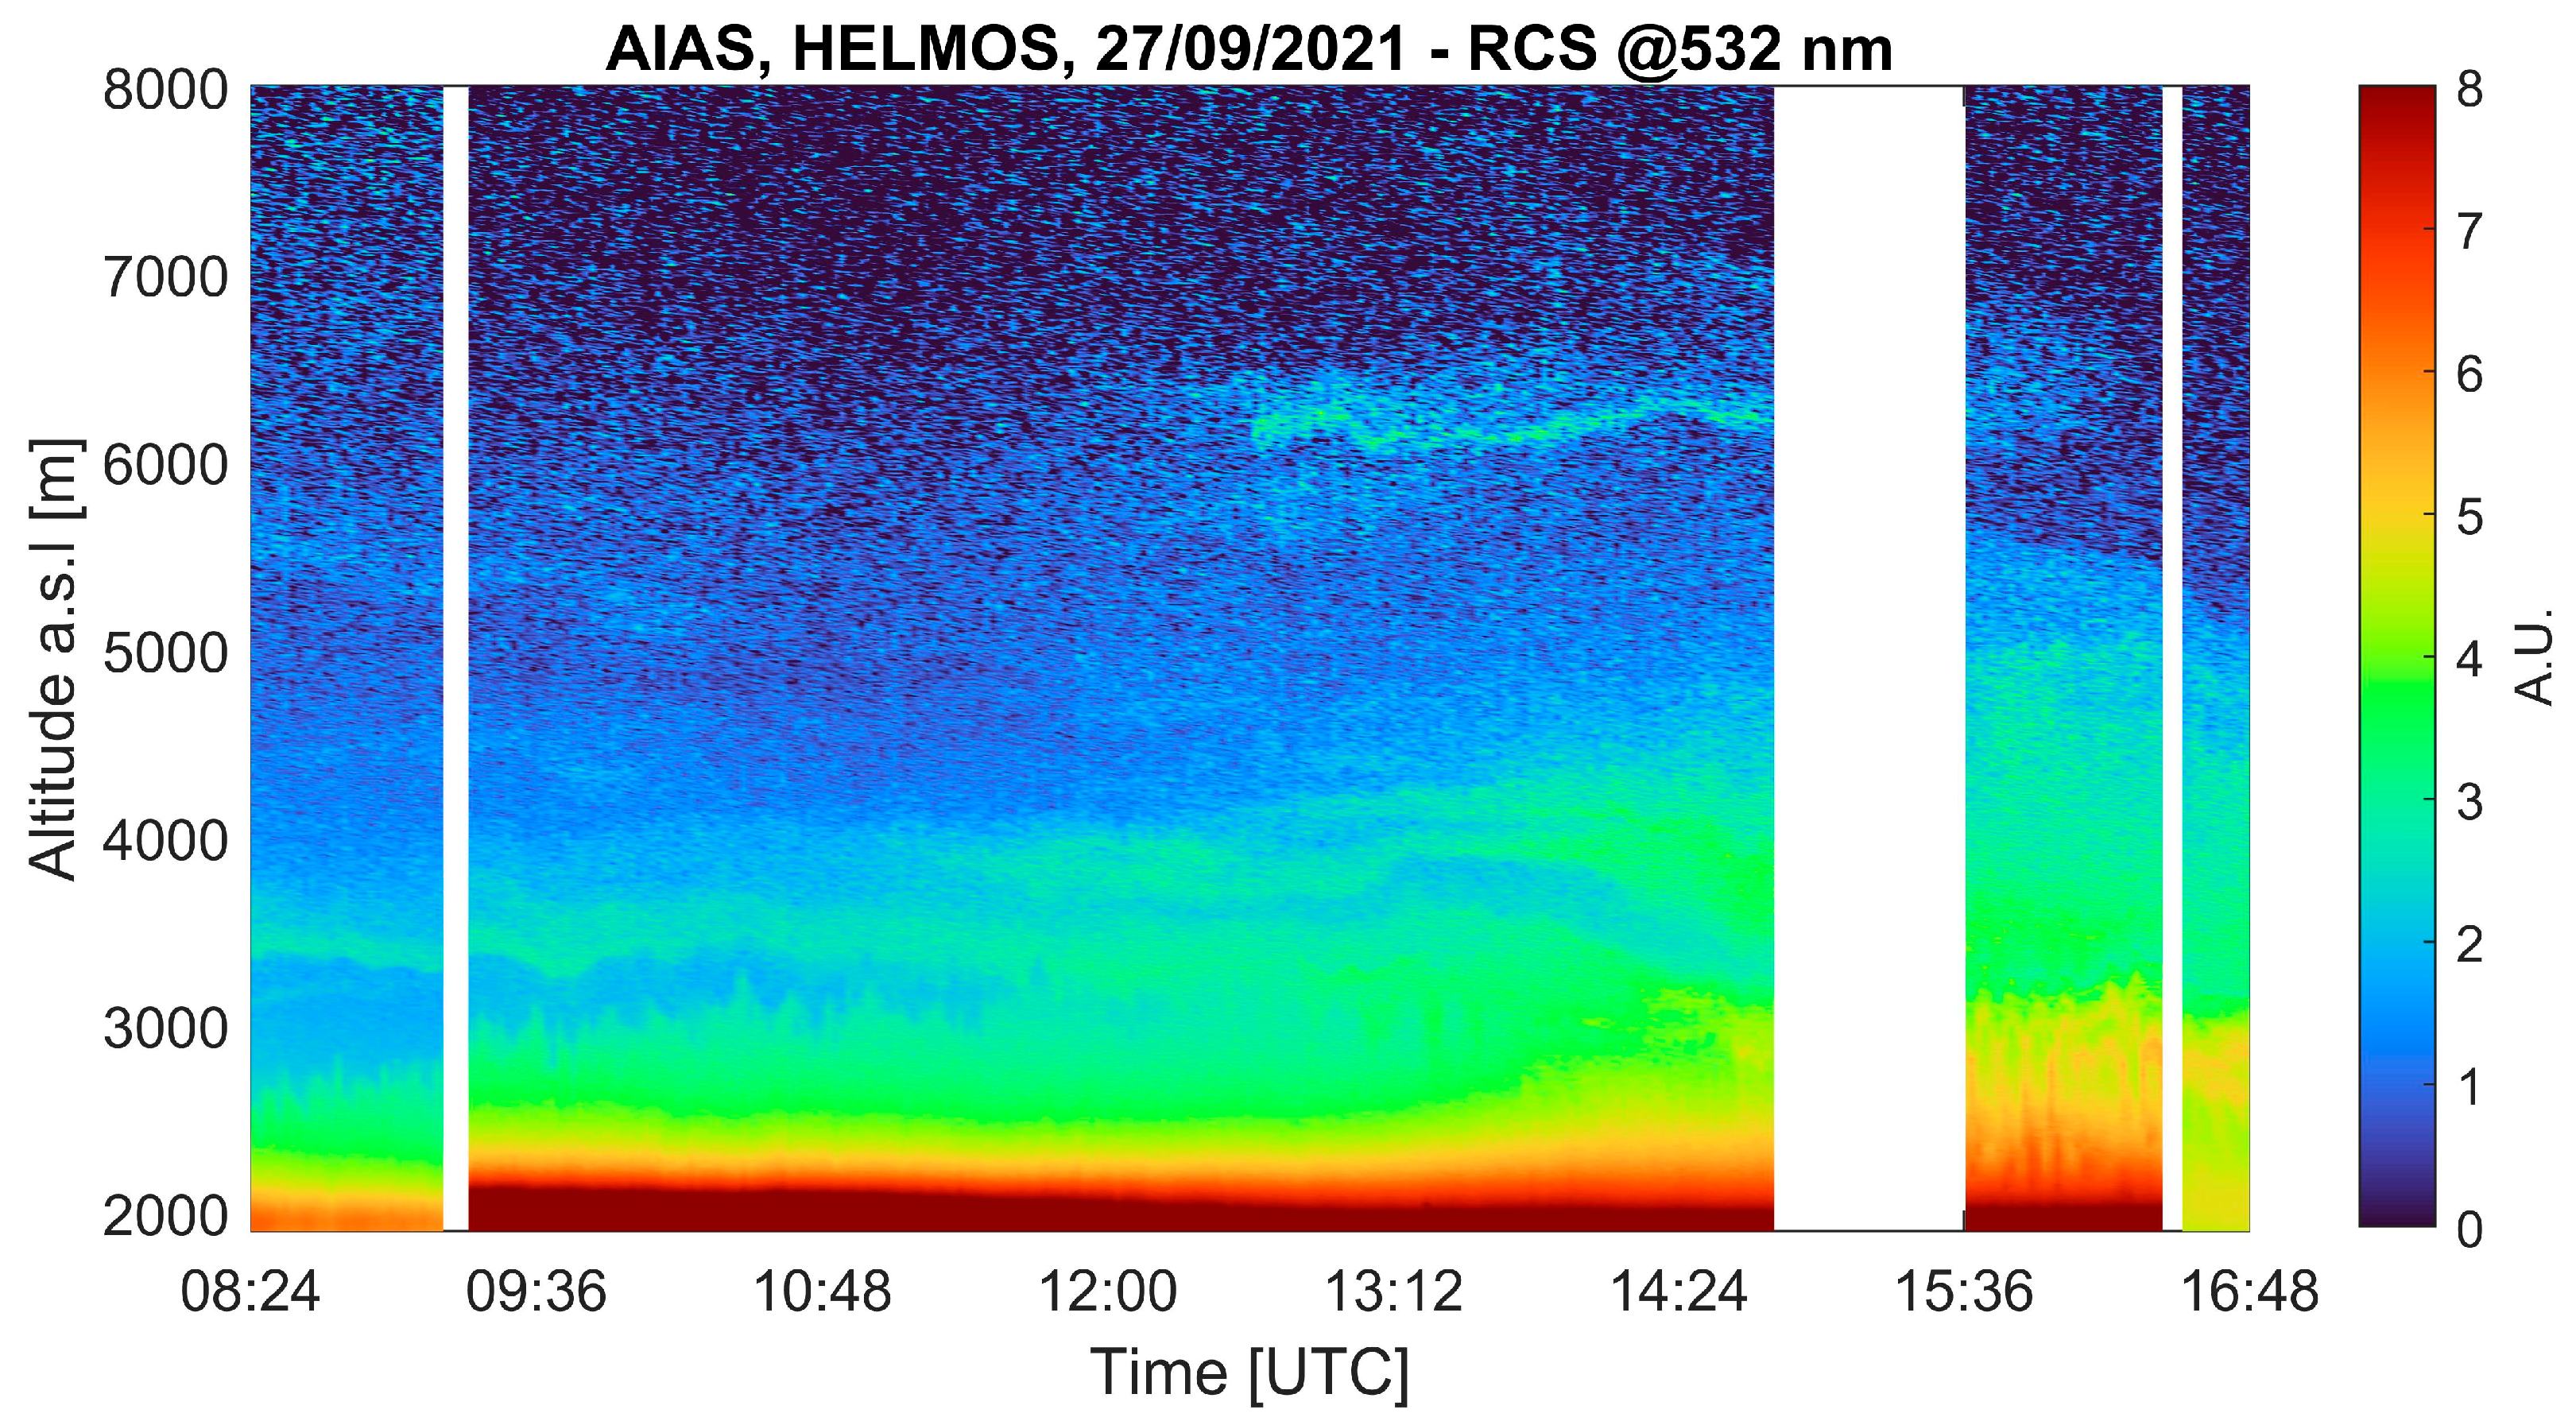
Figure 5 presents the spatio-temporal evolution of the range-corrected lidar signal (RCS) at 532 nm, retrieved on 27 September 2021, from ground up to ~6.0 km a.s.l.
Between 08:24 and 09:00 UTC, two distinct aerosol layers were observed above the planetary boundary layer (PBL), the first extending from ~2.0 to 2.5 km and the second from ~2.5 to 3.0 km. During the same period, a light transient layer appeared near the PBL top. In addition, a thin elevated aerosol layer was also detected at ~3.5 km, while scattered, faint aerosol layers were observed above ~4.0 km, most likely associated with lofted Saharan dust transported in the free troposphere. As the day continued, the layer near 3.5 km became denser and more enhanced. Around 12:00 UTC, this layer split into two thinner ones; one remaining at ~3.5 km and the other rising toward ~4.0 km. Simultaneously, at ~12:30 UTC, the previously diffuse aerosols above ~6.0 km began to consolidate into a very thin, well-defined layer. By 15:30 UTC, the two mid-tropospheric layers (~3.5 and 4.0 km) merged and ascended, forming an extended layer from ~3.0 to 5.5 km. Meanwhile, the lower layer between 2.5 and 3.0 km remained persistent throughout the day. Toward the evening (~17:00 UTC), the elevated aerosol layers exhibited a gradual descent, marking the transition toward local nighttime and possibly indicating the onset of stratification and descend.
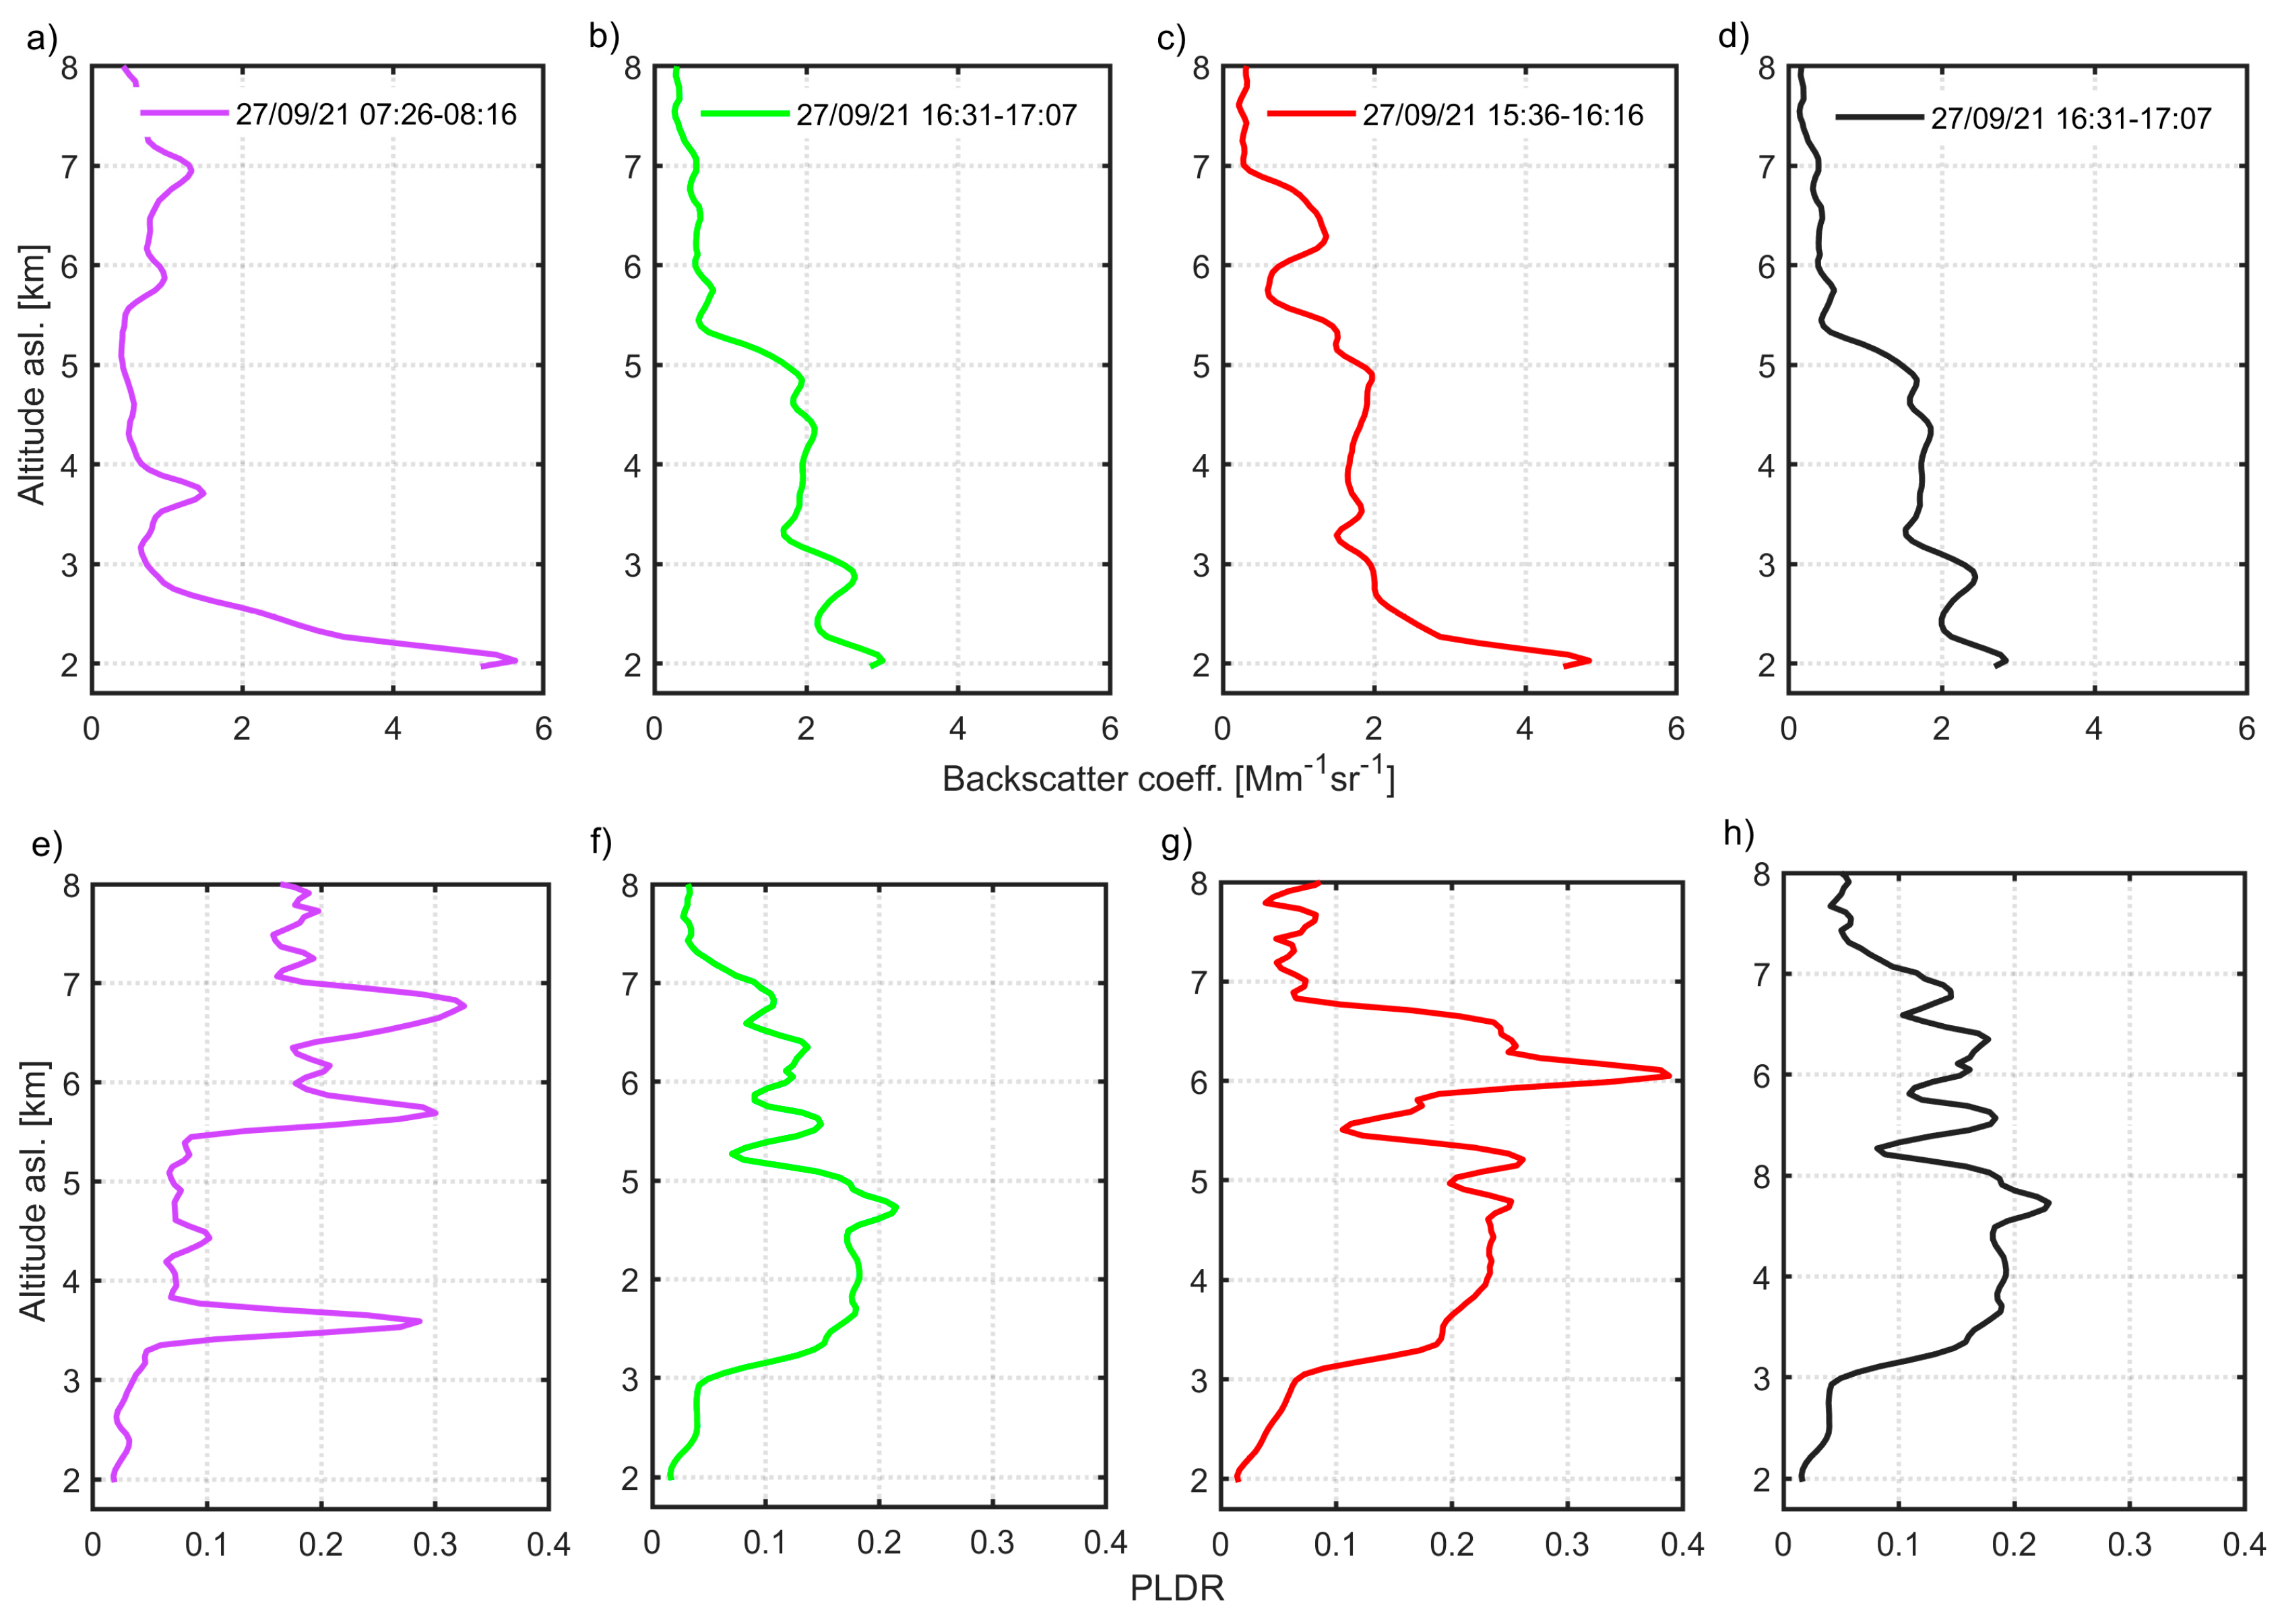
Figure 6 presents the vertical profiles of the aerosol backscatter coefficient β at 532 nm (a–d) and the corresponding particle linear depolarization ratio (PLDR; e–h) for four temporal intervals on 27 September 2021: (a) 07:26–08:16, (b) 13:00–14:00, (c) 15:36–16:16, and (d) 16:31–17:07 UTC. The aerosol backscatter profiles reveal the presence of multiple aerosol layers between ~3 and 6.5 km throughout the day, consistent with the structure shown in
Table 2. The increased PLDR values (0.2 to 0.4) at altitudes between 3.5 and 7.0 km height a.s.l. (07:26-14:00 UTC) indicate the clear presence of non-spherical particles, likely desert dust, along that day (
Figure 6e,f). Later that day (15:36-17:07 UTC), the PLDR values ranged between 0.2-0.3 (
Figure 4g,h), suggesting a gradual decrease of the intensity of the dust event at the same altitude heights.
Table 2 summarizes the geometrical and mean optical properties of three aerosol layers observed on 27 September 2021 at 15:36-16:16 UTC. The first layer was located between 2.92 and 3.70 km, with a center of mass (CoM) at 3.30 km. The second layer extended from 3.70 to 4.30 km (CoM at 4.02 km), while the third was observed higher in the atmosphere, spanning from 5.44 to 6.80 km with a CoM at 6.13 km. The aerosol backscatter coefficient (β
aer) ranged from 1.02 ± 0.14 Mm
-1 sr
-1 in the lower layer to 0.85 ± 0.47 Mm
-1 sr
-1 in the uppermost one, indicating a slight decrease in aerosol load with height. The particle linear depolarization ratio (PLDR) increased with altitude from 0.11 ± 0.03 in Layer 1 to 0.32 ± 0.13 in Layer 3 suggesting an increasing presence of non-spherical particles, indicating a strong contribution of mineral dust aerosols in the upper layers.
3.4.2. Case 2 - Saharan Dust Mixed with Biomass Burning Particles (30/09/2021)
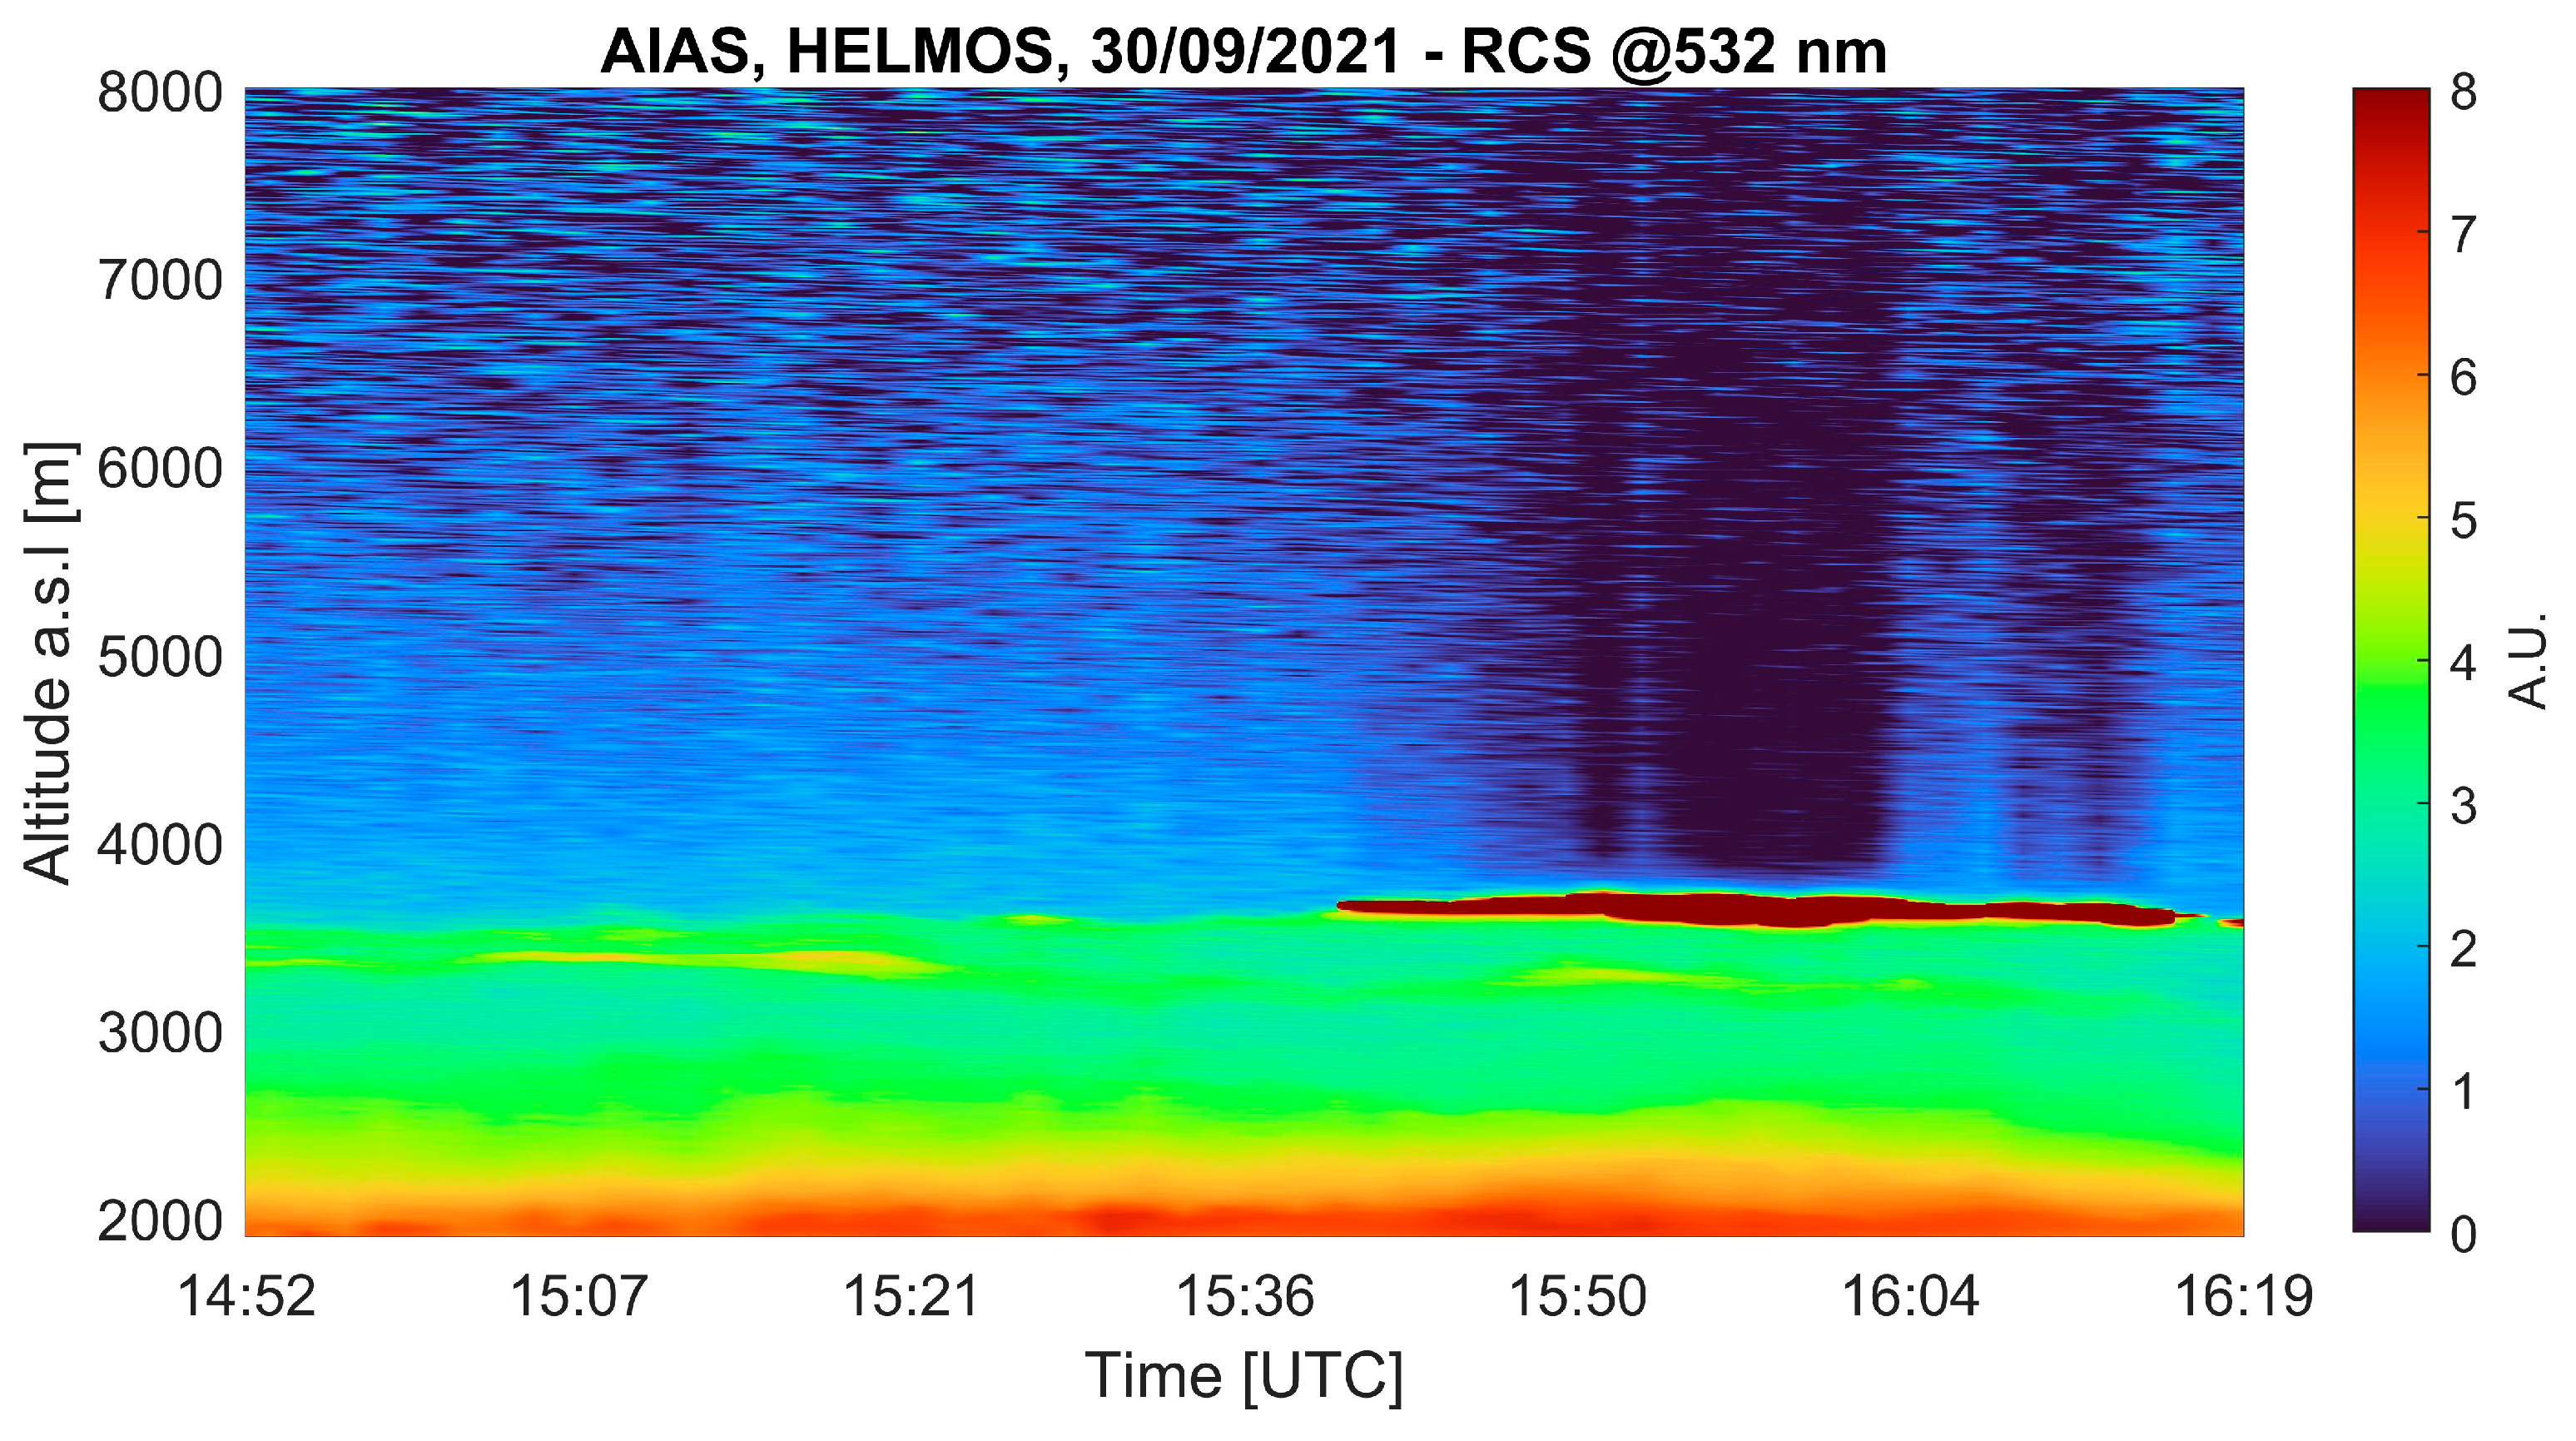
On 30 September 2021, the lidar observations reveal two distinct aerosol layers during the early afternoon hours (cf.
Figure 7). At 14:50 UTC, a stable lower layer is observed between 2.0 and 3.0 km, with a second layer extending from 3.0 to 3.9 km. These layers remain well-defined until around 15:40 UTC, when a thin cloud begins to form near the top of the upper aerosol layer, around 3.8 km. This cloud, persisting until approximately 16:15 UTC, may be associated with the interaction between aerosol particles and humid air masses, thus, leading to cloud formation around 3.5 km height.
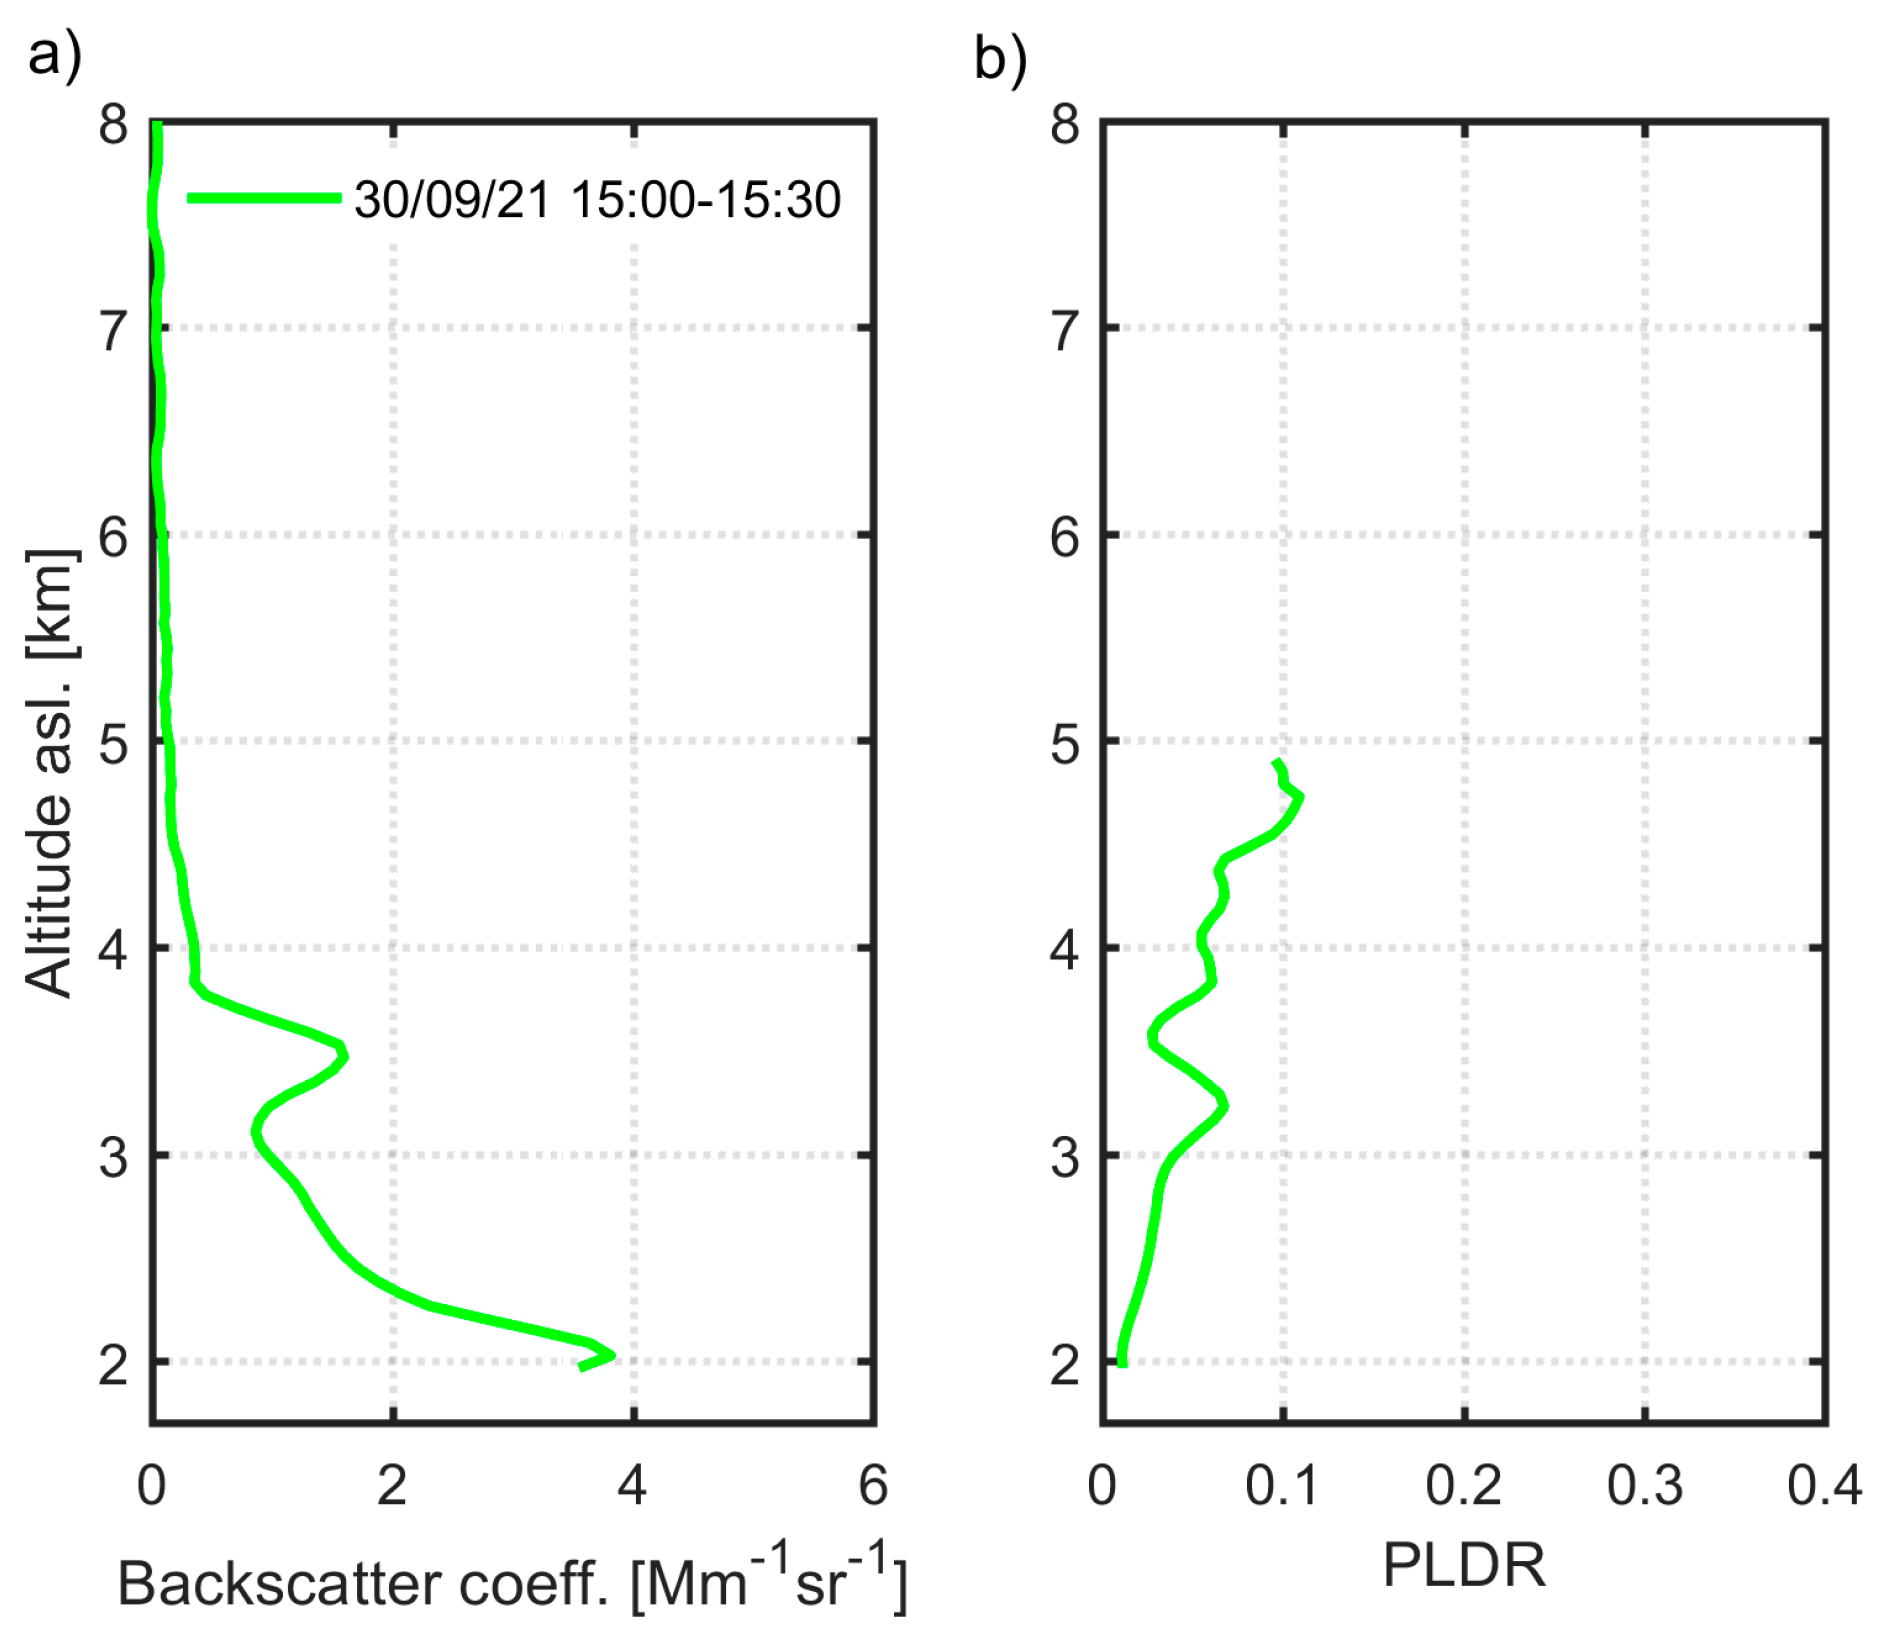
The vertical profiles of β
aer and PLDR at 532 nm, were retrieved for the period 15:00–15:30 UTC on 30 September 2021 (
Figure 8a,b). Based on
Figure 8a we observe decreasing values of β
aer (3.9 to 0.9 Mm
-1 sr
-1) from 2 to ~3 km height a.s.l., respectively; the corresponding PLDR values remain well below 0.04, indicating the presence of spherical particles [
55,
56], corroborating our argument of the arrival of biomass burning particles over our observing site, as discussed in
Figure 3e. Moreover, a distinct aerosol layer, decoupled from the lower one, is observed from ~3.10 to ~3.8 km (
Figure 8a) and is related to the arrival of air masses rich in desert dust particles (cf.
Figure 3e). However, its low PLDR value peaking at 0.078 at 3.4 km height a.sl. (cf.
Figure 8b) suggests a possible mixing of desert dust with marine aerosols (which typically exhibit PLDR values below 0.1) during the air mass transport from the Saharan desert to Helmos over the Mediterranean Sea (see also
Figure 3e). Above 3.6 km a.s.l., the PLDR values show an increasing trend but remain relatively low, reaching up to 0.1. This again suggests a possible mixing of desert dust with marine aerosols.
Table 3 summarizes the geometrical and mean optical properties of the aerosol layer observed on 30 September 2021. A single layer is identified between 3.10 and 3.88 km, with a center of mass (CoM) at 3.46 km. The β
aer at 532 nm is 1.00 ± 0.44 Mm
-1 sr
-1, while the PLDR is relatively low (0.05 ± 0.02), indicating the predominance of spherical particles, consistent with a strong contribution of biomass burning aerosols to the desert ones.
3.5. Radiative Forcing Calculations
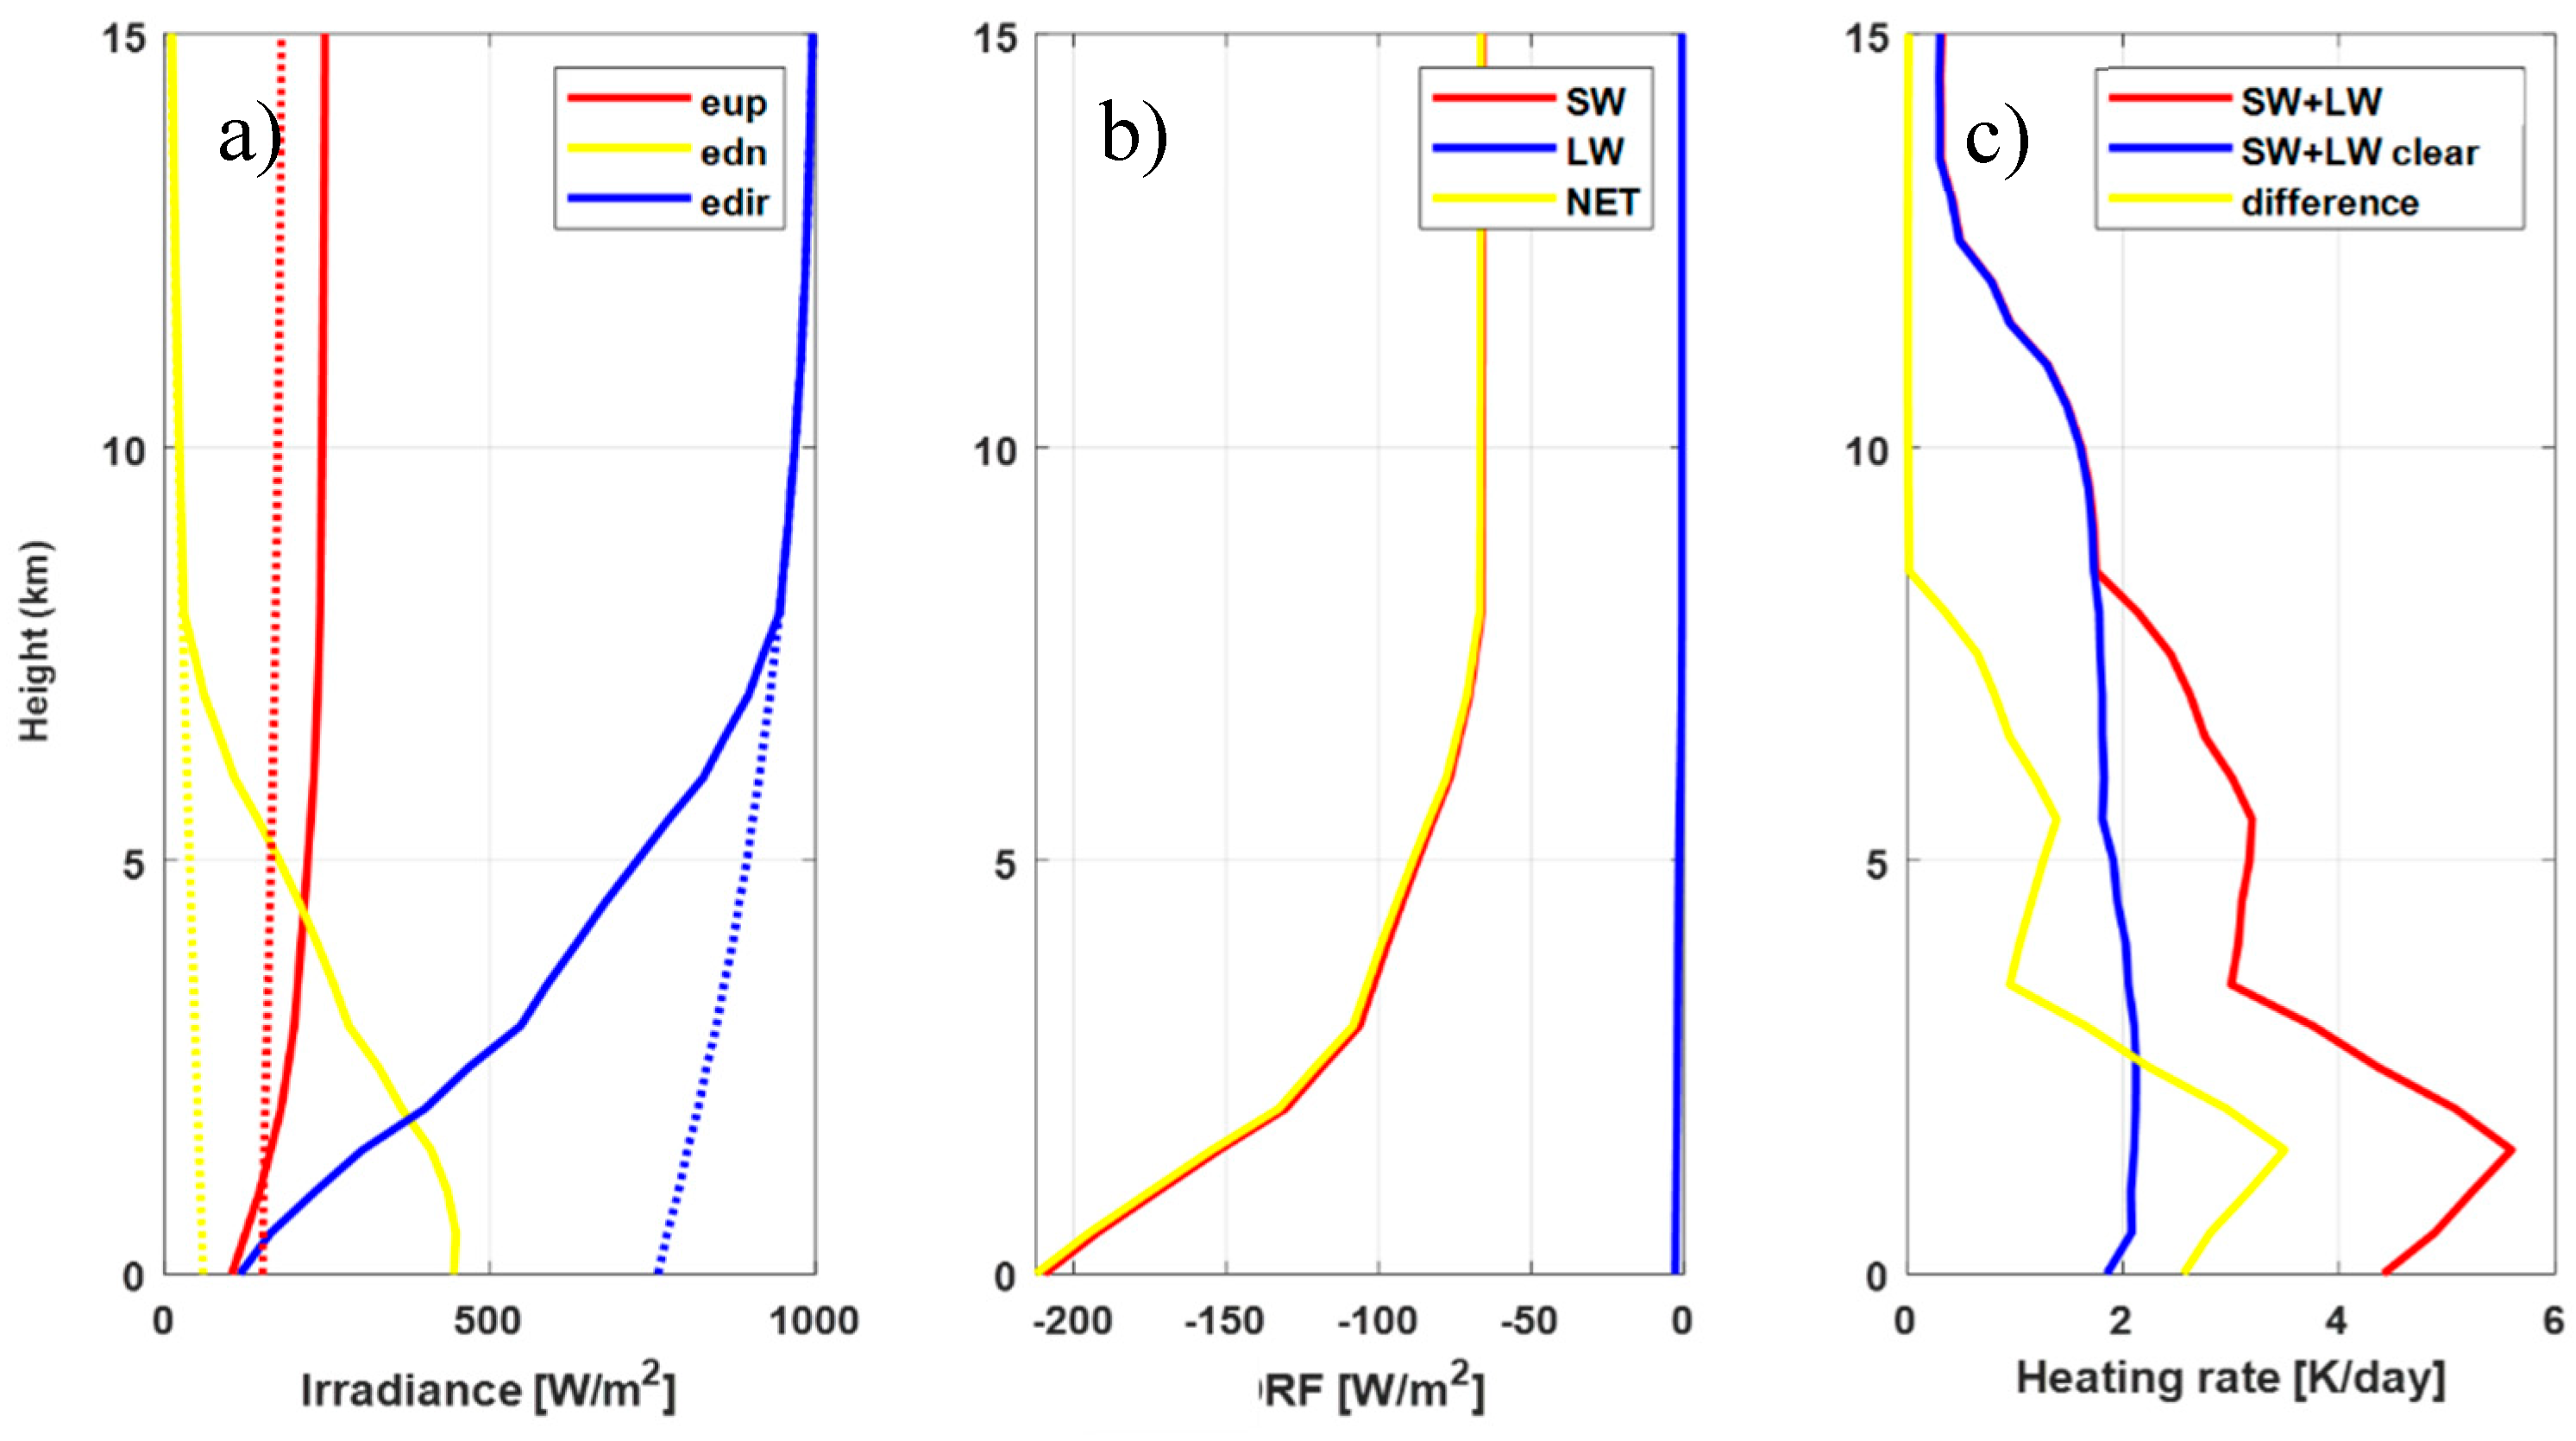
In this Section we focus on the radiative forcing calculations performed for the dust outbreaks of 27 and 30 September 2021. More specifically, the radiative transfer analysis of the dust outbreak event on 27 September 2021 was based on the LibRadtran model to assess the atmospheric impact of dust compared to a clear-sky day used as a reference. Thus, the simulations were configured to capture the vertical profiles of irradiance, radiative flux divergence (DRF), and atmospheric heating rate. The results are presented in
Figure 9 as functions of altitude from ground up to 15 km.
For the irradiance profiles presented in
Figure 9a, the downward irradiance (edn, yellow line) decreases monotonically with height, while the upward component (eup, red) increases due to scattering and reflection by atmospheric particles. The direct irradiance (edir, blue) exhibits rapid attenuation near the surface, indicative of substantial extinction by dust aerosols, consistent with a dense, elevated dust layer over the region. The net radiative forcing (
Figure 9b) indicates regions of heating (positive) or cooling (negative). In this case, strong shortwave flux (SW, red) divergence is evident within the lower to mid-troposphere, aligned with the presence of the dust layer. Longwave divergence (LW, blue), is comparatively smaller but significant near the surface, reflecting enhanced thermal emission and absorption processes. In
Figure 9c, a pronounced heating enhancement is evident between approximately 3 and 7 km altitude, peaking around 5–6 km, coinciding with the expected vertical distribution of mineral dust. This heating is related to the absorption of shortwave radiation by dust particles, which substantially modifies the thermal structure of the atmosphere during the event. These values highlight a significant surface dimming effect and atmospheric heating induced by the dust layer. The net negative forcing at the top of the atmosphere (TOA) implies a cooling effect on the Earth’s energy budget, while the large negative surface forcing and associated positive heating rate near the ground suggest substantial energy absorption and re-radiation within the atmosphere.
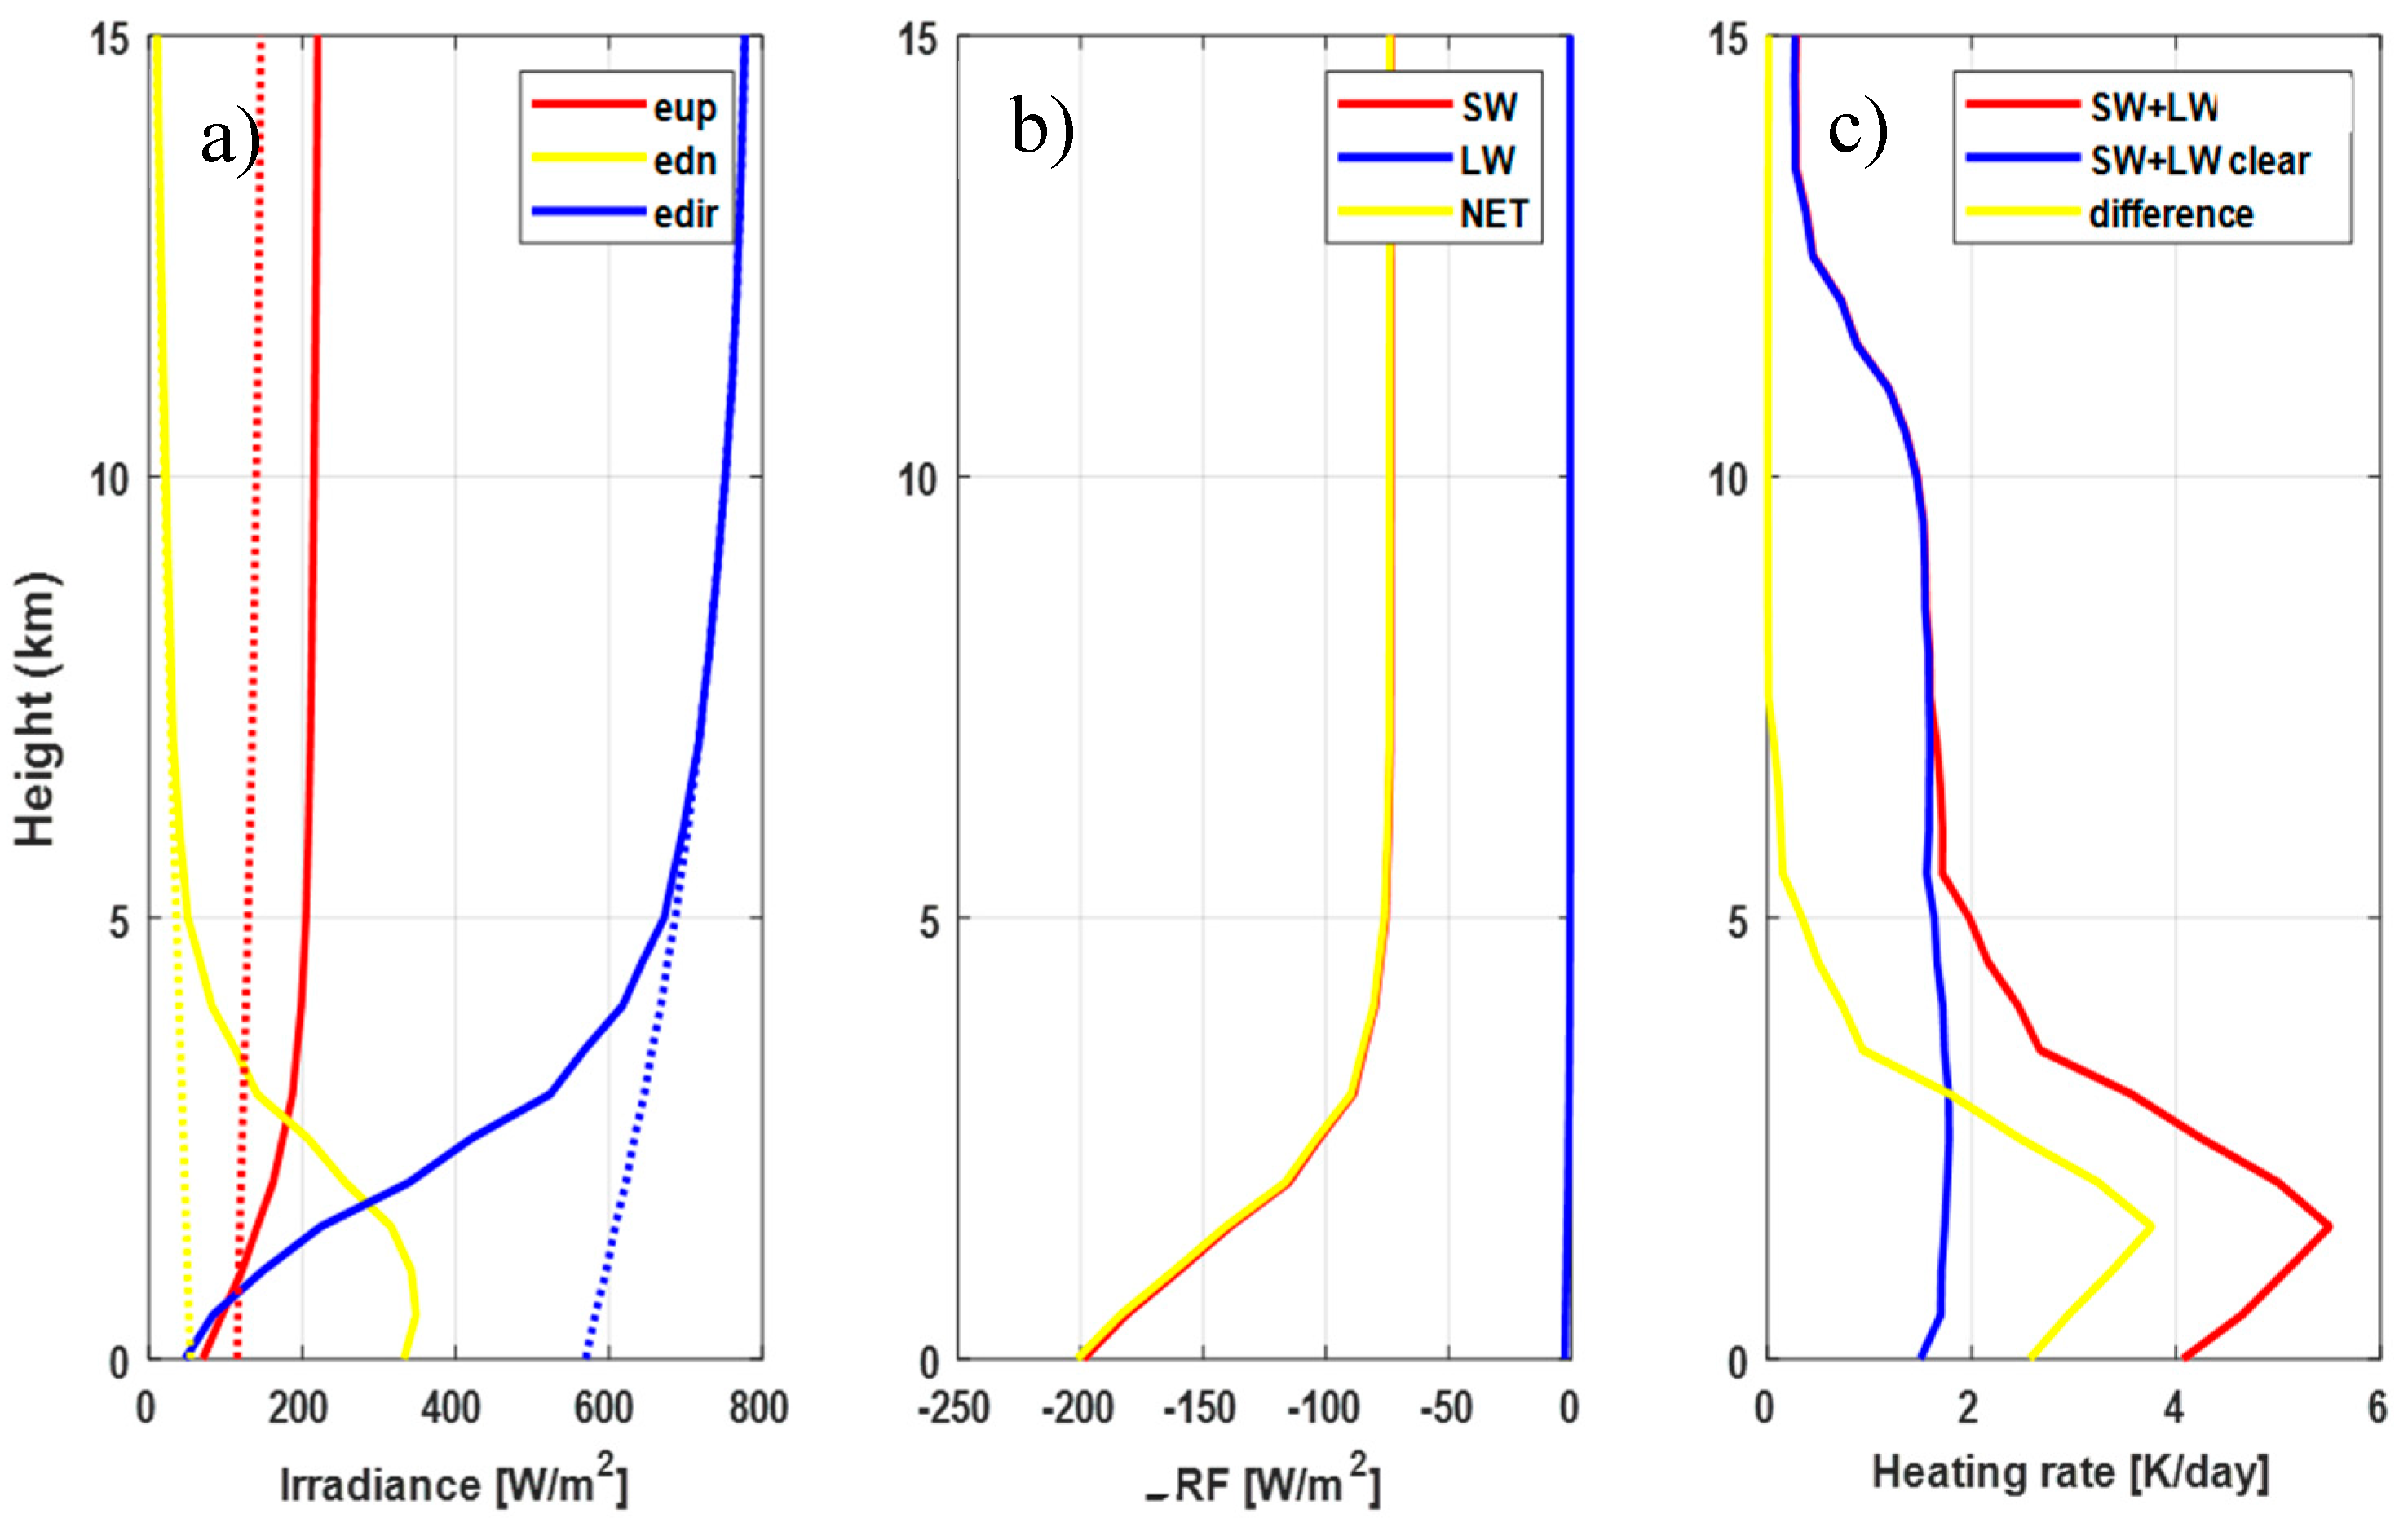
Figure 10 illustrates the atmospheric radiative impacts of a biomass burning aerosol layer with mixtures on 30 September 2021 over Helmos, Greece, simulated using the LibRadtran radiative transfer model. Here, the upward irradiance (eup, red) increases with altitude, peaking near the top of the aerosol layer due to strong scattering and reflection by smoke particles. Downward irradiance (edn, yellow) decreases sharply with altitude, indicating substantial attenuation of solar radiation by the absorbing smoke layer. Direct irradiance (edir, blue) is drastically reduced in the lower troposphere, confirming strong absorption, and scattering by the biomass burning aerosols. The net flux (yellow) profile reveals a clear imbalance in radiative energy, leading to heating in the atmospheric column and cooling at the surface. The positive heating rate at the top of the atmosphere (0.05 K/day) indicates a small net energy gain in the upper layers, while the surface heating rate of 2.57 K/day implies substantial atmospheric warming near the ground due to the aerosol presence.
Table 4 summarizes the calculated radiative forcing values for 27 and 30 September 2021. At the top of the atmosphere (TOA), the net radiative forcing was strongly negative on both days, with values of –65.51 W/m² and –72.74 W/m², indicating a cooling effect. At the surface, the forcing was even more negative, reaching –212.49 W/m² on 27 September and –201.41 W/m² on 30 September, reflecting substantial energy loss. Despite this, the heating rates show a weak warming trend at TOA, with a heating rate of +0.04 and +0.05 K/day, while at the surface, the atmosphere experienced stronger heating of +2.55 and +2.57 K/day, respectively.
4. Discussion and Conclusions
In this paper we presented highlights of two selected case studies of tropospheric aerosol transport (between 2-6 km a.s.l.), over the high-altitude measuring site (1800-2300 m) of Helmos, during September 2021. These case studies are focused on 2 days where Saharan dust transport was detected over the Helmos site, and 1 day of mixture of biomass burning aerosols with continental ones, based on the aerosol profiles measured by the mobile backscatter/depolarization Aerosol lIdAr System (AIAS) at 532 nm of the National Technical University of Athens (NTUA). Moreover, we showed the spatio-temporal evolution of the vertical profiles of the aerosol optical (backscatter coefficient and particle linear depolarization ratio-PLDR) from ground level to typical heights of 5-6 km, showing PLDR values reaching even 0.30-0.40, typical of the presence of dust aerosols.
The elevated location of the Helmos observatory played a key role in these observations. By operating above the influence of local boundary-layer pollution, the site provided direct access to free-tropospheric aerosol layers, enabling a clearer characterization of long-range transported dust and smoke plumes. Such measurements are particularly valuable in the Mediterranean basin, where the interplay between Saharan dust and biomass burning emissions is frequent and can significantly alter regional radiative forcing.
The atmospheric radiative forcing associated with the observed aerosol layers was estimated using the Libradtran radiation model, both at the top of the atmosphere (TOA) and at the Earth’s surface, along with the corresponding heating rates (HR). The results are in qualitative agreement with those reported in Kokkalis et al. (2021) [
20], where a long-lasting Saharan dust event over Athens during the COVID-19 lockdown showed a net heating rate of +0.156 K/day at the surface and +2.543 K/day within 1–6 km altitude, despite reduced background pollution. Additionally, De Rosa et al. (2025) [
26], in a 13-year lidar-based study over Potenza, Italy, estimated a negative radiative effect at both the surface and TOA across all seasons, with values reaching up to −22.08 W/m² (surface) and −51.36 W/m
2 (TOA) during summer, highlighting the significant cooling potential of dust under varying seasonal conditions. Together, these studies confirm the strong radiative impact of Saharan dust across the Mediterranean, modulated by aerosol altitude, mixing state, and background atmospheric conditions.
Overall, our findings demonstrated the value of combining high-altitude lidar profiling with radiative transfer modeling to assess the impact of transported aerosols. The Helmos measurements underscored, once again the strategic importance of mountain observatories [
8,
14] in measuring free-tropospheric aerosol layers that are often inaccessible from low-level sites. Continuous observations at such locations will be essential for reducing uncertainties in aerosol radiative forcing and for improving our understanding of the increasingly frequent occurrence of dust–smoke mixtures in a warming Mediterranean climate.
Author Contributions
“Conceptualization, A.P.; methodology, A.P., O.S., M.G.; software, O.S., S.S., C.-A.P., M.G.; validation, O.S. and S.S.; formal analysis, A.P.; investigation, C.-A.P., D.A..; resources, A.P..; data curation, C.-A.P., D.A., M.M., S.S., O.S., M.G., R.F.; writing—original draft preparation, A.P.; writing—review and editing, M.G., O.S., S.S. and K.M; visualization, O.S., S.S., C-A.P.; supervision, A.P.; project administration, A.P.; All authors have read and agreed to the published version of the manuscript.”
Funding
This work has been supported by the “National Νetwork on Climate Change and its Impacts (CLIMPACT)” which is implemented under the sub-project 3 of the project “Infrastructure of national research networks in the fields of Precision Medicine, Quantum Technology and Climate Change”, funded by the Public Investment Program of Greece, General Secretary of Research and Technology/Ministry of Development and Investments. M.G. was supported by the Hellenic Foundation for Research and Innovation (HFRI) under the 4th Call for HFRI Ph.D. Fellowships (Fellowship number: 9293).
Data Availability Statement
The data are available upon request to the first author..
Acknowledgments
The authors gratefully acknowledge the NOAA Air Resources Laboratory (ARL) for the provision of the HYSPLIT transport and dispersion model and/or READY website (
http://www.ready.noaa.gov) used in this publication. The Biomedical Research Foundation of the Academy of Athens (BRFAA) is acknowledged for the provision of its mobile platform to host the NTUA AIAS lidar system. We acknowledge the use of data and/or imagery from NASA’s Fire Information for Resource Management System (FIRMS) (
https://earthdata.nasa.gov/firms (accessed on 19 August 2025)), part of NASA’s Earth Observing System Data and Information System (EOSDIS).
Conflicts of Interest
The authors declare no conflicts of interest.
References
- Forster, P.; Ramaswamy, V.; Artaxo, P.; Berntsen, T.; Betts, R.; Fahey, D.W.; Haywood, J.; Lean, J.; Lowe, D.C.; Raga, G.; et al. Changes in Atmospheric Constituents and in Radiative Forcing.
- Intergovernmental Panel On Climate Change (Ipcc) Climate Change 2021 – The Physical Science Basis: Working Group I Contribution to the Sixth Assessment Report of the Intergovernmental Panel on Climate Change; 1st ed.; Cambridge University Press, 2023; ISBN 978-1-009-15789-6.
- Lohmann, U.; Feichter, J. Global Indirect Aerosol Effects: A Review. Atmospheric Chem. Phys. 2005, 5, 715–737. [CrossRef]
- Murray, B.J.; O’Sullivan, D.; Atkinson, J.D.; Webb, M.E. Ice Nucleation by Particles Immersed in Supercooled Cloud Droplets. Chem. Soc. Rev. 2012, 41, 6519. [CrossRef]
- Haywood, J.; Boucher, O. Estimates of the Direct and Indirect Radiative Forcing Due to Tropospheric Aerosols: A Review. Rev. Geophys. 2000, 38, 513–543. [CrossRef]
- Andreae, M.O.; Rosenfeld, D. Aerosol–Cloud–Precipitation Interactions. Part 1. The Nature and Sources of Cloud-Active Aerosols. Earth-Sci. Rev. 2008, 89, 13–41. [CrossRef]
- Rosenfeld, D. Suppression of Rain and Snow by Urban and Industrial Air Pollution. Science 2000. [CrossRef]
- Gao, K.; Vogel, F.; Foskinis, R.; Vratolis, S.; Gini, M.I.; Granakis, K.; Billault-Roux, A.-C.; Georgakaki, P.; Zografou, O.; Fetfatzis, P.; et al. Biological and Dust Aerosols as Sources of Ice-Nucleating Particles in the Eastern Mediterranean: Source Apportionment, Atmospheric Processing and Parameterization. Atmospheric Chem. Phys. 2024, 24, 9939–9974. [CrossRef]
- Gao, K.; Vogel, F.; Foskinis, R.; Vratolis, S.; Gini, M.I.; Granakis, K.; Zografou, O.; Fetfatzis, P.; Papayannis, A.; Möhler, O.; et al. On the Drivers of Ice Nucleating Particle Diurnal Variability in Eastern Mediterranean Clouds. Npj Clim. Atmospheric Sci. 2025, 8, 1–15. [CrossRef]
- Foskinis, R.; Motos, G.; Gini, M.I.; Zografou, O.; Gao, K.; Vratolis, S.; Granakis, K.; Vakkari, V.; Violaki, K.; Aktypis, A.; et al. Drivers of Droplet Formation in East Mediterranean Orographic Clouds. Atmospheric Chem. Phys. 2024, 24, 9827–9842. [CrossRef]
- Seigel, R.B.; van den Heever, S.C.; Saleeby, S.M. Mineral Dust Indirect Effects and Cloud Radiative Feedbacks of a Simulated Idealized Nocturnal Squall Line. Atmospheric Chem. Phys. 2013, 13, 4467–4485. [CrossRef]
- Lelieveld, J.; Berresheim, H.; Borrmann, S.; Crutzen, P.J.; Dentener, F.J.; Fischer, H.; Feichter, J.; Flatau, P.J.; Heland, J.; Holzinger, R.; et al. Global Air Pollution Crossroads over the Mediterranean. Science 2002, 298, 794–799. [CrossRef]
- Foskinis, R.; Gini, M.I.; Kokkalis, P.; Diapouli, E.; Vratolis, S.; Granakis, K.; Zografou, O.; Komppula, M.; Vakkari, V.; Nenes, A.; et al. On the Relation between the Planetary Boundary Layer Height and in Situ Surface Observations of Atmospheric Aerosol Pollutants during Spring in an Urban Area. Atmospheric Res. 2024, 308, 107543. [CrossRef]
- Zografou, O.; Gini, M.; Fetfatzis, P.; Granakis, K.; Foskinis, R.; Manousakas, M.I.; Tsopelas, F.; Diapouli, E.; Dovrou, E.; Vasilakopoulou, C.N.; et al. High-Altitude Aerosol Chemical Characterization and Source Identification: Insights from the CALISHTO Campaign. Atmospheric Chem. Phys. 2024, 24, 8911–8926. [CrossRef]
- Prospero, J.M.; Mayol-Bracero, O.L. Understanding the Transport and Impact of African Dust on the Caribbean Basin. Bull. Am. Meteorol. Soc. 2013, 94, 1329–1337. [CrossRef]
- Evan, A.T.; Flamant, C.; Gaetani, M.; Guichard, F. The Past, Present and Future of African Dust. Nature 2016, 531, 493–495. [CrossRef]
- Knippertz, P.; Todd, M.C. Mineral Dust Aerosols over the Sahara: Meteorological Controls on Emission and Transport and Implications for Modeling. Rev. Geophys. 2012, 50. [CrossRef]
- Marinou, E.; Amiridis, V.; Binietoglou, I.; Tsikerdekis, A.; Solomos, S.; Proestakis, E.; Konsta, Di.; Papagiannopoulos, N.; Tsekeri, A.; Vlastou, G.; et al. Three-Dimensional Evolution of Saharan Dust Transport towards Europe Based on a 9-Year EARLINET-Optimized CALIPSO Dataset. Atmospheric Chem. Phys. 2017, 17, 5893–5919. [CrossRef]
- Amiridis, V.; Kazadzis, S.; Gkikas, A.; Voudouri, K.A.; Kouklaki, D.; Koukouli, M.-E.; Garane, K.; Georgoulias, A.K.; Solomos, S.; Varlas, G.; et al. Natural Aerosols, Gaseous Precursors and Their Impacts in Greece: A Review from the Remote Sensing Perspective. Atmosphere 2024, 15, 753. [CrossRef]
- Kokkalis, P.; Soupiona, O.; Papanikolaou, C.A.; Foskinis, R.; Mylonaki, M.; Solomos, S.; Vratolis, S.; Vasilatou, V.; Kralli, E.; Anagnou, D.; et al. Radiative Effect and Mixing Processes of a Long-Lasting Dust Event over Athens, Greece, during the COVID-19 Period. Atmosphere 2021, 12, 1–26. [CrossRef]
- Papayannis, A.; Balis, D.; Amiridis, V.; Chourdakis, G.; Tsaknakis, G.; Zerefos, C.; Castanho, A.D.A.; Nickovic, S.; Kazadzis, S.; Grabowski, J. Measurements of Saharan Dust Aerosols over the Eastern Mediterranean Using Elastic Backscatter-Raman Lidar, Spectrophotometric and Satellite Observations in the Frame of the EARLINET Project. Atmos Chem Phys 2005.
- Papayannis, A.; Amiridis, V.; Mona, L.; Tsaknakis, G.; Balis, D.; Bösenberg, J.; Chaikovski, A.; De Tomasi, F.; Grigorov, I.; Mattis, I.; et al. Systematic Lidar Observations of Saharan Dust over Europe in the Frame of EARLINET (2000–2002). J. Geophys. Res. Atmospheres 2008, 113, 2007JD009028. [CrossRef]
- Soupiona, O.; Samaras, S.; Ortiz-Amezcua, P.; Böckmann, C.; Papayannis, A.; Moreira, G.A.; Benavent-Oltra, J.A.; Guerrero-Rascado, J.L.; Bedoya-Velásquez, A.E.; Olmo, F.J.; et al. Retrieval of Optical and Microphysical Properties of Transported Saharan Dust over Athens and Granada Based on Multi-Wavelength Raman Lidar Measurements: Study of the Mixing Processes. Atmos. Environ. 2019, 214, 116824. [CrossRef]
- Soupiona, O.; Papayannis, A.; Kokkalis, P.; Mylonaki, M.; Tsaknakis, G.; Argyrouli, A.; Vratolis, S. Long-Term Systematic Profiling of Dust Aerosol Optical Properties Using the EOLE NTUA Lidar System over Athens, Greece (2000–2016). Atmos. Environ. 2018, 183, 165–174. [CrossRef]
- Soupiona, O.; Papayannis, A.; Kokkalis, P.; Foskinis, R.; Sánchez Hernández, G.; Ortiz-Amezcua, P.; Mylonaki, M.; Papanikolaou, C.-A.; Papagiannopoulos, N.; Samaras, S.; et al. EARLINET Observations of Saharan Dust Intrusions over the Northern Mediterranean Region (2014–2017): Properties and Impact on Radiative Forcing. Atmospheric Chem. Phys. 2020, 20, 15147–15166. [CrossRef]
- De Rosa, B.; Amodeo, A.; D’Amico, G.; Papagiannopoulos, N.; Rosoldi, M.; Veselovskii, I.; Cardellicchio, F.; Falconieri, A.; Gumà-Claramunt, P.; Laurita, T.; et al. Characterization of Fresh and Aged Smoke Particles Simultaneously Observed with an ACTRIS Multi-Wavelength Raman Lidar in Potenza, Italy. Remote Sens. 2025, 17, 2538. [CrossRef]
- Adebiyi, A.A.; Kok, J.F. Climate Models Miss Most of the Coarse Dust in the Atmosphere. Sci. Adv. 2020, 6, 1–10. [CrossRef]
- Mona, L.; Liu, Z.; Müller, D.; Omar, A.; Papayannis, A.; Pappalardo, G.; Sugimoto, N.; Vaughan, M. Lidar Measurements for Desert Dust Characterization: An Overview. Adv. Meteorol. 2012, 2012, 1–36. [CrossRef]
- Papayannis, A.; Mamouri, R.E.; Amiridis, V.; Remoundaki, E.; Tsaknakis, G.; Kokkalis, P.; Veselovskii, I.; Kolgotin, A.; Nenes, A.; Fountoukis, C. Optical-Microphysical Properties of Saharan Dust Aerosols and Composition Relationship Using a Multi-Wavelength Raman Lidar, in Situ Sensors and Modelling: A Case Study Analysis. Atmospheric Chem. Phys. 2012, 12, 4011–4032. [CrossRef]
- Mamouri, R.-E.; Nisantzi, A.; Ansmann, A.; Hadjimitsis, D.G. Extreme Dust Storm over the Eastern Mediterranean in September 2015: Lidar Vertical Profiling of Desert Dust at Limassol, Cyprus; Aerosols/Field Measurements/Troposphere/Physics (physical properties and processes), 2016;
- Veselovskii, I.; Goloub, P.; Podvin, T.; Bovchaliuk, V.; Derimian, Y.; Augustin, P.; Fourmentin, M.; Tanre, D.; Korenskiy, M.; Whiteman, D.N.; et al. Retrieval of Optical and Physical Properties of African Dust from Multiwavelength Raman Lidar Measurements during the SHADOW Campaign in Senegal. Atmospheric Chem. Phys. 2016, 16, 7013–7028. [CrossRef]
- Haarig, M.; Ansmann, A.; Engelmann, R.; Baars, H.; Toledano, C.; Torres, B.; Althausen, D.; Radenz, M.; Wandinger, U. First Triple-Wavelength Lidar Observations of Depolarization and Extinction-to-Backscatter Ratios of Saharan Dust. Atmospheric Chem. Phys. 2022, 22, 355–369. [CrossRef]
- Katsivela, E.; Chatoutsidou, S.E.; Saridaki, A.; Raisi, L.; Stathopoulou, P.; Tsiamis, G.; Kunfeng, G.; Fetfatzis, P.; Romanos, F.; Gidarakou, M.; et al. Airborne Microorganisms at Hellenic Atmospheric Aerosol and Climate Change Station in Helmos Mountain (Greece). ACS Earth Space Chem. 2025, 9, 1801–1814. [CrossRef]
- Freudenthaler, V.; Esselborn, M.; Wiegner, M.; Heese, B.; Tesche, M.; Ansmann, A.; Müller, D.; Althausen, D.; Wirth, M.; Fix, A.; et al. Depolarization Ratio Profiling at Several Wavelengths in Pure Saharan Dust during SAMUM 2006. Tellus B 2009, 61, 165–179. [CrossRef]
- Papayannis, A.; Kokkalis, P.; Mylonaki, M.; Soupiona, R.; Papanikolaou, C.A.; Foskinis, R.; Giakoumaki, A. Recent Upgrades of the EOLE and AIAS Lidar Systems of the National Technical University of Athens Operating Since 2000 in Athens, Greece. EPJ Web Conf. 2020, 237, 02030. [CrossRef]
- Mylonaki, M.; Papayannis, A.; Anagnou, D.; Veselovskii, I.; Papanikolaou, C.-A.; Kokkalis, P.; Soupiona, O.; Foskinis, R.; Gidarakou, M.; Kralli, E. Optical and Microphysical Properties of Aged Biomass Burning Aerosols and Mixtures, Based on 9-Year Multiwavelength Raman Lidar Observations in Athens, Greece. Remote Sens. 2021, 13, 3877. [CrossRef]
- D’Amico, G.; Amodeo, A.; Baars, H.; Binietoglou, I.; Freudenthaler, V.; Mattis, I.; Wandinger, U.; Pappalardo, G. EARLINET Single Calculus Chain – Overview on Methodology and Strategy. Atmospheric Meas. Tech. 2015, 8, 4891–4916. [CrossRef]
- Solomos, S.; Spyrou, C.; Barreto, A.; Rodríguez, S.; González, Y.; Neophytou, M.K.A.; Mouzourides, P.; Bartsotas, N.S.; Kalogeri, C.; Nickovic, S.; et al. The Development of METAL-WRF Regional Model for the Description of Dust Mineralogy in the Atmosphere. Atmosphere 2023, 14, 1615. [CrossRef]
- LeGrand, S.L.; Polashenski, C.; Letcher, T.W.; Creighton, G.A.; Peckham, S.E.; Cetola, J.D. The AFWA Dust Emission Scheme for the GOCART Aerosol Model in WRF-Chem v3.8.1. Geosci. Model Dev. 2019, 12, 131–166. [CrossRef]
- Hersbach, H.; Bell, B.; Berrisford, P.; Hirahara, S.; Horányi, A.; Muñoz-Sabater, J.; Nicolas, J.; Peubey, C.; Radu, R.; Schepers, D.; et al. The ERA5 Global Reanalysis. Q. J. R. Meteorol. Soc. 2020, 146, 1999–2049. [CrossRef]
- Thompson, G.; Field, P.R.; Rasmussen, R.M.; Hall, W.D. Explicit Forecasts of Winter Precipitation Using an Improved Bulk Microphysics Scheme. Part II: Implementation of a New Snow Parameterization. 2008. [CrossRef]
- Grell, G.A.; Freitas, S.R. A Scale and Aerosol Aware Stochastic Convective Parameterization for Weather and Air Quality Modeling. Atmospheric Chem. Phys. 2014, 14, 5233–5250. [CrossRef]
- Iacono, M.J.; Delamere, J.S.; Mlawer, E.J.; Shephard, M.W.; Clough, S.A.; Collins, W.D. Radiative Forcing by Long-Lived Greenhouse Gases: Calculations with the AER Radiative Transfer Models. J. Geophys. Res. Atmospheres 2008, 113. [CrossRef]
- Janjic, Z.I. The Surface Layer in the NCEP Eta Model. Am. Meteorol. Soc. 1996, In Proceedings of the Eleventh Conference on Numerical Weather Prediction, Norfolk, VA, USA, 354–355.
- Janjic, Z.I. (2002) Nonsingular Implementation of the Mellor-Yamada Level 2.5 Scheme in the NCEP Meso Model. NCEP Office Note No. 437, 61 p. - References - Scientific Research Publishing Available online: https://www.scirp.org/reference/referencespapers?referenceid=1295196 (accessed on 12 September 2025).
- Tewari, M.; Chen, F.; Wang, W.; Dudhia, J.; LeMone, M.A.; Gayno, G.; Wegiel, J.; Cuenca, R.H. 14.2A IMPLEMENTATION AND VERIFICATION OF THE UNIFIED NOAH LAND SURFACE MODEL IN THE WRF MODEL.
- Mesinger, F. Forecasting Upper Tropospheric Turbulence within the Framework of the Mellor-Yamada 2.5 Closure. 2020, 18, 4.28-4.29.
- The Step-Mountain Eta Coordinate Model: Further Developments of the Convection, Viscous Sublayer, and Turbulence Closure Schemes in: Monthly Weather Review Volume 122 Issue 5 (1994) Available online: https://journals.ametsoc.org/view/journals/mwre/122/5/1520-0493_1994_122_0927_tsmecm_2_0_co_2.xml (accessed on 12 September 2025).
- Ginoux, P.; Chin, M.; Tegen, I.; Prospero, J.M.; Holben, B.; Dubovik, O.; Lin, S.-J. Sources and Distributions of Dust Aerosols Simulated with the GOCART Model. J. Geophys. Res. Atmospheres 2001, 106, 20255–20273. [CrossRef]
- Nabat, P.; Somot, S.; Mallet, M.; Chiapello, I.; Morcrette, J.J.; Solmon, F.; Szopa, S.; Dulac, F.; Collins, W.; Ghan, S.; et al. A 4-D Climatology (1979–2009) of the Monthly Tropospheric Aerosol Optical Depth Distribution over the Mediterranean Region from a Comparative Evaluation and Blending of Remote Sensing and Model Products. Atmospheric Meas. Tech. 2013, 6, 1287–1314. [CrossRef]
- Levy, R.C.; Remer, L.A.; Kleidman, R.G.; Mattoo, S.; Ichoku, C.; Kahn, R.; Eck, T.F. Global Evaluation of the Collection 5 MODIS Dark-Target Aerosol Products over Land. Atmospheric Chem. Phys. 2010, 10, 10399–10420. [CrossRef]
- Tanré, D.; Kaufman, Y.J.; Herman, M.; Mattoo, S. Remote Sensing of Aerosol Properties over Oceans Using the MODIS/EOS Spectral Radiances. J. Geophys. Res. Atmospheres 1997, 102, 16971–16988. [CrossRef]
- Stein, A.F.; Draxler, R.R.; Rolph, G.D.; Stunder, B.J.B.; Cohen, M.D.; Ngan, F. NOAA’s HYSPLIT Atmospheric Transport and Dispersion Modeling System. Bull. Am. Meteorol. Soc. 2015, 96, 2059–2077. [CrossRef]
- Emde, C.; Buras-Schnell, R.; Kylling, A.; Mayer, B.; Gasteiger, J.; Hamann, U.; Kylling, J.; Richter, B.; Pause, C.; Dowling, T.; et al. The libRadtran Software Package for Radiative Transfer Calculations (Version 2.0.1). Geosci. Model Dev. 2016, 9, 1647–1672. [CrossRef]
- Janicka, L.; Stachlewska, I.S.; Veselovskii, I.; Baars, H. Temporal Variations in Optical and Microphysical Properties of Mineral Dust and Biomass Burning Aerosol Derived from Daytime Raman Lidar Observations over Warsaw, Poland. Atmos. Environ. 2017, 169, 162–174. [CrossRef]
- Murayama, T.; Müller, D.; Wada, K.; Shimizu, A.; Sekiguchi, M.; Tsukamoto, T. Characterization of Asian Dust and Siberian Smoke with Multi-Wavelength Raman Lidar over Tokyo, Japan in Spring 2003. Geophys. Res. Lett. 2004, 31. [CrossRef]
Figure 1.
(a) The study area (b) and the sub-domain over Greece, and (c) the regional area around Helmos and the lidar site located at 1750 m a.s.l.
Figure 1.
(a) The study area (b) and the sub-domain over Greece, and (c) the regional area around Helmos and the lidar site located at 1750 m a.s.l.
Figure 2.
Vertically integrated dust load (mg m-2) in METAL-WRF model for the period 23-30 September 2021.
Figure 2.
Vertically integrated dust load (mg m-2) in METAL-WRF model for the period 23-30 September 2021.
Figure 3.
Air mass trajectories arriving over Helmos at various heights on 27 September 2021 (
Figure 3a-d for 08:00, 14:00, 16:00, 17:00 UTC, respectively) and on 30 September 2021 (15:00 UTC) calculated by the HYSPLIT air mass back trajectory model (starting point 240 hours before). The red dots delineate the presence of biomass burning spots.
Figure 4.
(a,c) MODIS-EFFIS “True Image” and (b,d) the AOD at 550 nm obtained from MODIS Aqua and Terra merged data at 27 and 30 September 2021, respectively.
Figure 4.
(a,c) MODIS-EFFIS “True Image” and (b,d) the AOD at 550 nm obtained from MODIS Aqua and Terra merged data at 27 and 30 September 2021, respectively.
Figure 5.
Spatio-temporal evolution of the range-corrected lidar signal obtained by the AIAS lidar at 532 nm in arbitrary units (A.U.) over Helmos on 27 September 2021.
Figure 5.
Spatio-temporal evolution of the range-corrected lidar signal obtained by the AIAS lidar at 532 nm in arbitrary units (A.U.) over Helmos on 27 September 2021.
Figure 6.
Vertical profiles of the aerosol backscatter coefficient at 532 nm (a–d) and the corresponding PLDR (e–h) for four-time intervals on 27 September 2021: (a,e) 07:26–08:16 UTC, (b,f) 13:00–14:00 UTC, (c,g) 15:36–16:16 UTC, and (d,h) 16:31–17:07 UTC.
Figure 6.
Vertical profiles of the aerosol backscatter coefficient at 532 nm (a–d) and the corresponding PLDR (e–h) for four-time intervals on 27 September 2021: (a,e) 07:26–08:16 UTC, (b,f) 13:00–14:00 UTC, (c,g) 15:36–16:16 UTC, and (d,h) 16:31–17:07 UTC.
Figure 7.
Spatio-temporal evolution of the range-corrected lidar signal obtained by the AIAS lidar at 532 nm in arbitrary units (A.U.) over Helmos on 30 September 2021.
Figure 7.
Spatio-temporal evolution of the range-corrected lidar signal obtained by the AIAS lidar at 532 nm in arbitrary units (A.U.) over Helmos on 30 September 2021.
Figure 8.
Vertical profiles of (a) the aerosol backscatter coefficient and (b) and the corresponding PLDR at 532 nm on 30 September 2021 at 15:00 – 15:30 UTC.
Figure 8.
Vertical profiles of (a) the aerosol backscatter coefficient and (b) and the corresponding PLDR at 532 nm on 30 September 2021 at 15:00 – 15:30 UTC.
Figure 9.
Vertical profiles of a) irradiance (upward irradiance-eup, red line, downward irradiance-edn, yellow line, direct irradiance-edir, blue line), b) the radiative forcing RF for shortwave (SW, red line), longwave (LW, blue line) irradiance and the net flux (yellow), c) the hating rate for the sum of shortwave and longwave loaded atmosphere (red), the sum of shortwave and longwave clear atmosphere (blue), and their difference (yellow) as estimated for 27 September 2021 over Helmos.
Figure 10.
Vertical profiles of a) irradiance (upward irradiance-eup, red line, downward irradiance-edn, yellow line, direct irradiance-edir, blue line), b) the radiative forcing RF for shortwave (SW, red line), longwave (LW, blue line) irradiance and the net flux (yellow), c) the hating rate for the sum of shortwave and longwave loaded atmosphere (red), the sum of shortwave and longwave clear atmosphere (blue), and their difference (yellow) as estimated for 30 September 2021 over Helmos.
Table 1.
Physical schemes in METAL-WRF setup.
Table 1.
Physical schemes in METAL-WRF setup.
| Physical Component |
Parameterization Scheme |
Reference |
| Microphysics |
Thompson Scheme |
Thompson et al., 2008 [41] |
| Cumulus |
Grell-Freitas Scheme |
Grell and Freitas 2014 [42] |
| Shortwave/Shortwave radiation |
RRTMG scheme |
Iacono et al., 2008 [43] |
| Surface Layer physics |
Eta similarity scheme |
Janjic, 1996; 2002 [44,45] |
| Land Surface |
Noah Land Surface Model |
Tewari et al., 2004 [46] |
| Planetary Boundary layer |
Mellor-Yamada-Janjic scheme |
Mesinger 1993 [47]; Janjic 1994 [48] |
| Dust module |
GOCART-AFWA aerosol scheme |
Ginoux, 2001 [49]; LeGrand et al., 2019 [39] |
Table 2.
Geometrical and mean aerosol properties at different layers, for 27 September 2021 at 15:36-16:16 UTC.
Table 2.
Geometrical and mean aerosol properties at different layers, for 27 September 2021 at 15:36-16:16 UTC.
| Parameter |
Layer 1 |
Layer 2 |
Layer 3 |
| Layer Bottom (km) |
2.92 |
3.70 |
5.44 |
| Layer Top (km) |
3.70 |
4.30 |
6.80 |
| CoM (km) |
3.30 |
4.02 |
6.13 |
| βaer (Μm-1 sr-1) |
1.02±0.14 |
0.98±0.16 |
0.85±0.47 |
| PLDR |
0.11±0.03 |
0.19±0.05 |
0.32±0.13 |
Table 3.
Geometrical and mean optical aerosol properties for 30 September 2021.
Table 3.
Geometrical and mean optical aerosol properties for 30 September 2021.
| Parameter |
Layer 1 |
| Layer Botton (km) |
3.10 |
| Layer Top (km) |
3.88 |
| CoM (km) |
3.46 |
| βaer (Μm-1 sr-1) |
1.00±0.44 |
| PLDR |
0.05±0.02 |
Table 4.
Radiative forcing calculations (30 September 2021).
Table 4.
Radiative forcing calculations (30 September 2021).
| Quantity |
27 September 2021 |
30 September 2021 |
| Net TOA Radiative Forcing |
–65.51 W/m² |
–72.74 W/m2
|
| Net Surface Radiative Forcing |
–212.49 W/m² |
–201.41 W/m2
|
| Heating Rate at TOA |
+0.04 K/day |
0.05 K/day |
| Heating Rate at Surface |
+2.55 K/day |
2.57 K/day |
|
Disclaimer/Publisher’s Note: The statements, opinions and data contained in all publications are solely those of the individual author(s) and contributor(s) and not of MDPI and/or the editor(s). MDPI and/or the editor(s) disclaim responsibility for any injury to people or property resulting from any ideas, methods, instructions or products referred to in the content. |
© 2025 by the authors. Licensee MDPI, Basel, Switzerland. This article is an open access article distributed under the terms and conditions of the Creative Commons Attribution (CC BY) license (http://creativecommons.org/licenses/by/4.0/).