
Submitted:
18 August 2025
Posted:
19 August 2025
You are already at the latest version
Abstract
Vertically resolved aerosol characterization is crucial for assessing the impact of aerosols on radiation, cloud formation, and climate. Atmospheric aerosol particles exhibit significant spatial and temporal variability, making long–term observations essential for understanding these variations and developing an aerosol climatology. We conducted, for the first time, long–term lidar measurements in Albania during 2022–2023 using a ground–based Raman lidar. In this study, we evaluate aerosol extinction profiles, and mass concentration profiles using 15 years of Cloud–Aerosol Lidar and Infrared Pathfinder Satellite Observations (CALIPSO) data and one year of ground–based Raman lidar measurements. We present seasonal patterns of total, dust, and non-dust contributions. Additionally, we analyze monthly AOD variations over a 15–year period from CALIPSO and a one–year period from POLLY (POrtabLe Lidar sYstem). Along with aerosol climatology, the air mass cluster backward trajectories by means of HYSPLIT (Hybrid Single Particle Lagrangian Integrated Trajectory) are shown as seasonally means for a 10–year period. The maximum extinction coefficient retrieved by CALIPSO in the near-surface layer ranges from 80 to 100 Mm⁻¹. In comparison, POLLY observations at 300 m altitude indicate maximum extinction values between 75 and 125 Mm⁻¹. The maximum height of the aerosol layer is detected between 8 and 10 km. Wildfire smoke layers were identified up to 10 km height during the summer season. Strong Saharan dust outbreaks, with mass concentrations up to 300 µg m⁻³, and moderate events, with concentrations around 100 µg m⁻³, are presented through two case studies and analyzed in detail. The highest AOD values are observed during summer, specifically in August, reaching approximately 0.26 for CALIPSO and 0.19 for POLLY. In contrast, the lowest values occur in winter. For POLLY, the minimum AOD is recorded in December at 0.053, while for CALIOP, the lowest values are around 0.1, observed in December and January. HYSPLIT backward trajectories cluster analysis indicates regional aerosol transport primarily from the Balkans and Italy, along with long-range transport from Western Europe and North America.
Keywords:
CALIPSO
; Raman lidar
; extinction coefficient
; AOD
; mass concentration
; HYSPLIT
1. Introduction
Aerosols significantly impact Earth’s climate, air quality, and human health. They interact with radiation and clouds, thus influencing Earth’s radiation budget, cloud properties, and precipitation [1]. These effects strongly depend on aerosol vertical distribution [2,3]. Aerosols exhibit high spatial and temporal variability, making large–scale and long–term observations essential for understanding their effects [4]. Vertically resolved aerosol observations are essential for assessing aerosol impacts on cloud formation and radiation [5,6]. Monitoring the vertical distribution of aerosol extinction provides insights into pollutant transport, seasonal variations, and atmospheric processes. A comprehensive approach, combining in situ, satellite, and surface–based observations, is vital for assessing global aerosol models and improving surface measurement interpretation [7]. Due to the lack of in-situ observations in Albania and the wider Western Balkans, we base our analysis on satellite and ground–based lidar measurements.
The Cloud-Aerosol Lidar and Infrared Pathfinder Satellite Observations (CALIPSO) mission enables multi-year aerosol profiling, offering long-term, global-scale measurements of aerosols and clouds. These data provide a unique opportunity to evaluate aerosol climatology and its spatiotemporal variability. Ground-based lidar systems, such as Raman lidars, complement these observations by delivering high temporal resolution aerosol profiles. Unlike CALIPSO, Raman lidars independently measure backscatter and extinction coefficients, allowing direct retrieval of the lidar ratio [8]. Since the lidar ratio is a key input for CALIPSO retrievals and aerosol classification, ground-based lidar observations are crucial for validating and enhancing the accuracy of aerosol optical properties retrieved by CALIPSO.
Regarding desert dust mass concentrations in the Mediterranean region. Gkikas et al. [9] bring together all aerosol and dust observations in Southern Europe, and it can be clearly seen that there is a gap of stations and observations over the Balkan region. So, the Albanian observations are a welcome addition to the characterization of dust in the Mediterranean region. Barnaba et al. [10] analyzed PM10 loads in Italy, and defined a dust day when PM10 by dust is > 10 . They found out that road(traffic) dust in Rome and elsewhere contributes about 2 to the dust load. Annual average in Southern Italy was > 5 around the years 2012. Included is the station in Lecce. These authors highlight the importance of dust as a contribution to environmental conditions and how difficult it is to describe dust events. And dust can be in the lower troposphere up to 5,6,7 km height and surface observations often miss these dust events. But any dust is relevant for the climate and especially for cloud and precipitation formation. So observations of PM profiles are welcome to the modeling community. Rogozovsky et al. [11] showed a list of dust event definitions. Significant or strong dust events (in surface in situ observations) are usually defined by PM10 >100 , lasting for at least three hours.
The Western Balkan region is a black spot regarding atmospheric observations, especially in studying aerosol vertical distribution and their properties. While numerous European Aerosol Research Lidar Network (EARLINET) stations across Europe support ground-based aerosol monitoring, the Western Balkans region lacks extensive coverage, with Belgrade, Serbia, being the only established site. The Belgrade station has not been operational for years now. Notably, Albania, located near the Adriatic Sea, has had no prior atmospheric observations. To address this gap, we deployed, for the first time, a Raman lidar in Tirana, Albania, conducting a one-year measurement campaign. This effort provides a unique and invaluable dataset for aerosol characterization. During this campaign, various aerosol events were observed, including Canadian and Greek wildfire smoke and Saharan dust, in addition to anthropogenic pollution. This region is particularly loaded with residential wood-burning smoke during the heating season. These residential wood combustion emissions impact the air quality and health by significantly enhancing the PM2.5 levels. Furthermore, these black carbon–rich emissions contribute to elevated lidar ratio values throughout the heating season [12]. The continuous one-year Raman lidar observations provided a comprehensive dataset for aerosol climatology over this region.
This study investigates seasonal variations in the vertical distribution of aerosol extinction and aerosol optical depth (AOD) using both ground-based POrtabLe Lidar sYstem POLLY) and satellite-based lidar (CALIPSO) observations. By comparing these datasets, we aim to identify local and regional contributions to aerosol climatology. Ground-based lidar measurements not only enhance the accuracy of CALIOP (Cloud-Aerosol Lidar with Orthogonal Polarization) retrievals but also serve as essential validation tools. One year of POLLY lidar observations from Tirana, Albania, alongside 15 years of CALIOP measurements, are incorporated.
The paper is structured as follows: Section 2 provides an overview of aerosol products retrieved from CALIOPO and POLLY lidars. Section 3 presents seasonal variations in aerosol extinction profiles, including AOD values, and compares CALIPSO and POLLY observations. Additionally, seasonally resolved HYSPLIT (Hybrid Single Particle Lagrangian Integrated Trajectory) cluster analysis offers insights into airflow patterns and aerosol transport. Moreover, two case studies are analyzed in detail and presented. Concluding remarks are given in Section 4.
2. Methodology
This study employs a comprehensive dataset, including satellite and ground-based lidar measurements. POLLY lidar was deployed in Tirana, Albania, from 8 November 2022 until 7 October 2023. Calipso delivers aerosol data from June 2006 to August 2023.
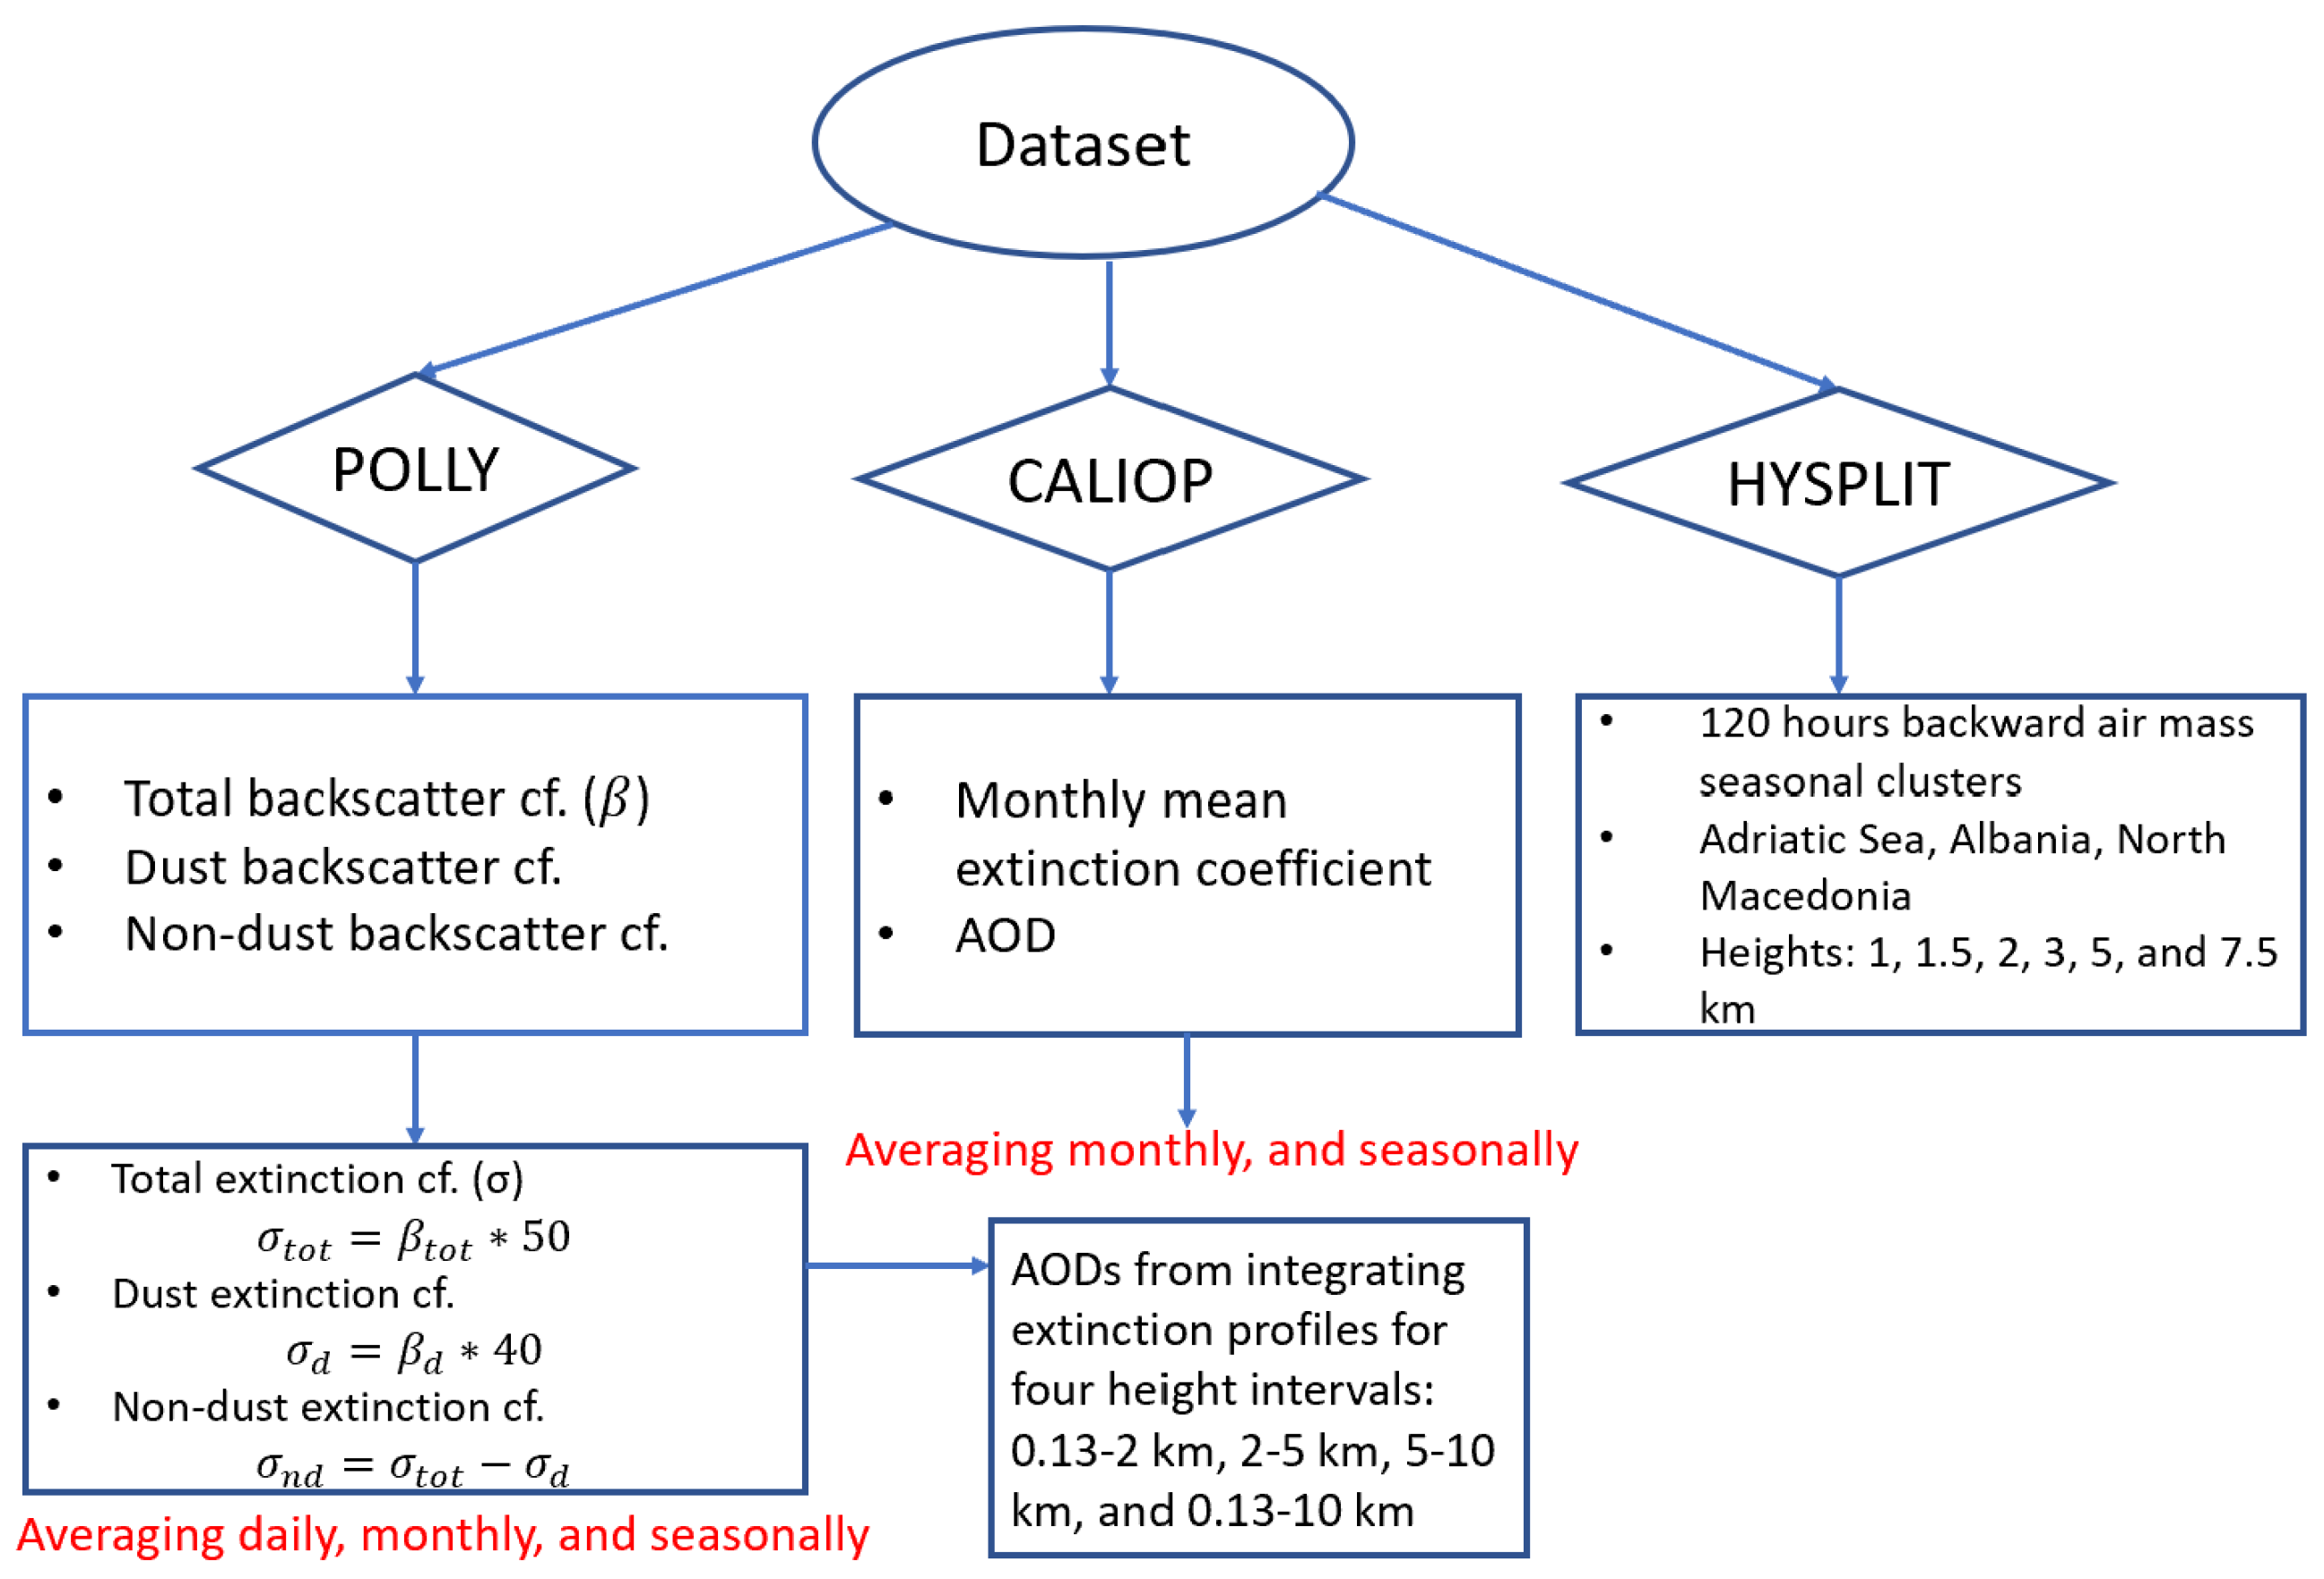
Ground–based lidars are characterized by high temporal resolution, while satellite–based ones are characterized by high spatial resolution. Although ground–based lidars are affected by an incomplete overlap between the laser beam and the receiver field–of–view, they still provide very accurate insights on the aerosol load and dynamics within the planetary boundary layer, allowing for estimating local contributions. Table 1 and Figure 1 provide details on the methodology followed in this study and the dataset employed.

Table 1.
Overview of the dataset employed in this study.
| Dataset | Parameters | Time Constraints |
|---|---|---|
| CALIOP | Extinction coefficient, AOD | 2006-2021 |
| POLLY | Extinction coefficient, AOD | Nov 2022-Oct 2023 |
| HYSPLIT | Cluster air mass trajectories | 2012-2022 |
Figure 1.
Flowchart illustrating the overall methodology followed in this study.
2.1. Study Area
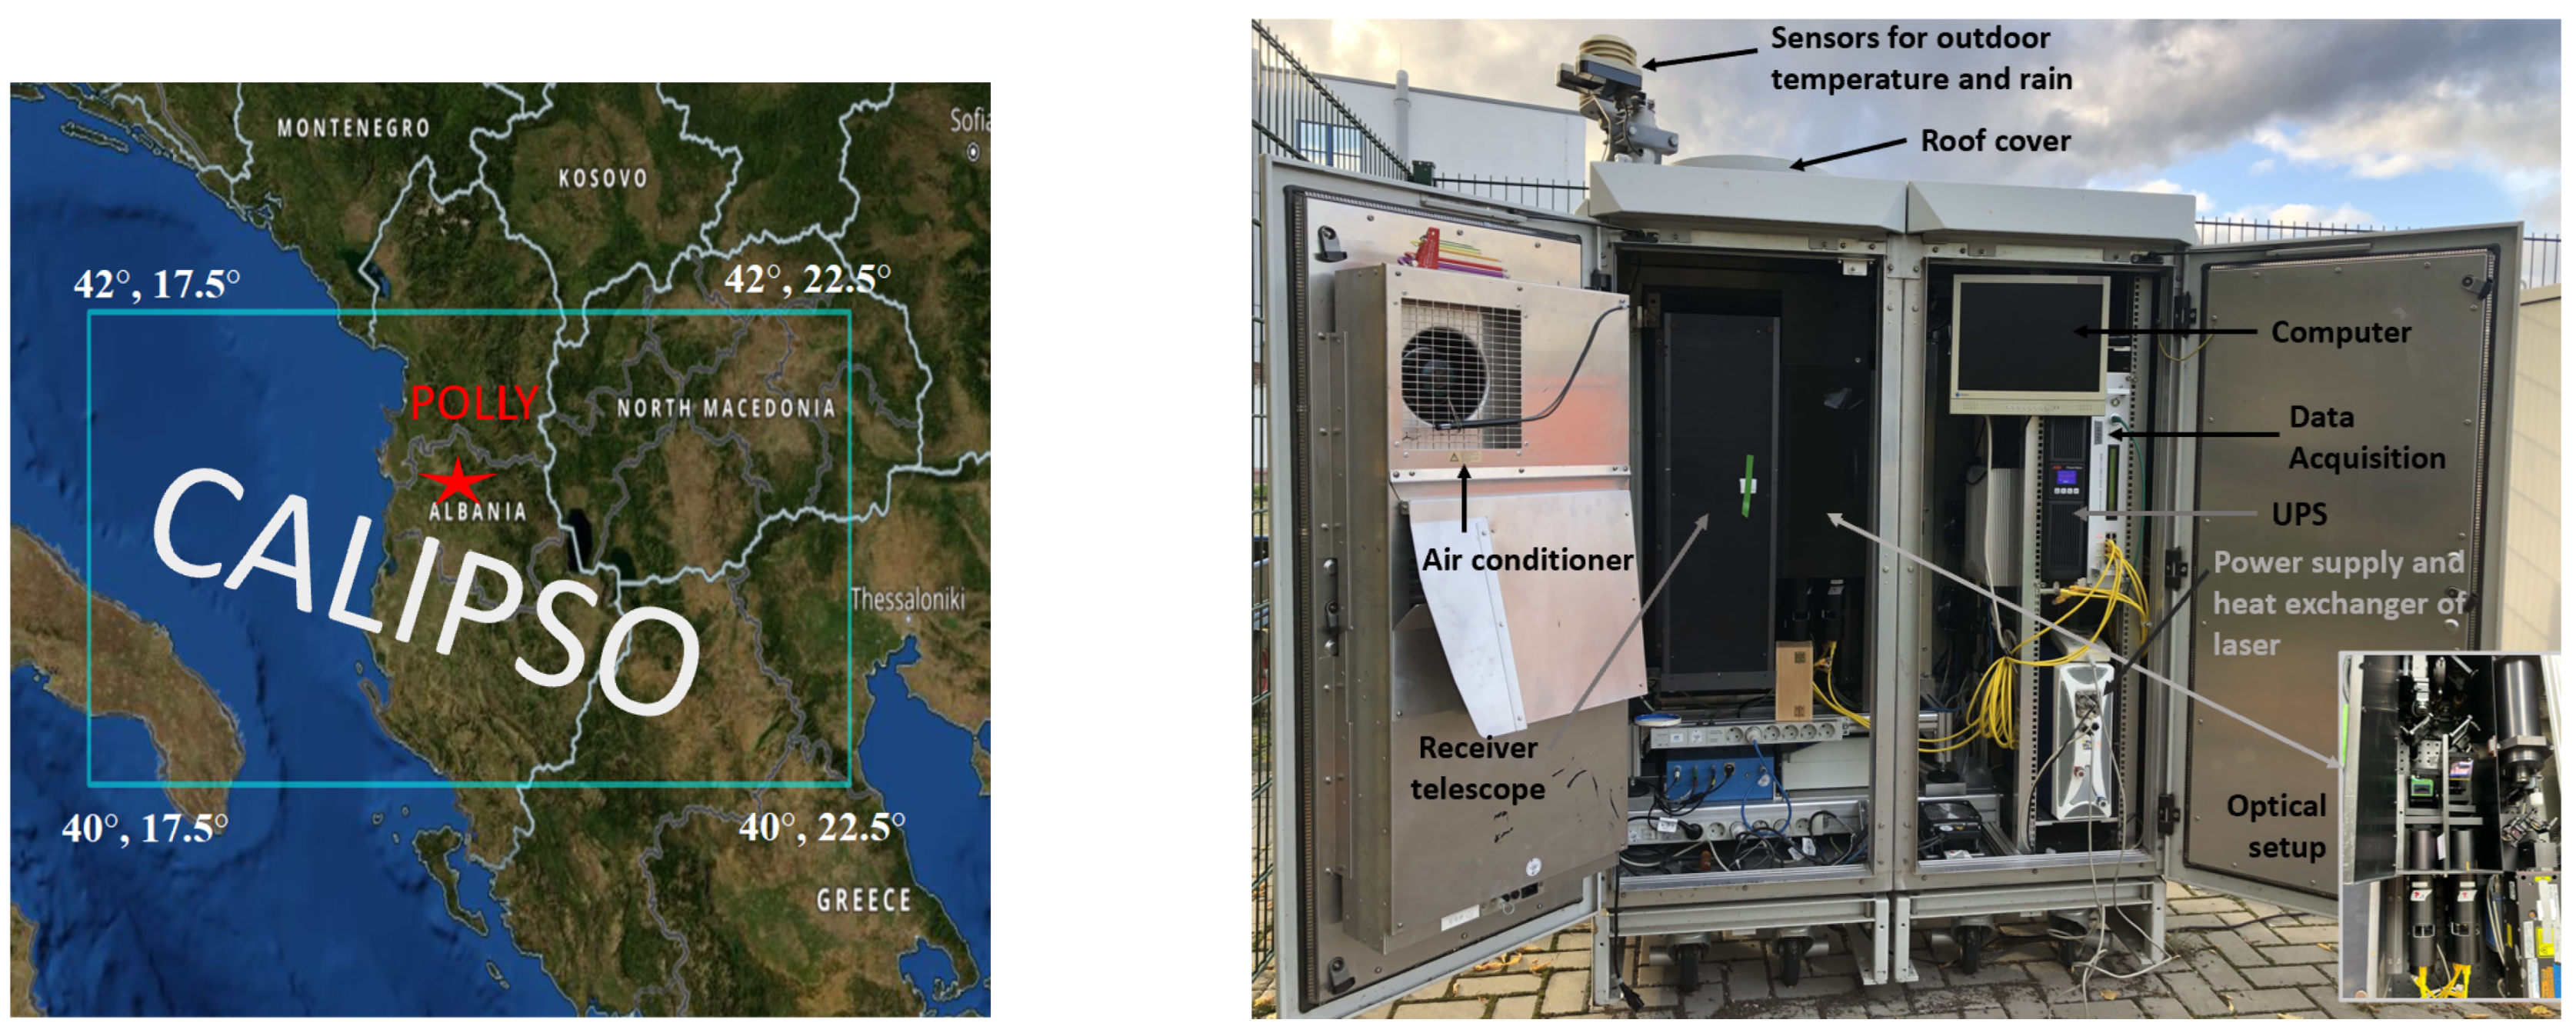
CALIPSO data products belong to the map area indicated by a blue square. POLLY’s observations were performed in the capital city of Albania, Tirana (41.36 N, 19.76 E), indicated by the red star in Figure 2. HYSPLIT air mass cluster analysis was conducted for three different locations over the Adriatic Sea, the POLLY site in Tirana, and North Macedonia. Due to insignificant changes among these locations, we present in this paper only the air mass cluster analysis for the POLLY site.
Figure 2.
The CALIPSO data grid (lat. – (left panel) and lon. –). POLLY_1v2 (right panel) instrument deployed at the Agricultural University of Tirana in Tirana.
Figure 2.
The CALIPSO data grid (lat. – (left panel) and lon. –). POLLY_1v2 (right panel) instrument deployed at the Agricultural University of Tirana in Tirana.
2.2. CALIPSO Observations
CALIOP is a two-wavelength (532 and 1064 nm) elastic backscatter lidar onboard CALIPSO that provides high-resolution vertical profiles of aerosols and clouds [13,14]. CALIOP is equipped with a three-channel receiver unit at 1064 nm, 532 nm parallel-polarized, and 532 nm cross-polarized. Calipso products are delivered as Level 1B (attenuated backscatter coefficient and depolarization ratio), Level 2 (backscatter coefficient and depolarization ratio), and Level 3 (monthly extinction coefficient globally gridded). A monthly global gridded dataset of daytime and nighttime aerosol extinction profiles and AOD has been developed and is available as a Level 3 aerosol product [2]. CALIPSO Level 3 data downloaded products are distributed as globally gridded means with x spatial resolution. The Level 3 products are available as: CALIPSO Lidar Level 3 Tropospheric Aerosol Profiles, Cloudy Sky Opaque Data; CALIPSO Lidar Level 3 Tropospheric Aerosol Profiles, Cloudy Sky Transparent Data; CALIPSO Lidar Level 3; CALIPSO Lidar Level 3 Tropospheric Aerosol Profiles, All Sky Data; Tropospheric Aerosol Profiles, Cloud Free Data. The dataset used in our study is CALIOP cloud-free Level 3, where averages are constructed from columns where no clouds are detected at 5 km horizontal resolution [15]. This study involves only nighttime observations.
- We make use of CALIPSO Level 3 data files, cloud-free data (V4.20 and V4.21)
- Spatial resolution x (horizontal), 60 m vertical
- Analysed 185 data files (total) for extinction for the time period June 2006 - December 2021
- Cal L2 data analysis for Albania, which has a small geographical area, is not easy to perform due to the low number of profiles and cloud occurrence
Table 2.
Overview of the data analysis from CALIPSO-derived aerosol extinction coefficients and AOD values.
Table 2.
Overview of the data analysis from CALIPSO-derived aerosol extinction coefficients and AOD values.
| Step | Description |
| 1 | Downloading CALIPSO Level 3 cloud-free (V4.20 and V4.21) nighttime data from Earthdata Search homepage |
| 2 | Generating monthly mean profiles of total and dust extinction coefficients for the geographical area ((lat. - and lon.- )) from June 2006 to December 2021 |
| 3 | Removing peaks of the extinction profile, indicative of clouds, after visual inspection |
| 4 | Computing non-dust extinction profiles by subtracting the dust extinction coefficient from the total extinction coefficient |
| 5 | Generating monthly AOD values from June 2006 to December 2021 using Python |
| 6 | Computing multi-year monthly means of total and dust extinction profiles and AOD values from June 2006 to December 2021 |
| 7 | Computing seasonal means and standard deviations |
2.3. POLLY Lidar Observations
The POLLY lidar is a single–wavelength polarization Raman lidar operated in Tirana, Albania. The instrument integrates a laser, power supply and heat exchanger, receiver telescope, data acquisition, computer, UPS, sensors for outdoor temperature and rain, roof cover, and the cabinet (see Figure 2 right panel). The laser head generates pulses at 532 nm wavelength, and the receiver unit is equipped with a far–range telescope and five photomultipliers operating in photon-detection mode [16,17,18]. The optical profiles are retrieved using the Raman method [19,20,21]. The particle backscatter coefficient, extinction coefficient, depolarization ratio, and lidar ratio profiles at 532 nm can be retrieved with the respective 10%, 20%, 10%, and 25%, respectively. The particle backscatter coefficient is retrieved with the Raman lidar method, so the overlap effect cancels out and is trustworthy down to 100–150 m [12,22]. The backscatter profiles are processed automatically by the POLLYNET processing chain (https://polly.tropos.de/) as described in Baars et al. [23]. The extinction coefficient and lidar ratio are impacted by incomplete overlap between the receiver and the laser. Full overlap is reached at about 600 m. To derive the extinction profiles down to the ground, we multiplied the particle backscatter coefficient by the lidar ratio. In the case of dust extinction, the lidar ratio was set to 40 sr, and for non–dust, a lidar ratio of 50 sr was implied.
Table 3.
Overview of the data analysis from POLLY-derived aerosol extinction coefficients and AOD values.
Table 3.
Overview of the data analysis from POLLY-derived aerosol extinction coefficients and AOD values.
| Step | Description |
| 1 | Profiles are automatically calculated by the processing chain; the profile "quicklooks" are available at https://POLLY.tropos.de |
| 2 | Downloading nighttime profiles automatically processed from TROPOS POLLYNET chain |
| 3 | Generating hourly backscatter coefficient profiles for total, dust, and non–dust components as measured by POLLY (lat. and lon.) from November 2022 to October 2023, selecting only nighttime cloud–free profiles |
| 4 | Computing extinction coefficient profiles for total, dust, and non-dust contributions by multiplying the total particle backscatter profile with the corresponding lidar ratio [20] |
| 5 | Computing daily and afterwards monthly aerosol extinction means along with standard deviations |
| 6 | Integrating the aerosol extinction profiles for different height ranges to obtain the AOD values for each month |
| 7 | Computing aerosol extinction seasonal means and standard deviations |
The extinction profiles are converted in aerosol mass concentration profiles following the equation below (see Eq. 3). Mass concentration profiles introduced in Figure 5 are derived using the extinction profiles in Figure 4. The mass concentrations are given in g m,
with the particle backscatter in Mmsr, the lidar ratio S in sr. Their product represents the aerosol extinction coefficient. The parameter denotes the particle density (g cm), while c is the extinction-to-volume conversion factor (Mm). For mineral dust we assume = 2.6 g cm, and . For non-dust particles, mainly sulfates, we use = 1.5 g cm, and . For smoke the values are = 1.15 g cm, and . The uncertainties are indicated by error bars and are estimated to be on the order of 30%. Mass concentration uncertainties were obtained through error propagation, considering uncertainties of about 10-20% for the lidar ratios, 10% for the smoke particle density, 5-10% for the backscatter coefficient, and an uncertainty of 20% in the extinction-to-volume conversion factor. [12,24,25].
3. Results
3.1. Aerosol Optical Depth
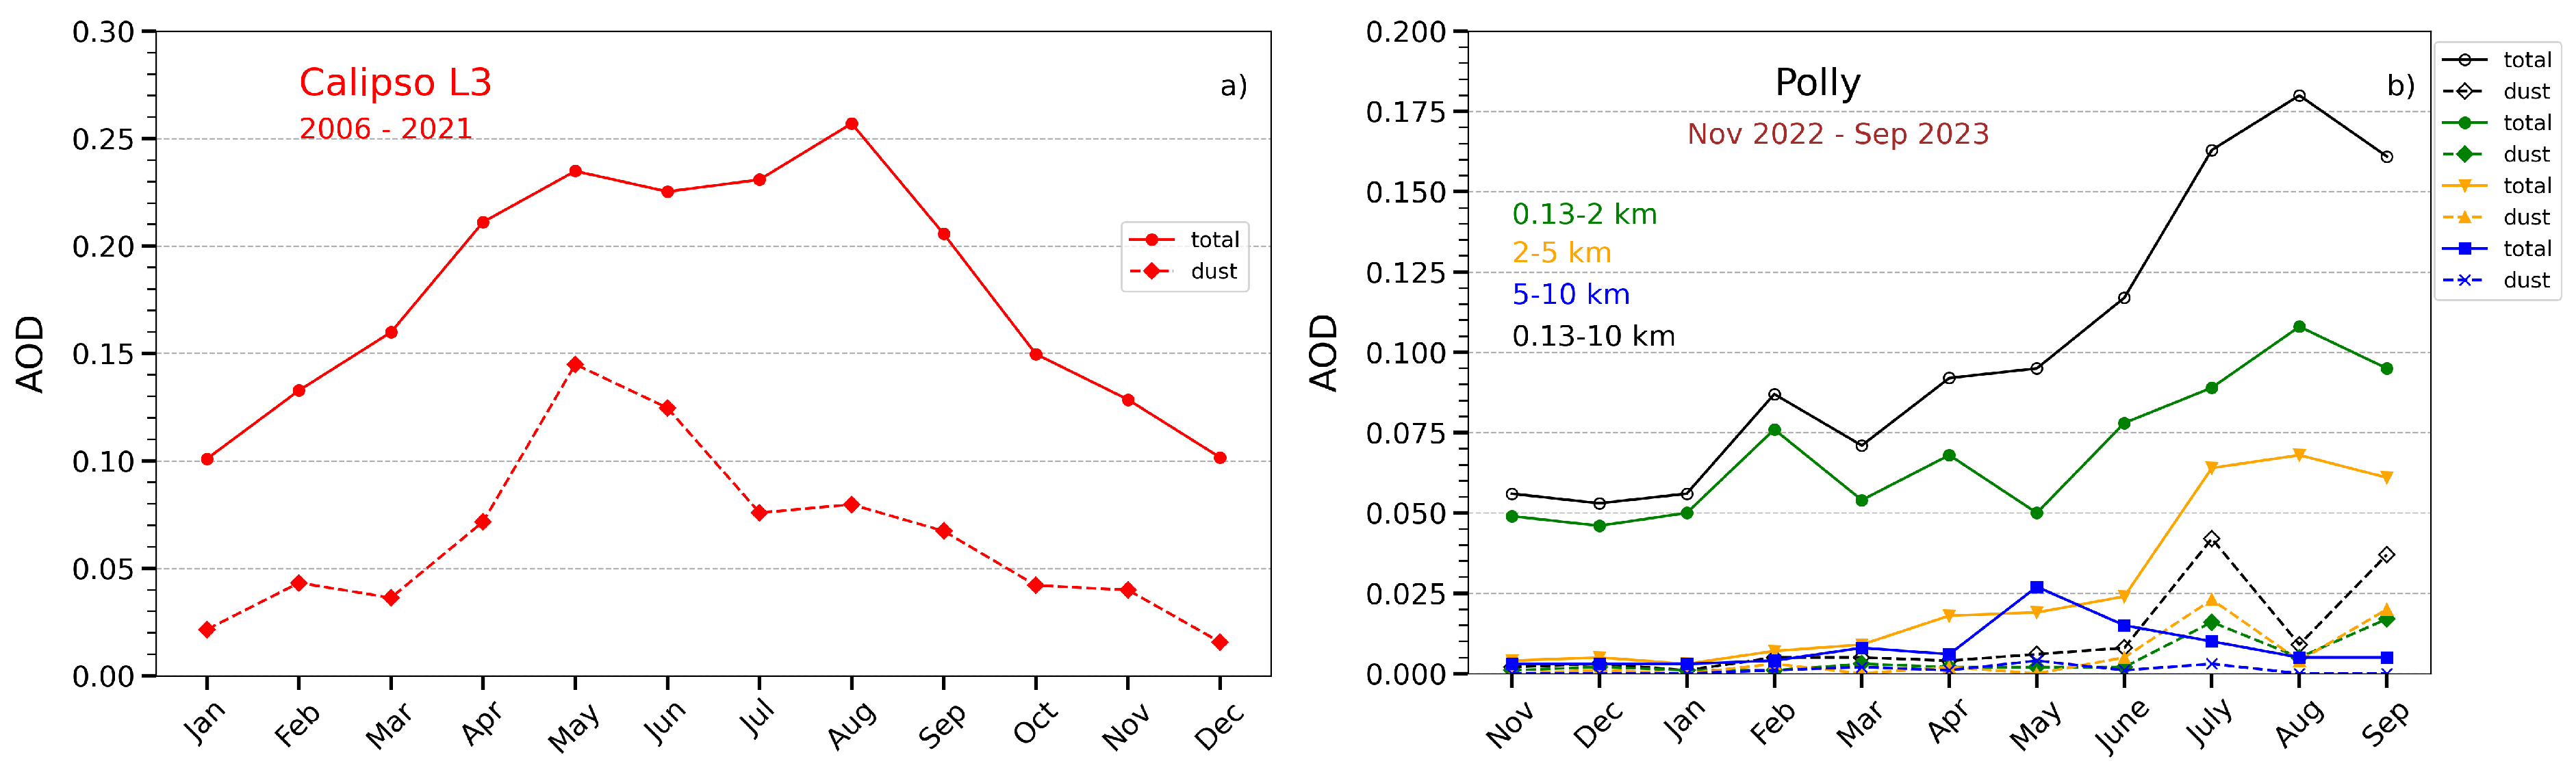
Figure 3a shows the total AOD time series from CALIOP observations for the given study area (see Figure 2 a), averaged from 2006 to 2021. The AOD dust contribution is presented in addition. The POLLY AOD values were retrieved after integrating the backscatter-derived extinction coefficient measured by POLLY from 8 November 2022 to 7 October 2023. The profiles are integrated for three different layers: 0.13–2 km, 2–5 km, 5–10 km, and from 0.13 to 10 km. In Figure 3b) we exclude the AOD values for October due to the low number of observations.
The Calipso AOD values vary between 0.01 to 0.26, while POLLY’s AOD ranges from 0.005 to 0.20. In both cases, the maximum AOD value is observed in August, and the minimum values are measured in winter. The main dust season appears to happen from April to September, culminating in May, according to Calipso observations. Referring to POLLY observations, we have two dust peaks, in May and July, but these peaks are comparably smaller than the Calipso one. One contributing factor to this difference is the high frequency of cloud occurrence during the POLLY campaign, particularly in winter and spring. Moreover, between 2006 and 2021, the Balkan region experienced significantly more intense Saharan dust outbreaks compared to the period 2022–2023. Additionally, the spatial averaging over a broader region in the case of CALIPSO data introduces further discrepancies. According to POLLY’s measurements, most of the aerosol is found at the first 2 km. From 2 to 5 km, there is a significant presence of aerosols, mainly from June to September. A slight difference in the value of dust AOD is noted between the 0.13–2 km and 2–5 km altitude ranges. This indicates that the dust layer is usually extended from the ground up to 5 km in height. AOD values for dust at altitudes between 5 and 10 km are negligible. An increasing trend in total aerosol is observed in the 0.13–-2 km and 2-–5 km layers, particularly pronounced from July to September. In general, the AOD values measured with POLLY are comparably smaller than the CALIPSO ones.
Figure 3.
a) Monthly mean AOD values for total aerosols (solid line) and dust (dashed line) derived from CALIPSO observations over the period 2006–-2021. Each data point represents the average of all AOD measurements for the corresponding month across the entire 16–year dataset. b) Monthly mean AOD values, derived from integrating the extinction coefficient, for total (solid line) and dust (dashed line) aerosols from POLLY observations at different altitude ranges: 0.13–-2 km (green), 2-–5 km (orange), 5-–10 km (blue), and 0.13–10 km (black) covering the period from November 2022 to September 2023.
3.2. Aerosol Extinction Climatology
Aerosol extinction vertical profiles up to 10 km height are retrieved using 15–year CALIPSO observations and one-year POLLY observations. Along with the total extinction coefficient at 532 nm (solid line), the contributions from dust (dashed line) and non-dust (dotted line) are computed and visualized as shown in Figure 4. The extinction profiles are seasonally averaged, with 15-year means shown for CALIPSO and one-year means for POLLY. The POLLY extinction profiles are plotted starting from 300 m.
It is generally observed that the main aerosol layer extends from the ground up to 2 km altitude. The maximum extinction coefficient is about 110 in the case of Calipso and was observed in spring. In spring, POLLY measures a maximum mean extinction coefficient of approximately 100 . During winter, the maximum height of the aerosol layer observed is around 3 km. In contrast, during the summer, the aerosol layer extends up to 8 km in height. During spring and autumn, the aerosol layer reaches a height of 5 km, and sometimes the presence of aerosol can be observed from 8 to 10 km height, as shown in the spring plot. Aerosols measured at such altitudes are related to the long-range transport of dust particles and wildfire smoke. Calipso extinction coefficient profiles are larger than those derived from POLLY, except for autumn, where they are almost the same. The differences are more pronounced among the dust components. Calipso extinction products involve a greater geographical area and a longer period than POLLY, covering more than 15 Saharan dust seasons. Although the vertical aerosol development is very similar in both cases throughout the seasons, unique observations were taken with Polly during the 2023 spring season. Between 8 and 10 km height wildfire smoke layers were detected originating from Canadian forest fires, especially in the second half of May and in June. Ground-based lidars operate 24 hours a day and have a high temporal resolution, allowing this method to capture aerosol transported from distant regions not often present at the observation site. In contrast, CALIPSO has a low temporal resolution, and the magnitude of aerosol extinction retrieved in the upper troposphere may be underestimated due to the detection limits of the CALIOP Level 2 retrieval algorithm [2].
Figure 4.
Seasonal mean profiles of the extinction coefficient at 532 nm computed for summer (JJA), winter (DJF), spring (MAM), and autumn (SON) rom POLLY signal profiles. One year of POLLY measurements (lines in green)(November 2022-October 2023) are considered. In contrast, 15 years of CALIOP observations (orange lines) (June 2006-December 2022), are seasonally averaged in the case of the total, dust, and non-dust extinction profiles. The standard deviations are shown by the error bars.
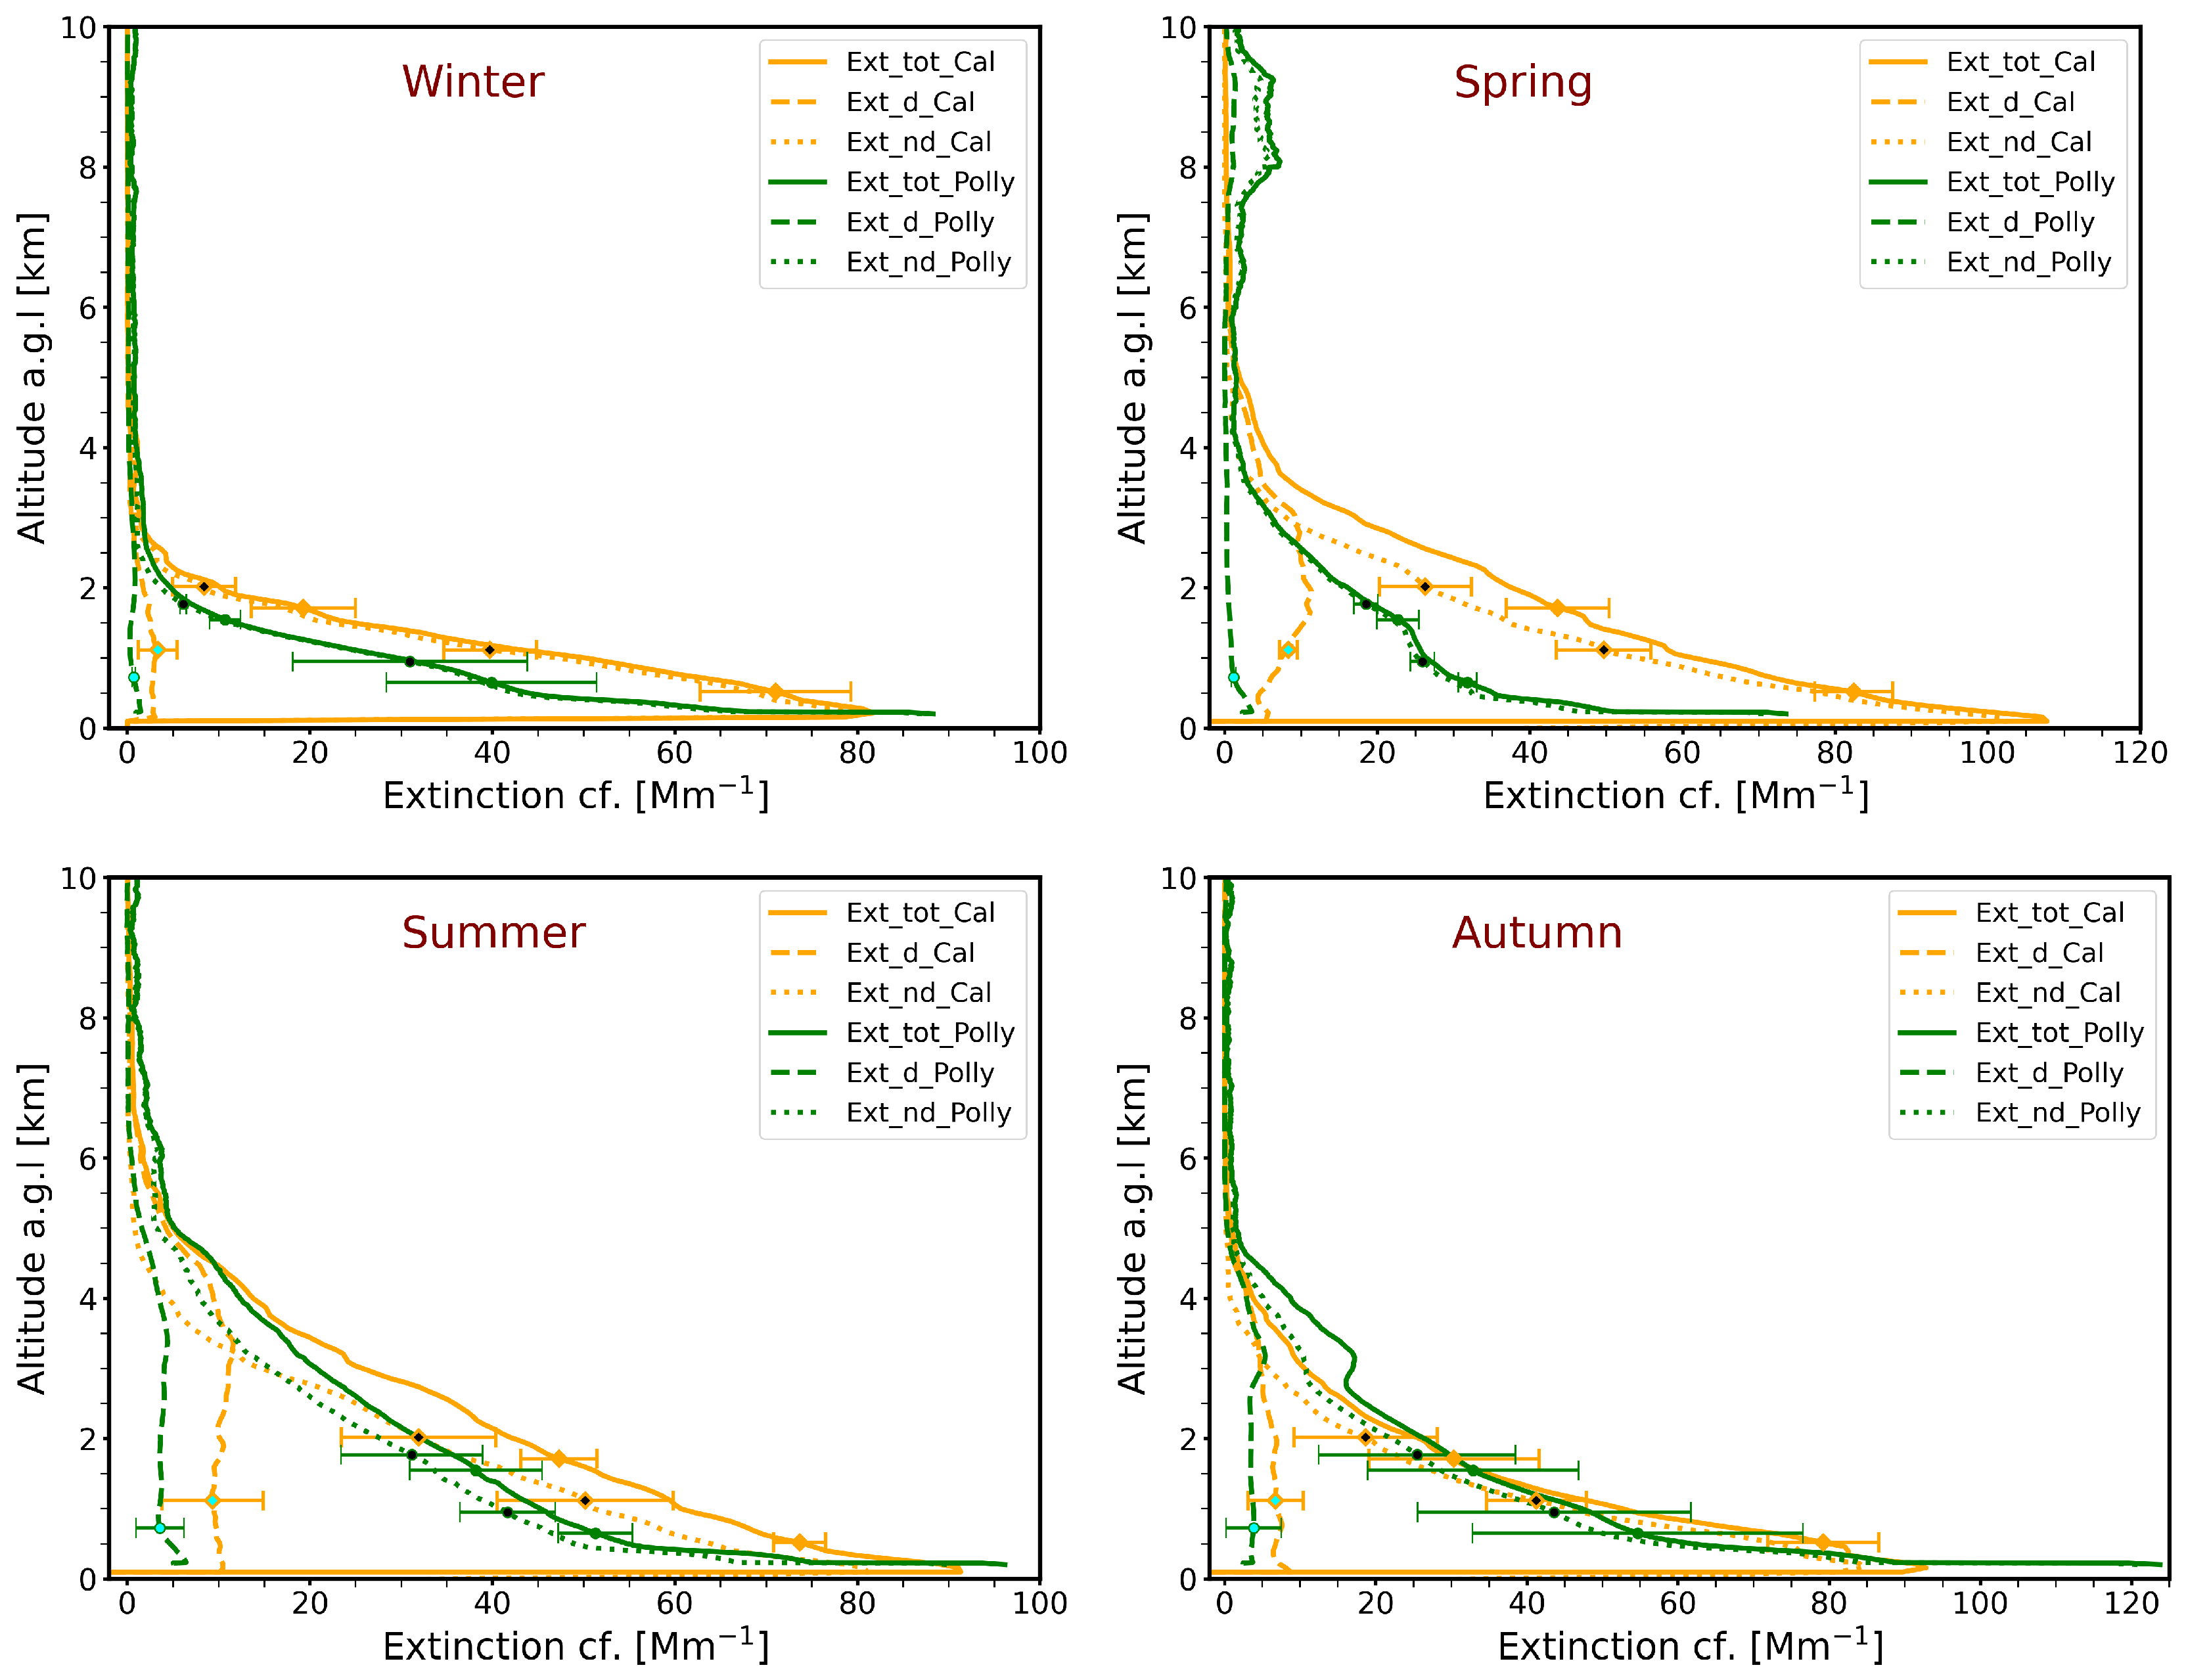
According to the CALIPSO 15-year means, dust is present every season and dominates in spring. In summer, the dust layer extended higher up. Dust measured with POLLY during summer is 50% less than dust measured with Calipso, and in autumn, they are almost same. There is a noticeable difference between dust profiles measured in spring. Frequently occurring cloudy and rainy conditions in the summer half–year 2023 are probably the reason for the low Saharan dust impact on the aerosol conditions measured with POLLY at Tirana in 2023. The seasonal mean profiles for dust and non–dust PM (particulate matter) clearly show that there is always background dust over Albania in spring and summer up to 4–5 km height. Only in winter, the dust impact is very low. A similar seasonally varying impact (spring, summer, autumn, winter) was found by Hofer et al. [22] over a Polly station in Central Asia, but at a much higher mean PM dust level, around mean values of 100–200 g m.
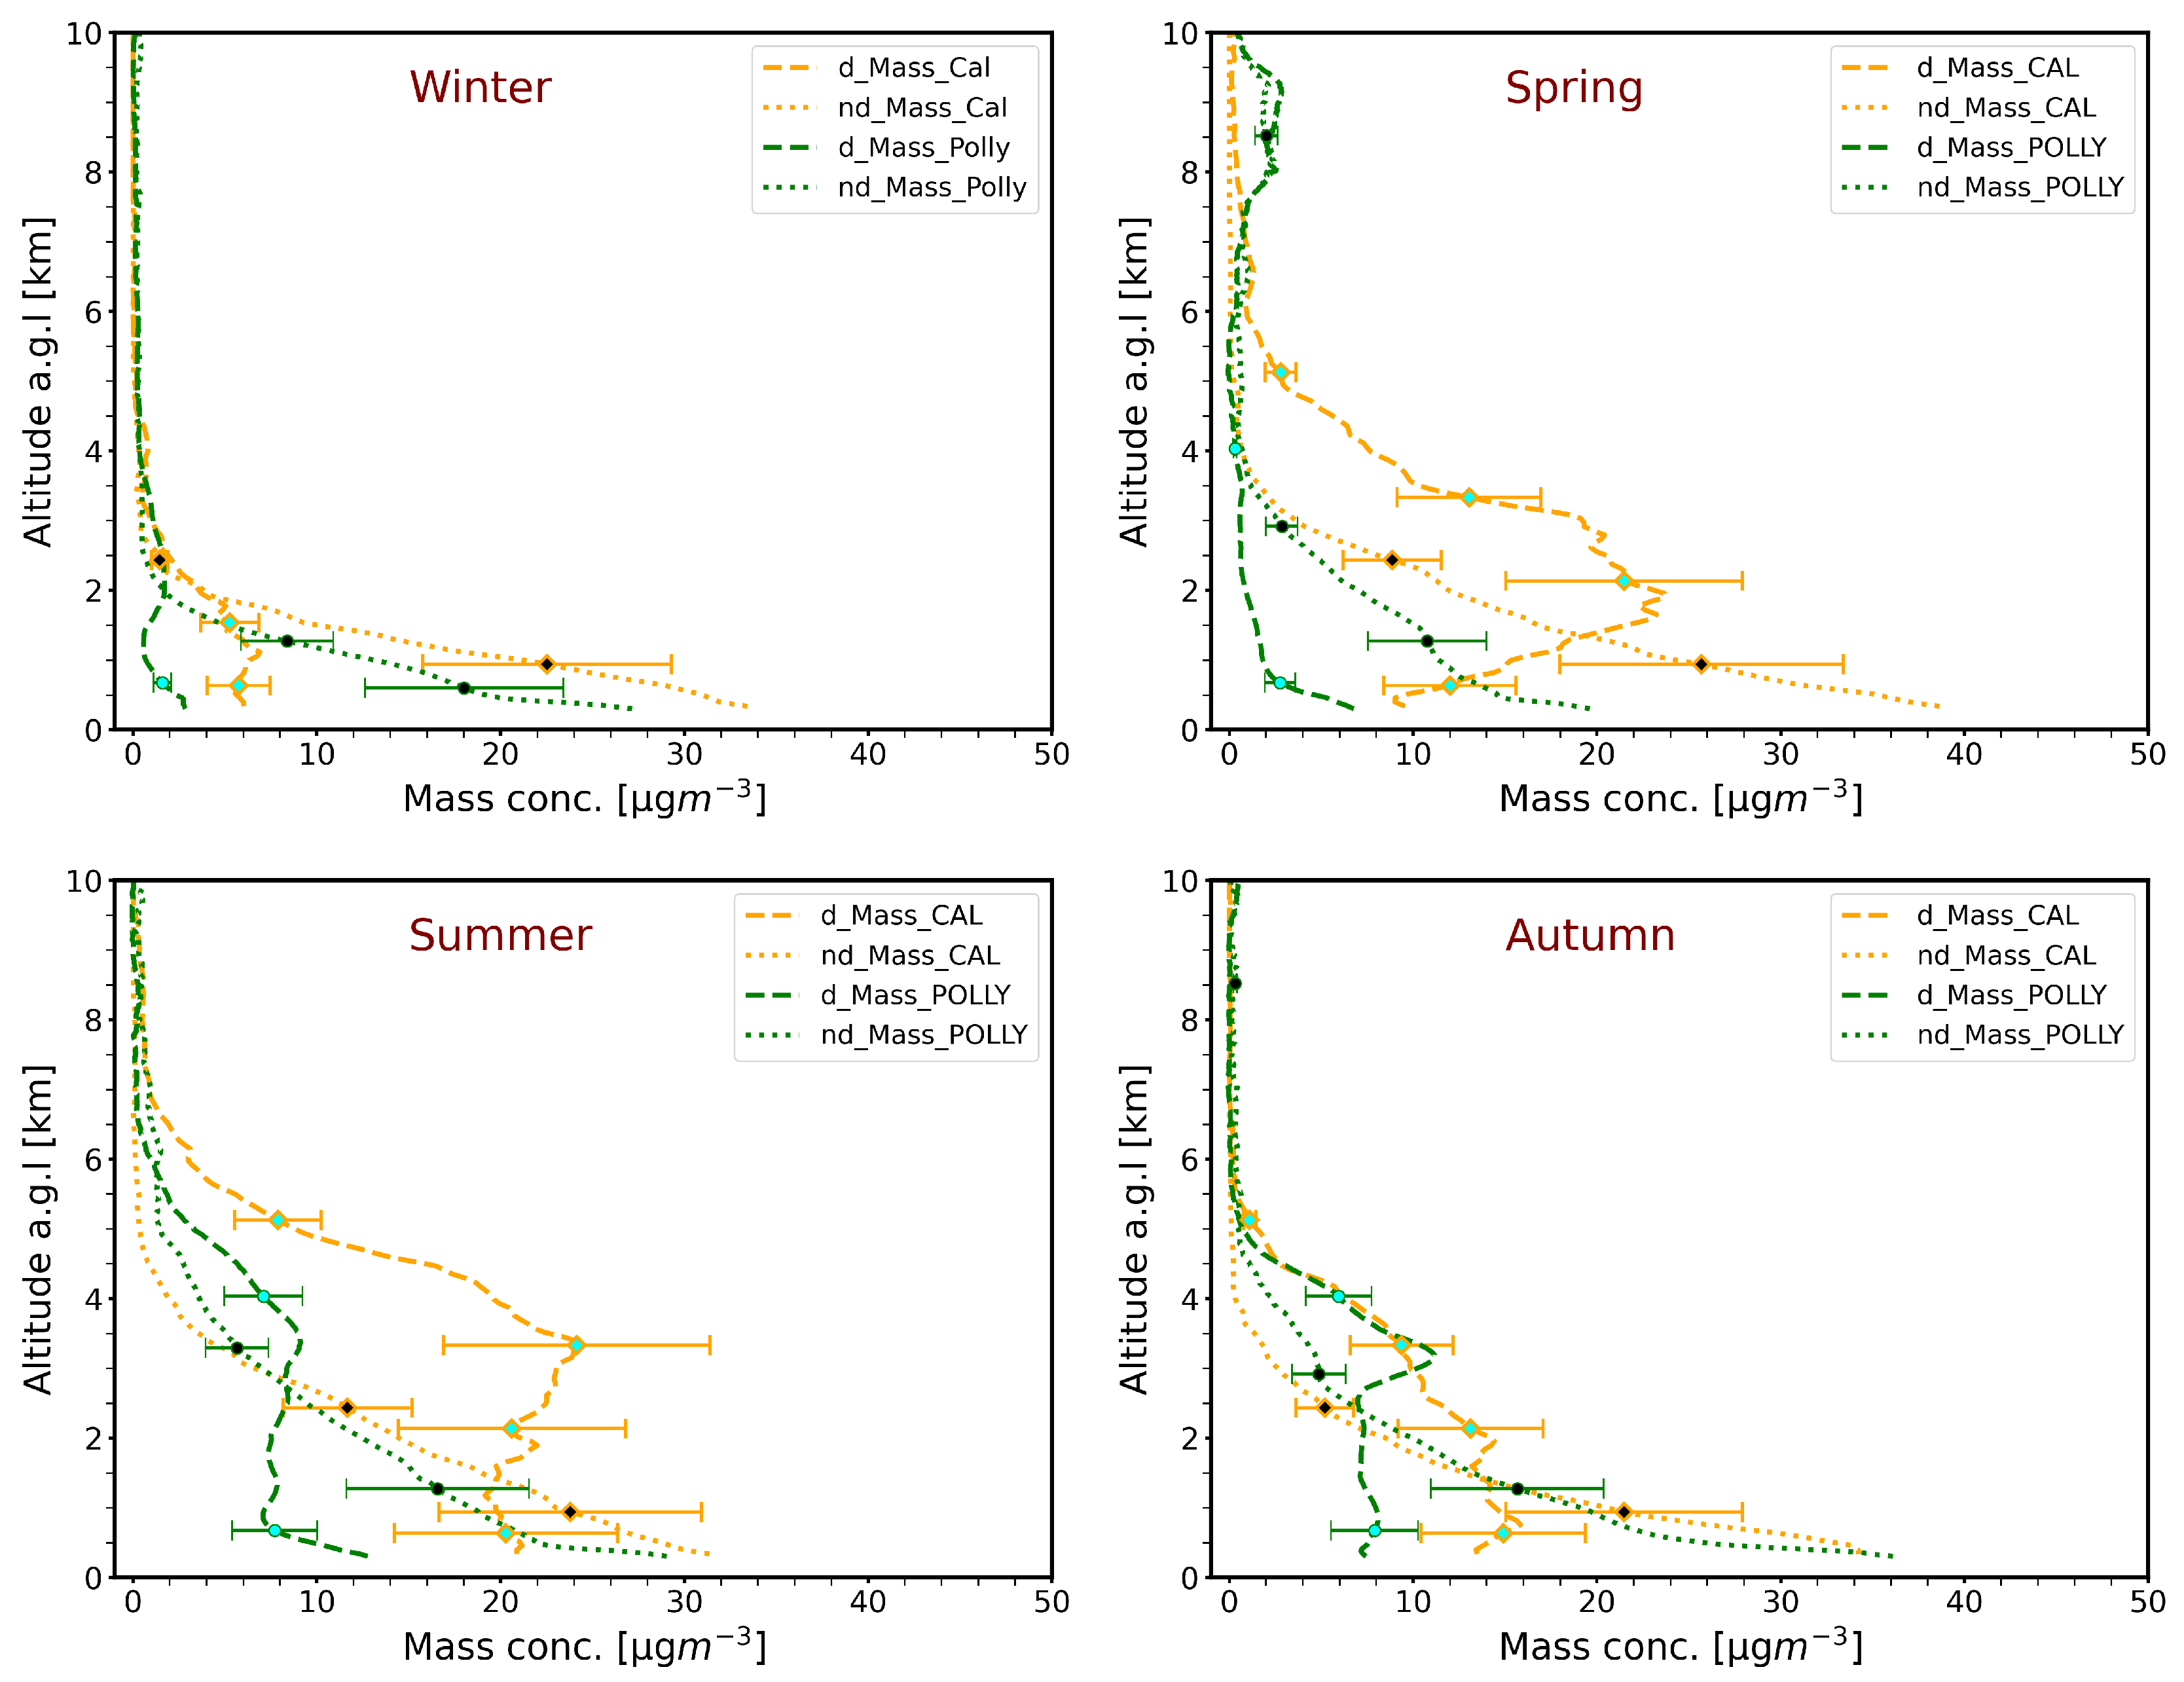
3.3. Aerosol Mass Climatology
We converted the extinction values in Section 3.2 into mass concentration values as described in Section 2.3. The results are shown in Figure 5. Good agreement was found between the CALIPSO observations (2006–2022) and the 2022–2023 POLLY observations for the anthropogenic aerosol fraction (non–dust fraction) in the autumn, winter, and summer seasons. The aerosol pollution was obviously almost constant over the 2006–2023 time period. An exception is found for the spring season. This may be caused by a very low heating contribution to the overall pollution in the spring of 2023. The autumn and summer values indicate the contribution of traffic and industrial activities to air pollution. The non-dust mass concentrations are around 30 g m in Tirana and the western Balkan region. In contrast, the dust mass concentrations vary a lot from season to season as the CALIPSO observations indicate. The Polly data may indicate that the 2022–2023 dust season was very weak. The dust mass concentrations were very low compared to the CALIPSO values, which may represent the climatological average.
Figure 5.
Seasonal mean profiles of the mass concentration at 532 nm computed for summer (JJA), winter (DJF), spring (MAM), and autumn (SON) from POLLY signal profiles. One year of POLLY measurements (lines in green)(November 2022–October 2023) is considered. In contrast, 15 years of CALIOP observations (orange lines) (June 2006–December 2022), are seasonally averaged. The uncertainties are denoted by the error bars.
3.4. Air Mass Cluster Analysis
Ten years (2012–2022) air mass 120–hour back–trajectories seasonal cluster analysis using HYSPLIT for three distinct locations within the grid area and for different height levels (1, 1.5, 2, 3, 5, 7.5 km) were performed to identify the aerosol main sources and investigate their transport. Backward trajectories arriving at the POLLY site, the Adriatic Sea, and North Macedonia. Due to insignificant differences among them, we present in this paper only the 5–day clusters for the POLLY site and heights of 1 km and 7.5 km (see Figure 6. The remaining figures are provided in the supplementary material.
Figure 6.
(a) Results of the seasonally resolved HYSPLIT cluster analysis of daily 120 h backward trajectories arriving above Tirana at 1 km height a.g.l. (upper panel) and 7.5 km height (lower panel) for winter (DJF), spring (MAM), summer (JJA), and autumn (SON). A period of 10 years (2012-2022) of daily HYSPLIT backward trajectories are considered, about 900 trajectories per season. The relative frequency of occurrence of air mass transport belonging to a specific cluster is given in percent at the beginning of the cluster trajectory, together with the cluster number.
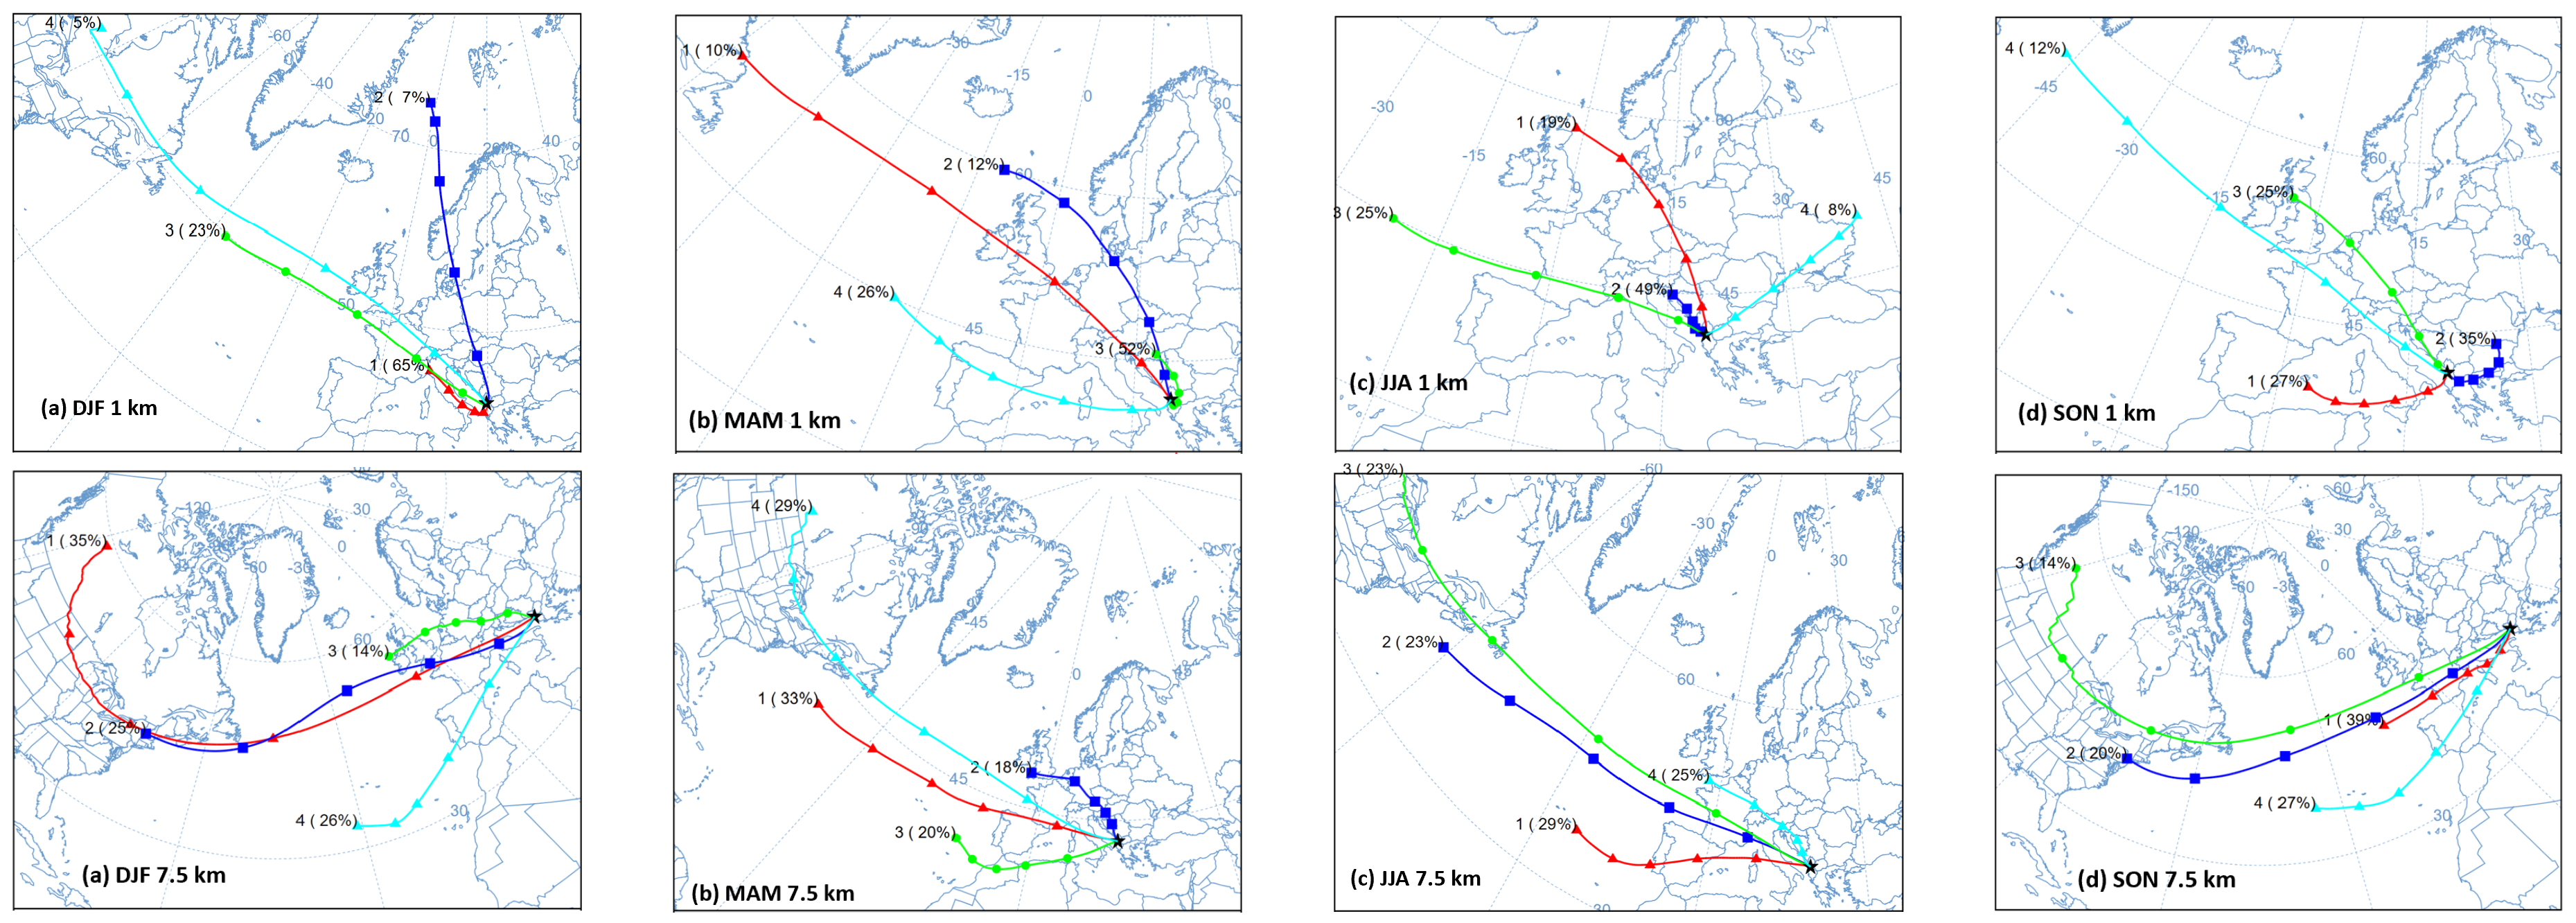
The highest cluster trajectory frequency in winter at 1 km height originated from Italy, with a frequency of 65%. Meanwhile, in spring and summer, the predominant air mass transport originates from the Balkans region. Source regions are nearby countries, such as Croatia and Bosnia and Herzegovina. In autumn, there is also a significant contribution from the Mediterranean Sea (cluster 1) and Bulgaria (cluster 2) (Figure 6 d). At 7.5 km height, long-range air mass transport prevails throughout all seasons. The aerosol originates mainly from North America (around 50%).
3.5. Case Study
In the following subsections, we present two case studies, one dust case and a dust–smoke case. In both cases, we apply the POLIPHON (Polarization Lidar Photometer Networking) method to separate the dust and non–dust fractions of the total aerosol backscatter coefficient [20]. The two cases demonstrate the full potential of the single-wavelength POLLY instrument. The Raman lidar method enables us to retrieve the lidar ratio profile, which contains information about the measured aerosol types.
3.5.1. Case Study: Dust
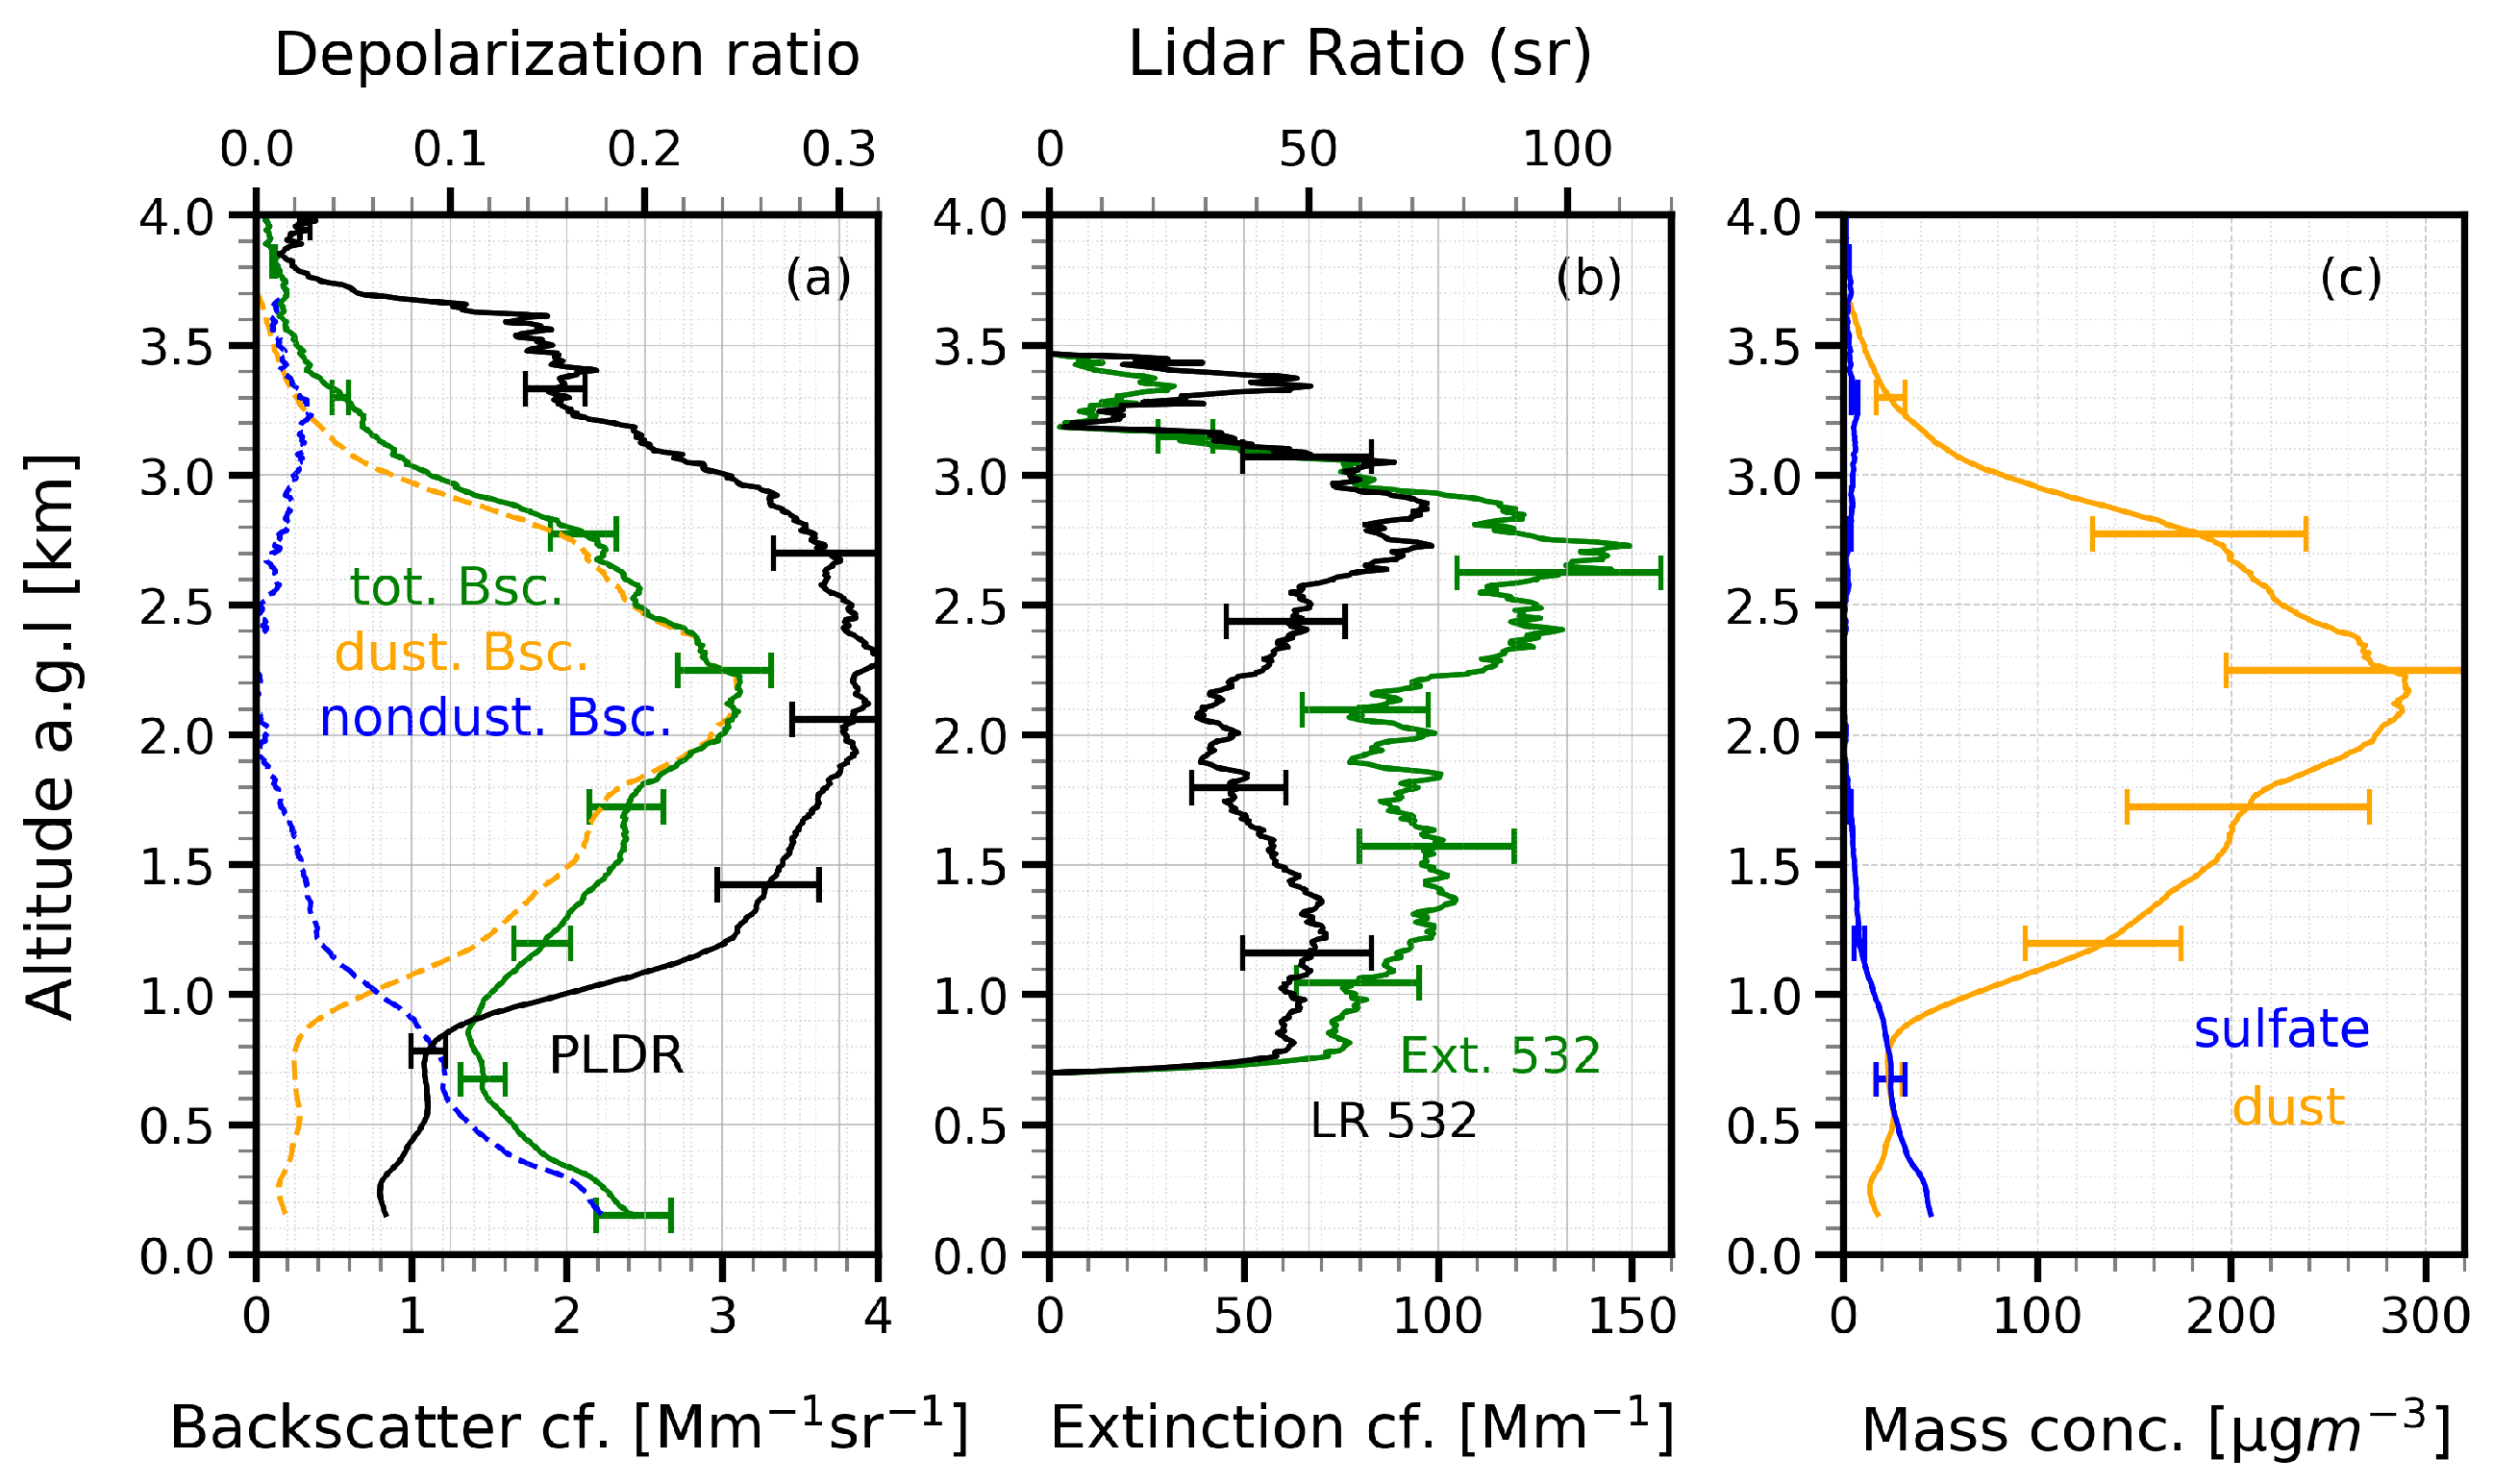
A strong dust outbreak that extended from 1 to 3 km, with a vertical depth of 2 km, was observed on the 14th of July 2023 in Tirana, Albania. A maximum backscatter of about 3 Mm was measured at around 2.2 km height. The depolarization ratio at the main layer is 30% and the lidar ratio ranges between 40 and 50 sr, indicative of dust [26]. The extinction coefficient varies between 100 and 150 Mm (see Figure 7 b). The optical profiles are averaged from 19:00 to 20:00 UTC with a vertical smoothing window of 292 m (39 bins) for the backscatter coefficient and depolarization ratio and 1042 m (139 bins) in the case of the extinction coefficient and lidar ratio.
The POLIPHON method is applied in order to separate dust and non–dust contributions. As shown by the blue line, indicating the non–dust backscatter profile, from the ground up to approximately 1 km, dominates the non–dust component (anthropogenic pollution). While between 3 and 3.5 km (the depolarization ratio <15%), a mixture of mineral dust and pollution is observed. In Figure 7 c, the pronounced Saharan dust outbreak showed maximum mass concentrations of 300 g m. The contribution of the non–dust fraction to mass concentration was negligible in the dust plume, but again around 30-50 g m below the plume (in the boundary layer in the lowest 1 km of the troposphere).
Figure 7.
Vertical profiles of aerosol optical properties retrieved for 14 July 2023, averaged from 19:00 to 20:00 UTC, in Tirana, Albania. a) Total backscatter coefficient at 532 nm (green solid line), particle linear depolarization ratio at 532 nm (black solid line), dust backscatter coefficient (orange dashed line), and non-dust backscatter coefficient (blue dashed line). b) Extinction coefficient (green line), and lidar ratio (black line). c) Dust and non-dust (sulfate) mass concentrations. Uncertainties are shown as error bars.
3.5.2. Case Study: Dust and Smoke
This case reveals a multi-layered aerosol structure, underscoring the complexity of aerosol conditions encountered in 2023.
Figure 8.
Vertical profiles of aerosol optical properties retrieved for 27 August 2023, averaged from 21:00 to 24:00 UTC, in Tirana, Albania. a) Total backscatter coefficient at 532 nm (green solid line), particle linear depolarization ratio at 532 nm (black solid line), dust backscatter coefficient (orange dashed line), and non-dust backscatter coefficient (blue dashed line). b) Extinction coefficient (green line), and lidar ratio (black line). c) Dust, non-dust (sulfate), and smoke mass concentrations. Uncertainties are shown as error bars.
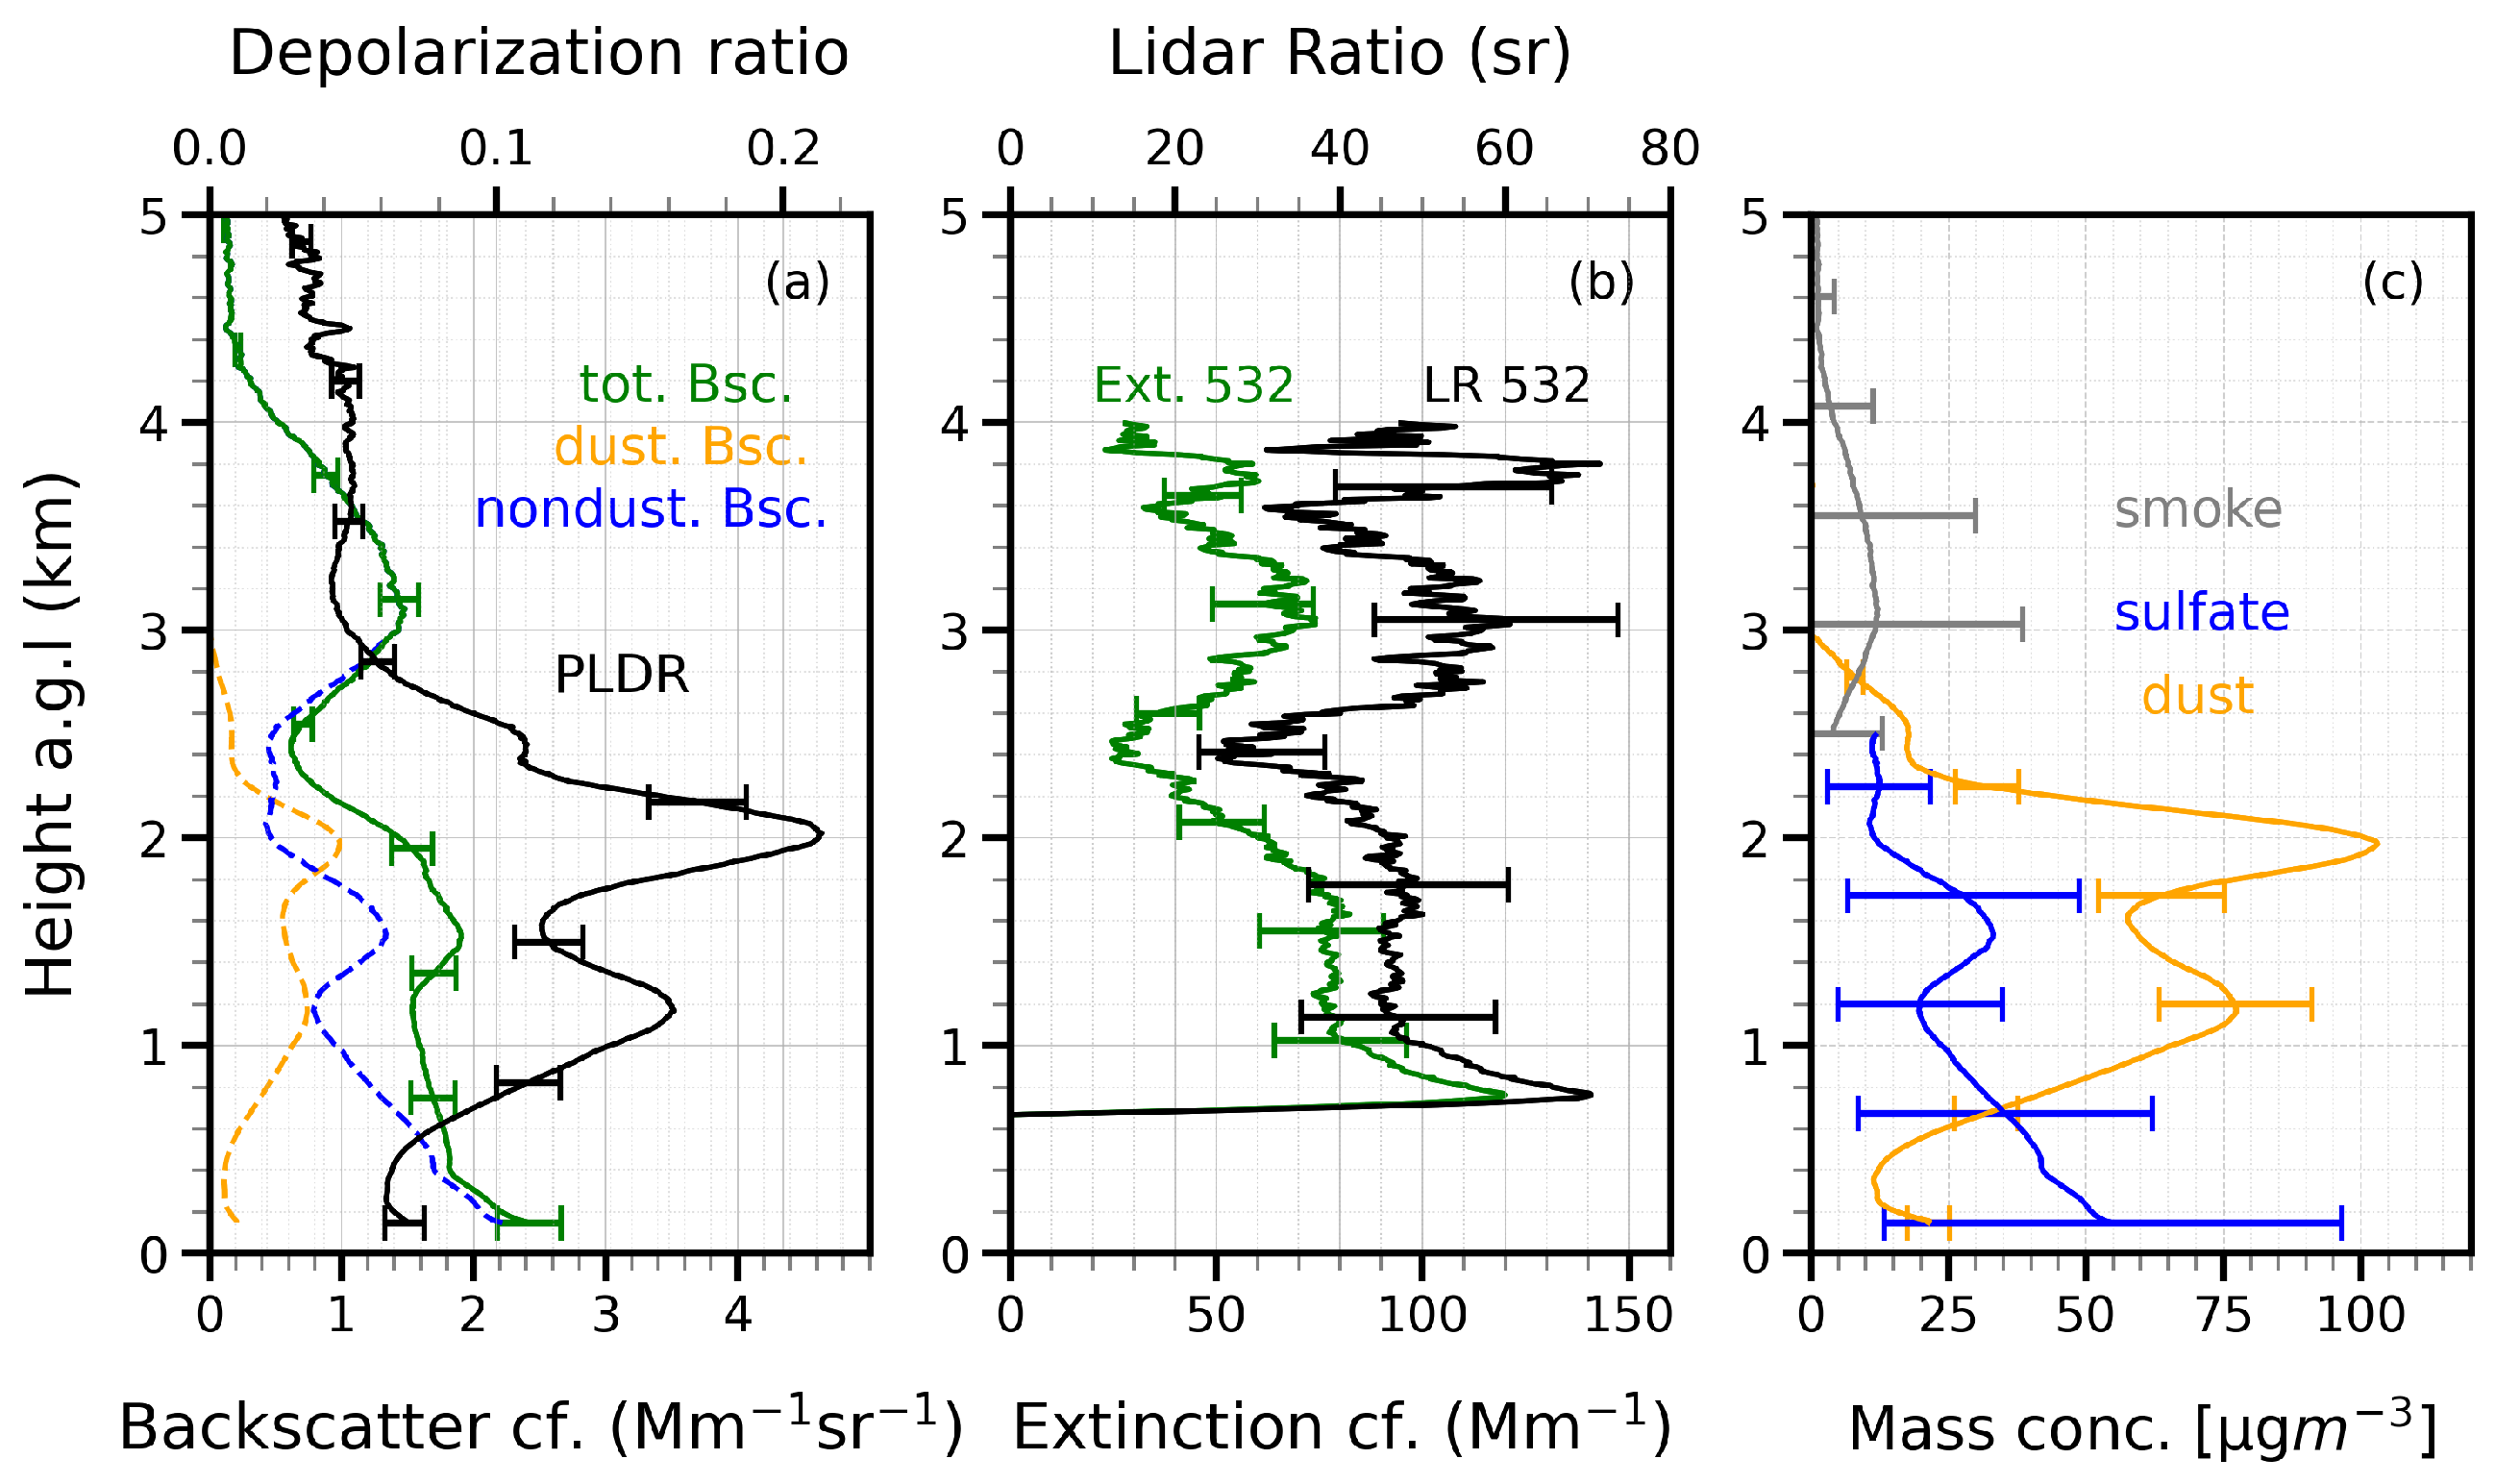
From the surface up to 1 km height, the non–dust component dominates. At 1.2 km and 2 km two peaks of 17% and 22% appear in the depolarization ratio profile, indicating the prevalence of mineral dust. This corresponds to a moderate dust outbreak, with mass concentrations of 50-100 g m between 1 and 3 km altitude. The maximum backscatter coefficient within the dust layer is about 1.8 Mm. The lidar ratio varies between 40 and 50 sr below 2.5 km, and increases to 50–70 sr above 2.6 km. Above the dust layer, between 2.8 and 4.4 km, a smoke layer is detected with mass concentration of 10 to 20 g m. The dust contribution here is negligible (vanishing above 3 km). Within this layer, the maximum extinction coefficient is about 70 Mm. A low depolarization ratio (<5%), combined with a lidar ratio greater than 55 sr provides clear evidence of smoke. The anthropogenic pollution contributes with 10-50 g m to the overall mass concentration within the lowermost 2 km of the atmosphere over Tirana.
4. Conclusions
This study examines the spatiotemporal and vertical distribution of the aerosol extinction coefficient and AOD across the Adriatic Sea, Albania, and North Macedonia, using the latest Level-3 Version 4.20 and 4.21 Standard Cloud-Free CALIOP datasets from 2006 to 2021. High-temporal-resolution extinction coefficient and AOD data are further supplemented by complementary observations conducted in Tirana, Albania, using a POLLY ground-based Raman lidar operating continuously for 24 hours during 2022–2023. Extinction profiles are shown up to 10 km height and demonstrate different aerosol layers, where the main layer is observed at first 2 kilometers, reaching a maximum of 110 Mm in the case of Calipso and 125 Mm in the case of POLLY. The aerosol layer is extended higher up during spring, summer, and autumn. In winter, most of the aerosol is found below 2.5 km. Strong dust outbreaks were observed, for example on 14 July 2023, with mass concentrations reaching up to 300 g m at around 2 km altitude. Moderate dust events occurred more frequently, such as on 27 August 2023, with concentrations below 100 g m. In contrast, pollution levels remained relatively constant across all seasons, with typical surface concentrations of 30-50 g m. The CALIPSO mission was terminated at the end of July 2023, leaving behind a comprehensive aerosol dataset. Its multi-year measurements and broader spatial coverage result in differences in the extinction profiles when compared to POLLY, which is based on only one year of observations. The differences are more pronounced when it comes to the dust component. The AOD values, computed and visualized on a monthly basis, also exhibit notable differences. CALIPSO AODs range from 0.02 to 0.26, whereas those from POLLY vary between 0.001 and 0.19. To better characterize the aerosol variations over Albania, longer ground-based lidar observations of particle backscatter, extinction, lidar ratio, and depolarization ratio at several wavelengths would be desirable. Air mass cluster analysis underlines the regional, continental, and intercontinental aerosol transport.
Author Contributions
Conceptualization, Gladiola Malollari, Albert Ansmann and Ronny Engelmann; Data curation, Gladiola Malollari and Kevin Ohneiser; Formal analysis, Gladiola Malollari; Investigation, Albert Ansmann and Ronny Engelmann; Methodology, Gladiola Malollari, Albert Ansmann, Julian Hofer, Kevin Ohneiser and Ronny Engelmann; Resources, Gladiola Malollari, Julian Hofer and Kevin Ohneiser; Software, Gladiola Malollari, Julian Hofer, Kevin Ohneiser and Fatbardh Sallaku; Supervision, Albert Ansmann, Ronny Engelmann and Seit Shallari; Validation, Gladiola Malollari, Julian Hofer and Kevin Ohneiser; Visualization, Gladiola Malollari; Writing – original draft, Gladiola Malollari; Writing – review & editing, Gladiola Malollari, Albert Ansmann, Fatbardh Sallaku and Seit Shallari. All authors will be updated at each stage of manuscript processing, including submission, revision, and revision reminder, via emails from our system or the assigned Assistant Editor.
Funding
This research received no funding.
Data Availability Statement
The POLLY dataset are available at Tropos server https://polly.tropos.de/calendar/location/46. The Calipso data are downloadable via the Earthdata Search homepage (https://search.earthdata.nasa.gov/search)
Acknowledgments
The authors express their gratitude to the Leibniz Institute for Tropospheric Research for conducting the lidar campaign in Albania, and to the Agricultural University of Tirana for facilitating this campaign and supporting this research through scholarships.
Conflicts of Interest
The authors declare no conflicts of interest.
Abbreviations
The following abbreviations are used in this manuscript:
| CALIPSO | Cloud-Aerosol Lidar and Infrared Pathfinder Satellite Observations |
| CALIOP | Cloud-Aerosol Lidar with Orthogonal Polarization) |
| POLLY | POrtabLe Lidar sYstem |
| HYSPLIT | (Hybrid Single Particle Lagrangian Integrated Trajectory |
| POLIPHON | Polarization Lidar Photometer Networking |
References
- Boucher, O.; Randall, D.; Artaxo, P.; Bretherton, C.; Feingold, G.; Forster, P.; Kerminen, V.M.; Kondo, Y.; Liao, H.; Lohmann, U.; et al. Clouds and Aerosols. In Climate Change 2013: The Physical Science Basis. Contribution of Working Group I to the Fifth Assessment Report of the Intergovernmental Panel on Climate Change; Technical report; Intergovernmental Panel on Climate Change: Cambridge, United Kingdom and New York, NY, USA, 2013. [Google Scholar]
- Winker, D.M.; Tackett, J.L.; Getzewich, B.J.; Liu, Z.; Vaughan, M.A.; Rogers, R.R. The global 3-D distribution of tropospheric aerosols as characterized by CALIOP. Atmospheric Chemistry and Physics 2013, 13, 3345–3361. [Google Scholar] [CrossRef]
- Pappalardo, G.; Wandinger, U.; Mona, L.; Hiebsch, A.; Mattis, I.; Amodeo, A.; Ansmann, A.; Seifert, P.; Linné, H.; Apituley, A.; et al. EARLINET correlative measurements for CALIPSO: First intercomparison results. Journal of Geophysical Research: Atmospheres 2010, 115. [Google Scholar] [CrossRef]
- Yu, H.; Chin, M.; Winker, D.M.; Omar, A.H.; Liu, Z.; Kittaka, C.; Diehl, T. Global view of aerosol vertical distributions from CALIPSO lidar measurements and GOCART simulations: Regional and seasonal variations. Journal of Geophysical Research: Atmospheres 2010, 115. [Google Scholar] [CrossRef]
- Mamouri, R.E.; Amiridis, V.; Papayannis, A.; Giannakaki, E.; Tsaknakis, G.; Balis, D.S. Validation of CALIPSO space-borne-derived attenuated backscatter coefficient profiles using a ground-based lidar in Athens, Greece. Atmospheric Measurement Techniques 2009, 2, 513–522. [Google Scholar] [CrossRef]
- Rogozovsky, I.; Ansmann, A.; Hofer, J.; Chudnovsky, A. Unveiling Atmospheric Layers: Vertical Pollution Patterns and Prospects for High-Resolution Aerosol Retrievals Using the Eastern Mediterranean as a Case Study. Environmental Science & Technology 2025, 59, 12181–12195. [Google Scholar] [CrossRef]
- Solomon, S.; Qin, D.; Manning, M.; Chen, Z.; Marquis, M.; Avery, K.; Tignor, M.; Miller, H. Climate Change 2007: The Physical Science Basis. Working Group I Contribution to the Fourth Assessment Report of the IPCC; Cambridge University Press, 2007; Vol. 1. [Google Scholar]
- Ansmann, A.; Wandinger, U.; Riebesell, M.; Weitkamp, C.; Michaelis, W. Independent measurement of extinction and backscatter profiles in cirrus clouds by using a combined Raman elastic-backscatter lidar. Appl. Opt. 1992, 31, 7113–7131. [Google Scholar] [CrossRef]
- Gkikas, A.; Basart, S.; Hatzianastassiou, N.; Marinou, E.; Amiridis, V.; Kazadzis, S.; Pey, J.; Querol, X.; Jorba, O.; Gassó, S.; et al. Mediterranean intense desert dust outbreaks and their vertical structure based on remote sensing data. Atmospheric Chemistry and Physics 2016, 16, 8609–8642. [Google Scholar] [CrossRef]
- Barnaba, F.; Bolignano, A.; Di Liberto, L.; Morelli, M.; Lucarelli, F.; Nava, S.; Perrino, C.; Canepari, S.; Basart, S.; Costabile, F.; et al. Desert dust contribution to PM10 loads in Italy: Methods and recommendations addressing the relevant European Commission Guidelines in support to the Air Quality Directive 2008/50. Atmospheric Environment 2017, 161, 288–305. [Google Scholar] [CrossRef]
- Rogozovsky, I.; Ansmann, A.; Baars, H.; Engelmann, R.; Chudnovsky, A. The challenge of identifying dust events in a highly polluted Eastern Mediterranean region. Science of The Total Environment 2024, 953, 175920. [Google Scholar] [CrossRef]
- Malollari, G.; Ansmann, A.; Chudnovsky, A.; Baars, H.; Engelmann, R.; Althausen, D.; Heese, B.; Shallari, S. Vertical profiling of residential wood combustion aerosols over Tirana, Albania: First lidar-based observations. Atmospheric Environment 2025, 359, 121358. [Google Scholar] [CrossRef]
- Winker, D.M.; Hunt, W.H.; McGill, M.J. Initial performance assessment of CALIOP. Geophysical Research Letters 2007, 34. [Google Scholar] [CrossRef]
- Winker, D.M.; Vaughan, M.A.; Omar, A.; Hu, Y.; Powell, K.A.; Liu, Z.; Hunt, W.H.; Young, S.A. Overview of the CALIPSO Mission and CALIOP Data Processing Algorithms. Journal of Atmospheric and Oceanic Technology 2009, 26, 2310–2323. [Google Scholar] [CrossRef]
- Tackett, J.L.; Winker, D.M.; Getzewich, B.J.; Vaughan, M.A.; Young, S.A.; Kar, J. CALIPSO lidar level 3 aerosol profile product: version 3 algorithm design. Atmospheric Measurement Techniques 2018, 11, 4129–4152. [Google Scholar] [CrossRef] [PubMed]
- Althausen, D.; Engelmann, R.; Foster, R.; Rhone, P.; Baars, H. Portable Raman lidar for determination of particle backscatter and extinction coefficients. In Proceedings of the 22nd Internation Laser Radar Conference (ILRC 2004); 2004; Vol. 561, p. 83. [Google Scholar]
- Althausen, D.; Engelmann, R.; Baars, H.; Heese, B.; Ansmann, A.; Müller, D.; Komppula, M. Portable Raman Lidar PollyXT for Automated Profiling of Aerosol Backscatter, Extinction, and Depolarization. Journal of Atmospheric and Oceanic Technology 2009, 26, 2366–2378. [Google Scholar] [CrossRef]
- Malollari, G.; Ansmann, A.; Baars, H.; Jimenez, C.; Hofer, J.; Engelmann, R.; Skupin, N.; Shallari, S. Ångström exponent impact on the aerosol optical properties obtained from vibrational-rotational Raman lidar observations. EGUsphere 2025, 2025, 1–12. [Google Scholar] [CrossRef]
- Ansmann, A.; Seifert, P.; Tesche, M.; Wandinger, U. Profiling of fine and coarse particle mass: case studies of Saharan dust and Eyjafjallajökull/Grimsvötn volcanic plumes. Atmospheric Chemistry and Physics 2012, 12, 9399–9415. [Google Scholar] [CrossRef]
- Tesche, M.; Ansmann, A.; Müller, D.; Althausen, D.; Engelmann, R.; Freudenthaler, V.; Groß, S. Vertically resolved separation of dust and smoke over Cape Verde using multiwavelength Raman and polarization lidars during Saharan Mineral Dust Experiment 2008. Journal of Geophysical Research: Atmospheres 2009, 114. [Google Scholar] [CrossRef]
- Mamouri, R.E.; Ansmann, A. Fine and coarse dust separation with polarization lidar. Atmospheric Measurement Techniques 2014, 7, 3717–3735. [Google Scholar] [CrossRef]
- Hofer, J.; Ansmann, A.; Althausen, D.; Engelmann, R.; Baars, H.; Abdullaev, S.F.; Makhmudov, A.N. Long-term profiling of aerosol light extinction, particle mass, cloud condensation nuclei, and ice-nucleating particle concentration over Dushanbe, Tajikistan, in Central Asia. Atmospheric Chemistry and Physics 2020, 20, 4695–4711. [Google Scholar] [CrossRef]
- Baars, H.; Kanitz, T.; Engelmann, R.; Althausen, D.; Heese, B.; Komppula, M.; Preißler, J.; Tesche, M.; Ansmann, A.; Wandinger, U.; et al. An overview of the first decade of PollyNET: an emerging network of automated Raman-polarization lidars for continuous aerosol profiling. Atmospheric Chemistry and Physics 2016, 16, 5111–5137. [Google Scholar] [CrossRef]
- Chen, J.; Li, C.; Ristovski, Z.; Milic, A.; Gu, Y.; Islam, M.S.; Wang, S.; Hao, J.; Zhang, H.; He, C.; et al. A review of biomass burning: Emissions and impacts on air quality, health and climate in China. Science of The Total Environment 2017, 579, 1000–1034. [Google Scholar] [CrossRef]
- Ansmann, A.; Ohneiser, K.; Mamouri, R.E.; Knopf, D.A.; Veselovskii, I.; Baars, H.; Engelmann, R.; Foth, A.; Jimenez, C.; Seifert, P.; et al. Tropospheric and stratospheric wildfire smoke profiling with lidar: mass, surface area, CCN, and INP retrieval. Atmospheric Chemistry and Physics 2021, 21, 9779–9807. [Google Scholar] [CrossRef]
- Floutsi, A.A.; Baars, H.; Engelmann, R.; Althausen, D.; Ansmann, A.; Bohlmann, S.; Heese, B.; Hofer, J.; Kanitz, T.; Haarig, M.; et al. DeLiAn – a growing collection of depolarization ratio, lidar ratio and Ångström exponent for different aerosol types and mixtures from ground-based lidar observations. Atmospheric Measurement Techniques 2023, 16, 2353–2379. [Google Scholar] [CrossRef]
Disclaimer/Publisher’s Note: The statements, opinions and data contained in all publications are solely those of the individual author(s) and contributor(s) and not of MDPI and/or the editor(s). MDPI and/or the editor(s) disclaim responsibility for any injury to people or property resulting from any ideas, methods, instructions or products referred to in the content. |
© 2025 by the authors. Licensee MDPI, Basel, Switzerland. This article is an open access article distributed under the terms and conditions of the Creative Commons Attribution (CC BY) license (http://creativecommons.org/licenses/by/4.0/).
Copyright: This open access article is published under a Creative Commons CC BY 4.0 license, which permit the free download, distribution, and reuse, provided that the author and preprint are cited in any reuse.


