Preprint
Article

This version is not peer-reviewed.

Effects of Laboratory Warming on Active Soil Organic Matter and Bacterial Diversity During the Long-Term Deсomposition of Forest Litter in Soil Microcosms

Submitted:

23 September 2025

Posted:

25 September 2025

You are already at the latest version

Abstract

To investigate the combined impacts of temperature and plant residues on the mineralization capacity of soil organic matter and taxonomic composition and activity of the soil microbiome, a 364-day experiment with gray forest soil was carried out in a controlled laboratory conditions. Three substrate management, control (C), augmented with aspen leaves (L) and branches (B), and three temperature settings (2, 12, and 22oC) comprised the treatment levels. According to the findings, long-term experimental warming reduced alpha diversity (number of species), increased microbial respiration and decomposition rates, and changed community composition. It has also lowered active soil organic matter. In comparison to branches, the percentage of mineralization in leaves was higher during the course of the year (29.9-57.8% and 20.1-47.6%, respectively). The efficiency of organic matter decomposition rose by 1.5 to 2 times between 2 and 12°C. It has been discovered that all experimental versions are dominated by Proteobacteria. According to α-diversity analysis, leaves were the most preferred substrate for increasing species representation. Temperature was the most significant factor affecting the microbial community’s structure, according to β-diversity data. Our research provides new insights into the soil organic matter formation, and raises interesting questions regarding the microbiological drivers of this process.

Keywords: 
;  ;  

1. Introduction

Soil organic matter (SOM) is a crucial component of terrestrial ecosystems and a reservoir in the global carbon (C) cycle [1]. The dynamics of SOM affect the concentration of greenhouse gases, which makes them a significant factor in climate change [2,3]. Additionally, soil organic matter serves a variety of biological, chemical, and physical purposes, including improving soil structure and water retention, facilitating cation exchange, and increasing P availability [4,5,6,7,8]. The decomposition of organic material in the soil and vegetation, which is controlled by climatic variables, directly affects the soil carbon stock [9,10,11,12].
A significant portion of plant primary production enters the soil as fresh plant material, forming the detrital carbon pool [13]. The remains of aboveground and belowground biomass are utilized by mesofauna and microfauna communities, epiphytic and soil microorganisms [14]. As a result of enzymatic attacks, organic materials are broken down into individual fragments and particles (Particulate Organic Matter, POM), and large and small molecules of biopolymers are formed, which are either stabilized (Mineral-Associated Organic Matter, MOM) or continue to decompose, mineralizing into carbon dioxide [3,15,16,17,18]. The movement of plant biomass into the soil, the incorporation of plant residues into SOM, and the storage of carbon within the stable SOM pool are natural stages in the soil sequestration of atmospheric carbon [19].
In forest ecosystems, the organic material entering the soil is represented by a variety of residues. Leaves make up about 22-80% of the total litterfall, with other types of litter including branches, bark, and cones [13,20,21]. Substrate quality is one of the main factors influencing litter decomposition rate. An important characteristic reflecting the quality of litter and determining its decomposition rate is the C/N ratio: the higher it is, the lower the quality of the litter [22]. According to other views, while the C/N ratio provides a general idea of the decomposability of organic materials, it is not always suitable as an indicator of the biological quality of the material being decomposed and the decomposition dynamics [14]. More accurate indicators are suggested to be the content of N, lignin, and polyphenols, and the lignin/N ratio [14,23]. Plant litter often has a low N: C ratio because it is primarily composed of cell wall materials made of carbohydrates [24]. Cellulose is the main carbohydrate in primary cell walls and is linked to hemicellulose, embedding itself in a pectin-rich gel-like matrix. Conversely, lignin is deposited inside and around cellulose and binds to hemicellulose in secondary cell walls [25]. High lignin concentrations have a strong impact on reducing litter decomposition rates, which is why leaves typically decompose faster than branches due to their higher nutrient content and lower lignin concentration [26,27]. In areas with favorable climatic conditions, the decomposition of plant residues is primarily limited by the quality of the organic material, whereas under unfavorable conditions, it is limited by environmental factors [28].
One of the most important abiotic factors related to climate is temperature [29,30]. Rising temperatures can increase the input of organic residues into the soil, but simultaneously accelerate their microbial decomposition [31,32]. As the temperature increases, carbon losses from the soil increase more than carbon inputs into the soil, because the sensitivity of hydrolytic processes to temperature is much higher than that of photosynthesis [33]. There are varying opinions about the long-term effects of global warming on soil organic matter, including the extent to which temperature changes will affect its availability to microorganisms [34,35,36]. According to some estimates, after a brief burst of mineralization affecting a small active (labile) pool of organic matter, the process as a whole will slow down [30,37,38,39]. According to another view, carbon mineralization losses will not change significantly, or, on the contrary, will increase, as the decomposition of the large stable pool of SOM will intensify [40,41,42]. In any case, changes in environmental temperature will affect the ratio of labile and stable components in the composition of SOM, which can lead to its dysfunction [43]. Incubation experiments have shown that the degree of availability of substrates from plant residues significantly influenced the temperature dependence of soil respiration [39]. As the quality of organic carbon in plant residues decreased, hydrolytic activity became more sensitive to temperature changes [44].
Temperature changes also affect the biotic factors of litter decomposition, which are linked to shifts in the structure and activity of soil microbial communities [45,46]. It is known that microbial communities are capable of regulating not only the energy balance in the soil but also the rate of C turnover [47,48,49,50,51]. However, recent studies show that microorganisms can respond differently to temperature changes. For example, there is evidence of significant changes in soil microbial communities in response to warming over both a short period (up to 12 months) [23,52] and after 8 years [53]. There are also studies that have found no significant changes in communities due to rising temperatures over a similar period [54]. It is assumed that it takes a longer period, often no less than 10 years, to detect even minimal shifts in the structure of soil microbial communities under changing temperature regimes [55]. The relationship between microorganisms and the temperature sensitivity of organic matter in plant residues and soil also remains unclear [56,57,58,59].
According to our previous research and literature searches, we hypothesized that the ratios of microbial mechanisms controlling soil carbon balance will change significantly as a result of global warming. This will be reflected in changes in microbial community composition and decomposition activity, which will ultimately impact the soil’s capacity to sequester carbon.
In this study we address this gap by investigating influence of temperature on the decomposition of forest litter plant residues and the formation of the biologically active pool of SOM, as well as on the taxonomic composition and activity of the soil microbiome. To achieve this, a 364-day incubation experiment was carried out using soil microcosms from a mixed forest in the Moscow region, with addition of two types of plant residues (fragments of aspen leaves and branches). Microcosms were incubated under aerobic conditions at three temperature regimes characteristic of the southern Moscow region: (1) during the spring and autumn months, (2) during the summer period, and (3) under global temperature rise.

2. Materials and Methods

2.1. Soil and Plant Residues Sampling

Soil samples for incubation experiments were collected in June 2023 in a secondary deciduous forest near the Pushchino town, Moscow region (54.8° N, 37.6° E) with a mean annual temperature (MAAT) of 8.9oC and mean annual precipitation (MAAP) of 1005 mm. Samples were taken from a depth of 0-20 cm in fivefold replication. The tree layer vegetation in this area was represented by Norway maple (Acer platanoides), birch (Betula sp.), aspen (Populus tremula), and alder (Alnus). The soil was characterized as gray forest loam on cover loess, underlain by moraine (Greyzemic Phaeozems Albic). The soil properties were tested by the relevant detection methods in the core facility “Physico-chemical methods of soil and ecosystem research “of IPCBPSS RAS, Puschino, Moscow Region, Russia and are presented in Table 1.
In October 2023, two varieties of plant residues were gathered: tiny branches and pieces of aspen leaves. Plant residues (PR) were dried at 65°C, ground to a size of < 0.5 mm and carbon and nitrogen content was estimated by CHNS 932 analyzer (LECO, St. Joseph, MI, USA). The leaves of this plant had a C: N ratio of 46.4, a total nitrogen (N) content of 0.92±0.02%, and a total carbon (C) value of 42.85±0.58%. They were 63.1 0.74±0.03%, and 46.54±0.45% for the branches, respectively.

2.2. Incubation Experiments Design

Aerobic microcosm incubation experiments were carried out in 100 ml glass flasks, which were filled with a sample equal to 10 g of air-dried soil. Microcosms, were incubated for 364 days in thermostats at three temperature regimes: a constant temperature of 2°C (a model of spring and autumn months average temperature in the southern Moscow region), 12°C (a model of the average temperature during the summer period), and 22°C (a model of global warming). To identify the agents responsible for the transformation of plant residues into soil, fragments of fallen aspen leaves and thin branches were added at the 0.5% of the soil weight.
Thus, this experiment a total of 135 microcosms were randomly established and included nine variants: (1) C- control untreated group incubated at 2, 12 and 22oC, (2) L-treated with leaves group incubated at 2, 12 and 22oC, and (3) B-treated with branches group incubated at 2, 12 and 22oC. For each experimental variant, three microcosms were used for dynamic CO2 measurement throughout the incubation period, and 12 microcosms were destructively used for DNA extraction at time points 0, 6, 9 and 12 months. The following designations were used for the samples used in the molecular analysis: month-variant-temperature. For example, 6L22 indicates samples that were incubated for 6 months with leaves at a temperature of 22°C.
Soil moisture was continuously checked and kept at 30% by weight (70% WHC) during the incubation period.

2.3. Measurement of the Intensity of PR Decomposition and Characteristics of Active Soil Organic Matter Based on Microbial Respiration

Microbial respiration (CO2 production) was used as a proxy for the rate of decomposition of organic amendments and formation of active organic matter in soil. CO2 was quantified in the gas phase of the flasks used Cristal Lux 4000 M GC device (Chromatek CJSC, Yoshkar-Ola, Russia) after 24–48 h of incubation. To recalculate the content of CO2 in the gas phase to the value of release from the soil samples, the volumes of the vial and gas sample, as well as the soil mass and time of incubation, were taken into account, while the carbon dioxide content was expressed as recalculated to carbon (C−CO2).
The first measurement was done after 24 hours the experiment setting up, then daily during the first and second weeks, then three times a week during the second and first decades of the fourth month of incubation, and from the second decade of the fourth month of incubation, once every seven or ten days. A total of 67 gas sample collections were carried out throughout the incubation period. After each measurement, the flasks were ventilated [60].
The C-CO2 flux rate (mg/100 g soil per day) was calculated from the difference in CO2 concentrations over the exposure period. The cumulative amount of C-CO2 production (mg/100 g) was determined by adding the amount of C-CO2 at each measurement time point to the sum for the previous time points. In the soil variants with PR, the cumulative amount of C-CO2 produced from organic residues was determined by subtracting the C-CO2 released from the control variant soil.
The decomposition rate constant of the studied soil samples and organic residues at different incubation periods was calculated using the Equation (1):
k =   ( ln M t M 0 t )
where k is the decomposition constant, days⁻¹; Mt—carbon content (Corg) in the sample at different observation periods, % of the initial value; M0—initial Corg content in the sample (at the beginning of observations), %; t—decomposition duration, days [61].
The amount of biologically active (potentially mineralizable) organic matter (C0) was calculated based on the amount of C-CO2 mineralization losses, using a single-component first-order kinetic Equation (2):
Сt = C0 (1–exp(–kt)
where Ct is the proportion of C-CO2 losses (% of Corg in the sample) over time t (days); C0 is the content of potentially mineralizable carbon, % of the initial Corg in the sample; k is the mineralization rate constant, day–1 [60].
By substituting the cumulative amounts of C-CO2 (Ct, mg/100 g) released during the incubation period (t, days) into Equation (2), the content of active organic matter carbon (C0, mg/100 g) in the soil at the beginning of the incubation was calculated [60].
The mineralization rate index (MRI), which represents the rate at which organic matter from residues is converted into inorganic forms by microorganisms (mg C/ (100g soil × day) was calculated using Equation (3):
MRI = C0 × k1
where C0 is the amount of biologically active (potentially mineralizable) organic matter, k1 is the mineralization constant [62].
The temperature coefficient (Q10), which characterizes the temperature sensitivity of substrate decomposition rate by increasing the intensity of CO2 release with a 10°C increase in incubation temperature, was calculated using Equation (4):
Q10 = (K2/K1) [10/(T2 – T1)]
where K2 is the substrate decomposition rate at the upper temperature value T2; K1—the rate of substrate decomposition at the lower temperature value T1 [31].

2.3. DNA Extraction, Quantitative PCR and Illumina 16S rRNA Sequencing

Soil microbial communities were characterized with DNA amplicon sequencing. Total microbial DNA in 0.25 g soil samples across four time points (month 0, 6, 9 and 12) was extracted using the DNeasy Power Soil Pro Kit (Qiagen, Hilden, Germany) and a Precellys 24 homogenizer (Bertin Technologies, Montigny-le-Bretonneux, France) at 6500 rpm (40 s). Each sub-sample from the same soil underwent independent extraction. The quantity and quality of the extracted DNA were assessed using a Nanodrop 1000 Spectrophotometer (Thermo Fisher Scientific, Waltham, MA, USA).
Taxonomic analysis of the bacterial community was conducted using universal primers 341F and 805R [63] specific to the V3-V4 regions of the 16S rRNA gene. PCR was performed as described in [64].
Further library preparation was carried out in accordance with the manufacturer’s instructions in the MiSeq Reagent Kit Preparation Guide (Illumina) (https://support.illumina.com/downloads/16s_metagenomic_sequencing_library_preparation.html). After obtaining the amplicons, the libraries were cleaned and mixed in equimolar amounts using the SequalPrep™ Normalization Plate Kit (Thermo Fisher Scientific, Waltham, USA). The resulting pool was analyzed by capillary electrophoresis and then sequenced at the resource center “Genomic Technologies, Proteomics, and Cell Biology” of ARRIAM, Russia using the Illumina MiSeq (2 × 250 bp) system (Illumina, San Diego, CA, USA according to the manufacturer’s instructions.

2.4. 16SrRNA Gene Amplicon Analyses

Initial data processing, including demultiplexing and adapter removal, was performed using MiSeq System Suite (v.4.1.0) Illumina software. We used phyloseq [65] package, along with the SILVA ribosomal DNA database release 138 [66], to denoise the data, merge sequences, remove chimeric reads, identify amplicon sequence variants (ASVs), and perform taxonomic classification. The QIIME2 (v.2024.5) software program was used to illustrate the taxonomic analysis results [67]. Heatmaps, bar graphs, and alpha- and beta-diversity plots were made using the phyloseq (v1.30.0) package. The R packages tidyverse [68] and vegan [69] were used for statistical analysis and data visualization.
The assumption of normalcy within groups was evaluated using the Shapiro-Wilk test (p-value < 0.05). One-way ANOVA was used for pairwise group comparisons, and Tukey’s post-hoc tests were then used.

2.5. Data Analysis

Every assay was run in triplicate. Excel for Microsoft Office 10 was used to organize the collected data. Microsoft Excel and SPSS Statistics v. 17.0 software were used to calculate the means and standard deviations (SD) of three separate studies, which are the data that are displayed. A p -value of less than 0.05 was deemed statistically significant in all tests.

3. Results

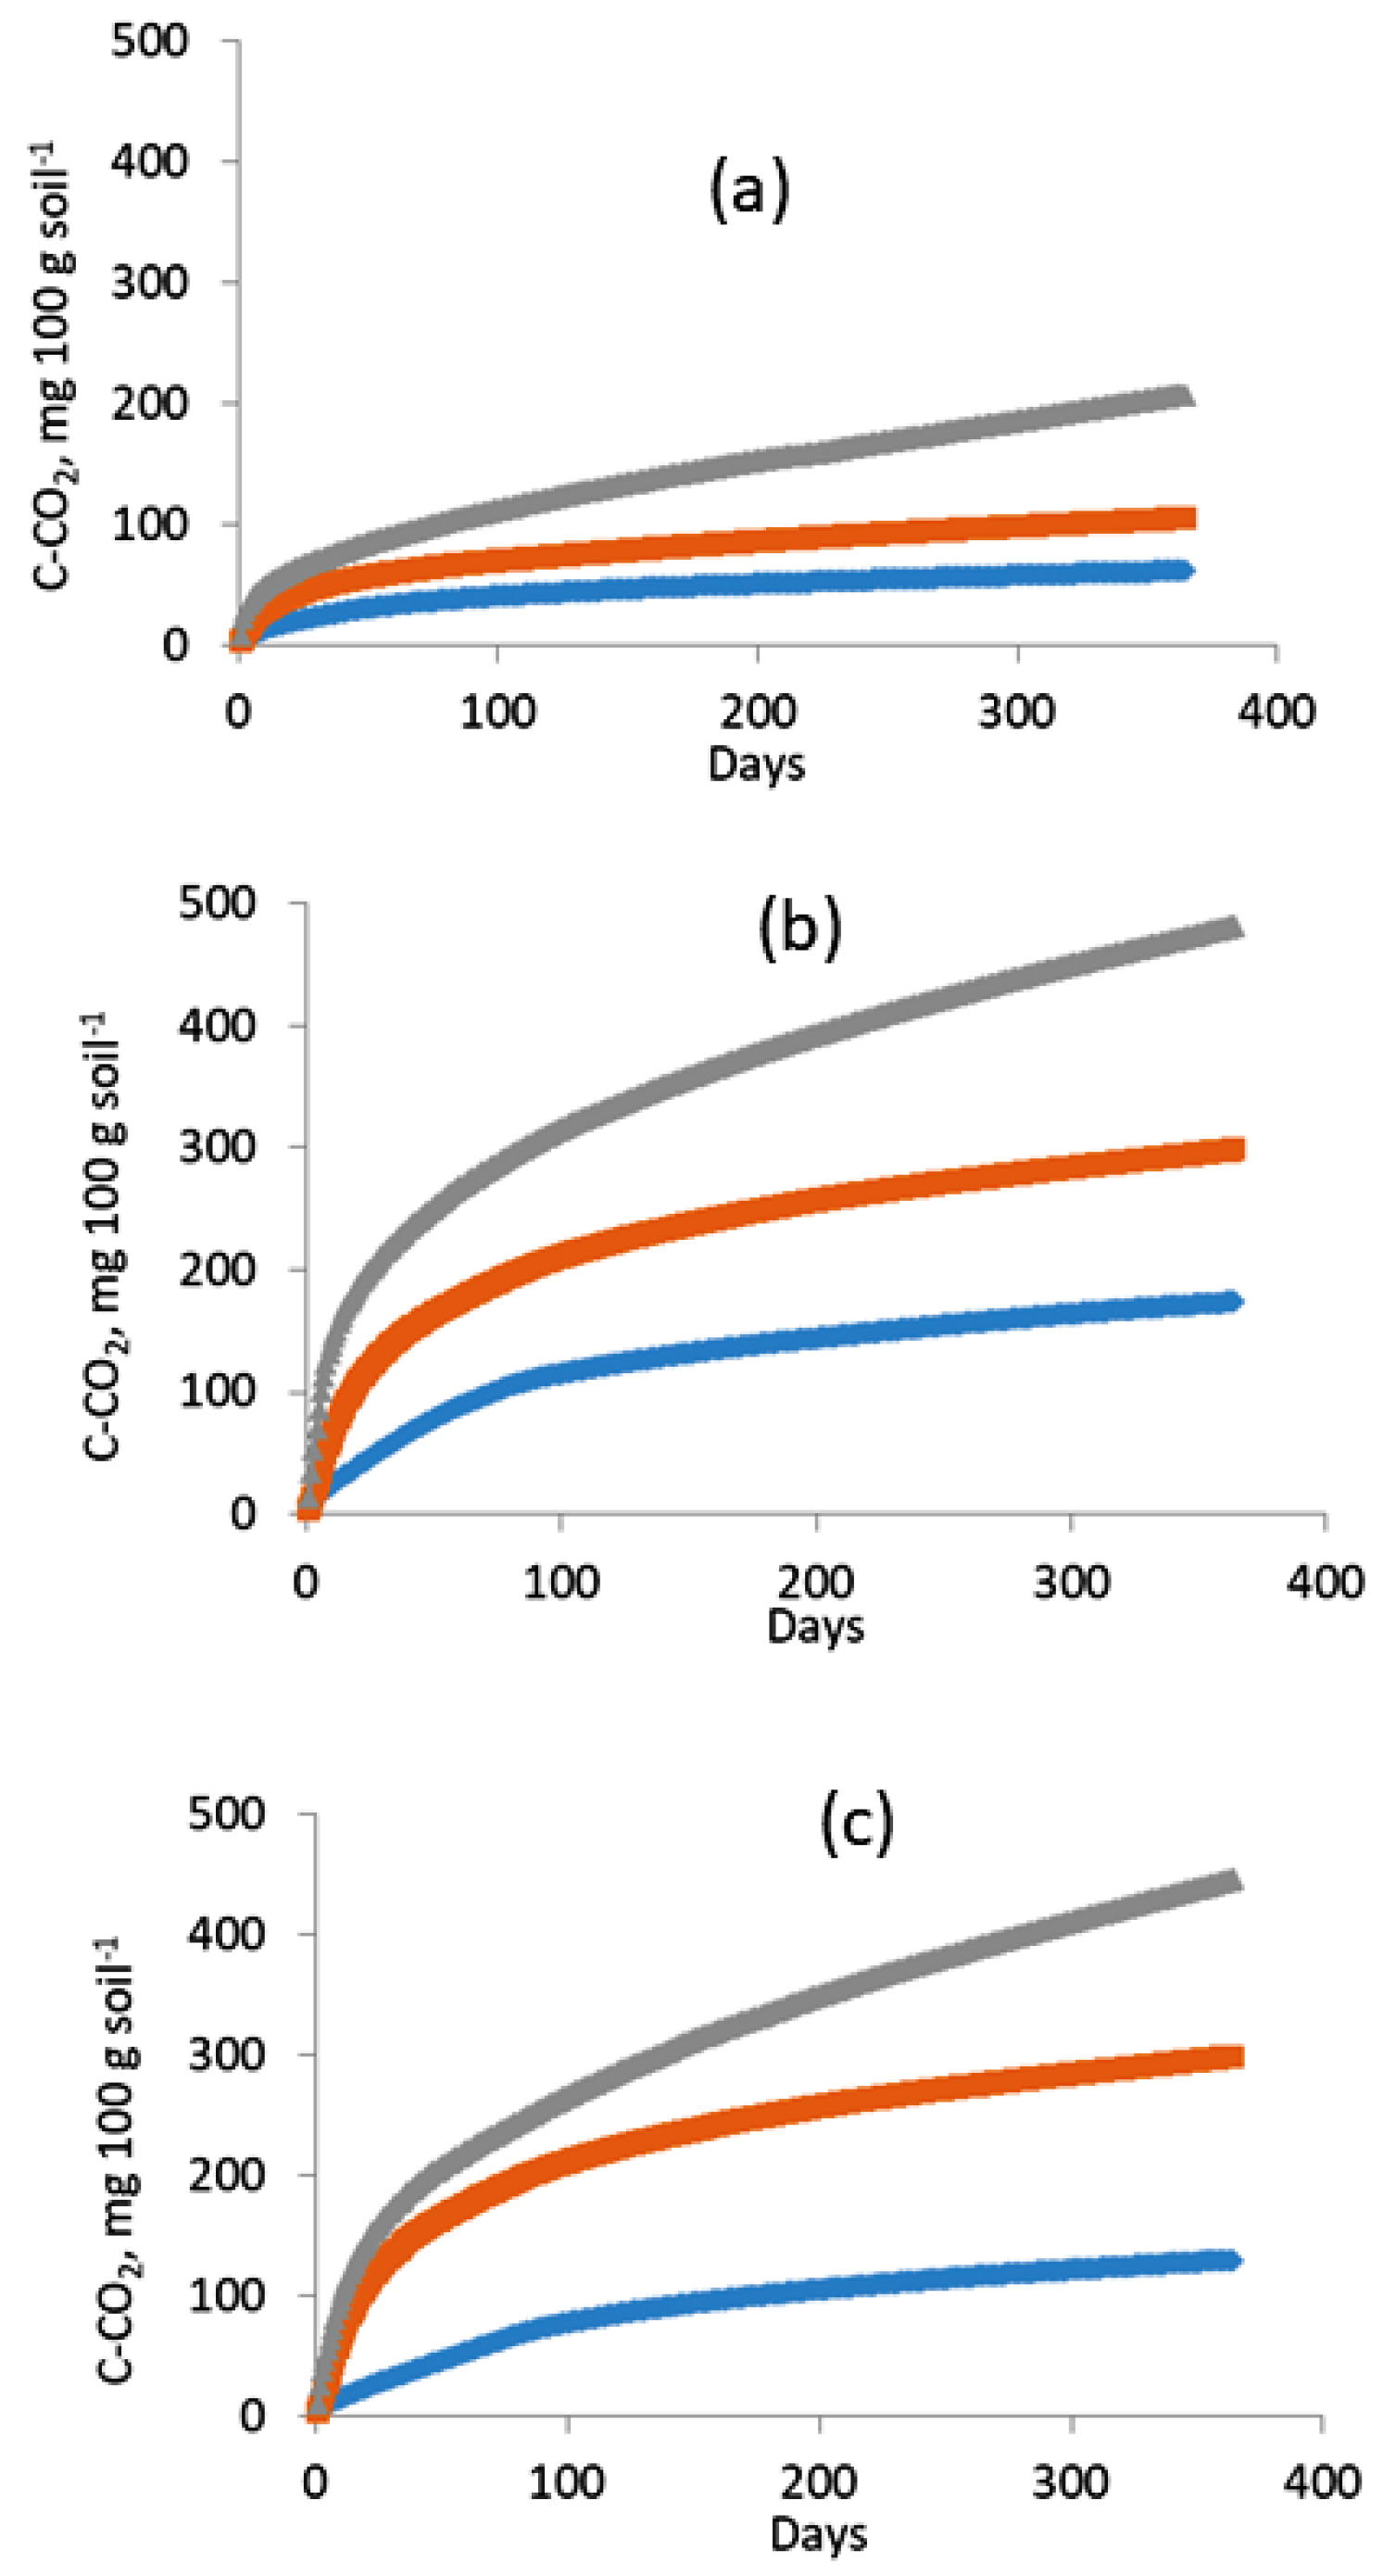
3.1. Dynamics of C-CO2 Release from Soil Samples

The determination of the intensity of the CO2 release (Figure 1) indicated the differences in the dynamics and intensity of the basal soil respiration (C variants) and respiration induced by the introduction substrates (L and B variants) in the microcosm incubated with different temperature regime.
The decomposition of SOM and plant residues in the soil followed classical two-phase dynamics, with rapid and slow rates at the beginning and end of the incubation, respectively. The peak of C-CO2 release from the soil occurred on the 2nd to 4th day of incubation (Figure 1). At all temperature regimes and time points the emission from microcosms with plant residues was significantly higher compared to the control soil, and it was higher in microcosms with aspen leaves as compared with branch contained. As expected, the higher the incubation temperature, the greater the production of C-CO2.
For a 2°C variant, the rate of basal respiration (without PR) was low during the entire period of observation with a slight increase in intensity during the first three days after incubation start. The addition of leaves and branches did not significantly change either the dynamics or the intensity of the process (Figure 1)
The dynamics of the processes at 12 and 22°C were completely different from 2oC. Leaf addition in 12oC variants resulted in a gradual increase over the first 9 days, followed by a sharp decrease over the next 15 days. The introduction of branches led to a less intense increase in activity during the first 7 days, a plateau at approximately the same level for the following 14 days, and then a decline (Figure 1).
In the C-soil steady state condition, when the rate of CO2 produced and lost from the microcosm, was reached after a month of incubation, while in the variants with plant residues it was achieved after approximately two months. It should be noted that throughout the entire incubation period, including the final stage from month 7 to 12, the CO2 release was approximately twice as high in variants L and B compared to variant С. A stimulating effect of increased temperature was also noted.
The trajectory of the cumulative CO2 emission curves amply demonstrated the joint impact of temperature and the kind of plant residue (Figure 2). All cumulative curves are similar; however, for the variants with leaf and branch additions incubated at 22°C, the curve does not plateau even after 364 days. Temperature has a major impact on the total amount of carbon released. For example, leaves addition leads to a total release of 174.23 mg of C at 2°C, and it increases to 298.6 mg and 481.74 mg at 12 and 22°C, respectively
During the first 30 days of incubation, 24 to 44% of the C-CO2 accounted for over the year of the experiment was released from the soil. Cumulative C-CO2 production values decreased in the following temperature series in all variants: 22°C > 12°C > 2°C. In turn, based on the total amount of C-CO2 released, the ranking of the organic materials tested was as follows: aspen leaves > aspen branches > SOM.

3.2. Decomposition of Plant Residues and Formation of the Active SOM Pool

During the incubation period, the introduced substrates decomposed, and the intensity and kinetic parameters of the process depended not only on the type of the substrates but also on the temperature. Over the annual incubation, 2 to 7% of SOM was mineralized in the soil without the addition of litter material (Table 2). The added plant residues decomposed much more intensely than the SOM, and leaf organic matter decomposed 1.2-1.5 times more than that of fine branches. Increasing the temperature from 2 to 12oC accelerated the decomposition of SOM, leaves, and branches by 1.4, 1.5, and 1.6 times, respectively. Increasing the temperature to 22°C led to a further increase in the decomposition intensity of these organic substrates by 2.0, 1.3, and 1.5 times, respectively.
The amount of organic matter (Corg) in samples with leaf addition was higher than in samples with branch addition at all temperature regimes. The maximum values of this indicator was estimated at 22°C, accounting for 57.77% and 47.62% of the added amount with leaves and branches, respectively.
The calculated mineralization rate constants confirmed that the higher the incubation temperature, the faster the organic matter decomposed. The decomposition rate constant value was higher in leaf litter samples, reaching maximum values (0.025 ± 0.0012 day-1) at 22°C, and lowest in branch litter samples at all temperature regimes (Table 2).Two established facts stand out. Firstly, the decomposition rate constants of plant residues were lower than those of SOM. Secondly, the SOM decomposition constant did not show a strict dependence on temperature, unlike plant residues.
Increasing temperature and the presence of decomposable material in the soil positively influenced the size of the biologically active SOM pool (Table 3). The C0 content in the soil without additives increased from 64 to 186 mg/100g within a temperature range of 2°C to 22°C.
In the investigated soil samples, the amount of active organic matter (C0) varied between 64.84 and 423.54 mg С/100g soil and increased in tandem with the temperature growth. The samples with leaves addition had a considerably greater C0 content and its fraction in Corg. At all temperature regimes, the content of biologically active organic matter (C0) and its proportion in Corg were higher in the leaf litter treatment. Overall, the introduction of plant residues contributed to a 2.2-3.0-fold increase in the content of active organic matter in the soil. Content of C0 in soil without plant residues was 2.6-7.4% of Corg, while in the soil with plant residues reached 5.0-14.3% (Table 3).
The combined effect of temperature and the quality of plant additives on the mineralization process is characterized by the mineralization rate index (MRI). The ranges of MRI values varied from 1.24 to 7.86 mg/100 g dry weight. Its values were at their maximum at 22°C in samples amended with leaves (Table 3), throughout all temperature regimes (Table 3).
The temperature coefficient (Q10) characterizes the sensitivity of the substrate decomposition process to a 10°C increase in temperature. SOM was more temperature-sensitive than plant residues, especially in the medium to high temperature range (Table 4).
Thin aspen branches with a C/N ratio of 63 showed higher thermal sensitivity than the leaves of this tree, which have a C/N ratio of 46. Within the low to medium temperature range, the thermal sensitivity of plant residue decomposition was more pronounced than in the 12–22°C interval.
In the early stages of decomposition plant residues showed the highest thermal sensitivity under the low to medium temperature range (2-12oC). The maximum values of the temperature coefficient corresponded to the samples with branches added in the temperature range of 2-12°C, while the minimum values corresponded to the control samples. Increasing the temperature to 22°C significantly reduced the temperature sensitivity in all experimental samples, except for those with leaf addition, where it, on the contrary, slightly increased from 1.26 to 1.47 (Table 4).
At the late stage of decomposition, an inverse relationship was observed. The thermal sensitivity of leaf and branch decomposition was higher in the range of 12 − 22°C. On average across the three criteria evaluated, the temperature coefficient of soil organic matter decomposition was 1.94, aspen leaves—1.87, and aspen branches—2.90.

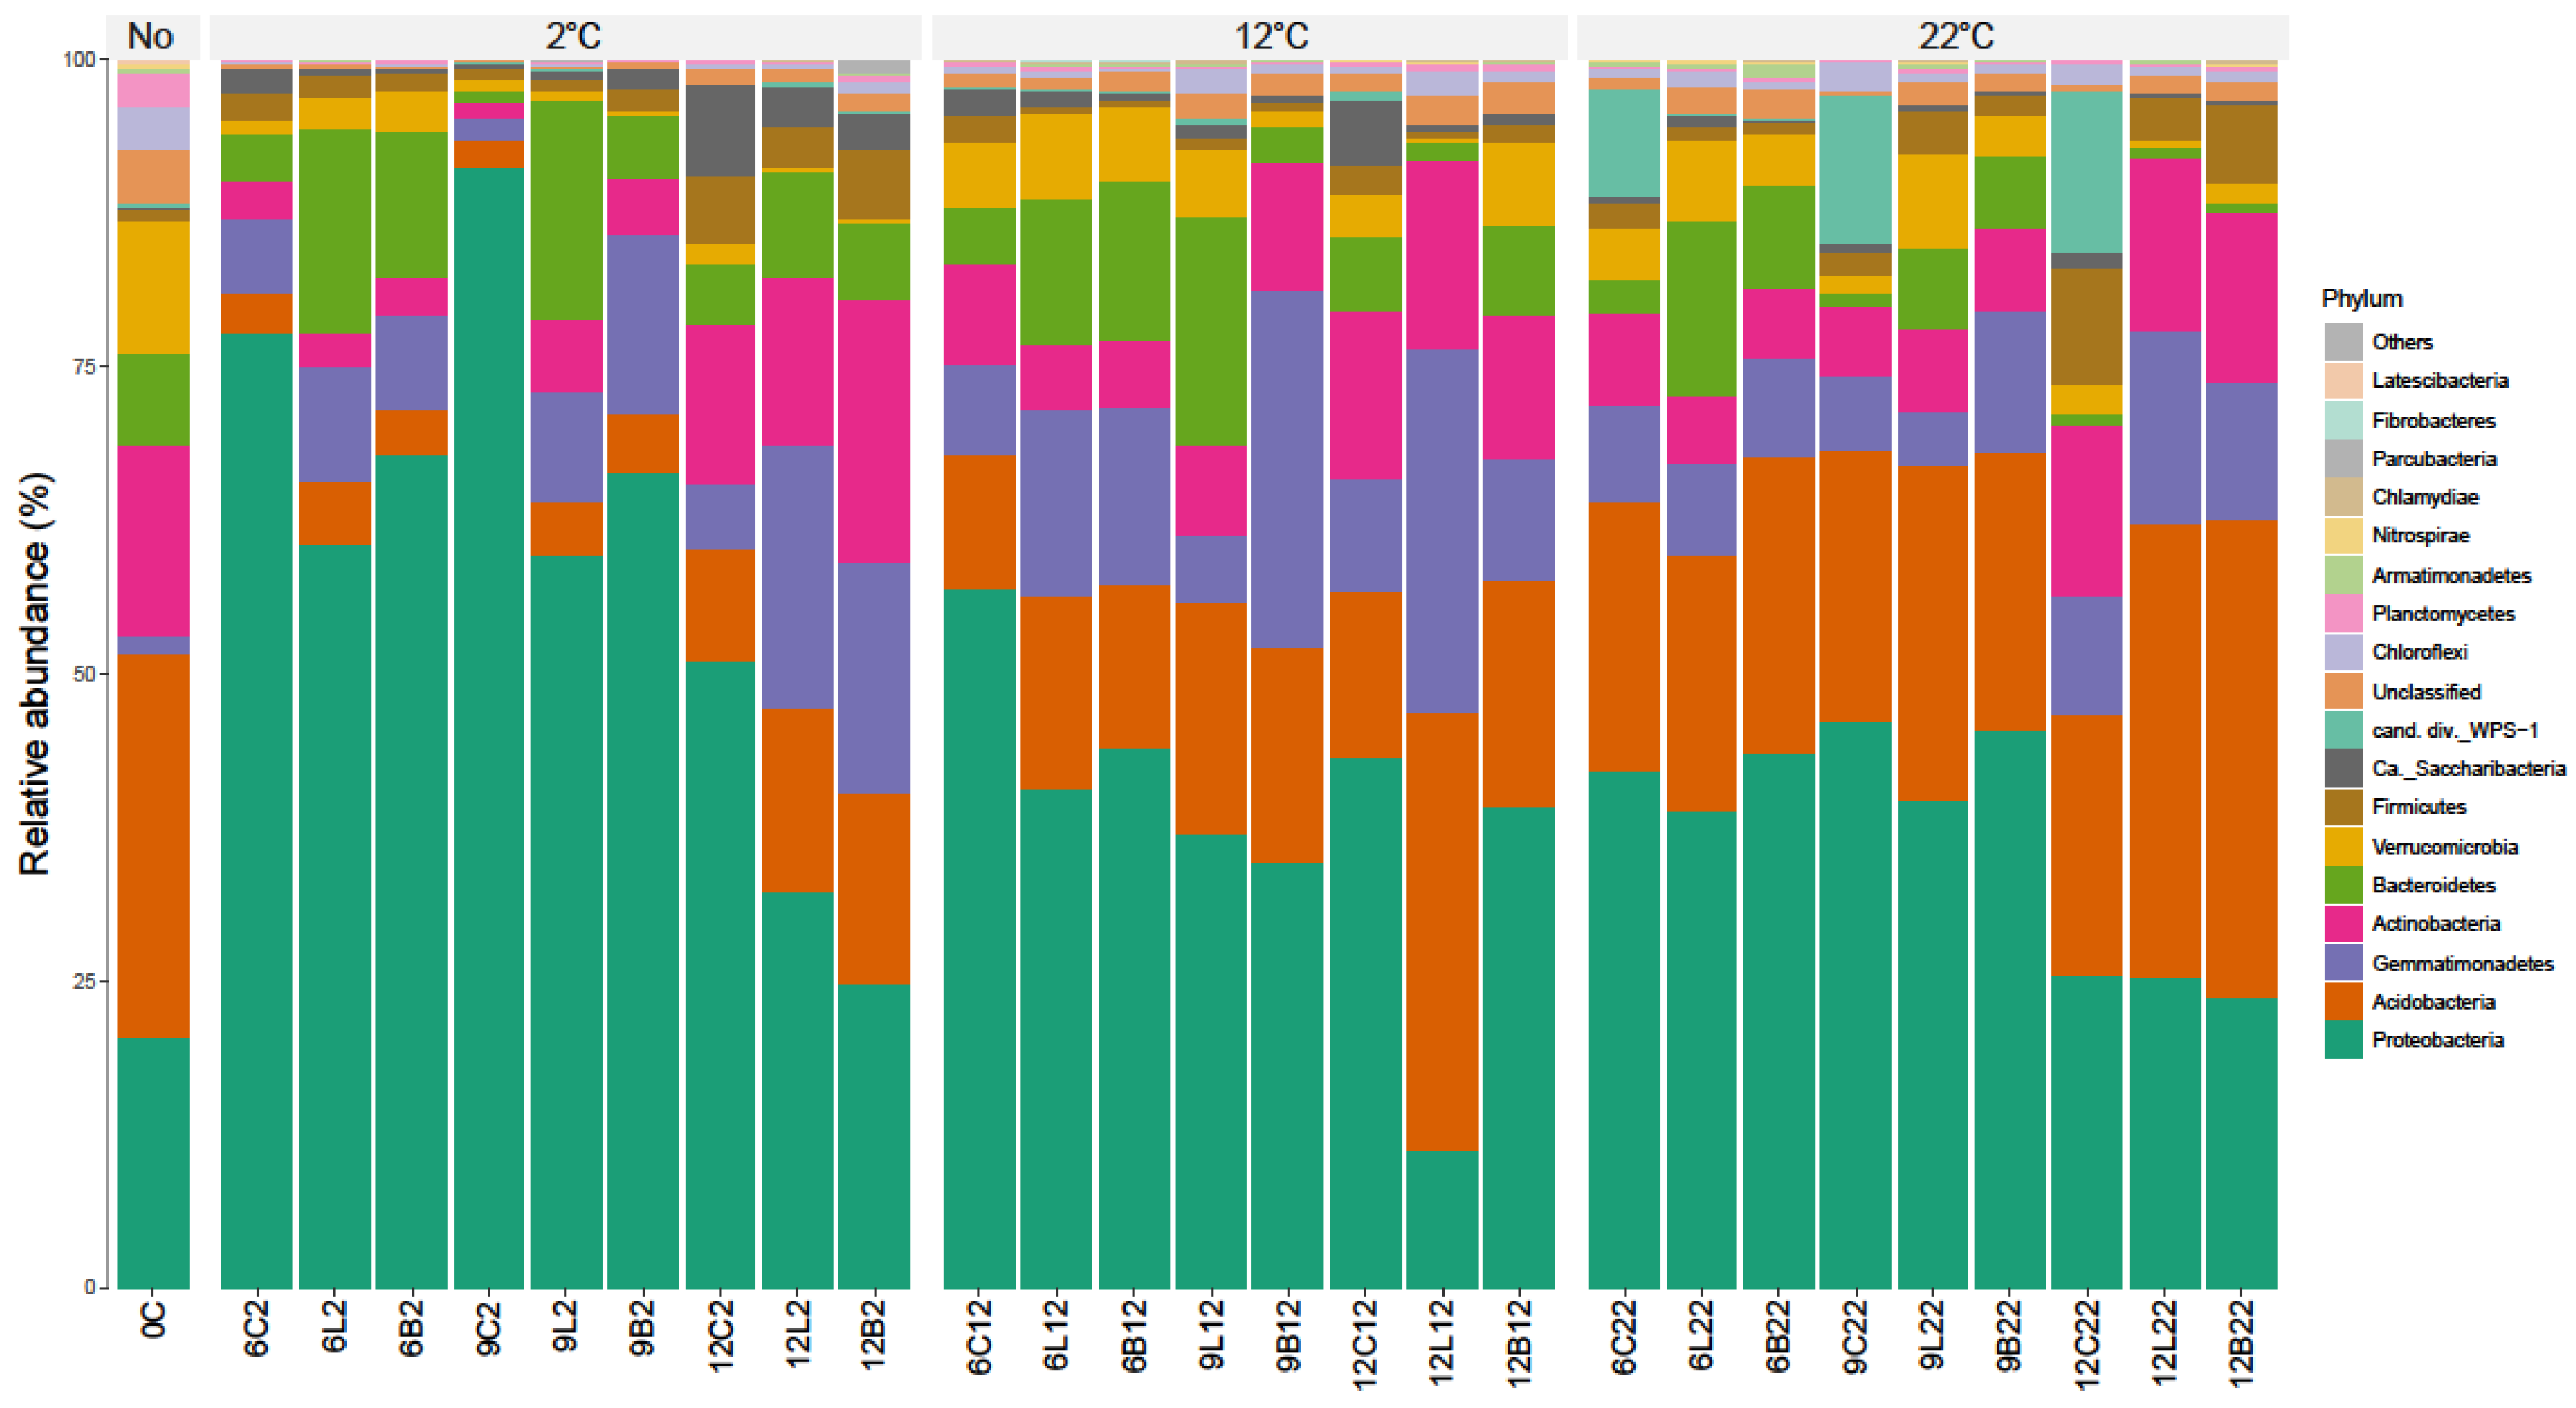
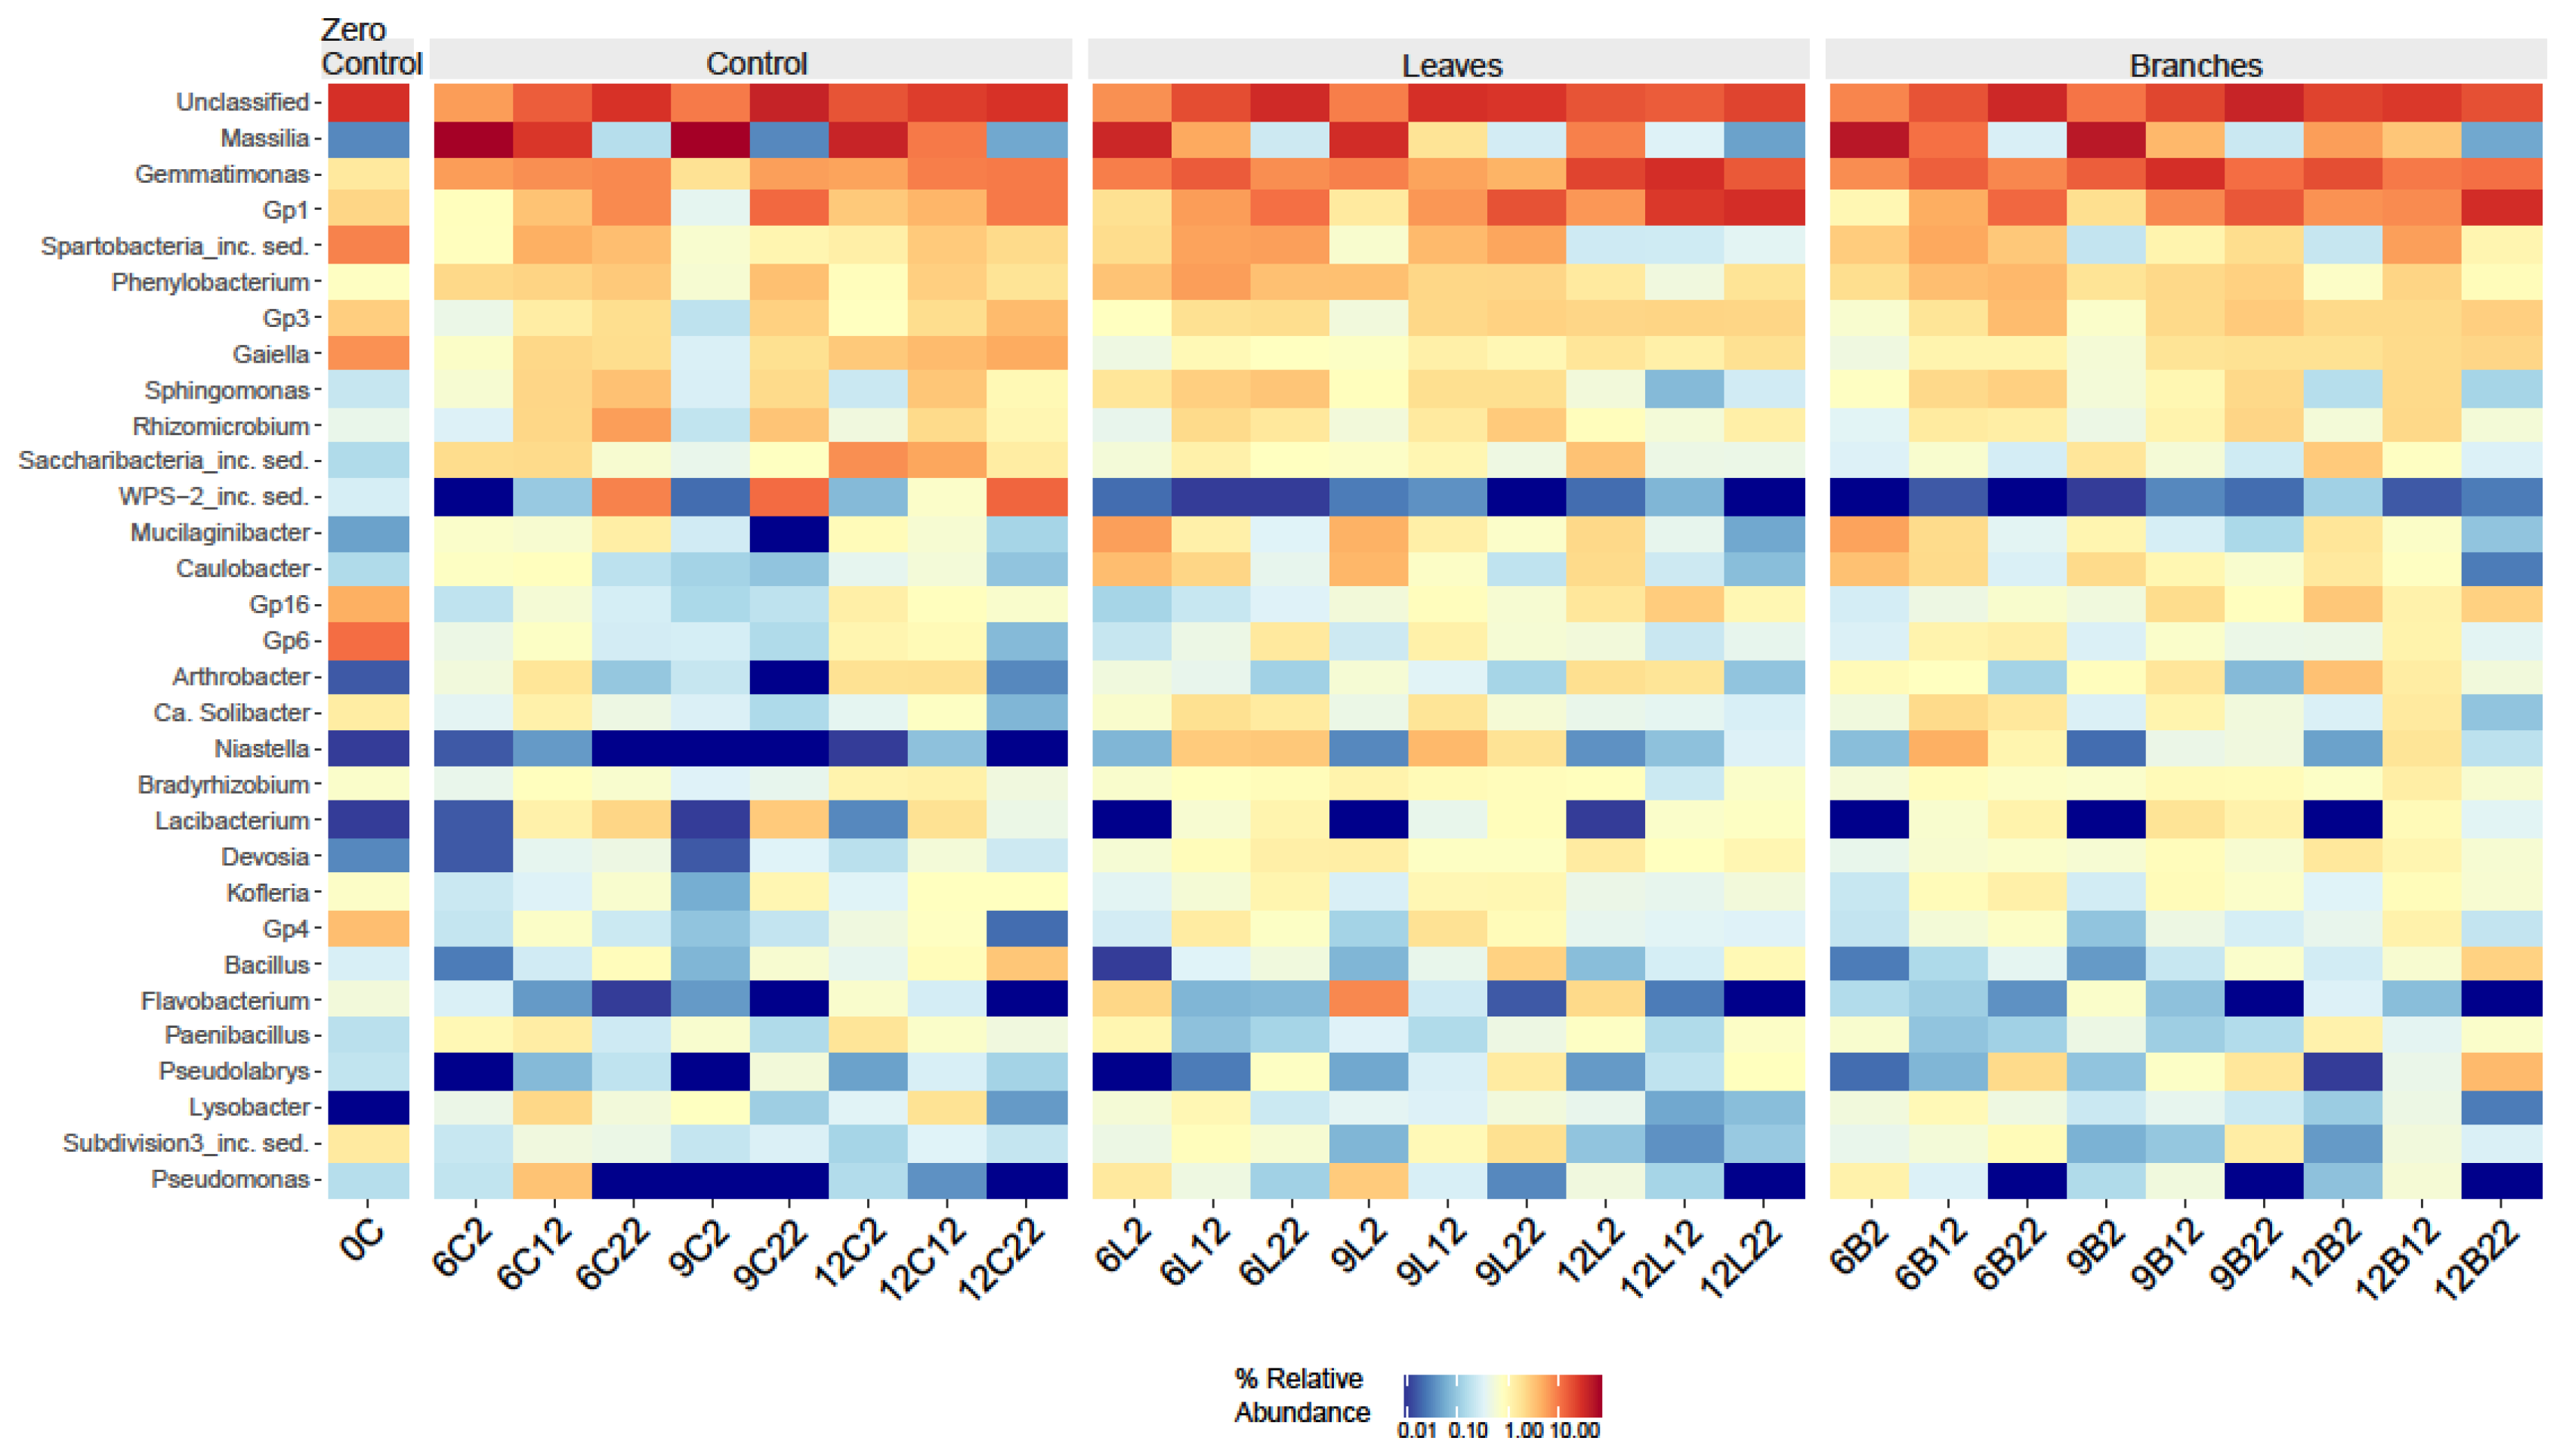
3.3. Effect of Plant Residues on the Soil Bacterial Communities over Time at Different Incubation Temperatures

The phyla, Proteobacteria were the main dominant microbial group in all soil samples with their relative abundance up to 58% and represented by the classes Alpha- and Betaproteobacteria. Another dominant groups were Acidobacteria (up to 18%), Gemmatimonadetes (up to 14%), and Actinobacteria (up to 10%) (Figure 3).
Shifts in the structure of bacterial communities occurred at different stages of plant material decomposition (Figure 3). In the control soil, the phylum Acidobacteria was dominant, but after 6 months of incubation at temperatures of 2°C and 12°C (6C2 and 6C12 sample), Betaproteobacteria became the main dominant, while at 22°C (622C sample), Alphaproteobacteria emerged as dominant.
In samples with substrate addition at all incubation times at a temperature of 2°C, Betaproteobacteria were the dominant group, but with an increase in temperature by 12 and 22°C, Alphaproteobacteria, Acidobacteria, and Gemmatimonadetes became dominants.
At the genus level, the majority of the bacteria from the dominant phylum Proteobacteria were aerobic (Figure 4). Among them, the relative abundance of Massilia, Gemmatimonas, Gp1 bacterial groups were higher than 10%.
Massilia was absolute dominant group averaged 42% of all the genera present. In some cases, especially at a temperature of 2°C, it reached up to 67%. The Gemmatimonas was also well represented, making up 30% of the entire community, and unlike Massilia, these bacteria were distributed approximately equally across all experimental conditions. Another dominant group was Gp1, which accounted for up to 29% of the total genetic diversity in the substrate amended samples.
The Spartobacteria was highly abundant in the control soil (9%), but its relative abundance decreased with the addition of substrates, especially in the variants for leaves addition at 2°C. The genera Gp16 (11%), Gaiella (7%), Phenylobacterium (6%), Mucilaginibacter (6%), Gp16 (5%), Gp3 (4%), Caulobacter (4%), and Spingomonas (4%) were also characterized by relative high abundance (Figure 4). The WPS-2 family was temperature-sensitive and dominated (up to 12%) in control samples, but only at 22oC.

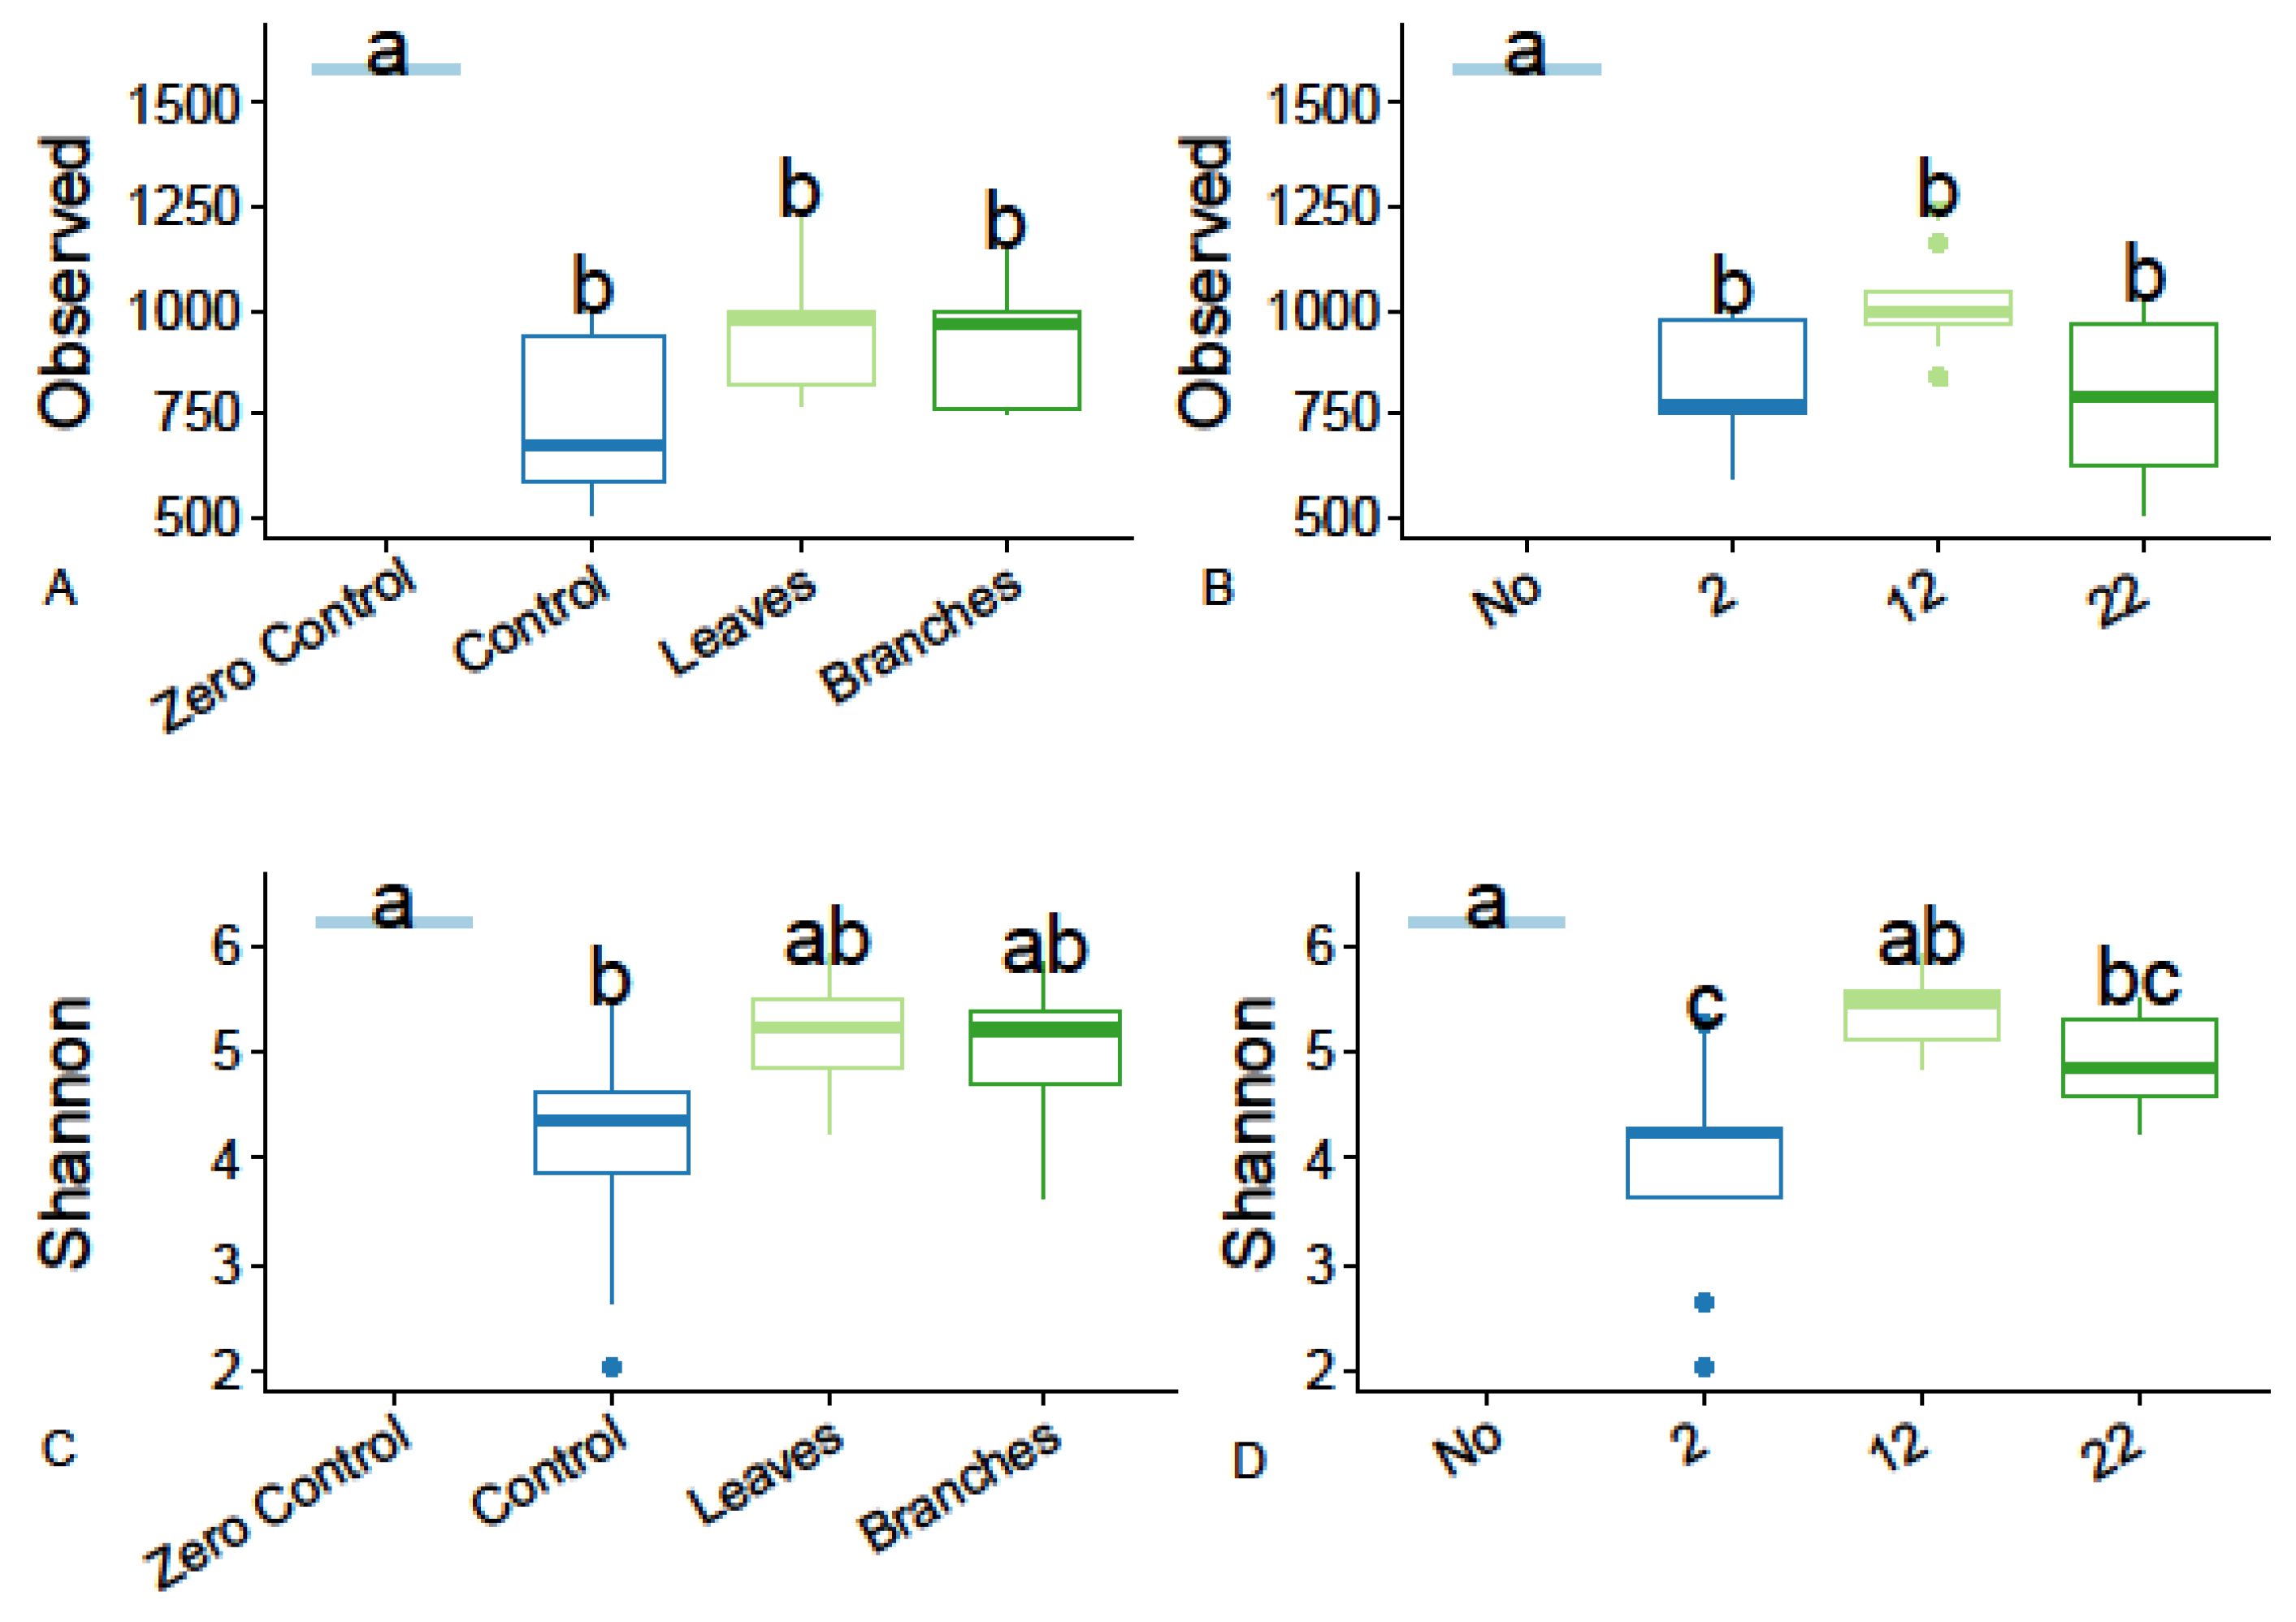
3.4. Diversity of Soil Bacterial Communities

To assess the functional diversity, the Observed and Shannon indices were calculated for the different sample groups. We compared the bacterial alpha diversity at different incubation temperatures and substrate addition. Both Observed and Shannon indices increased in substrate enriched samples. The highest numbers of Observed species (OTU) (950) and the Shannon index (5.3) were found in soil samples amended with leaves (Figure 5A and C). In the control soil samples, the number of OTUs was 730, and the Shannon index was 4.2.
The highest microbial diversity indices were observed at an incubation temperature of 12oC (Figure 5B,D).
The beta diversity provides insights into the functional differences between microbial communities. To assess it, a dissimilarity matrix was calculated based on Bray–Curtis distances and visualized using Principal Coordinate Analysis (PCoA) (Figure 6) Axis 1 primarily captured variation in soil temperature, while axis 2 captured substrate variation. The interpretation rate of the x-axis (PCo1) accounted for 41% of the variability among the samples, while the y-axis (PCo2) explained 16.2 %, both cumulatively explained 57.2% of the variance in sample composition (Figure 6).
The results of PCA demonstrate that the bacterial communities were well separated at different incubation temperatures and the difference was significant under the analysis of similarities test (p <0.01). The clusters grouping values with the same temperature included all substrate and incubation time variants. These clear groupings among samples belonging to the same substrate enriched experimental group, indicating distinct functional profiles across the conditions. The maximum diversity was reached at a temperature of 12°C in almost all sample types. A decline resulted from both an increase and a decrease.
The added plant substrate also influenced the differences in the structure of soil bacterial communities, but to a lesser extent than temperature.

4. Discussion

4.1. Effect of Temperature on Soil Organic Matter During Decomposition of Forest Litter

Soil microorganisms are the main drivers of biogeochemical cycles and are essential for soil formation and stabilization [70]. Microbial respiration and its temperature sensitivity are key proxies for the global C cycle. The rate and cumulative values of CO2 emission characterize both the state of the microbial community and its ability to decompose organic substrates, as well as the availability of substrates for decomposition. Temperature significantly affects the microbial decomposition of organic matter, with higher temperatures generally leading to an increased decomposition rate [71]. It was demonstrated that annual soil temperature influenced the decomposition rate of leaf litter and fine roots on 95% and 86%, respectively [72].
The temperature sensitivity of organic matter decomposition (Q10) depends on the quality of C and is higher for labile C compounds [44]. The influence of temperature on labile organic matter in soils is complex and not fully understood. On the one hand, the decomposition of labile OM is less temperature-sensitive than that of stable OM [73], while an increase in its content can enhance the temperature sensitivity of POM decomposition [74]. Increasing the temperature generally promotes the natural mineralization of organic matter. However, the addition of labile organic matter can slow down the decomposition of POM, potentially leading to carbon sequestration [74].
An incubation experiment was conducted on gray forest soil from a mixed forest in the Moscow region for 364 days (a model of an annual cycle). Microcosms were incubated at three temperature regimes: the average temperature model for the spring and autumn months in southern Moscow Oblast, the average summer temperature model, and the global warming model. To investigate the agents of plant residue transformation into soil, fragments of fallen leaves and thin branches were introduced.
One important measure of the soil’s ability to provide nutrients and support the carbon cycle is the amount of organic matter that is vulnerable to breakdown, or potentially mineralizable organic matter. In samples that included leaf addition, it was found that the amounts of potentially mineralizable organic matter, active organic matter content, and the mineralization index all achieved their maximum levels.
The decomposition rate constant and the Q10 temperature coefficient were highest in the samples with branch additions. The temperature sensitivity of substrate decomposition rate, as measured by the increase in CO2 release intensity, increased within the temperature range of 2-12°C. We concluded that the temperature sensitivity of substrate decomposition rate, as measured by the rise in CO2 emission, increased within the temperature range of 2-12°C and decreased with a further rise up to 22°C. The maximum values of the temperature coefficient Q10 were observed in samples with the addition of branches, while the minimum values were in the control samples. The decomposition rate constant was significantly higher in samples with leaves, and the minimum was observed in samples with branches. Similar patterns were observed in other studies [31], when adding plant residues increased Q10 in the temperature range of 5-15°C, while a decrease in this parameter was found in the temperature range of 15-25°C.
As the temperature increased, Q10 decreased by 2-2.2 times in the control soil and in soil amended with branches, but this indicator remained at the same level with the addition of leaves. At the same time, adding branches increased temperature sensitivity by a factor of 2 compared to the control, and almost threefold when adding leaves, but only within the temperature range of 12 to 22 degrees. This is due to the different composition of SOM and plant residues, as well as the presence of both microbial biomass and organic matter stabilized by the mineral fraction in the composition of SOM. The highest values of the temperature coefficient Q10 were characteristic of aspen branches, which had a higher C/N ratio than aspen leaves. It should be noted that the temperature coefficient Q10, calculated from soil respiration, primarily characterizes the apparent temperature sensitivity of organic matter, rather than the intrinsic temperature sensitivity [34].
The Q10 value depends on substrate availability and soil properties. Increased substrate availability typically increases Q10 values, with this effect being particularly pronounced in soils characterized by low substrate availability [75,76]. Some studies note the influence of a substrate on the temperature coefficient values. For example, in the study by Wetterstedt et al., 2010, it was suggested that Q10 should increase when transitioning from a higher-quality substrate (straw) to a lower-quality one (needles). However, their main assumption that straw decomposes more easily than coniferous litter was only confirmed for samples at 15 and 25 °C, but not for 5 °C. The authors concluded that the wide range of microorganisms, both bacteria and fungi, involved in the decomposition of wheat straw [77] were more sensitive to low temperatures than the fungi primarily responsible for the decomposition of coniferous litter [78]. Addition of litter to the soil from coniferous and broadleaf forests has reduced Q10 [26].
We concluded that litter addition reduces Q10, indicating decrease of the response of SOM decomposition to rising temperatures. Moreover, the introduction of labile organic matter can slow down the degradation of SOM, potentially leading to carbon sequestration [74]. On the other hand, the introduction of easily decomposable substrate can cause the priming effect [79] and an increase in carbon emissions. The slowing down of organic matter decomposition at low soil moisture creates the illusion of carbon sequestration in the soil. However, the potentially mineralizable carbon that has been preserved due to unfavorable temperatures remains unstabilized and can be lost if the temperature rises [39].

4.2. Effect of Temperature on Microbial Communities During Forest Litter Decomposition

Limitations in growth resources (e.g., carbon substrates) may change bacterial utilization strategy for a particular substrate or resource and microbial interactions. Thus the ability to adapt and recovery from environmental changed is a critical process in ecosystem functioning [80].We observed a shift in community composition, demonstrating that bacterial community abundance was impacted by warming conditions and C dynamics. According to our findings, temperature was the most important factor influencing the structure and diversity of the bacterial community, regardless of the presence and composition of plant residues.
Bacterial diversity was highly dependent on the temperature regime, with different taxa exhibiting varying sensitivities and adaptation capabilities. In the control soil, the phylum Acidobacteria was dominant, but after 6 months of incubation at 2°C and 12°C, the class Betaproteobacteria became the main dominant, while at 22°C, the class Alphaproteobacteria emerged as dominant. In [81] study Actinobacteria and Firmicutes were the most sensitive to temperature changes, while Proteobacteria exhibited resistance to temperature variation.
Analysis of community α-diversity revealed that leaves are the most preferred substrate for increasing species richness: Shannon and OTU index values reached their maximum specifically in samples with leaf addition. These findings are similar to the result of previous studies concluded that temperature significantly affects the alpha- diversity of the soil bacterial community [82]. According to β-diversity data, temperature was the most important factor influencing the structure of the microbial community, with the optimum being 12°C.
The most abundant bacteria in the soil of our study were Massilia, with the maximum number observed at a temperature of 2°C. These bacteria are known for ability to colonize the surface and root systems of plants and some species can dissolve phosphorus compounds in the soil, accelerating plant growth, while preferring low temperatures [83]. Abundance of Spartobacteria, Niastella, Mucilaginibacter and WPS-2 also depended on the temperature regime. Gp1, Gp3, Gp6, and Gp16 genera, which are common in forest ecosystems and are typical of gray forest soil [84] were also abundant. Among the dominant bacteria were those of the genus Mucilaginibacter, which are known as denitrifiers and are sensitive to substrate addition, being more frequently found in the experimental variants with the leaves and branches. Meanwhile, Mucilaginibacter preferred lower temperatures, and its numbers decreased at 22°C. A similar pattern is observed for bacteria of the genus Caulobacter, which are also denitrifiers and prefer rich in substrate soils [84].
Substrate was another important factor influencing the composition of the microbial community. Some studies indicate that the diversity of soil microorganisms depends on the composition and amount of litter [85,86]. However, there is an opinion that the influence of the substrate should only be assessed taking into account the temperature regime [87]. Based on our findings we concluded that leaves were the most nutritious substrate—samples with their addition showed an increased diversity compared to samples with the addition of branches and the control. For example, bacteria of the genus Niastella, which were found in large numbers in the samples from the experiment with the addition of substrates (leaves and branches), were almost completely absent in the control samples. This phenomenon may be explained by the findings that such bacteria prefer readily available substrates and are most often isolated from the soil and rhizosphere of agricultural ecosystems [86,88]. A similar pattern was observed for the genus Devosia.

5. Conclusions

The important role of microorganisms in soil carbon dynamics is widely recognized, but predicting their behavior under climate warming remains unclear. We analyzed the effect of elevated temperatures on the active organic matter content and bacterial community diversity in laboratory simulations with forest soil amended with forest litter. It was found that temperature rise increased the content of active organic carbon, and the bacterial community structure was highly dependent on temperature, which further supports the importance of microorganisms in soil C mineralization during the warming. This study provides a theoretical reference for further understanding the interaction between soil microorganisms and active organic matter in forest soils under climate warming conditions.

Author Contributions

Conceptualization, I.K., V.S. and M.S.; methodology, V.S.; investigation, T.K., M.S.; data curation, N.K. and V.S.; writing—original draft preparation, N.K., M.S. and I.K.; writing—review and editing, V.S., H.L. and I.K.; visualization, I.P.; supervision, I.K.; project administration, I.K.; funding acquisition, I.K. and H.L. All authors have read and agreed to the published version of the manuscript.

Funding

This research was funded by Russian Science Foundation (RSF), grant number 25-47-00065 (RSF) (https://rscf.ru/en/project/25-47-00065/). HL was supported by National Nature Science Foundation of China (NSFC) grant number W2412054 through International Cooperation and Exchanges Project between NSFC and RSF.

Institutional Review Board Statement

Not applicable.

Data Availability Statement

The datasets presented in this study are available upon request from the corresponding author.

Acknowledgments

The authors thank the Core Facility “Physico-chemical methods of soil and ecosystem research “of IPCBPSS RAS, Puschino, Moscow Region, Russia, for the technical assistance and use of the research facilities.

Conflicts of Interest

The authors declare no conflicts of interest.

References

  1. Kögel-Knaber, I.; Amelung, W. Dynamics, Chemistry, and Preservation of Organic Matter in Soils. In Treatise on Geochemistry, Second Edition; Holland, H.D. , Turekian, K.K., Eds.; Elsevier: Oxford, 2014; Volume 12, pp. 157–215. [Google Scholar]
  2. Jackson, R.B.; Lajtha, K.; Crow, S.E.; Hugelius, G.; Kramer, M.G.; Piñeiro, G. The ecology of soil carbon: pools, vulnerabilities, and biotic and abiotic controls. Annu. Rev. Ecol. Evol. Syst. 2017, 48, 419–445. [Google Scholar] [CrossRef]
  3. Lehmann, J.; Kleber, M. The contentious nature of soil organic matter. Nature 2015, 528, 60–68. [Google Scholar] [CrossRef]
  4. Krull, E.S.; Skjemstad, J.O.; Baldock, J.A. Functions of soil organic matter and the effect on soil properties. CSIRO 2004, 129 p.
  5. Sinsabaugh, R.L.; Follstad Shah, J.J. Ecoenzymatic stoichiometry of recalcitrant organic matter decomposition: the growth rate hypothesis in reverse. Biogeochemistry 2011, 102, 31–43. [Google Scholar] [CrossRef]
  6. Rillig, M.C.; Ryo, M.; Lehmann, A.; Aguilar-Trigueros, C.A.; Buchert, S.; Wulf, A.; Iwasaki, A.; Roy, J.; Yang, G. The role of multiple global change factors in driving soil functions and microbial biodiversity. Science 2019, 366, 886–890. [Google Scholar] [CrossRef]
  7. Kleber, M.; Bourg, I.C.; Coward, E.K.; Hansel, C.M.; Myneni, S.C.; Nunan, N. Dynamic interactions at the mineral–organic matter interface. Nat. Rev. Earth Environ. 2021, 2, 402–421. [Google Scholar] [CrossRef]
  8. Chen, C.; Thompson, A. The influence of native soil organic matter and minerals on ferrous iron oxidation. Geochim. Cosmochim. Acta 2021, 292, 254–270. [Google Scholar] [CrossRef]
  9. Bradford, M.A.; Maynard, D.S.; Crowther, T.W.; Frankson, P.T.; Mohan, J.E.; Steinrueck, C.; Warren, R.J. Belowground community turnover accelerates the decomposition of standing dead wood. Ecology 2021, 102, e03484. [Google Scholar] [CrossRef]
  10. Santonja, M.; Pereira, S.; Gauquelin, T.; Quer, E.; Simioni, G.; Limousin, J.M.; Baldy, V. Experimental precipitation reduction slows down litter decomposition but exhibits weak to no effect on soil organic carbon and nitrogen stocks in three mediterranean forests of southern France. Forests 2022, 13, 1485. [Google Scholar] [CrossRef]
  11. Shay, P.E.; Winder, R.S.; Constabel, C.P.; Trofymow, J.A. Fungal community composition as affected by litter chemistry and weather during four years of litter decomposition in rainshadow coastal Douglas-fir forests. J. Fungi 2022, 8, 735. [Google Scholar] [CrossRef]
  12. Purahong, W.; Ji, L.; Wu, Y.T. Community assembly processes of deadwood mycobiome in a tropical forest revealed by long-read third-generation sequencing. Microb. Ecol. 2024, 87, 66. [Google Scholar] [CrossRef]
  13. Berg, B.; McClaugherty, C. Plant Litter: Decomposition, Humus Formation, Carbon Sequestration, 3rd ed.; Springer-Verlag: Berlin, Heidelberg, 2014; 315p. [Google Scholar]
  14. Prescott, C.E. Litter decomposition: what controls it and how can we alter it to sequester more carbon in forest soils? Biogeochemistry 2010, 101, 133–149. [Google Scholar] [CrossRef]
  15. Castellano, M.J.; Mueller, K.E.; Olk, D.C.; Sawyer, J.E.; Six, J. Integrating plant litter quality, soil organic matter stabilization, and the carbon saturation concept. Glob. Change Biol. 2015, 21, 3200–3209. [Google Scholar] [CrossRef]
  16. Cotrufo, M.F.; Soong, J.L.; Horton, A.J.; Campbell, E.E.; Haddix, M.L.; Wall, D.H.; Parton, W.J. Formation of soil organic matter via biochemical and physical pathways of litter mass loss. Nat. Geosci. 2015, 8, 776–779. [Google Scholar] [CrossRef]
  17. Rocci, K.S.; Lavallee, J.M.; Stewart, C.E.; Cotrufo, M.F. Soil organic carbon response to global environmental change depends on its distribution between mineral-associated and particulate organic matter: a meta-analysis. Sci. Total Environ. 2021, 793, 148569. [Google Scholar] [CrossRef]
  18. Rocci, K.S.; Cotrufo, M.F.; Ernakovich, J.; Foster, E.; Frey, S.; Georgiou, K.; Grandy, A.S.; Malhotra, A.; Reich, P.B.; Schlerman, E.P.; et al. Bridging 20 years of soil organic matter frameworks: empirical support, model representation, and next steps. J. Geophys. Res. Biogeosci. 2024, 129, e2023JG007964. [Google Scholar] [CrossRef]
  19. Lal, R. Digging deeper: A holistic perspective of factors affecting soil organic carbon sequestration in agroecosystems. Glob. Change Biol. 2018, 24, 3285–3301. [Google Scholar] [CrossRef]
  20. Scarascia-Mugnozza, G.; Bauer, G.A.; Persson, H.; Matteucci, G.; Masci, A. Tree biomass, growth and nutrient pools. In Carbon and Nitrogen Cycling in European Forest Ecosystems; Schulze, E.D., Ed.; Springer: Berlin, Heidelberg, 2000; pp. 49–62. [Google Scholar]
  21. Didion, M.; Frey, B.; Rogiers, N.; Thürig, E. Validating tree litter decomposition in the Yasso07 carbon model. Ecol. Model. 2014, 291, 58–68. [Google Scholar] [CrossRef]
  22. Manzoni, S.; Trofymow, J.A.; Jackson, R.B.; Porporato, A. Stoichiometric controls on carbon, nitrogen, and phosphorus dynamics in decomposing litter. Ecol. Monogr. 2010, 80, 89–106. [Google Scholar] [CrossRef]
  23. Zhang, D.; Hui, D.; Luo, Y.; Zhou, G. Rates of litter decomposition in terrestrial ecosystems: global patterns and controlling factors. J. Plant Ecol. 2008, 1, 85–93. [Google Scholar] [CrossRef]
  24. Carreiro, M.M.; Sinsabaugh, R.L.; Repert, D.A.; Parkhurst, D.F. Microbial enzyme shifts explain litter decay responses to simulated nitrogen deposition. Ecology 2000, 81, 2359–2365. [Google Scholar] [CrossRef]
  25. Baldwin, L.; Głazowska, S.; Mravec, J.; Fangel, J.; Zhang, H.; Felby, C.; Schjoerring, J.K. External nitrogen input affects pre-and post-harvest cell wall composition but not the enzymatic saccharification of wheat straw. Biomass Bioenergy 2017, 98, 70–79. [Google Scholar] [CrossRef]
  26. Wang, Q.; Wang, S.; He, T.; Liu, L.; Wu, J. Response of organic carbon mineralization and microbial community to leaf litter and nutrient additions in subtropical forest soils. Soil Biol. Biochem. 2014, 71, 13–20. [Google Scholar] [CrossRef]
  27. Luo, R.; Kuzyakov, Y.; Zhu, B.; Qiang, W.; Zhang, Y.; Pang, X. Phosphorus addition decreases plant lignin but increases microbial necromass contribution to soil organic carbon in a subalpine forest. Glob. Change Biol. 2022, 28, 4194–4210. [Google Scholar] [CrossRef]
  28. Fortunel, C.; Garnier, E.; Joffre, R.; Kazakou, E.; Quested, H.; Grigulis, K.; Lavorel, S.; Ansquer, P.; Castro, H.; Cruz, P.; et al. Leaf traits capture the effects of land use changes and climate on litter decomposability of grasslands across Europe. Ecology 2009, 90, 598–611. [Google Scholar] [CrossRef]
  29. Baldrian, P. Microbial activity and the dynamics of ecosystem processes in forest soils. Curr. Opin. Microbiol. 2017, 37, 128–134. [Google Scholar] [CrossRef]
  30. Bradford, M.A.; Wieder, W.R.; Bonan, G.B.; Fierer, N.; Raymond, P.A.; Crowther, T.W. Managing uncertainty in soil carbon feedbacks to climate change. Nat. Clim. Change 2016, 6, 751–758. [Google Scholar] [CrossRef]
  31. Menko, E.V.; Tikhonova, E.N.; Ulanova, R.V.; Sukhacheva, M.V.; Kuznetsova, T.V.; Udaltsov, S.N.; Kravchenko, I.K. Temperature sensitivity of the initial stage of microbial destruction of wood litter in forest soil. Biophysics 2018, 63, 792–802. [Google Scholar] [CrossRef]
  32. Kravchenko, I.; Tikhonova, E.; Semenov, V.M. Temperature sensitivity of litter and soil organic matter decomposition: perspective of soil microbial community structure and function. In Microbes in Land Use Change Management; Singh, J.S., Tiwari, S., Singh, C., Singh, A.K., Eds.; Elsevier: Amsterdam, The Netherlands, 2021; pp. 1–44. [Google Scholar]
  33. Filley, T.R.; Boutton, T.W.; Liao, J.D.; Jastrow, J.D.; Gamblin, D.E. Chemical changes to nonaggregated particulate soil organic matter following grassland-to-woodland transition in a subtropical savanna. J. Geophys. Res. Biogeosci. 2008, 113, G03009. [Google Scholar] [CrossRef]
  34. Davidson, E.A.; Janssens, I.A. Temperature sensitivity of soil carbon decomposition and feedbacks to climate change. Nature 2006, 440, 165–173. [Google Scholar] [CrossRef]
  35. Kirschbaum, M.U.F. The temperature dependence of organic-matter decomposition—still a topic of debate. Soil Biol. Biochem. 2006, 38, 2510–2518. [Google Scholar] [CrossRef]
  36. Hartley, I.P.; Ineson, P. Substrate quality and the temperature sensitivity of soil organic matter decomposition. Soil Biol. Biochem. 2008, 40, 1567–1574. [Google Scholar] [CrossRef]
  37. Melillo, J.M.; Frey, S.D.; DeAngelis, K.M.; Werner, W.J.; Bernard, M.J.; Bowles, F.P.; Grandy, A.S. Long-term pattern and magnitude of soil carbon feedback to the climate system in a warming world. Science 2017, 358, 101–105. [Google Scholar] [CrossRef]
  38. Van Gestel, N.; Shi, Z.; Van Groenigen, K.J.; Osenberg, C.W.; Andresen, L.C.; Dukes, J.S.; Hungate, B.A. Predicting soil carbon loss with warming. Nature 2018, 554, E4–E5. [Google Scholar] [CrossRef] [PubMed]
  39. Semenov, V.M.; Lebedeva, T.N.; Zinyakova, N.B.; Khromychkina, D.P.; Sokolov, D.A.; Lopes de Gerenyu, V.O.; Kravchenko, I.K.; Li, H.; Semenov, M.V. Dependence of soil organic matter and plant residues decomposition on temperature and moisture in the long-term incubation experiments. Eurasian Soil Sci. 2022, 55, 926–939. [Google Scholar] [CrossRef]
  40. Carey, J.C.; Tang, J.; Templer, P.H.; Kroeger, K.D.; Crowther, T.W.; Burton, A.J.; Tietema, A. Temperature response of soil respiration largely unaltered with experimental warming. Proc. Natl. Acad. Sci. USA 2016, 113, 13797–13802. [Google Scholar] [CrossRef] [PubMed]
  41. Crowther, T.W.; Todd-Brown, K.E.O.; Rowe, C.W.; Wieder, W.R.; Carey, J.C.; Machmuller, M.B.; Bradford, M.A. Quantifying global soil carbon losses in response to warming. Nature 2016, 540, 104–108. [Google Scholar] [CrossRef] [PubMed]
  42. Hicks Pries, C.E.; Castanha, C.; Porras, R.C.; Torn, M.S. The whole-soil carbon flux in response to warming. Science 2017, 355, 1420–1423. [Google Scholar] [CrossRef]
  43. Morrow, J.G.; Huggins, D.R.; Reganold, J.P. Climate change predicted to negatively influence surface soil organic matter of dryland cropping systems in the inland Pacific Northwest, USA. Front. Ecol. Evol. 2017, 5, 10. [Google Scholar] [CrossRef]
  44. Fierer, N.; Craine, J.M.; McLauchlan, K.; Schimel, J.P. Litter quality and the temperature sensitivity of decomposition. Ecology 2005, 86, 320–326. [Google Scholar] [CrossRef]
  45. Matzner, E.; Borken, W. Do freeze-thaw events enhance C and N losses from soils of different ecosystems? A review. Eur. J. Soil Sci. 2008, 59, 274–284. [Google Scholar] [CrossRef]
  46. Xiong, J.; Peng, F.; Sun, H.; Xue, X.; Chu, H. Divergent responses of soil fungi functional groups to short-term warming. Microb. Ecol. 2014, 68, 708–715. [Google Scholar] [CrossRef]
  47. Bardgett, R.D.; Freeman, C.; Ostle, N.J. Microbial contributions to climate change through carbon cycle feedbacks. ISME J. 2008, 2, 805–814. [Google Scholar] [CrossRef]
  48. Liang, C.; Schimel, J.P.; Jastrow, J.D. The importance of anabolism in microbial control over soil carbon storage. Nat. Microbiol. 2017, 2, 17105. [Google Scholar] [CrossRef]
  49. Mason-Jones, K.; Tian, P.; Liu, S.; Wang, Q.; Sun, T. Form of nitrogen deposition affects soil organic matter priming by glucose and cellulose. Biol. Fertil. Soils 2019, 55, 383–391. [Google Scholar] [CrossRef]
  50. Zhu, X.; Jackson, R.D.; DeLucia, E.H.; Tiedje, J.M.; Liang, C. The soil microbial carbon pump: From conceptual insights to empirical assessments. Glob. Change Biol. 2020, 26, 6032–6039. [Google Scholar] [CrossRef]
  51. Kästner, M.; Miltner, A.; Thiele-Bruhn, S.; Liang, C. Microbial necromass in soils—linking microbes to soil processes and carbon turnover. Front. Environ. Sci. 2021, 9, 756378. [Google Scholar] [CrossRef]
  52. Yergeau, E.; Bokhorst, S.; Kang, S.; Zhou, J.; Greer, C.W.; Aerts, R.; Kowalchuk, G.A. Shifts in soil microorganisms in response to warming are consistent across a range of Antarctic environments. ISME J. 2012, 6, 692–702. [Google Scholar] [CrossRef] [PubMed]
  53. Zhou, J.; Xue, K.; Xie, J.; Deng, Y.; Wu, L.; Cheng, X.; Luo, Y. Microbial mediation of carbon-cycle feedbacks to climate warming. Nat. Clim. Change 2012, 2, 106–110. [Google Scholar] [CrossRef]
  54. Allison, S.D.; Wallenstein, M.D.; Bradford, M.A. Soil-carbon response to warming dependent on microbial physiology. Nat. Geosci. 2010, 3, 336–340. [Google Scholar] [CrossRef]
  55. Rinnan, R.; Rousk, J.; Yergeau, E.; Kowalchuk, G.A.; Bååth, E. Temperature adaptation of soil bacterial communities along an Antarctic climate gradient: predicting responses to climate warming. Glob. Change Biol. 2009, 15, 2615–2625. [Google Scholar] [CrossRef]
  56. Blagodatskaya, E.; Blagodatsky, S.; Khomyakov, N.; Myachina, O.; Kuzyakov, Y. Temperature sensitivity and enzymatic mechanisms of soil organic matter decomposition along an altitudinal gradient on Mount Kilimanjaro. Sci. Rep. 2016, 6, 22240. [Google Scholar] [CrossRef] [PubMed]
  57. Ding, J.; Chen, L.; Zhang, B.; Liu, L.; Yang, G.; Fang, K.; Yang, Y. Linking temperature sensitivity of soil CO2 release to substrate, environmental, and microbial properties across alpine ecosystems. Glob. Biogeochem. Cycles 2016, 30, 1310–1323. [Google Scholar] [CrossRef]
  58. Karhu, K.; Auffret, M.D.; Dungait, J.A.J.; Hopkins, D.W.; Prosser, J.I.; Singh, B.K.; Hartley, I.P. Temperature sensitivity of soil respiration rates enhanced by microbial community response. Nature 2014, 513, 81–84. [Google Scholar] [CrossRef]
  59. Thiessen, S.; Gleixner, G.; Wutzler, T.; Reichstein, M. Both priming and temperature sensitivity of soil organic matter decomposition depend on microbial biomass–An incubation study. Soil Biol. Biochem. 2013, 57, 739–748. [Google Scholar] [CrossRef]
  60. Semenov, V.M.; Pautova, N.B.; Lebedeva, T.N.; Khromychkina, D.P.; Semenova, N.A. Decomposition of plant residues and the formation of active organic matter in the soil of incubation experiments. Eurasian Soil Sci. 2019, 52, 1172–1184. [Google Scholar] [CrossRef]
  61. Larionova, A.A.; Kvitkina, A.K.; Evdokimov, I.V.; Bykhovets, S.S.; Stulin, A.F. Effect of temperature on the decomposition rate of labile and stable organic matter in agrochernozem. Eurasian Soil Sci. 2013, 46, 803–813. [Google Scholar] [CrossRef]
  62. Semenov, V.M.; Tulina, A.S. Comparative characteristics of the mineralizable pool of organic matter in soils of natural and agricultural ecosystems. Eurasian Soil Sci. 2011, 44, 1227–1237. [Google Scholar]
  63. Klindworth, A.; Pruesse, E.; Schweer, T.; Peplies, J.; Quast, C.; Horn, M.; Glöckner, F.O. Evaluation of general 16S ribosomal RNA gene PCR primers for classical and next-generation sequencing-based diversity studies. Nucleic Acids Res. 2013, 41, e1. [Google Scholar] [CrossRef]
  64. Semenov, M.V.; Manucharova, N.A.; Krasnov, G.S.; Nikitin, D.A.; Stepanov, A.L. Biomass and taxonomic structure of microbial communities in soils of the right-bank basin of the Oka River. Eurasian Soil Sci. 2019, 52, 971–981. [Google Scholar] [CrossRef]
  65. McMurdie, P.J.; Holmes, S. phyloseq: An R Package for reproducible interactive analysis and graphics of microbiome census data. PLoS ONE 2013, 8, e61217. [Google Scholar] [CrossRef] [PubMed]
  66. Quast, C.; Pruesse, E.; Yilmaz, P.; Gerken, J.; Schweer, T.; Yarza, P.; Peplies, J.; Glöckner, F.O. The SILVA ribosomal RNA gene database project: Improved data processing and web-based tools. Nucleic Acids Res. 2013, 41, D590–D596. [Google Scholar] [CrossRef] [PubMed]
  67. Caporaso, J.G.; Kuczynski, J.; Stombaugh, J.; Bittinger, K.; Bushman, F.D.; Costello, E.K.; Fierer, N.; Peña, A.G.; Goodrich, J.K.; Gordon, J.I.; et al. QIIME allows analysis of highthroughput community sequencing data. Nat. Methods 2010, 7, 335–336. [Google Scholar] [CrossRef]
  68. Wickham, H.; Averick, M.; Bryan, J.; Chang, W.; D’Agostino McGowan, L.; François, R.; Grolemund, G.; Hayes, A.; Henry, L.; Hester, J.; et al. Welcome to the Tidyverse. J. Open Source Softw. 2019, 4, 1686. [Google Scholar] [CrossRef]
  69. Oksanen, J.; Blanchet, F.G.; Friendly, M.; Kindt, R.; Legendre, P.; McGlinn, D.; Minchin, P.R.; O’Hara, R.B.; Simpson, G.L.; Solymos, P.; et al. vegan: Community Ecology Package. R package version 2.5-6. 2019. Community Ecol. 2020, 8, 732–740. [Google Scholar]
  70. Angst, G.; Mueller, K.E.; Nierop, K.G.J.; Simpson, M.J. 2021. Plant- or microbial- derived? A review on the molecular composition of stabilized soil organic matter. Soil Biol. Biochem. 2021, 156, 108189. [Google Scholar] [CrossRef]
  71. Roberts, B.A.; Fritschi, F.B.; Horwath, W.R.; Scow, K.M.; Rains, W.D.; Travis, R.L. Comparisons of soil microbial communities influenced by soil texture, nitrogen fertility, and rotations. Soil Sci. 2011, 176, 487–494. [Google Scholar] [CrossRef]
  72. Song, S.; Hu, X.; Zhu, J.; Zheng, T.; Zhang, F.; Ji, C.; Zhu, J. The decomposition rates of leaf litter and fine root and their temperature sensitivities are influenced differently by biotic factors. Plant Soil 2021, 461, 603–616. [Google Scholar] [CrossRef]
  73. Conant, R.T.; Drijber, R.A.; Haddix, M.L.; Parton, W.J.; Paul, E.A.; Plante, A.F.; Steinweg, J.M. Sensitivity of organic matter decomposition to warming varies with its quality. Glob. Change Biol. 2008, 14, 868–877. [Google Scholar] [CrossRef]
  74. Li, Y.; Chen, Z.; Chen, J.; Castellano, M.J.; Ye, C.; Zhang, N.; Ding, W. Oxygen availability regulates the quality of soil dissolved organic matter by mediating microbial metabolism and iron oxidation. Glob. Change Biol. 2022, 28, 7410–7427. [Google Scholar] [CrossRef]
  75. Gershenson, A.; Bader, N.E.; Cheng, W. Effects of substrate availability on the temperature sensitivity of soil organic matter decomposition. Glob. Change Biol. 2009, 15, 176–183. [Google Scholar] [CrossRef]
  76. Feng, C.; Godbold, D.L.; Sun, H.; Wei, L.; Zhang, Y. Temperature sensitivity of organic matter mineralization as affected by soil edaphic properties and substrate quality. Catena 2022, 210, 105901. [Google Scholar] [CrossRef]
  77. Bastian, F.; Bouziri, L.; Nicolardot, B.; Ranjard, L. Impact of wheat straw decomposition on successional patterns of soil microbial community structure. Soil Biol. Biochem. 2009, 41, 262–275. [Google Scholar] [CrossRef]
  78. Korkama-Rajala, T.; Müller, M.M.; Pennanen, T. Decomposition and fungi of needle litter from slow-and fast-growing Norway spruce (Picea abies) clones. Microb. Ecol. 2008, 56, 76–89. [Google Scholar] [CrossRef]
  79. Kuzyakov, Y.; Friedel, J.K.; Stahr, K. Review of mechanisms and quantification of priming effects. Soil Biol. Biochem. 2000, 32, 1485–1498. [Google Scholar] [CrossRef]
  80. Philippot, L.; Griffiths, B.S.; Langenheder, S. Microbial community resilience across ecosystems and multiple disturbances. Microbiol. Mol. Biol. Rev. 2021, 85, e00026–e00120. [Google Scholar] [CrossRef] [PubMed]
  81. Sun, H.; Terhonen, E.; Koskinen, K.; Paulin, L.; Kasanen, R.; Asiegbu, F.O. Bacterial diversity and community structure along different peat soils in boreal forest. Appl. Soil Ecol. 2014, 74, 37–45. [Google Scholar] [CrossRef]
  82. Fang, K.; Chen, L.; Qin, S.; Zhang, Q.; Liu, X.; Chen, P.; Yang, Y. Mineral and climatic controls over soil organic matter stability across the Tibetan alpine permafrost region. Glob. Biogeochem. Cycles 2021, 35, e2021GB007118. [Google Scholar] [CrossRef]
  83. Zheng, B.X.; Bi, Q.F.; Hao, X.L.; Zhou, G.W.; Yang, X.R. Massilia phosphatilytica sp. nov., a phosphate solubilizing bacteria isolated from a long-term fertilized soil. Int. J. Syst. Evol. Microbiol. 2017, 67, 2514–2519. [Google Scholar] [CrossRef]
  84. Semenov, M.V.; Krasnov, G.S.; Semenov, V.M.; van Bruggen, A.H.C. Long-term fertilization rather than plant species shapes rhizosphere and bulk soil prokaryotic communities in agroecosystems. Appl. Soil Ecol. 2020, 154, 103641. [Google Scholar] [CrossRef]
  85. Zeng, Q.; An, S.; Liu, Y. Soil bacterial community response to vegetation succession after fencing in the grassland of China. Sci. Total Environ. 2017, 609, 2–10. [Google Scholar] [CrossRef]
  86. Chen, L.; Wang, D.; Yang, S.; Wang, G. Niastella vici sp. nov., isolated from farmland soil. Int. J. Syst. Evol. Microbiol. 2016, 66, 1768–1772. [Google Scholar] [CrossRef] [PubMed]
  87. Prevost-Boure, N.C.; Maron, P.A.; Ranjard, L.; Nowak, V.; Dufrene, E.; Damesin, C.; Lata, J.C. Seasonal dynamics of the bacterial community in forest soils under different quantities of leaf litter. Appl. Soil Ecol. 2011, 47, 14–23. [Google Scholar] [CrossRef]
  88. Akter, S.; Park, J.H.; Rahman, M.M.; Huq, M.A. Niastella soli sp. nov., isolated from rhizospheric soil of a persimmon tree. Int. J. Syst. Evol. Microbiol. 2021, 71, 004870. [Google Scholar] [CrossRef] [PubMed]
Figure 1. Trend in the average CO2 fluxes rates (mg C-CO2 g−1 d.w. soil day-1) measured over the course of the early 60-day phase of the incubation microcosm experiment. Letters show variant of experiment: a- control (C), b- amended with leaves (L), c- amended with branches (B). Color of line shows the incubation temperature: blue—2oC, orange—12oC, gray- 22oC.
Preprints 177884 g001
Figure 2. Cumulative C fluxes (mg CO2-C g−1 dry soil) over the course of the 364 -day decomposition experiment. Letters show variant of experiment: a- control (C), b- amended with leaves (L), c- amended with branches (B). Color of line shows the incubation temperature: blue—2oC, orange—12oC, gray- 22oC.
Preprints 177884 g002
Figure 3. Relative abundances of taxonomic groups across the different sample averaged across replicates (n = 3).
Preprints 177884 g003
Figure 4. Heatmap of the bacterial community structure at the genus level in an incubation experiment with the addition of plant residues.
Preprints 177884 g004
Figure 5. Bacterial richness (Observed) (A, B) and evenness (Shannon) (C, D) indexes depending on the substrate (A,C) and temperature regime (B, D) in soil microcosms.
Preprints 177884 g005
Figure 6. Principal Coordinate Analysis (PCoA) plot of soil bacterial community assembly patterns using the Bray-Curtis (BC) distance matrix. The ellipses have been drawn to highlight the grouping of the samples by temperature.
Preprints 177884 g006
Table 1. Basic parameters of the experimental gray forest soil.
Soil’s parameter, dimension Parameter`s value
Texture Loamya, coarseb
Clay, % 37.6 ± 0.7
Sand, % 1.8 ± 0.5
Loam, % 14.8 ± 0.5
pHH2O 5.28 ± 0.02
SOC, %
TN,%
2.53 ± 0.04
0.15 ± 0.03
C:N 12.13
N-NH4+, mg/100 g 0.29 ± 0.04
N-NO3˗, mg/100g 0.27 ± 0.01
P2O5, mg/100g 4.62 ± 0.09
K2O, mg/100g 14.10 ± 0.01
Ca2+, mmol/100 g 22.4 ± 0.14
Mg2+, mmol/100 g 0.60 ± 0.01
Cmbc, mg/100g 158 ± 3
Nmbd, mg/100g 38 ± 121
a US Department of Agriculture textural classes. b FAO textural classes. c carbon in microbial biomass. d nitrogen in microbial biomass.
Table 2. Decomposition of soil organic matter and plant residues during annual incubation depending on temperature.
Temperature Variant Corg, % of initial k1, day-1
2°С Control 2.6 ± 0.1 0.019 ± 0.000
Leaves 29.9 ± 0.1 0.013 ± 0.000
Branches 20.1 ± 0.2 0.006 ± 0.000
12°С Control 3.7 ± 0.1 0.021 ± 0.000
Leaves 44.7 ± 1.1 0.017 ± 0.001
Branches 32.1 ± 0.4 0.014 ± 0.000
22°С Control 7.4 ± 0.1 0.011 ± 0.000
Leaves 57.8 ± 1.7 0.025 ± 0.001
Branches 47.6 ± 0.6 0.015 ± 0.001
Table 3. The influence of decomposable materials on the size of the biologically active SOM pool .
Temperature Variant C0, mg/100 g k1, day-1 % of initial Сorg content MRI,
mg C/100 g/ day
2°С Control (C2) 64.8 ± 1.1 0.019 ± 0.000 2.6 1.24
Leaves (L2) 192.8 ± 0.8 0.015 ± 0.000 6.5 2.89
Branches (B2) 149.6 ± 1.5 0.010 ± 0.000 5.0 1.56
12°С Control (C12) 94.1 ± 1.8 0.021 ± 0.000 3.7 1.94
Leaves (L12) 286.0 ± 3.0 0.018 ± 0.000 9.7 5.11
Branches (B12) 244.1 ± 0.2 0.016 ± 0.000 8.2 3.90
22°С Control (C22) 186.1 ± 2.7 0.011 ± 0.000 7.4 2.13
Leaves (L22) 423.5 ± 5.8 0.019 ± 0.000 14.3 7.86
Branches (B22) 405.3 ± 1.6 0.014 ± 0.001 13.5 5.47
Table 4. Temperature coefficient Q10 of decomposition of soil organic matter and plant residues.
Temperature range Variants
Control Leaves Branches
Based on decomposition rate efficiency
2–12 °С 1.42 1.49 1.60
12–22 °С 2.00 1.29 1.48
Based on C-CO2 production during first month of decomposition
2–12 °С 1.87 3.12 10.31
12–22 °С 1.72 1.38 1.89
Based on C-CO2 production during 10th month of decomposition
2–12 °С 1.48 1.71 1.94
12–22 °С 3.17 2.21 2.20
Disclaimer/Publisher’s Note: The statements, opinions and data contained in all publications are solely those of the individual author(s) and contributor(s) and not of MDPI and/or the editor(s). MDPI and/or the editor(s) disclaim responsibility for any injury to people or property resulting from any ideas, methods, instructions or products referred to in the content.
Copyright: This open access article is published under a Creative Commons CC BY 4.0 license, which permit the free download, distribution, and reuse, provided that the author and preprint are cited in any reuse.
Prerpints.org logo

Preprints.org is a free preprint server supported by MDPI in Basel, Switzerland.

Subscribe

Disclaimer

Terms of Use

Privacy Policy

Privacy Settings

© 2025 MDPI (Basel, Switzerland) unless otherwise stated