
Submitted:
19 September 2025
Posted:
22 September 2025
You are already at the latest version
Abstract
Peruvian alpacas represent 85% of the global population and are mainly bred for their fiber and adaptation to high-altitude Andean environments. Two distinct phenotypes exist: Huacaya and Suri. This study aimed to investigate the genetic population structure of alpacas (Vicugna pacos) using genotyping by sequencing (GBS), also known as restriction enzyme-reduced representation sequencing, and to evaluate its application as a breeding tool. We sampled 838 Huacaya and Suri alpacas of varying coat colors and fiber qualities from ten locations in Cusco and Puno, Peru. After quality filtering, 68,641 high-confidence SNPs were obtained. These were used to estimate inbreeding, population differentiation (Fst), and observed and expected heterozygosity. Mean values of inbreeding, observed heterozygosity, and expected heterozygosity were 0.05, 0.30, and 0.34, respectively. Several animals across all sampling sites exhibited high inbreeding levels (≥0.20). Low genetic differentiation between Huacaya and Suri suggested close genetic relationships and continuous gene flow despite marked phenotypic differences. Overall, the results demonstrate that GBS provides a powerful and cost-effective approach for SNP discovery and genotyping in alpacas, offering valuable insights for genomic characterization and the potential identification of markers associated with productive traits in South American camelids managed by smallholder breeders.
Keywords:
alpaca genetics
; genotyping by sequencing
; SNP
; population structure
; genetic diversity
1. Introduction
Human use of South American camelids dates back more than 10,000 years, when the first human populations in the Americas began hunting the wild species guanaco (Lama guanicoe) and vicuña (Vicugna vicugna) for food [1,2]. Both the llama and the alpaca played an important role in the economy and culture of Andean communities, forming part of the life strategy of man and rural Andean communities even today. Alpacas are adapted to extreme environmental conditions, such as frost, present in high Andean regions such as Peru, lack of water and steep slopes, present in the Andean regions of Peru, Bolivia, Ecuador, Chile and Argentina [3].
The alpaca population in Peru is estimated at approximately 4.5 million. Most alpacas are found in the regions of Puno (45.3%), Cusco (15%), and Arequipa (10.5%). Regarding llamas, Peru ranks as the world's second-largest llama producer, with a total of 746,269 animals distributed across over 55,000 farming units. Roughly half of these are Ch’aku llamas, while the other half are Q’ara llamas. The Puno region has the highest concentration, accounting for 32% of the national population [4].
There are several reports using molecular markers to determine the population structure of alpaca populations using microsatellites. Figueroa (2023) [5] evaluated two alpaca populations (Ajoyani and Quimsachata) using fourteen and twelve microsatellite markers, respectively. The mean values of observed heterozygosity, expected heterozygosity, and polymorphism information content per marker for Ajoyani were 0.76 (0.11), 0.77 (0.10), and 0.74 while for Quimsachata, the values were 0.78 (0.09), 0.77 (0.10), and 0.74, respectively. This study provided valuable indicators for the design of appropriate conservation programs. Additionally, Gallegos-Acero (2023) [6], using pedigree data from Suri alpacas, reported an inbreeding coefficient (F) of 0.06% and an average relatedness (AR) of 0.40% in the reference alpaca population. A total of 288 ancestors contributed to its foundation, with 132 effective ancestors and 338 effective founders. The mean generation interval was 5.53 years, being longer in the sire–daughter and sire–son pathways. Pedigree completeness was 72.07% through the maternal line and 46.0% through the paternal line. In another study conducted in Poland, 17 microsatellite markers were used to differentiate alpacas from llamas and to assess interspecies admixture. The results showed high genetic diversity in Polish alpacas, with over 200 different alleles identified and average observed and expected heterozygosity values of 0.75 and 0.77, respectively. The average inbreeding coefficient was 0.03, and the polymorphism information content averaged 0.74 [7]. However, due to the small number of markers often identified, microsatellites have been disputed as a useful tool to measure genetic diversity, including in alpacas [8].
Alpaca fiber is a vital economic resource for thousands of smallholder producers in the Andean highlands, making genetic improvement a strategic priority for enhancing fiber quality and rural livelihoods. However, progress has been constrained by the lack of molecular tools specific to the species. Recent advances have begun to bridge this gap. A SNP microarray with 76,508 markers was developed for Huacaya alpacas, covering over 90% of the genome and enabling the identification of candidate variants related to fiber quality and color [9]. This tool supports genome-wide association studies (GWAS), marker-assisted selection, and the early implementation of genomic selection.
A genomic study involving 960 Huacaya alpacas applied this SNP array to Alpaca fiber and identified 35 SNPs, nine heritable haplotypes, and 180 SNPs under selection. Four candidate regions were consistently detected across multiple methods, marking the first comprehensive genomic analysis of fiber diameter in alpacas [10]. Complementary whole-genome sequencing of South American camelids identified runs of homozygosity and adaptive genes, with signs of introgression from wild species such as vicuñas and llamas into alpacas [11]. Unfortunately, the very high cost of the Alpaca SNP microarray prevents its use among the majority of breeders in Peru.
The purpose of our study is to explore genetic diversity measures for alpaca using the genotyping-by-sequencing (GBS) technology and evaluate its potential as a cost-effective tool for breeders in Peru. Using high-throughput SNPs derived from GBS data, we estimate inbreeding levels as well as observed and expected heterozygosities across all samples. We also assessed the genetic differentiation between Huacaya and Suri alpacas, the two types of alpacas with significant phenotypic differences, commonly regarded as different breeds in Peru.
2. Materials and Methods
Animal material and sample collection
Samples of 838 alpacas from ten sites in Cusco and Puno were used (Figure 1). Animals have different fleece colors and fiber quality. Two sites (La Raya-UNSAAC and UNA) are research sites from public Peruvian universities, and the remaining eight are local breeder farms of varying size. All sampling sites were located at elevations exceeding 4,000 meters above sea level.
Samples were collected from ear cartilage, placed in Tissue Sampling Unit (TSU) tubes and sent to the AgResearch laboratory in New Zealand for DNA extraction and GBS genotyping.
Sequencing and genotyping
We used genotyping by sequencing (GBS), also known as restriction enzyme-reduced representation sequencing (RE-RRS), a next-generation sequencing technique which digests genomic DNA using restriction enzymes and sequences the resulting fragments of given sizes. The GBS libraries were constructed according to the methods outlined in Elshire et al [12] with modifications as outlined in Dodds et al [13]. Two (Llama) / Four (Alpaca) GBS libraries were prepared using a PstI-MspI double-digest and negative control samples (no DNA) were included. Libraries underwent a Pippin Prep (SAGE Science, Beverly, Massachusetts, United States) to select fragments in the size range of 220-340 bp (genomic sequence plus 148 bp of adapters). Single-end sequencing (1 x 101bp) was performed on a NovaSeq6000 utilizing v1.5 chemistry. Raw fastq files were quality checked using a custom QC pipeline (available at https://github.com/AgResearch/DECONVQC). As one of the qc steps raw fastq files were quality checked using FastQC v0.10.1 (http://www.bioinformatics.babraham.ac.uk/projects/fastqc/).
Reference-based SNP detection
Reads were demultiplexed using GBSX v1.3 [14] with settings ‘-mb 0 -me 0 -n false’. Adapters were removed using cutadapt v2.9 [15] with settings ‘-a AGATCGGAAGAGCGGTTCAGCAGGAATGCCGAG -m 40’. A custom Python script was used to detect internal PstI cut sites. Reads were virtually digested and only the first fragment was kept. Processed reads shorter than 40 bp were discarded. Clean reads were aligned to a reference genome (Alpaca: GCA_000164845.5_VicPac3.2, Llama: GCA_013239585.1_ASM1323958v1) using bwa mem v0.7.17-r1188 [16] with default settings. Alignments were filtered using samtools v1.9 [17] with settings ‘-q 30’. Variants were detected using bcftools v1.9 [17] with settings ‘mpileup --max-depth 8000 --skip-indels -a AD,DP’, ‘call -cv’, ‘view -M2’.
SNP filtering and pruning
Raw vcf files were filtered using vcftools v. 0.1.16 [18] with the following settings: minor allele frequency >= 0.05; SNP quality >= 20; maximum missing rate <= 0.1 and Hardy-Weinberg equilibrium <= 0.01. BCFtools v. 1.21 [17] was then used for Linkage-dissequilibrium (LD) pruning using a LD value of 0.2 in 10 Kb sliding windows.
Inbreeding, heterozygosity and Fst coefficients
KGD 1.3.1 [13] was used to calculate the genomic relationship matrix (GRM) and to estimate inbreeding levels. For each sample, the inbreeding coefficient was defined as self-relatedness (GRM diagonal) minus 1. Population differentiation metrics (Fst coefficient) between Suri and Huacaya and across locations, and the observed and expected heterozygosities adjusted for sequencing depth were also estimated using the population genetics functions, GBS-PopGen.R, from KGD [19]. The observed heterozygosity was taken from ohet2 and the expected heterozygosity from ehet. KGD is freely available at https://github.com/AgResearch/KGD.
Population structure analysis
3. Results
Alpaca population analysis
A total of 835 alpaca samples were successfully sequenced and produced a total of 773,827 SNPs across samples. Each site had an average mean read depth of 1.29 and a call rate of 0.547. After filtering and pruning, 68,641 SNPs were kept for further analyses. These final SNPs had a mean read depth of 1.71 and a mean call rate of 0.73.
Across all samples, the estimated inbreeding was variable with a mean value of 0.05, and minimum and maximum values of -0.37 and 0.42, respectively. However, there were a few animals with high levels of inbreeding (inbreeding coefficient >=0.20). Across locations (Figure 2), the pattern was similar. Most farms have mean inbreeding levels around 0.05 but also had several animals with high inbreeding. In particular, Espinar, Huaycho and Nuñoa have animals with the highest inbreeding levels with inbreeding coefficients >0.30. In contrast to that, the animals from the university sites, UNSAAC and UNA, show the lowest inbreeding levels. Negative inbreeding values for some samples were also observed across all locations. These can arise due to excess heterozygosity relative to Hardy-Weinberg equilibrium and indicate that on average parents are less related than expected under random mating. Founders and outbred animals are expected to have negative inbreeding levels [27].
The observed and expected heterozygosities, mean across all samples, were 0.30 and 0.34, respectively. There was little variation in heterozygosity across locations, both observed and expected, as all values were in the range of 0.28 to 0.34. Similarly, the population differentiation metrics (Fst) showed no genetic background differences across the ten locations, Fst values ranged from 0.001 to 0.025 (no statistical differences). Importantly, the estimated Fst between Huacaya and Suri was 0.001, showing no evidence of genetic differentiation between animals from these two breeds.
Comparison of cross-entropy values between different K values suggested the existence of 7 ancestral populations that contributed to the current alpaca genetic pool (Figure 3). Every individual was assigned to a putative genetic population based on the contribution of each putative ancestral population to its genetic composition. Every ancestral population has at least one extant individual assigned to that population. The large majority of individuals sampled belong to population P5, which suggests a sampling bias caused either by the effect of breeding programs looking to improve wool production, quality and disease resistance or by the number of locations sampled (mostly Cusco and Puno areas).
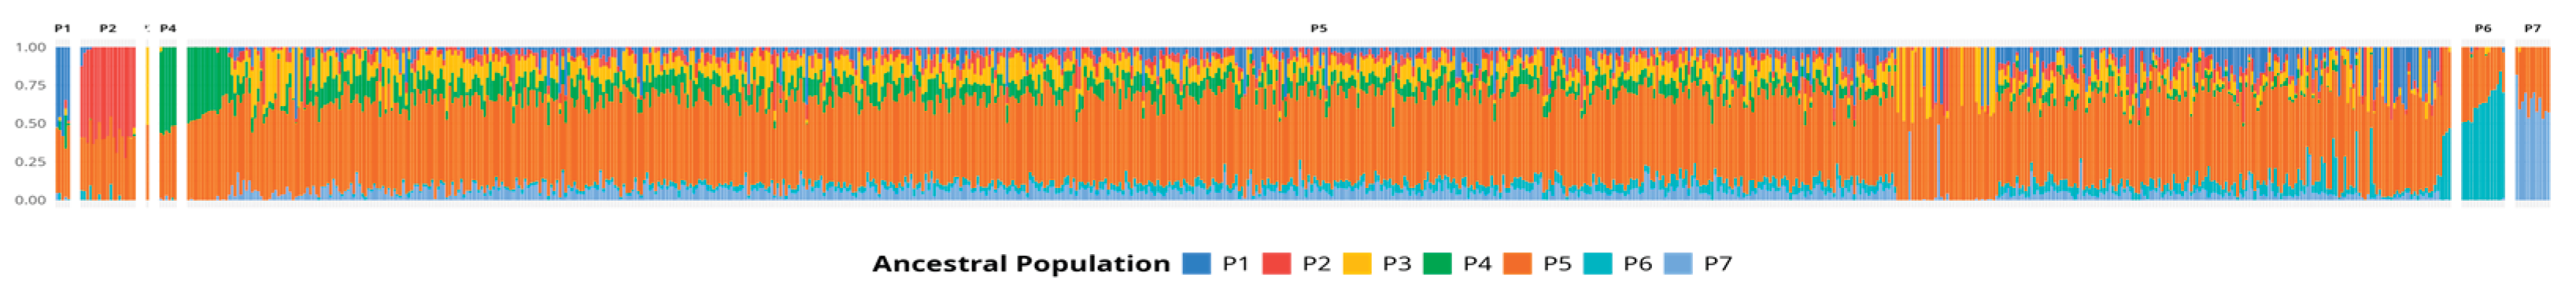
The Q-matrix produced by sNMF analysis was used as a proxy to measure the genetic contribution of each ancestral population to each individual genetic composition. As can be seen in Figure 4, every individual contains a significant contribution of ancestral population P5, which reinforces the idea that population P5 is overrepresented in the samples of this study, either because of biased sampling in the limited geographical location or due to breeding practices.
4. Discussion
GBS genotyping is a flexible, high-throughput technology. It can provide high marker density at approximately one-fifth the cost of currently available genotyping technologies [22] for genetic diversity studies, genomic selection and genome-wide association studies. This makes GBS a powerful, cost-effective approach for discovering and genotyping single-nucleotide polymorphisms in species where SNP chip arrays are not available or where the cost of SNP chip arrays is prohibitively high for breeders.
GBS genotyping has been used in several minor livestock species, including horses, deer, camels and guinea pigs, for genetic and genomic population studies, revealing genetic differentiation among analyzed breeds [23,24,25,26]. Here we used GBS on alpaca populations from two breeds (Huacaya and Suri) from ten sites in Peru. Our results from the Fst and population structure analyses show no clear genetic differences between Huacaya and Suri phenotypes (mean Fst=0.001). In contrast to that, and using a similar GBS approach, Dodds et al [19] found clear differences between red and wapiti for farmed deer in NZ (mean Fst =0.088). Our results thus confirm that Huacaya and Suri alpaca might not be considered different breeds from a genomic perspective only and provide support to the hypothesis that Suri alpaca could have resulted from a mutation of the TRPV3 gene in Huacaya animals [11].
The levels of inbreeding estimated here (overall mean=0.05) are similar to those reported previously for this species in Peru. Using the alpaca SNP chip array, Calderón et al. (2021), estimated an overall inbreeding of 0.004 (0.02) using 150 animals from four locations in Peru. Sampling bias of farms/animals might be a likely reason for these differences, as our study includes mostly farms from smallholder breeders (8/10 sites) whereas Calderón et al. (2021) mostly sampled alpacas from the private companies in Peru with established breeding programs (3/4 sites). In addition, Pallotti et al., (2023) [11] estimated similar inbreeding levels, 0.043 (± 0.022), using whole-genome sequence data from Peruvian alpaca samples. Importantly, high levels of inbreeding (>=0.20) were observed for several animals in all ten locations.
The estimated heterozygosity across all samples (0.32 observed and 0.34 expected), was similar to that estimate by Calderón et al. (2021) using SNP chip array data for alpacas, 0.27 (0.01). Both estimations were also much lower than the heterozygosity estimated by microsatellites, which ranged between 0.75 and 0.78 [5,6,7]. Similar lower levels of heterozygosity have also been estimated for other species using SNP chip data. For instance, local goat breeds in Italy exhibited heterozygosities from 0.22 to 0.44 [28,29] which might confirm the potential biases when using microsatellites.
A closer look at the population structure reveals genetic signatures from up to 7 different populations. Despite this, all individuals derive a significant proportion of their variants from a single putative ancestral population (P5). This prevents a clear separation of the populations via PCA and weak population structure. This combination of low heterozygosity and shallow population structure has has been previously reported in endangered vultures (Gyps coprotheres) in southern Africa using microsatellite markers. Although the analysis rejected a recent population bottleneck, the reduction in effective population size and heterozygosity raised concerns over its future management and conservation [30].
A recent assessment of alpaca populations in Peru using microsatellite markers also showed limited population structure with most of the genetic variants coming from a common ancestral population. This study included 38 Huacaya individuals from two locations in the Junin region (Suitucancha and Paccha) of Peru [31] and used data from a 2023 survey that looked at 168 Huacaya individuals from the Puno region (Ajoyani and Quimsachata [5]). Both studies showed no population structure in the two samples analyzed despite their different geographical locations and different breeding approaches.
An empirical comparison of genomic diversity estimations between SNP and microsatellite data in Arabidopsis halleri showed that SNP diversity estimations are more reliable and less biased than microsatellite ones, with the latter consistently overestimating genetic diversity [32]. In another comparison between SNP and microsatellite population genetic estimates in Gunnison sage-grouse (Centrocercus minimus) showed good concordance between the population estimates using either data source, but in some instances there were significant differences in the estimation of genetic diversity between the two data sources. The authors conclude that SNP data has three main advantages: it estimates population diversity more precisely, has a higher resolution to identify clusters and has the ability to consider local adaptations [33]. Our work supports these reports , by estimating lower genetic diversity and increasing the resolution and sensitivity of cluster identification in the Alpaca populations studied.
5. Conclusions
Our findings highlight the emerging role of genomic tools like GBS in alpaca breeding in Peru and other countries farming minor species, where a small number of farm animals make SNP chip arrays too expensive. The intense selection pressure for fiber quality and color, and the absence of breeding programs among smallholder farms where crosses between relatives are avoided could explain the high levels of inbreeding found here. Integrating GBS tools into selection programs for alpaca can thus accelerate genetic progress and significantly enhance production traits, contributing to the sustainability and competitiveness of smallholder breeders.
Supplementary Materials
The article does not have any supplementary material.
Author Contributions
All the authors listed in this paper have contributed to the preparation and execution of this research. J.M., R.B. and R.C.: Methodology, Data curation, Software, Formal analysis and Investigation; C.M., H.R. and R.C.: Funding acquisition and Supervision; C.M. and J.M.: Writing - original draft and Writing—Review and Editing; H.R., C.M. and R.C.: Project administration. C.M., J.M. and R.C.: Writing - original draft. J.M., C.M., H.R., and R.C. All authors have read and agreed to the published version of the manuscript.
Funding
This research was funded by CONCYTEC through the PROCIENCIA program (ex-FONDECYT), under the framework of the “Proyectos de investigacion basica 2022-01” competition, according to agreement N° PE501077903-2022-PROCIENCIA and to the Universidad Nacional San Antonio Abad del Cusco through the financial scheme E041-2017-UNSAAC-02.
Institutional Review Board Statement
This research was performed in strict accordance with the recommendations in the legal frame-work (Animal Welfare Law) for all Peruvian Public and Private Laboratories and Higher Education Institutions. Moreover, the study was conducted according to the guidelines of the Declaration of Helsinki and following the Code of Ethics for animal experiments as reflected in the ARRIVE guidelines available at http://www.nc3rs.org.uk/ARRIVEchecklist (Accessed on 7 July 2020). This study was approved by the Bioethics Committee for the use of animals at the Universidad Nacional del Altiplano—Puno—Perú (Approval Date: 22 October 2022, Code Number: CONSTANCIA DE ETICA N° 12-2022-FMVZ-UNA-PUNO)".
Informed Consent Statement
Not applicable.
Data Availability Statement
The GBS genotypes used in this study will be publicly available at Figshare after publication at Alpaca GBS genotypes (vcf files).
Acknowledgments
The authors would like to thank the Macusani District Municipality for providing access to the slaughterhouse to conduct this research.
Conflicts of Interest
The authors declare no conflicts of interest.
Abbreviations
The following abbreviations are used in this manuscript:
| GBS | Genotyping by sequencing |
| SNP | Single Nucleotide Polimorfic |
| GWAS | Genome-wide association studies |
| UNSAAC | Universidad Nacional San Antonio Abad del Cusco |
| UNA | Universidad Nacional del Altiplano |
| TSU | Tissue Sampling Unit |
| RE-RRS | Restriction enzyme-reduced representation sequencing |
| GRM | Genomic relationship matrix |
| Fst | Population differentiation metrics |
References
- Wheeler, J.C. La Domesticación de La Alpaca (Lama Pacos L.) y La Llama (Lama Glama L.) y El Desarrollo Temprano de La Ganadería Autóctona En Los Andes Centrales. Boletín de Lima 1984, 36, 74–84. [Google Scholar]
- Fan, R.; Gu, Z.; Guang, X.; Marín, J.C.; Varas, V.; González, B.A.; Wheeler, J.C.; Hu, Y.; Li, E.; Sun, X.; et al. Genomic Analysis of the Domestication and Post-Spanish Conquest Evolution of the Llama and Alpaca. Genome Biol 2020, 21, 159. [Google Scholar] [CrossRef]
- Wheeler, J.C. Origen, Evolución y Status Actual. Avances y Perspectivas En El Conocimiento de Los Camélidos Sudamericanos. En: Fernández-Baca, S. (Ed) Avances y Perspectivas Del Conocimiento de Los Camélidos Sudamericanos. FAO. Santiago, Chile.
- MIDAGRI Ministerio de Desarrollo Agrario y Riego. Anuario Estadístico Producción Ganadera y Avícola 2021, Dirección General de Estadística, Seguimiento y Evaluación de Políticas / Dirección de Estadística e Información Agraria. Dirección de Estadística e Información Agraria.
- Figueroa, D.; Corredor, F.-A.; Mamani-Cato, R.H.; Gallegos-Acero, R.F.; Condori-Rojas, N.; Estrada, R.; Heredia, L.; Salazar, W.; Quilcate, C.; Arbizu, C.I. Microsatellite-Based Genetic Diversity and Population Structure of Huacaya Alpacas (Vicugna Pacos) in Southern Peru. Animals 2023, 13, 1552. [Google Scholar] [CrossRef]
- Gallegos-Acero, R.; Canaza-Cayo, A.W.; Halley Rodríguez-Huanca, F.; Herberht Mamani-Cato, R.; De La Cruz, A.; Sílvio De Sousa Bueno Filho, J. Genetic Structure of the Population of Suri Alpaca from Peru. JAHP 2023, 11. [Google Scholar] [CrossRef]
- Podbielska, A.; Piórkowska, K.; Szmatoła, T. Microsatellite-Based Genetic Structure and Hybrid Detection in Alpacas Bred in Poland. Animals 2021, 11, 2193. [Google Scholar] [CrossRef]
- Jackling, F.C.; Vaughan, J.L.; Goddard, M.E.; Appleton, B.R. GENETIC DIVERSITY IN ALPACAS: CAN INBREEDING EXPLAIN THE HIGH PREVALENCE OF CONGENITAL DEFECTS? Proc. Assoc. Advmt. Anim. Breed. Genet. 19.
- Calderon, M.; More, M.J.; Gutierrez, G.A.; Ponce De León, F.A. Development of a 76k Alpaca (Vicugna Pacos) Single Nucleotide Polymorphisms (SNPs) Microarray. Genes 2021, 12, 291. [Google Scholar] [CrossRef]
- More, M.; Veli, E.; Cruz, A.; Gutiérrez, J.P.; Gutiérrez, G.; Ponce De León, F.A. Genome-Wide Association Study of Fiber Diameter in Alpacas. Animals 2023, 13, 3316. [Google Scholar] [CrossRef]
- Pallotti, S.; Picciolini, M.; Antonini, M.; Renieri, C.; Napolioni, V. Genome-Wide Scan for Runs of Homozygosity in South American Camelids. BMC Genomics 2023, 24, 470. [Google Scholar] [CrossRef]
- Elshire, R.J.; Glaubitz, J.C.; Sun, Q.; Poland, J.A.; Kawamoto, K.; Buckler, E.S.; Mitchell, S.E. A Robust, Simple Genotyping-by-Sequencing (GBS) Approach for High Diversity Species. PLoS ONE 2011, 6, e19379. [Google Scholar] [CrossRef]
- Dodds, K.G.; McEwan, J.C.; Brauning, R.; Anderson, R.M.; Van Stijn, T.C.; Kristjánsson, T.; Clarke, S.M. Construction of Relatedness Matrices Using Genotyping-by-Sequencing Data. BMC Genomics 2015, 16, 1047. [Google Scholar] [CrossRef]
- Herten, K.; Hestand, M.S.; Vermeesch, J.R.; Van Houdt, J.K. GBSX: A Toolkit for Experimental Design and Demultiplexing Genotyping by Sequencing Experiments. BMC Bioinformatics 2015, 16, 73. [Google Scholar] [CrossRef] [PubMed]
- Martin, M. Cutadapt Removes Adapter Sequences from High-Throughput Sequencing Reads. EMBnet j. 2011, 17, 10. [Google Scholar] [CrossRef]
- Li, H.; Durbin, R. Fast and Accurate Short Read Alignment with Burrows–Wheeler Transform. Bioinformatics 2009, 25, 1754–1760. [Google Scholar] [CrossRef] [PubMed]
- Danecek, P.; Bonfield, J.K.; Liddle, J.; Marshall, J.; Ohan, V.; Pollard, M.O.; Whitwham, A.; Keane, T.; McCarthy, S.A.; Davies, R.M.; et al. Twelve Years of SAMtools and BCFtools. GigaScience 2021, 10, giab008. [Google Scholar] [CrossRef] [PubMed]
- Danecek, P.; Auton, A.; Abecasis, G.; Albers, C.A.; Banks, E.; DePristo, M.A.; Handsaker, R.E.; Lunter, G.; Marth, G.T.; Sherry, S.T.; et al. The Variant Call Format and VCFtools. Bioinformatics 2011, 27, 2156–2158. [Google Scholar] [CrossRef] [PubMed]
- Dodds, K.G.; McEwan, J.C.; Brauning, R.; Clarke, S.M. Assessing Population Allele Frequency Differences Using Low-Depth Sequencing Data. Journal of the Royal Society of New Zealand 2025, 55, 2677–2688. [Google Scholar] [CrossRef]
- Frichot, E.; François, O. LEA: An R Package for Landscape and Ecological Association Studies. Methods Ecol Evol 2015, 6, 925–929. [Google Scholar] [CrossRef]
- Jombart, T. Adegenet : A R Package for the Multivariate Analysis of Genetic Markers. Bioinformatics 2008, 24, 1403–1405. [Google Scholar] [CrossRef]
- De Donato, M.; Peters, S.O.; Mitchell, S.E.; Hussain, T.; Imumorin, I.G. Genotyping-by-Sequencing (GBS): A Novel, Efficient and Cost-Effective Genotyping Method for Cattle Using Next-Generation Sequencing. PLoS ONE 2013, 8, e62137. [Google Scholar] [CrossRef]
- Costilla, R.; Brauning, R.; Ward, J.F.; Newman, S.-A.N.; McIntyre, S.; Van Stijn, T.C.; Baird, H.J.; Thompson, B.R.; Clarke, S.M.; McEwan, J.C.; et al. Improved Prediction Using Genomic Relationships for Farmed Red Deer in New Zealand. New Zealand Journal of Agricultural Research 2025, 68, 798–807. [Google Scholar] [CrossRef]
- Sabahat, S.; Brauning, R.; Clarke, S.M.; Nadeem, A.; Thomson, P.C.; Khatkar, M.S. SNP Discovery and Population Structure Analysis in Lassi and Marecha Camel Breeds Using a Genotyping by Sequencing Method. Animal Genetics 2020, 51, 620–623. [Google Scholar] [CrossRef]
- Borja Lozano, M.V.; Vigil Santillán, B.; More Montoya, M.J.; Morón Barraza, J.A.; García-Serquén, A.L.; Gutiérrez Reynoso, G.; Yalta-Macedo, C.E. Genotyping-by-sequencing Reveals a High Number and Quality of Single Nucleotide Polymorphisms in Guinea Pigs ( Cavia Porcellus ) from the Peruvian Andes. Animal Genetics 2023, 54, 792–797. [Google Scholar] [CrossRef]
- Gurgul, A.; Miksza-Cybulska, A.; Szmatoła, T.; Jasielczuk, I.; Piestrzyńska-Kajtoch, A.; Fornal, A.; Semik-Gurgul, E.; Bugno-Poniewierska, M. Genotyping-by-Sequencing Performance in Selected Livestock Species. Genomics 2019, 111, 186–195. [Google Scholar] [CrossRef]
- Foster, Y.; Dutoit, L.; Grosser, S.; Dussex, N.; Foster, B.J.; Dodds, K.G.; Brauning, R.; Van Stijn, T.; Robertson, F.; McEwan, J.C.; et al. Genomic Signatures of Inbreeding in a Critically Endangered Parrot, the Kākāpō. G3 Genes|Genomes|Genetics 2021, 11, jkab307. [Google Scholar] [CrossRef] [PubMed]
- Genomic Characterization of Animal Genetic Resources; FAO, 2023; ISBN 978-92-5-137298-2.
- Cortellari, M.; Barbato, M.; Talenti, A.; Bionda, A.; Carta, A.; Ciampolini, R.; Ciani, E.; Crisà, A.; Frattini, S.; Lasagna, E.; et al. The Climatic and Genetic Heritage of Italian Goat Breeds with Genomic SNP Data. Sci Rep 2021, 11, 10986. [Google Scholar] [CrossRef]
- Kleinhans, C.; Willows-Munro, S. Low Genetic Diversity and Shallow Population Structure in the Endangered Vulture, Gyps Coprotheres. Sci Rep 2019, 9, 5536. [Google Scholar] [CrossRef] [PubMed]
- Peralta, W.; Nestares, A.; Gamarra, J.; Rojas, M.; Sullca, J.; Estrada, R. Genetic Diversity and Population Structure of Alpacas (Vicugna Pacos) in Peru: A Microsatellite Analysis. Diversity 2025, 17, 353. [Google Scholar] [CrossRef]
- Fischer, M.C.; Rellstab, C.; Leuzinger, M.; Roumet, M.; Gugerli, F.; Shimizu, K.K.; Holderegger, R.; Widmer, A. Estimating Genomic Diversity and Population Differentiation – an Empirical Comparison of Microsatellite and SNP Variation in Arabidopsis Halleri. BMC Genomics 2017, 18, 69. [Google Scholar] [CrossRef]
- Zimmerman, S.J.; Aldridge, C.L.; Oyler-McCance, S.J. An Empirical Comparison of Population Genetic Analyses Using Microsatellite and SNP Data for a Species of Conservation Concern. BMC Genomics 2020, 21, 382. [Google Scholar] [CrossRef] [PubMed]
Figure 1.
Geographical locations (in red) where alpaca were sampled in the south of Peru (Cusco and Puno).
Figure 1.
Geographical locations (in red) where alpaca were sampled in the south of Peru (Cusco and Puno).
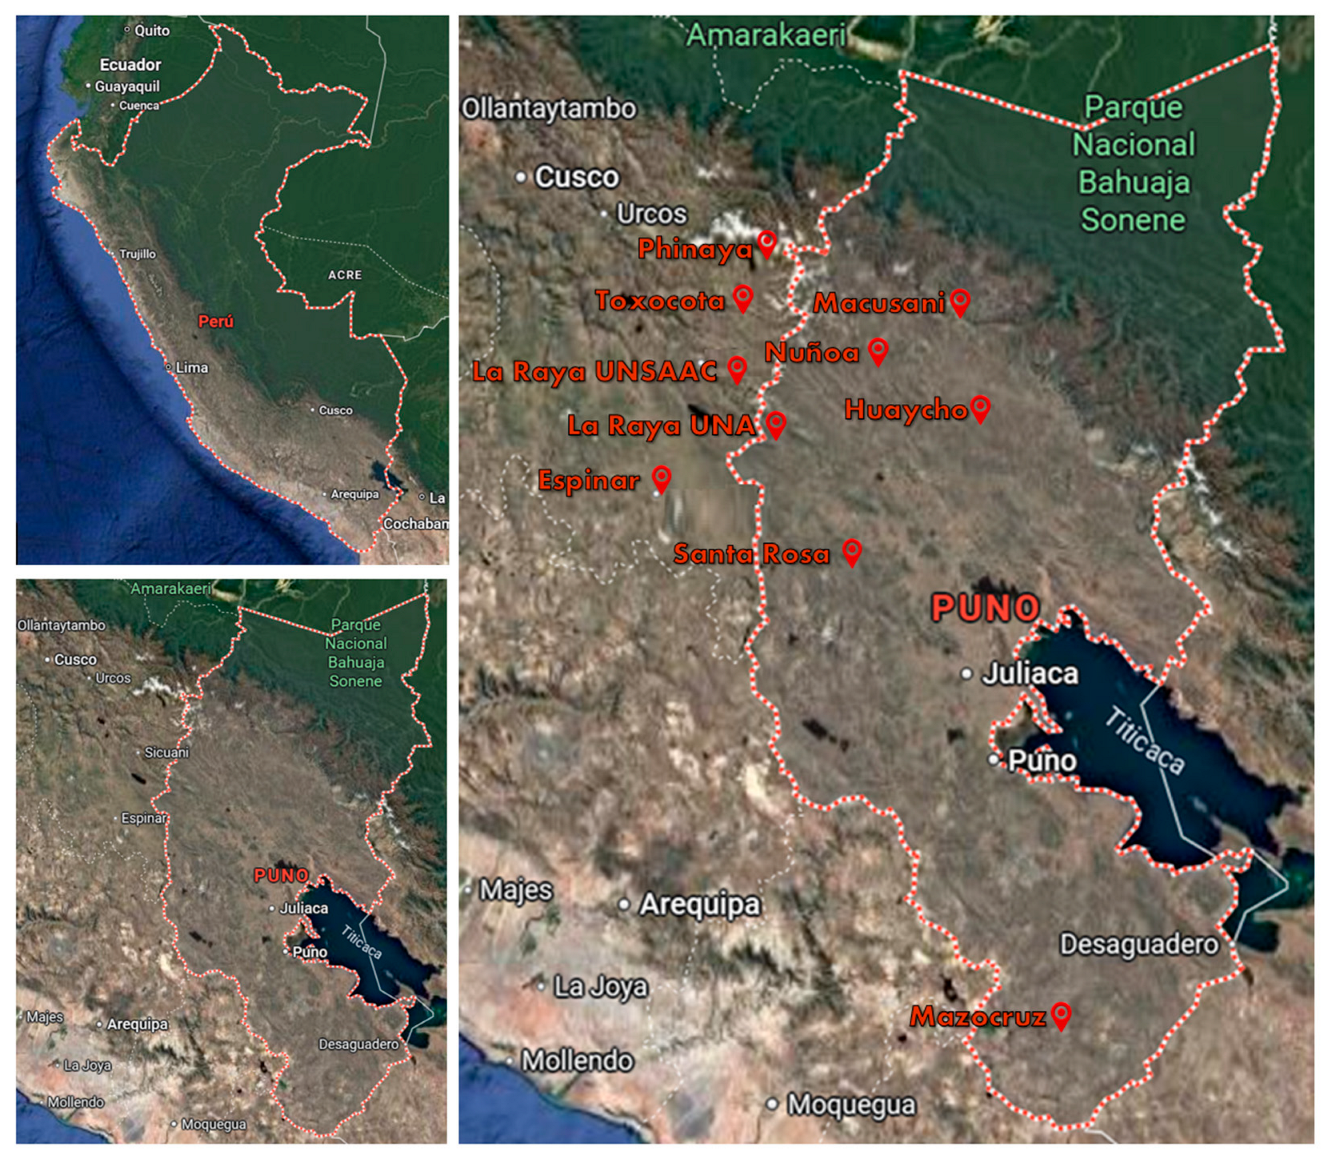
Figure 2.
Inbreeding levels by location for alpaca samples. Each dot represents the inbreeding coefficient for a sample. Boxplots show their distributions at a particular location.
Figure 2.
Inbreeding levels by location for alpaca samples. Each dot represents the inbreeding coefficient for a sample. Boxplots show their distributions at a particular location.
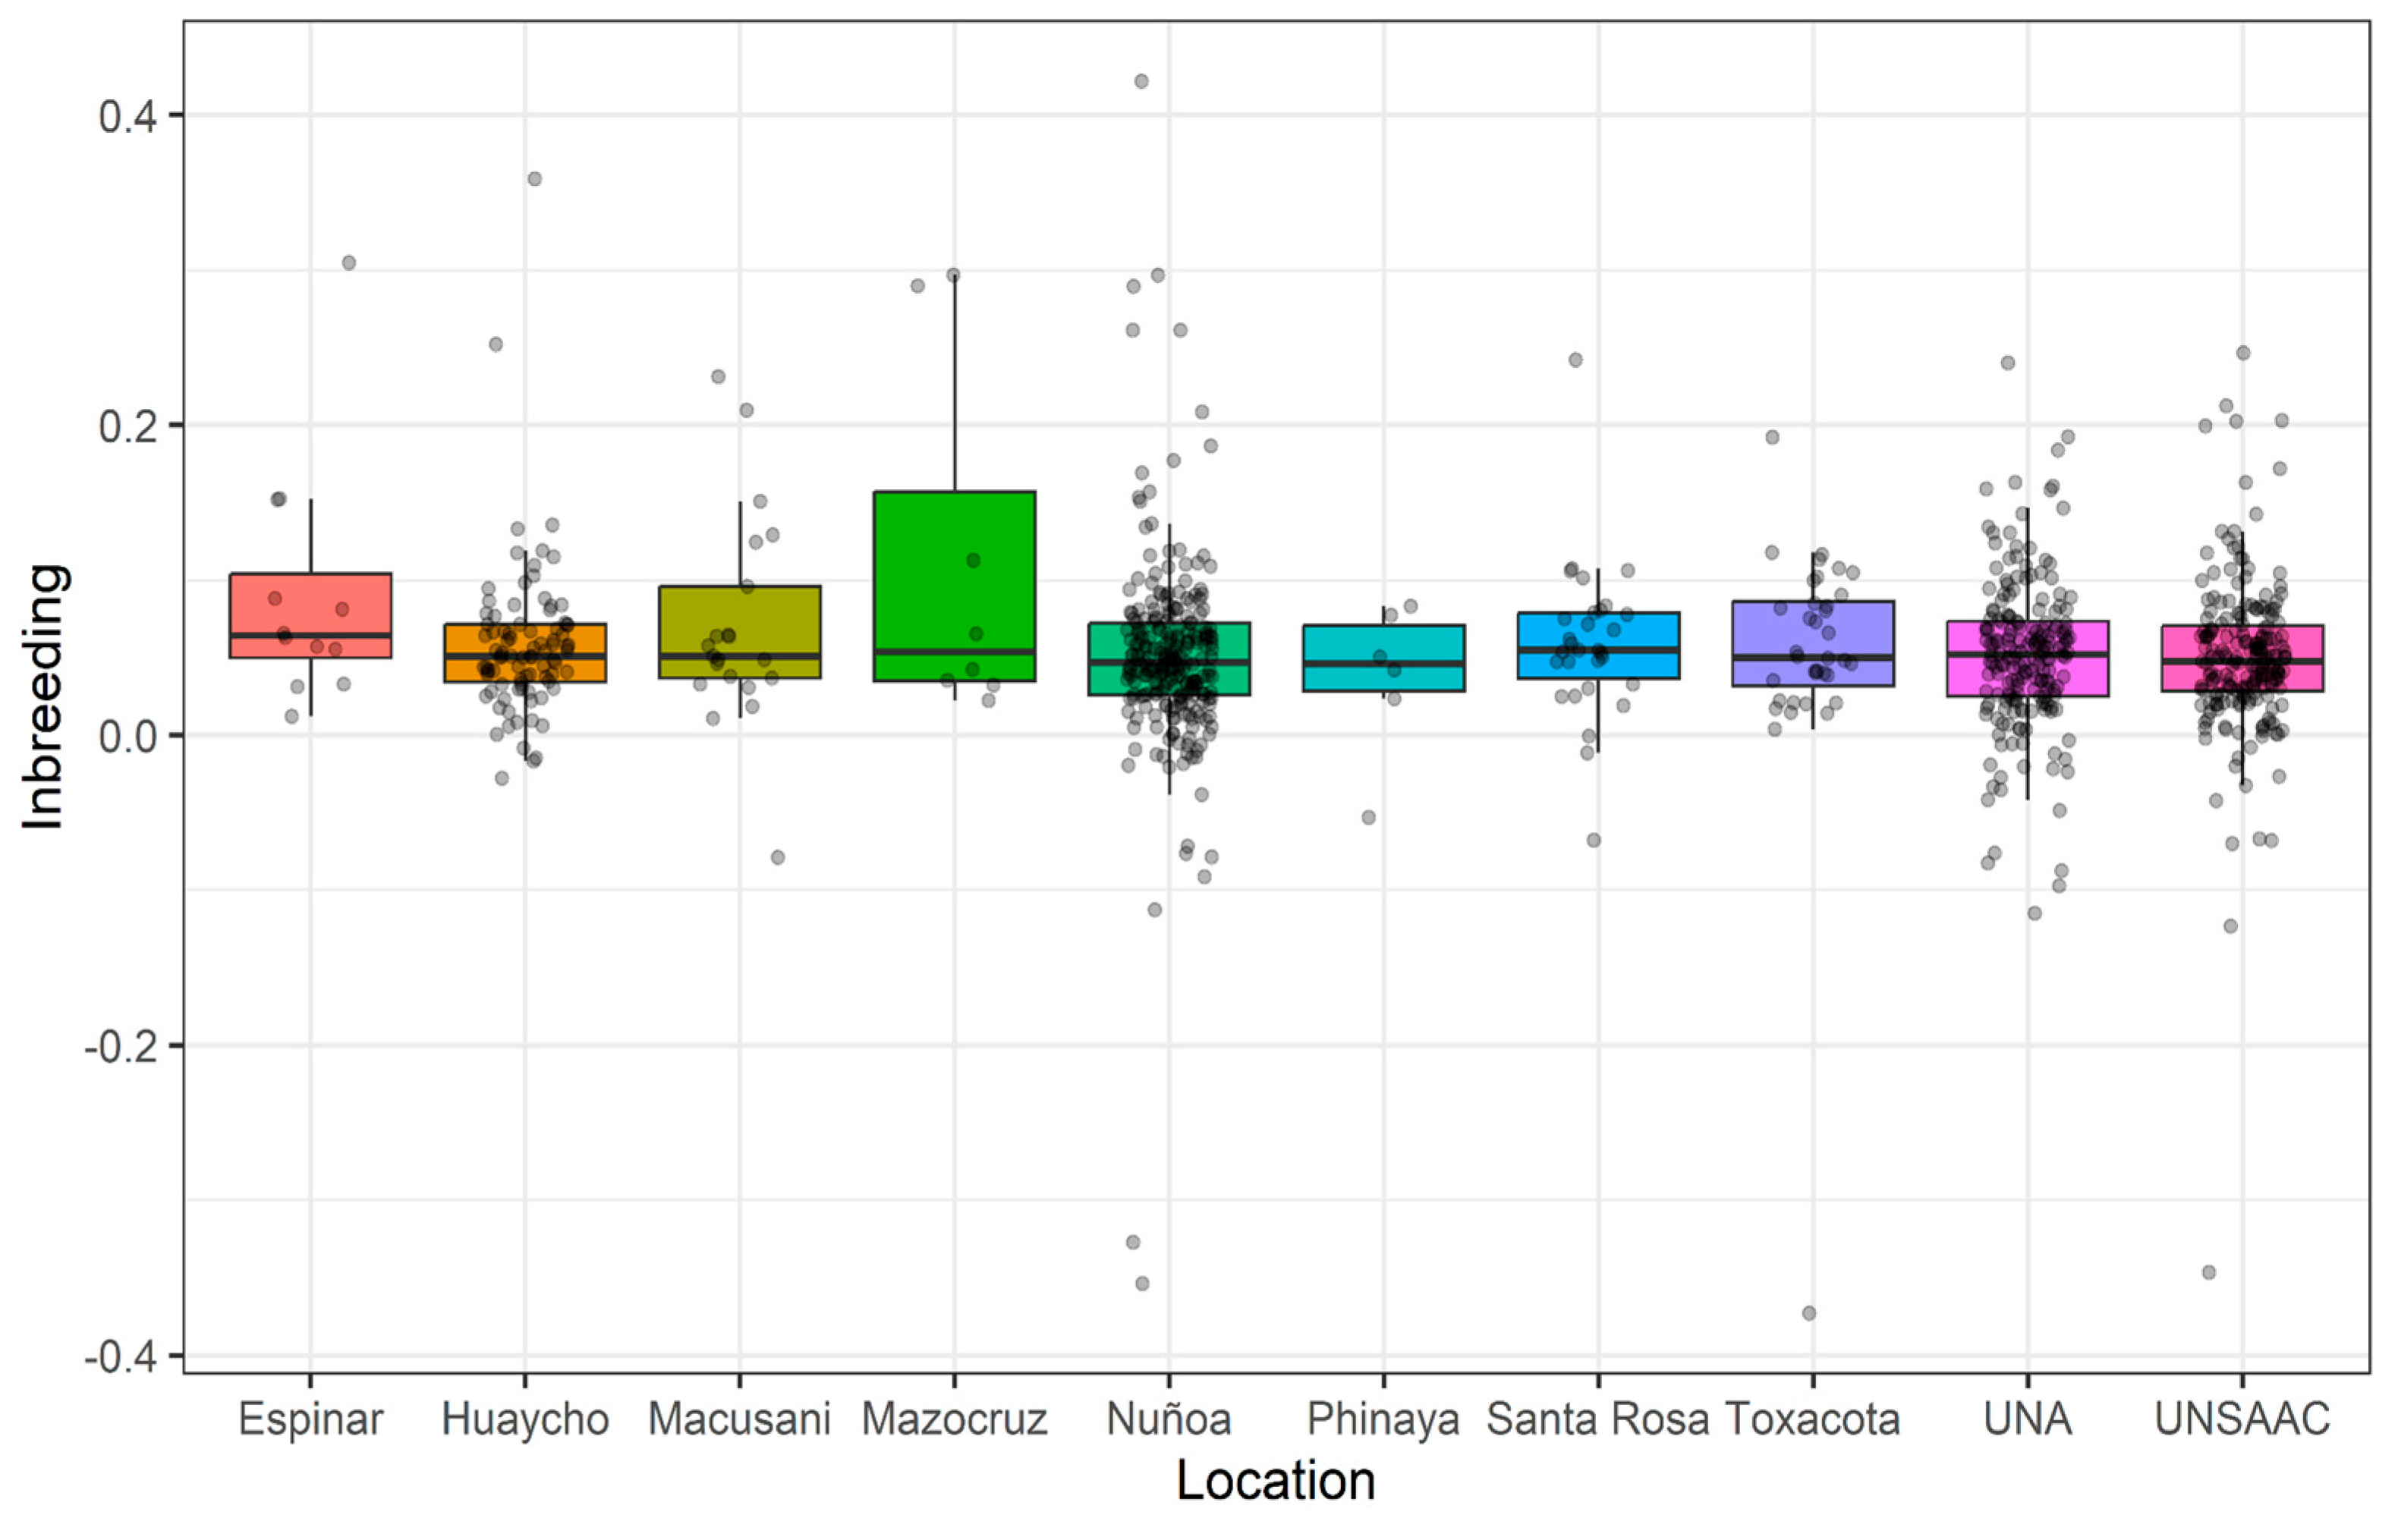
Figure 3.
Scatter plot of the top two PCs and LDs in the PCA and DAPC analysis.
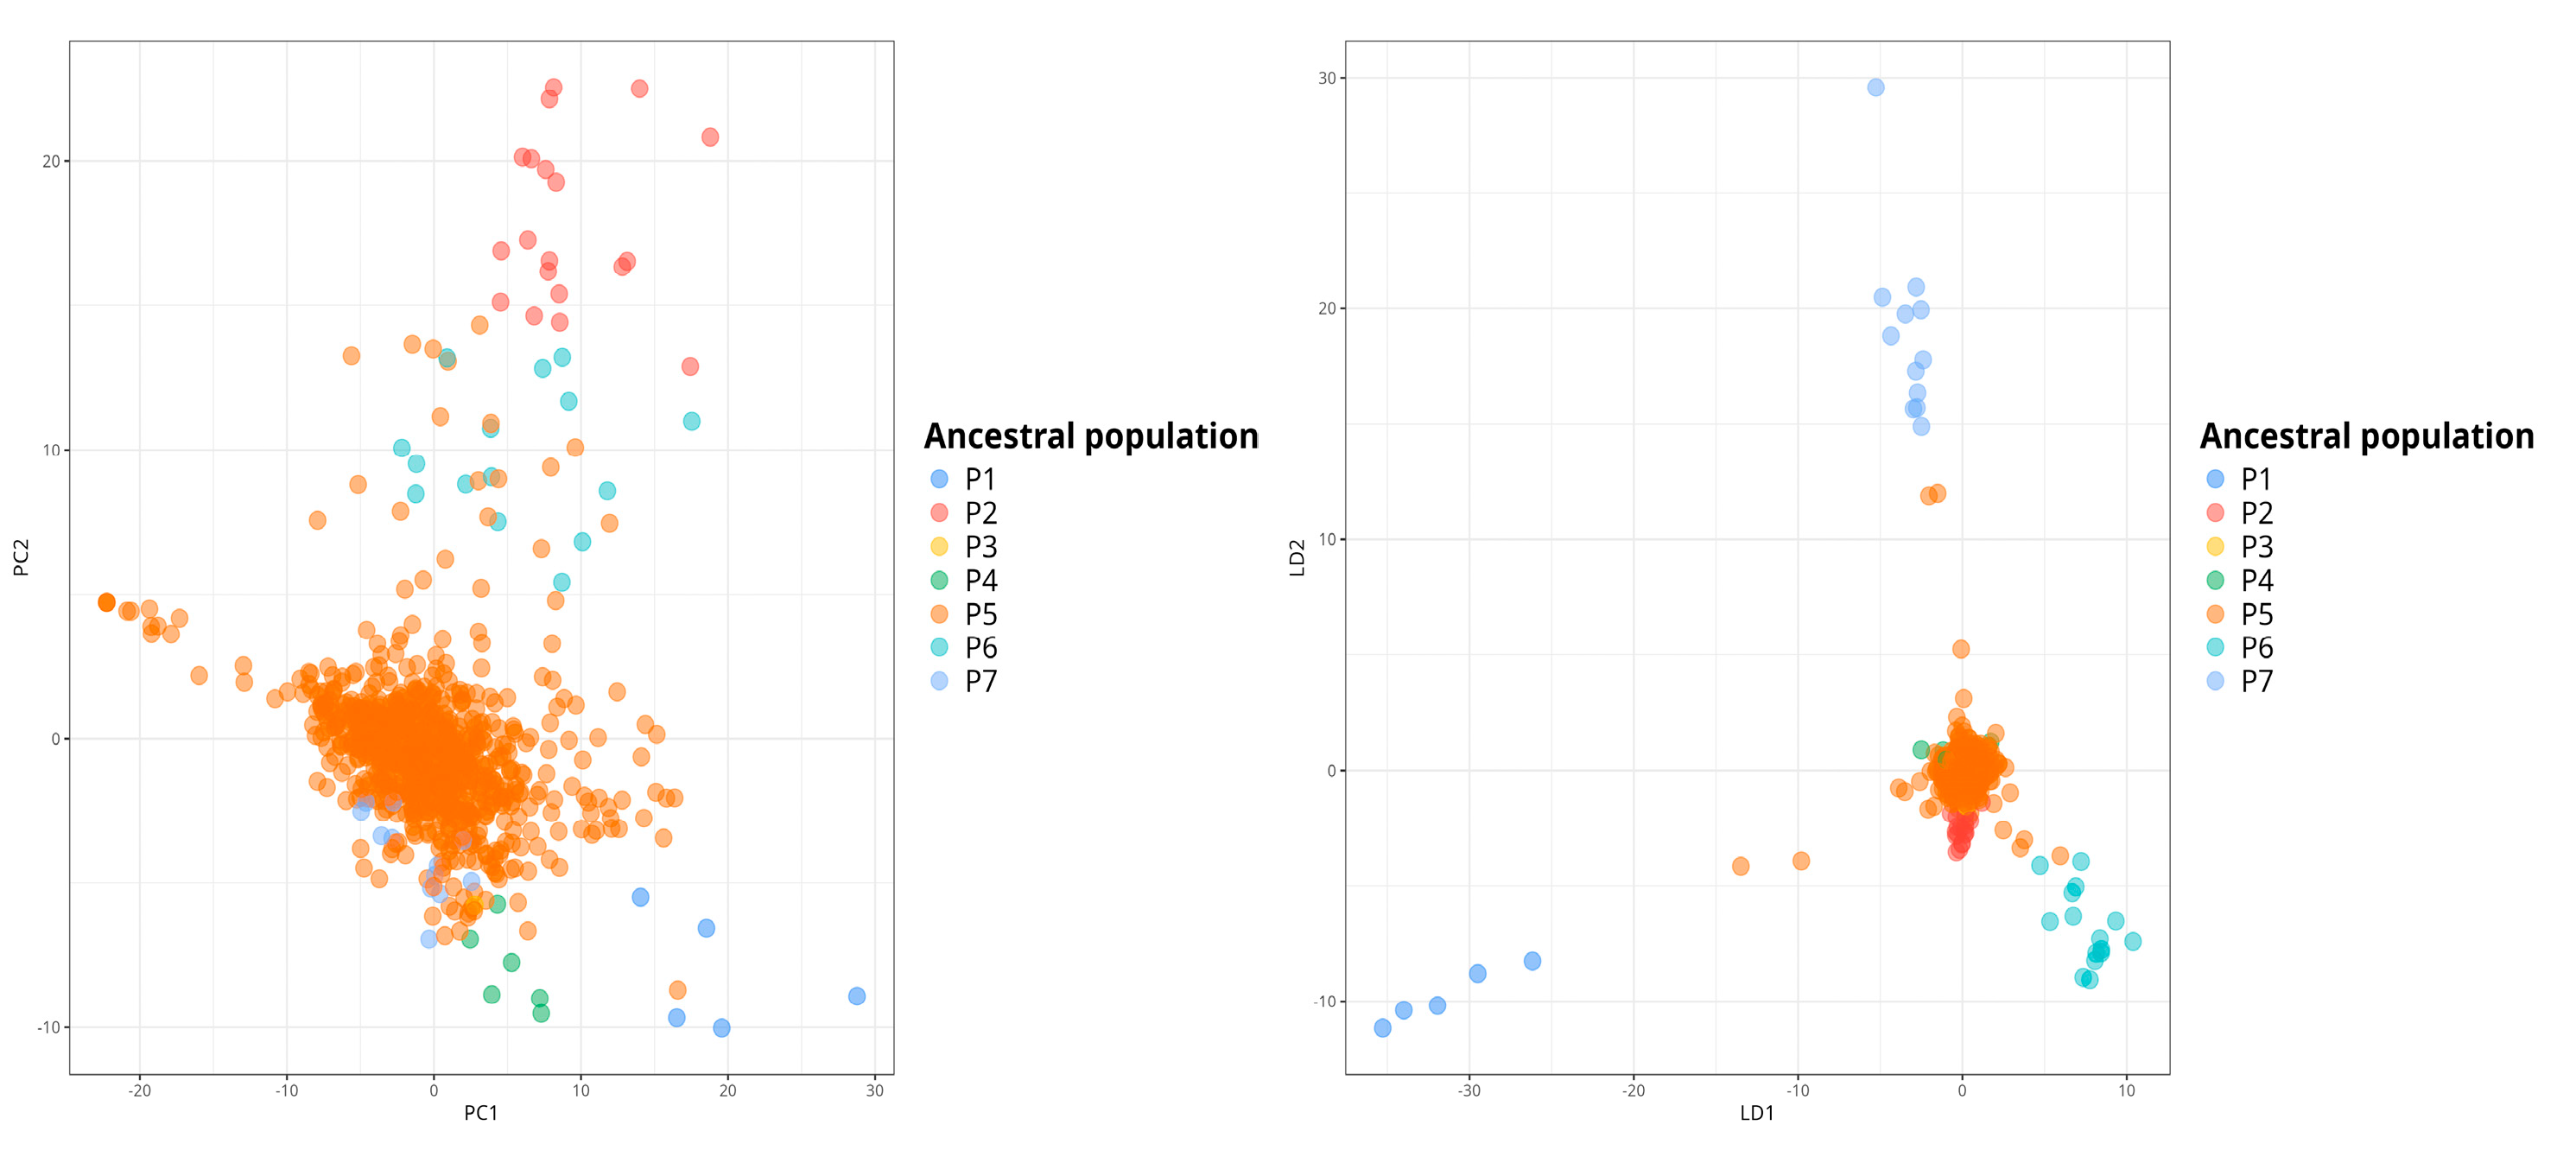
Figure 4.
Bar plot of genetic composition for each individual separated by putative population.
Disclaimer/Publisher’s Note: The statements, opinions and data contained in all publications are solely those of the individual author(s) and contributor(s) and not of MDPI and/or the editor(s). MDPI and/or the editor(s) disclaim responsibility for any injury to people or property resulting from any ideas, methods, instructions or products referred to in the content. |
© 2025 by the authors. Licensee MDPI, Basel, Switzerland. This article is an open access article distributed under the terms and conditions of the Creative Commons Attribution (CC BY) license (http://creativecommons.org/licenses/by/4.0/).
Copyright: This open access article is published under a Creative Commons CC BY 4.0 license, which permit the free download, distribution, and reuse, provided that the author and preprint are cited in any reuse.


