
Submitted:
30 October 2025
Posted:
30 October 2025
You are already at the latest version
Abstract
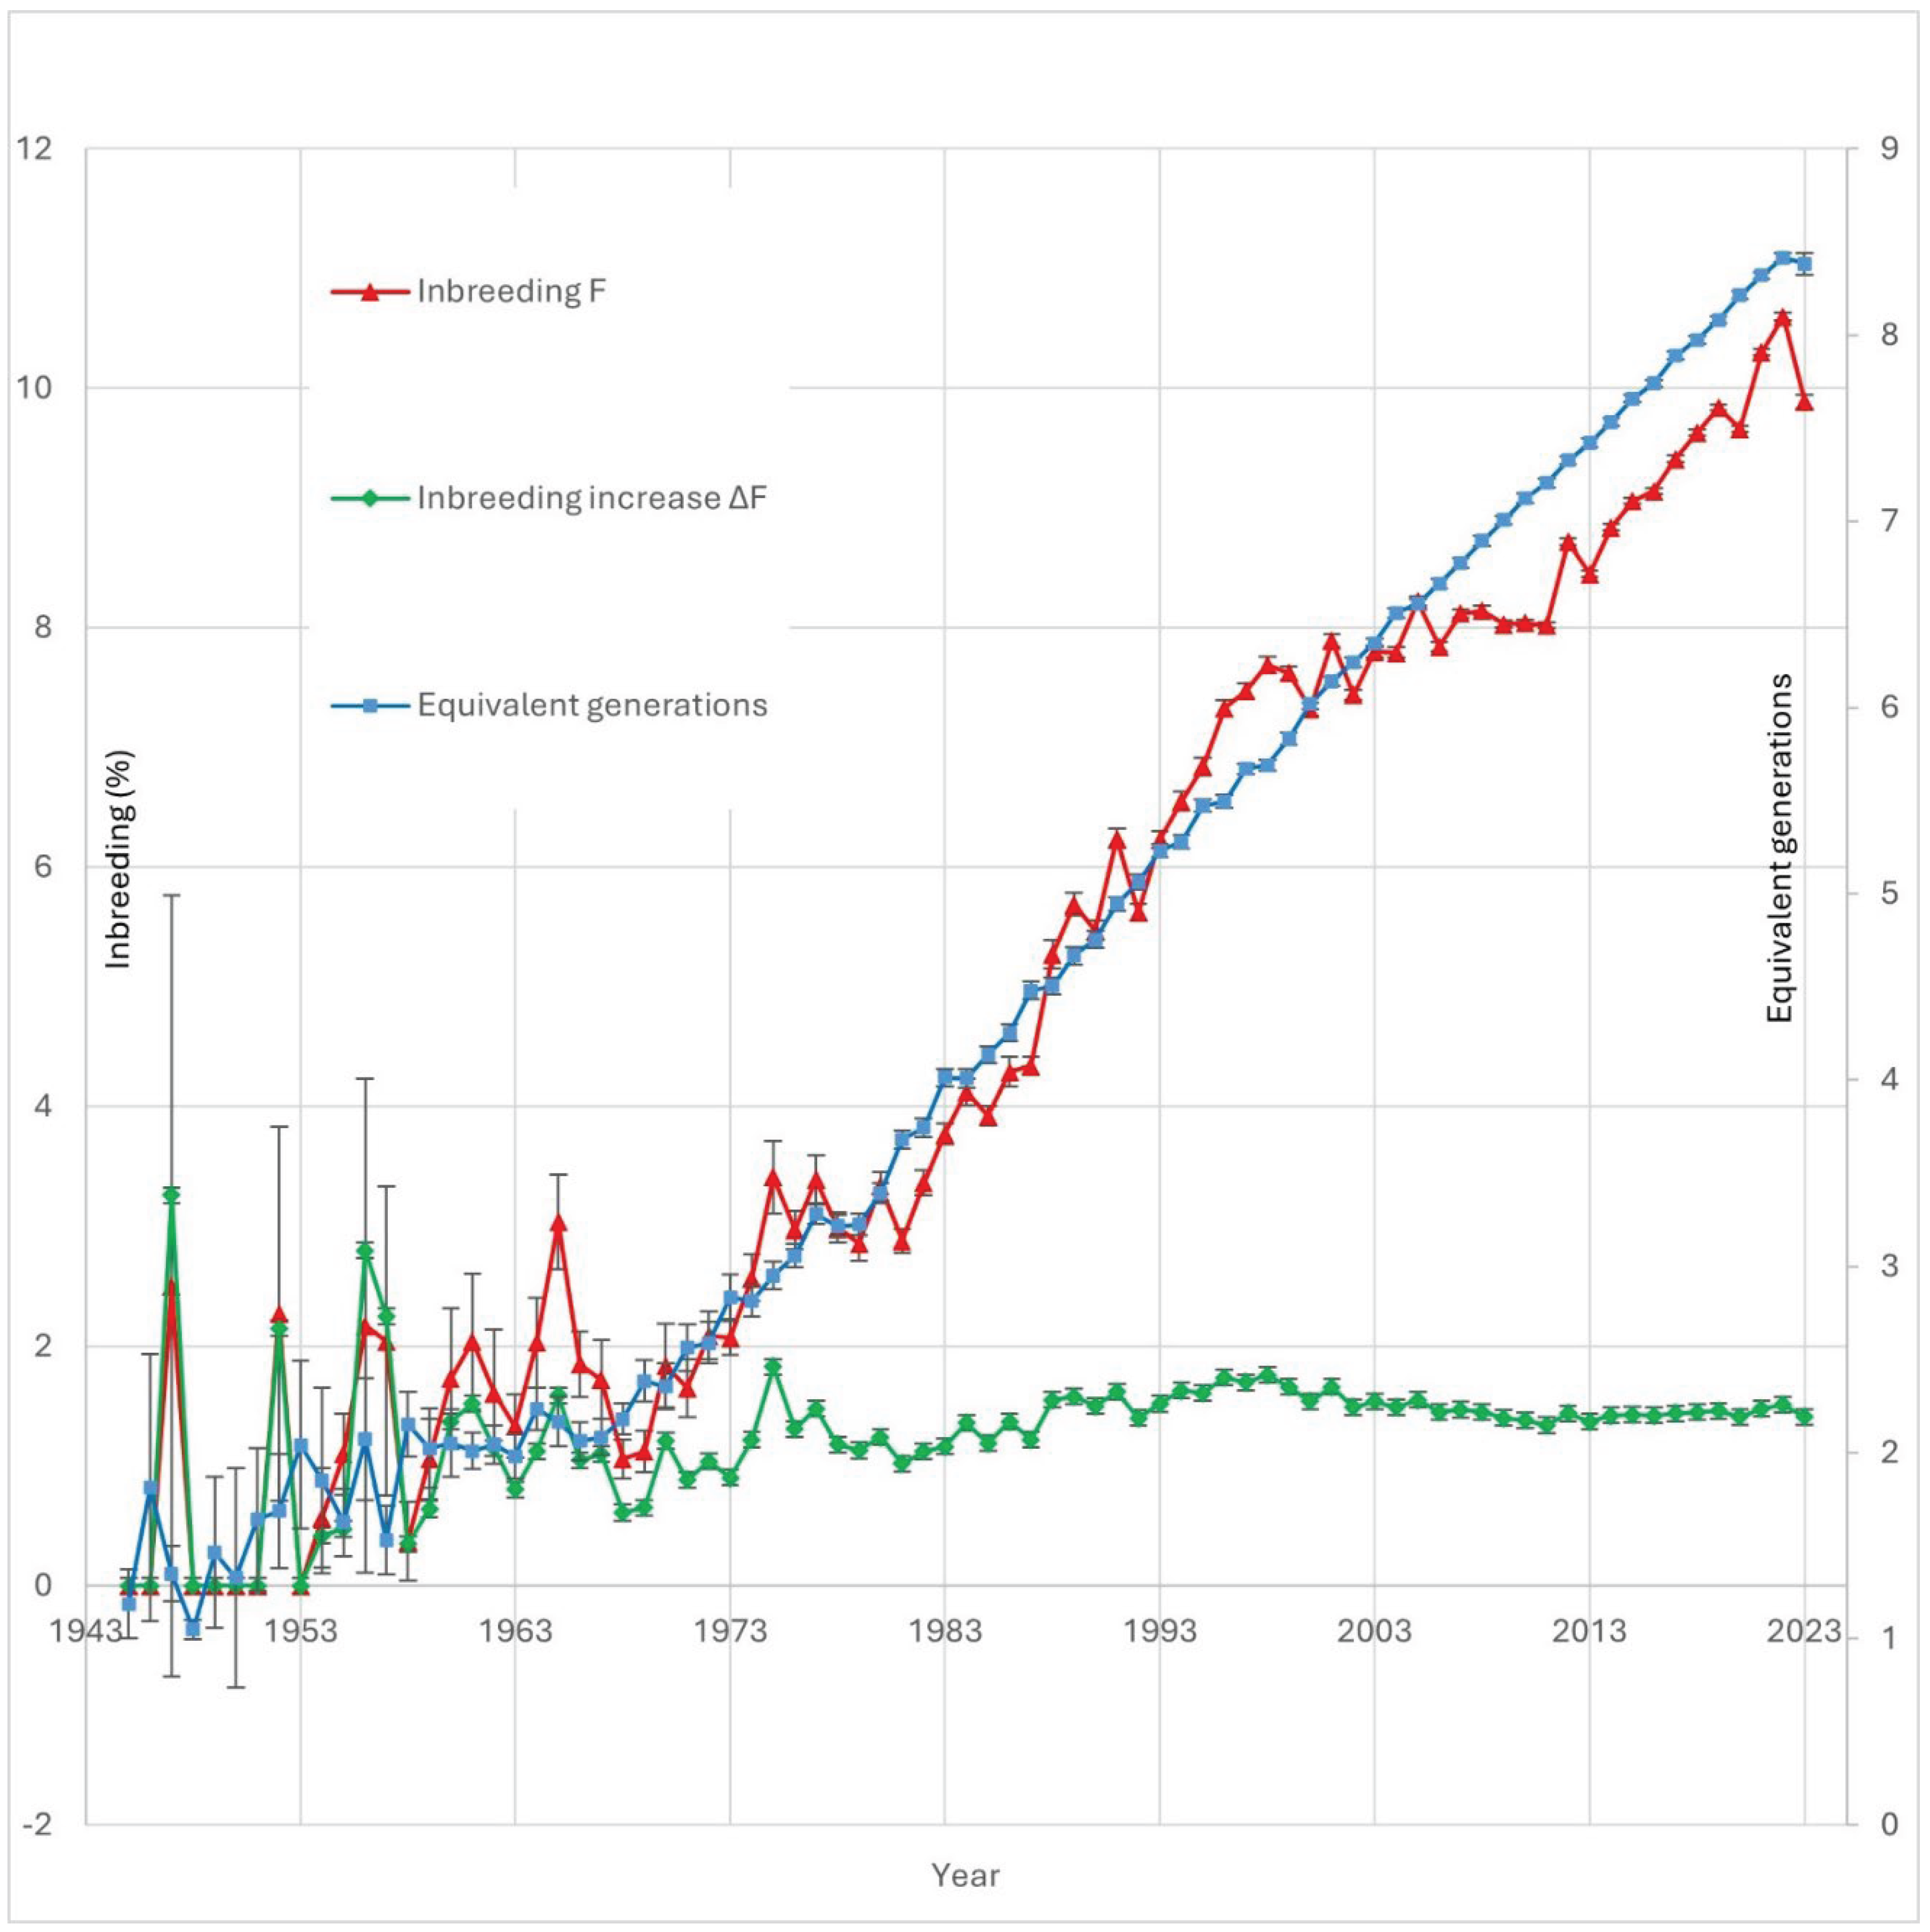
Objective: The aim of this study was to analyze inbreeding depression in the Peruvian paso horse (PPH), with a focus on its effects on morphometric, physiological, and functional traits. Methods: A total of 35 traits were evaluated in 148 animals, using pedigree records up to 2023 provided by the National Association of Breeders and Owners of the PPH. Multivariate animal models were employed to estimate heritability, and a Best Linear Unbiased Prediction (BLUP) model was applied to calculate estimated breeding values (EBVs), accounting for fixed effects including sex, stud farm, gait speed, and age. Results: The findings indicate that both the inbreeding coefficient (F) and its rate of change (ΔF) have significant effects on multiple traits. Pedigree analyses revealed that both parents recorded for over 94% of animals, indicating good pedigree depth. Certain historical periods were identified as having reduced ancestral diversity, highlighting the importance of monitoring genetic diversity to prevent population bottlenecks. The number of equivalent complete generations ranged from 2.355 to 8.417 between 1970 and 2023. Inbreeding exerted a negative impact on key traits such as withers height and scapulo-humeral angle. Furthermore, ΔF demonstrated a more immediate and pronounced effect on specific traits. Notably, differential impacts were observed between F and ΔF. Correlations between EBVs calculated with and without inclusion of inbreeding as a covariate were significantly below 0.99 for certain traits, suggesting that inbreeding introduces estimation bias, likely due to the expression of recessive deleterious alleles. Conclusions: Our results demonstrate that inbreeding affects not only linear body measurements but also anatomical angles, potentially reflecting the influence of pleiotropic genes affecting multiple morphological traits. Moreover, functional and physiological traits were found to be particularly sensitive to inbreeding effects, underscoring the need for strategic genetic management in this breed.
Keywords:
Introduction
Material and Methods
Animals and Pedigree
Traits
Measurements
Genetic and Statistical Analysis
Results
Descriptive Analysis of Morphometric, Physiological, and Functional Traits
Pedigree Structure and Population Genetic Parameters
Analysis of Inbreeding, Temporal Trends, and Genetic Impact
Linear Regression Analysis with Respect to Inbreeding
Effect of Inbreeding on EBVs
Discussion
Pedigree Structure
Analysis of Inbreeding, Temporal Trends, and Genetic Impact
Effect of Inbreeding on Traits
Effect of Inbreeding on EBVs
Conclusions
Funding
Supplementary Material
Authors’ Contributions
Acknowlegments
Data Availability
Ethics Approval
Declaration of Genertive AI and AI-Assisted Technologies in the Writing Process
Conflict of Interest
References
- Vilela JL, Quintana PG, Velarde ML, Vargas T, Gonzales RG, Dextre J. Preliminary analysis of the development of a breeding program of the Peruvian Paso horse in field conditions. Revista Mexicana De Ciencias Pecuarias 2025; 16(1): 194–207. [CrossRef]
- Larrea Izurieta COL, Carpio MG, Landi V, Hurtado EA, Andrade JIM, Loor LEV, Rivadeneira EL, Macas LFC. Evaluation of inbreeding and genetic variability of the Peruvian Paso Horse registered in Ecuador. Revista de Investigaciones Veterinarias Del Peru 2022; 33(5). [CrossRef]
- Leroy G. Inbreeding depression in livestock species: Review and meta-analysis. Animal Genetics 2014; 45(5): 618–628. [CrossRef]
- Keller LF, Waller DM. Inbreeding effects in wild populations. Trends in Ecology and Evolution 2002; 17(5): 230–241. [CrossRef]
- Bussiman FO, Perez BC, Ventura RV, Peixoto MGCD, Curi RA, Balieiro JC. Pedigree analysis and inbreeding effects over morphological traits in Campolina horse population. Animal 2018; 12(11): 2246–2255. [CrossRef]
- Gutiérrez JP, Cervantes I, Molina A, Valera M, Goyache F. Individual increase in inbreeding allows estimating effective sizes from pedigrees. Genetics Selection Evolution 2008; 40(4): 359–378. [CrossRef]
- Vostry L, Vostra-Vydrova H, Citek J, Gorjanc G, Curik I. Association of inbreeding and regional equine leucocyte antigen homozygosity with the prevalence of insect bite hypersensitivity in Old Kladruber horse. Animal Genetics 2021; 52(4): 422–430. [CrossRef]
- Montenegro V, Vilela JL, Wurzinger M. Assessment of generation interval and inbreeding in Peruvian Paso Horse. Proc XI World Congress on Genetics Applied to Livestock Production. Auckland, New Zealand, 2018. https://www.researchgate.net/publication/340875981_Assessment_of_Generation_Interval_and_Inbreeding_in_Peruvian_Paso_Horse.
- Cortes O, Cañon J, Andrino S, Fernanadez M, Carleos C. Inbreeding depression and runs of homozygosity islands in Asturiana de los Valles cattle breed after 30 years of selection. Journal of Animal Breeding and Genetics 2024; 141(4): 440–452. [CrossRef]
- Chaves LJ, Vencovsky R, Silva RSM, de Campos Telles MP, Zucchi MI, Coelho ASG. Estimating inbreeding depression in natural plant populations using quantitative and molecular data. Conservation Genetics 2011; 12(2): 569–576. [CrossRef]
- Caballero A, Villanueva B, Druet T. On the estimation of inbreeding depression using different measures of inbreeding from molecular markers. Evolutionary Applications 2021; 14(2): 416–428. [CrossRef]
- Gómez-Raya L, Rodríguez C, Barragán C, Silió L. Genomic inbreeding coefficients based on the distribution of the length of runs of homozygosity in a closed line of Iberian pigs. Genetics Selection Evolution 2015; 47(1), art. no. 81. [CrossRef]
- Lowman B. Estimated breeding values for beef cattle. In Practice 2004; 26(4): 206–211. [CrossRef]
- Becker PJJ, Hegelbach J, Keller LF, Postma E. Phenotype-associated inbreeding biases estimates of inbreeding depression in a wild bird population. Journal of Evolutionary Biology 2016; 29(1): 35–46. [CrossRef]
- Townsend SM, Jamieson IG. Molecular and pedigree measures of relatedness provide similar estimates of inbreeding depression in a bottlenecked population. Journal of Evolutionary Biology 2013; 26(4): 889–899. [CrossRef]
- Gutiérrez JP, Goyache F. A note on ENDOG: a computer program for analysing pedigree information. Journal of Animal Breeding and Genetics 2005; 122: 172–176.
- Goyache F, Gutiérrez JP, Fernández I, Alvarez I, Royo LJ. Using pedigree information to monitor genetic variability of endangered populations: The Xalda sheep breed of Asturias as an example. Journal of Animal Breeding and Genetics 2003; 120(2): 95–105. [CrossRef]
- Curik I, Ferenčaković M, Sölkner J. Inbreeding and runs of homozygosity: A possible solution to an old problem. Livestock Science 2014; 166: 26–34. [CrossRef]
- Sørensen AC, Sørensen MK, Berg P. Inbreeding in Danish dairy cattle breeds. Journal of Dairy Science 2005; 89(5): 1865–1872. [CrossRef]
- McParland S, Kearney JF, Rath M, Berry DP. Inbreeding trends and pedigree analysis of Irish dairy and beef cattle populations. Journal of Animal Science 2007; 85(2): 322–331. [CrossRef]
- Food and Agriculture Organization of the United Nations (FAO). Molecular genetic characterization of animal genetic resources. FAO Animal Production and Health Guidelines No. 9. 2011. http://www.fao.org/3/i2413e/i2413e.pdf.
- Boichard D, Maignel L, Verrier E. The value of using probabilities of gene origin to measure genetic variability in a population. Genetics Selection Evolution 1997; 29(1): 5–23. [CrossRef]
- Li Z, Ran Z, Zhang Y, Xiao X, An M. Genetic Diversity and Structure of Geodorum eulophioides, a Plant Species with Extremely Small Populations in China. Diversity 2023; 15(9). [CrossRef]
- Frigo MJ, Mangolin CA, Oliveira Jr RS, Machado MDFPS. Esterase polymorphism for analysis of genetic diversity and structure of wild poinsettia (Euphorbia heterophylla) populations. Weed Science 2009; 57(1): 54–60. [CrossRef]
- Ivanković A, Ramljak J, Dovč P, Kelava N, Konjačić M. Genetic structure of three Croatian horse breeds: Implications for their conservation strategy. Italian Journal of Animal Science 2009; 8(4): 677–689. [CrossRef]
- Nogueira MB, McManus C, de Faria DA, Santos SAO, Ianella P, Paiva SR. Fine-scale genetic diversity of the Brazilian Pantaneiro horse breed adapted to flooded regions. Tropical Animal Health and Production 2021; 53(6). [CrossRef]
- Valera M, Molina A, Gutiérrez JP, Gómez J, Goyache F. Pedigree analysis in the Andalusian horse: population structure, genetic variability and influence of the Carthusian strain. Livestock Production Science 2005; 95(1–2): 57–66. [CrossRef]
- Cervantes I, Molina A, Goyache F, Gutiérrez JP, Valera M. Population history and genetic variability in the Spanish Arab Horse assessed via pedigree analysis. Livestock Science 2008; 113(1): 24–33. [CrossRef]
- Gonçalves RW, Costa MD, Rezende ASC, Rocha Júnior VR, Leite JRA. Effect of inbreeding on morphometric traits in Mangalarga Marchador horses. Arquivo Brasileiro de Medicina Veterinaria e Zootecnia 2012; 64(2): 419–426. [CrossRef]
- Gómez MD, Valera M, Molina A, Gutiérrez JP, Goyache F. Assessment of inbreeding depression for body measurements in Spanish Purebred (Andalusian) horses. Livestock Science 2009; 122(2–3): 149–155. [CrossRef]
- Poyato-Bonilla J, Perdomo-González DI, Sánchez-Guerrero MJ, Varona L, Molina A, Casellas J, Valera M. Genetic inbreeding depression load for morphological traits and defects in the Pura Raza Española horse. Genetics Selection Evolution 2020; 52(1). [CrossRef]
- Leroy G, Mary-Huard T, Verrier E, Danvy S, Charvolin E, Danchin-Burge C. Methods to estimate effective population size using pedigree data: Examples in dog, sheep, cattle and horse. Genetics Selection Evolution 2013; 45(1): 1–12. [CrossRef]
- Bartolomé E, Perdomo-González DI, Sánchez-Guerrero MJ, Valera M. Genetic Parameters of Effort and Recovery in Sport Horses Assessed with Infrared Thermography. Animals 2021; 11: 832. [CrossRef]
- Oh SH. Evaluation of optimum genetic contribution theory to control inbreeding while maximizing genetic response. Asian-Australasian Journal of Animal Sciences 2012; 25(3): 299–303. [CrossRef]
- Jensen P, Overgaard J, Loeschcke V, Schou MF, Malte H, Kristensen TN. Inbreeding effects on standard metabolic rate investigated at cold, benign and hot temperatures in Drosophila melanogaster. Journal of Insect Physiology 2014; 62(1): 11–20. [CrossRef]
- Aguilar I, Fernandez EN, Blasco A, Ravagnolo O, Legarra A. Effects of ignoring inbreeding in model-based accuracy for BLUP and SSGBLUP. Journal of Animal Breeding and Genetics 2020; 137(4): 356–364. [CrossRef]
- Gorjanc G, Bijma P, Hickey JM. Reliability of pedigree-based and genomic evaluations in selected populations. Genetics Selection Evolution 2015; 47(1). [CrossRef]
- Santana ML, Oliveira PS, Eler JP, Gutierrez JP, Ferraz JB. Pedigree analysis and inbreeding depression on growth traits in Brazilian Marchigiana and Bonsmara breeds. Journal of Animal Science 2012; 90(1): 99–108. [CrossRef]

| Trait1) | Observations | Mean | Standard deviation | Minimum | Maximum | Coefficient of variation (%) | p-value Anderson-Darling | h2 | SE | |
| WH | 148 | 145.08 | 2.98 | 137.00 | 153.00 | 2.05 | 0.273 | 0.625 | 0.343 | |
| CRH | 148 | 146.05 | 3.59 | 132.00 | 155.00 | 2.46 | 0.089 | 0.715 | 0.328 | |
| SH | 148 | 75.04 | 6.57 | 67.00 | 148.50 | 8.76 | 0.175 | 0.704 | 0.362 | |
| MDH | 148 | 137.59 | 3.62 | 128.90 | 149.00 | 2.63 | 0.348 | 0.644 | 0.316 | |
| CHW | 148 | 34.02 | 2.31 | 29.00 | 39.00 | 6.78 | 0.252 | 0.784 | 0.339 | |
| TG | 148 | 176.93 | 7.27 | 155.00 | 198.00 | 4.11 | 0.378 | 0.693 | 0.346 | |
| BL | 148 | 153.58 | 5.65 | 140.00 | 168.00 | 3.68 | 0.800 | 0.643 | 0.367 | |
| MC | 148 | 17.53 | 0.85 | 15.00 | 20.00 | 4.85 | <0.001 | 0.601 | 0.348 | |
| MT | 148 | 18.68 | 0.86 | 17.00 | 21.00 | 4.63 | <0.001 | 0.426 | 0.339 | |
| BIA | 148 | 63.15 | 4.30 | 49.33 | 77.00 | 6.82 | 0.087 | 0.776 | 0.232 | |
| HA | 148 | 139.12 | 3.92 | 129.67 | 154.67 | 2.82 | 0.097 | 0.723 | 0.290 | |
| SHA | 148 | 91.66 | 3.06 | 81.33 | 103.33 | 3.34 | <0.001 | 0.776 | 0.352 | |
| FTA | 148 | 124.25 | 5.07 | 116.67 | 139.33 | 4.08 | <0.001 | 0.734 | 0.313 | |
| BA | 148 | 123.06 | 5.55 | 110.67 | 158.83 | 4.51 | <0.001 | 0.599 | 0.312 | |
| CFA | 148 | 91.66 | 2.86 | 85.00 | 104.33 | 3.12 | <0.001 | 0.734 | 0.334 | |
| FPL | 148 | 11.27 | 1.37 | 7.96 | 23.00 | 12.19 | <0.001 | 0.663 | 0.352 | |
| HPL | 148 | 11.26 | 1.24 | 7.81 | 21.00 | 11.04 | <0.001 | 0.604 | 0.400 | |
| NL | 148 | 60.57 | 3.83 | 48.00 | 69.00 | 6.32 | 0.517 | 0.738 | 0.251 | |
| UL | 148 | 34.83 | 2.48 | 29.00 | 53.00 | 7.11 | 0.021 | 0.630 | 0.254 | |
| FL | 148 | 35.91 | 2.51 | 29.00 | 44.00 | 7.00 | 0.229 | 0.756 | 0.287 | |
| FPP | 148 | 16.70 | 0.90 | 14.00 | 21.00 | 5.40 | <0.001 | 0.569 | 0.308 | |
| HPP | 148 | 17.58 | 0.82 | 15.50 | 21.00 | 4.67 | <0.001 | 0.501 | 0.350 | |
| CW | 148 | 34.96 | 4.41 | 25.00 | 56.00 | 12.62 | 0.050 | 0.762 | 0.323 | |
| CL | 148 | 49.18 | 3.78 | 32.00 | 58.00 | 7.68 | 0.062 | 0.756 | 0.286 | |
| HW | 148 | 22.40 | 1.26 | 20.00 | 31.00 | 5.61 | <0.001 | 0.588 | 0.399 | |
| HL | 148 | 61.47 | 2.28 | 56.00 | 68.00 | 3.70 | 0.187 | 0.765 | 0.347 | |
| MCL | 148 | 26.57 | 1.75 | 22.00 | 30.00 | 6.58 | 0.017 | 0.701 | 0.263 | |
| MTL | 148 | 30.54 | 1.72 | 26.00 | 35.00 | 5.64 | 0.061 | 0.736 | 0.304 | |
| EXT | 134 | 42.23 | 4.60 | 22.07 | 55.33 | 10.89 | 0.361 | 0.250 | 0.217 | |
| OVR | 136 | 27.95 | 20.99 | -14.04 | 72.44 | 75.09 | 0.780 | 0.427 | 0.203 | |
| TER | 137 | 25.30 | 5.97 | 8.93 | 43.47 | 23.60 | 0.858 | 0.471 | 0.198 | |
| ACS | 134 | 71.55 | 6.68 | 52.03 | 87.37 | 9.33 | 0.938 | 0.415 | 0.226 | |
| GTD | 88 | 1.60 | 2.02 | -3.40 | 9.40 | 125.98 | 0.425 | 0.684 | 0.466 | |
| GTDX | 88 | 1.05 | 2.99 | -6.60 | 13.10 | 286.35 | 0.066 | 0.770 | 0.518 | |
| RMS | 135 | 2.63 | 0.93 | 0.85 | 5.36 | 35.33 | 0.888 | 0.582 | 0.368 | |
| 1) WH: Withers height; CRH: Croup height; SH: Sub-pectoral height; MDH: Mid-dorsal height; CHW: Chest width; TG: Thoracic girth; BL: Body length; MC: Metacarpal circumference; MT: Metatarsal circumference; BIA: Back inclination angle; HA: Hock angle; SHA: Scapulohumeral angle; FTA: Femorotibial angle; BA: Brachial angle; CFA: Coxofemoral angle; FPL: Forelimb pastern length; HPL: Hindlimb pastern length; NL: Neck length; UL: Upper arm length; FL: Femur length; FPP: Forelimb pastern perimeter; HPP: Hindlimb pastern perimeter; CW: Croup width; CL: Croup length; HW: Head width; HL: Head length ; MCL: Metacarpal length; MTL: Metatarsal length ; EXT: Extension; OVR: Overreach; TER: Term; ACS: Acuteness; GTD: Gluteal temperature difference; GTDX: Maximum gluteal temperature difference; RMS: Vertical acceleration. | ||||||||||
| Parameter | Total population | Phenotyped population | |
| Animals | 40993 | 151 | |
| Males | 16061 | 34 | |
| Females | 24932 | 117 | |
| Animals with known parents | |||
| With known father | 95.25 | 100.00 | |
| With known mother | 94.90 | 100.00 | |
| Inbreeding | |||
| Mean F (%) | 6.74 | 9.02 | |
| Mean ΔF (%) | 1.38 | 1.41 | |
| Average relatedness coefficient (%) | 8.37 | 11.98 | |
| Average maximum generations | 11.58 | 16.00 | |
| Average complete generations | 3.62 | 4.85 | |
| Average equivalent generations | 5.75 | 7.70 | |
| Effective population size per equivalent generation | 37.46 | 40.66 | |
| Founders | 1758 | 310 | |
| Equivalent founders | 1661 | 291 | |
| Ancestors contributing to the population | 1592 | 140 | |
| Effective number of founders (fe) | 27 | 17 | |
| Effective number of ancestors (fa) | 18 | 11 | |
| Wright’s fixation indices | |||
| FIS | 0.0250 | 0.0265 | |
| FST | 0.0016 | 0.000082 | |
| FIT | 0.0266 | 0.0266 | |
| Generation interval ± ES | 8.90 ± 0.03 | 9.04 ± 0.30 | |
| Age at first reproductionz(Ap) | 9.30 | 5.28 | |
| Regression coefficient (β) of Ap on F ± SE | -5.20 ± 0.62 | -38.48 ± 12.57 | |
| Regression coefficient (β) of Ap on ΔF ± SE | 6.54 ± 2.08 | -189.73 ± 103.56 |
| F | ΔF | |||||||||
| Trait 1) | b unstandardized |
b standardized |
SE | p-value | b unstandardized |
b standardized |
SE | p-value | ||
| WH | -0.193 | -0.240 | 0.081 | 0.018 | -1.052 | -0.210 | 0.493 | 0.035 | ||
| CRH | -0.132 | -0.134 | 0.094 | 0.177 | -0.613 | -0.100 | 0.573 | 0.287 | ||
| SH | -0.111 | -0.164 | 0.064 | 0.086 | -0.546 | -0.129 | 0.394 | 0.168 | ||
| MDH | -0.189 | -0.193 | 0.100 | 0.062 | -0.945 | -0.155 | 0.614 | 0.126 | ||
| CHW | -0.022 | -0.035 | 0.058 | 0.706 | -0.151 | -0.039 | 0.354 | 0.670 | ||
| TG | -0.160 | -0.081 | 0.163 | 0.327 | -0.852 | -0.069 | 0.994 | 0.393 | ||
| BL | -0.096 | 0.150 | 0.063 | 0.522 | -0.392 | -0.041 | 0.916 | 0.669 | ||
| MC | -0.003 | -0.011 | 0.021 | 0.906 | -0.006 | -0.004 | 0.130 | 0.966 | ||
| MT | -0.022 | -0.096 | 0.024 | 0.353 | -0.132 | -0.090 | 0.146 | 0.370 | ||
| BIA | 0.106 | 0.092 | 0.107 | 0.322 | 0.685 | 0.095 | 0.651 | 0.295 | ||
| HA | 0.074 | 0.070 | 0.096 | 0.443 | 0.366 | 0.560 | 0.587 | 0.534 | ||
| SHA | -0.236 | -0.298 | 0.074 | 0.002 | -1.459 | -0.296 | 0.452 | 0.002 | ||
| FTA | 0.048 | 0.035 | 0.122 | 0.698 | 0.216 | 0.025 | 0.745 | 0.773 | ||
| BA | -0.308 | -0.207 | 0.149 | 0.041 | -2.017 | -0.218 | 0.906 | 0.028 | ||
| CFA | -0.047 | -0.064 | 0.075 | 0.537 | -0.246 | -0.054 | 0.458 | 0.593 | ||
| FPL | 0.042 | 0.112 | 0.035 | 0.228 | 0.278 | 0.119 | 0.211 | 0.192 | ||
| HPL | 0.002 | 0.006 | 0.031 | 0.947 | -0.012 | -0.005 | 0.188 | 0.951 | ||
| NL | 0.172 | 0.165 | 0.090 | 0.060 | 0.948 | 0.146 | 0.552 | 0.089 | ||
| UL | -0.029 | -0.043 | 0.058 | 0.623 | -0.111 | -0.027 | 0.355 | 0.756 | ||
| FL | -0.016 | -0.024 | 0.054 | 0.766 | -0.172 | -0.041 | 0.329 | 0.603 | ||
| FPP | 0.003 | 0.013 | 0.021 | 0.885 | 0.035 | 0.023 | 0.131 | 0.791 | ||
| HPP | 0.012 | 0.055 | 0.021 | 0.563 | 0.130 | 0.094 | 0.129 | 0.315 | ||
| CW | -0.105 | -0.087 | 0.106 | 0.323 | -0.495 | -0.066 | 0.647 | 0.446 | ||
| CL | 0.075 | 0.074 | 0.076 | 0.321 | 0.613 | 0.096 | 0.459 | 0.185 | ||
| HW | -0.061 | -0.178 | 0.033 | 0.069 | -0.138 | -0.150 | 0.203 | 0.120 | ||
| HL | -0.003 | -0.005 | 0.056 | 0.955 | 0.061 | 0.016 | 0.339 | 0.858 | ||
| MCL | -0.091 | -0.193 | 0.036 | 0.013 | -0.441 | -0.150 | 0.224 | 0.051 | ||
| MTL | -0.034 | -0.075 | 0.041 | 0.400 | -0.103 | -0.036 | 0.248 | 0.680 | ||
| EXT | 0.200 | 0.087 | 1.067 | 0.502 | 1.201 | 0.154 | 0.805 | 0.139 | ||
| OVR | -0.190 | -0.037 | 0.422 | 0.653 | -1.575 | -0.049 | 2.561 | 0.540 | ||
| TER | 0.116 | 0.073 | 0.162 | 0.475 | 0.679 | 0.069 | 0.986 | 0.492 | ||
| ACS | 0.369 | 0.203 | 0.183 | 0.047 | 2.090 | 0.186 | 1.118 | 0.065 | ||
| GTD | -0.138 | -0.240 | 0.063 | 0.034 | -0.825 | -0.241 | 0.368 | 0.030 | ||
| GTDX | -0.107 | -0.145 | 0.100 | 0.293 | -0.582 | -0.133 | 0.583 | 0.324 | ||
| RMS | 0.008 | 0.035 | 0.022 | 0.695 | 0.040 | 0.027 | 0.131 | 0.758 | ||
| 1) WH: Withers height; CRH: Croup height; SH: Sub-pectoral height; MDH: Mid-dorsal height; CHW: Chest width; TG: Thoracic girth; BL: Body length; MC: Metacarpal circumference; MT: Metatarsal circumference; BIA: Back inclination angle; HA: Hock angle; SHA: Scapulohumeral angle; FTA: Femorotibial angle; BA: Brachial angle; CFA: Coxofemoral angle; FPL: Forelimb pastern length; HPL: Hindlimb pastern length; NL: Neck length; UL: Upper arm length; FL: Femur length; FPP: Forelimb pastern perimeter; HPP: Hindlimb pastern perimeter; CW: Croup width; CL: Croup length; HW: Head width; HL: Head length ; MCL: Metacarpal length; MTL: Metatarsal length ; EXT: Extension; OVR: Overreach; TER: Term; ACS: Acuteness; GTD: Gluteal temperature difference; GTDX: Maximum gluteal temperature difference; RMS: Vertical acceleration | ||||||||||
| Top 20 | Bottom 20 | |||||||
| Trait2) | F | ΔF | F | ΔF | ||||
| rp | rs | rp | rs | rp | rs | rp | rs | |
| WH | 0.808 | 0.710 | 0.830 | 0.723 | 0.805 | 0.826 | 0.827 | 0.838 |
| CRH | 0.976 | 0.920 | 0.981 | 0.923 | 0.962 | 0.898 | 0.976 | 0.946 |
| SH | 0.939 | 0.832 | 0.957 | 0.901 | 0.968 | 0.904 | 0.981 | 0.935 |
| MDH | 0.974 | 0.955 | 0.979 | 0.958 | 0.917 | 0.759 | 0.946 | 0.854 |
| CHW | 0.994 | 0.989 | 0.990 | 0.980 | 0.998 | 0.985 | 0.997 | 0.980 |
| TG | 0.989 | 0.974 | 0.986 | 0.970 | 0.949 | 0.967 | 0.955 | 0.964 |
| BL | 0.984 | 0.934 | 0.991 | 0.959 | 0.961 | 0.946 | 0.983 | 0.968 |
| MC | 1.000 | 0.998 | 1.000 | 1.000 | 1.000 | 0.998 | 1.000 | 1.000 |
| MT | 0.981 | 0.962 | 0.984 | 0.962 | 0.935 | 0.913 | 0.937 | 0.916 |
| BIA | 0.964 | 0.812 | 0.951 | 0.704 | 0.994 | 0.964 | 0.993 | 0.973 |
| HA | 0.999 | 0.988 | 1.000 | 0.994 | 0.994 | 0.971 | 0.998 | 0.991 |
| SHA | 0.902 | 0.785 | 0.895 | 0.761 | 0.762 | 0.654 | 0.749 | 0.606 |
| FTA | 0.928 | 0.899 | 0.930 | 0.899 | 0.826 | 0.814 | 0.821 | 0.794 |
| BA | 0.991 | 0.854 | 0.990 | 0.851 | 0.880 | 0.827 | 0.861 | 0.821 |
| CFA | 0.991 | 0.961 | 0.992 | 0.968 | 0.940 | 0.907 | 0.947 | 0.920 |
| FPL | 0.998 | 0.795 | 0.997 | 0.788 | 0.919 | 0.836 | 0.893 | 0.818 |
| HPL | 1.000 | 0.985 | 1.000 | 0.977 | 0.998 | 0.995 | 0.995 | 0.989 |
| NL | 0.948 | 0.940 | 0.960 | 0.931 | 0.943 | 0.868 | 0.947 | 0.886 |
| UL | 0.997 | 0.910 | 0.998 | 0.937 | 0.993 | 0.929 | 0.996 | 0.967 |
| FL | 0.997 | 0.970 | 0.996 | 0.959 | 0.980 | 0.961 | 0.959 | 0.917 |
| FPP | 0.999 | 0.997 | 1.000 | 1.000 | 0.993 | 0.979 | 0.999 | 0.992 |
| HPP | 1.000 | 1.000 | 0.994 | 0.980 | 0.999 | 0.994 | 0.981 | 0.977 |
| CW | 0.998 | 0.931 | 0.999 | 0.959 | 0.982 | 0.911 | 0.991 | 0.917 |
| CL | 0.986 | 0.937 | 0.978 | 0.926 | 0.973 | 0.928 | 0.949 | 0.923 |
| HW | 0.992 | 0.898 | 0.994 | 0.911 | 0.927 | 0.798 | 0.937 | 0.853 |
| HL | 0.999 | 0.995 | 1.000 | 0.998 | 0.999 | 0.997 | 1.000 | 0.998 |
| MCL | 0.822 | 0.795 | 0.868 | 0.841 | 0.888 | 0.758 | 0.934 | 0.827 |
| MTL | 0.987 | 1.000 | 0.995 | 0.979 | 0.982 | 0.970 | 0.994 | 0.982 |
| EXT | 0.893 | 0.820 | 0.889 | 0.818 | 0.960 | 0.797 | 0.961 | 0.797 |
| OVR | 0.993 | 0.959 | 0.991 | 0.932 | 0.948 | 0.928 | 0.932 | 0.913 |
| TER | 0.994 | 0.979 | 0.993 | 0.979 | 0.989 | 0.944 | 0.987 | 0.935 |
| ACS | 0.892 | 0.815 | 0.904 | 0.823 | 0.847 | 0.612 | 0.850 | 0.623 |
| GTD | 0.948 | 0.920 | 0.946 | 0.934 | 0.862 | 0.767 | 0.869 | 0.755 |
| GTDX | 0.978 | 0.956 | 0.982 | 0.965 | 0.978 | 0.962 | 0.980 | 0.962 |
| RMS | 0.994 | 0.980 | 0.997 | 0.986 | 0.985 | 0.977 | 0.992 | 0.991 |
| 1) rp: Pearson correlation; rs: Spearman correlation. F: Inbreeding coefficient; ΔF: Individual rate of inbreeding. All correlations were statistically significant at p < 0.001, except for traits ACS (0.612 and 0.623) and SHA (0.654 and 0.606), which had p-values < 0.01. Values in blue are statistically different from 0.99, as determined by Fisher’s Z-test. | ||||||||
| 2) WH: Withers height; CRH: Croup height; SH: Sub-pectoral height; MDH: Mid-dorsal height; CHW: Chest width; TG: Thoracic girth; BL: Body length; MC: Metacarpal circumference; MT: Metatarsal circumference; BIA: Back inclination angle; HA: Hock angle; SHA: Scapulohumeral angle; FTA: Femorotibial angle; BA: Brachial angle; CFA: Coxofemoral angle; FPL: Forelimb pastern length; HPL: Hindlimb pastern length; NL: Neck length; UL: Upper arm length; FL: Femur length; FPP: Forelimb pastern perimeter; HPP: Hindlimb pastern perimeter; CW: Croup width; CL: Croup length; HW: Head width; HL: Head length ; MCL: Metacarpal length; MTL: Metatarsal length ; EXT: Extension; OVR: Overreach; TER: Term; ACS: Acuteness; GTD: Gluteal temperature difference; GTDX: Maximum gluteal temperature difference; RMS: Vertical acceleration | ||||||||
Disclaimer/Publisher’s Note: The statements, opinions and data contained in all publications are solely those of the individual author(s) and contributor(s) and not of MDPI and/or the editor(s). MDPI and/or the editor(s) disclaim responsibility for any injury to people or property resulting from any ideas, methods, instructions or products referred to in the content. |
© 2025 by the authors. Licensee MDPI, Basel, Switzerland. This article is an open access article distributed under the terms and conditions of the Creative Commons Attribution (CC BY) license (http://creativecommons.org/licenses/by/4.0/).


