
Submitted:
19 September 2025
Posted:
19 September 2025
You are already at the latest version
Abstract
This study employs coarse-grained molecular dynamics simulations to investigate how the overlap distance between graphene nanosheets influences the mechanical properties of “brick-mortar” structured graphene-polyethylene nanocomposites. Simulations are conducted in a fixed box size while varying the overlap distance from 2.4 to 24 nm. The stress-strain response exhibits three distinct stages: elastic increase, plastic plateau, and slow decrease. The yield strength increases nearly linearly from 115.3±3.8 to 347.9±33.0 MPa with increasing overlap distance, a trend well captured by an extended shear-lag model incorporating polymer stretch. The critical failure strain, marking the onset of strain localization, first increases and then decreases, peaking at an overlap distance of 4.8 nm. This non-monotonic behavior is attributed to a competition between polymer stretch and polymer shear in interfacial stress transfer. Similarly, the plateau stress and toughness show two-stage evolution: the plateau stress remains constant (~100 MPa) up to 4.8 nm before increasing significantly, while toughness rises from 16.9±0.2 to 51.0±4.0 MJ/m³ across the range. These findings reveal the nanoscale mechanisms behind strength and toughness in bioinspired nanocomposites and provide guidelines for optimizing performance through overlap distance tuning.
Keywords:
“brick-mortar” nanocomposites
; coarse-grained molecular dynamics
; graphene
; polyethylene
; shear-lag model
1. Introduction
Nacre, a natural “brick-mortar” structured nanocomposite, achieves an extraordinary combination of strength and toughness that is rarely attained in artificial materials [1]. Its structure consists of approximately 95% aragonite platelets and 5% organic biopolymer. Notably, nacre exhibits a fracture toughness of about 10 MPa·m¹/²—two orders of magnitude higher than that of monolithic aragonite (0.25 MPa·m¹/²)—while retaining a substantial strength of 80 MPa compared to 160 MPa for pure aragonite [2]. This enhancement is largely due to efficient stress transfer across the interface, mediated by the nanoconfinement of the polymer adhesive between mineral platelets. The extreme dimensional constraints—~500 nm for aragonite and ~10 nm for the biopolymer layer [3]—promote the formation of a distinct interphase, where the deformation behavior of the polymer is critical to mechanical performance [4]. In particular, under stress, the confined polymer undergoes competing modes of deformation: polymer stretching and polymer shear, both essential for toughness and strength. Inspired by nacre, graphene-polyethylene nanocomposites have been developed with similarly promising properties [5,6,7,8,9]. However, the detailed mechanisms behind strength and toughness—especially the role of overlap distance between reinforcing sheets in modulating polymer stretch versus shear—remain unclear. Current designs often rely on empirical approaches rather than mechanistic insight. Understanding how interfacial architecture influences the nanoconfined polymer behavior, particularly the competition between these two deformation modes, is crucial for the rational design of high-performance bio-inspired nanocomposites.
The high strength and toughness of nacre and nacre-inspired “brick-mortar” nanocomposites originate from a variety of interfacial interactions at the nanoscale. A significant enhancement in interface strength contributes to improved load transfer and consequently superior mechanical performance. These strengthening mechanisms arise from robust interfacial interactions, typically classified as either non-covalent or covalent bonds [10]. Non-covalent interactions—such as hydrogen bonding [5,11], ionic bonds [12,13,14] and van der Waals forces [15,16]—are prevalent in natural nacre and widely incorporated into bio-inspired materials. Graphene, known for its high specific surface area and exceptional in-plane stiffness (approximately 1 TPa) [17], is particularly suitable for designing such composites. The extensive interface area and strong interfacial interactions between graphene and polymer matrices induce a nanoconfinement effect, which substantially enhances mechanical properties, including toughness and strength. Surface modification further introduces functional groups to graphene, promoting stronger interfaces and facilitating the fabrication of high-performance “brick-mortar”nanocomposites. In these materials, interfacial sliding between adjacent bricks, mediated by reversible non-covalent bonds, results in ductile deformation and high toughness [18,19,20]. For example, Zhang et al. fabricated “brick-mortar” composites using monolayer oxidized graphene and ultrathin polymer layers, demonstrating that hydrogen and van der Waals interfacial interactions significantly enhance crack bridging [20]. He et al. employed melamine cross-linkers to develop an optimization strategy for graphene-oxide composites, simultaneously increasing strength and toughness through non-covalent interface engineering [19]. Similarly, Jia et al. introduced a self-folding graphene design that improves ductility with minimal strength reduction, utilizing energy dissipation via the ductile failure of van der Waals interfaces [21]. In summary, noncovalent nacre-inspired “brick-mortar” nanocomposites are capable of breaking and reforming the noncovalent interfacial interactions, maintaining interfacial shear stress and energy-dissipation efficiency, and thus the strength-toughness paradox can be potentially solved accordingly. Therefore, in this paper, the influences of nonvalent interfacial interactions will be investigated on the strength and toughness of nacre-inspired nanocomposites.
While the role of interfacial interactions in enhancing the mechanical properties of “brick-mortar” structured nanocomposites is well-established, the deformation behavior of the polymer phase—specifically the competition between tension and shear at the interface—remains insufficiently understood. Previous analyses, particularly those based on shear-lag models, have predominantly emphasized shear-dominated stress transfer mechanisms [22,23,24,25]. For instance, in graphite-nanoplatelet/polyethylene (GNP/PE) composites, van der Waals forces and carbon–π bonding promote polymer alignment and adhesion at the interface, but these studies primarily attributed load transfer to shear deformation, neglecting the contribution of tensile deformation within the polymer phase [26]. Recent studies suggest that tensile deformation in the polymer phase—macroscopic stretching under axial load—may significantly enhance stress distribution and energy dissipation, particularly in architectures with controlled overlap distances. For example, in ladder-like graphene architectures, efficient stress transfer is achieved through a combination of interfacial shear and axial load transmission at the ends of flakes, implying that overlap distance modulates the balance between shear and tensile pathways [27]. Nevertheless, these studies did not explicitly quantify the role of tensile deformation. Despite these advances, a systematic investigation into how overlap distance regulates the competition between tension and shear in the polymer phase is lacking. Furthermore, existing shear-lag models fail to incorporate the tensile strength of the polymer phase, leading to an incomplete understanding of stress transfer efficiency. This gap is critical because optimizing overlap distance could simultaneously maximize the contributions of shear (via interfacial sliding) and tension (via bulk polymer stretch), thereby resolving the strength-toughness trade-off [28].
To elucidate the effect of tension and shear in polymer phase on strength and toughness of “brick-mortar” structured nanocomposites, coarse grained (CG) molecular dynamics (MD) simulations can be highly useful. CG MD can be used to perform studies on nanoscale systems at molecular resolutions, while overcoming time and length scale limitations of all-atomistic (AA) MD simulations [29,30,31,32]. In this study, CG MD simulations have been studied to systematically investigate the dependence of mechanical performance of “brick-mortar” structured nanocomposites on overlap distance, focusing on the role of tension and shear in polymer phase in determining strength and toughness. Our simulation results are presented and discussed in order to clarify the effect of overlap distance on mechanical performance of “brick-mortar” structured graphene-polyethylene nanocomposites. Beyond the fundamental insights into toughening mechanisms, this study could provide foundational design guidelines for engineering high-performance structural nanocomposites, particularly for applications requiring exceptional fracture resistance and damage tolerance under mechanical load, such as in aerospace components, lightweight automotive parts, and protective coatings. By quantitatively linking key parameters like overlap distance to macroscopic performance, our work could offer a predictive framework for optimizing filler architecture, which can guide the synthesis of advanced composites in these fields.
2. Materials and Methods
In this work, the "brick-mortar" architecture of graphene-polyethylene nanocomposites is represented by the computational model illustrated in Figure 1. Note that, in this work, polyethylene is considered for its linear topology and simple structure. In our future work, branch polymers and cross-linked polymers will also be involved to study the effect of polymer topology on the mechanical performance of nanocomposites. The polyethylene matrix adopts a CG representation developed by Capaldi et al. [33], which has been widely validated for capturing the mechanical behavior of polyethylene and its nanocomposites [6,34]. Each CG bead corresponds to a group of atoms: CH₂ units along the chain backbone and terminal CH₃ groups, interconnected by explicit bonds. Bond stretching between adjacent beads is governed by a harmonic potential. Bond angle bending is defined for every triplet of consecutive beads, with the associated energy also described by a harmonic function based on the cosine of the angle. For dihedral torsion, a four-bead interaction is considered, and the potential energy is formulated as a third-order polynomial function of the dihedral cosine. Nonbonded interactions between beads are modeled using a Lennard-Jones 12-6 potential, truncated at a cutoff distance of 2.5σ. A complete summary of the CG potential parameters is provided in Table S1 in the Supplemental Material.
The graphene component is represented using a CG model developed by Ruiz et al. [35], employing a four-to-one mapping scheme wherein each CG bead corresponds to four carbon atoms. This approach preserves the characteristic hexagonal lattice structure of graphene. Interactions within the graphene model are divided into bonded and nonbonded categories. Bonded interactions are modeled using three distinct potentials: a Morse potential describes bond stretching between adjacent beads; a harmonic potential applied to the angle formed by three consecutive beads captures bond bending; and a harmonic dihedral potential governs the torsional behavior of four connected beads. Nonbonded interactions are represented with a standard Lennard-Jones 12-6 potential, truncated at a cutoff distance of 2.5σ. Owing to the planar geometry of graphene and the decoupled mathematical formulation of the various interaction potentials, the in-plane and out-of-plane mechanical properties can be accurately reproduced by independently calibrating the coefficients of the dihedral potential and the other bonded potentials, respectively. Complete parameters for the graphene CG potential are provided in Table S2 of the Supplemental Material. In this specific study, we considered pristine graphene to establish a fundamental understanding of the mechanical interplay and stress-transfer mechanisms at an ideal, defect-free interface, thereby providing a critical performance benchmark and isolating the geometric effects of the “brick-mortar” architecture. We fully acknowledge that synthesized graphene often contains intrinsic defects, grain boundaries, and chemical impurities, which would undoubtedly impact interfacial bonding strength and load transfer efficiency, likely leading to a reduction in the overall composite performance metrics predicted by our idealized model. Therefore, the simulated mechanical performance of nanocomposites in this work are overestimated compared with the nanocomposites in reality, which are typically reinforced by graphene with defects.
Interfacial nonbonded interactions between polyethylene and graphene are modeled using the Lennard-Jones 12-6 potential, expressed as:
Here, denotes the finite distance at which the interparticle potential is zero, determined in accordance with the Lorentz–Berthelot mixing rule [36]. The variable represents the instantaneous distance between a graphene bead i and a polyethylene bead j. The parameter describes the depth of the potential well and reflects the strength of the interfacial interaction. In the present work, the = 0.0132 eV is selected, corresponding to an interfacial adhesion energy of 0.12 J/m3.
The initial configurations of the nanocomposites were generated using self-avoiding algorithms [37] within a cuboid simulation cell of dimensions . The height was set to twice the combined thickness of the polymer phase ( = 4 nm) and graphene phase thickness ( = 70.34 nm), where each graphene “brick” consists of seven atomic layers. Two sets of graphene bricks were pre-positioned in a staggered arrangement along the longitudinal direction, each centered in the upper and lower halves of the simulation box, respectively. The number of bricks per set varied from 1 to 10, yielding overlap lengths anging from 2.4 to 24 nm. Accordingly, the graphene loading percentage in this work ranges from 56.1 wt% to 60.8 wt% as the overlap distance ranges from 2.4 to 24 nm. The detailed loading percentage of graphene can be found in Table S3 in the supplemental materials. Linear polymer chains, each comprising 100 connected beads, were constructed via a random-walk algorithm until the available volume was occupied. All chains featured identical bond lengths and bond angles between consecutive beads, while dihedral angles were randomized among quadruplets of adjacent beads. A total of 1400 polymer chains were incorporated into each system. The models were subsequently energy-minimized and equilibrated under the NVT ensemble at 200 K—below the glass transition temperature of polyethylene [38]—for 400 ps to achieve physically stable configurations. The NVT ensemble, also known as canonical ensemble, is a statistical ensemble that is used to study material properties under the conditions of a constant particle number N, constant volume V and a temperature fluctuating around an equilibrium value 〈T〉. A time step of 2 fs was employed throughout all simulations unless otherwise specified, balancing computational efficiency and numerical accuracy. Following equilibration, uniaxial tensile tests were conducted to evaluate the mechanical performance, including strength, toughness, and fracture strain. Periodic boundary conditions were applied in all three directions. Next, the sample is relaxed for 400 picoseconds under NPT ensemble in which the temperature is 200 K and the pressure is 100 kPa. The NPT ensemble, also known as isothermal–isobaric ensemble, is a statistical ensemble that is used to study material properties under the conditions of a constant particle number N, a temperature fluctuating around an equilibrium value 〈T〉, a pressure fluctuating around an equilibrium value 〈P〉. Prior to deformation, the systems underwent further relaxation under the NPT ensemble at 200 K and 100 kPa for 400 ps. Tensile deformation was then applied by imposing an engineering strain increment of 0.001 every 10 ps along the loading direction, while maintaining a lateral pressure of 100 kPa. In this work, all MD simulations were conducted within the LAMMPS computational frame-work [39] while relevant results about atomic configurations were visualized using OVITO [40].
We need to admit that the thickness and thermal properties of graphene “bricks” could have a significant impact on the results of simulations and thus the mechanical performance of nanocomposites. As demonstrated in a previous study [41], the lateral size of graphene flakes plays a vital role in thermal transport properties in graphene-based nanocomposites. Here, in this work, the thickness of graphene “bricks” is also important for the mechanical performance of graphene-reinforced nanocomposites. As the thickness of graphene “bricks” increases, the out-of-plane bending stiffness of those “bricks” also increases [42], which could influence the stiffness of nanocomposites reinforced by those graphene “bricks”. Therefore, it would be an interesting topic for future studies to investigate the effect of the thickness of graphene “bricks” on the mechanical performance of graphene-reinforced nanocomposites with “brick-mortar” structures.
3. Results and Discussions
In this study, uniaxial tensile tests were conducted via coarse-grained simulations to investigate nanocomposites with varying overlap distances , which ranged from 2.4 nm to 24 nm. For each polymer phase thickness , five independent samples were constructed using self-avoiding walk algorithms with distinct random seeds to ensure statistical reliability of the configurations. As illustrated in Figure 2, the average stress–strain behavior exhibits three distinct stages, consistent with previously reported responses in “brick-mortar” structured nanocomposites [6,19,43,44]. Stage I is characterized by linear-elastic deformation, during which stress increases linearly and reversibly with strain. Throughout this stage, the material undergoes uniform deformation without interfacial slippage between the graphene and polyethylene phases. In Stage II, plastic deformation becomes dominant. The stress fluctuates around a plateau value, accompanied by interfacial sliding between graphene bricks and the polymer matrix. This sliding mechanism leads to the formation of voids near the edges of graphene bricks and the adjacent polyethylene regions. Stage III is marked by brick pull-out and ultimate failure. In this stage, the stress declines continuously with increasing strain, indicating loss of load-bearing capacity and structural integrity of the nanocomposite. Three mechanical characteristics are identified as shown in Figure 2, namely yield strength , plateau stress and critical failure strain . The yield strength denotes the maximum stress in stage I, above which the void formation and polymer slippage can be triggered. The plateau stress is the average stress in stage II, which indicate the stress the nanocomposites can maintain without strain localization. The critical failure strain is the characteristic strain for nanocomposites above which strain localization happens at the end of stage II. Note that for concision, only part of results are shown in Figure 2. Additional results including = 2.4 nm can be found in Figure S1 in the supplemental materials.
To visually illustrate deformation mechanisms and elucidate the structure–property relationships in graphene–polyethylene nanocomposites, representative snapshots from uniaxial tensile simulations are presented in Figure 3 for systems with varying overlap distances . Each column corresponds to a distinct value, while each row depicts the morphological evolution at a specific strain level. The first two rows correspond to Stage I, where elastic deformation is evident from the gradually widening gaps between adjacent graphene bricks. In the subsequent rows, associated with Stage II, void nucleation emerges between longitudinally adjacent bricks, accompanied by interfacial sliding between graphene and polyethylene phases. Finally, as strain further increases, localized deformation leads to progressive pull-out of graphene bricks from one end, culminating in structural failure. This process aligns with the steady stress reduction observed in Stage III of the stress–strain response.
.
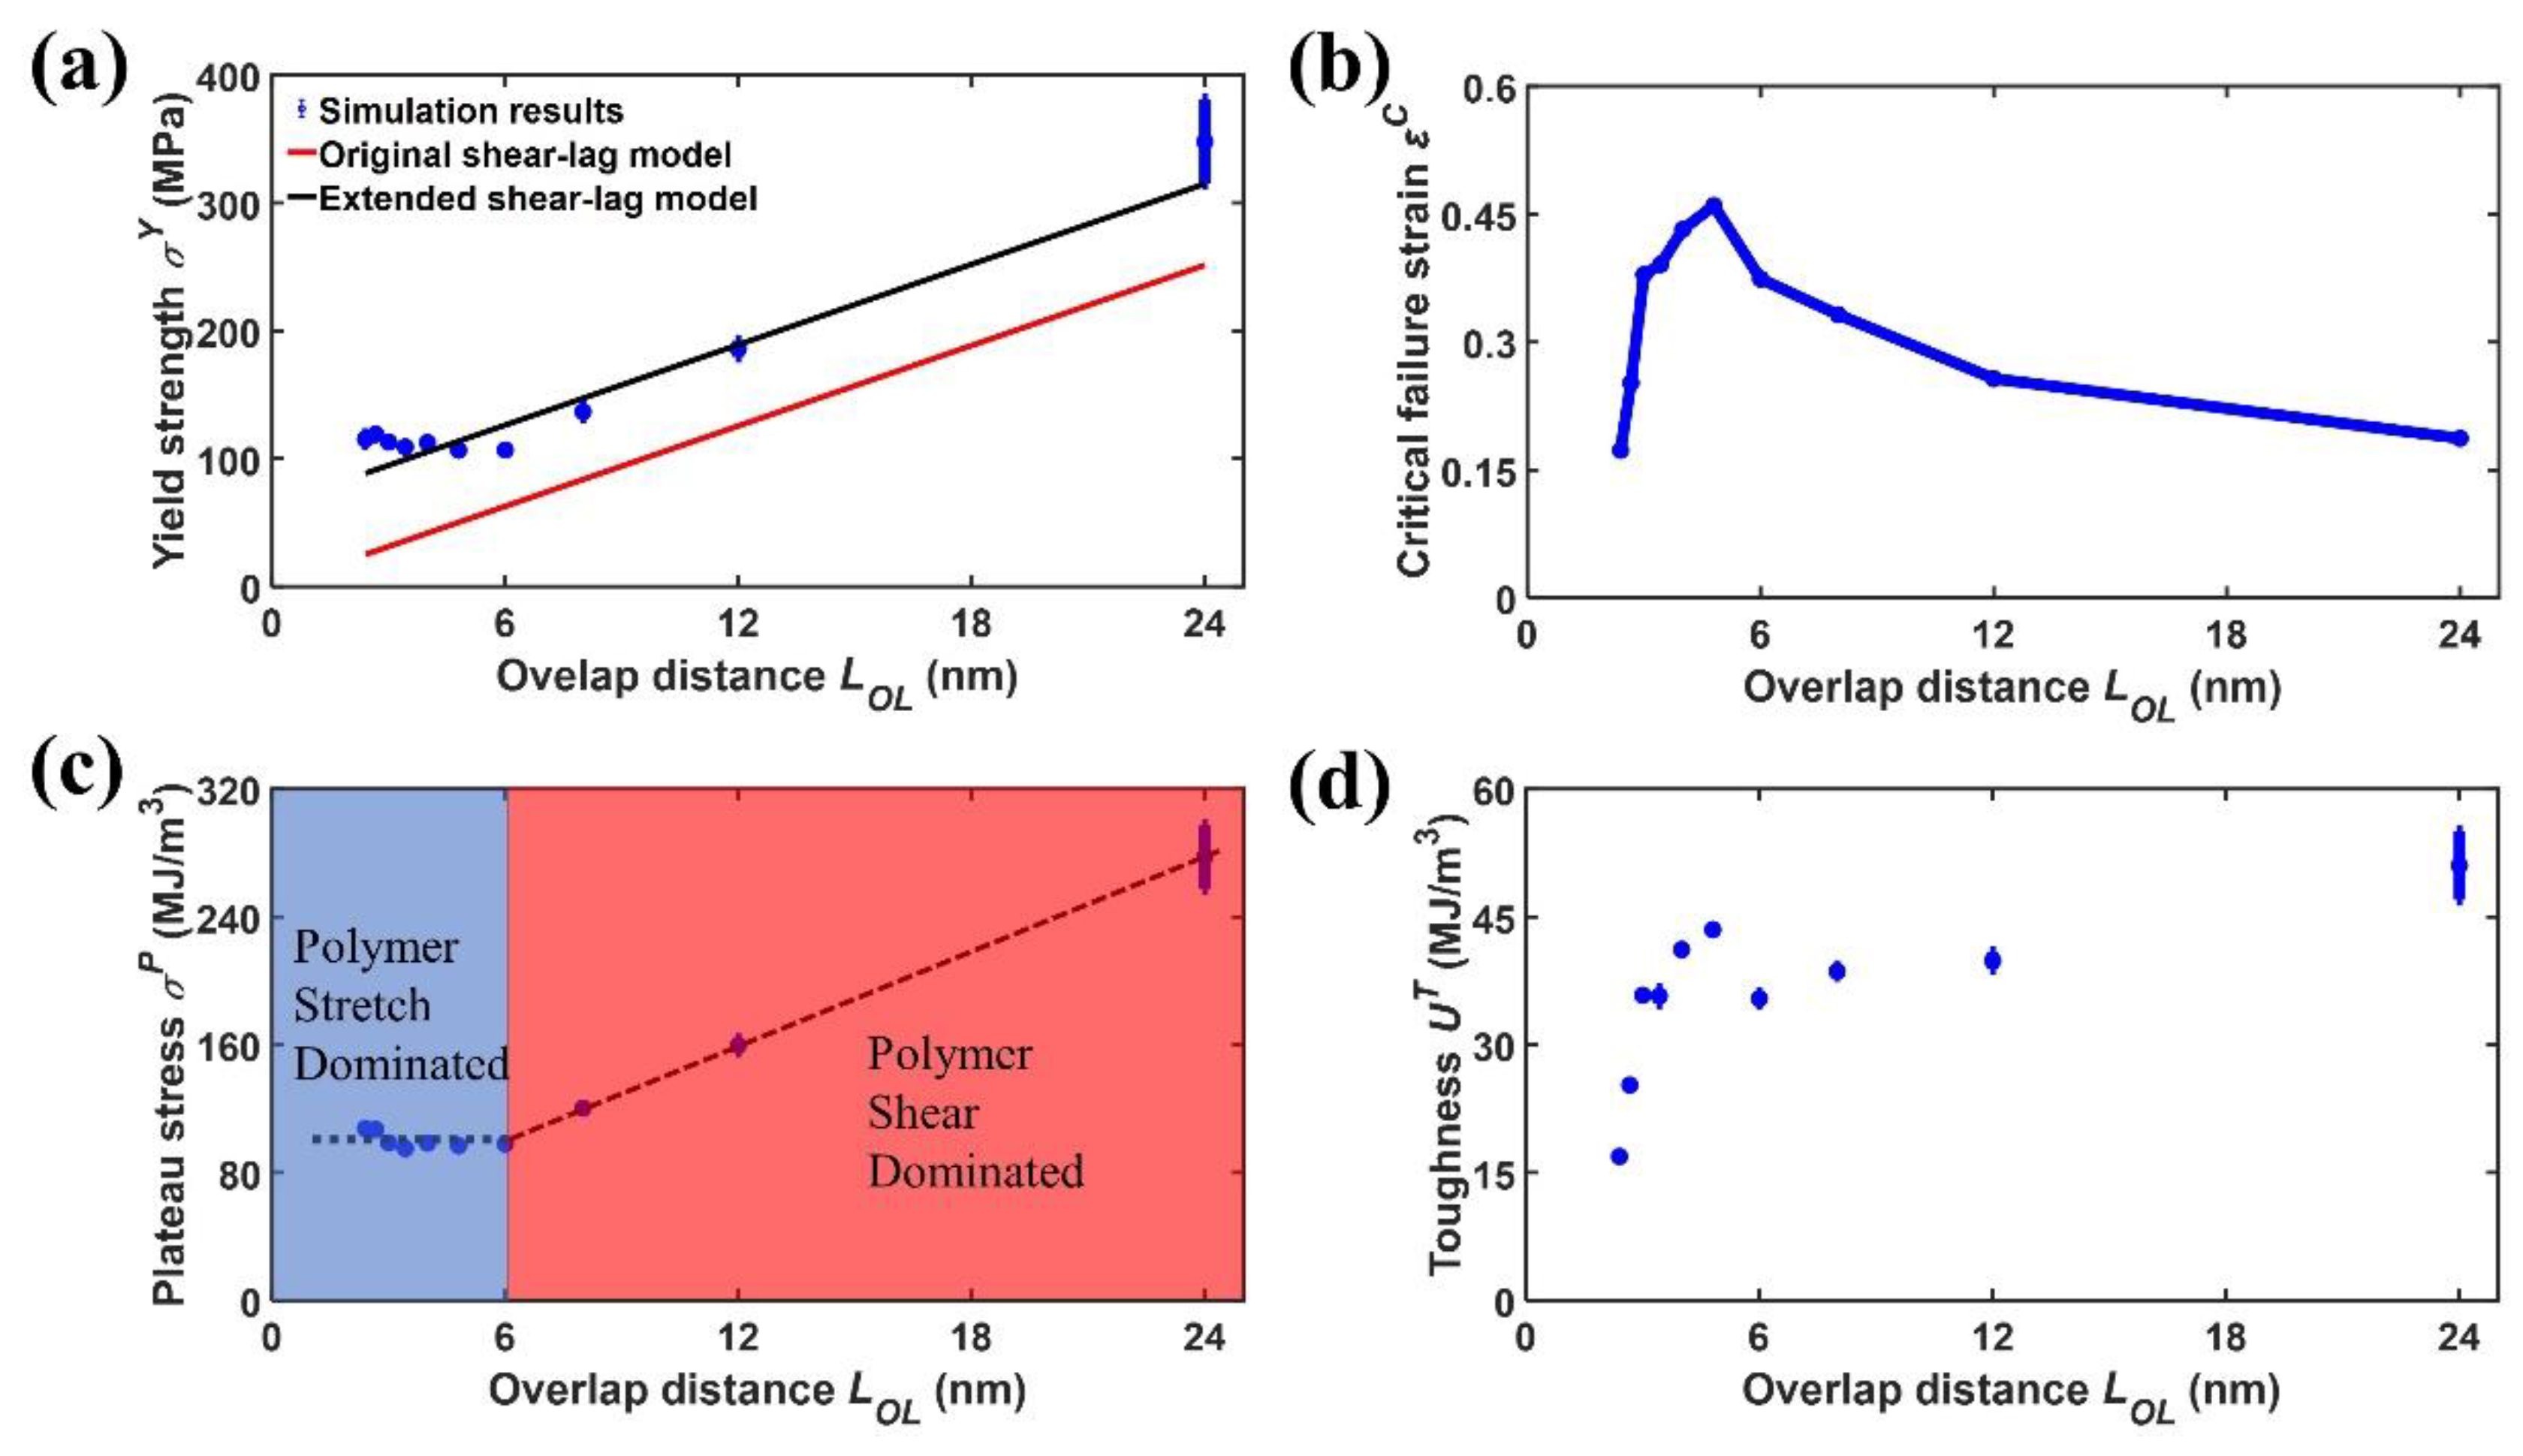
The relations between overlap distance and mechanical properties of the nanocomposites are shown in Figure 4. Figure 4(a) shows the yield strength versus overlap distance . It can be seen that the yield strength increases from 115.3±3.8 MPa to 347.9±33.0 MPa as the overlap distance increase from 2.4 to 24 nm. According to the shear-lag model [45,46], the yield strength can be expressed as a function of overlap distance ,
where is the characteristic length which represents the length scale for interfacial stress transfer, is the shear strength of the bulk polyethylene matrix, is the Young’s modulus of graphene (1 TPa used in this work) [35], is the polymer phase thickness, is the graphene phase thickness, is the shear modulus of polyethylene phase (0.64 GPa used in this work) [46]. For this study, the characteristic length is 59.9 nm while the overlap distance is only 24 nm. According to previous studies [46], when the overlap distance is significant smaller than the characteristic length , the interfacial shear stress between the graphene “brick” and the polyethylene “mortar” barely changes along the longitudinal direction of the graphene ‘brick’. Therefore, Eq. 2 can be transitioned to a degenerate form in the following expression [45,46],
The above equation is so-called “original shear-lag model” in this work. However, it can be seen that the theoretical predictions from the original shear-lag model significantly underestimates the yield strength of the simulations as shown in Figure 4(a). The deviations in yield strength between the original shear-lag model and the simulation results can be attributed to the neglected contribution of polymer stretch to the yield strength. According to our previous study [46], the yield strength of the pure polymer phase is around 100 MPa, comparable to that of nanocomposites. Consequently, to account for the contribution of polyethylene stretch on , a new term is incorporated into Eq. 4, resulting in the final expression of as follows [46],
where is the yield strength of polyethylene under uniaxial tensile tests, 94±5 MPa as reported previously [46]. Eq. 5 is so-called “extended shear-lag model”. It can be seen that the simulation results of yield strength can be well captured by the extended shear lag model.
Figure 4(b) shows the critical failure strain versus the overlap distance . It can be seen that the critical failure strain , at which strain localization happens, experiences an up-hill increase and a subsequent down-hill decrease. Specifically, the critical failure strain reaches the peak when the overlap distance is equal to 4.8 nm. In fact, for graphene-polyethylene nanocomposites here, there are two competing mechanisms affecting the mechanical performance like critical failure strain, namely polymer stretch and polymer shear. When the overlap distance is no bigger than 4.8 nm, the interfacial stress transfer inside the nanocomposites can be mainly contributed to polymer stretch. In this scenario, as the overlap distance decreases, the density of interfacial defects increases, leading to the decrease of critical failure strain . When the overlap distance is no smaller than 4.8 nm, the tensile strain concentration becomes more intensive between adjacent graphene “bricks” in the same layer as the overlap distance increases. Moreover, the interfacial stress transfer inside the nanocomposites is determined by both polymer stretch and polymer shear. Consequently, the critical failure strain , beyond which strain localization happens, decreases, as the overlap distance increases. Note that the transition in interfacial stress transfer mechanisms, while valid for our specific modeled system, cannot be broadly generalized to all polymer-graphene nanocomposites without qualification, as the dominant stress transfer mechanism is highly sensitive to factors including the specific polymer matrix's stiffness and entanglement, the chemical nature of the interface (e.g., functionalized vs. pristine graphene), and the filler aspect ratio. Our conclusion was drawn under the specific conditions of our simulation (e.g., a ductile, amorphous polymer matrix with adequate interfacial adhesion and the given brick dimensions). For a much stiffer or more brittle polymer, or a weaker interface, shear-lag mechanisms may dominate even at very short overlap distance.
Figure 4(c) shows the plateau stress versus the overlap distance . It can be seen that the plateau stress also undergoes a two-stage evolution versus the overlap distance . In the first stage, when the overlap distance is no bigger than 4.8 nm, the plateau stress fluctuates around 100 MPa. In this stage, since the overlap distance is relatively small, the polymer shear cannot support high level interfacial stress transfer. Therefore, the deformation and interfacial stress transfer is dominated by polymer stretch. Consequently, this stage is named as “Polymer stretch dominated” stage. In the second stage, when the overlap distance is no smaller than 4.8 nm, the plateau stress increases increases linearly from 96.8±0.5 to 277.4±20.2 MPa associated with the increase of the overlap distance from 4.8 nm to 24 nm. In this stage, the deformation and interfacial stress transfer is dominated by both polymer stretch and polymer shear. Since the part of yield strength from polymer stretch is a constant, the increase of yield strength is completely contributed by polymer shear. Therefore, this stage is named as “Polymer stretch dominated” stage. Figure 4(d) shows the toughness versus the overlap distance . The toughness is calculated using characteristic strain based on the expression as follows [46],
Similarly, the toughness also experiences a two-stage variation as the overlap distance increases. In the first stage, when the overlap distance is no bigger than 4.8 nm, the toughness intensively increases from 16.9±0.2 to 43.5±0.2 MJ/m3 since the plateau stress barely changes and the critical failure stress intensively increases. In the second stage, when the overlap distance is no smaller than 4.8 nm, the toughness undergoes mild increase from 43.5±0.2 to 51.0±4.0 MJ/m3 as the overlap distance increases from 4.8 to 24 nm. The above mild increase can be attributed to the increase of plateau stress but simultaneous decrease of critical failure strain as the overlap distance increases.
Additionally, while our current study primarily focused on the mechanical response, our data suggests that varying the overlap distance () influences the polymer confinement and interfacial dynamics, which in turn would be expected to modulate the Tg. A shorter creates a higher density of polymer-filler interfaces, potentially restricting chain mobility and elevating the Tg more significantly than a configuration with longer, more spaced-out overlaps. We are currently investigating in a follow-up study specifically designed to quantify the nanoconfinement effects and thermodynamic properties of our model system as a function of its architectural parameters.
4. Conclusions
In this study, CG MD simulations have been performed to study the dependence of mechanical performance of graphene-polyethylene nanocomposites with “brick-mortar” structure on the overlap distance. In this study, the simulation box size is fixed at , while the overlap distance ranges from 2.4 to 24 nm. Results indicate that the stress of nanocomposites experience a three-stage evolution versus strain, namely an elastic increase in stage I, a plastic plateau in stage II, and a slow decrease in stage III. Moreover, the yield strength experiences a nearly linear increase from 115.3±3.8 to 347.9±33.0 MPa as the overlap distance increases from 2.4 to 24 nm. The above relation between yield strength and the overlap distance can be well captured by an extended shear-lag model with polymer stretch taken into account. Moreover, the critical failure strain, above which strain localization happens at the end of stage II, experiences an up-hill increase first followed by a down-hill decrease, reaching the maximum when the overlap distance is equal to 4.8 nm. The two-stage evolution of critical failure strain can be attributed to the competition between polymer stretch and polymer shear with respect to interfacial stress transfer inside nanocomposites. When the overlap distance is no bigger than 4.8 nm, the interfacial stress transfer is dominated by polymer stretch. In contrast, when the overlap distance is no smaller than 4.8 nm, the interfacial stress transfer is dominated by polymer shear. Similarly, the plateau stress also experiences a two-stage evolution versus overlap distance. In the first stage the plateau stress maintains around 100 MPa as the overlap distance increases from 2.4 to 4.8 nm while in the second stage the plateau stress increases from 96.8±0.5 to 277.4±20.2 MPa as the overlap distance increase from 4.8 to 24 nm. Likewise, the toughness also experiences a two-stage increase from 16.9±0.2 to 51.0±4.0 MJ/m3 as the overlap distance increases from 2.4 to 24 nm. Overall, these findings unveil the fundamental mechanism at the nanoscale for tough-and-strong polymer composites via nanostructure design.
However, no research provides a perfect study, with this work being no exception to the rule. Our use of an ordered, staggered arrangement was intentional to establish a theoretical performance ceiling and to clearly isolate the fundamental toughening mechanisms—crack deflection and fiber bridging/pull-out—in a controlled system without confounding variables. Nevertheless, in practical composites, a random distribution is common and would likely lead to a reduction in macroscopic mechanical properties such as fracture toughness and strength. This anticipated decrease is due to several factors associated with randomness, including the potential for flake agglomeration (creating stress concentrations), the formation of easy-crack-path voids, and a less efficient pull-out process due to suboptimal flake orientation and embedding. Furthermore, the data would lose its deterministic nature, showing significant variability and requiring extensive statistical analysis over numerous simulations to obtain meaningful averages. Investigating these effects is a crucial next step, and this valuable point directly informs our planned future work, which will employ high-throughput sampling of random configurations to quantitatively bridge the gap between our idealized model and experimentally realistic microstructures. Validating simulation data against experimental results is paramount for the advancement of the field. A follow-up plan involves active collaboration with experimental groups to synthesize nanocomposites with controlled filler architectures based on our parameters and to compare their stress-strain responses, utilizing techniques such as in-situ mechanical testing coupled with SEM/Raman spectroscopy to directly observe failure mechanisms and quantify interfacial stress transfer. This future research could bridge the gap between our atomic-scale models and practical material performance to create a predictive design framework for next-generation graphene nanocomposites.
Supplementary Materials
The following supporting information can be downloaded at the website of this paper posted on Preprints.org, Table S1: Functional form and parameters of the force field for the coarse-grained model of polyethylene; Table S2: Functional form and parameters of the force field for the coarse-grained model of graphene.
Author Contributions
Conceptualization, N.L. and L.W.; methodology, N.L.; software, K.H. and N. L.; validation, Z.Z.; formal analysis, N.L.; investigation, N.L.; resources, N.L.; data curation, K.H., N.L. and Z.Z.; writing—original draft preparation, N.L., K.H.; writing—review and editing, N.L., D.X., Z.Z., and L.W.; visualization, N.L. and K.H.; supervision, N.L., D.X. and L.W.; project administration, N.L. and L.W.; funding acquisition, N.L., D.X. and L.W. All authors have read and agreed to the published version of the manuscript.
Funding
N.L., L.W. and D.X. acknowledge support from National Natural Science Foundation of China under grant No. 12302185, 52205493, 12272270. D.X. also acknowledges support from the Aeronautical Science Foundation of China (ASFC) under the grant No. ASFC-20230016038001. This work is also sponsored by Shanghai Gaofeng Project for University Academic Program Development.
Data Availability Statement
Data will be made available on request.
Conflicts of Interest
The authors declare no conflicts of interest.
Abbreviations
The following abbreviations are used in this manuscript:
| AA | All-atomistic |
| CG | Coarse-grained |
| MD | Molecular dynamics |
References
- Ji, B.; Gao, H. Mechanical properties of nanostructure of biological materials. Journal of the Mechanics and Physics of Solids 2004, 52, 1963–1990. [Google Scholar] [CrossRef]
- Tang, H.; Barthelat, F.; Espinosa, H.D. An elasto-viscoplastic interface model for investigating the constitutive behavior of nacre. Journal of the Mechanics and Physics of Solids 2007, 55, 1410–1438. [Google Scholar] [CrossRef]
- Nudelman, F.; Gotliv, B.A.; Addadi, L.; Weiner, S. Mollusk shell formation: Mapping the distribution of organic matrix components underlying a single aragonitic tablet in nacre. Journal of Structural Biology 2006, 153, 176–187. [Google Scholar] [CrossRef] [PubMed]
- Xia, W.; Keten, S. Interfacial stiffening of polymer thin films under nanoconfinement. Extreme Mechanics Letters 2015, 4, 89–95. [Google Scholar] [CrossRef]
- Li, Y.-Q.; Yu, T.; Yang, T.-Y.; Zheng, L.-X.; Liao, K. Bio-Inspired Nacre-like Composite Films Based on Graphene with Superior Mechanical, Electrical, and Biocompatible Properties. Advanced Materials 2012, 24, 3426–3431. [Google Scholar] [CrossRef]
- Liu, N.; Zeng, X.; Pidaparti, R.; Wang, X. Tough and strong bioinspired nanocomposites with interfacial cross-links. Nanoscale 2016, 8, 18531–18540. [Google Scholar] [CrossRef]
- Huang, C.; Cheng, Q. Learning from nacre: Constructing polymer nanocomposites. Composites Science and Technology 2017, 150, 141–166. [Google Scholar] [CrossRef]
- Woo, J.Y.; Oh, J.H.; Jo, S.; Han, C.-S. Nacre-Mimetic Graphene Oxide/Cross-Linking Agent Composite Films with Superior Mechanical Properties. ACS Nano 2019, 13, 4522–4529. [Google Scholar] [CrossRef]
- Chen, Y.; Fu, J.; Dang, B.; Sun, Q.; Li, H.; Zhai, T. Artificial Wooden Nacre: A High Specific Strength Engineering Material. ACS Nano 2020, 14, 2036–2043. [Google Scholar] [CrossRef] [PubMed]
- Zhang, Y.; Gong, S.; Zhang, Q.; Ming, P.; Wan, S.; Peng, J.; Jiang, L.; Cheng, Q. Graphene-based artificial nacre nanocomposites. Chemical Society Reviews 2016, 45, 2378–2395. [Google Scholar] [CrossRef] [PubMed]
- Putz, K.W.; Compton, O.C.; Palmeri, M.J.; Nguyen, S.T.; Brinson, L.C. High-Nanofiller-Content Graphene Oxide–Polymer Nanocomposites via Vacuum-Assisted Self-Assembly. Advanced Functional Materials 2010, 20, 3322–3329. [Google Scholar] [CrossRef]
- Park, S.; Lee, K.-S.; Bozoklu, G.; Cai, W.; Nguyen, S.T.; Ruoff, R.S. Graphene Oxide Papers Modified by Divalent Ions—Enhancing Mechanical Properties via Chemical Cross-Linking. ACS Nano 2008, 2, 572–578. [Google Scholar] [CrossRef]
- Lam, D.V.; Gong, T.; Won, S.; Kim, J.-H.; Lee, H.-J.; Lee, C.; Lee, S.-M. A robust and conductive metal-impregnated graphene oxide membrane selectively separating organic vapors. Chemical Communications 2015, 51, 2671–2674. [Google Scholar] [CrossRef]
- Yeh, C.-N.; Raidongia, K.; Shao, J.; Yang, Q.-H.; Huang, J. On the origin of the stability of graphene oxide membranes in water. Nature Chemistry 2015, 7, 166–170. [Google Scholar] [CrossRef]
- Xu, Y.; Bai, H.; Lu, G.; Li, C.; Shi, G. Flexible Graphene Films via the Filtration of Water-Soluble Noncovalent Functionalized Graphene Sheets. Journal of the American Chemical Society 2008, 130, 5856–5857. [Google Scholar] [CrossRef]
- Zhang, J.; Xu, Y.; Cui, L.; Fu, A.; Yang, W.; Barrow, C.; Liu, J. Mechanical properties of graphene films enhanced by homo-telechelic functionalized polymer fillers via π–π stacking interactions. Composites Part A: Applied Science and Manufacturing 2015, 71, 1–8. [Google Scholar] [CrossRef]
- Jiang, J.-W.; Wang, J.-S.; Li, B. Young's modulus of graphene: A molecular dynamics study. Physical Review B 2009, 80, 113405. [Google Scholar] [CrossRef]
- He, Z.; Zhu, Y.; Wu, H. A universal mechanical framework for noncovalent interface in laminated nanocomposites. Journal of the Mechanics and Physics of Solids 2022, 158, 104560. [Google Scholar] [CrossRef]
- He, Z.; Zhu, Y.; Xia, J.; Wu, H. Optimization design on simultaneously strengthening and toughening graphene-based nacre-like materials through noncovalent interaction. Journal of the Mechanics and Physics of Solids 2019, 133, 103706. [Google Scholar] [CrossRef]
- Zhang, X.; Nguyen, H.; Daly, M.; Nguyen, S.T.; Espinosa, H.D. Nanoscale toughening of ultrathin graphene oxide-polymer composites: mechanochemical insights into hydrogen-bonding/van der Waals interactions, polymer chain alignment, and steric parameters. Nanoscale 2019, 11, 12305–12316. [Google Scholar] [CrossRef] [PubMed]
- Jia, X.; Liu, Z.; Gao, E. Bio-inspired self-folding strategy to break the trade-off between strength and ductility in carbon-nanoarchitected materials. npj Computational Materials 2020, 6, 13. [Google Scholar] [CrossRef]
- Zhou, L.; He, Z.; Zhang, Z.; Zhu, Y.; Wu, H. Maximum utilization of nacre-mimetic composites by architecture manipulation and interface modification towards critical damage state. Composites Science and Technology 2023, 233, 109893. [Google Scholar] [CrossRef]
- Shao, L.-H.; Qu, X.; Wang, T.; Cui, Z.; Liu, Y.; Zhu, Y. Interfacial shear stress transfer between elastoplastic fiber and elastic matrix. Journal of the Mechanics and Physics of Solids 2023, 173, 105218. [Google Scholar] [CrossRef]
- He, Z.; Wu, H.; Xia, J.; Hou, Y.; Zhu, Y. How weak hydration interfaces simultaneously strengthen and toughen nanocellulose materials. Extreme Mechanics Letters 2023, 58, 101947. [Google Scholar] [CrossRef]
- Hou, Y.; Han, Z.-M.; Zhu, Y.; Xia, J.; Li, J.; Yang, K.-P.; He, Z.; Song, R.; Guan, Q.-F.; Lu, Y.; et al. Artificial kink defects enable high-efficiency degradation of nanocellulose via mechanochemical activation. Matter. [CrossRef]
- Sadeghpour, E.; Guo, Y.; Chua, D.; Shim, V.P.W. Micro-scale computational modeling of graphene-based nanocomposites – Influence of filler-matrix interface failure. Mechanics of Materials 2020, 150, 103584. [Google Scholar] [CrossRef]
- Yao, Z.; Xia, A.; Wang, Y.; Zhang, K.; Yang, L.; Yu, M.; Wang, D. Construction of a “rigid-flexible” double-locking transition layer based on “mortar-brick–mortar” structure to achieve the effective transfer of stress at the interface. Chemical Engineering Journal 2025, 515, 163470. [Google Scholar] [CrossRef]
- Xia, H.; Geng, K.; Pan, H.; Wang, Z.; Zhang, Z.; Wang, B. A micromechanical model for bioinspired nanocomposites with interphase. Composite Structures 2023, 321, 117316. [Google Scholar] [CrossRef]
- Xia, W.; Song, J.; Hsu, D.D.; Keten, S. Understanding the Interfacial Mechanical Response of Nanoscale Polymer Thin Films via Nanoindentation. Macromolecules 2016, 49, 3810–3817. [Google Scholar] [CrossRef]
- Song, J.; Kahraman, R.; Collinson, D.W.; Xia, W.; Brinson, L.C.; Keten, S. Temperature effects on the nanoindentation characterization of stiffness gradients in confined polymers. Soft Matter 2019, 15, 359–370. [Google Scholar] [CrossRef] [PubMed]
- Xia, W.; Lan, T. Interfacial Dynamics Governs the Mechanical Properties of Glassy Polymer Thin Films. Macromolecules 2019, 52, 6547–6554. [Google Scholar] [CrossRef]
- Li, T.; Meng, Z.; Keten, S. Interfacial mechanics and viscoelastic properties of patchy graphene oxide reinforced nanocomposites. Carbon 2020, 158, 303–313. [Google Scholar] [CrossRef]
- Capaldi, F.M.; Boyce, M.C.; Rutledge, G.C. Molecular response of a glassy polymer to active deformation. Polymer 2004, 45, 1391–1399. [Google Scholar] [CrossRef]
- Liu, N.; Pidaparti, R.; Wang, X. Mechanical Performance of Graphene-Based Artificial Nacres under Impact Loads: A Coarse-Grained Molecular Dynamic Study. Polymers 2017, 9, 134. [Google Scholar] [CrossRef]
- Ruiz, L.; Xia, W.; Meng, Z.; Keten, S. A coarse-grained model for the mechanical behavior of multi-layer graphene. Carbon 2015, 82, 103–115. [Google Scholar] [CrossRef]
- Lorentz, H.A. Ueber die Anwendung des Satzes vom Virial in der kinetischen Theorie der Gase. Annalen der Physik 1881, 248, 127–136. [Google Scholar] [CrossRef]
- Peliti, L. Self-avoiding walks. Physics Reports 1984, 103, 225–231. [Google Scholar] [CrossRef]
- Fu, Y.; Song, J.-H. Large deformation mechanism of glassy polyethylene polymer nanocomposites: Coarse grain molecular dynamics study. Computational Materials Science 2015, 96, 485–494. [Google Scholar] [CrossRef]
- Belytschko, T.; Xiao, S.P.; Schatz, G.C.; Ruoff, R.S. Atomistic simulations of nanotube fracture. Physical Review B 2002, 65. [Google Scholar] [CrossRef]
- Stukowski, A. Visualization and analysis of atomistic simulation data with OVITO–the Open Visualization Tool. Modelling and Simulation in Materials Science and Engineering 2010, 18, 015012. [Google Scholar] [CrossRef]
- Sudhindra, S.; Rashvand, F.; Wright, D.; Barani, Z.; Drozdov, A.D.; Baraghani, S.; Backes, C.; Kargar, F.; Balandin, A.A. Specifics of Thermal Transport in Graphene Composites: Effect of Lateral Dimensions of Graphene Fillers. ACS Applied Materials & Interfaces 2021, 13, 53073–53082. [Google Scholar] [CrossRef]
- Cranford, S.; Sen, D.; Buehler, M.J. Meso-origami: Folding multilayer graphene sheets. Applied Physics Letters 2009, 95, 123121. [Google Scholar] [CrossRef]
- Xia, W.; Ruiz, L.; Pugno, N.M.; Keten, S. Critical length scales and strain localization govern the mechanical performance of multi-layer graphene assemblies. Nanoscale 2016, 8, 6456–6462. [Google Scholar] [CrossRef] [PubMed]
- Liu, N.; Hong, J.; Zeng, X.; Pidaparti, R.; Wang, X. Fracture mechanisms in multilayer phosphorene assemblies: from brittle to ductile. Physical Chemistry Chemical Physics 2017, 19, 13083–13092. [Google Scholar] [CrossRef]
- Wei, X.; Naraghi, M.; Espinosa, H.D. Optimal Length Scales Emerging from Shear Load Transfer in Natural Materials: Application to Carbon-Based Nanocomposite Design. ACS Nano 2012, 6, 2333–2344. [Google Scholar] [CrossRef]
- Liu, N.; Li, S.; Wang, X. Mechanism of coupling polymer thickness and interfacial interactions on strength and toughness of non-covalent nacre-inspired graphene nanocomposites. Composites Science and Technology 2023, 241, 110124. [Google Scholar] [CrossRef]
Figure 1.
Overall view of the representative volume element (RVE) of graphene-polyethylene nanocomposites (a) Front view; (b) Top view; (c) Right view.
Figure 1.
Overall view of the representative volume element (RVE) of graphene-polyethylene nanocomposites (a) Front view; (b) Top view; (c) Right view.
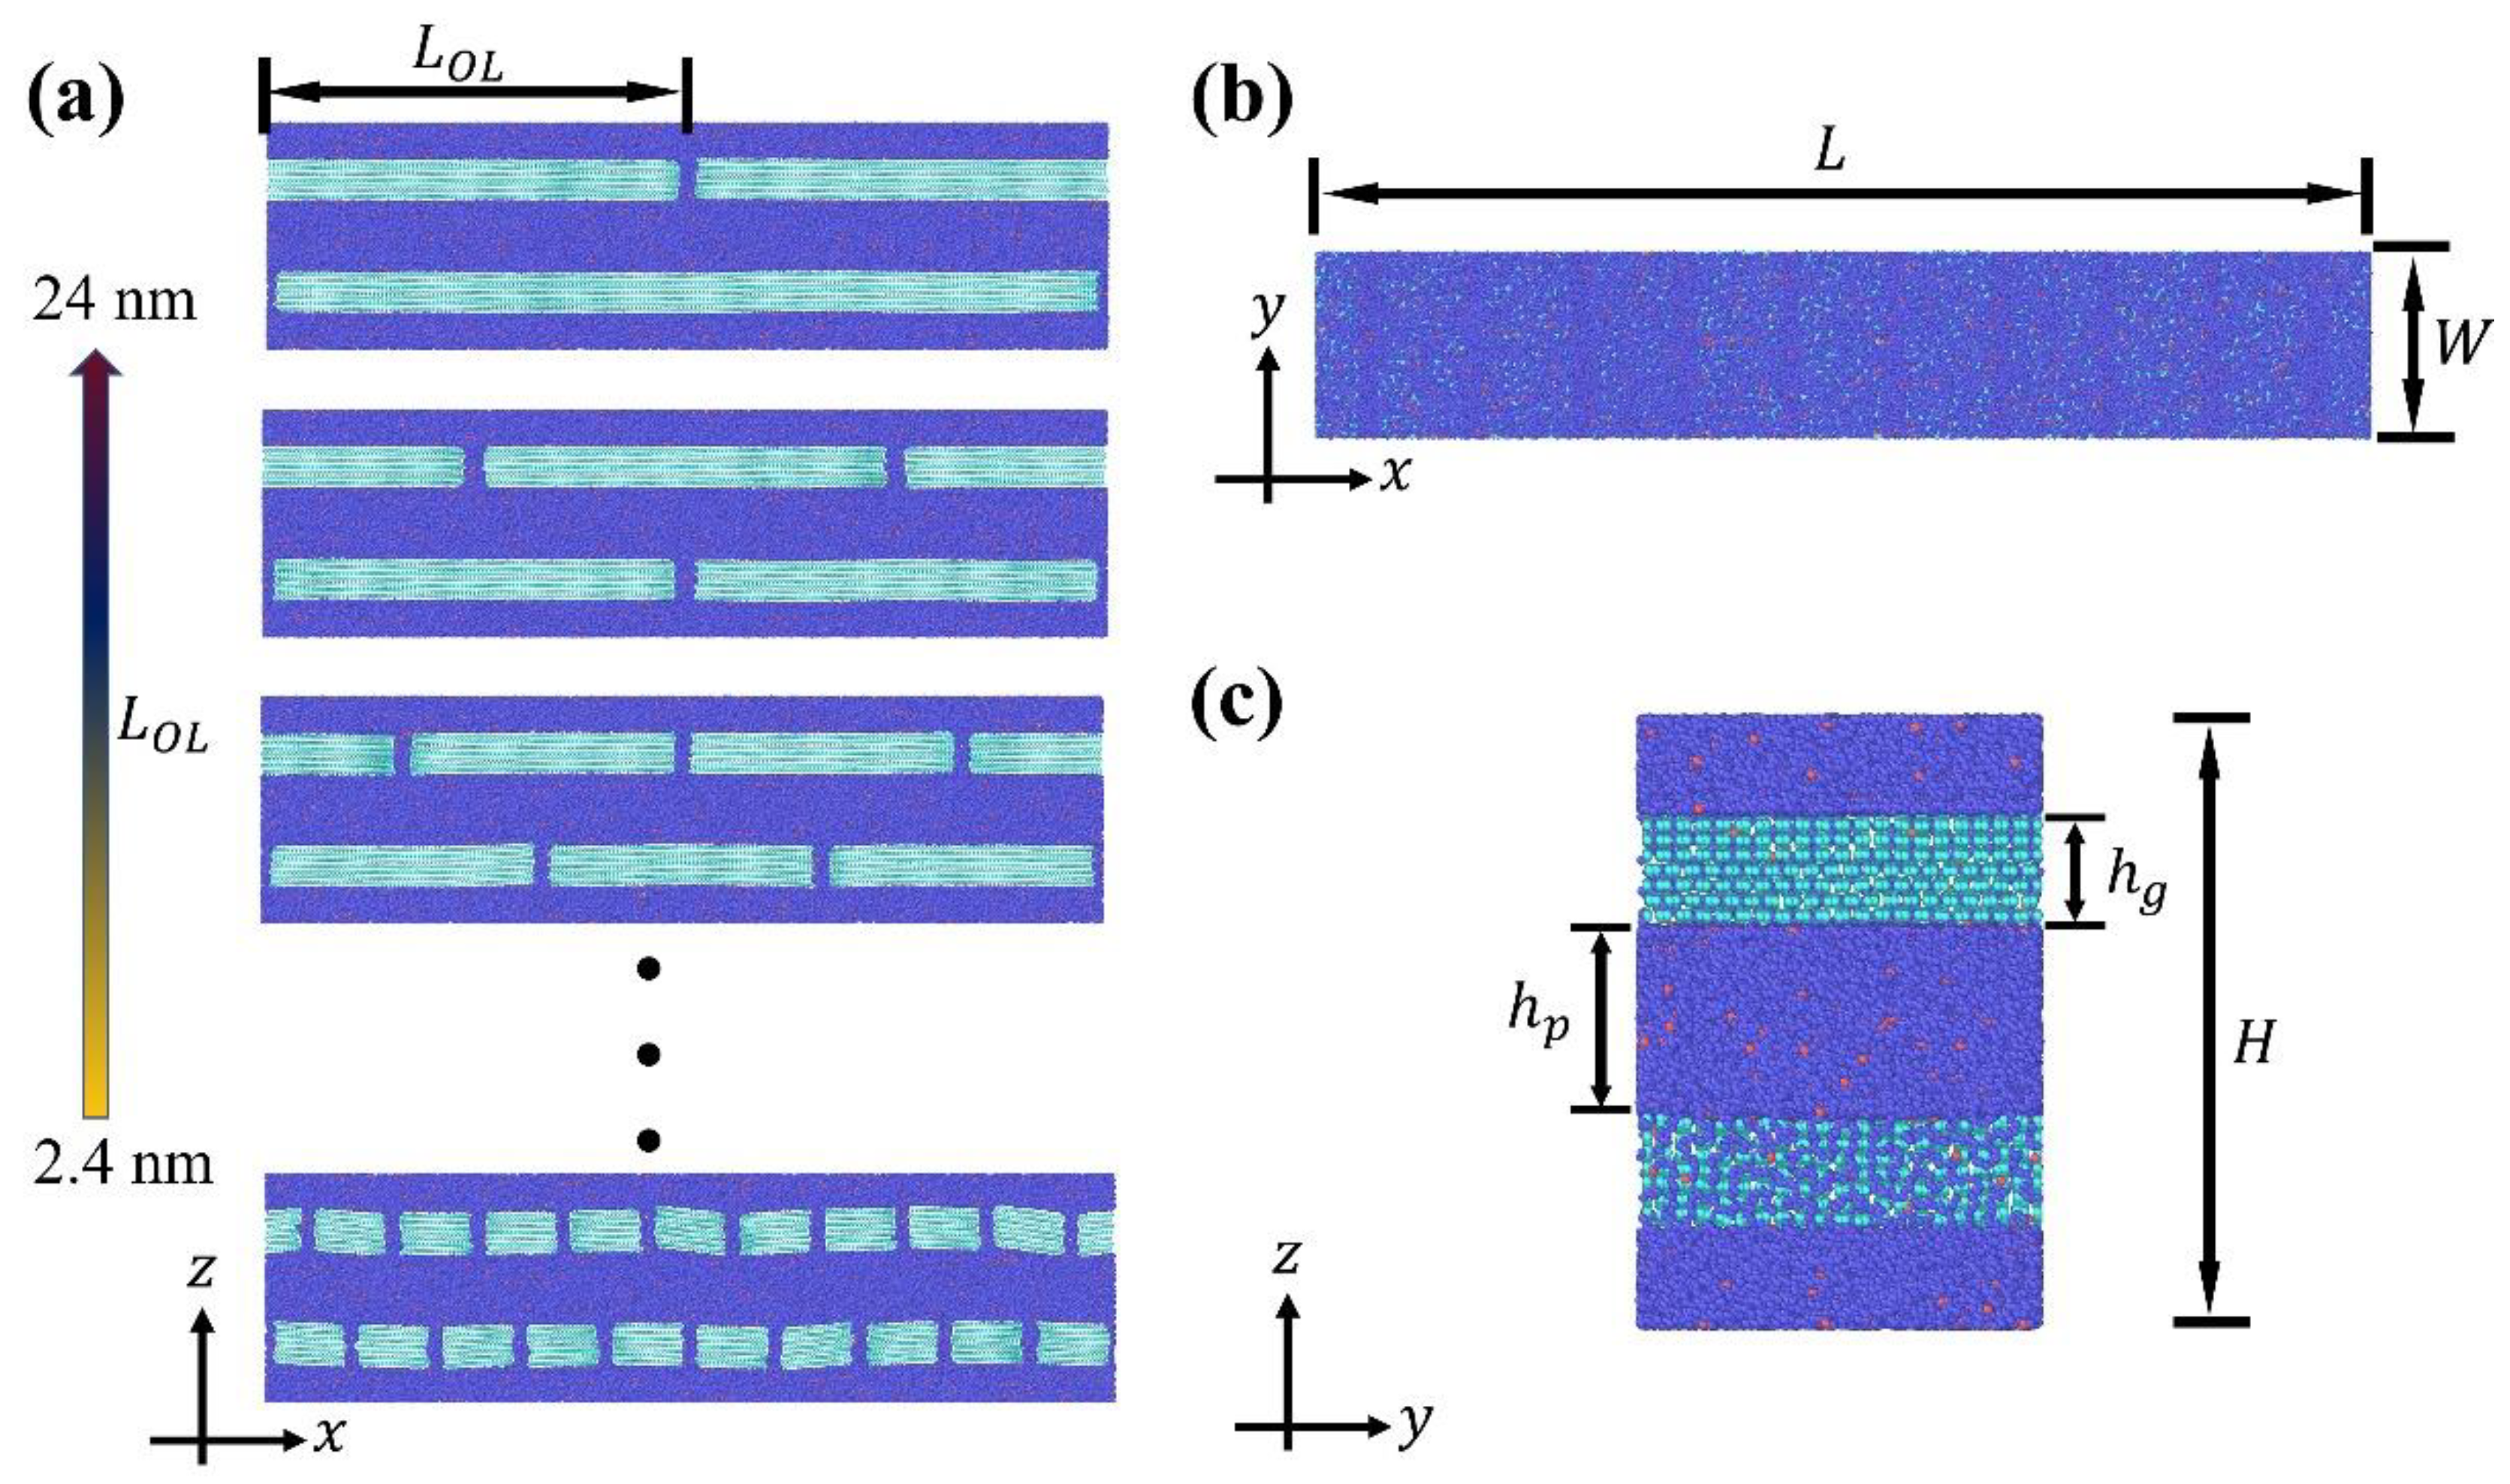
Figure 2.
Average stress-strain curves of nanocomposites with different overlap distance under uniaxial tensile tests.
Figure 2.
Average stress-strain curves of nanocomposites with different overlap distance under uniaxial tensile tests.
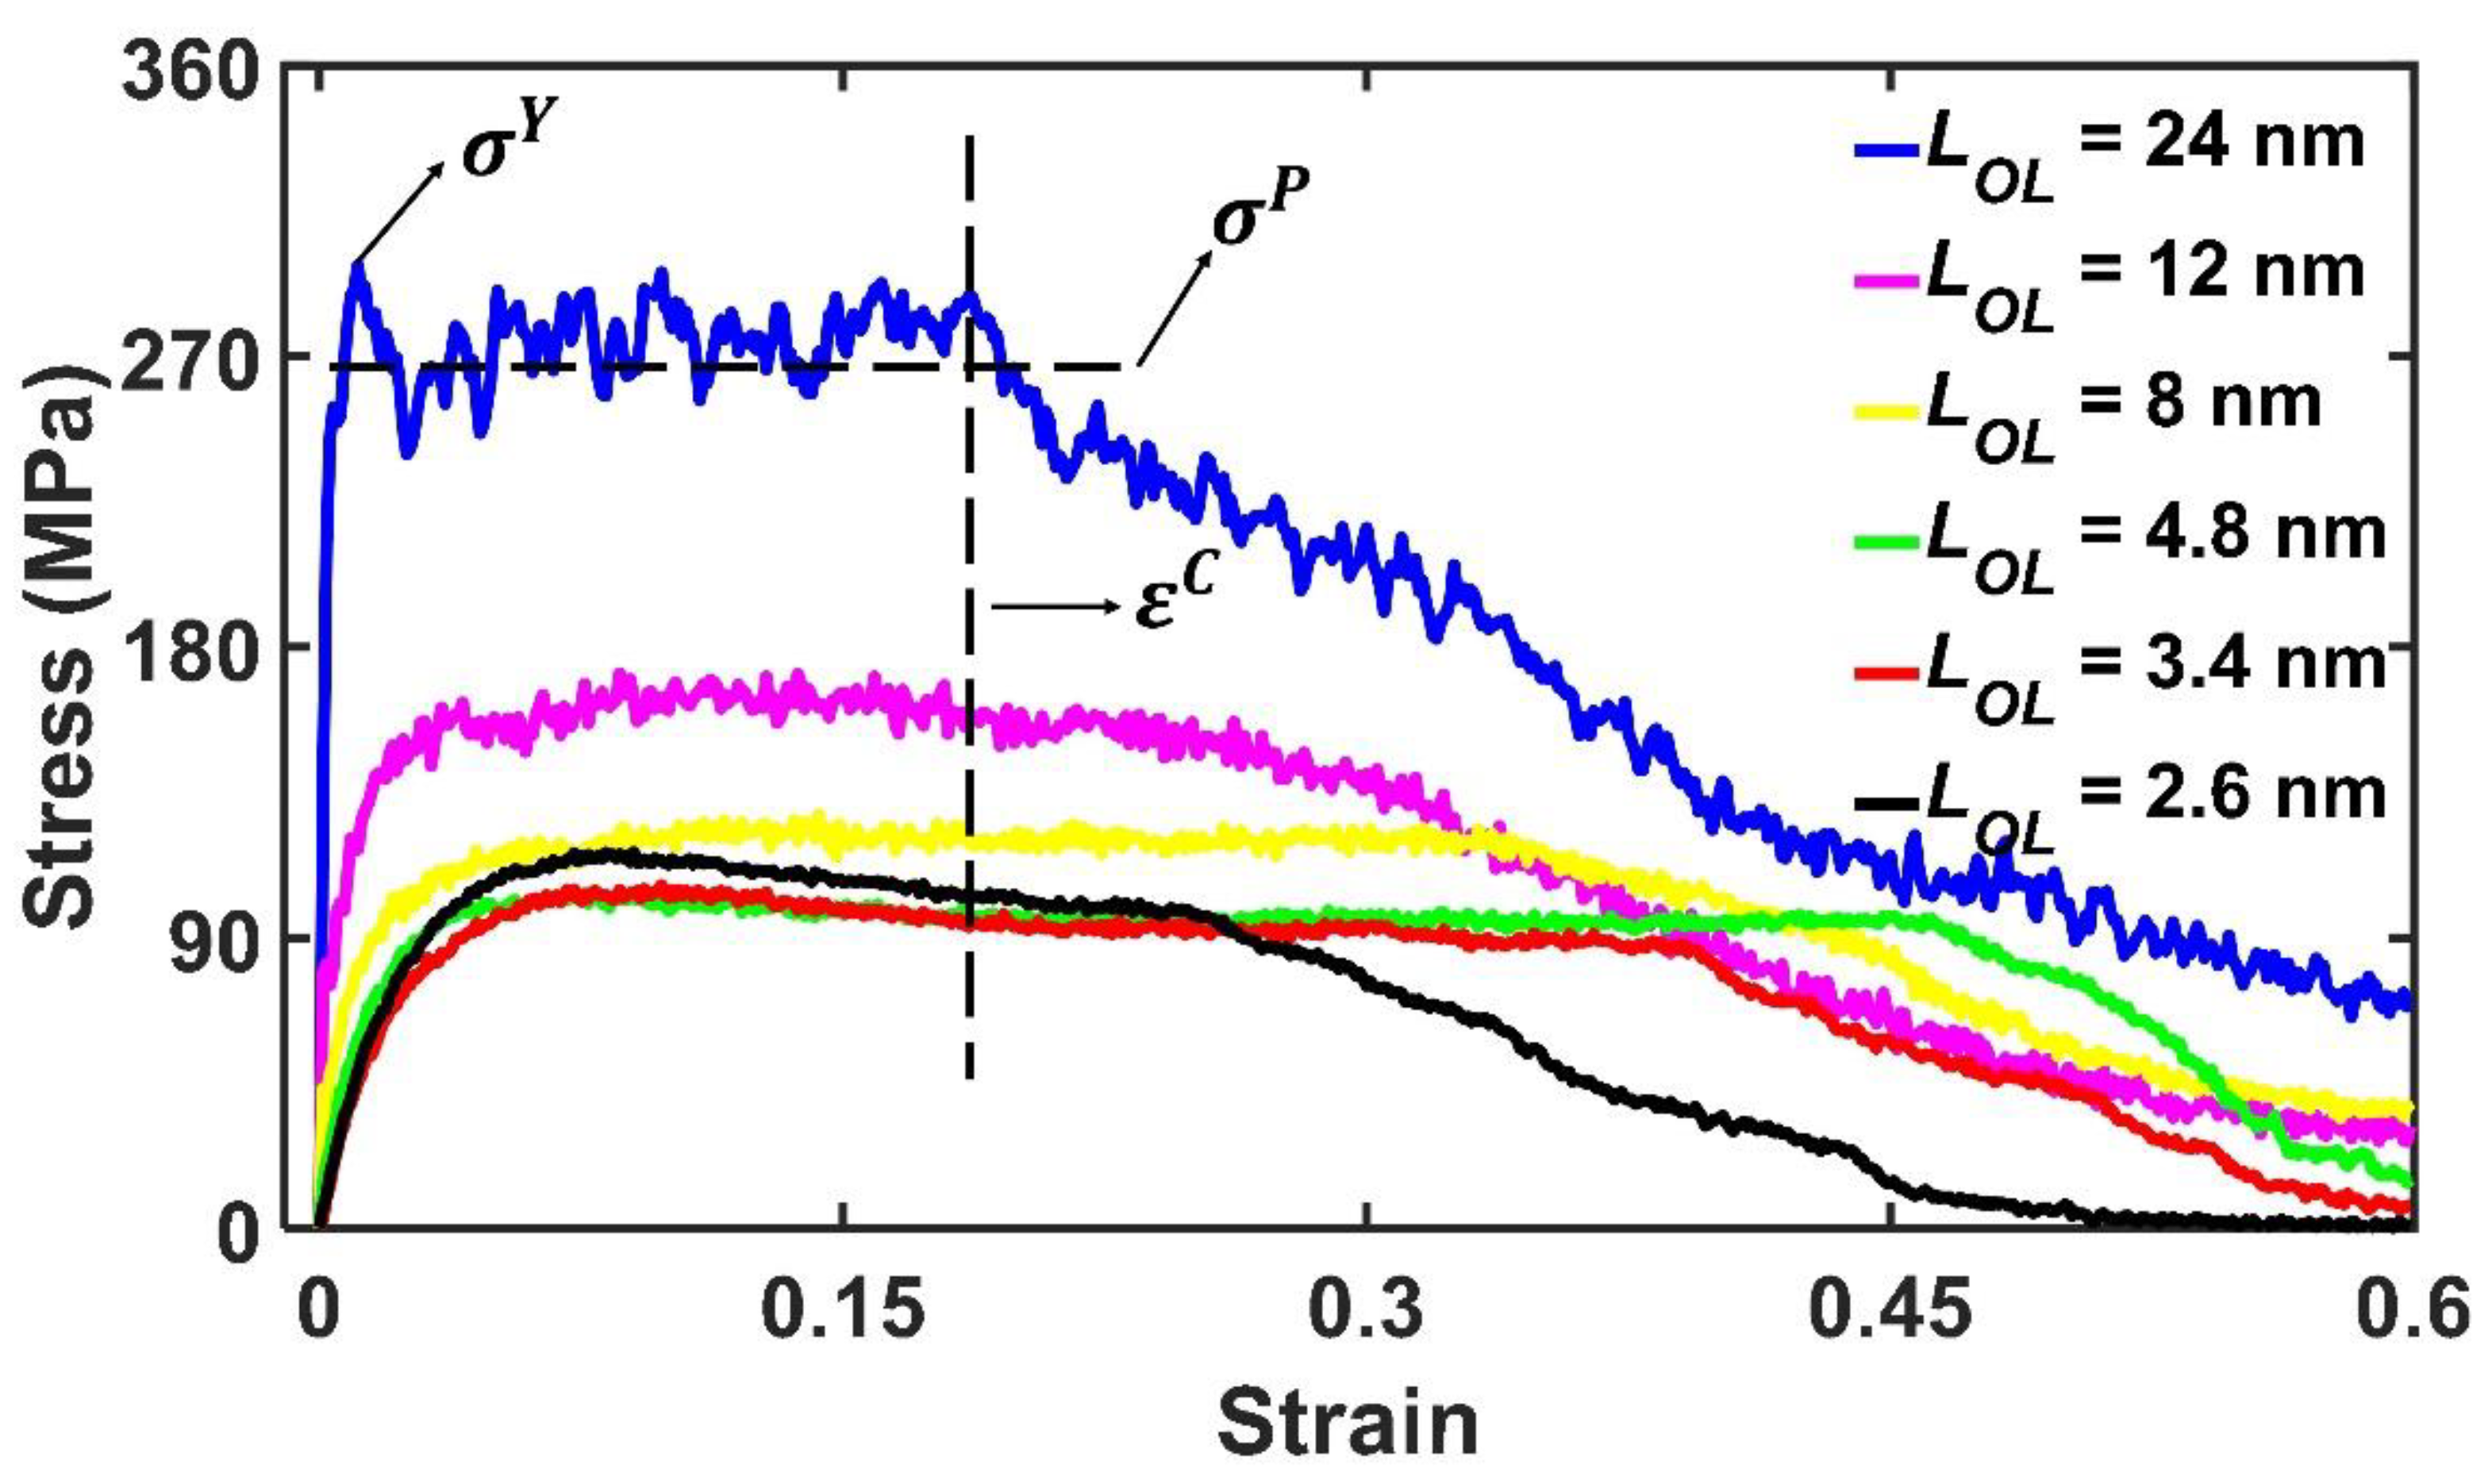
Figure 3.
Strain map of the tensile dynamics for nanocomposites with different overlap distance
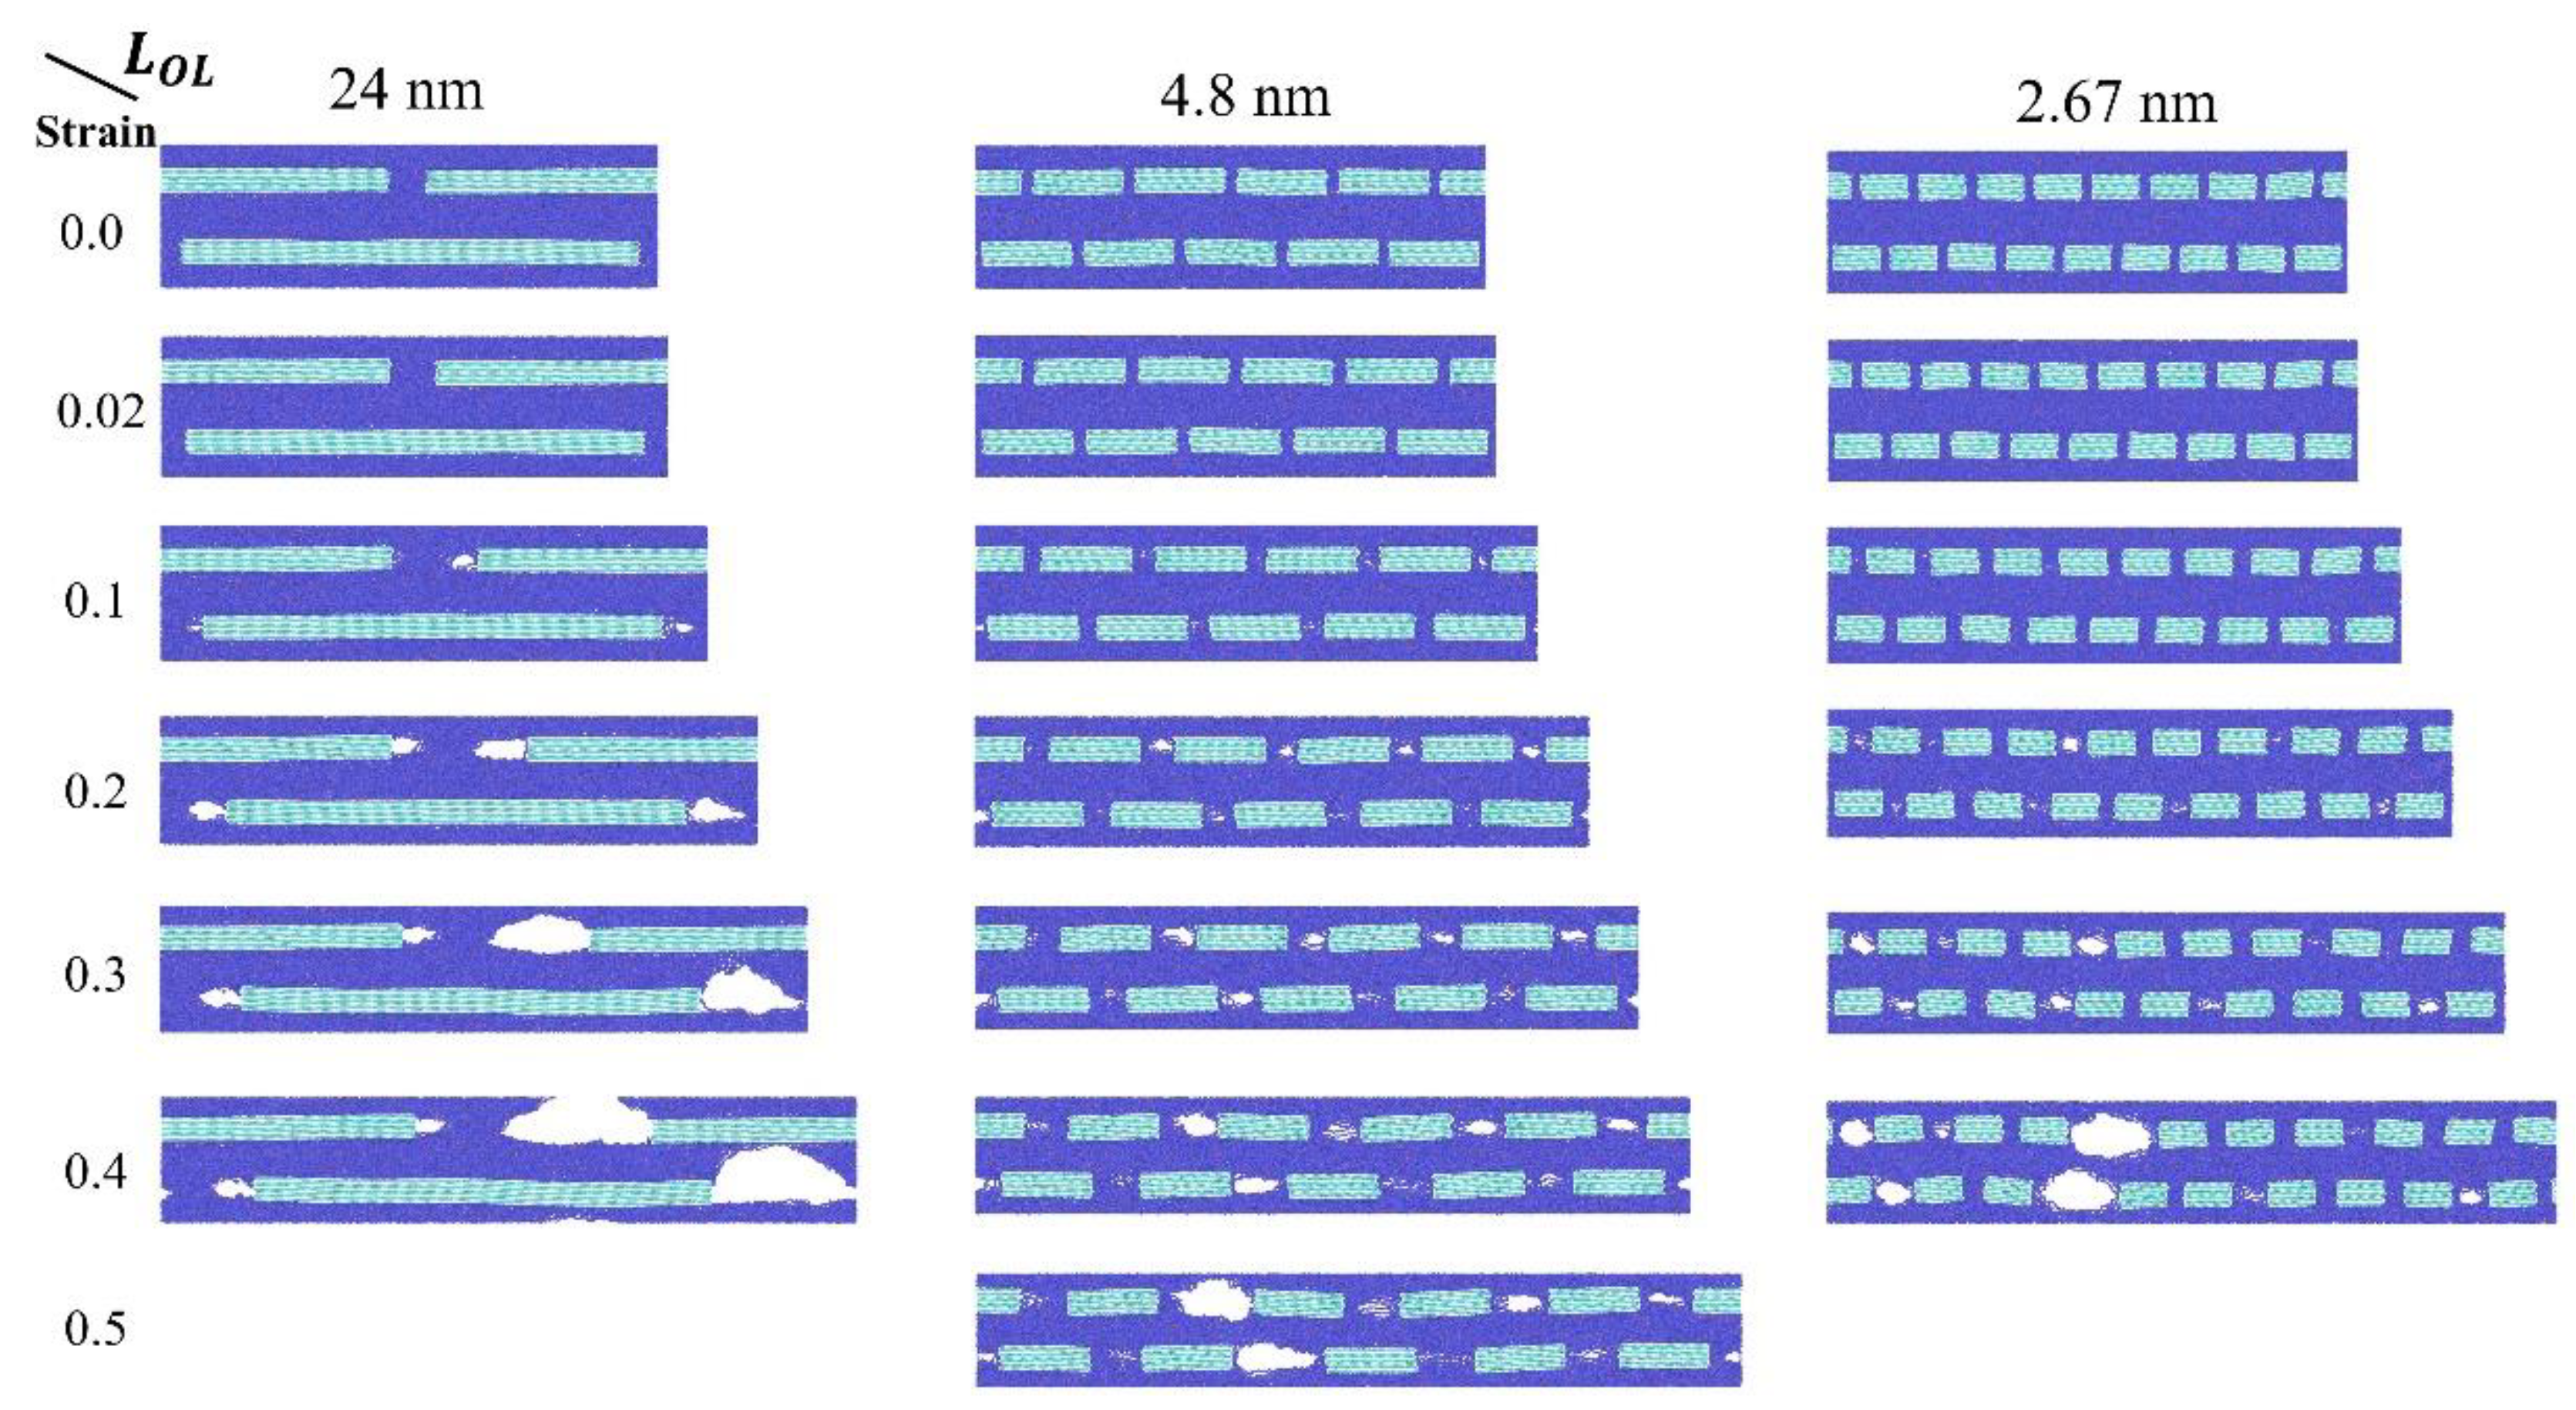
Figure 4.
Overlap distance effect on (a) Yield strength; (b) Critical failure strain; (c) Plateau stress; (d) Toughness.
Figure 4.
Overlap distance effect on (a) Yield strength; (b) Critical failure strain; (c) Plateau stress; (d) Toughness.
Disclaimer/Publisher’s Note: The statements, opinions and data contained in all publications are solely those of the individual author(s) and contributor(s) and not of MDPI and/or the editor(s). MDPI and/or the editor(s) disclaim responsibility for any injury to people or property resulting from any ideas, methods, instructions or products referred to in the content. |
© 2025 by the authors. Licensee MDPI, Basel, Switzerland. This article is an open access article distributed under the terms and conditions of the Creative Commons Attribution (CC BY) license (http://creativecommons.org/licenses/by/4.0/).
Copyright: This open access article is published under a Creative Commons CC BY 4.0 license, which permit the free download, distribution, and reuse, provided that the author and preprint are cited in any reuse.


