
Submitted:
06 January 2025
Posted:
07 January 2025
You are already at the latest version
Abstract
Geopolymer nanocomposites, incorporating pristine graphene-based nanomaterials, are at the forefront of research in advanced construction materials, improving mechanical, electrical, and thermal properties. This study investigates the nucleation mechanisms of geopolymers on pristine graphene substrates, namely graphene reinforced geopolymer nanocomposite (GRGN), by analyzing nanostructure particle sizes, pore size distributions, cluster sizes, and system energy at a pH of 11, compared to a system without graphene nanosheets. Seven distinct monomer species were selected to observe cluster evolution over numerous iterations, providing insights into the dynamic nature of geopolymer nucleation on graphene-based substrates. Thus, the computed adsorption energies, based on the recent DFT studies, reveal interactions between aluminosilicate species and graphene nanomaterials. Furthermore, implementation of energy values from dimerization reactions among monomer species, as reported earlier, introduces tetrahedral geometrical constraints, crucial for understanding how particles aggregate into clusters. The findings indicated that fewer particles participate in cluster formation in the system containing a graphene nanosheet compared to the one without it. However, the system with the graphene nanosheet exhibits more favorable energy. This contrast is likely due to the higher adsorption energy between the graphene nanosheet, and the particles involved in cluster formation. This research underscores the significant potential of geopolymer nanocomposites and their role in shaping the future of construction materials.
Keywords:
geopolymer
; 3D off-lattice coarse-grained Monte Carlo
; graphene reinforced geopolymer nanocomposite
; pH
; nucleation
; graphene-based nanomaterials
1. Introduction
The word “geopolymer,” introduced by Davidovits in 1978 [1], denotes materials formed by combining aluminosilicate powder with a precursor solution of potassium silicate or sodium silicate [2,3]. The initiation of the alkalinization process is significantly influenced by silicate solutions precursors. In the dissolution-precipitation geopolymerization reaction, hydroxyl (OH-) groups in the alkaline solution first break the bonds between silicate and aluminate in the solid aluminosilicate powder material (metakaolin, MK) [4,5]. This is followed by a polycondensation reaction that leads to the creation of an aluminosilicate network [6]. This network comprises interconnected aluminate and silicate (Si) tetrahedra connected by oxygen bridging bonds [3]. Geopolymer binders demonstrate mechanical properties comparable to those of ordinary Portland cement, yet their production generates roughly 80–90% fewer global anthropogenic CO2 emissions. This characteristic establishes geopolymer as a sustainable and eco-friendly substitute for conventional cement [7]. The core chemical and structural properties of geopolymers produced from MK [8], slag, and fly ash are analyzed to evaluate how the selection of raw materials impacts the characteristics of the resulting geopolymer composites [3]. Geopolymers exhibit superior resistance to acid compared to Portland cement, a characteristic frequently highlighted as one of the key advantages of geopolymers [9,10,11]. Additionally, geopolymers possess inherent fire resistance and exhibit exceptional thermal stability, surpassing that of conventional cements [12].
Nanoscale modeling of geopolymers has recently attracted significant interest among researchers [13,14]. Lolli et al. [15] developed an innovative framework for understanding the molecular structure of geopolymers, highlighting the significance of nanoscale interfaces between crystalline and amorphous regions in influencing the material’s mechanical behavior. Izadifar et al. [16] studied a polymerization mechanisms of alkaline aluminosilicate gels using a three-dimensional off-lattice coarse-grained Monte Carlo (CGMC) method, which also enabled the characterization of their nanostructural features, such as particle size distributions and pore size distributions. The input data for this analysis included the Gibbs free energy values of dimerization reactions for four different monomer species, obtained from the literature and computed using the DFT modeling approach as described by White et al. [7,17]. Moreover, Valencia et al. [18] lately employed CGMC simulation method with octree cells for geopolymer nucleation [19] at different pH values. Yang and White [20] employed alkali-activated materials (AAMs), specifically class F fly ash and MK, at the mesoscale using the CGMC simulation method, combined with the DFT computational method. Their findings revealed that in both H-activated fly ash and MK systems, the growth of the gel occurred via the development of medium-sized clusters in conjunction with the expansion of the largest particle. Subsequent to this process, certain small clusters persisted in the pore solution of the solidified gel, with their dimensions determined by the saturation level of pre-dissolved silicate concentrations within the system. Furthermore, Izadifar et al. [4,5] have recently calculated the enthalpy activation energy (ΔH∗) under far-from-equilibrium conditions, utilizing the transition state theory (TST) to determine atomistic reaction rates for silicate tetrahedra dissolution in MK via the (DFT) computational approach [21]. White et al. [22] also employed quantum chemical-based interaction energies, computed via density functional theory computations. They utilized an on-lattice CGMC simulation to investigate the primary stages of gel/cluster formation in sodium silicate systems across various concentrations. Their model implemented on a cubic lattice comprising 125,000 sites in the canonical ensemble (NVT) with periodic boundary conditions, facilitated the assessment of structure evolution resulting from polymerization reactions through Monte-Carlo moves and total system energy minimization.
Materials with two-dimensional structures, like graphene [23], have gained remarkable attention in nanomaterials study because of their exceptional thermal [24,25,26,27], mechanical [28,29,30,31], and electrical properties [32]. The GRGN has been explored across various advanced material applications, including structural health monitoring, structural supercapacitors, hydrogen production, 3D printing, dye wastewater treatment, and concrete, showing promising outcomes [33]. Zhang et al. [34] synthesized a new graphene-bottom-ash-based geopolymer (GBAG) composite using alkaline-activated geopolymerization. The primary aim was to enhance the electrical conductivity of GBAG by integrating graphene into its otherwise non-conductive matrix. Zhong et al. [35] for the first time reported the extrusion based 3D printing of geopolymer/GO nanocomposite structures. Their study showed that incorporating GO significantly alters the rheological behavior of the geopolymer precursor, facilitating the 3D printing of structures with the GO/geopolymer (GOGP) blend, a capability not achievable with pure geopolymer. Thus, the primary aim of the current study is to perform a 3D off-lattice CGMC simulation method, both with (GRGN) and without a pristine graphene nanosheet, to investigate the nucleation mechanism of alkaline aluminosilicate gel in a silicate-activated system. The Gibbs free energy associated with the process of dimerization, derived from a study by White et al. [7], is used for four monomer species of Si(OH)4, Al(OH)4−.Na+, SiO(OH)3−.Na+.3H2O, and SiO2(OH)22−.2Na+.6H2O. Furthermore, we incorporated the adsorption energy (Ead), including van der Waals (vdW) interactions between a pristine graphene nanosheet and four monomer species, as detailed in Table 1 of the recent study by Izadifar et al. [36], to investigate the nucleation process in this study. Each monomer type is modeled as a separate coarse-grained particle type to investigate the evolution of gel structure across varying numbers of iterations. We explore pH value of 11, employing an expanded simulation system with Octree cell expansion to enhance accuracy. The system’s total energy is calculated at various iterations, offering valuable insights into its behavior. Moreover, we analyze the formation of clusters and the dissolution of MK over 56,000,000 iterations. The final structure is analyzed to evaluate cluster size distribution and pore network features.
2. Simulation Model and Method
2.1. Atomistic Model Preparation
The off-lattice CGMC method begins by defining the number of particles for the four different monomer species, based on the selected activated solution and pH level. For the chosen silicate-activated system, the contributions of water as well as Na (68.4%), silicate in solution (10.6%), and MK (21.0%) have been acquired from the data (shown in Table 3) provided by White et al. [7]. For this, a cubic simulation box with a size of 100 Å was selected, and the percentage of each type of monomer specie was computed. For the silicate-activated system, the contribution of silicate in the solution and MK are equivalent to the simulation boxes with dimensions of 47.32, and 59.43 Å, respectively. Hence, the total count of silicate monomers in solution and MK particles (in a simplified crystal arrangement) within the simulation box, with average diameters of 3.3 and 4 Å, are determined as 2744 and 2744, respectively. Given the three types of silicate monomers in solution, namely Si(OH)4, SiO(OH)3-.Na+.3H2O, SiO2(OH)22-.2Na+.6H2O, the distribution percentages of these three contributed silicate monomer types (2744 particles in total) to maintain the pH at 11 are computed as 5%, 90%, and 5%, respectively [37]. These percentages translate to particle numbers of 137, 2470, and 137 respectively, as per Figure 5 published by Sefcik and McCormick [37]. Furthermore, the proportion of particles in MK present as alumina (aluminum oxide) and silica (silicon dioxide) are determined to be 42% (1152 particles) and 58% (1592 particles), respectively [7]. Moreover, the adsorption energy (Ead) incorporating van der Waals (vdW) dispersion forces between pristine graphene nanosheet and four monomer species of Si(OH)4, Al(OH)4−.Na+, SiO(OH)3−.Na+.3H2O, and SiO2(OH)22−.2Na+.6H2O extracted form Table 1, reported by Izadifar et al. [36].
2.2. Monte Carlo Approach: Implementation in MATLAB Code
A custom MATLAB code [38,39] was created to manage and analyze data within exclusive cells following an Octree pattern, as depicted in Figure 1. To include data from adjacent cells, a neighbor relationship was defined, where two sites were considered neighbors only if they shared a common face; adjacency via an edge or corner not being sufficient. This methodology ensured that all interactions between clusters and monomers across cells were captured. It is also worth mentioning that all the reported numbers from section 2.1 concerning silicate monomers in solution, as well as silica and alumina particles from MK must be divided by 8 partitions, each represents as a subsystem according to Octree pattern. Figure 2 provides a detailed side view where two subsystems share particles involved in the geopolymerization process. The software tracked detailed information during the simulation, covering monomer specifications, cluster dynamics, system energy fluctuations, and the complex MK dissolution process. Post-simulation analysis involved using the global scan method to extract cluster size distribution. A refined pore network model was constructed, assuming idealized spherical pores, with monomers and dimers considered as aqueous species, as reported by White et al. [7]. Particle structure digitization utilized a watershed algorithm and city-block distance transform function (Figure 3). Subsequently, the analysis of pore connectivity and size distribution was conducted based on the approach detailed by Izadifar et al. [16]. The system’s overall energy was evaluated using the Gibbs free energy associated with dimerization, as documented by White et al. [7].
2.3. Octree Cells Approach: MATLAB Program Development
Models based on atomistic theory often face challenges in capturing mesoscale phenomena in zeolites due to the high computational costs involved in simulating across the necessary length scales [2]. The principal aim is to explore particle behavior during polymerization processes by employing a simplified mechanical model.. This investigation is essential for understanding nanoparticle formation, as larger system sizes are required to produce statistically meaningful results. Furthermore, simplified models enable a more concentrated examination of particular system characteristics [40]. The simulation methodology used in this study builds upon our former research [16] with a system size of 100x100x100 Å3. To facilitate this, an octree cell structure with an initial partitioning level was developed, enabling parallel simulation, which is commonly utilized in High-Performance Computing (HPC) environments. Specifically, eight identical simulations were executed simultaneously, each with 7,000,000 iterations, and at the end, their results were combined for a thorough structural analysis. (as detailed in Section 2.2). The use of Octree patterns considerably lowered the memory demands for the CGMC solver when simulating large-scale systems, balancing the reduction of artificial effects in smaller lattice simulations with achieving convergence in a rational time frame [18].
2.4. Density Functional Theory (DFT) Computational Modeling Method
Density functional theory (DFT) [41] computations modeling method was conducted to determine the geometrical parameters of the silicate and aluminate monomers (refer to Figure 4). The Vienna ab initio simulation package (VASP) [42,43,44,45,46] was utilized, employing the projected-augmented wave (PAW) method [47] and pseudopotential to model electron-ion interaction. The electron exchange and correlation functional were selected based on the generalized gradient approximation (GGA) with the Perdew−Burke−Ernzerhof (PBE) parametrization [48]. The Brillouin zone was sampled using a well-converged k-sampling equivalent, given by 1 × 1 × 1 Monkhorst-Pack k-points mesh size for the entire system [49]. A plane-wave cutoff energy of 400 eV was employed for structural relaxations, ensuring convergence. The electronic self-consistent cycles convergence criterion was set at 10-6 eV, while ion relaxation continued until forces fell below 10-3 eV/Å. Additionally, structural analysis was carried out using the three-dimensional visualization software VESTA [50].
3. Results and Discussions
The distances between bonded atoms and the angles formed by these bonds, computed through DFT calculations, are detailed in Table A1-2 from our recent study, respectively [18]. Based on tetrahedral formation, we calculated β angles of 135.12° and 138.28° for the dimerization reactions of Si3-O11-Al1 and Si1-O4-Si2 (as shown in Figure 4), respectively. For Si-O and Al-O bonds in tetrahedral monomer formation, we considered mean values of bond lengths of 1.65 and 1.76 Å, respectively, which define the radius of coarse-grained particles specific to each particle type. Additionally, mean angles of 108° and 107° were assumed for O-Al-O and O-Si-O angles in formation of tetrahedral monomer, respectively, specifying each particle pairing type. The process of polycondensation brings the monomers together, leading them to connect at a single point—the shared center of the bonding oxygen between both particles (as illustrated in Figure 4). At pH 11, images capturing the evolution of the two geopolymer systems including without and with the contribution of graphene nanosheet at a certain number of iterations of 0, 40,000, 80,000, and 56,000,000 are observed from Figure 5A-B, respectively. The coarse-grained particles representing various monomer building units are color-coded as follows: Si(OH)4 particles are depicted in cyan, SiO(OH)3-.Na+.3H2O particles in blue, SiO2(OH)22-.2Na+.6H2O particles in green, and Al(OH)4-.Na+ particles in red. The final equilibrium condition was reached after 56 million iterations. The percentage of total particles involved in gel formation (cluster formation) was found to be 59.48% without the contribution of a graphene nanosheet and 57.27% with the contribution of a graphene nanosheet. Figure 6 depicts the equilibrium conditions observed during the energy computation for the silicate-activated system at pH 11, both with and without the contribution of a graphene nanosheet, after 8 million iterations within the solution, excluding MK.
Indeed, this pre-equilibrium condition was conducted for dissolved activator silicates. It is notable that the system containing pristine graphene nanosheet exhibited a lower energy of -819 kJ/mol compared to the system without the contribution of graphene nanosheet, indicating a more favorable condition. As depicted in Figure 7, the moment when MK is introduced into the system is marked as iteration 0. In other words, pre-equilibration condition obtained from iteration 8,000,000 (as shown in Figure 6) has been set to iteration 0 with the MK involvement as shown in Figure 7. Therefore, the system’s energy at the simulation’s outset is not zero, indicating the pre-equilibration process, involving the silicate monomers in the solution as an activator, is examined.
Figure 7 indicates a swift reduction in energy, implying the dissolution of MK particles and the initiation of the polymerization process, where aluminum monomers from the MK particles play a crucial role. After 500,000 iterations, the energy trend begins to stabilize, and by 56 million iterations, the energy values for the systems, both with and without the presence of the graphene nanosheet converge completely to values of -13,997 kJ/mol, and 14,228 kJ/mol, respectively. Figure 8 depicts the variation in the percentage of aluminate and silicate monomers for two systems, one with graphene contribution and one without, at pH 11 throughout the simulation. At the initiation of MK dissolution, the concentration of aluminate monomers remains at zero for both systems with and without the contribution of a graphene nanosheet, as all aluminate particles are initially contained within the MK particle. In contrast, the total concentration of silicate monomers present in both systems from the pre-equilibrium condition at 8 million iterations is 36.42% (without graphene nanosheet) and 36.80% (with graphene nanosheet). These starting values represent the quantity of silicate monomers within the solution. Over time, the concentrations of aluminate and silicate monomers rise significantly due to the dissolution of the precursors. The highest amount of silicate monomers in the solution are 51.87% at iteration of 16,000 (with graphene nanosheet), and 51.00% (without graphene nanosheet) at iteration of 15,200.
Moreover, the highest amount of aluminate presented as monomers in the solution reach to 14.37% (with graphene nanosheet), and 14.27% (without graphene nanosheet) at iteration of 17,600. After 56 million iterations, the number of monomers in the solution decreased due to the cluster formation. It was observed that the remaining aluminate and silicate monomers in the solution was fewer in the system without graphene nanosheet compared to the system with graphene nanosheet. To enhance comprehension of the varying silicate contributions to the cluster formation over time, Figure 9 illustrates the total number of silicate monomer species over different iterations. The three different types of monomer species, namely Si(OH)4, SiO(OH)3-.Na+.3H2O, and SiO2(OH)22-.2Na+.6H2O contributed 1.80, 32.81, and 1.80% (total 36.41%, as depicted in Figure 8) at the beginning of the simulation for the system without graphene nanosheet, respectively. In the case of graphene nanosheet contribution, the same previously monomer species contributed 1.82, 32.48, and 1.82% (total 36.12%, as depicted in Figure 8), respectively. It is also worth reporting that the amount of SiO(OH)3-.Na+.3H2O in the solution after 8 million pre-equilibrium condition and at the beginning of MK dissolution is high (32.81% for system without graphene, and 32.48% for the system including graphene nanosheet) due to its high contribution equals to 90% (as explained earlier in section 2.1) in the silicate-activated system.
The highest amount of these three silicate monomer presented at 15,200 iterations due to MK dissolution, and at the end after 56 million iterations, the amount of SiO(OH)3-.Na+.3H2O decreased to 30.96%, and 32.26% for both systems without and with the incorporation of a graphene nanosheet, respectively. Figure 10 illustrates the trend of total particles present as monomer and cluster during 56 million iterations for both systems, with and without the incorporation of a graphene nanosheet. It is essential to note that graphene particles have not been factored into the reported percentage of monomers and clusters contribution for the system including graphene nanosheet, as the role of graphene is crucial for adsorption of different species onto it. The point where both monomers and clusters achieved an equal percentage (50%) occurred at 466,400 iterations for the system with the graphene nanosheet and at 398,400 iterations for the system without it. After 56 million iterations, it is evident that the number of particles participating in cluster formation is lower in the system with graphene nanosheet (57.27%) compared to the system without it (59.48%). Conversely, the energy of the system including graphene nanosheet is more favorable (more negative) (-14,228 kJ/mol) than the system without graphene (-13,997 kJ/mol), as depicted in Figure 7. This discrepancy can be attributed to the higher adsorption energy between the graphene nanosheet and particles contributing to cluster formation.
Figure 11 illustrates the progression of existing MK particles during the dissolution process for both systems, with and without the presence of graphene nanosheet. The total dissolution of MK at various iterations has been observed for both systems, with and without the inclusion of a graphene nanosheet. The main reason of various computed iterations for MK dissolution obtained from both systems, can be attributed to the fact that the MK dissolution can be accepted or rejected. After a random MK particle dissolution (either alumina or silica), the system checks for overlaps with other particles. If no overlap is detected, the particle movement is accepted within the Monte Carlo (MC) framework if the total system energy after the move is lower than the energy before the move. If the energy increases (becomes less negative), the movement may still be accepted based on the probability X, which is compared to a randomly selected value between 0 and 1. The probability X is determined using the Boltzmann factor for the change in configuration, as shown in equation 1, where kB represents the Boltzmann constant, T is the temperature, and ΔE is the energy change.
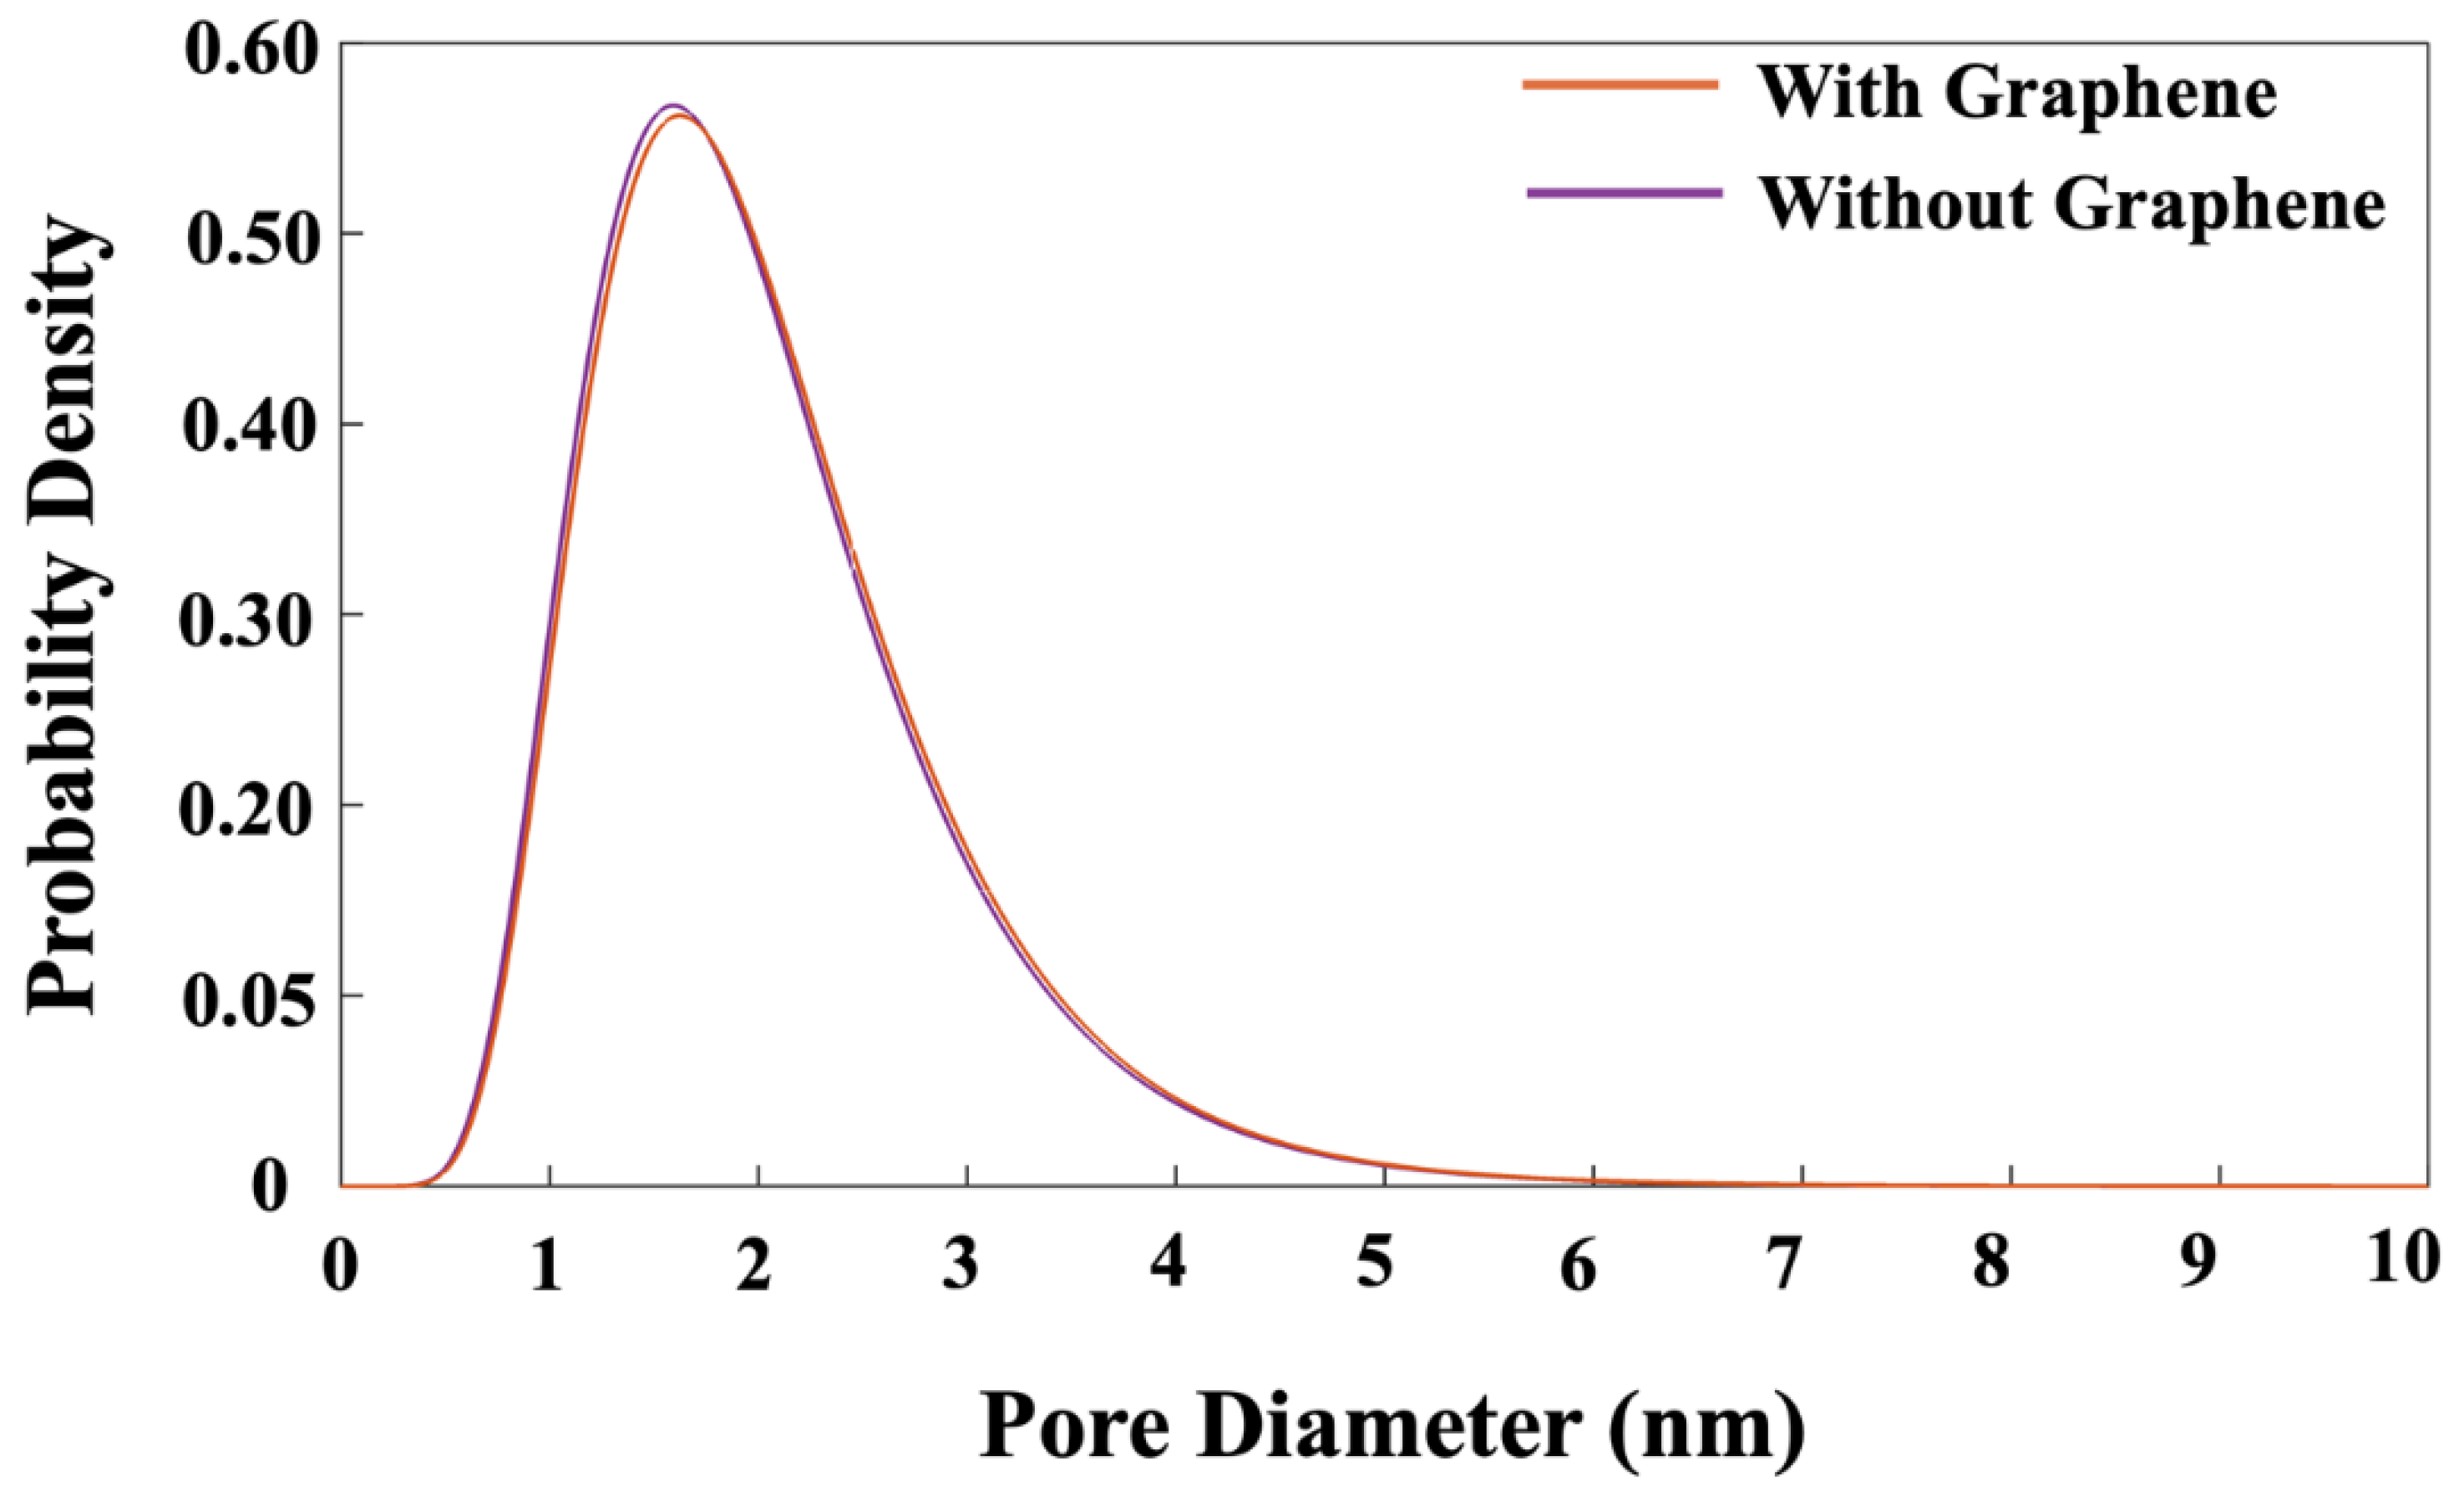
If the movement is not accepted, the particle will return to its original position (MK), and the loop for the next step will begin. In the next step, a particle is randomly selected, and it is moved in any direction to a new position while ensuring that the connections between particles maintain the tetrahedral structure. The displacement of the particle is determined by generating a random number between zero and one, which is then multiplied by the radius of the moving particle. It is also worth mentioning that particles participate into cluster formation, when the distance between the moved particle and its nearest neighbor is within 1 Å. The system’s total energy is then recalculated to determine whether it has increased or decreased as a result of this change as described above. After every 20 iterations, the pH of system is also checked to make sure to maintain the pH of the system at 11. If the pH is changed, the pH must be accordingly controlled by 5% (Si(OH)4), 90% (SiO(OH)3-.Na+.3H2O), and 5% (SiO2(OH)22-.2Na+.6H2O) [37]. Figure 12 also plotted to illustrate the distribution of pore sizes for both systems. The pore size distribution in both systems exhibits a similar trend. At a high probability density of 56.5%, pore diameters of 1.62, and 1.57 nm were observed for the systems with and without the incorporation of a graphene nanosheet, respectively.
4. Conclusions
This research explored the nucleation of aluminosilicate gel using the off-lattice coarse-grained Monte Carlo (CGMC) method, both with (GRGN) and without graphene nanosheets, at a system pH of 11. The tetrahedral geometry and binding energy parameters of aluminate and silicate monomers were derived from DFT simulations. To efficiently scale up the CGMC system sizes, a method employing the Octree cell approach was developed, significantly reducing computational time and taking full advantage of parallel high-performance computing. The results revealed that the proportion of particles involved in cluster formation was lower in the system with graphene compared to the one without it. In contrast, the system containing graphene displayed a more favorable energy state, which can be ascribed to the stronger adsorption energy between the graphene nanosheet and the particles participating in cluster formation. Additionally, the complete dissolution of MK required more iterations in the system with graphene than in the system without it. Regarding pore size distribution, both systems showed a similar trend, with pore diameters of 1.62 nm and 1.57 nm at a high probability density of 56.5% for the systems with and without graphene, respectively.
Acknowledgements
The authors gratefully appreciate the financial support from the DFG (Deutsche Forschungsgemeinschaft) German national science foundation for the NanoGP project “Multiscale modeling of advanced nano-reinforced geopolymer/CNTs materials” under project number 446266595. The authors also acknowledge Nicolas Castrillon Valencia for development of MATLAB code. Computational work was conducted on the Lichtenberg High-Performance Computer at TU Darmstadt.
Declaration of Competing Interest
The authors declare that they have no known competing financial interests or personal relationships that could have appeared to influence the work reported in this paper.
References
- J. Davidovits, “Geopolymers: Inorganic polymeric new materials,” Journal of Thermal Analysis, vol. 37, no. 8, pp. 1633–1656, Aug. 1991. [CrossRef]
- S. Chitsaz and A. Tarighat, “Molecular dynamics simulation of N-A-S-H geopolymer macro molecule model for prediction of its modulus of elasticity,” Construction and Building Materials, vol. 243, p. 118176, May 2020. [CrossRef]
- P. Duxson, A. Fernández-Jiménez, J. L. Provis, G. C. Lukey, A. Palomo, and J. S. J. van Deventer, “Geopolymer technology: the current state of the art,” J Mater Sci, vol. 42, no. 9, pp. 2917–2933, May 2007. [CrossRef]
- M. Izadifar, N. Ukrainczyk, and E. Koenders, “Silicate Dissolution Mechanism from Metakaolinite Using Density Functional Theory,” Nanomaterials, vol. 13, no. 7, Art. no. 7, Mar. 2023. [CrossRef]
- M. Izadifar, N. Ukrainczyk, and E. Koenders, “Atomistic Insights into Silicate Dissolution of Metakaolinite under Alkaline Conditions: Ab Initio Quantum Mechanical Investigation,” Langmuir, vol. 40, no. 37, pp. 19332–19342, Sep. 2024. [CrossRef]
- A. Buchwald, H.-D. Zellmann, and Ch. Kaps, “Condensation of aluminosilicate gels—model system for geopolymer binders,” Journal of Non-Crystalline Solids, vol. 357, no. 5, pp. 1376–1382, Mar. 2011. [CrossRef]
- C. E. White, J. L. Provis, T. Proffen, and J. S. J. van Deventer, “Molecular mechanisms responsible for the structural changes occurring during geopolymerization: Multiscale simulation,” AIChE J., vol. 58, no. 7, pp. 2241–2253, Jul. 2012. [CrossRef]
- M. Izadifar et al., “COMPREHENSIVE EXAMINATION OF DEHYDROXYLATION OF KAOLINITE, DISORDERED KAOLINITE, AND DICKITE: EXPERIMENTAL STUDIES AND DENSITY FUNCTIONAL THEORY,” Clays and Clay Minerals, vol. 68, no. 4, pp. 319–333, 2020. [CrossRef]
- T. Bakharev, “Resistance of geopolymer materials to acid attack,” Cement and Concrete Research, vol. 35, no. 4, pp. 658–670, Apr. 2005. [CrossRef]
- N. Ukrainczyk, M. Muthu, O. Vogt, and E. Koenders, “Geopolymer, Calcium Aluminate, and Portland Cement-Based Mortars: Comparing Degradation Using Acetic Acid,” Materials, vol. 12, no. 19, p. 3115, Sep. 2019. [CrossRef]
- A. Koenig, A. Herrmann, S. Overmann, and F. Dehn, “Resistance of alkali-activated binders to organic acid attack: Assessment of evaluation criteria and damage mechanisms,” Construction and Building Materials, vol. 151, pp. 405–413, Oct. 2017. [CrossRef]
- M. Amran, S.-S. Huang, S. Debbarma, and R. S. M. Rashid, “Fire resistance of geopolymer concrete: A critical review,” Construction and Building Materials, vol. 324, p. 126722, Mar. 2022. [CrossRef]
- M. R. Sadat, K. Muralidharan, G. N. Frantziskonis, and L. Zhang, “From atomic-scale to mesoscale: A characterization of geopolymer composites using molecular dynamics and peridynamics simulations,” Computational Materials Science, vol. 186, p. 110038, Jan. 2021. [CrossRef]
- J. Henon, F. Pennec, A. Alzina, J. Absi, D. S. Smith, and S. Rossignol, “Analytical and numerical identification of the skeleton thermal conductivity of a geopolymer foam using a multi-scale analysis,” Computational Materials Science, vol. 82, pp. 264–273, Feb. 2014. [CrossRef]
- F. Lolli, H. Manzano, J. L. Provis, M. C. Bignozzi, and E. Masoero, “Atomistic Simulations of Geopolymer Models: The Impact of Disorder on Structure and Mechanics,” ACS Appl. Mater. Interfaces, vol. 10, no. 26, pp. 22809–22820, Jul. 2018. [CrossRef]
- M. Izadifar, N. C. Valencia, P. Xiao, N. Ukrainczyk, and E. Koenders, “3D Off-Lattice Coarse-Grained Monte Carlo Simulations for Nucleation of Alkaline Aluminosilicate Gels,” Materials, vol. 16, no. 5, Art. no. 5, Feb. 2023. [CrossRef]
- C. E. White, J. L. Provis, G. J. Kearley, D. P. Riley, and J. S. J. Van Deventer, “Density functional modelling of silicate and aluminosilicate dimerisation solution chemistry,” Dalton Trans., vol. 40, no. 6, Art. no. 6, 2011. [CrossRef]
- N. C. Valencia, M. Izadifar, N. Ukrainczyk, and E. Koenders, “Coarse-Grained Monte Carlo Simulations with Octree Cells for Geopolymer Nucleation at Different pH Values,” Materials, vol. 17, no. 1, p. 95, Dec. 2023. [CrossRef]
- L. Prasittisopin and I. Sereewatthanawut, “Effects of seeding nucleation agent on geopolymerization process of fly-ash geopolymer,” Front. Struct. Civ. Eng., vol. 12, no. 1, pp. 16–25, Mar. 2018. [CrossRef]
- K. Yang and C. E. White, “Modeling the Formation of Alkali Aluminosilicate Gels at the Mesoscale Using Coarse-Grained Monte Carlo,” Langmuir, vol. 32, no. 44, pp. 11580–11590, Nov. 2016. [CrossRef]
- M. Izadifar, J. S. Dolado, P. Thissen, N. Ukrainczyk, E. Koenders, and A. Ayuela, “Theoretical Elastic Constants of Tobermorite Enhanced with Reduced Graphene Oxide through Hydroxyl vs Epoxy Functionalization: A First-Principles Study,” J. Phys. Chem. C, vol. 127, no. 36, pp. 18117–18126, Sep. 2023. [CrossRef]
- C. E. White, J. L. Provis, T. Proffen, and J. S. J. van Deventer, “Quantitative Mechanistic Modeling of Silica Solubility and Precipitation during the Initial Period of Zeolite Synthesis,” J. Phys. Chem. C, vol. 115, no. 20, pp. 9879–9888, May 2011. [CrossRef]
- K. S. Novoselov et al., “Electric Field Effect in Atomically Thin Carbon Films,” Science, vol. 306, no. 5696, pp. 666–669, 2004. [CrossRef]
- A. A. Balandin et al., “Superior Thermal Conductivity of Single-Layer Graphene,” Nano Letters, vol. 8, no. 3, pp. 902–907, Mar. 2008. [CrossRef]
- B. Mortazavi, “Ultra high stiffness and thermal conductivity of graphene like C3N,” Carbon, vol. 118, pp. 25–34, 2017. [CrossRef]
- B. Mortazavi, M. Pötschke, and G. Cuniberti, “Multiscale modeling of thermal conductivity of polycrystalline graphene sheets,” Nanoscale, vol. 6, no. 6, pp. 3344–3352, 2014. [CrossRef]
- B. Mortazavi and S. Ahzi, “Thermal conductivity and tensile response of defective graphene: A molecular dynamics study,” Carbon, vol. 63, pp. 460–470, Nov. 2013. [CrossRef]
- C. Lee, X. Wei, J. W. Kysar, and J. Hone, “Measurement of the Elastic Properties and Intrinsic Strength of Monolayer Graphene,” Science, vol. 321, no. 5887, pp. 385–388, 2008. [CrossRef]
- B. Mortazavi and G. Cuniberti, “Atomistic modeling of mechanical properties of polycrystalline graphene,” Nanotechnology, vol. 25, no. 21, p. 215704, May 2014. [CrossRef]
- M. Izadifar et al., “Fracture toughness of various percentage of doping of boron atoms on the mechanical properties of polycrystalline graphene: A molecular dynamics study,” Physica E: Low-dimensional Systems and Nanostructures, vol. 114, p. 113614, 2019. [CrossRef]
- M. Izadifar, R. Abadi, A. N. Jam, and T. Rabczuk, “Investigation into the effect of doping of boron and nitrogen atoms in the mechanical properties of single-layer polycrystalline graphene,” Computational Materials Science, vol. 138, pp. 435–447, 2017. [CrossRef]
- J. R. Williams, L. DiCarlo, and C. M. Marcus, “Quantum Hall Effect in a Gate-Controlled p-n Junction of Graphene,” Science, vol. 317, no. 5838, pp. 638–641, 2007. [CrossRef]
- R. S. Krishna, J. Mishra, B. Nanda, S. K. Patro, A. Adetayo, and T. S. Qureshi, “The role of graphene and its derivatives in modifying different phases of geopolymer composites: A review,” Construction and Building Materials, vol. 306, p. 124774, Nov. 2021. [CrossRef]
- Y. J. Zhang, P. Y. He, M. Y. Yang, and L. Kang, “A new graphene bottom ash geopolymeric composite for photocatalytic H 2 production and degradation of dyeing wastewater,” International Journal of Hydrogen Energy, vol. 42, no. 32, pp. 20589–20598, Aug. 2017. [CrossRef]
- J. Zhong, G.-X. Zhou, P.-G. He, Z.-H. Yang, and D.-C. Jia, “3D printing strong and conductive geo-polymer nanocomposite structures modified by graphene oxide,” Carbon, vol. 117, pp. 421–426, 2017. [CrossRef]
- M. Izadifar, W. Sekkal, L. Dubyey, N. Ukrainczyk, A. Zaoui, and E. Koenders, “Theoretical Studies of Adsorption Reactions of Aluminosilicate Aqueous Species on Graphene-Based Nanomaterials: Implications for Geopolymer Binders,” ACS Appl. Nano Mater., p. acsanm.3c02438, Sep. 2023. [CrossRef]
- J. Šefčík and A. V. McCormick, “Thermochemistry of aqueous silicate solution precursors to ceramics,” AIChE J., vol. 43, no. S11, pp. 2773–2784, 1997. [CrossRef]
- M. Izadifar, N. Ukrainczyk, K. M. Salah Uddin, B. Middendorf, and E. Koenders, “Dissolution of β-C2S Cement Clinker: Part 2 Atomistic Kinetic Monte Carlo (KMC) Upscaling Approach,” Materials, vol. 15, no. 19, p. 6716, Sep. 2022. [CrossRef]
- M. Izadifar, N. Ukrainczyk, K. Salah Uddin, B. Middendorf, and E. Koenders, “Dissolution of Portlandite in Pure Water: Part 2 Atomistic Kinetic Monte Carlo (KMC) Approach,” Materials, vol. 15, no. 4, p. 1442, Feb. 2022. [CrossRef]
- M. Jorge, S. M. Auerbach, and P. A. Monson, “Modeling Spontaneous Formation of Precursor Nanoparticles in Clear-Solution Zeolite Synthesis,” J. Am. Chem. Soc., vol. 127, no. 41, Art. no. 41, Oct. 2005. [CrossRef]
- W. Kohn and L. J. Sham, “Self-Consistent Equations Including Exchange and Correlation Effects,” Phys. Rev., vol. 140, no. 4A, p. A1133—-A1138, Nov. 1965. [CrossRef]
- G. Kresse and J. Hafner, “Ab initio molecular dynamics for liquid metals,” Phys. Rev. B, vol. 47, no. 1, pp. 558–561, Jan. 1993. [CrossRef]
- G. Kresse and J. Furthmüller, “Efficiency of ab-initio total energy calculations for metals and semiconductors using a plane-wave basis set,” Computational Materials Science, vol. 6, no. 1, pp. 15–50, 1996. [CrossRef]
- G. Kresse and J. Furthmüller, “Efficient iterative schemes for ab initio total-energy calculations using a plane-wave basis set,” Phys. Rev. B, vol. 54, no. 16, pp. 11169–11186, Oct. 1996. [CrossRef]
- J. Hafner, “Ab-initio simulations of materials using VASP: Density-functional theory and beyond,” J Comput Chem, vol. 29, no. 13, pp. 2044–2078, Oct. 2008. [CrossRef]
- G. Sun, J. Kürti, P. Rajczy, M. Kertesz, J. Hafner, and G. Kresse, “Performance of the Vienna ab initio simulation package (VASP) in chemical applications,” Journal of Molecular Structure: THEOCHEM, vol. 624, no. 1–3, pp. 37–45, Apr. 2003. [CrossRef]
- G. Kresse and D. Joubert, “From ultrasoft pseudopotentials to the projector augmented-wave method,” Phys. Rev. B, vol. 59, no. 3, pp. 1758–1775, Jan. 1999. [CrossRef]
- J. P. Perdew, K. Burke, and M. Ernzerhof, “Generalized Gradient Approximation Made Simple,” Phys. Rev. Lett., vol. 77, no. 18, pp. 3865–3868, Oct. 1996. [CrossRef]
- H. J. Monkhorst and J. D. Pack, “Special points for Brillouin-zone integrations,” Phys. Rev. B, vol. 13, no. 12, pp. 5188–5192, Jun. 1976. [CrossRef]
- K. Momma and F. Izumi, “ıt VESTA: a three-dimensional visualization system for electronic and structural analysis,” Journal of Applied Crystallography, vol. 41, no. 3, pp. 653–658, Jun. 2008. [CrossRef]
Figure 1.
The system is split into eight regions, with each region representing a subsystem, and arranged in an Octree configuration.
Figure 1.
The system is split into eight regions, with each region representing a subsystem, and arranged in an Octree configuration.
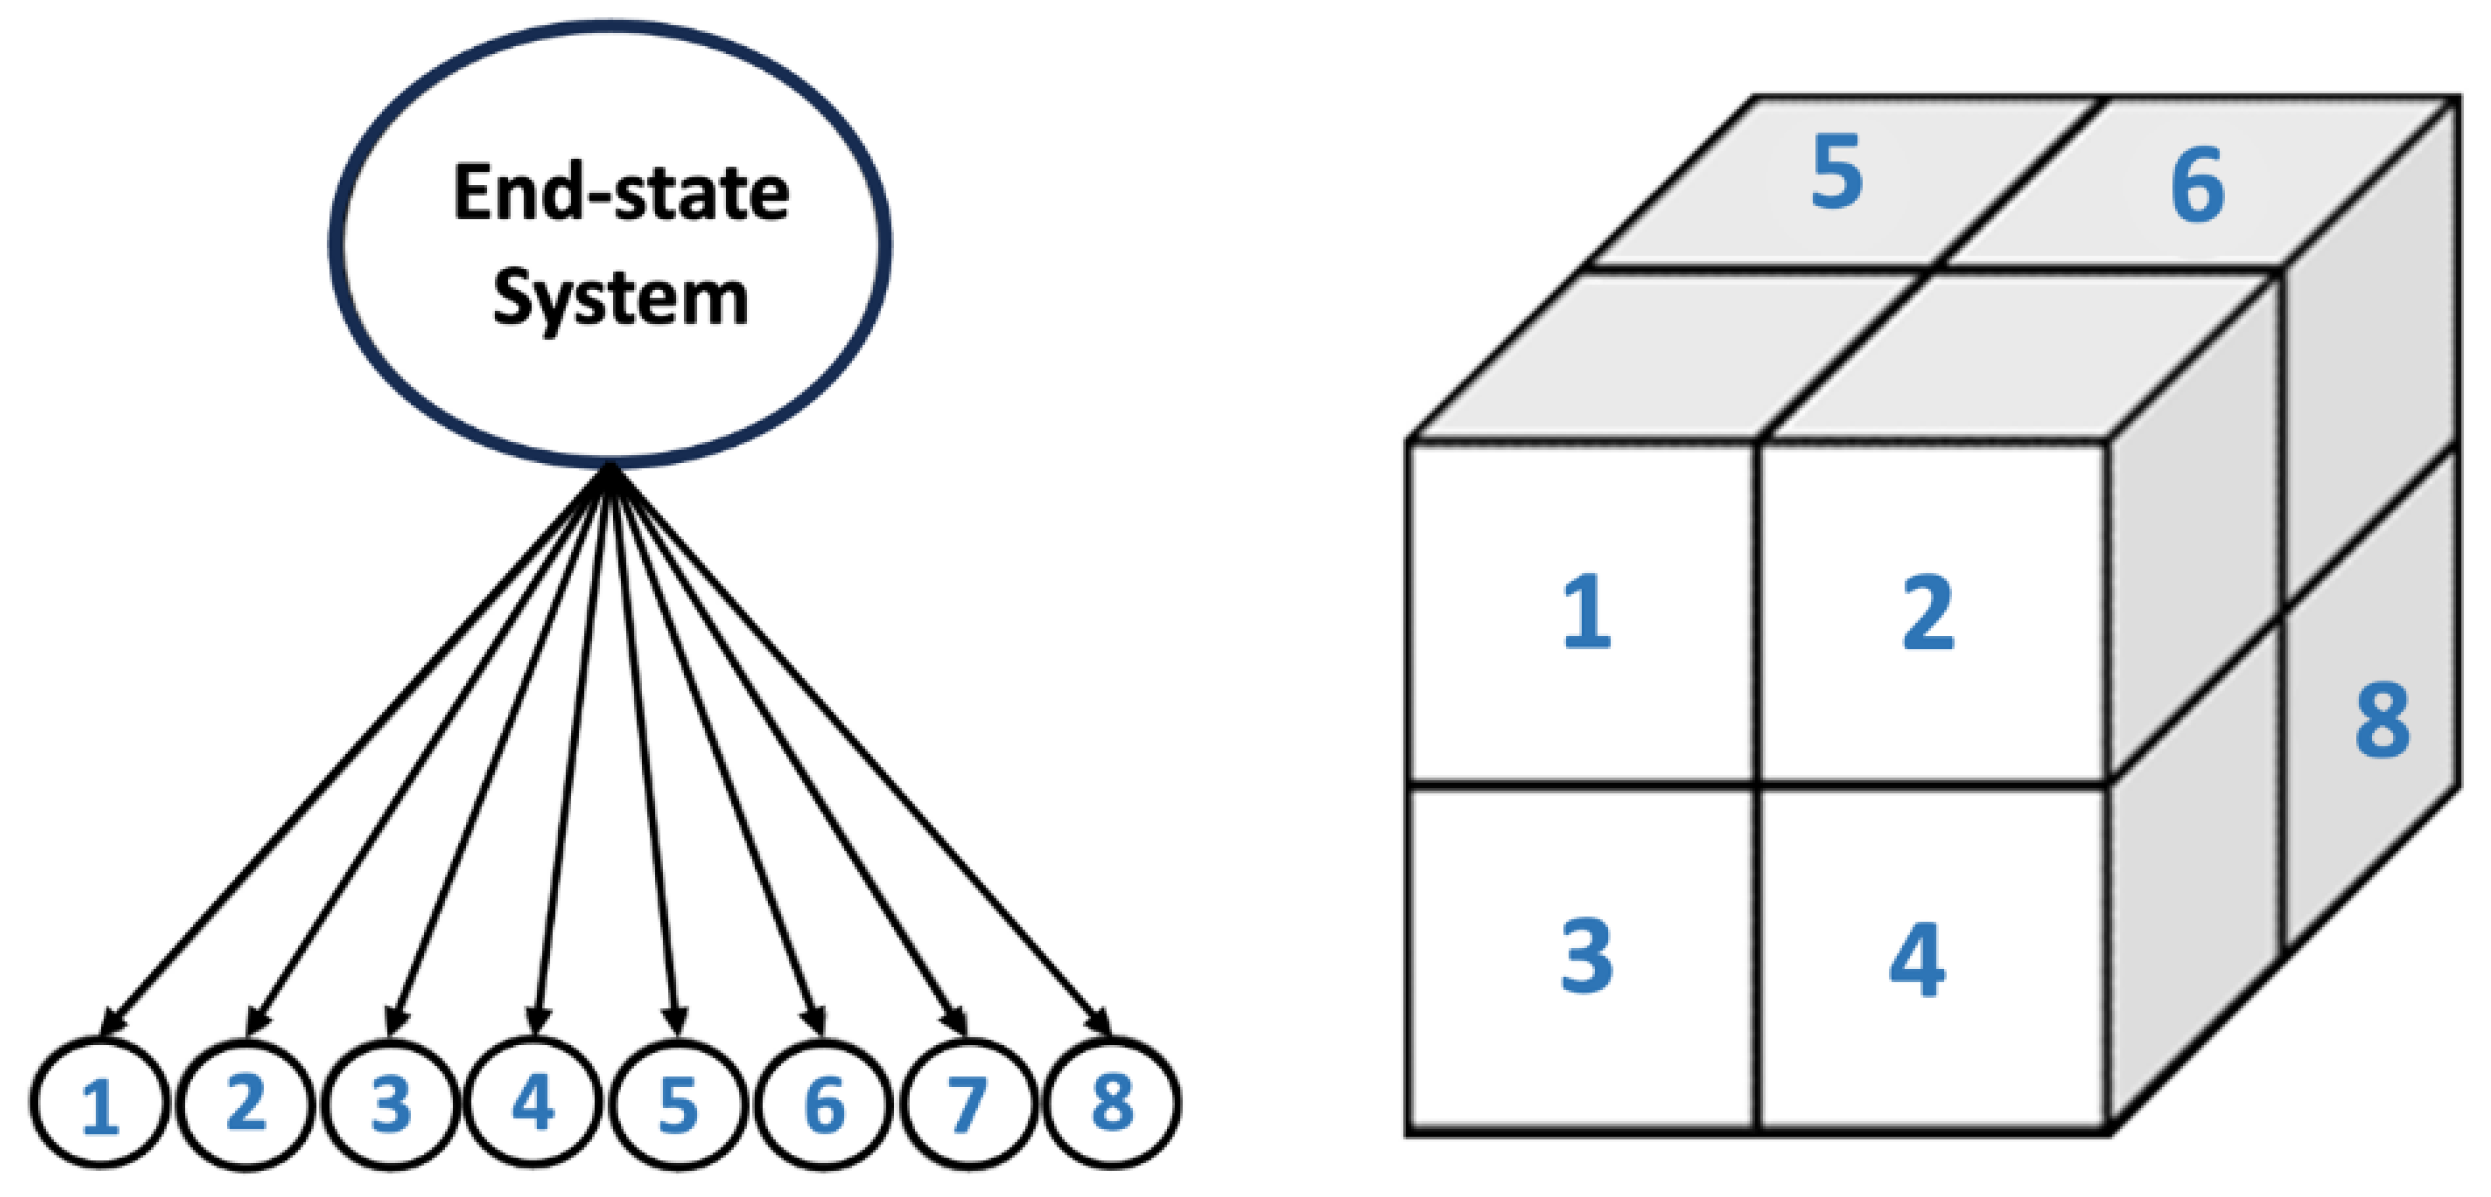
Figure 2.
The pH11 system is depicted in a side view, providing a close-up of the interface planes within the octree simulation cell structure. Particles positioned at the boundaries of each subsystem are connected to adjacent cells, enhancing the overall interconnectivity of the system.
Figure 2.
The pH11 system is depicted in a side view, providing a close-up of the interface planes within the octree simulation cell structure. Particles positioned at the boundaries of each subsystem are connected to adjacent cells, enhancing the overall interconnectivity of the system.
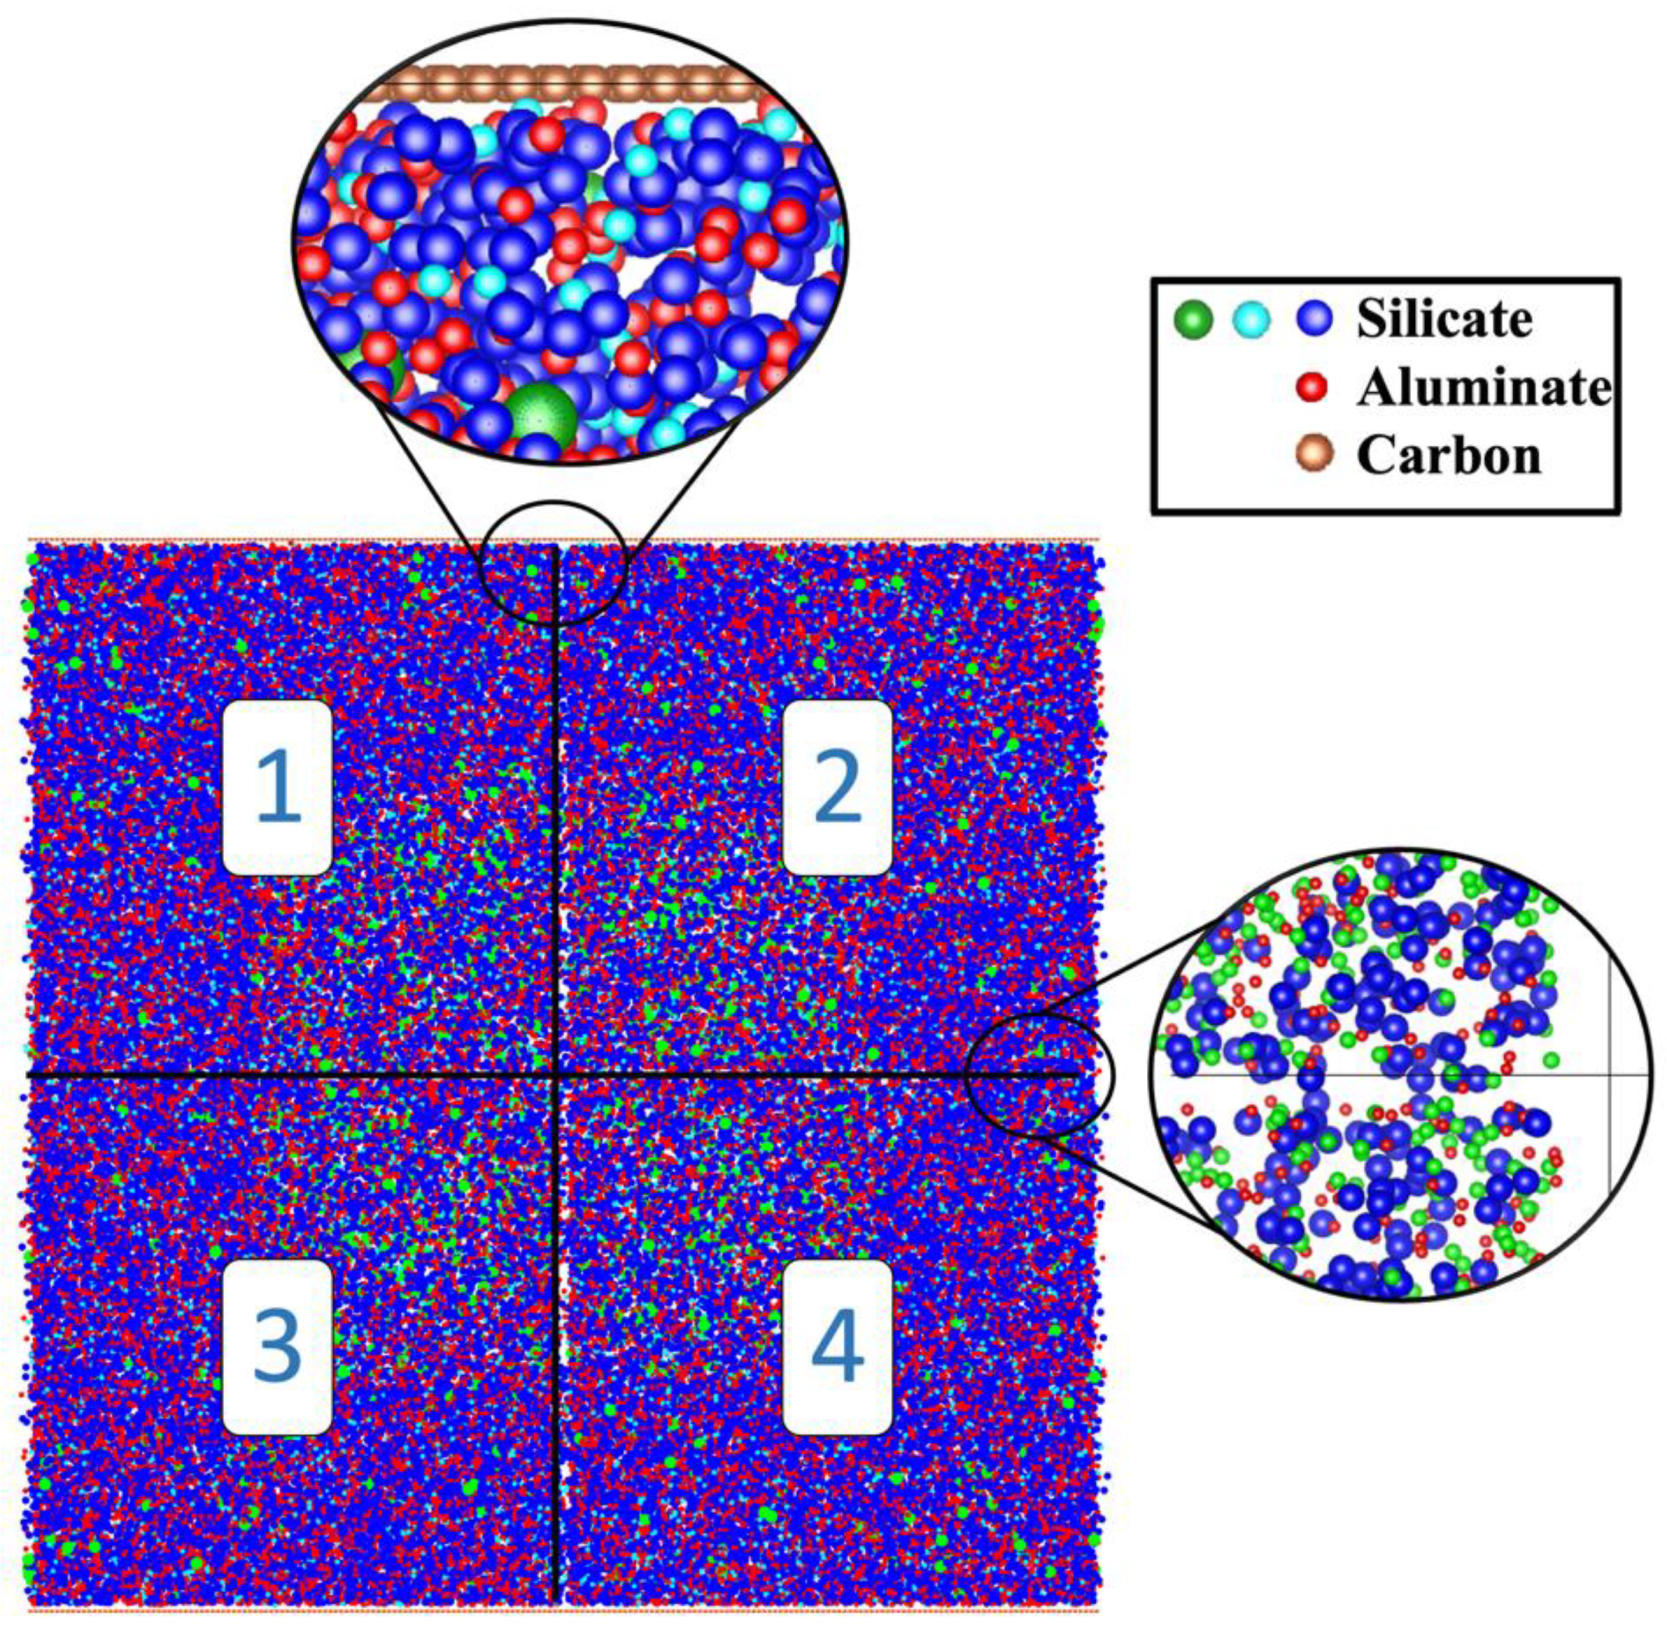
Figure 3.
The concluding simulation snapshot at pH 11 displays clusters, particles, and pore distribution on the right side. On the left side, the calculation of pore size distribution is detailed: dark aquamarine-colored particles represent coarse-grained monomer particles (without distinguishing types), while yellow particles indicate pore sizes.
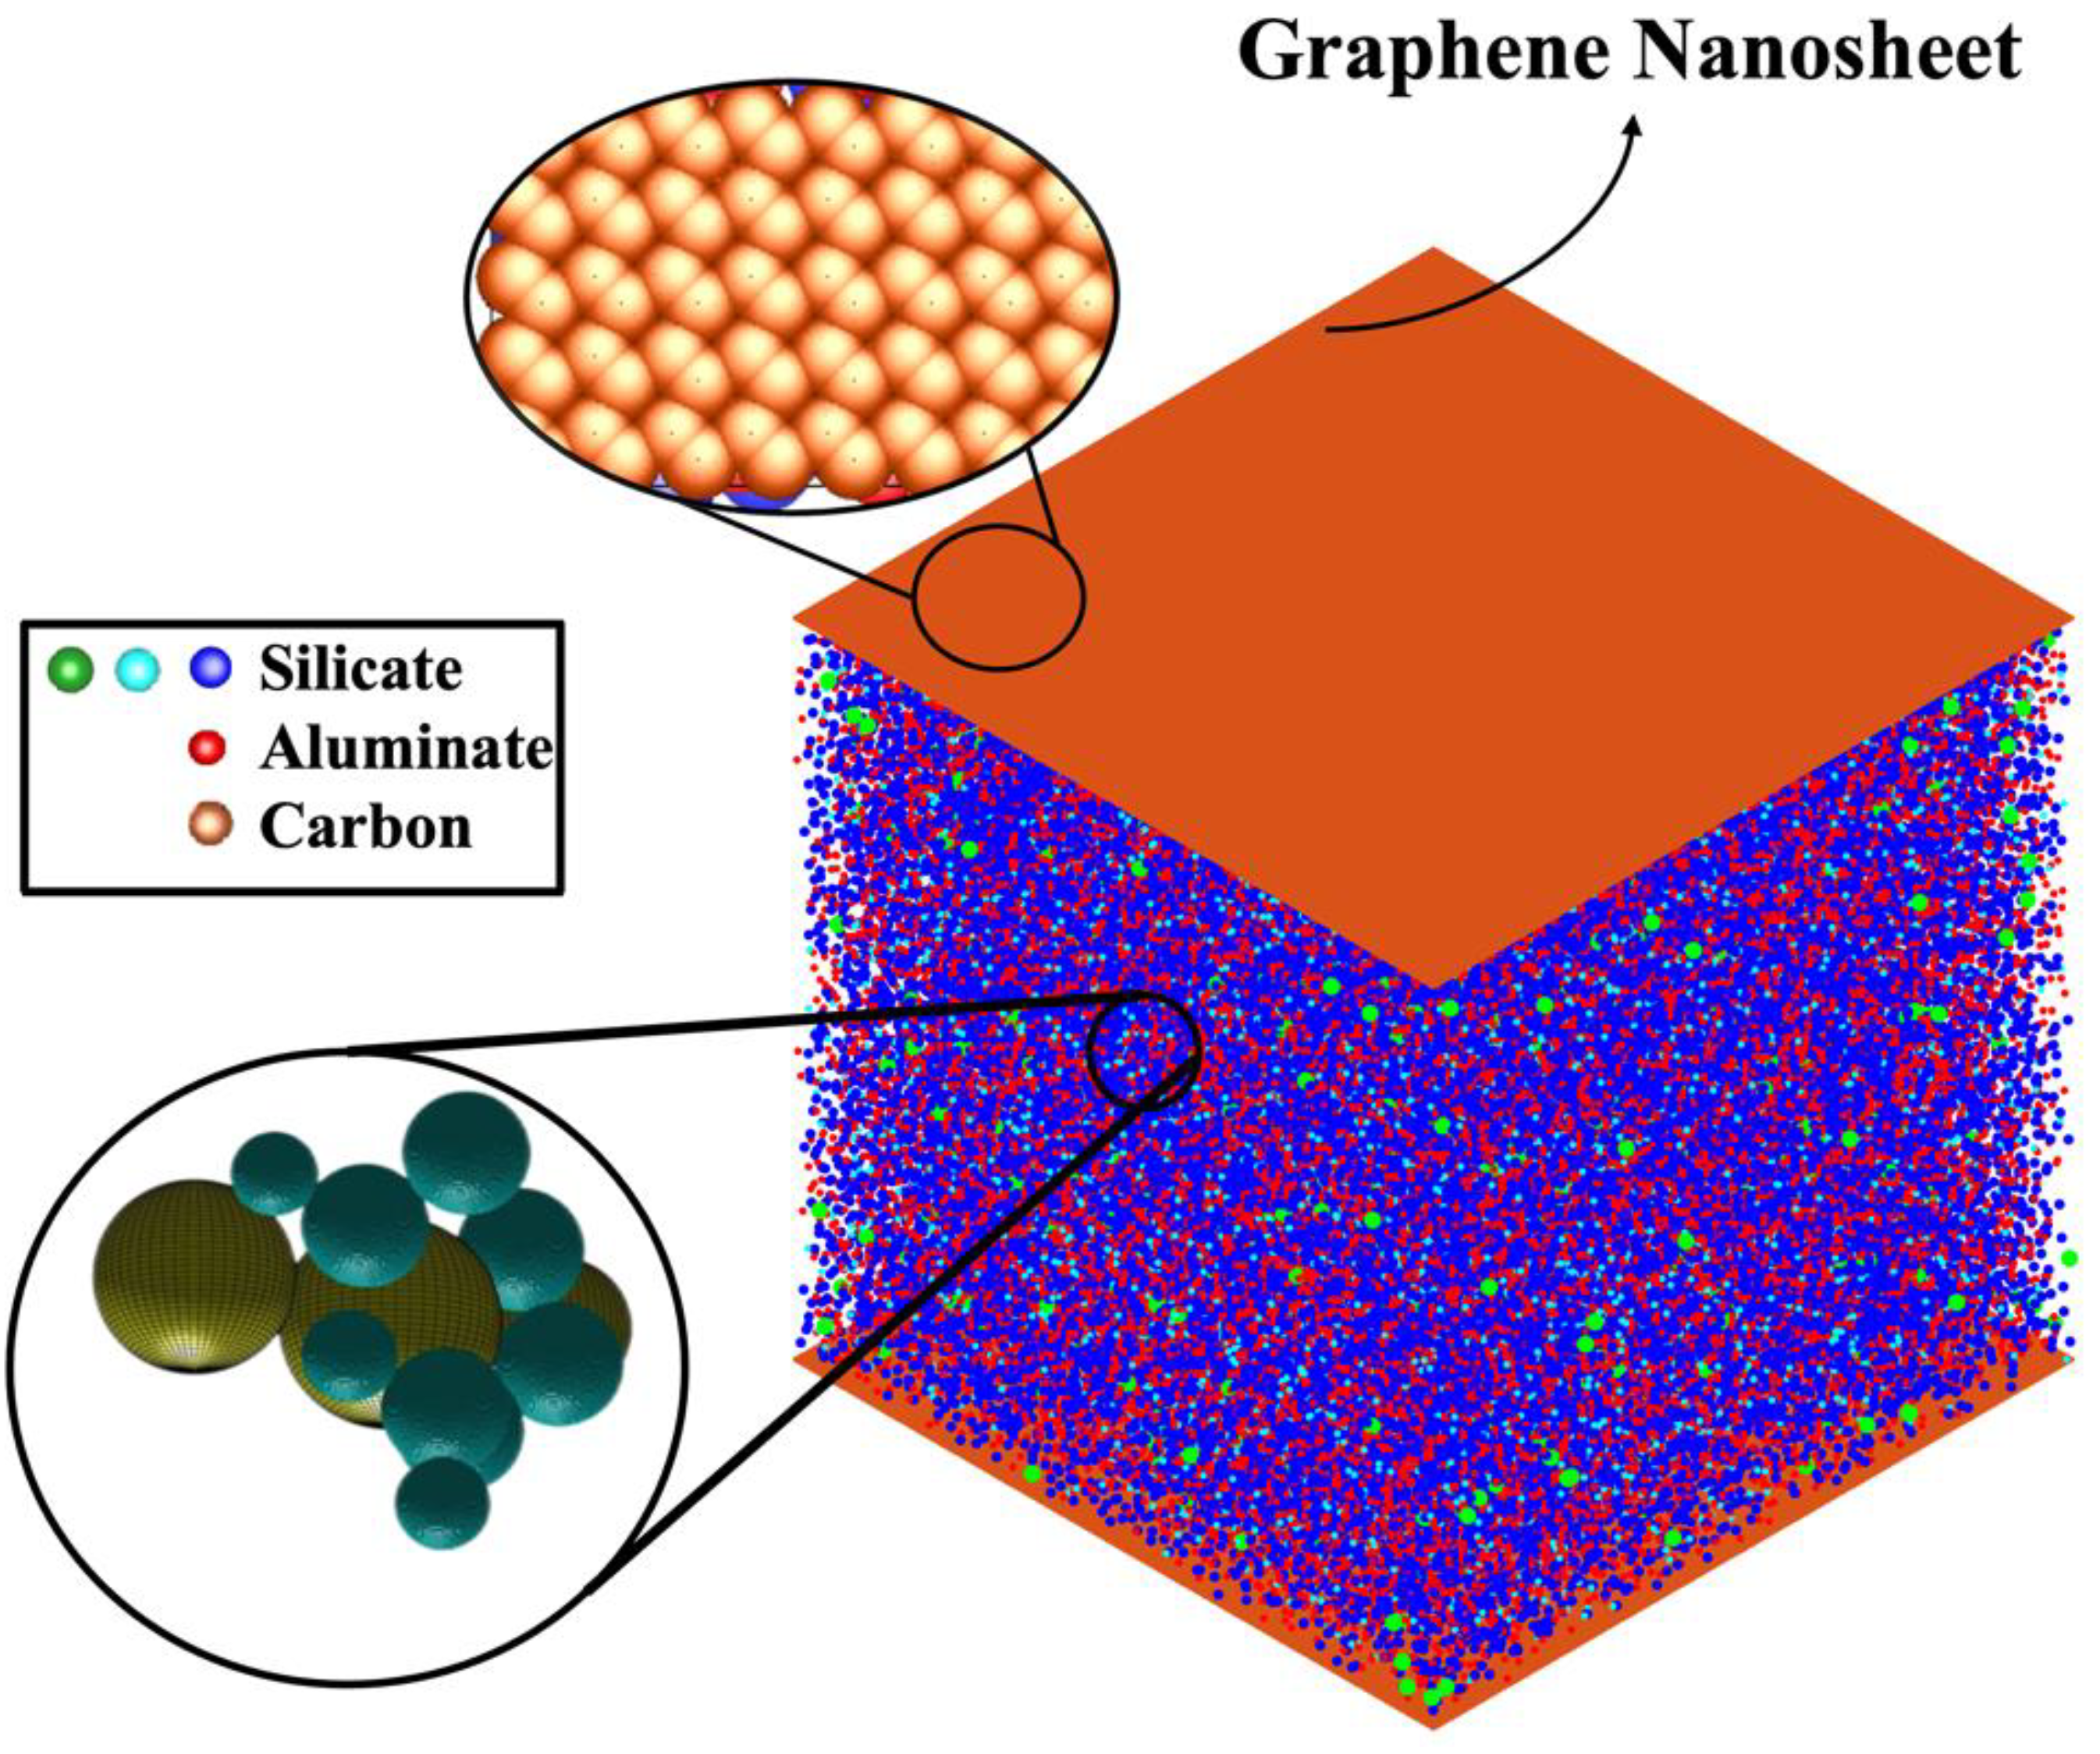
Figure 4.
The dimerization reaction, characterized by tetrahedral formation for A) Si-O-Si and B) Si-O-Al, was optimized using DFT computational modeling method. The radius of the coarse-grained particles was determined based on the average bond length. Interaction between the two particles occurs at a single point, located at the center of the bonding oxygen atom O4 for case A and O11 for case B.
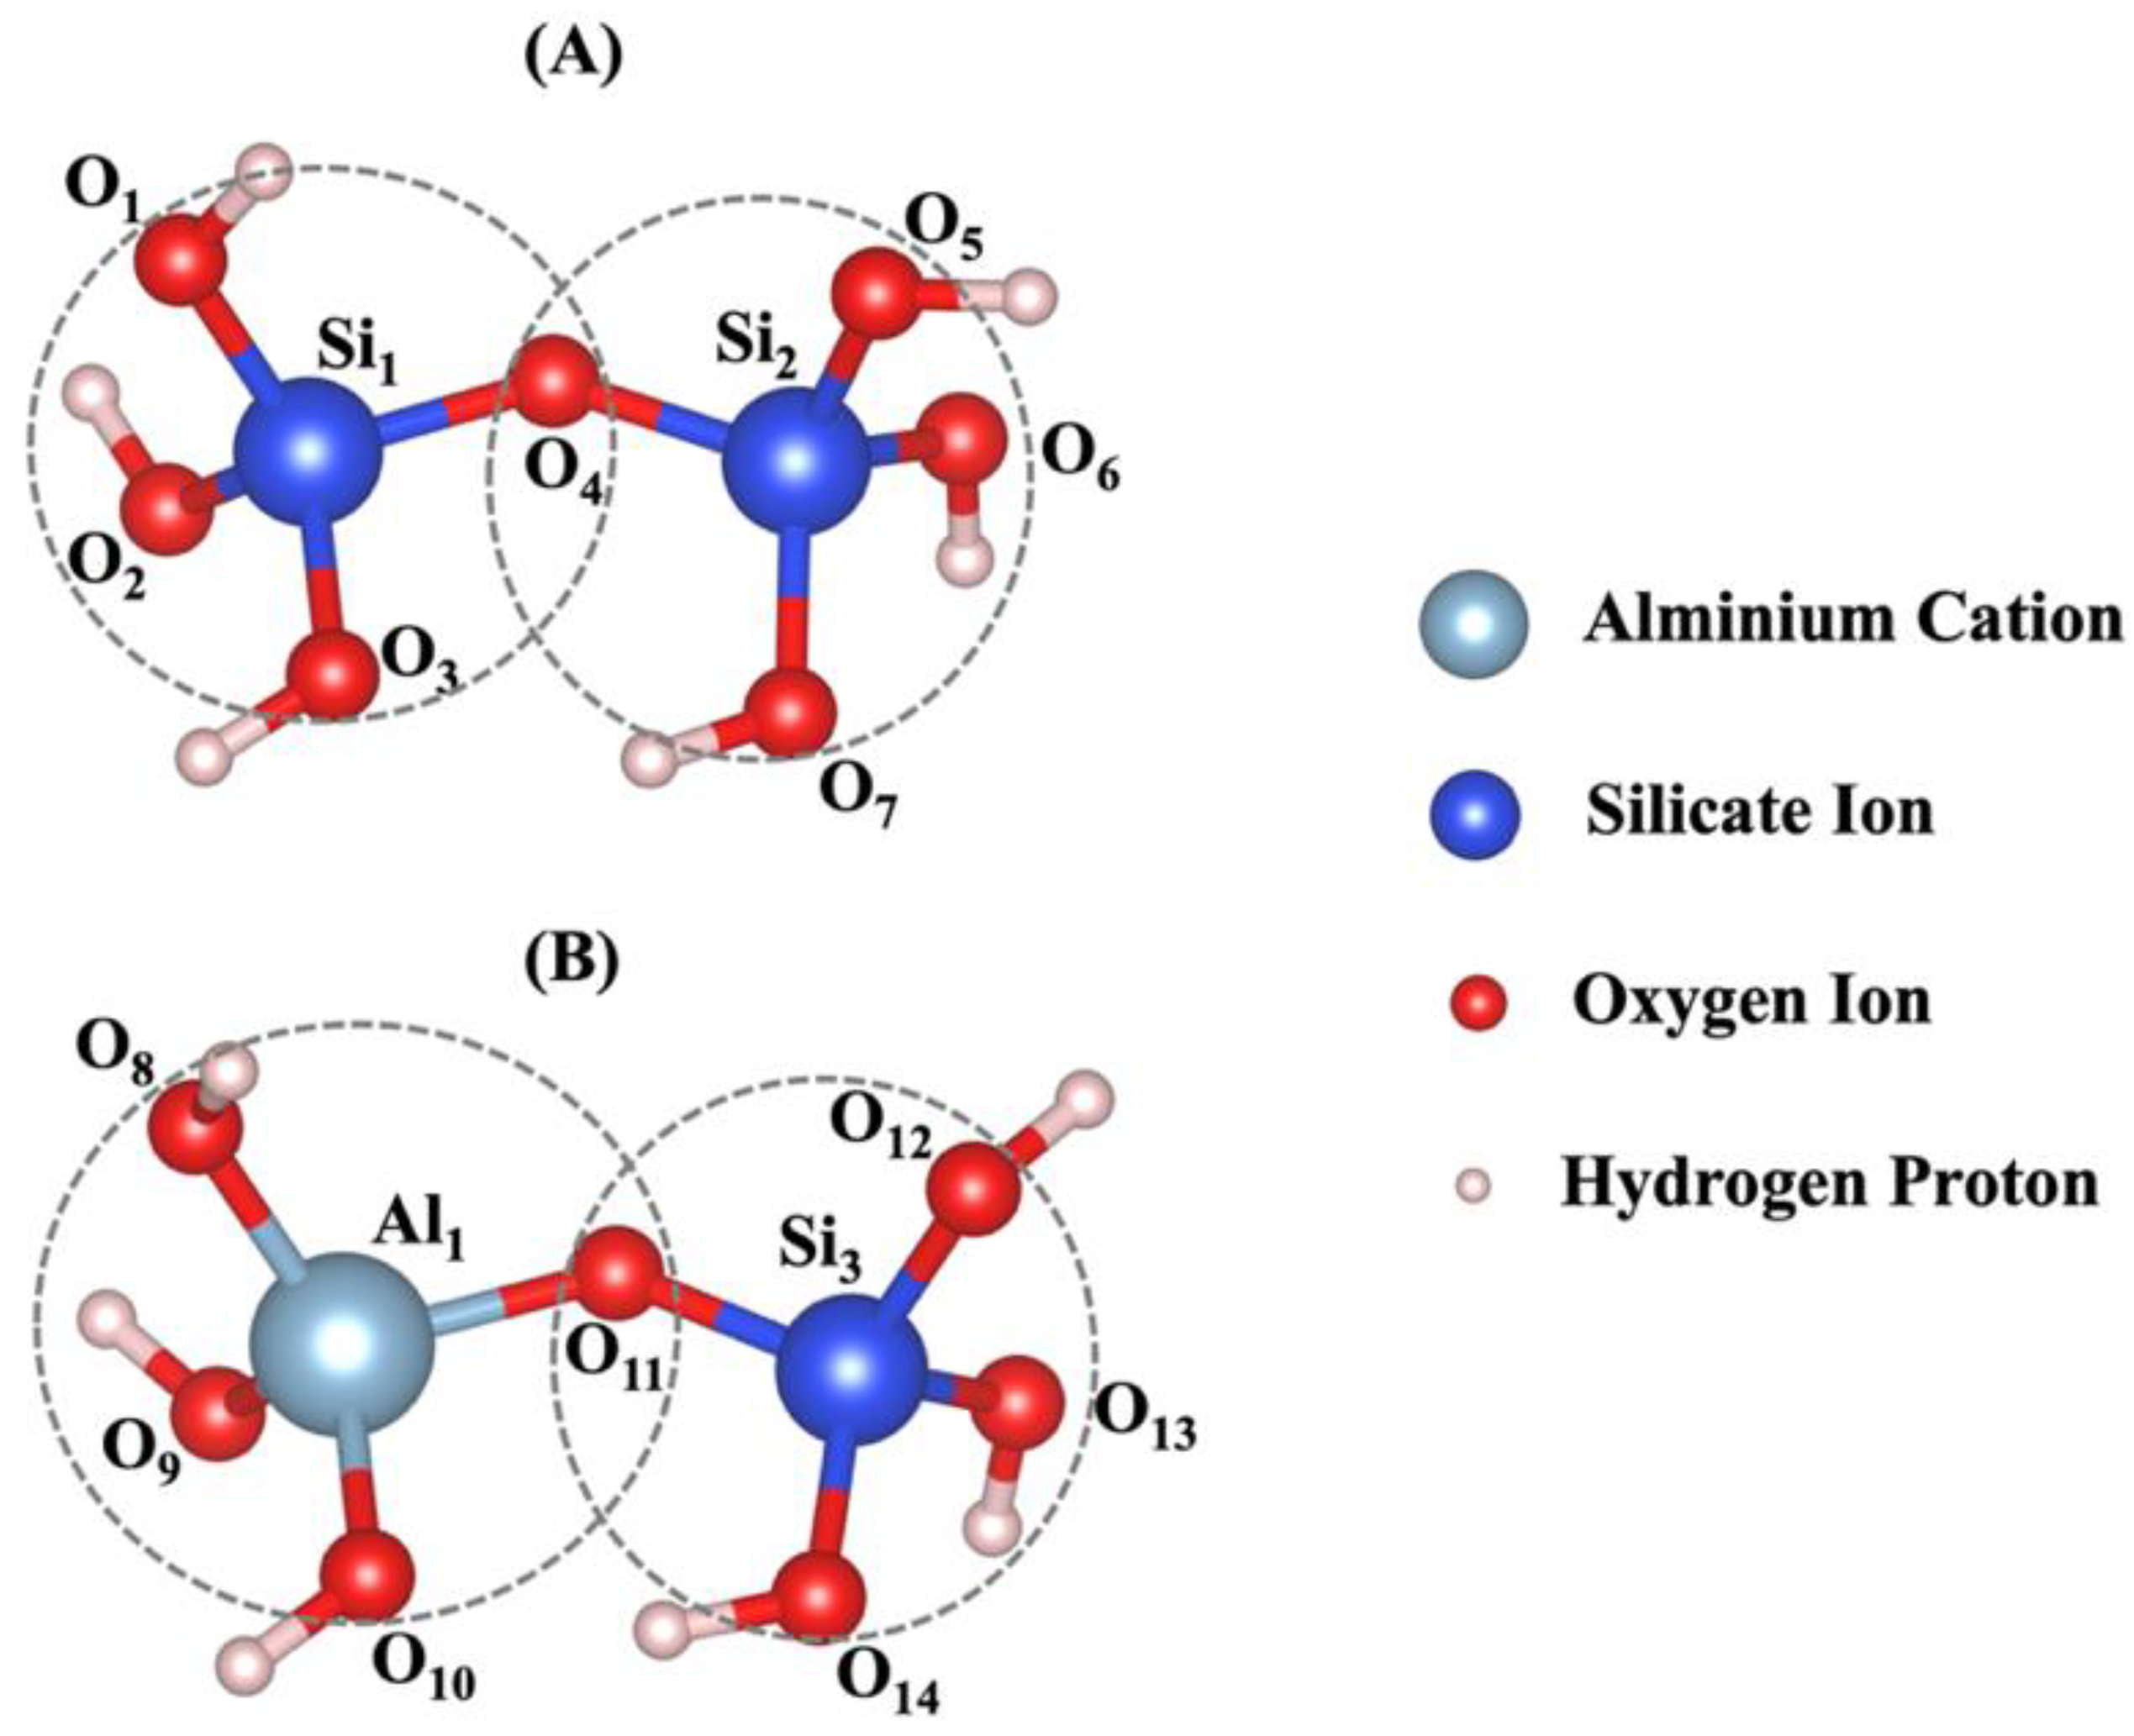
Figure 5.
The progression of structures and cluster formation in geopolymer systems A) without and B) with contribution of graphene nanosheet are observed at specific iteration points: 0, 40,000, 80,000, and 56,000,000. The addition of MK into the system is indicated at iteration 0, preceded by pre-equilibration occurring from iteration 8,000,000 to iteration 0.
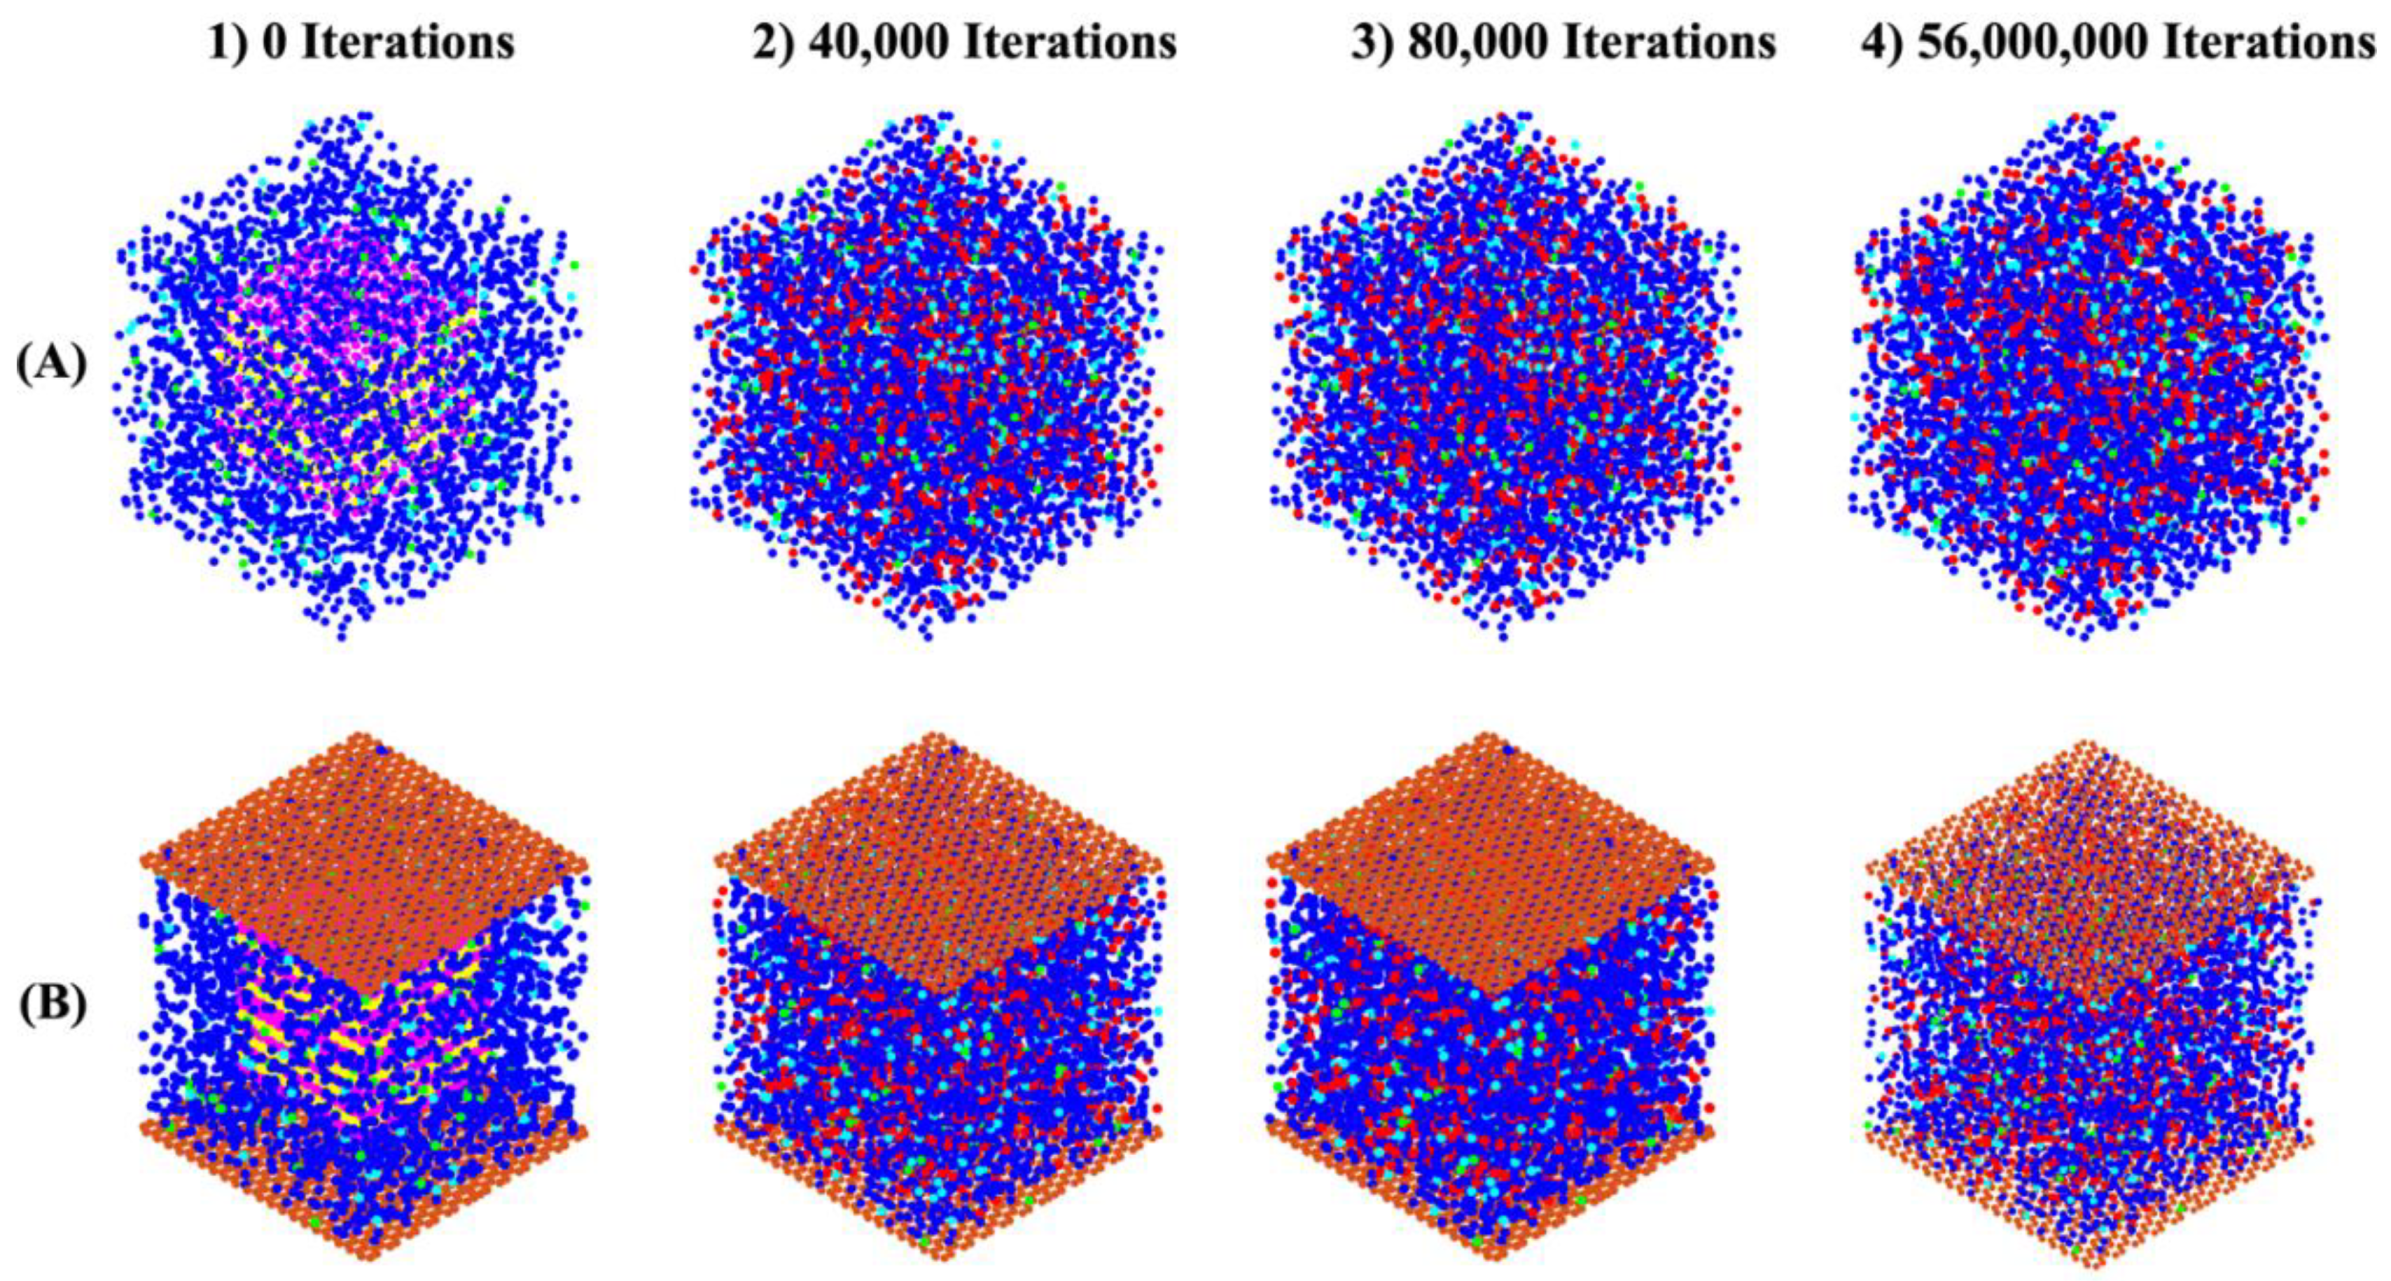
Figure 6.
The energy progression of silicate species (particles) in the solution is examined for the pH 11 system, prior to the involvement of MK.
Figure 6.
The energy progression of silicate species (particles) in the solution is examined for the pH 11 system, prior to the involvement of MK.
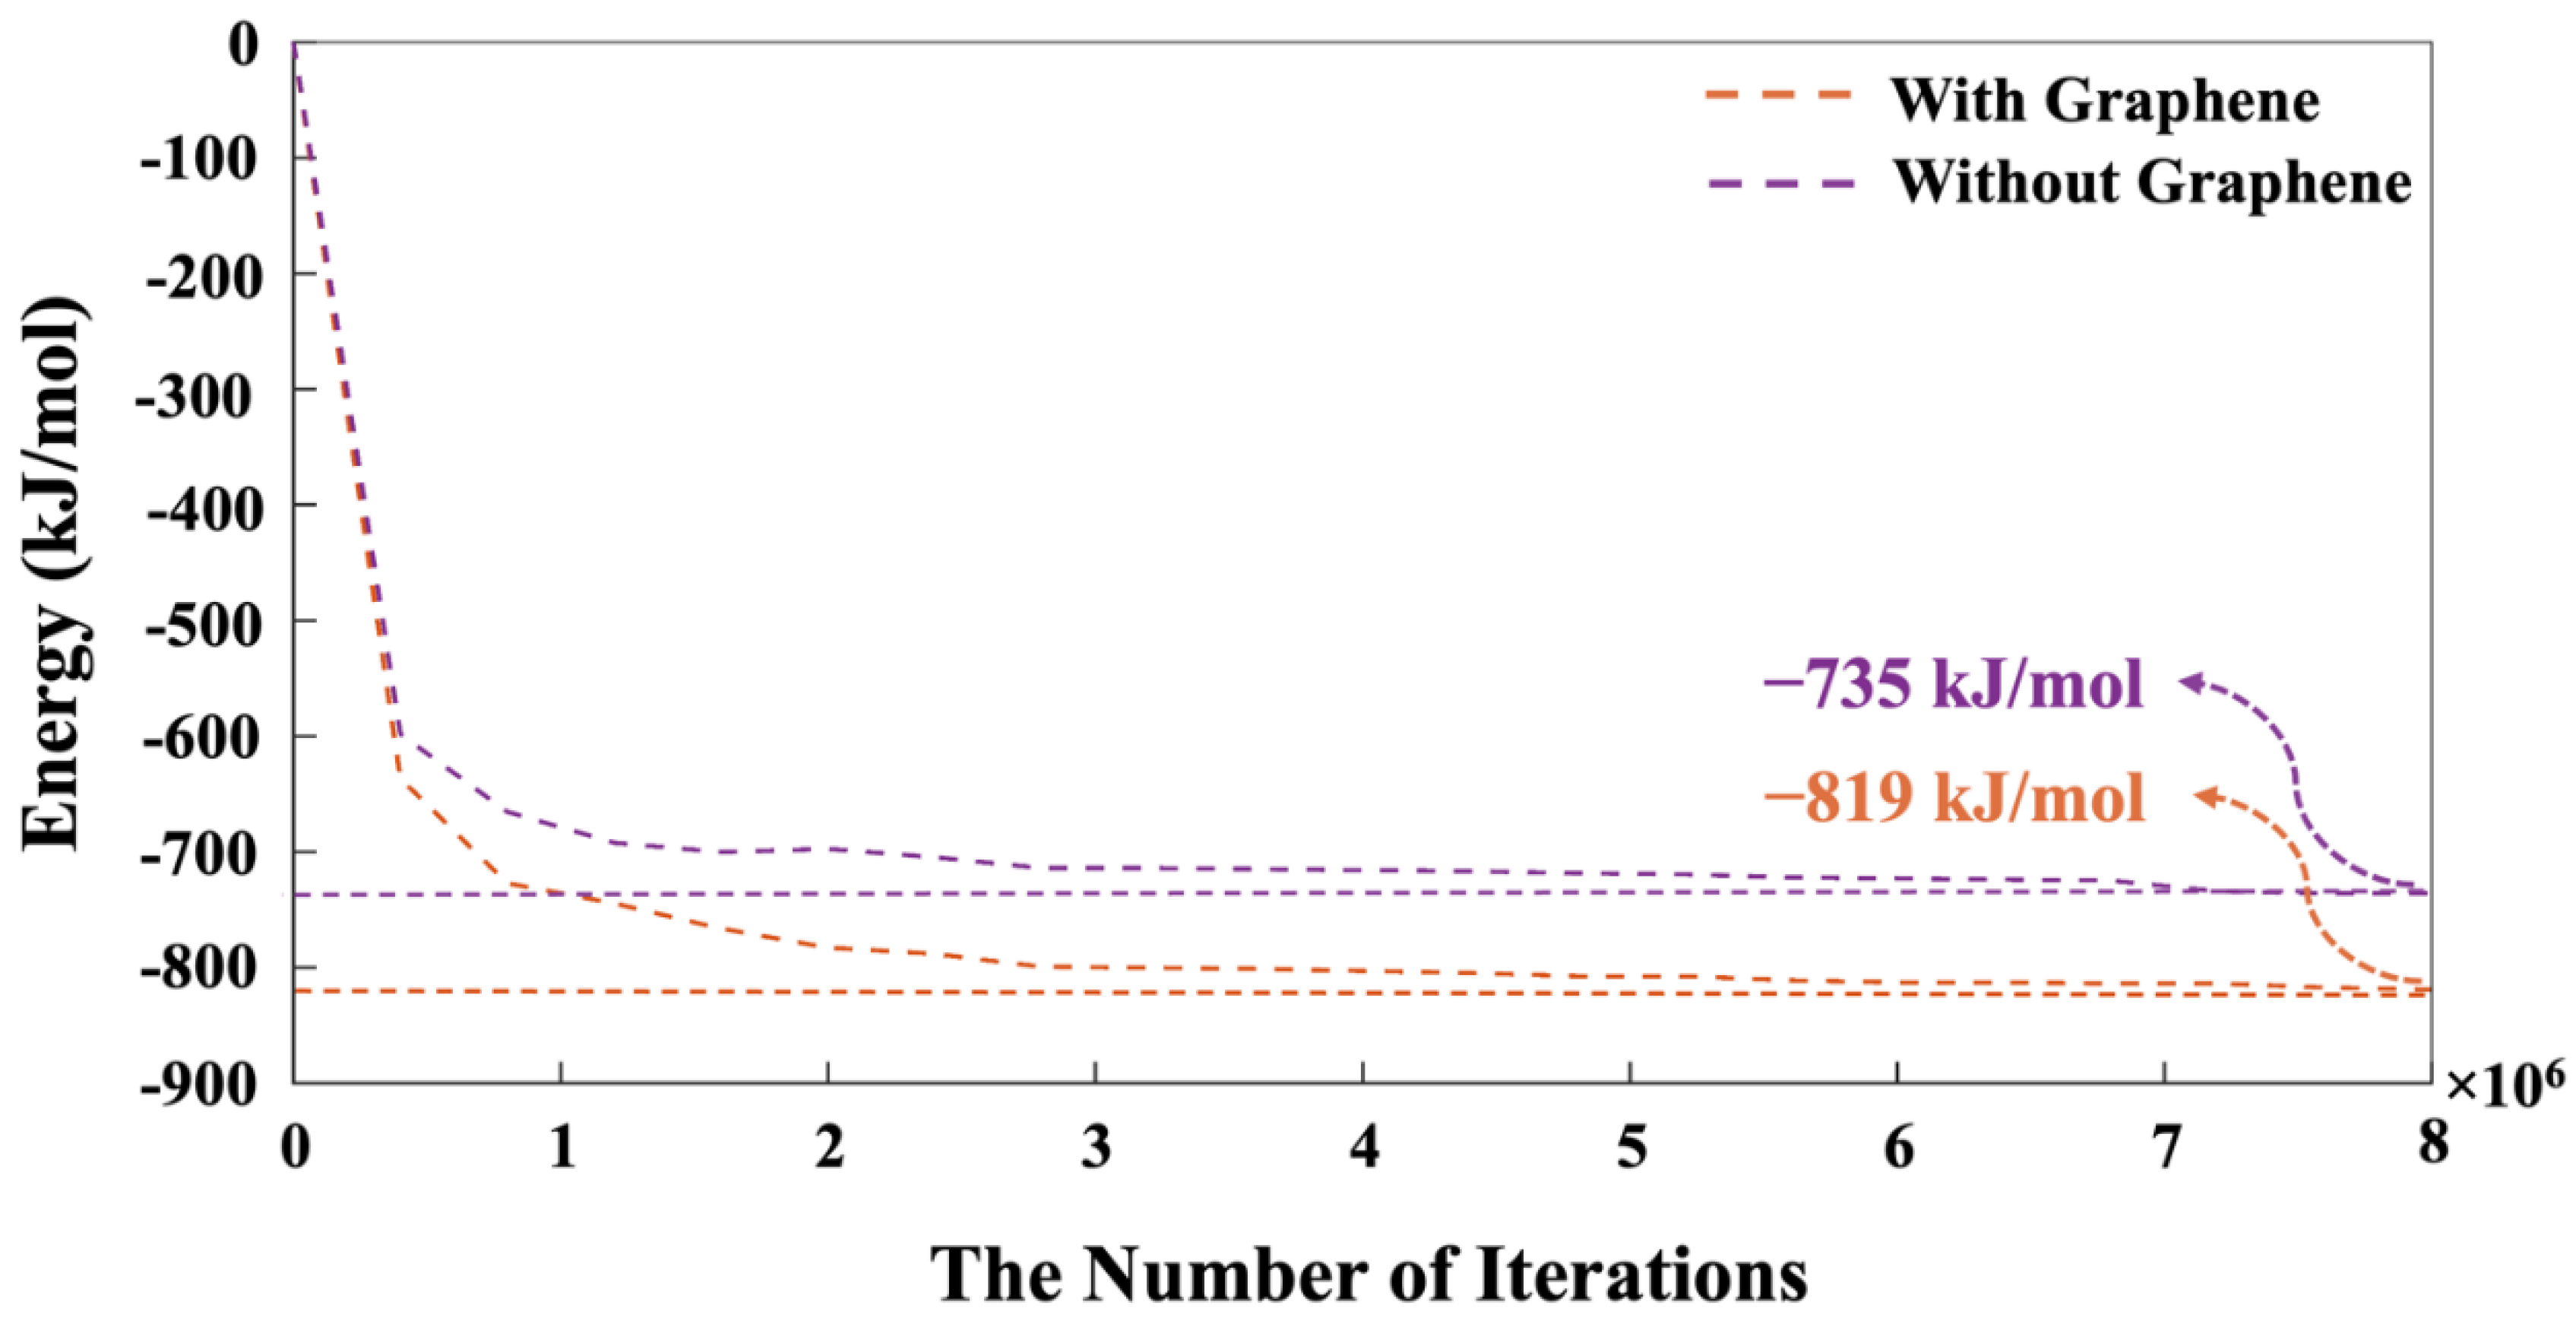
Figure 7.
During 56 million iterations and with the involvement of MK, the equilibrium condition for the pH 11 system was determined by performing energy minimization calculations with and without the contribution of a graphene nanosheet. The introduction of MK into the system is indicated at iteration 0, followed by a pre-equilibration period lasting an additional 8,000,000 iterations (Figure 6).
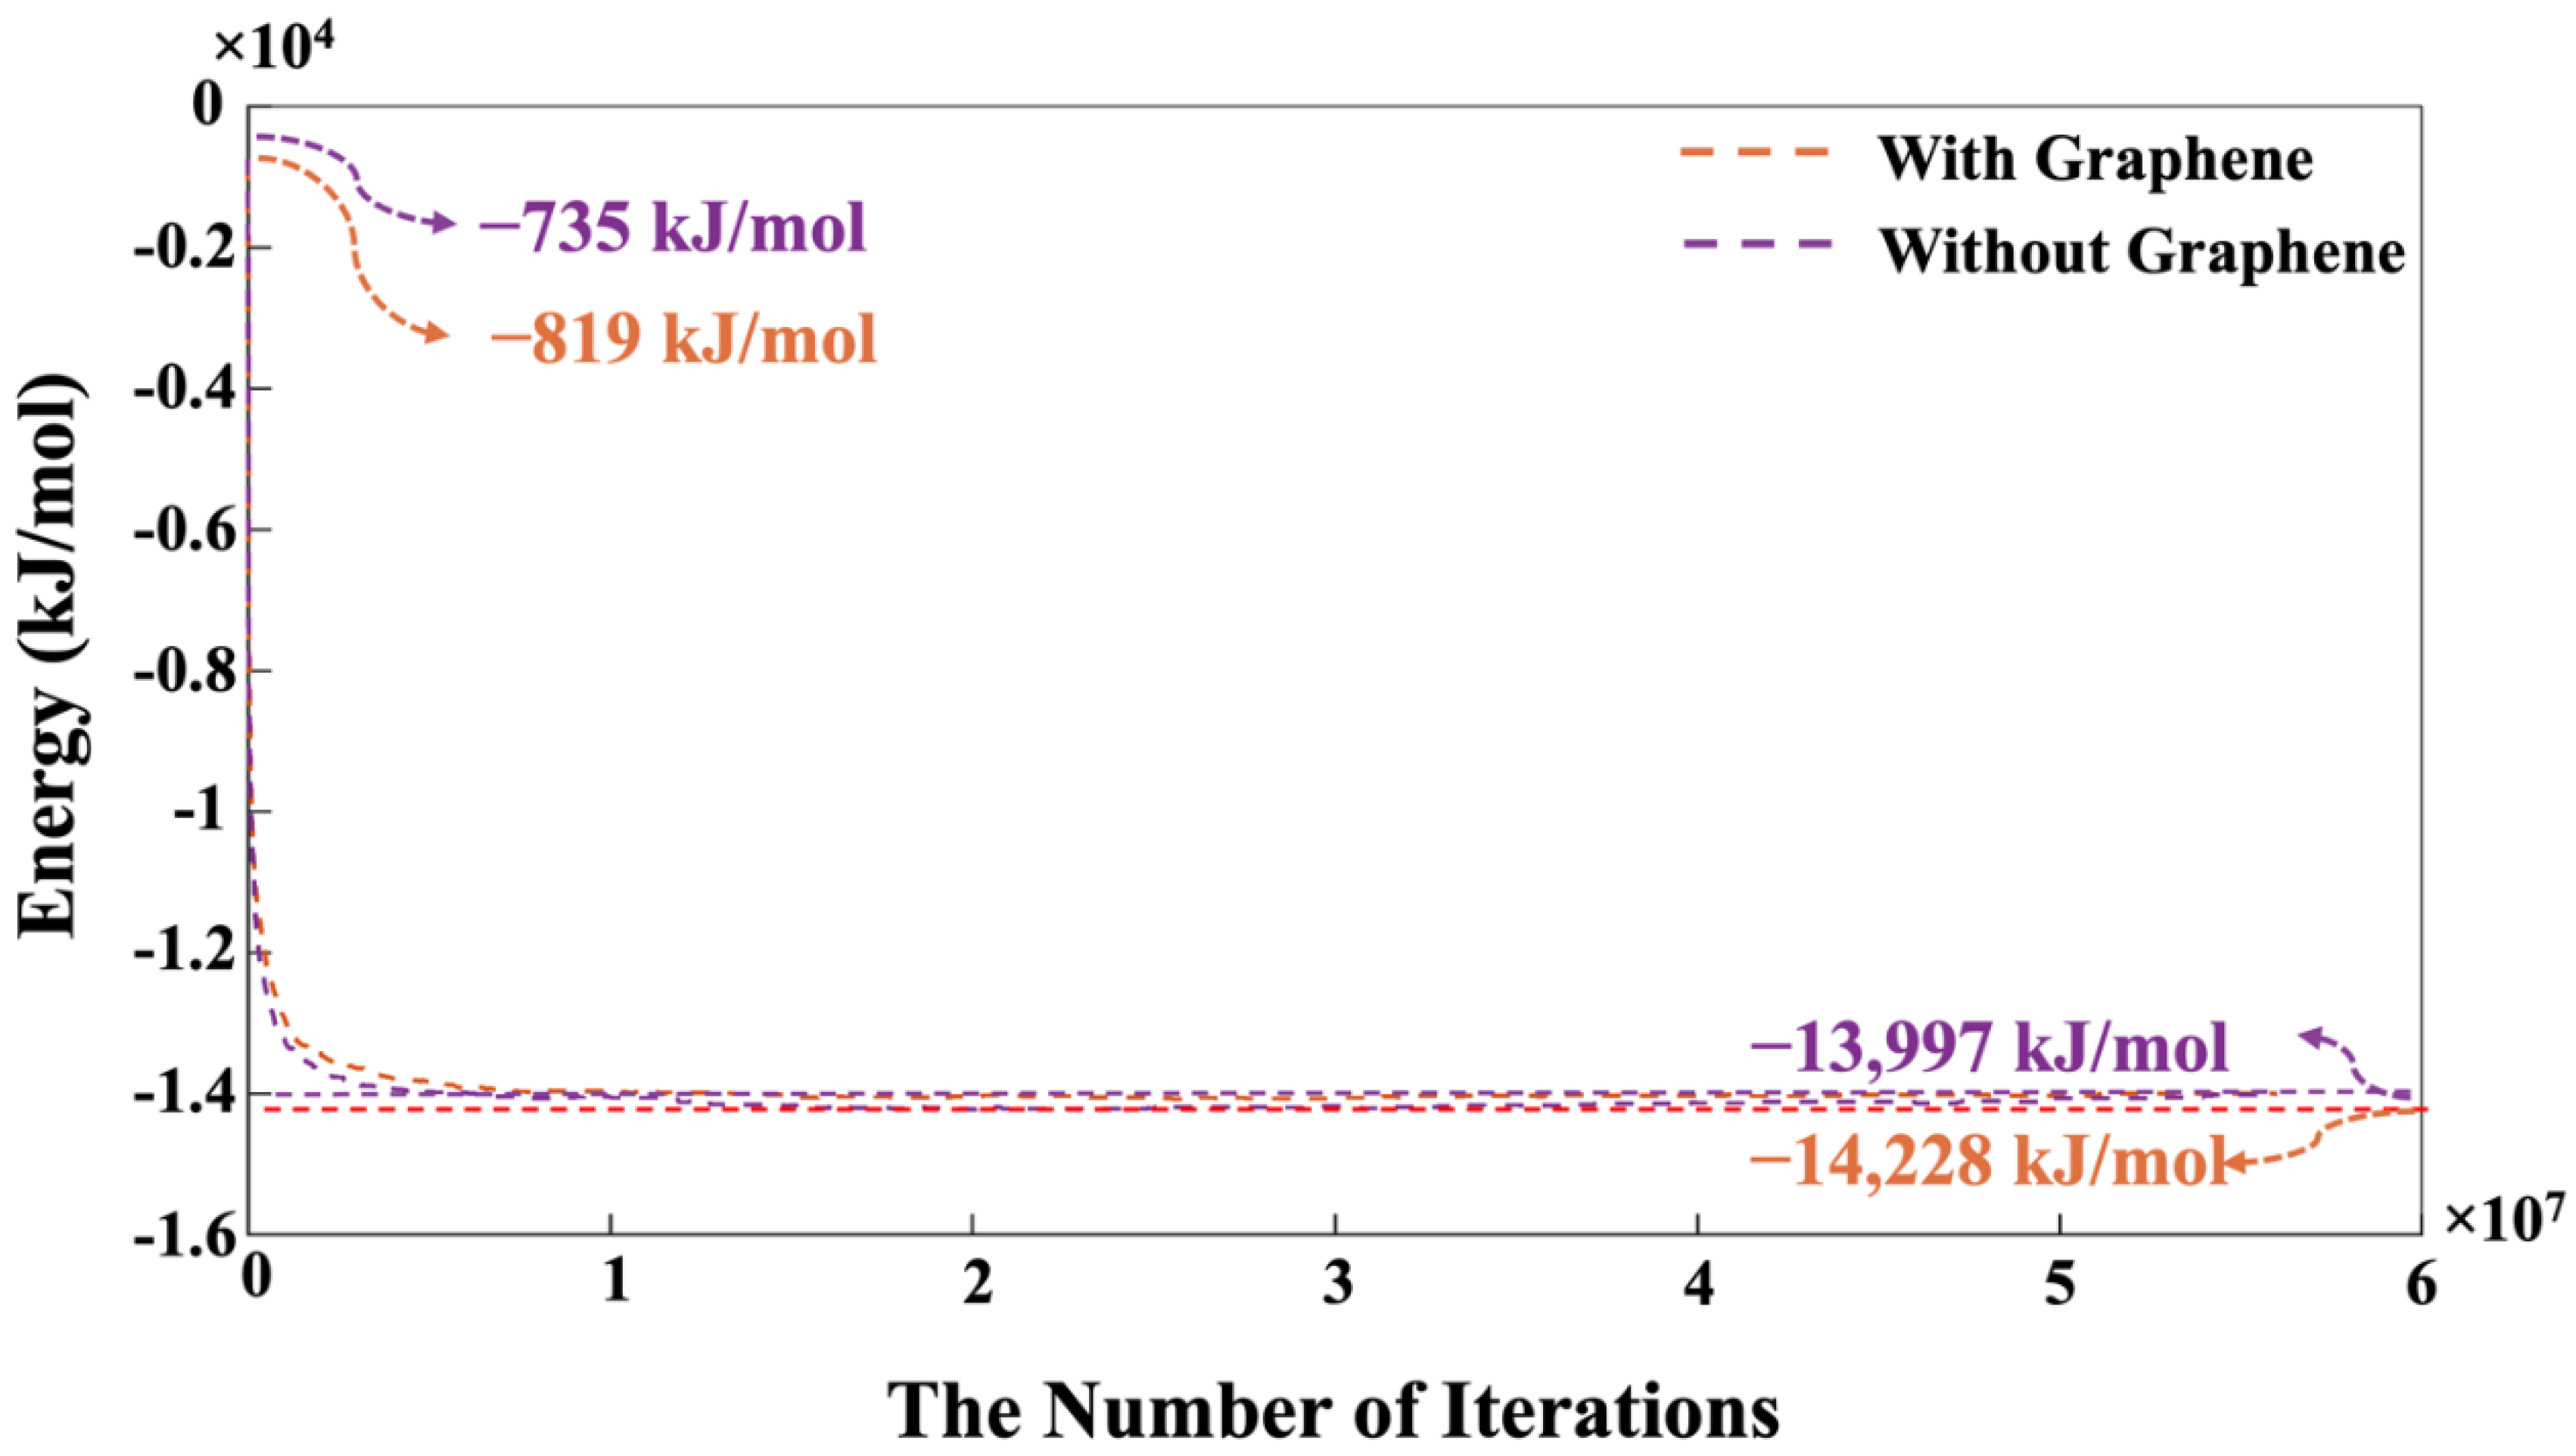
Figure 8.
The variation in the quantity of silicate and aluminate monomers within the simulated system is monitored over 56,000,000 iterations for the pH 11 system, both with and without the involvement of a graphene nanosheet. MK particles are regarded as monomers solely during the dissolution process.
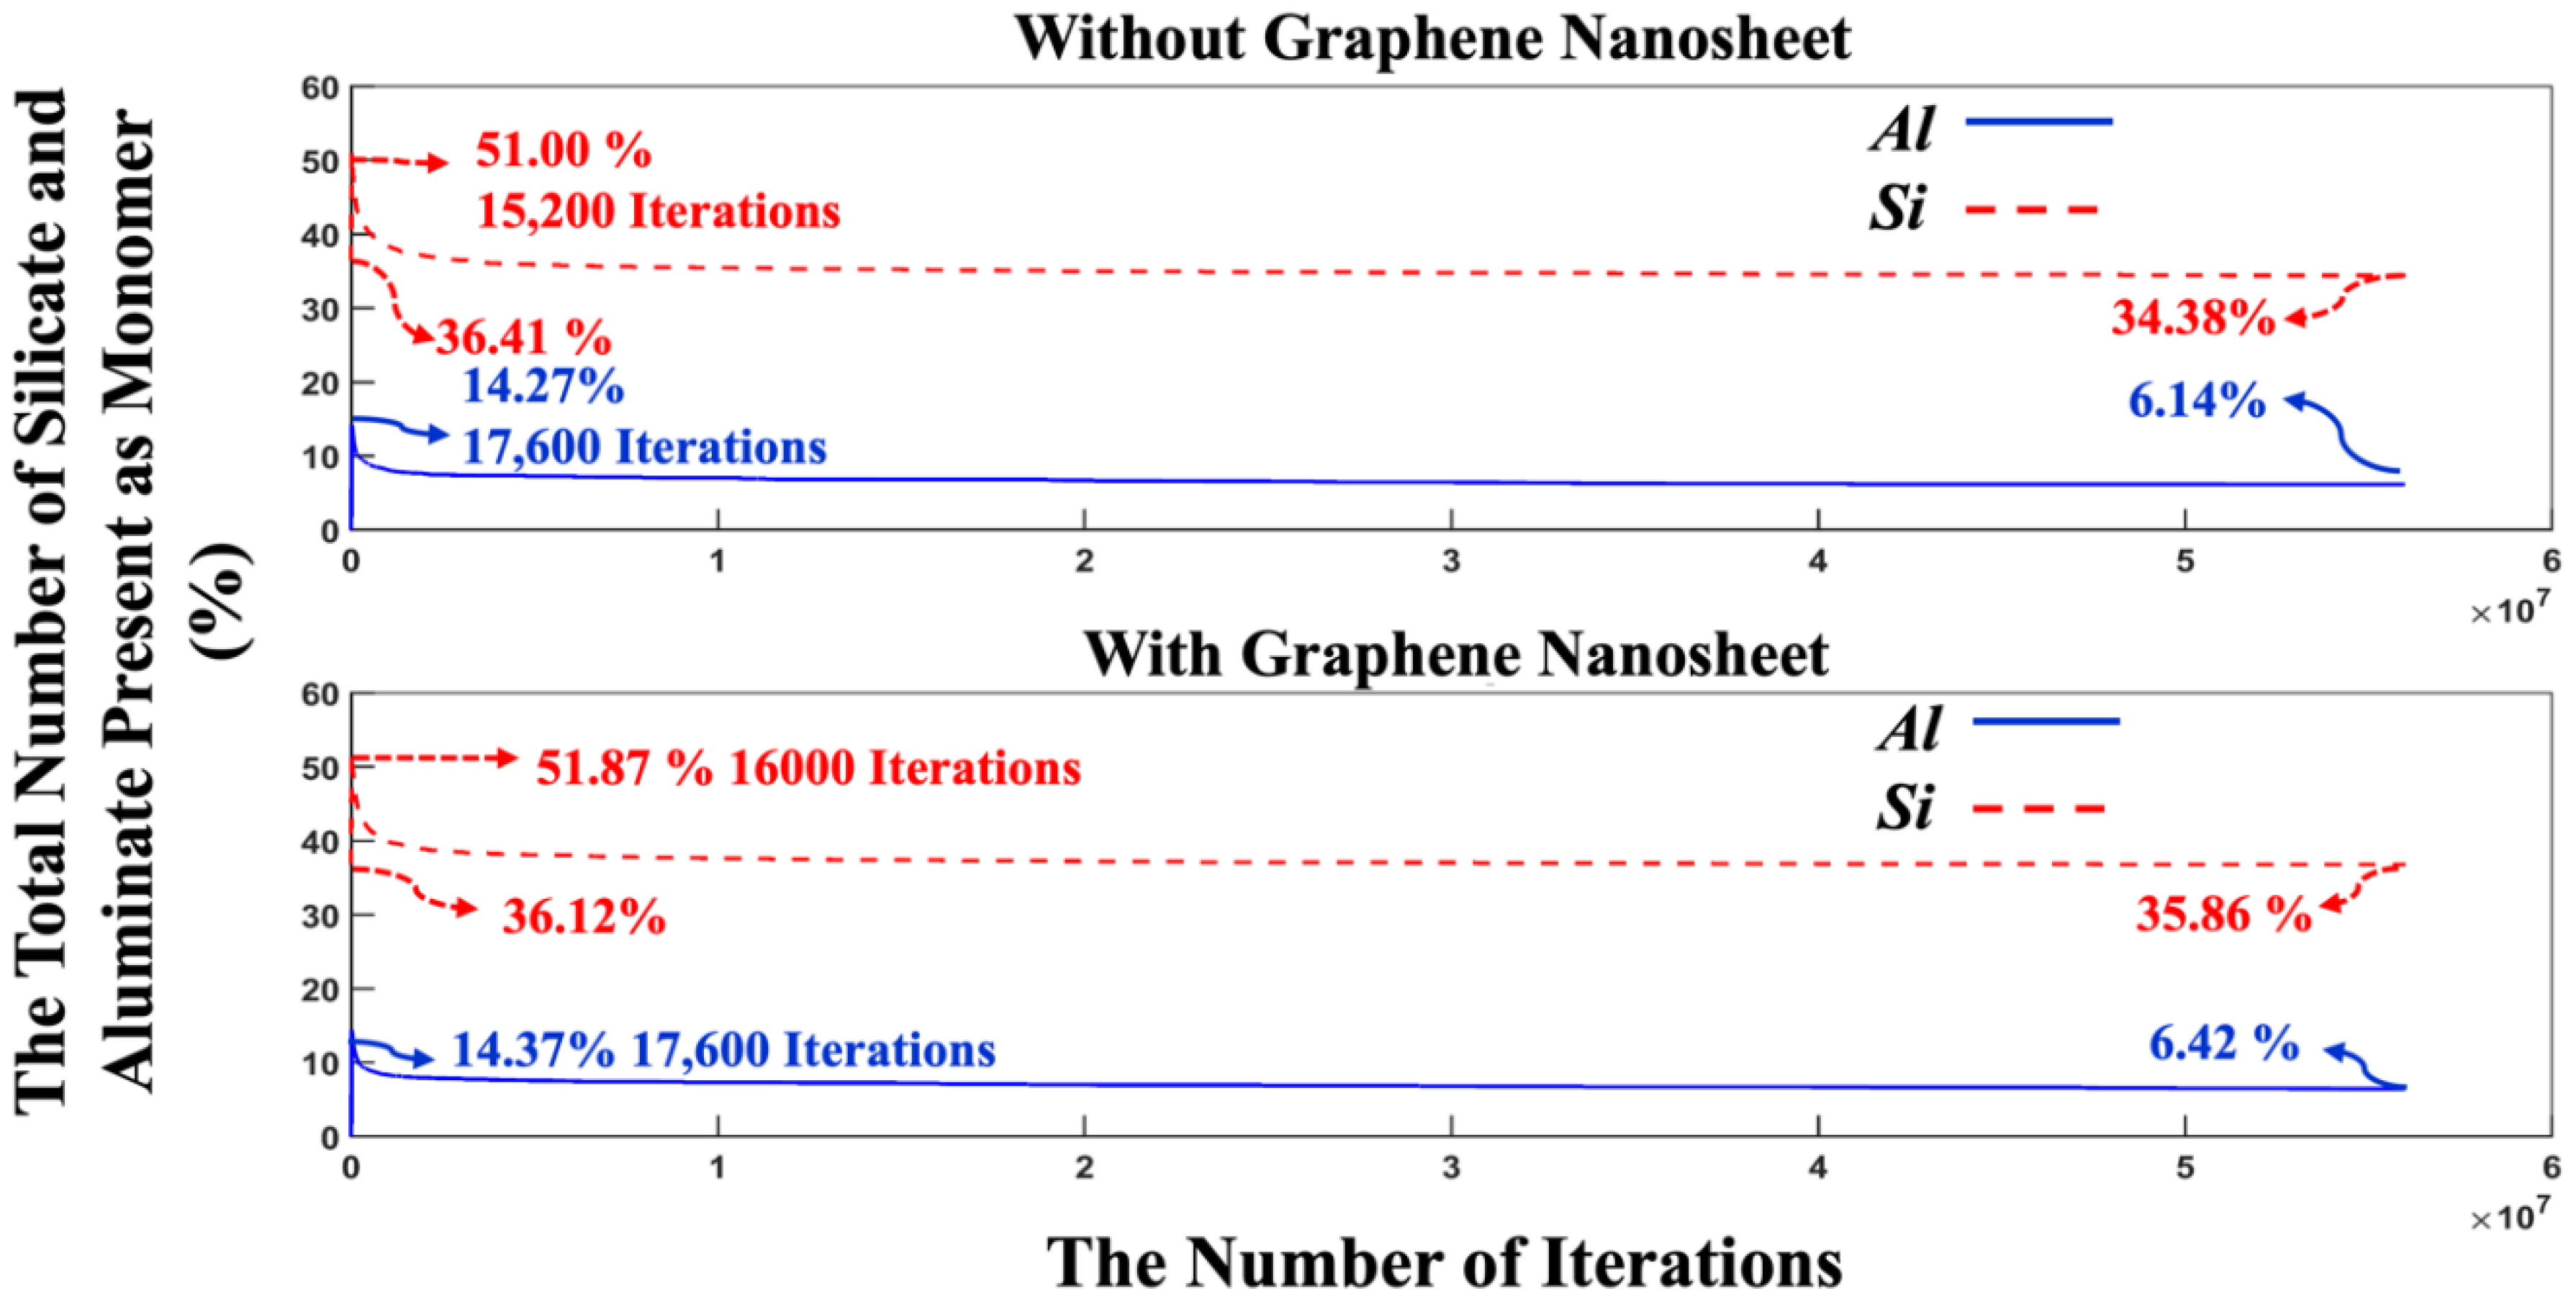
Figure 9.
During 56 million iterations, the percentage of silicate monomers within the system is tracked, with and without the incorporation of a graphene nanosheet. At the beginning of the simulation (iteration zero), MK species (particles) were excluded as they dissolved during process.
Figure 9.
During 56 million iterations, the percentage of silicate monomers within the system is tracked, with and without the incorporation of a graphene nanosheet. At the beginning of the simulation (iteration zero), MK species (particles) were excluded as they dissolved during process.
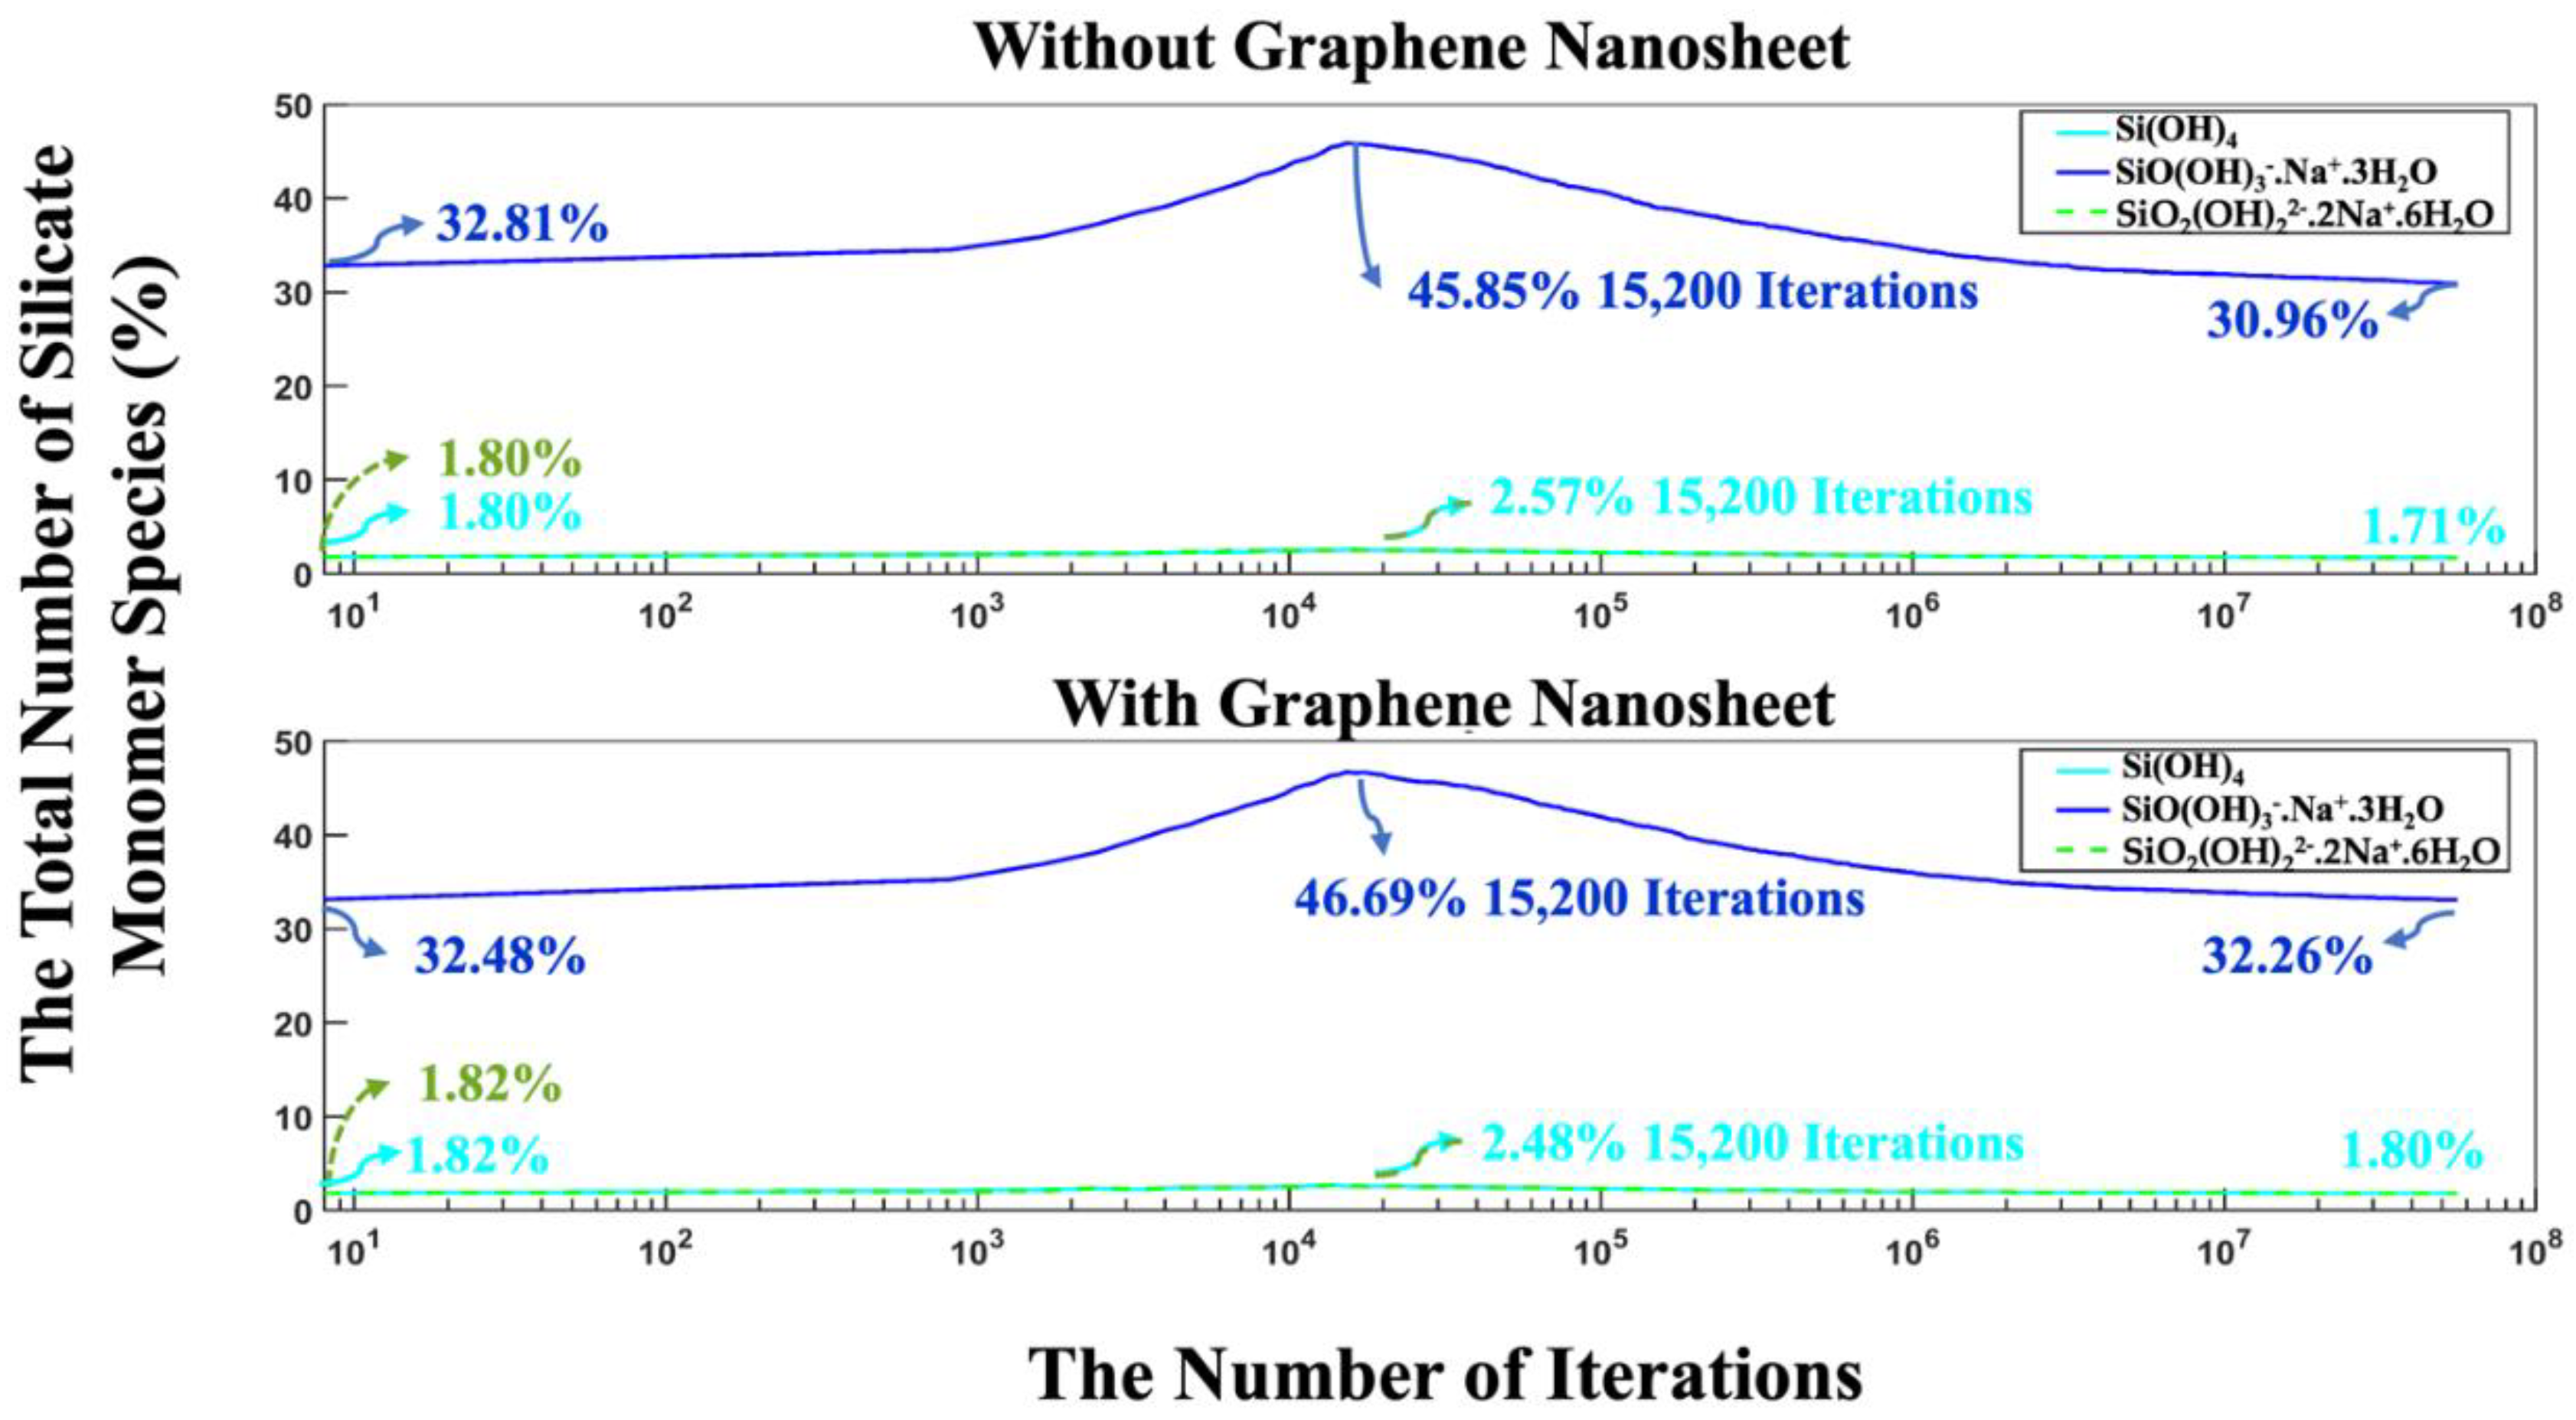
Figure 10.
The evolution of monomer numbers, both participating and not participating in cluster formation, was tracked over 56 million iterations for both systems, one incorporating a graphene nanosheet and the other without. .
Figure 10.
The evolution of monomer numbers, both participating and not participating in cluster formation, was tracked over 56 million iterations for both systems, one incorporating a graphene nanosheet and the other without. .
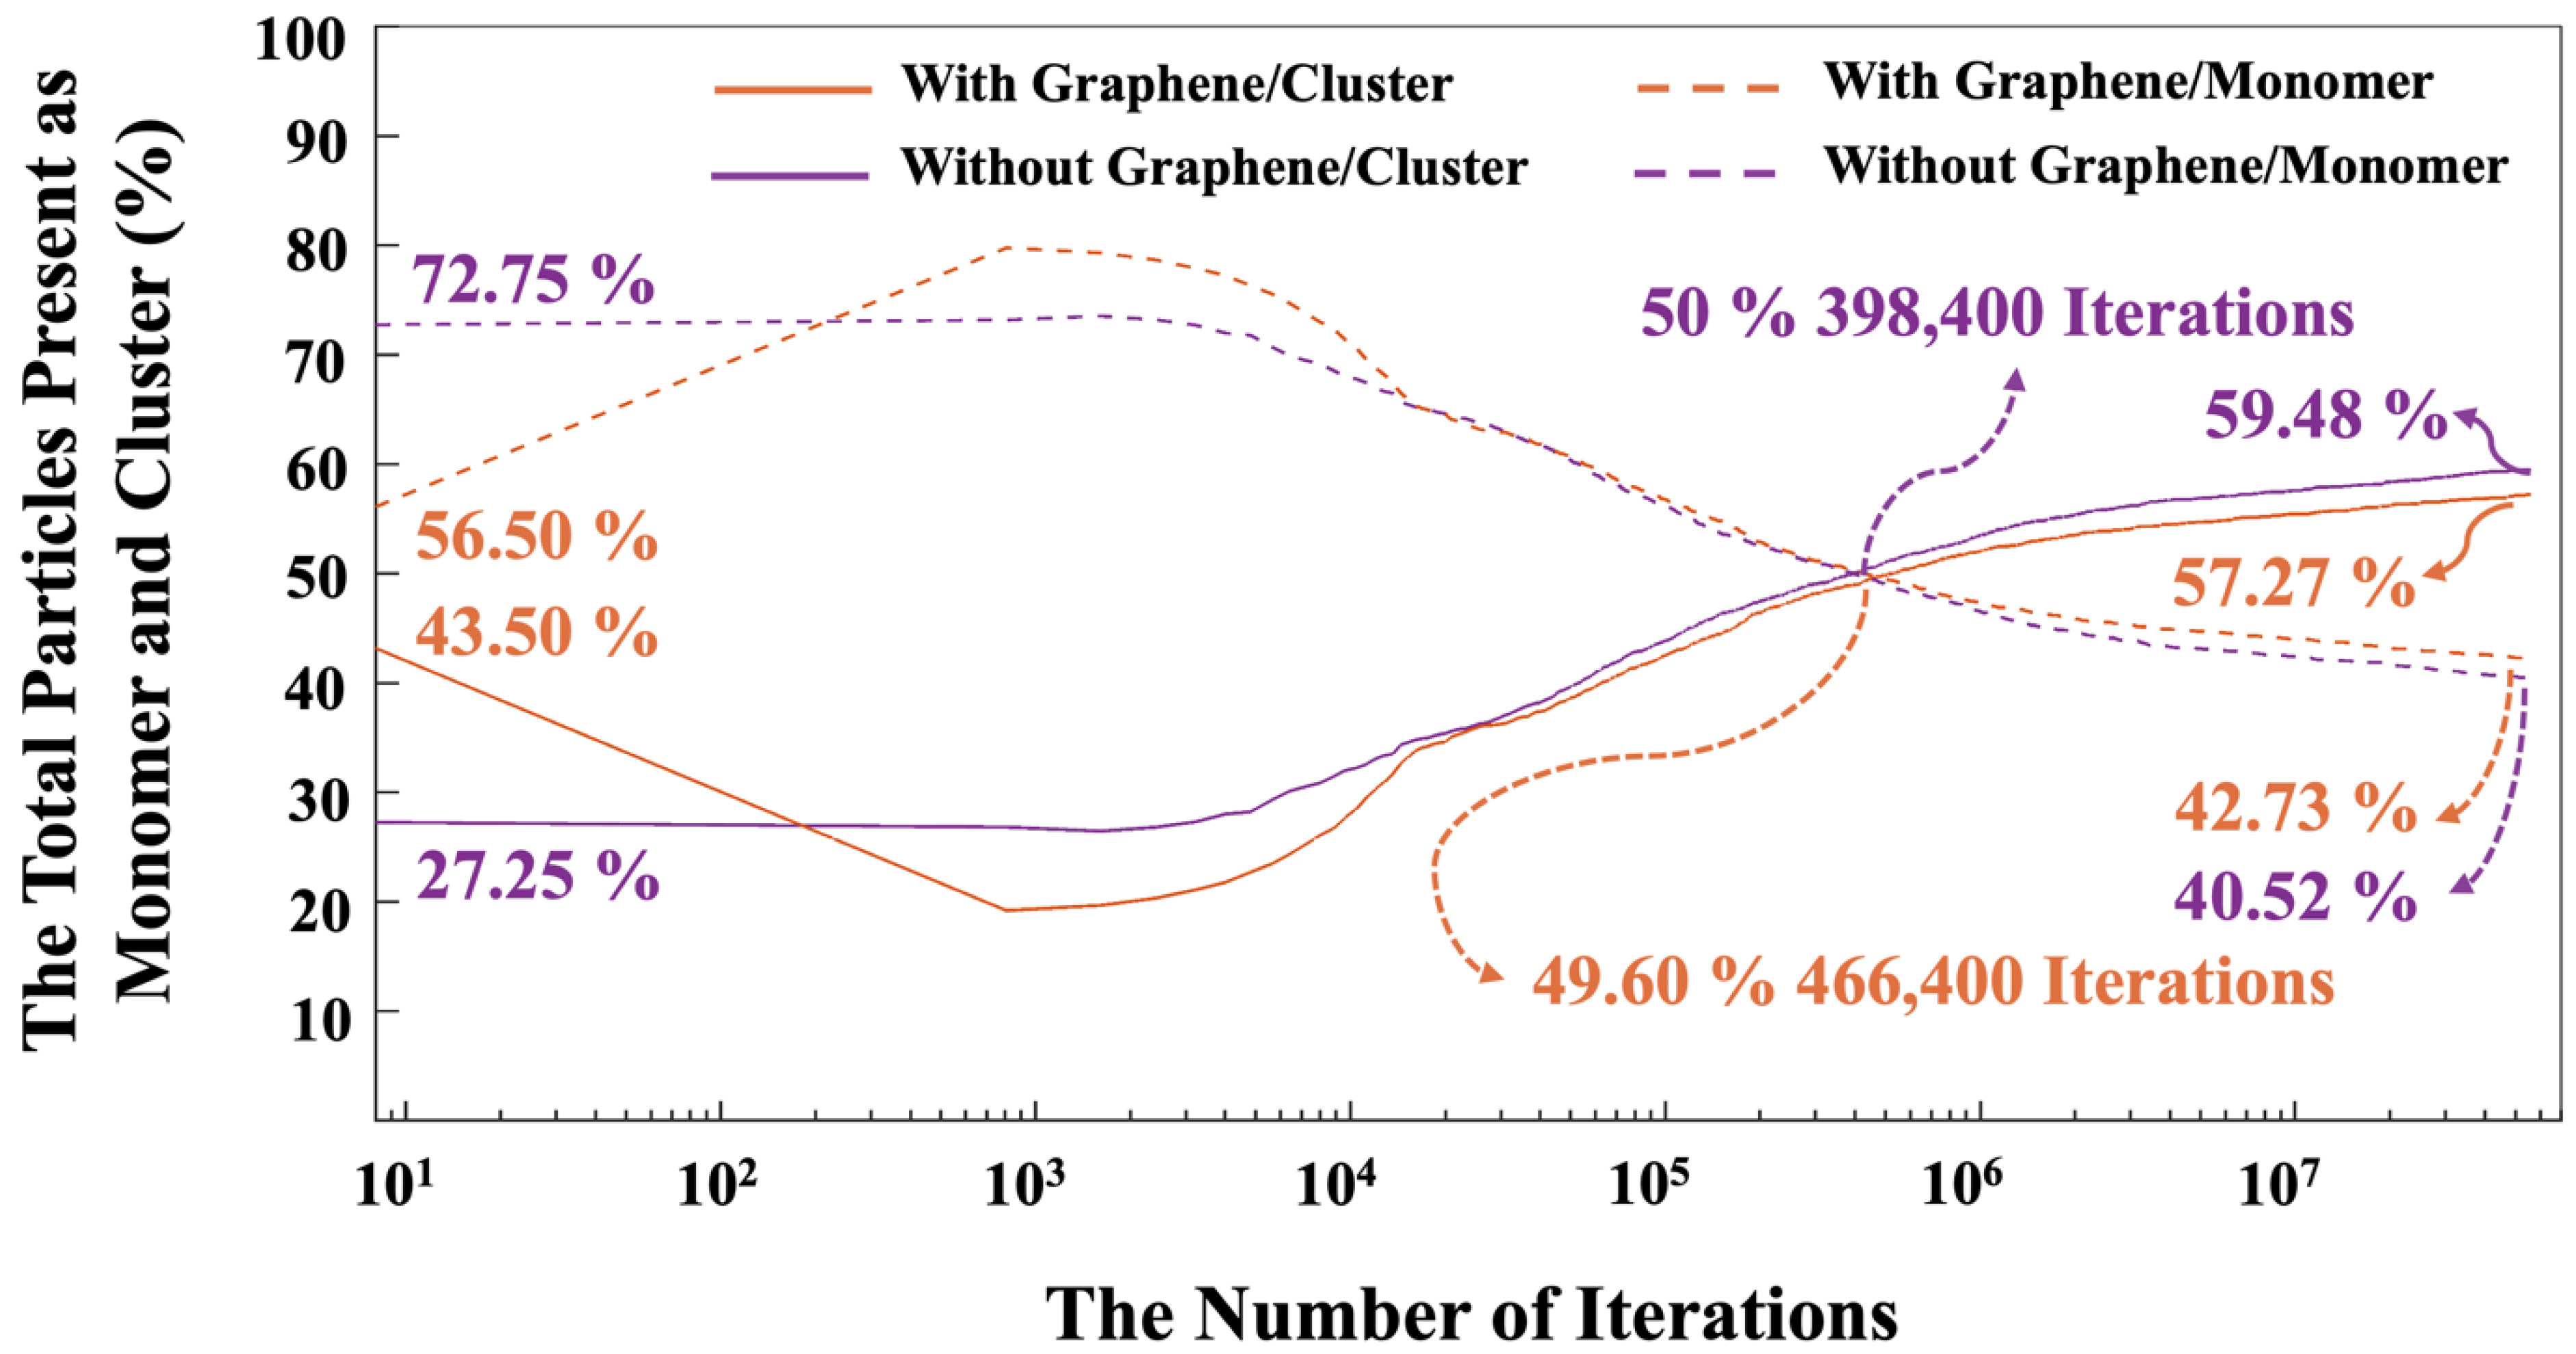
Figure 11.
The dissolution process of MK, with and without the incorporation of a graphene nanosheet are observed over 56 million iterations.
Figure 11.
The dissolution process of MK, with and without the incorporation of a graphene nanosheet are observed over 56 million iterations.
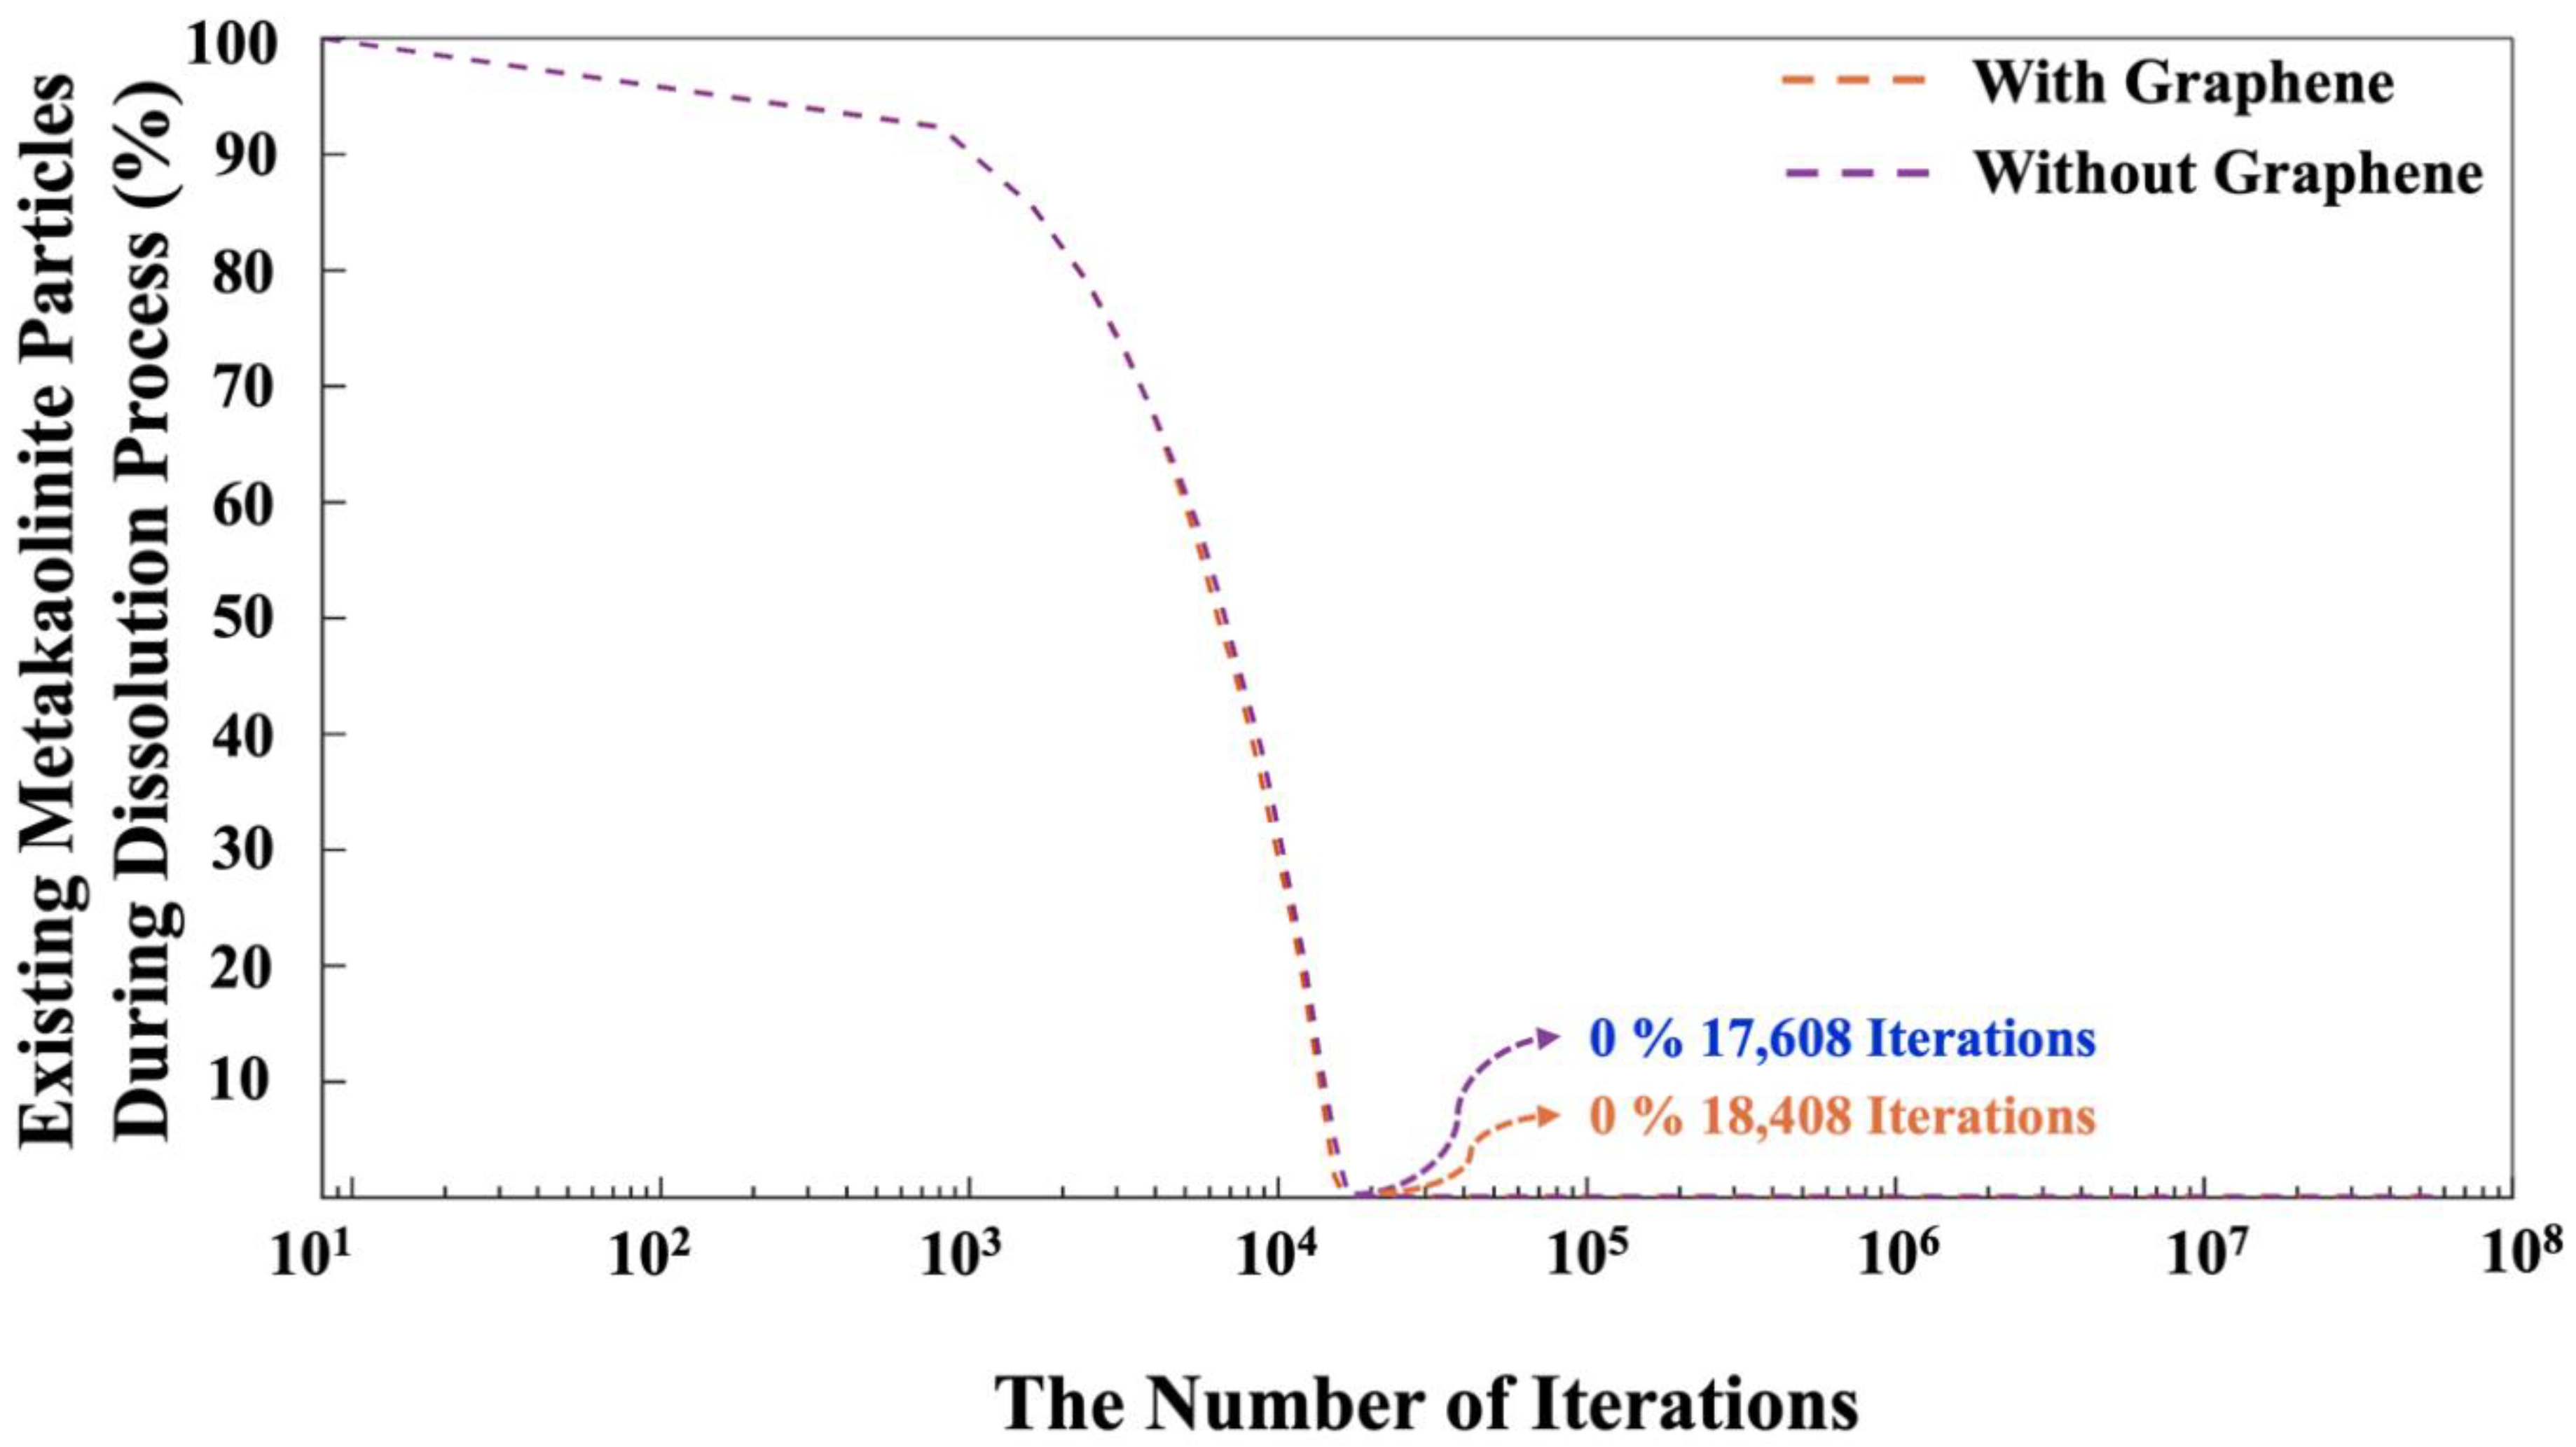
Figure 12.
Pore size distribution after 56 million iterations for both systems with and without the incorporation of a graphene nanosheet.
Figure 12.
Pore size distribution after 56 million iterations for both systems with and without the incorporation of a graphene nanosheet.
Disclaimer/Publisher’s Note: The statements, opinions and data contained in all publications are solely those of the individual author(s) and contributor(s) and not of MDPI and/or the editor(s). MDPI and/or the editor(s) disclaim responsibility for any injury to people or property resulting from any ideas, methods, instructions or products referred to in the content. |
© 2025 by the authors. Licensee MDPI, Basel, Switzerland. This article is an open access article distributed under the terms and conditions of the Creative Commons Attribution (CC BY) license (http://creativecommons.org/licenses/by/4.0/).
Copyright: This open access article is published under a Creative Commons CC BY 4.0 license, which permit the free download, distribution, and reuse, provided that the author and preprint are cited in any reuse.


