
Submitted:
11 April 2025
Posted:
14 April 2025
You are already at the latest version
Abstract
Understanding and optimizing thermal conductivity in epoxy-based composites is crucial for efficient thermal management applications. This study investigates the anisotropic thermal conductivity of a tetra-functional epoxy resin filled with low concentrations (0.25–2.00 wt%) of carbonaceous nanofillers: 1-D multiwall carbon nanotubes (MWCNTs) and 2-D exfoliated graphite (EG) nanoparticles. Epoxy formulations incorporating MWCNTs exhibit a ~60% increase in in-plane thermal conductivity (λI-p dir.) compared to the unfilled resin, with negligible changes in the through-plane direction (λT-p dir.). Conversely, EG nano-particles enhance thermal conductivity in both directions, with a preference for the in-plane direction, achieving a ~250% increase at 2 wt%. In light of this, the graphene-based fillers establish a predominant thermal transport direction in the resulting nanocomposites due to their layered structure, whereas MWCNTs create unidirectional thermal pathways. Experimental measurements, conducted using the Transient Plane Source (TPS) method, were complemented by multiphysics simulations in COMSOL and theoretical studies based on the theory of thermal circuits to explain the observed phenomena and justify the experimental findings. The TPS results reveal distinct behaviors depending on the nanofiller geometry. This integrated approach, combining experiments, theoretical analyses, and simulations, demonstrates the potential for tailoring the thermal properties of epoxy nanocomposites. These insights provide a foundation for developing advanced materials optimized for efficient thermal management in high-performance systems.
Keywords:
epoxy resin
; thermal conductivity
; simulation study
; thermal anisotropy
1. Introduction
Efficient thermal management of heat dissipation is crucial in determining the performance, reliability, and longevity of advanced miniaturized devices used in various fields of technology [1]. These include, but are not limited to, electronic components such as central processing units (CPUs) and graphics processing units (GPUs) in computers, optoelectronic systems like high-power light-emitting diodes (LEDs), photonic devices, rechargeable batteries, and electronic packaging systems.
The miniaturization of devices and demand for higher performance increase power densities, generating more heat per unit volume. Without effective thermal management, overheating can degrade materials, reduce performance, and lead to device failure [2]. One promising approach to addressing this challenge is to enhance the thermal conductivity of the interface materials used within these systems. Thermal interface materials (TIMs) play a crucial role in efficiently transferring heat from the heat-generating components to the surrounding cooling systems [3]. Improving the thermal conductivity of TIMs ensures faster heat dissipation, minimizing thermal resistance at interfaces and mitigating the risk of thermal runaway. Also, studies, such as those by Razeeb et al. [4] and Pop et al. [5], have highlighted the importance of advanced TIMs for sustaining the reliability of next-generation electronics. Recent innovations in thermally conductive materials, especially graphene and CNTs, highlight their potential to enhance heat transfer in TIMs due to graphene's high in-plane conductivity and CNTs' unidirectional thermal transport [6]. When incorporated into polymer matrices, such as epoxies, these nanomaterials form conductive networks that facilitate efficient heat dissipation across interfaces [7,8].
Improving the thermal conductivity of TIMs is essential for effective heat management, preventing overheating, and extending device lifespan in advanced electronic, optoelectronic, and photonic technologies. Polymer-based TIMs are widely used due to their advantageous properties, including lightweight nature, making them ideal for aerospace and portable applications. They are also easy to process, allowing for versatile fabrication, and offer excellent corrosion resistance, ensuring durability in harsh environments. Additionally, their cost-effectiveness compared to metal or ceramic alternatives makes them highly suitable for large-scale manufacturing and commercial use.
However, a significant drawback of conventional polymers is their inherent thermal insulation. Most unmodified polymers have a low thermal conductivity, typically ranging from 0.1 to 0.5 W/m·K, which is orders of magnitude lower than metals (e.g., copper: ~400 W/m·K, aluminum: ~200 W/m·K) or advanced carbon-based materials (e.g., graphene: >2000 W/m·K) [9]. The low thermal conductivity of polymers limits their effectiveness in applications requiring efficient heat dissipation. To overcome this, researchers have developed strategies to enhance their conductivity while preserving their advantages. A widely used method is the incorporation of thermally conductive fillers, such as ceramic particles (e.g., aluminum oxide, boron nitride) or carbon-based materials (e.g., graphene, carbon nanotubes), which form thermal pathways within the polymer matrix. Notably, graphene nanoplatelets, with their exceptionally high thermal conductivity, can significantly improve polymer composites' heat transfer while maintaining their lightweight and flexible properties [10].
Similarly, boron nitride fillers have demonstrated effective thermal enhancement, leveraging their anisotropic heat transport properties and chemical stability [11]. Despite these advancements, the performance of TIMs is often constrained by factors such as the dispersion quality of the fillers, interfacial thermal resistance between the filler and the polymer matrix, and the percolation threshold required to form a continuous thermal network [12]. Enhancing polymer-based TIMs through surface functionalization or optimized filler alignment remains crucial for improving thermal performance. Recently, CNTs and graphene nanoparticles have gained attention for their nanostructures and exceptional properties, including high mechanical strength, electrical conductivity, and superior thermal conductivities of up to 3000 W/m·K and 5000 W/m·K, respectively. [13,14]. However, the thermal conductivity (λ) of carbon-based composites, falls significantly short of the values estimated from theoretical predictions [15,16,17].
This discrepancy stems from challenges in achieving uniform graphene dispersion, strong interfacial adhesion, and optimal orientation within composites. Extensive research has focused on improving filler dispersion and interfacial properties, resulting in significant advancements [18,19,20]. Graphene exhibits strong intrinsic anisotropy, primarily due to its unique two-dimensional (2D) structure composed of sp²-hybridized carbon atoms arranged in a hexagonal lattice along the basal plane [21]. This structural configuration results in highly directional thermal transport behavior. Experimental studies have demonstrated that graphene’s in-plane thermal conductivity is remarkably high, ranging between 1000 and 5300 W/m·K, whereas its cross-plane (or through-plane) thermal conductivity is significantly lower, typically falling within the range of 5 to 20 W/m·K [22]. This stark contrast in thermal conductivity arises from strong covalent bonds within graphene’s basal plane, enabling efficient phonon transport, while weak van der Waals forces between layers create thermal resistance in the through-plane direction. Similarly, carbon nanotubes (CNTs) exhibit high axial thermal conductivity (>3000 W/m·K) but lower radial conductivity due to weak inter-tube interactions. Unlike graphene’s planar heat flow, CNTs' quasi-1D structure directs heat along their length, with additional phonon scattering from their curvature. These differences are key in choosing between graphene and CNTs for thermal management, depending on heat dissipation needs and integration strategies.
A novel approach for estimating the overall thermal conductivity of particulate composites with interfacial thermal resistance is presented by Nan et al [23]. This method integrates an effective medium theory with the fundamental principle of Kapitza thermal contact resistance to provide a comprehensive predictive framework. Regarding the aforementioned approach, Chu et al. conducted an initial and interesting investigation into the controlled orientation of graphene within a metal matrix and its influence on the directional thermal properties of the resulting composites [24]. Their findings revealed an inverse anisotropic relationship between thermal conductivity (TC) and the coefficient of thermal expansion (CTE) with increasing graphene nanoplatelet (GNS) content. Notably, in-plane TC showed significant enhancement over through-plane TC, emphasizing the importance of graphene alignment in heat dissipation.
Directional dependence of thermal characteristics in boron carbide–graphene platelet composites was observed by Rutkowski et al. [25]. Chen and Gao investigated the transport behavior of graphene-nanoplatelet-based composite materials to identify the origins of anisotropy and explore effective methods for its control [26]. Currently, numerous studies have explored the anisotropic heat transfer properties of carbon-based materials [27,28]. However, there is a lack of comprehensive reviews addressing their development, existing challenges, and future perspectives.
This work experimentally investigates the intrinsic anisotropic thermal transport in nanocomposites incorporating one-dimensional (CNTs) and two-dimensional (exfoliated graphite, EG) fillers. To support the experimental findings, a morphological analysis is conducted to assess the dispersion of fillers within the epoxy matrix, which serves as the composite phase. Furthermore, multiphysics simulations are performed to gain deeper insights and, more importantly, to provide a three-dimensional graphical analysis of the thermal properties of these materials.
Additionally, a theoretical study based on an equivalent thermal circuit model is presented, focusing on graphene-based composites, where thermal anisotropy is more pronounced compared to CNT-based systems. The aim of this study is to enhance understanding in this field while offering valuable implications for emerging thermal management applications.
2. Materials and Methods
2.1. Sample Preparation
The epoxy matrix was formulated by blending tetraglycidyl methylene dianiline (TGMDA), an epoxy precursor with an equivalent weight of 117–133 g/eq, with 1,4-butanediol diglycidyl ether (BDE), a reactive monomer serving as a diluent. The curing process was facilitated by the addition of 4,4′-diaminodiphenyl sulfone (DDS) as the hardener. The epoxy system was prepared by maintaining an 80:20 TGMDA to BDE weight ratio, optimizing the balance between crosslinking density and matrix flexibility. The incorporation of BDE as a reactive diluent in unfilled and nanofilled epoxy formulations based on TGMDA has effectively reduced viscosity, enhancing processability and filler dispersion within the polymer network [29].
Figure 1 illustrates the chemical structures of the compounds utilized in the TBD epoxy matrix nanocomposites.
Carbon-based nanostructures, specifically Multiwall Carbon Nanotubes (MWCNTs) and Exfoliated Graphite (EG), were incorporated into an epoxy resin matrix to enhance its physical properties. The MWCNTs (Grade 3100) were sourced from Nanocyl S.A., and Transmission Electron Microscopy (TEM) analysis revealed that the outer diameter of the MWCNTs ranged from 10 to 30 nm, with lengths varying from hundreds of nanometers to several micrometers. These nanotubes exhibited wall counts ranging from 4 to 20 layers. The specific surface area of the MWCNTs, as determined using the Brunauer–Emmett–Teller (BET) method, was approximately 250-300 m²/g. The carbon purity of the MWCNTs was >95%, with metal oxide impurities constituting less than 5%, as confirmed by thermogravimetric analysis.
The Exfoliated Graphite (EG) was synthesized through intercalation and exfoliation techniques, starting with natural flake graphite of approximately 500 µm in average diameter. In this study, the EG sample used contained 56% exfoliated phase. The epoxy resin blend and DDS (diamino-diphenyl sulfone) were mixed at 120°C, followed by the addition of the carbon-based nanoparticles, which were integrated into the matrix using ultrasonic processing for 20 minutes. The resulting epoxy nanocomposites were prepared with two different nanoparticle loadings, specifically 0.5% and 1% by weight. The curing process consisted of a two-stage isothermal cycle: an initial stage at 125°C for 1 hour and a second stage at 200°C for 3 hours. For clarity, the unfilled epoxy resin is referred to as TBD (TGMDA + BDE + DDS), while the nanocomposites are denoted as TBD+X(nanofiller), where X represents the percentage of the nanofiller used.
2.2. Thermal Analysis
The study measured anisotropic thermal conductivity using the Hot Disk® 2500S thermal analyzer (mod 2500S, Hot-Disk AB Gothenburg - Sweden), following the ISO 22007-2 standard. The Transient Plane Source (TPS) method was applied to evaluate the in-plane (λI-p dir.) and trough-plane (λT-p dir.) thermal conductivity of carbon nanotube (CNT) and exfoliated graphite (EG) epoxy-based nanocomposites, which are assessed along the x and z axis, respectively. A nickel sensor was placed between cylindrical sample pieces, acting as a heat source and temperature sensor. A current pulse generates heat, and the temperature rise over time is recorded via the change in electrical resistance (R(t)).
The sensor's resistance change is expressed as:
where R0 is the initial resistance of the sensor before heating [Ω], ΔTi is the temperature difference across the heat sensor insulation layer [K], and ΔT(τ) represents the temperature increase of the sensor’s outer surface [K]. Naturally, the temperature coefficient of the electrical resistance of the heating element (α, [1/K]) must be known. The mean temperature increase of the material is given by:
with P0 constant heating power of the sensor [W], f(λI-p dir., λT-p dir.) is a function of a uniform in-plane and trough-plane thermal conductivity [W/m K] and is a dimensionless time function.
Further equations to determine the thermal properties are:
where and are the measured thermal diffusivity values, C=ρ∙cp is the heat capacity per volume [J/(m3s)] calculated in advance, using a Differential Scanning Calorimeter according to the ASTM E1269/DIN 51007, ρ and cp are the density [kgm-3] and the specific heat [J kg-1K-1].
Five measurements per sample were averaged for reliability, omitting the initial 50 data points to mitigate the influence of contact resistance. The probing depth and optimal measurement time (80s at 0.1W) were determined to ensure accurate results while minimizing sensor-sample contact resistance effects.
This method precisely characterizes thermal transport properties in anisotropic ma-terials, which are essential for nanocomposite applications. Spinelli et al. [30] have exten-sively documented the complete mathematical framework and methodology employed in the TPS technique. Figure 2 provides a visual overview highlighting the key principles of this approach for reference.
2.3. Morphological Analysis
The morphological characteristics of the obtained nanocomposites were analyzed using a Field Emission Scanning Electron Microscope (FESEM) (JSM-6700F, JEOL), operating at 3 kV. Thin sections of the nanocomposites were prepared by slicing solid samples with a sledge microtome, followed by an etching process before FESEM observation, as schematically summarized in Figure 3. The etching solution was prepared by dissolving 1.0 g of potassium permanganate in a mixture of 95 mL sulfuric acid (95–97%) and 48 mL orthophosphoric acid (85%) under continuous stirring. The resin-filled samples were submerged in this freshly prepared reagent at room temperature, with agitation maintained for 36 hours. To remove residual reagents, the samples underwent a multi-step washing process: first, they were rinsed with a cold solution composed of 2 parts concentrated sulfuric acid and 7 parts water. This was followed by treatment with a 30% hydrogen peroxide aqueous solution to eliminate any remaining manganese dioxide. Finally, the samples were washed thoroughly with distilled water and left under a vacuum for 5 days to ensure complete drying. The etching procedure adopted in this work has proved very effective in analyzing the correlation between the nanofiller properties and related composites [31].
2.4. Multiphisic Study
Experimental findings on thermal anisotropy were extensively analyzed using COMSOL Multiphysics® (version 6.1) simulations based on the Finite Element Method (FEM). The approach uses representative volume elements (RVEs) with different numbers of filler particles to capture thermal transport accurately. The study focuses on graphene-based composites, which show more pronounced anisotropic behavior than CNT-filled systems, with the Heat Transfer in Solids module used for thermal simulations. The simulations are based on applying a thermal gradient in two distinct directions: (i) through-plane, along the thickness of the composite, and (ii) in-plane, aligned with the graphene sheet orientation. Given the inherent symmetry of the structure, the thermal behavior along the y-direction mirrors that observed in the x-direction. As a result, the corresponding data and analysis for the y-direction do not provide additional insight and have been intentionally omitted throughout the discussion to maintain clarity and conciseness. This choice allows for a more streamlined presentation without compromising the completeness of the study.
Figure 4 depicts the essential model definitions used in the simulations alongside a schematic representation of the case studies considered.
This dual approach allows for a detailed evaluation of key thermal properties, particularly heat flux and temperature distribution as well as effective thermal conductivity in different orientations.
Once the geometry of the graphene nanoplatelet is fixed, the different sizes of the representative cell, in the case of a single sheet versus 27 particles, stem from the necessity to ensure equal alternative pathways for both the resin and the filler in the two observation directions.
The governing heat balance equations are explicitly reported below, while the initial and boundary conditions applied in both simulation cases, ensuring a well-posed problem, are summarized in Table 1.
More in detail, the thermal energy equation governing the heat conduction in a solid (at constant pressure) can be written in a three-dimensional Cartesian coordinate system, considering a small finite differential volume element characterized by the dimensions dx, dy and dz along the x-, y-, and z-axes, respectively as equation 4 for the graphene and equation 5 for the polymer.
where ρg and ρm are the graphene and polymer density [kgm-3], respectively, cpg and cpm are their specific heat [J kg-1K-1], λm, λgx,y and λgz represent, respectively, the thermal conductivity of the polymeric material, the thermal conductivity of graphene in the x- and y-directions (which are equal), and the thermal conductivity of graphene in the z-direction, perpendicular to its plane, all expressed in [Wm-1K-1].
Finally, , represent the second-order partial derivatives of the temperature function T with respect to the spatial coordinates x, y, and z.
2.4. Thermal Circuit Theory
The thermal behavior of the composite material was analyzed along both the in-plane and through-plane directions using thermal circuit theory. This approach enables a simplified yet effective representation of heat transfer mechanisms by modeling the composite as an equivalent network of thermal resistances. By applying this method, it was possible to capture the anisotropic heat conduction behavior of graphene-based composites, supporting both numerical simulations and experimental findings.
Similarly to the simulation study, the theoretical calculations assume the same symmetry condition, whereby the results along the y-direction are equivalent to those along the x-direction. Therefore, they are not reported, as they would be redundant and offer no additional insight. As illustrated in Figure 5, the through-plane and in-plane heat transport (left and right schematic, respectively) was modeled as a parallel and series arrangement of thermal resistances whose parameters are dictated by the dimensions of the polymer and graphene subdomains into which the representative domain of the composite is divided as well as by the intrinsic thermal conductivities of both the polymer matrix and the graphene filler in its two directions.
More in detail, heat flows sequentially through alternating polymer and graphene layers or exclusively polymer, with each material contributing a resistance term (Rip and Rig).
Regarding the heat transfer through the plane (j=z) or in the plane (j=x), the total thermal resistance in the direction of flow (Rj) is determined by the resistances in parallel in the plane orthogonal to the direction of flux and by the resistances in series along the direction of flux with which each parallel resistance is composed; the resistances offered by the individual subdomains layers of graphene and polymer are defined as follows:
where Lipj and Ligj are the thicknesses of the polymer and graphene layers, respectively; λp and λg,j denote the thermal conductivities of the polymer and that of graphene in j-direction, whereas represents the cross-sectional area of heat transfer, expressed as:
In the above equation, Lipy, Lipx, and Lipz represent the length, width and thickness of the polymer domain along the y- -x and z-axes, respectively, while Ligy, Ligx and Ligz denote the corresponding dimensions of the graphene domain.
The thermal circuit approach enables the determination of the heat flow components in both directions using the governing equations:
where Qj, Rj and ΔTj represents the heat flow, the overall resistance and the corresponding imposed temperature differences in the through-plane and in-plane directions. Once these quantities are known, the corresponding thermal conductivities can be determined using Fourier’s law of heat conduction, according to which the heat flux by conduction in one direction is proportional to the tem-perature gradient in the same direction through a constant of proportionality coinciding with the thermal conductivity, described by:
where qj is the heat flux (the amount of heat flowing per unit area per unit time, in units of W/m2) in the investigated directions (z and x), λj is the thermal conductivity of the material (in units of W/m⋅K), dTj/dj is the temperature gradient in the direction of heat transfer (in units of K/m).
The analysis is conducted with reference to a representative volume containing a single graphene platelet oriented parallel to the xy-plane. This setup allows for an isolated evaluation of the influence of the filler on the effective thermal conductivity of the resulting composite when the temperature difference is applied along x or z direction. This approach can be systematically extended, with appropriate considerations, to a larger number of filler particles (27 in this study), even when arranged arbitrarily. The latter case has been addressed using multiphysics simulation software to optimize computational feasibility. In all cases, the selected geometry is specifically designed to ensure identical spacing for the resin and graphene in the axial (z-direction) and in-plane (x-direction) directions. This configuration allows for an exclusive focus on the effect of heat flux propagation along these two dimensions while eliminating geometric factors that could otherwise influence the results. For instance, in the simplest case of a single graphene sheet, which serves as the initial reference due to its fundamental nature, moving along either the z-direction or the x-direction always results in encountering identical resin/graphene subdomain dimensions. This ensures a uniform and controlled environment for analyzing the heat flux behavior without introducing additional complexities related to geometric variations. In summary, this theoretical framework aims to quantify the impact of graphene’s anisotropic thermal properties on heat conduction, providing fundamental insights into the design of thermally efficient nanocomposites. This analytical treatment is a valuable tool for validating the experimental measurements and the numerical simulations performed in this study. Combining the thermal circuit approach with finite element simulations performed in COMSOL Multiphysics makes it possible to accurately quantify the anisotropic heat transport properties and predict the effective thermal conductivity in both directions.
3. Results and Discussions
This section presents the experimental results on the thermal conductivity of carbon-based composites at different weight percentages. A detailed morphological analysis is con-ducted to examine the dispersion and arrangement of the fillers within the polymer ma-trix. A theoretical study based on a thermal equivalent circuit is also introduced to model heat transfer behavior. To further support the experimental findings, a multiphysics simulation study is performed, providing a comprehensive understanding of the thermal performance of the composites. The combination of experimental, theoretical, and numerical approaches allows for a thorough evaluation of the key factors influencing thermal conductivity.
3.1. Experimental Thermal Conductivity Evaluation
Figure 6 compares the experimental results on the thermal conductivity (λ) of composites of tetrafunctional epoxy resin, modified with low weight percentages (up to 2% wt) of fillers: carbon nanotubes (CNT) on the (a) panel and exfoliated graphite (EG) on (b). The thermal conductivity is analyzed in two directions: through-plane (λT−p dir., represented by blue squares) and in-plane (λI-p dir., represented by pink circles). The data clearly indicate, in accordance with current literature [32,33], that epoxy composites incorporating 2D exfoliated graphite nanoparticles exhibit superior heat transport properties compared to those loaded with one-dimensional carbon nanotubes (CNTs). This observation underscores the improved thermal conductivity of epoxy composites enhanced by exfoliated graphite, highlighting the distinct influence of nanoparticle morphology on heat conduction.
As already reported in literature [34] the transport of thermal energy in carbon-based nanostructures primarily occurs through a phonon conduction mechanism, which is influenced by factors such as the number of active phonon modes, boundary surface scattering, the free path length of electrons and phonons, and inelastic Umklapp scattering. In multi-walled carbon nanotubes (MWCNTs), the 1D tubular structure tends to form entangled networks the epoxy resin may not effectively wet the inner surfaces. This poor interfacial contact results in a high thermal boundary resistance, also known as Kapitza resistance (Rk), which limits heat transfer between the filler and the organic matrix. Conversely, exfoliated graphite (EG), with its 2D planar structure, provides a significantly larger interfacial contact area with the epoxy matrix. The easier wetting of the nanofiller surfaces enhances the adhesion of graphene sheets to the matrix, forming a well-connected thermal network within the composite. This arrangement is ideal for efficient phonon transport, leading to a much lower Kapitza resistance than CNTs and, consequently, improved thermal conductivity.
More in detail, the experimental results of Figure 4 also show that for CNT-based composites the through-plane conductivity (λT−p dir.) remains relatively low, with a slight increase as the filler concentration increases. The in-plane conductivity (λ I−p dir. ) initially increases but then stabilizes around 0.4 W/mK. Overall, CNTs provide moderate enhancement in in-plane thermal conductivity but have a limited impact on through-plane conductivity. For EG-based composites, the through-plane conductivity (λT−p dir.) increases more significantly than in CNT-based composites, suggesting better heat transfer in this direction. The in-plane conductivity (λI−p dir.) follows a strong upward trend, reaching values close to 1 W/mK at 2 wt% filler concentration. Compared to CNTs, EG demonstrates superior enhancement in both thermal conductivity directions, especially in-plane. To summerize, EG-based composites outperform CNT-based composites in both in-plane and through-plane conductivity. CNTs exhibit weaker improvements in through-plane conductivity, likely due to their elongated shape and orientation within the matrix. EG provides a more efficient heat transfer network, especially in-plane, due to its layered structure and higher intrinsic thermal conductivity. These results suggest that EG would be a more effective filler for applications requiring high thermal conductivity than CNTs, particularly for enhancing in-plane heat dissipation.
3.2. Morphological Investigation
The FE-SEM images of Figure 7 provide essential insight into the morphology of nanocomposites containing 2% nanofillers: multi-walled carbon nanotubes (MWCNTs) in (a) and exfoliated graphite (EG) in (b), respectively. In both cases, the dispersion of the nanofillers appears to be well achieved, which is crucial for optimizing the electrical, mechanical, and thermal properties of the composite.
The morphology of the carbon nanotube-based composite shows an entangled net-work of CNTs embedded in the polymer matrix. This interconnected structure is beneficial for electrical conductivity as it facilitates charge transport by forming conductive path-ways. From a thermal transport perspective, the highly conductive nature of individual CNTs (with intrinsic thermal conductivity exceeding 3000 W/mK) plays a dominant role. Heat conduction in the composite is expected to be more efficient within the plane of the sample, where CNTs establish continuous thermal pathways. However, in the through-plane direction, thermal conductivity enhancement is significantly lower. This limitation is attributed to interfacial thermal resistance between the nanotubes and the polymer matrix, as well as phonon scattering at tube junctions and polymer intercalation regions. These factors hinder effective phonon transport across the composite thickness, reducing the thermal conductivity improvement in the perpendicular direction. Differently, the composite containing exfoliated graphite (EG) exhibits a characteristic layered morphology, where graphene sheets are dispersed but remain mostly parallel to the substrate. This structural arrangement has a profound impact on the thermal properties of the material. Due to the strong in-plane sp² carbon-carbon bonds within graphene layers, thermal conductivity is extremely high along the planar direction, reaching values comparable to bulk graphite (above 5000 W/mK). However, in the through-plane direction, heat transport is significantly hindered by the weak van der Waals interactions between stacked graphene sheets. These weak interlayer bonds introduce considerable thermal resistance, leading to poor vertical heat transfer. As a result, the composite exhibits a highly anisotropic thermal behavior, favoring lateral heat dissipation while limiting heat conduction perpendicular to the plane. In brief, both nanocomposites demonstrate anisotropic thermal properties due to their respective fillers' intrinsic characteristics and dispersion. While CNTs create a fibrous network that enhances in-plane thermal transport with minimal impact in the through-plane direction, exfoliated graphite forms layered structures that maximize in-plane conductivity while significantly restricting vertical heat transfer. The FE-SEM images support these findings by revealing the distribution, connectivity, and orientation of the nanofillers, which directly influence the macroscopic thermal performance of the composites. These results are particularly relevant for applications requiring efficient lateral heat dissipation, such as thermal interface materials, electronic cooling systems, and advanced heat management coatings.
3.3. Simulation Results
This section presents multiphysics simulation results examining the influence of the number and orientation of graphene platelets within the matrix on the thermal properties of the resulting materials. The analysis focuses on heat flux, thermal conductivity, and the spatial-temporal temperature distribution, offering insights into the heat transfer mechanisms governing these composites.
3.3.1. Case Study of a Single Graphene Platelet Parallel to the xy-Plane
The preliminary results presented in this subsection highlight the influence of a single graphene nanoplatelet (GNP) embedded in a resin matrix. The orientation of the GNP is set to 0 radians, meaning it lies parallel to the x-y plane. Figure 8(a) presents the evolution of the temperature with time. The temperature decreases in both directions, but slower in the in-plane direction (x-direction) than in the through-plane direction (z-direction). Figure 8(b) illustrates the evolution with time of the total heat flux components along the in-plane (x-direction) and through-plane (z-direction) directions. Initially, during the transient phase, both flux components decay sharply, in accordance with the temperature decrease in the same directions, and then each component asymptotes to a different constant value, once the equilibrium conditions are reached. Specifically, the flux in the z-direction decays faster than the one in the x-direction and reaches a steady state value (Qz = −6304.2 W/m²) in about 2 seconds, which is higher than the one reached along the x-direction in about 3 seconds (Qx = −4451.6 W/m²) because the temperature gradient along z is much higher than the gradient in the x-direction, even though the thermal conductivity in the plane is higher than that across the plane.
On the other hand, considering the balance equations for each component in a single direction it is possible to determine the characteristic time of the conductive phenomenon in that direction:
where Ligj and Lipj, αgj and αpj are the thermal diffusivity and length of graphene and polymer subdomain in the j-direction. In particular, the characteristic times of the conductive phenomenon are longer along the x-direction for both graphene and polymer considered separately, so that also the characteristic time of the conductive phenomenon in the entire composite domain is slower in the x-direction than in the z-direction.
The numerically calculated thermal conductivity in the x-direction (λx = 0.2487 W/mK) is slightly higher than the intrinsic thermal conductivity of the pure resin (0.235 W/mK). This increase suggests that even a single graphene nanoplatelet enhances the in-plane heat transfer, albeit modestly. However, the thermal conductivity in the z-direction (λz = 0.2350 W/mK) remains almost identical to that of pure resin, indicating that the presence of the graphene platelet does not significantly impact heat transport in this direction. All numerically calculated thermal data are reported in Table 2.
The two graphs of Figure 9 illustrate the temperature evolution along the symmetry axes in both the in-plane in panel (a) and through-plane directions in panel (b) of the composite material over time.
In the in-plane direction, the temperature distribution shows sharp discontinuities at approximately 500 µm and 1000 µm, corresponding to the resin-graphene platelet interfaces. Within the graphene region, the temperature remains constant, forming a plateau-like profile due to the platelet’s high thermal conductivity whereas a gradual temperature gradient emerges in the surrounding resin. These discontinuities arise from the stark contrast in thermal properties, as the resin’s lower conductivity restricts heat conduction. Conversely, in the through-plane direction, the temperature distribution follows a smooth gradient without significant jumps. The small thickness of the graphene platelet limits its influence on heat transfer, resulting in higher thermal resistance and less efficient conduction across its thickness compared to its plane. Overall, the results highlight the composite’s strong thermal anisotropy, with superior heat propagation along the graphene plane. This behavior is crucial for designing thermally conductive composites, particularly in applications like electronics thermal management and advanced structural materials.
Figure 10 presents a 3D visualization of temperature distribution at t=1 s and t=10 s for in-plane (x-direction) and through-plane (z-direction) heat transfer. More in detail, such temperature profiles are evaluated on a plane pass for the symmetric axis of the zy-plane distribution in the case of in-plane (I-p dir.) analysis or evaluated along transversal planes with respect to the xy-plane of graphene in the case of through-plane (T-p dir.) investigation. At t=1s in the x-direction (Figure 10 a), a strong temperature gradient separates hotter and cooler regions, indicating incomplete heat diffusion. By t=10 s (Figure 10 b), the system reaches near steady-state, with a uniform thermal profile due to graphene’s high in-plane conductivity. Conversely, in the z-direction, temperature gradients remain more pronounced at t=1 s (Figure 10 c) and persist at t=10 s (Figure 10 d), though somewhat smoothed. This highlights graphene’s anisotropic thermal properties, with much lower conductivity in the through-plane direction.
Figure 11 presents the total heat flux, specifically the x-component for the in-plane direction (a) and the z-component for the through-plane direction (b), evaluated at different time instants. In the in-plane direction (panel a), the graphene platelet spans the region from 500 µm to 1000 µm along the x-axis, occupying almost half of the observed length. The curves at different times (up to t =10 s) reveal that the heat flux increases sharply within this interval, reflecting the high thermal conductivity of the graphene compared to the surrounding resin. Over time, the flux profile evolves as heat penetrates the material, but the graphene region consistently exhibits a higher flux, indicating more efficient lateral heat transfer. In the through-plane direction (panel b), the platelet extends only 1 nm, creating a much thinner conductive layer. The flux, therefore, rises in this narrow band, though less dramatically than in the in-plane case, since the path for conduction is limited by the platelet’s small thickness. The inset in the right figure provides a magnified view of this zone, highlighting the local increase in flux as heat crosses the graphene layer. Despite the short distance, the platelet still enhances through-plane conduction relative to the surrounding resin, yet its impact is not as pronounced as along the in-plane axis.
To conclude, the four 3D plots in Figure 12 illustrate the evolution of the heat flux component along different directions at different time instants. The top row displays the heat flux in the x-direction, evaluated on a plane passing through the graphene sheet at t=1 s (a) and at t=10 s (b). The bottom row represents the heat flux distribution in the z-direction, evaluated along a transversal plane at t=1 s (c) and at steady state (t=10 s, d). Compared to the previous 2D-plots, these distributions provide insights into the temporal evolution and spatial localization of the heat transport within the domain. In the x-direction, at t=1 s, heat flux is concentrated near the graphene sheet, indicating strong in-plane conduction. By t=10 s, the flux stabilizes at a higher value and spreads more evenly due to graphene’s high in-plane conductivity. In the z-direction, at t=1 s, a strong gradient near the graphene sheet shows heat is primarily dissipated through the plane. By t=10 s, the distribution becomes more uniform.
Next studies will explore how multiple graphene layers in a 3×3 arrangement with varied orientations influence overall thermal conductivity.
3.3.2. Case Study—Influence of Multiple Graphene Platelets Orientation Relative to Heat Flux Direction on Thermal Properties
Given their highly anisotropic thermal conductivity, graphene platelets play a crucial role in determining heat transfer efficiency and the overall thermal performance of the material. Their orientation relative to the heat flux direction significantly influences the distribution and dissipation of thermal energy, affecting key properties such as thermal conductivity, heat flux pathways, and temperature gradients. Figure 13 illustrates the evolution of the total heat flux (x-component) evaluated in in-plane direction over time for different angles between the heat flow and the graphene plane, specifically from 0 up to π/2. The observed behavior reveals two distinct phases. Initially, there is a rapid decrease in heat flux, indicating a transient phase where heat redistributes quickly within the system. This sharp decline suggests that the material promptly reacts to thermal excitation before stabilizing. As time progresses, the flux approaches a steady-state value after approximately 5 seconds, where the rate of change diminishes, and the system reaches equilibrium. The final flux values depend on the angle, with a clear trend showing that the heat flux decreases as the angle increases.
Table 3 provides a detailed analysis that underscores the significant anisotropy in the thermal transport properties of graphene, encapsulating the previously discussed heat flux values and the newly computed thermal conductivity in the x-direction for various graphene nanoplatelet (GNP) orientations. The data confirmed that graphene exhibits directional dependence in its thermal transport behavior, where heat transfer is most efficient when GNPs are aligned parallel to the heat flux direction. Specifically, at an orientation angle of 0°, the system demonstrates the highest thermal conductivity value of 0.2635 W/mK, accompanied by the highest heat flux of -2039.3 W/m², highlighting graphene’s superior in-plane thermal transport properties. As the orientation angle increases, the thermal conductivity and heat flux progressively decrease. This reduction is more noticeable at intermediate angles, specifically at π/4 and π/3, where the values exhibit a more substantial decline, reflecting the inherent anisotropic nature of the material. At the extreme angle of π/2, which represents a perpendicular alignment to the heat flux direction, the thermal conductivity drops to 0.235 W/mK, and the heat flux reaches -1803.8 W/m², confirming that a perpendicular alignment significantly impedes heat transfer, further illustrating the material's anisotropic behavior. These results reinforce the concept that the efficiency of thermal conduction in graphene is highly dependent on its orientation relative to the heat flux direction. The findings also underscore the importance of considering this anisotropy when designing devices or materials that require precise control over thermal management, especially in applications where directional heat dissipation plays a critical role. The pronounced difference in thermal conductivity between the in-plane and through-plane directions reveals the potential of graphene for specific thermal management applications where heat needs to be directed or controlled in particular orientations.
The macroscopic thermal conductivity of the composite appears to follow the empirical law shown in equation 13, which provides a good interpolation of the numerical data, as evident from the graphical plot of Figure 14.
This equation expresses conductivity as a function of the sine and cosine squared terms, suggesting a dependency on the angular orientation of the graphene nanoplatelets, i.e..
The optimal values for the coefficients A, B, and C, ensuring the best fitting results, are as follows: A=0.07998, B=-0.15407 and C=0.18536.
This correlation aligns with the assumption made for the intrinsic thermal conductivity of the individual graphene sheets (, represented by the following equation:
The above equation models the thermal conductivity of anisotropic graphene, where the conductivity along different directions—denoted by θ, the angle between the heat flow direction and the GNP plane—follows a power-law combination of cosine and sine terms.
This formula reflects the anisotropic behavior of graphene, with the highest thermal conductivity when heat flows along the plane (θ=0, so λg,intr(0) = λI-p dir.) and the lowest when heat propagates perpendicular to the plane (θ=90∘, so λg,intr (90∘) = λT-p dir.).
By assuming such a dependence at the microscopic level for the individual GNPs, the macroscopic behavior of the composite naturally follows a similar angular dependency. The key idea is that the macroscopic conductivity results from the averaging of the anisotropic thermal properties of the individual graphene sheets, weighted by their orientation distribution within the composite. The interpolation law in the above equation 13 thus emerges as a consequence of the orientation-dependent conductivity model used for the graphene inclusions.
3.3.3. Case Study: Thermal Properties of Multiple Graphene Platelets (27) with Aligned, Random, and Perpendicular Orientations with Respect to the xy-Plane
Figure 15 illustrates the time evolution of temperature (probe domain) for three different cases: 0,π/2, and random orientations of graphene nanoplatelets relative to the xy-plane when the heat flow is in the in-plane direction (panel a) and in the through-plane direction (panel b). In both cases, since the thermal conductivity variations among the three cases are relatively minor (λ0≈ λπ/2≈ λRandom), the heat transfer mechanism remains similar, leading to almost indistinguishable temperature responses. The comparison between the two graphs highlights a significantly slower transient in temperature evolution when the temperature difference is applied along the x-direction rather than the z-direction. This slower response (about 30 s against 10 s, respectively) is due to the greater spatial extent in the x-direction, which influences heat diffusion dynamics. As theoretically expected, the equilibrium temperature remains unchanged.
The two plots of Figure 16 report the total heat flux (x-component) computed in the in-plane direction (panel a) and in through-plane direction (panel b) for the three different GNPs orientations —0, random, and π/2 —within the low-conductivity resin matrix.
Each curve exhibits a transient phase that transitions into a steady-state regime, although the transient period in the through-plane direction is notably shorter than in the in-plane direction (about 3 s respect about 5 s).
This difference arises because the distance over which the temperature difference is applied in the z-direction is smaller, allowing the system to reach thermal equilibrium more rapidly.
The orientation of the GNPs, which have much higher thermal conductivity than the resin, plays a key role in determining the steady-state flux.
When GNPs are aligned parallel to the main heat flow (orientation 0), the effective thermal conductivity is higher, leading to a greater flux (-2039.3 W/m2).
Conversely, when they are perpendicular (π/2), the flux is lower (-1803.3 W/m2). In both directions, the random orientation yields intermediate results, reflecting a partial alignment effect.
These observations highlight the importance of anisotropy and geometric configuration for achieving optimal thermal management in composite materials.
Once again, when comparing the transient phase durations in the temperature evolution (previous Figure 15) with those in the total heat flux, it is evident that the temperature transient phase is significantly longer. While the heat flux reaches steady-state conditions within a few seconds (approximately 5 seconds), the temperature requires around 10 or 30 seconds to stabilize. As previously discussed for a single graphene sheet, the prolonged transient temperature phase is due to the material’s thermal inertia, characterized by its heat capacity and diffusivity, while the rapid stabilization of the heat flux follows from Fourier’s law, which depends directly on the imposed thermal gradient.
In summary, the presented numerical results suggest that in practical applications, modifying the orientation of graphene nanoplatelets within this range would not significantly affect the overall temperature field. However, it can still influence the local heat flux distribution, as different orientation values result in different steady-state heat fluxes.
Table 4 compiles the previously discussed heat flux data and the numerical thermal conductivities calculated in both analyzed directions for the different graphene sheet orientation scenarios. In the first configuration, where the graphene sheets are aligned at 0°, the corresponding thermal conductivity values are 0.2658 W/mK in the x-direction and 0.2351 W/mK in the z-direction. This configuration shows better heat transfer along the x-axis due to the alignment of the graphene sheets, but the z-direction conductivity remains relatively low. In the second configuration, the random orientation of GNPs results in a more isotropic behavior, with slightly reduced thermal conductivity in the x-direction (0.2540 W/mK), which improves (0.2431 W/mK) in the z-direction compared to the 0° aligned case. In the third and last configuration, where the graphene sheets are aligned at 90°, the thermal conductivity values are 0.2351 W/mK in the x-direction and 0.3734 W/mK in the z-direction. This configuration greatly enhances heat transfer along the z-direction at the expense of reduced conductivity in the x-direction, demonstrating strong anisotropy. Overall, the 0° aligned configuration favors heat transfer in the x-direction, while the random configuration provides a balance between the x and z directions, making it more isotropic. In contrast, the π/2 aligned configuration enhances heat transfer in the z-direction, making it the best choice for applications requiring efficient vertical heat dissipation.
Figure 17 provides additional evidence of the composite’s anisotropic thermal response, as highlighted by the observed temperature distributions.
In the in-plane direction (a), plateaus correspond to the crossing of graphene nanoplatelets (GNPs), which, given their alignment along the analysis axis and their high intrinsic thermal conductivity facilitate localized thermal equilibrium, reducing temperature gradients within their regions.
As a result, temperature gradients within these regions are minimized, allowing for efficient heat conduction along the plane.
On the other hand, the through-plane profile (b) exhibits a smooth temperature distribution, as the GNPs are only present in their minimal thickness direction. This limits their effectiveness in influencing the heat flow in the through-plane direction.
Consequently, the temperature remains more uniform in the through-plane profile, reflecting the dominance of lateral heat conduction within the composite material.
The relatively poor thermal conductivity in the through-plane direction can be attributed to weak interfacial thermal resistance and limited connectivity between the filler particles, which impede efficient heat transfer.
This stark contrast between the in-plane and through-plane profiles emphasizes the importance of the material’s orientation and structural properties in governing its thermal transport behavior.
Figure 18 shows 3D surface temperature distributions at two different time points—t = 5 s (transient phase) and t = 60 s (steady state)—along the two orthogonal directions relative to the graphene sheets embedded in the composite.
Panels (a) and (b) represent the in-plane (I-p dir.) temperature fields at 5 s and 60 s, respectively, while panels (c) and (d) show the through-plane (T-p dir.) distributions at the same time instants.
In panel (a), during the transient regime, the temperature begins to diffuse primarily along the in-plane direction, following the high thermal conductivity pathways defined by the graphene sheets. By 60 s, as shown in panel (b), the temperature distribution becomes more uniform and widespread in-plane, indicating that thermal equilibrium has been largely reached along this direction.
Panels (c) and (d), corresponding to the through-plane direction, clearly demonstrate a slower heat diffusion process due to the limited thermal conductivity of the resin matrix in the direction orthogonal to the graphene sheets. At 5 s (panel c), the heat penetration is still superficial, while at 60 s (panel d), a more gradual but still non-uniform distribution persists, highlighting the anisotropic thermal response of the composite.
Overall, the 3D representation in these panels offers a richer understanding of the heat propagation dynamics compared to 2D-plots, making the anisotropic effects and the role of graphene orientation more visually and quantitatively evident.
In Figure 19, the heat flux components further illustrate the anisotropic thermal transport in the composite.
In the in-plane direction (a), the flux exhibits periodic dips, aligning with the positions of graphene nanoplatelets (GNPs). This pattern results from the high thermal conductivity of GNPs, which locally redistribute heat, creating non-uniform flux variations. Conversely, in the through-plane direction (b), the flux decreases smoothly, as heat encounters significant resistance due to the minimal thickness and weak interconnectivity of GNPs along this axis. Once again, this confirms that heat preferentially propagates in-plane, while through-plane conduction remains constrained by interfacial limitations.
The 3D surface heat flux distributions shown in Figure 20 complement the total heat flux previously discussed, providing further insight into the thermal behavior of the composite.
Panels (a) and (b) depict the x-component of the total heat flux (surface probe) in the in-plane direction (I-p dir.) at t = 1 s (transient phase) and t = 20 s (steady state), respectively. These plots highlight the preferential heat transport along the graphene sheets, consistent with their higher in-plane thermal conductivity. As a result, the heat flux is more concentrated in the graphene regions, which act as preferential thermal pathways, while the polymeric areas show lower thermal transport. Panels (c) and (d) illustrate the z-component of the heat flux in the through-plane direction (T-p dir.) at the same time points.
The magnitude of the flux in these panels is notably lower and more uniformly distributed compared to the in-plane direction, reflecting the limited thermal transport across the resin-dominated regions.
Overall, the figure emphasizes the strong anisotropic nature of the material, with heat preferentially propagating along the graphene-aligned in-plane pathways, which is especially evident in the early and steady-state phases. The periodic arrangement of the graphene plates suggests an engineered composite structure designed to enhance heat dissipation or directional thermal transport.
Figure 21 illustrates the thermal response of a composite material with randomly dispersed graphene platelets. Specifically, Figures (a) and (b) show the temperature profiles along the in-plane and through-plane directions, respectively, capturing the spatial distribution of heat. Figures (c) and (d) depict the total heat flux components, with (c) representing the x-component in the in-plane direction and (d) the z-component in the through-plane direction, highlighting the flux variations assessed along the corresponding spatial cutlines.
Contrary to the findings presented in the previously discussed results, in this case of randomly dispersed graphene platelets, which represents the most realistic scenario compared to an ordered arrangement of platelets, in the temperature profiles, a plateau is observed only when a high-thermal-conductivity graphene platelet, relative to the surrounding matrix, is entirely crossed by the cutline. This phenomenon corresponds to a parabolic shape in the heat flux profile. From a temporal perspective, temperature profiles remain briefly stable when the cutline transversely intersects the platelets, leading to the appearance of peaks in the heat flux graphs. These peaks arise due to the strong conductivity contrast between the matrix and the platelets, causing rapid local variations in heat transport.
Figure 22 illustrates the 3D surface temperature distributions in a composite containing randomly oriented graphene nanoplatelets (GNPs), highlighting the impact of disordered alignment compared to the previously analyzed case with aligned platelets. Figure 22 a) and Figure 22 b) show the temperature profiles along the in-plane direction (I-p dir.) at t = 5 s (transient phase) and t = 60 s (steady state), respectively.
Compared to the aligned configuration, the temperature distribution here appears less uniform and more scattered, indicating a reduced thermal conductivity in the in-plane direction. The heat spreads in a less directional and more diffused manner, underscoring the loss of thermal guidance provided by aligned platelets. Figure 22 c) and Figure 22 d) display the corresponding temperature distributions in the through-plane direction (T-p dir.) at the same time points. A similar trend is observed, with a less efficient heat transfer and more pronounced thermal gradients. The propagation of heat is visibly hindered, and the surface remains cooler relative to the aligned case, especially at early times. Overall, this figure clearly demonstrates that the random orientation of the GNPs weakens the material’s thermal anisotropy, leading to a less effective and less directed heat transfer in both in-plane and through-plane directions. The 3D visualizations are particularly effective in emphasizing these effects, making the contrast with the aligned configuration immediately apparent.
The graphs of Figure 23 Illustrate the total heat flux components In both the in-plane and through-plane directions at various time instants. Distinct peaks in both components correspond to the regions where the heat flux intersects graphene platelets, which are embedded in a low thermal conductivity resin. In the in-plane direction (Figure 23 a), the first peak exhibits a complete bell-shaped profile, indicating that the heat flux fully traverses the first platelet. This suggests a favorable alignment of the platelet with respect to the x-direction, allowing uninterrupted conduction across its entire length. In contrast, the subsequent peaks are sharper and narrower, indicating only partial intersection with other platelets. These irregularities arise due to the random orientation of the graphene platelets within the resin. As a result, the heat flux encounters varying cross-sectional areas, leading to reduced and asymmetrical peak shapes. A similar behavior is observed in the through-plane direction (Figure 23 b), where the z-component of the heat flux also displays localized peaks at positions where the flux path intersects the platelets. However, due to the orientation and anisotropy, these peaks are generally less intense and more localized than those in the in-plane direction, reflecting the less efficient heat conduction across platelet thickness and through the resin matrix. These results clearly demonstrate the strong dependence of thermal transport behavior on the spatial orientation and distribution of high-conductivity inclusions within a composite material.
The 3D surface distributions shown in Figure 24 complement the 2D results by providing spatial insight into the total heat flux behavior within the composite containing randomly oriented graphene nanoplatelets (GNPs). Panels (a) and (b) show the x-component (in-plane direction) of the heat flux at two time instants: during the transient phase (t = 1 s) and at steady state (t = 20 s). Similarly, panels (c) and (d) depict the z-component (through-plane direction) at the same time points. These 3D visualizations confirm and expand upon the findings from the 2D plots in Figure 23. Specifically, they illustrate how heat flux is locally intensified where the flux paths intersect the platelets. Regions of high flux intensity (marked by peaks or valleys in the surface maps) correspond to areas where the GNPs are more directly aligned with the respective direction of heat flow. This is especially evident in the in-plane direction, where the anisotropic thermal conductivity of the platelets results in stronger and more continuous flux channels at the steady state. In the through-plane direction, the flux distribution appears more scattered and less intense, again reflecting the limited contribution of the GNPs in this orientation due to their thin geometry and poor alignment with the z-axis. Moreover, the differences between the transient and steady-state phases highlight how the redistribution of thermal gradients over time is influenced by the spatial arrangement and orientation of the platelets. Overall, this 3D analysis reinforces the conclusion that platelet orientation plays a critical role in governing thermal transport within the composite and provides a more comprehensive picture of heat flow patterns across all dimensions.
3.4. Theoretical Thermal Analysis
Regardless of the number of graphene nanoplatelets and the observation direction, the methodology adopted for analyzing the thermal properties remains consistent. As illustrated in the simplest case of a single graphene sheet observed along the z-direction (Figure 25), the approach involves decomposing the physical domain into multiple resistive subdomains.
These subdomains are characterized by identical geometric parameters, with their lengths and cross-sectional areas matching those of the graphene structure in the direction of applied heat flow. The total resistance of the examined structure is determined by the series and parallel combination of the subdomain resistances, as schematically represented in Figure 25.
The primary factor that differentiates the analysis for a single graphene sheet from that of multiple nanoplatelets, or when considering alternative heat flow directions, is the number of resistive subdomains into which the system is partitioned. The corresponding resistive terms for the different analyzed cases are explicitly indicated below.
The provided equations 16 describe the effective thermal resistances Rj in a hybrid graphene/polymer system along the j-direction:
Such resistances, in each direction, are modeled as a combination of the thermal resistances associated with graphene-polymer hybrid domains (Rgpj) and those of the purely polymeric domains (Rpj). The structural arrangement of these domains influences heat dissipation, similar to how electrical conductors in parallel distribute current. If the graphene-rich regions provide significantly lower thermal resistance compared to the polymeric regions, the heat flux will predominantly follow these pathways, leading to anisotropic thermal conductivity characteristics in the material.
The coefficients αj and βj likely represent weighting factors that account for the relative contribution of each domain to the overall thermal resistance. More in detail, the coefficients αj and βj represent the number of resistances in parallel on the surface orthogonal to direction j, consisting of graphene-polymer series resistances and polymer-only series resistances, respectively.
This approach ensures that the polymeric contribution to thermal resistance is appropriately weighted according to the actual distribution of graphene platelets within the structure and consistently refers to the direction of exploration under analysis.
Each parallel branch, which may consist of either graphene/polymer hybrid subdomains or purely polymeric subdomains, is specifically evaluated according to the following relationships:
The provided equation defines the hybrid thermal resistance Rgpj in a series configuration for each parallel branch in the composite material, considering both the x- and z-directions, as indicated by the subscript j. This formulation is based on the second law of Ohm applied to heat conduction, which establishes that the total thermal resistance in a series arrangement is the sum of the individual resistances.
In this model, the resistance components are associated with the graphene platelets and the polymer matrix, considering their distinct thermal conductivities and geometric characteristics. The term Ligj represents the characteristic length of the graphene domain in direction j, while Lipj corresponds to the polymer subdomain. The thermal conductivity values λgj and λp describe the heat transport properties of graphene and polymer, respectively. It is important to note that graphene exhibits anisotropic thermal conductivity, meaning that λgx ≠ λgz, while the polymer is assumed to have isotropic conductivity λp .
The parameters γj and δj account for the number of identical series resistances associated with graphene and polymer regions, respectively, within each parallel branch. Specifically, γj quantifies the number of graphene platelets contributing to the series resistance along direction j, whereas δj represents the number of polymer-only segments in the same direction. These factors are essential in accurately modeling the heat transfer pathways as they reflect the structural arrangement of the hybrid composite system. The given equation evaluates the thermal resistance Rpj of purely polymeric parallel branches in the composite system, following the second law of Ohm for thermal conduction. This law states that for a series configuration, the total resistance is the sum of the individual resistances encountered along the heat flow path. In this formulation, the term Rpj represents the overall resistance of the polymer subdomain along direction j, which, once again, can be either x or z. The expression accounts for the number of repeated polymeric resistances in series by including the factor (γj+δj) already defined above.
To conclude, equation 17 estimates the heat flow Qj along the direction j (where j= x or z) in accordance with Fourier’s law, as introduced in the previous Method subsection and, more specifically, in its subsection 3.4 Thermal Circuity Theory. The expression accounts for the contributions of both the hybrid graphene/polymer and purely polymeric domains, weighted respectively by the different coefficients αj, βj, γj and . The temperature difference ΔTj drives the heat flux, which is applied across the opposite faces of the representative volume in the considered direction. The given equation follows an analogy to Ohm’s law, where heat flow (Qj) behaves like electric current (I), temperature difference (ΔTj) resembles voltage (V), and thermal resistance (Rj) corresponds to electrical resistance (R), reflecting Fourier’s law of heat conduction.
This last equation provides a crucial component in modeling the effective thermal behavior of the hybrid graphene/polymer composite. By considering both series and parallel contributions of the composite’s microstructure, it ensures a comprehensive and precise representation of the material’s anisotropic heat transfer properties by enabling a detailed analysis of heat transport in different spatial directions.
The values of all the aforementioned coefficients, evaluated in both the x and z directions, and considering either a single or multiple graphene platelets (27 in total), are systematically summarized in Table 5.
The following Table 6 presents all the computed values for the thermal parameters introduced in this thermal circuitry theory. The reported data include evaluations along the x and z-directions, considering both the simple case of a single graphene platelet and the more complex scenario involving multiple platelets (i.e., 27).
Table 7 compares the simulated and theoretical results for heat flux in both the through-plane direction (qz) and the in-plane direction (qx). The results show that the theoretical values match well with the simulated ones for both a single graphene nanoplatelet (GNP) and the 27-GNP configuration exhibiting a negligible percentage difference, with a maximum deviation of 0.176% in the worst-case scenario. Therefore, the theoretical results are consistent with the simulated outcomes, further supporting the experimental findings.
4. Conclusions
This study provides a comprehensive investigation into the anisotropic thermal conductivity of epoxy-based nanocomposites reinforced with low loadings of carbonaceous nanofillers, namely multiwall carbon nanotubes (MWCNTs) and exfoliated graphite (EG). The experimental results obtained via the Transient Plane Source (TPS) technique highlight the critical role of filler geometry in dictating heat transport behavior within the polymer matrix. Specifically, MWCNTs were found to selectively enhance in-plane thermal conductivity with minimal effect in the through-plane direction, while EG nanoparticles produced significant conductivity gains in both directions, with a stronger influence along the plane. A key strength of this work lies in its integrated approach, where experimental observations are robustly supported by both multiphysics simulations and theoretical modeling. 3D simulations conducted in COMSOL Multiphysics validated and enriched the experimental findings by visualizing local heat flux distributions and confirming the directional nature of thermal transport induced by the nanofillers. The ability to couple numerical modeling with experimental data proved essential for justifying the measured thermal behavior and for predicting trends beyond the experimental range. Complementarily, the introduction of an analytical framework based on thermal circuit theory allowed for a deeper interpretation of the mechanisms underlying anisotropic heat transfer in these heterogeneous systems. This model provided essential insight into how the spatial arrangement and orientation of the nanofillers affect the formation of conductive pathways. Overall, the synergy between experimental techniques, theoretical formulation, and computational modeling not only explains the observed anisotropic conductivity but also offers a reliable strategy for the rational design of thermally conductive polymer composites. These findings pave the way for engineering advanced materials tailored for high-performance thermal management applications.
Author Contributions
Conceptualization, G.S.; R.G. and V.R.; methodology, G.S.; preparation of the formulated nanocomposites, L.V.; morphological analysis, L.V. and C.N.; experimental thermal measurements, V.R. and C.N.; simulation study, R.G.; validation, V.R. and R.G.; formal analysis, L.G.; investigation, R.G. and G.S.; data curation, R.G. and G.S.; writing—original draft preparation, G.S.; writing—review and editing, L.G.; visualization, R.G.; supervision, G.S. and L.G.; funding acquisition, G.S. and L.G.; All authors have read and agreed to the published version of the manuscript.
Funding
This research was funded by the European Union’s Horizon Europe research and innovation programme under Grant Agreement No. 101091828, and supported by private funds from the University 'Giustino Fortunato' as part of Prof. Giovanni Spinelli’s project entitled 'Progettazione, caratterizzazione ed ottimizzazione di materiali nanocompositi con proprietà termoelettriche e meccaniche avanzate'.
Institutional Review Board Statement
Not applicable.
Data Availability Statement
All the necessary data are included in the text.
Conflicts of Interest
The authors declare no conflicts of interest.
References
- Kumar, A.; Dutt, N.; Awasthi, M. K. Heat Transfer Enhancement Techniques: Thermal Performance, Optimization and Applications. 2024, John Wiley & Sons.
- Bianco, V.; De Rosa, M.; Vafai, K. Phase-change materials for thermal management of electronic devices. Applied Thermal Engineering, 2022, 214, 118839.
- Pathumudy, R. D., & Prabhu, K. N. (2021). Thermal interface materials for cooling microelectronic systems: present status and future challenges. Journal of Materials Science: Materials in Electronics, 32, 11339-11366.
- Razeeb, K. M., Dalton, E., Cross, G. L. W., & Robinson, A. J. (2018). Present and future thermal interface materials for electronic devices. International Materials Reviews, 63(1), 1-21.
- Pop, E., Varshney, V., & Roy, A. K. (2012). Thermal properties of graphene: Fundamentals and applications. MRS bulletin, 37(12), 1273-1281.
- Ghosh, S., Calizo, I., Teweldebrhan, D., Pokatilov, E. P., Nika, D. L., Balandin, A. A., ... & Lau, C. N. (2008). Extremely high thermal conductivity of graphene: Prospects for thermal management applications in nanoelectronic circuits. Applied Physics Letters, 92(15).
- Zhang, F., Feng, Y., & Feng, W. (2020). Three-dimensional interconnected networks for thermally conductive polymer composites: Design, preparation, properties, and mechanisms. Materials Science and Engineering: R: Reports, 142, 100580.
- Ma, H., Gao, B., Wang, M., Yuan, Z., Shen, J., Zhao, J., & Feng, Y. (2021). Strategies for enhancing thermal conductivity of polymer-based thermal interface materials: A review. Journal of Materials Science, 56, 1064-1086.
- X. Huang, P. Jiang, T. Tanaka (2011) A Review of Dielectric Polymer Composites with high Thermal Conductivity. IEEE Electr. Insul. Mag. 27, 8-16.
- Yan, R., Simpson, R. E., Bertolazzi, S., et al. (2014). Thermal conductivity and self-heating in two-dimensional atomic crystals. Nature Communications, 5, 3646.
- Zhi, C., Bando, Y., Tang, C., et al. (2009). Boron nitride nanotubes. Materials Science and Engineering: R: Reports, 70, 92–111.
- Yu, A., Ramesh, P., Sun, X., et al. (2015). Enhanced thermal conductivity in a hybrid graphene and boron nitride filler for epoxy composites. ACS Applied Materials & Interfaces, 7(34), 19168–19175.
- Y. Zhou, P. Wu, Z. Cheng , J. Ingram, S. Jeelani (2008). Improvement in electrical, thermal and mechanical properties of epoxy by filling carbon nanotube. Express Polym Lett, 2(1), 40-48.
- A.Yasmin, I.Daniel (2004). Mechanical and thermal properties of graphite platelet/epoxy composites. Polymer, 45(24).
- A. Boden, B. Boerner, P. Kusch, I. Firkowska, S. Reich, Nanoplatelet size to control the alignment and thermal conductivity in copper-graphite composites, Nano Lett. 14 (2014) 3640-3644.
- F. Chen, J. Ying, Y. Wang, S. Du, Z. Liu, Q. Huang, Effects of graphene content on the microstructure and properties of copper matrix composites, Carbon 96 (2016) 836-842.
- T. Wejrzanowski, M. Grybczuk, M. Chmielewski, K. Pietrzak, K.J. Kurzydlowski, A. Strojny-Nedza, Thermal conductivity of metal-graphene composites, Mater. Design. 99 (2016) 163-173.
- Idumah, C. I., & Obele, C. M. (2021). Understanding interfacial influence on properties of polymer nanocomposites. Surfaces and Interfaces, 22, 100879.
- Baig, Z., Mamat, O., & Mustapha, M. (2018). Recent progress on the dispersion and the strengthening effect of carbon nanotubes and graphene-reinforced metal nanocomposites: a review. Critical Reviews in Solid State and Materials Sciences, 43(1), 1-46.
- Chen, J., Liu, B., Gao, X., & Xu, D. (2018). A review of the interfacial characteristics of polymer nanocomposites containing carbon nanotubes. RSC advances, 8(49), 28048-28085.
- A.K. Geim, K.S. Novoselov, The rise of graphene, Nature Mater. 6 (2007) 183-191.
- A.A. Balandin, Thermal properties of graphene and nanostructured carbon materials, Nature Mater. 10 (2011) 569-581.
- Nan, C. W., Birringer, R., Clarke, D. R., & Gleiter, H. (1997). Effective thermal conductivity of particulate composites with interfacial thermal resistance. Journal of Applied Physics, 81(10), 6692-6699.
- Chu, K., Wang, X. H., Li, Y. B., Huang, D. J., Geng, Z. R., Zhao, X. L., ... & Zhang, H. (2018). Thermal properties of graphene/metal composites with aligned graphene. Materials & Design, 140, 85-94.
- Rutkowski, P., Dubiel, A., Piekarczyk, W., Ziąbka, M., & Dusza, J. (2016). Anisotropy in thermal properties of boron carbide–graphene platelet composites. Journal of the European Ceramic Society, 36(12), 3051-3057.
- Chen, J., & Gao, X. (2019). Directional dependence of electrical and thermal properties in graphene-nanoplatelet-based composite materials. Results in Physics, 15, 102608.
- Guadagno, L., Aliberti, F., Longo, R., Raimondo, M., Pantani, R., Sorrentino, A., ... & Vertuccio, L. (2023). Electrical anisotropy controlled heating of acrylonitrile butadiene styrene 3D printed parts. Materials & Design, 225, 111507.
- Aliberti, F., Sorrentino, A., Palmieri, B., Vertuccio, L., De Tommaso, G., Pantani, R., ... & Martone, A. (2024). Lightweight 3D-printed heaters: design and applicative versatility. Composites Part C: Open Access, 15, 100527.
- L. Guadagno, M. Raimondo, V. Vittoria, L. Vertuccio, C. Naddeo, S. Russo, B. De Vivo, P. Lamberti, G. Spinelli, V. Tucci (2014). Development of epoxy mixtures for application in aeronautics and aerospace. RCS Adv., 4(30), 15474-15488.
- Spinelli, G.; Lamberti, P.; Tucci, V.; Kotsilkova, R.; Ivanov, E.; Menseidov, D.; Naddeo, C.; Romano, V.; Guadagno, L.; Adami, R.; et al. Nanocarbon/poly(lactic) acid for 3D printing: Effect of fillers content on electromagnetic and thermal properties. Materials 2019, 12, 2369.
- Aliberti, F., Guadagno, L., Longo, R., Raimondo, M., Pantani, R., Sorrentino, A., ... & Vertuccio, L. (2024). Three-Dimensional Printed Nanocomposites with Tunable Piezoresistive Response. Nanomaterials, 14(21), 1761.
- Balandin, A. A. Thermal properties of graphene and nanostructured carbon materials. Nature materials, 2011, 10, 569-581.
- Marconnet, A. M., Panzer, M. A., & Goodson, K. E. (2013). Thermal conduction phenomena in carbon nanotubes and related nanostructured materials. Reviews of Modern Physics, 85(3), 1295-1326.
- Gojny, F. H., Wichmann, M. H., Fiedler, B., Kinloch, I. A., Bauhofer, W., Windle, A. H., & Schulte, K. (2006). Evaluation and identification of electrical and thermal conduction mechanisms in carbon nanotube/epoxy composites. Polymer, 47(6), 2036-2045.
Figure 1.
Chemical structures of compounds used for the TBD epoxy matrix nanocomposites.
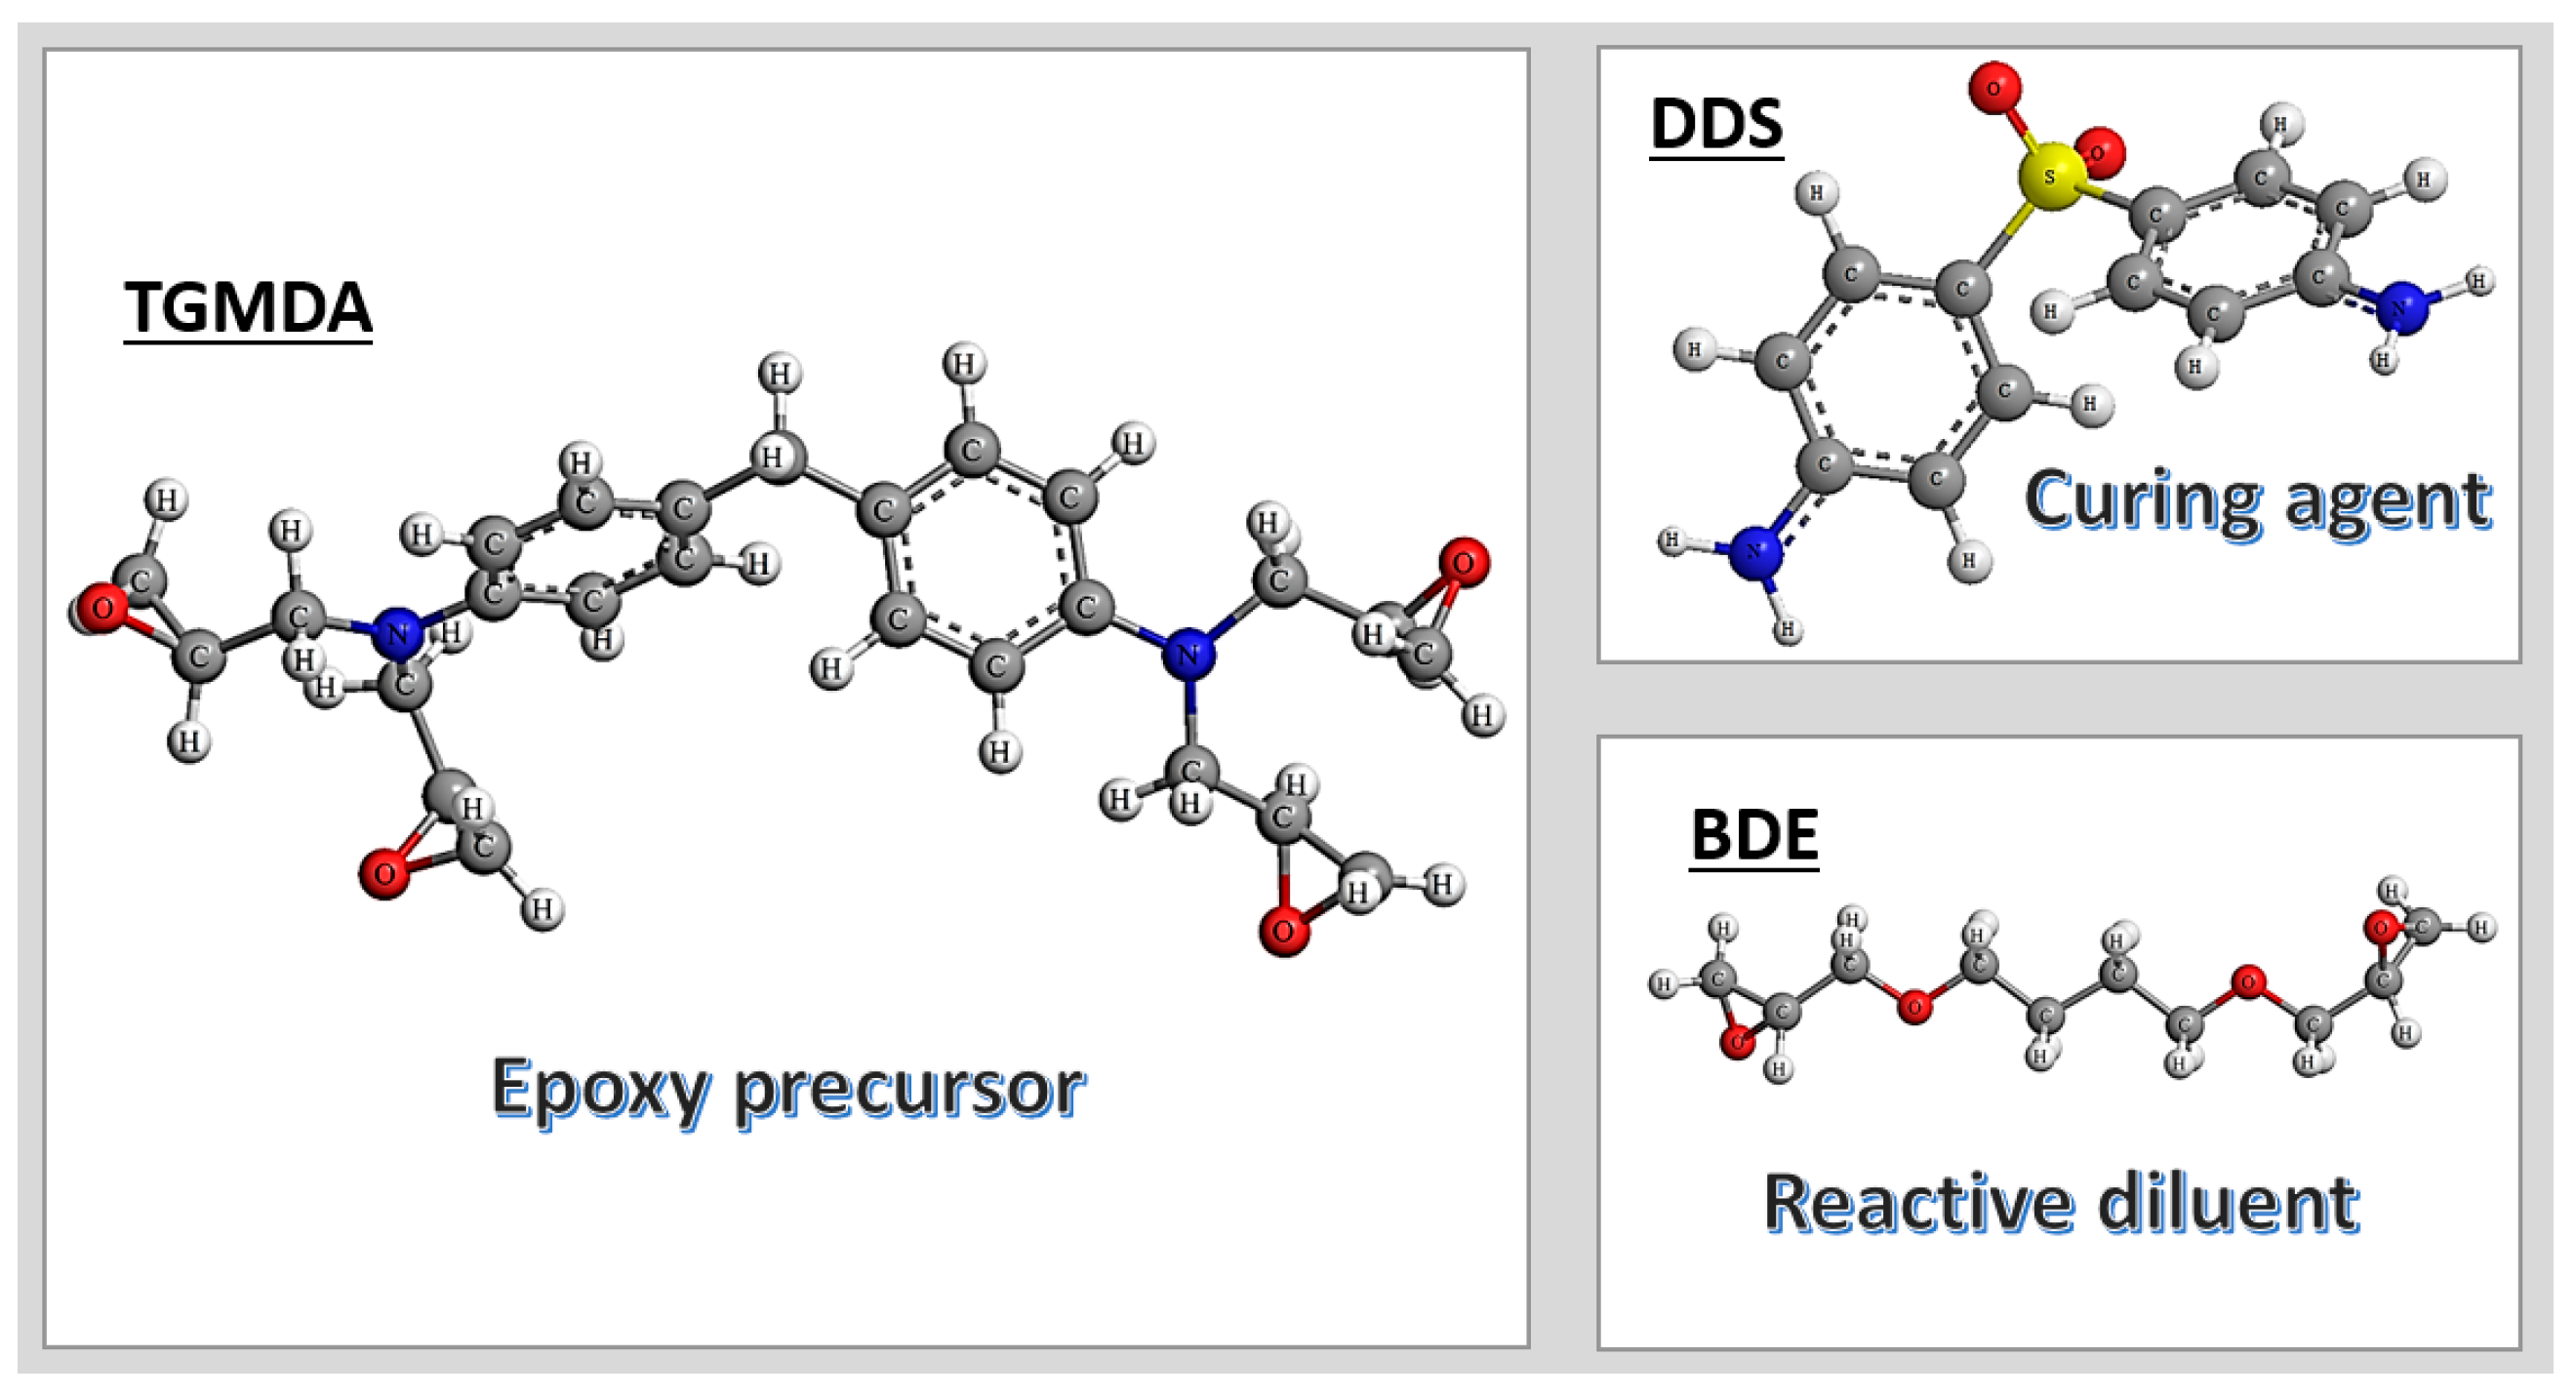
Figure 2.
The Hot Disk® 2500S thermal analyzer, accompanied by a schematic representation of the TPS sensor and actual specimens, including a diagram illustrating their geometrical characteristics.
Figure 2.
The Hot Disk® 2500S thermal analyzer, accompanied by a schematic representation of the TPS sensor and actual specimens, including a diagram illustrating their geometrical characteristics.
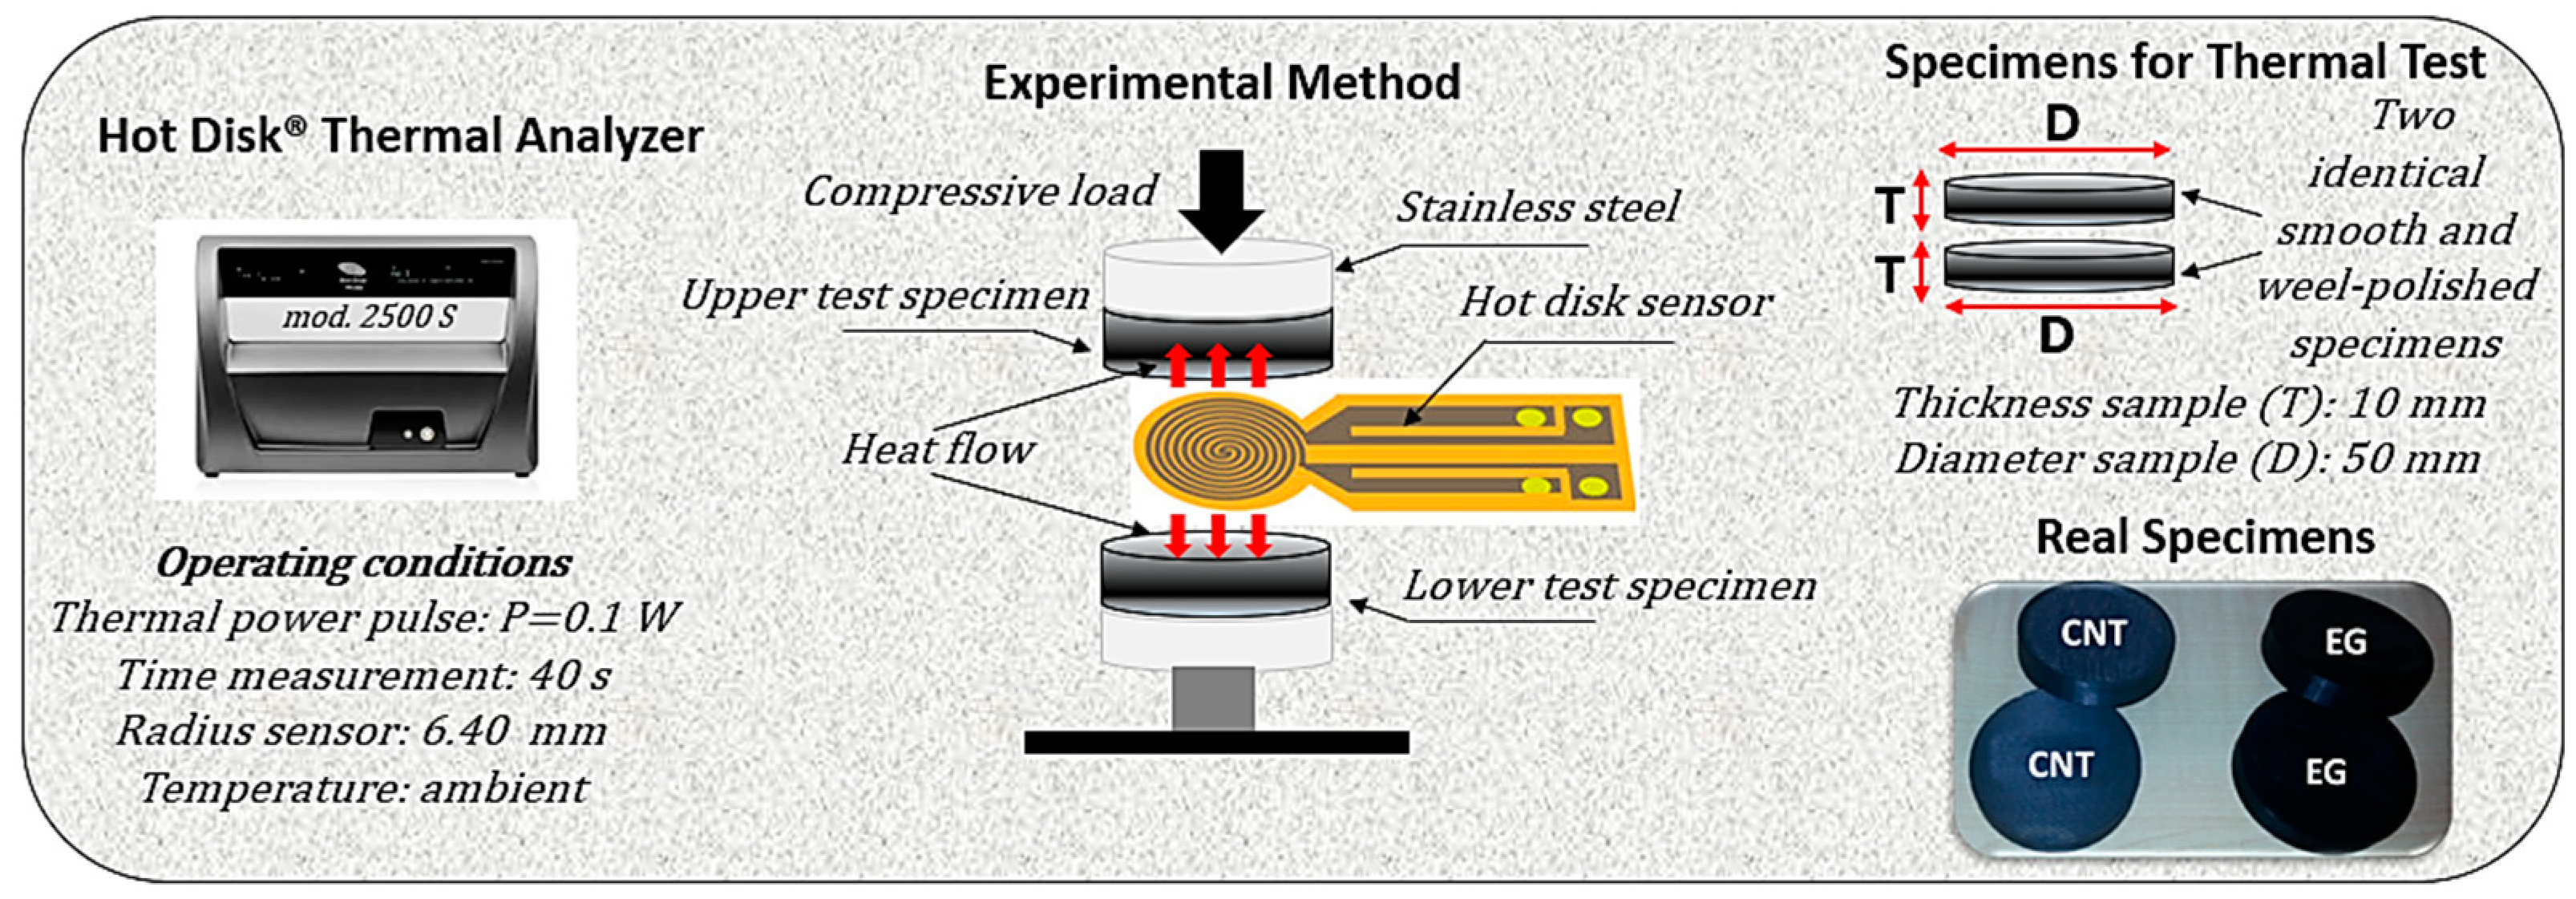
Figure 3.
Schematic representation of the etching procedure.
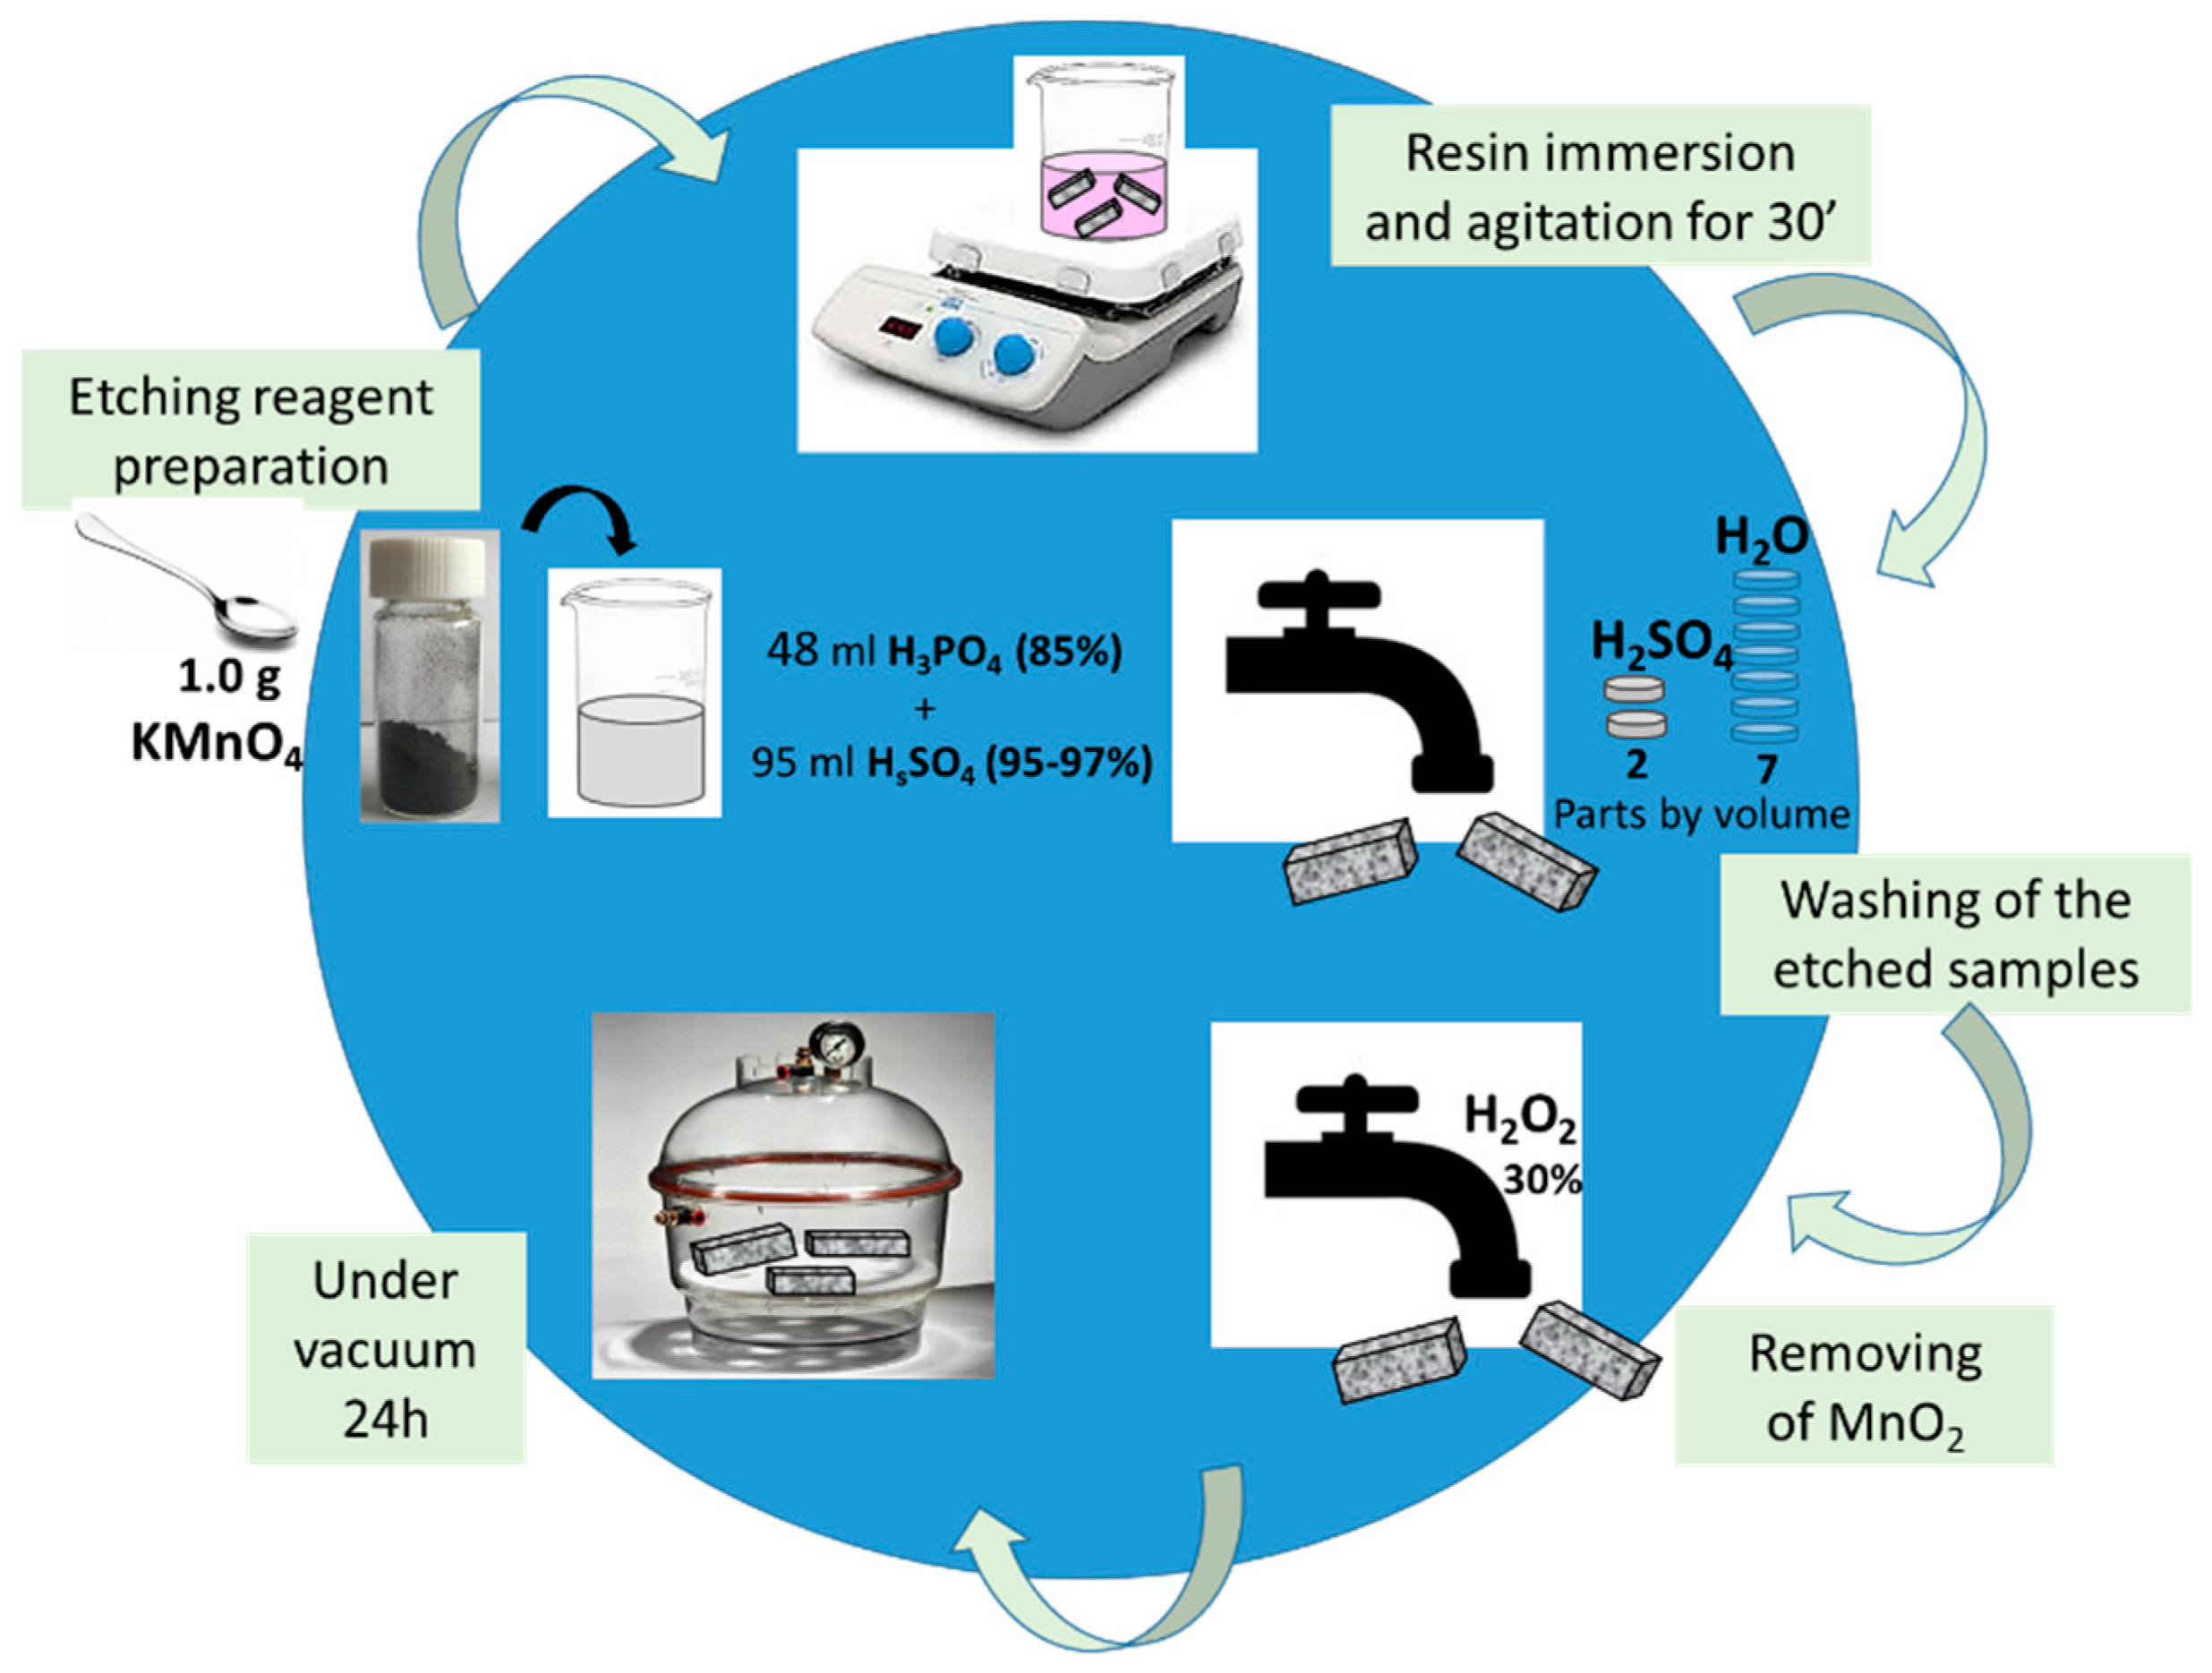
Figure 4.
Essential model definitions for the numerical analysis and schematic representation of the case studies examined in the present work.
Figure 4.
Essential model definitions for the numerical analysis and schematic representation of the case studies examined in the present work.
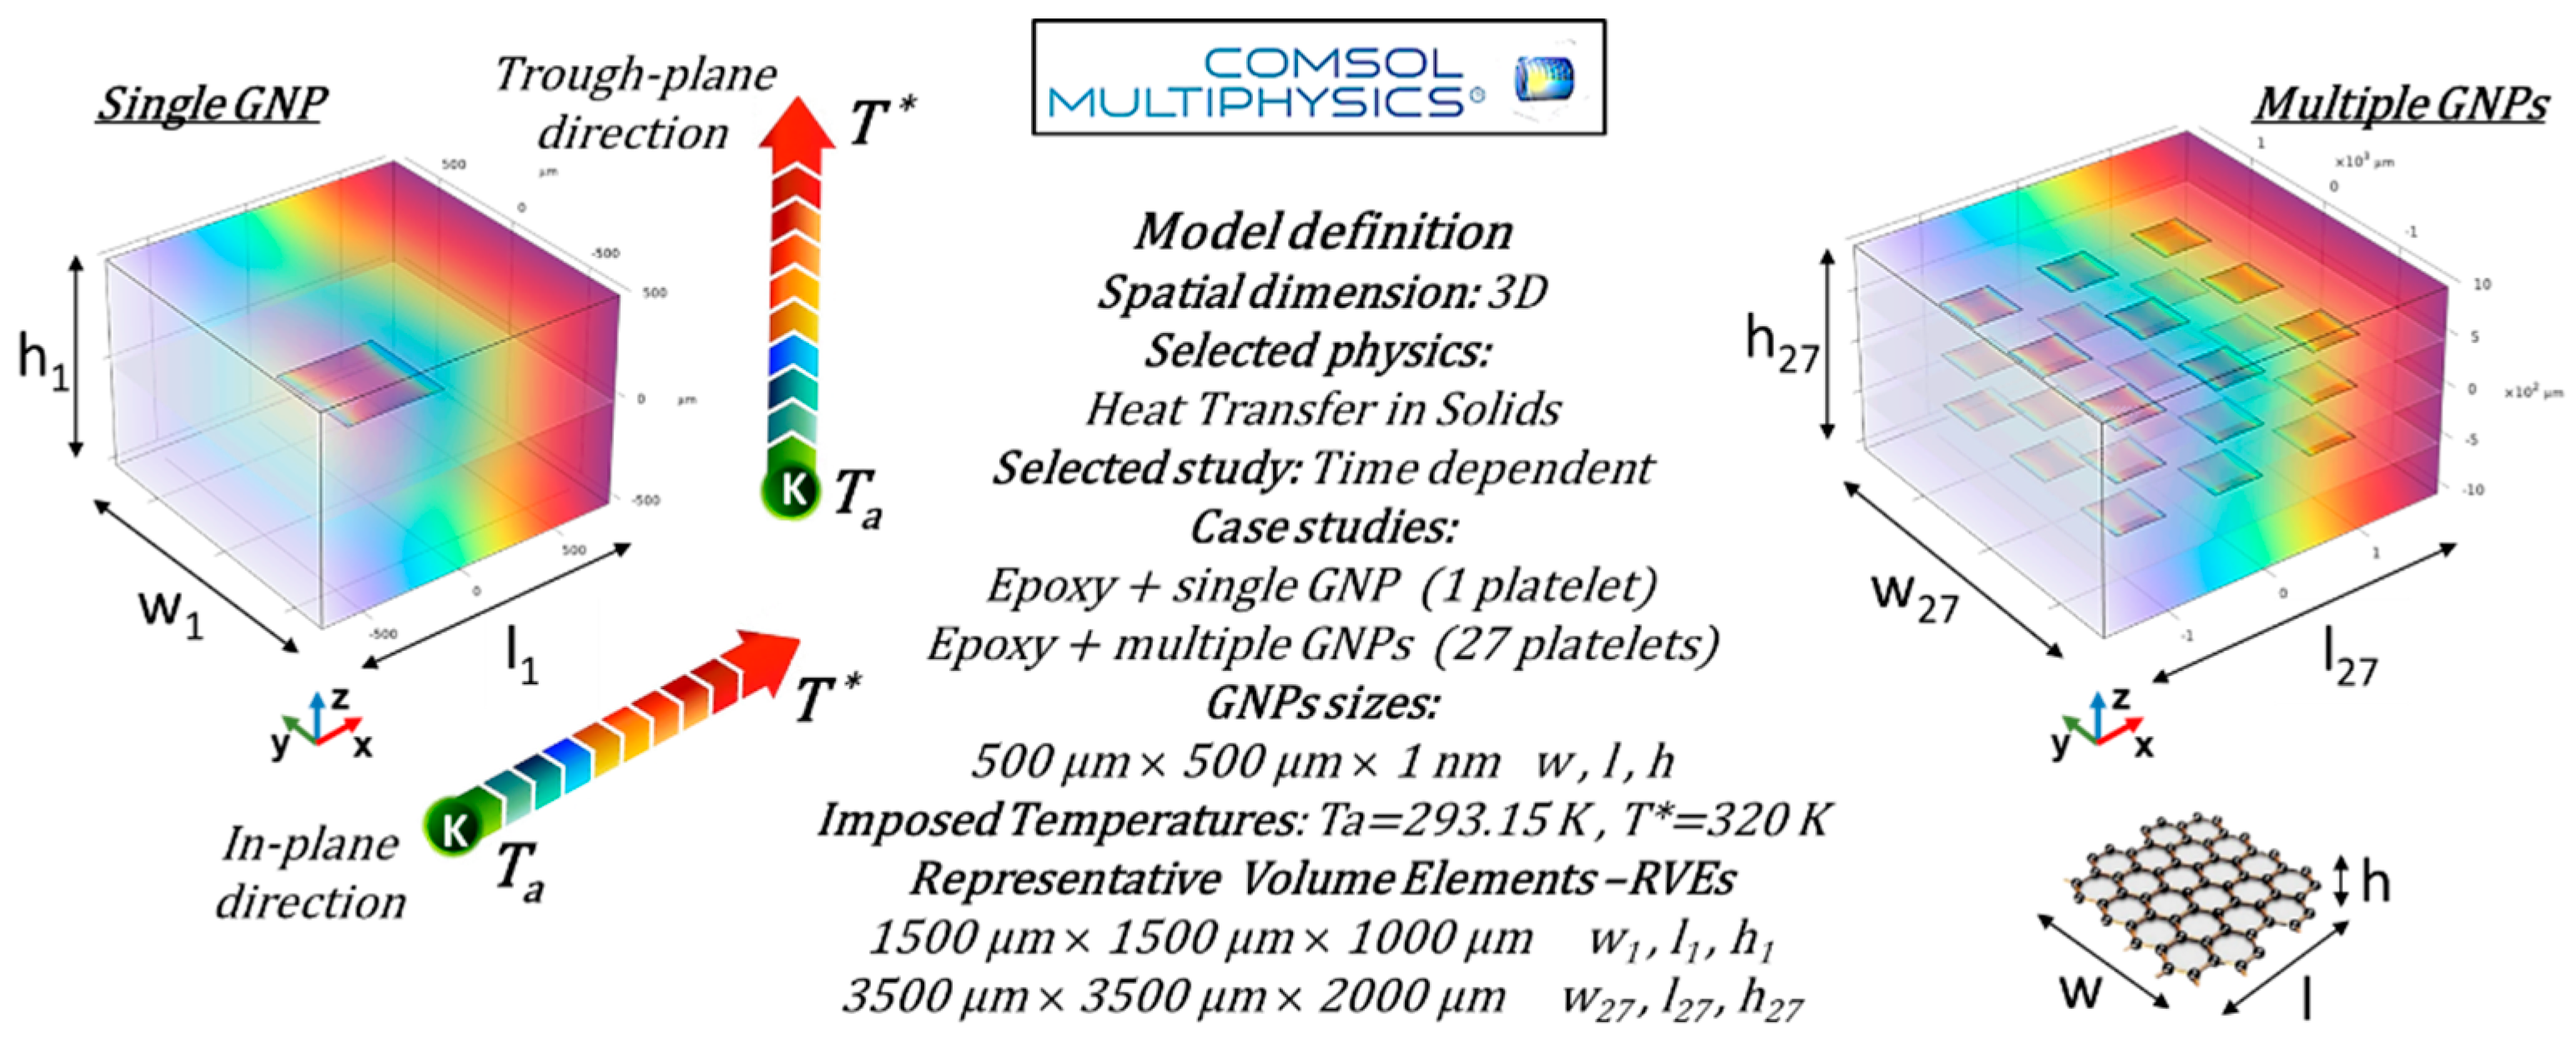
Figure 5.
Schematic representation of the thermal circuit theory applied to the graphene-based nanocomposite in the trough-plane direction (left) and in-plane direction (right).
Figure 5.
Schematic representation of the thermal circuit theory applied to the graphene-based nanocomposite in the trough-plane direction (left) and in-plane direction (right).
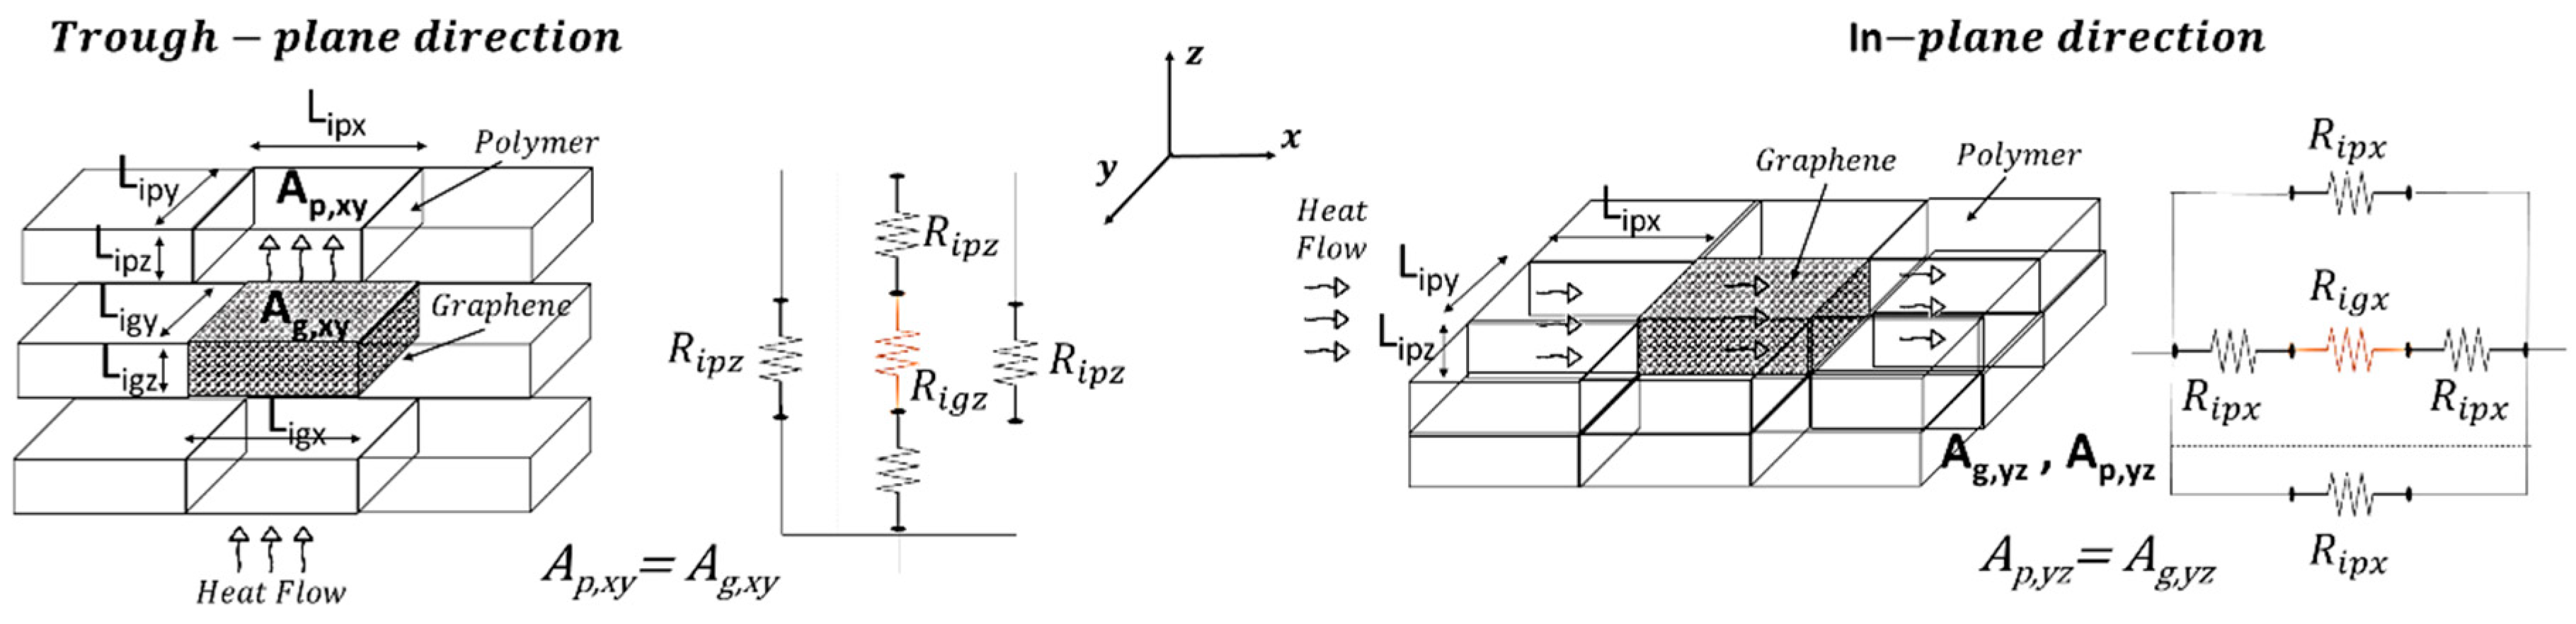
Figure 6.
In-plane (λI-p dir.) and trough-plane (λT-p dir.) thermal conductivities of epoxy resin filled with different concentrations of carbon nanotubes CNTs in (a) and exfoliated graphite EG in (b).
Figure 6.
In-plane (λI-p dir.) and trough-plane (λT-p dir.) thermal conductivities of epoxy resin filled with different concentrations of carbon nanotubes CNTs in (a) and exfoliated graphite EG in (b).
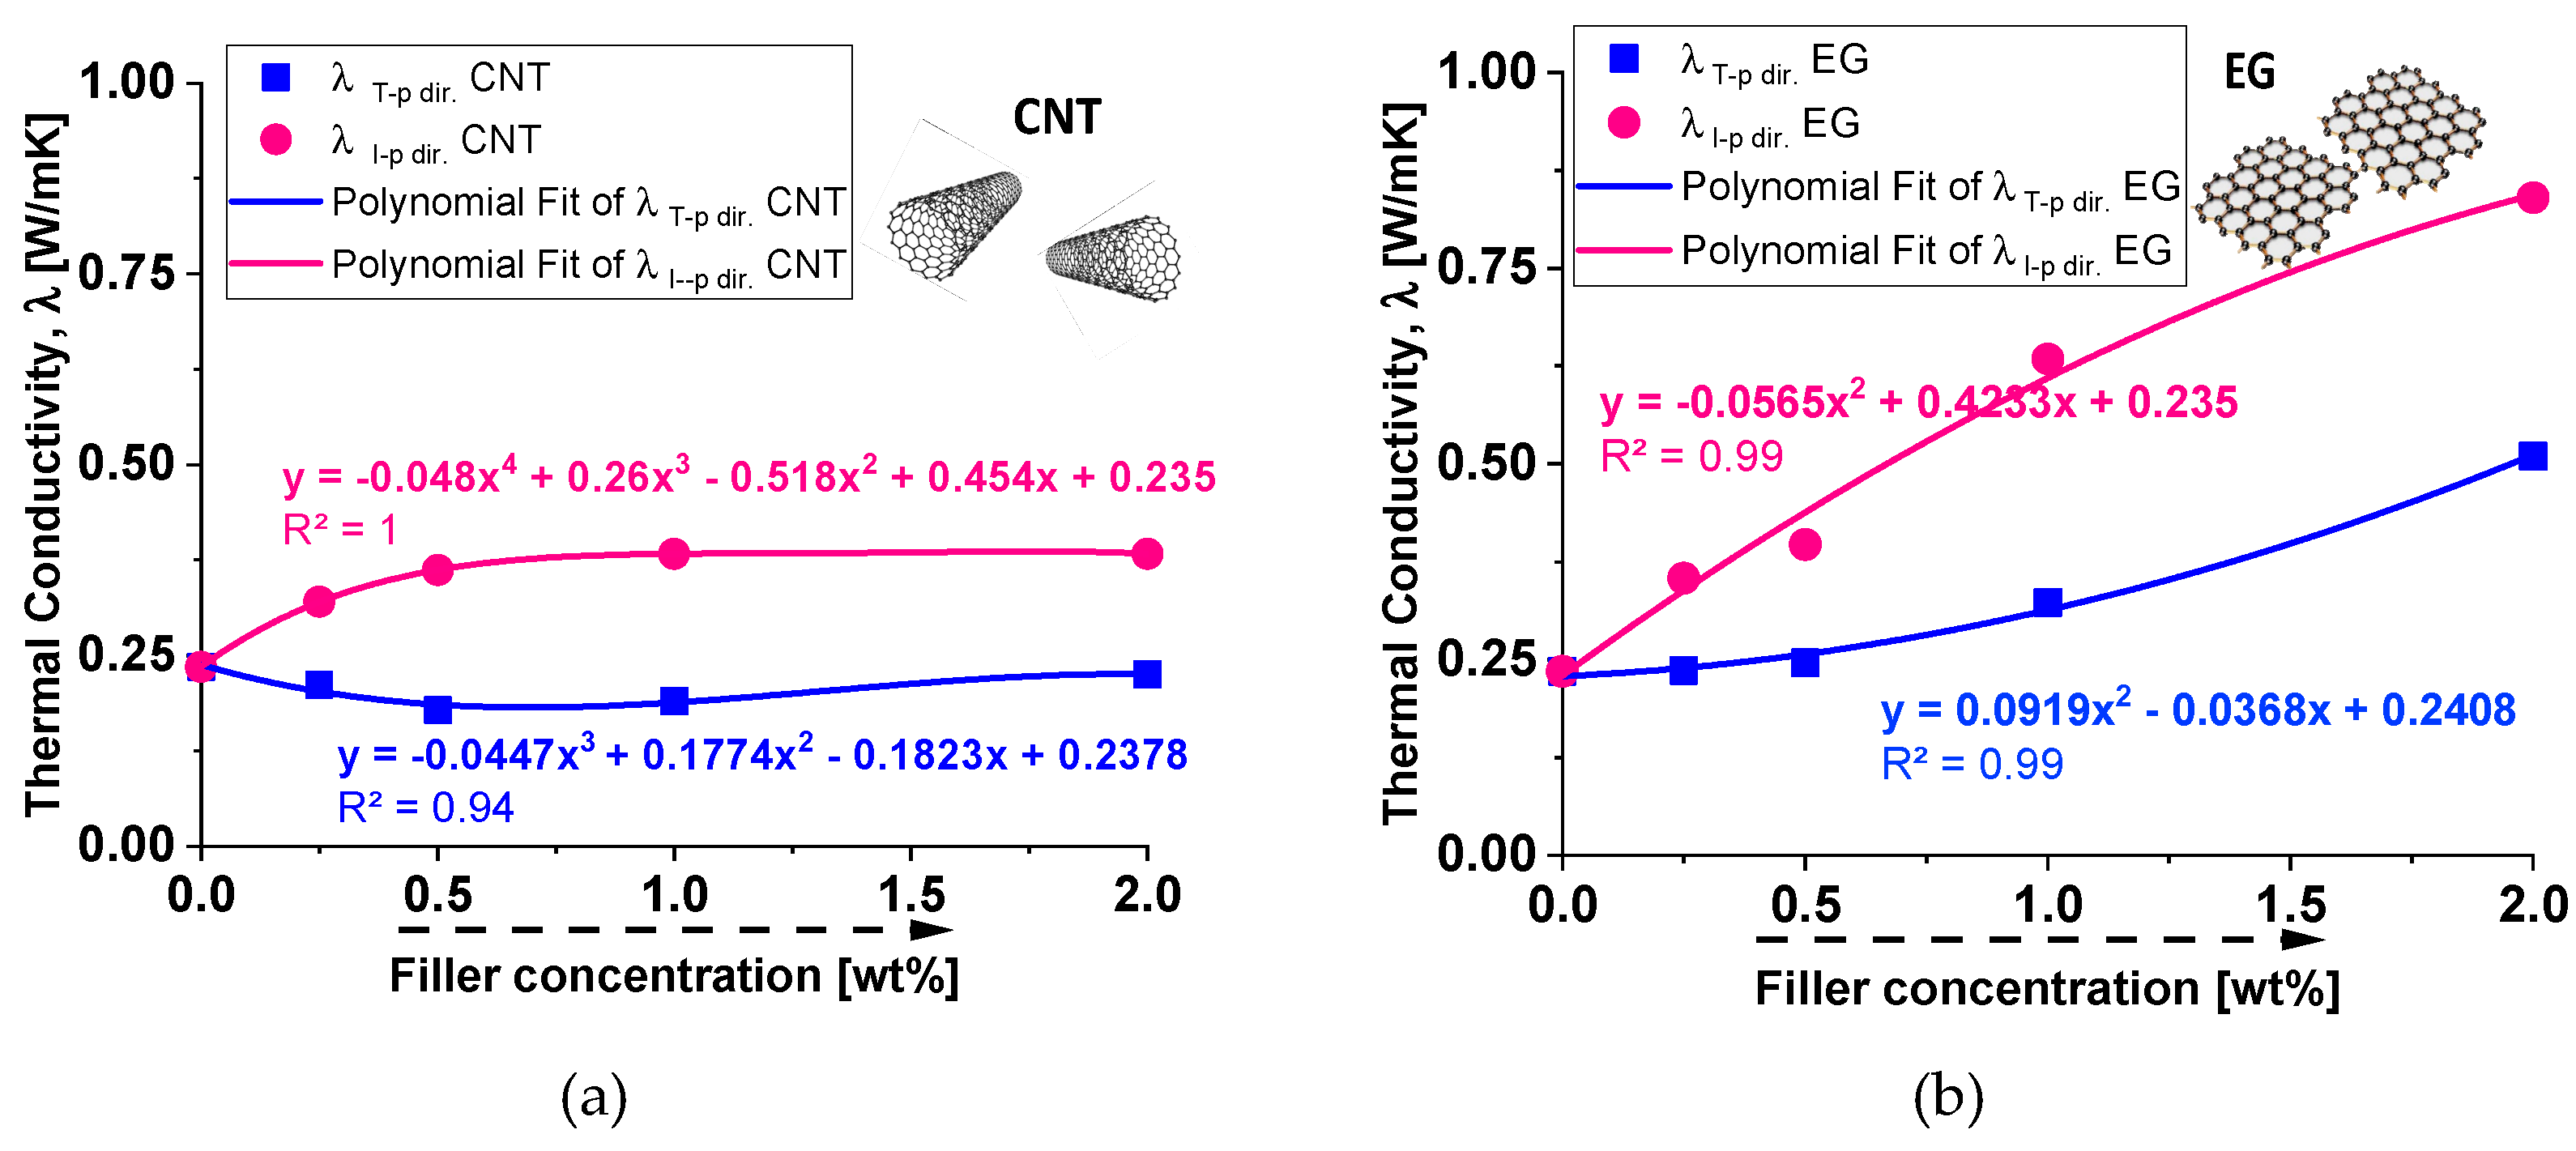
Figure 7.
Morphological analysis of nanocomposite samples containing 2 wt% carbon nanotubes (CNTs) in (a) and 2 wt% exfoliated graphite (EG) in (b).
Figure 7.
Morphological analysis of nanocomposite samples containing 2 wt% carbon nanotubes (CNTs) in (a) and 2 wt% exfoliated graphite (EG) in (b).
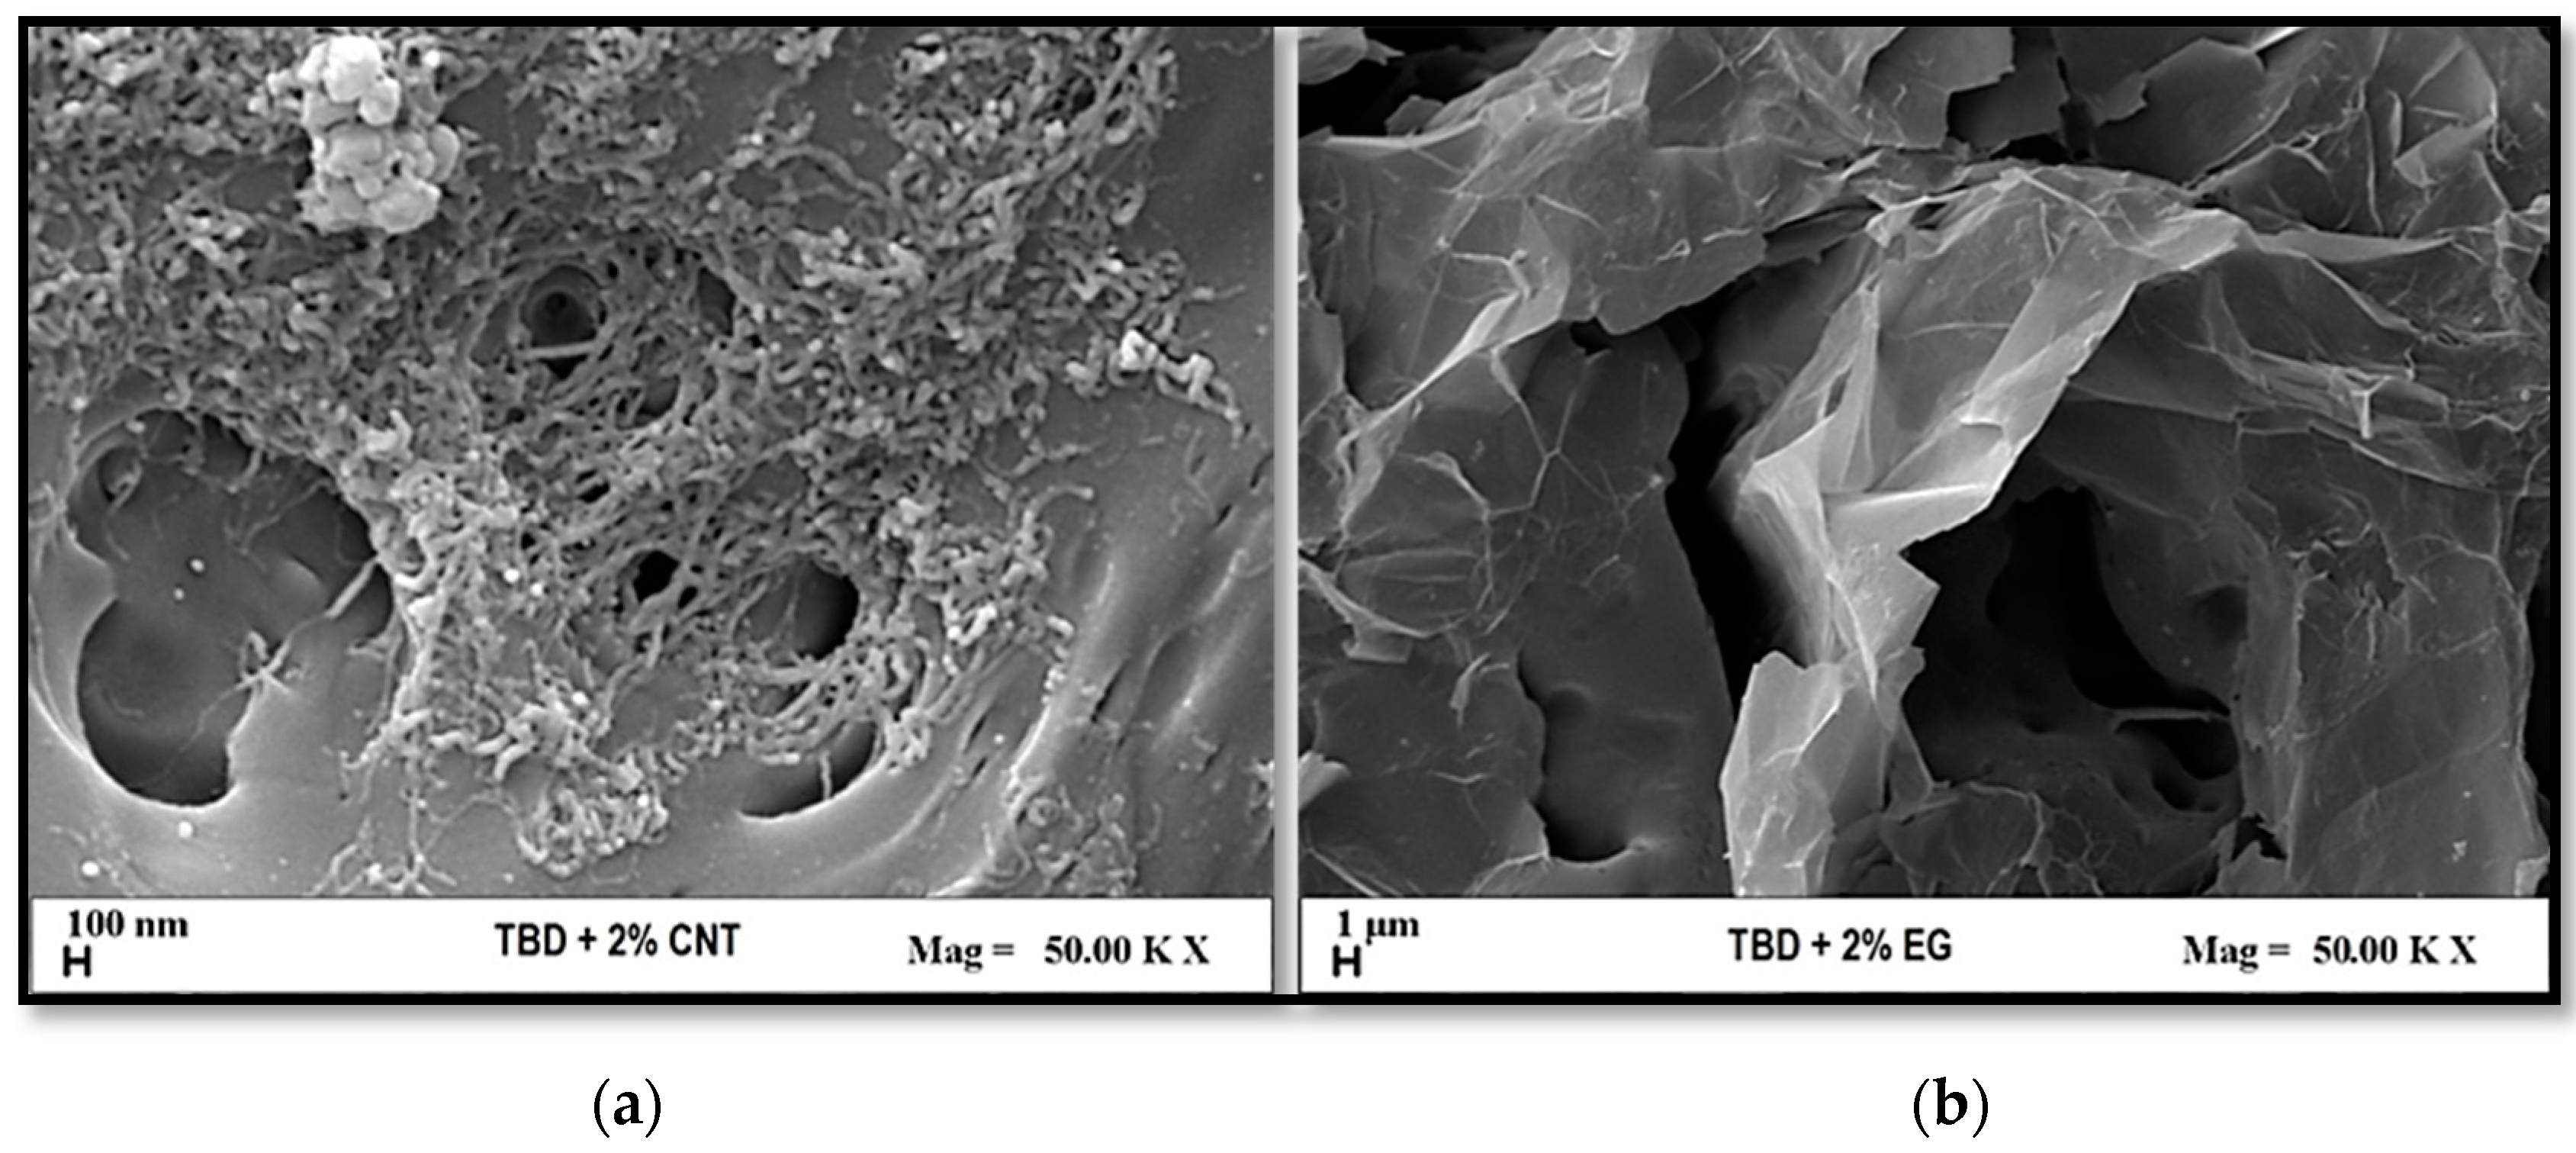
Figure 8.
Temperature evolution over time for both investigated directions (in-plane and trough-plane) in panel (a) and corresponding evolution of the total heat flux components along the in-plane (x-direction) and through-plane (z-direction) directions over time in panel (b).
Figure 8.
Temperature evolution over time for both investigated directions (in-plane and trough-plane) in panel (a) and corresponding evolution of the total heat flux components along the in-plane (x-direction) and through-plane (z-direction) directions over time in panel (b).
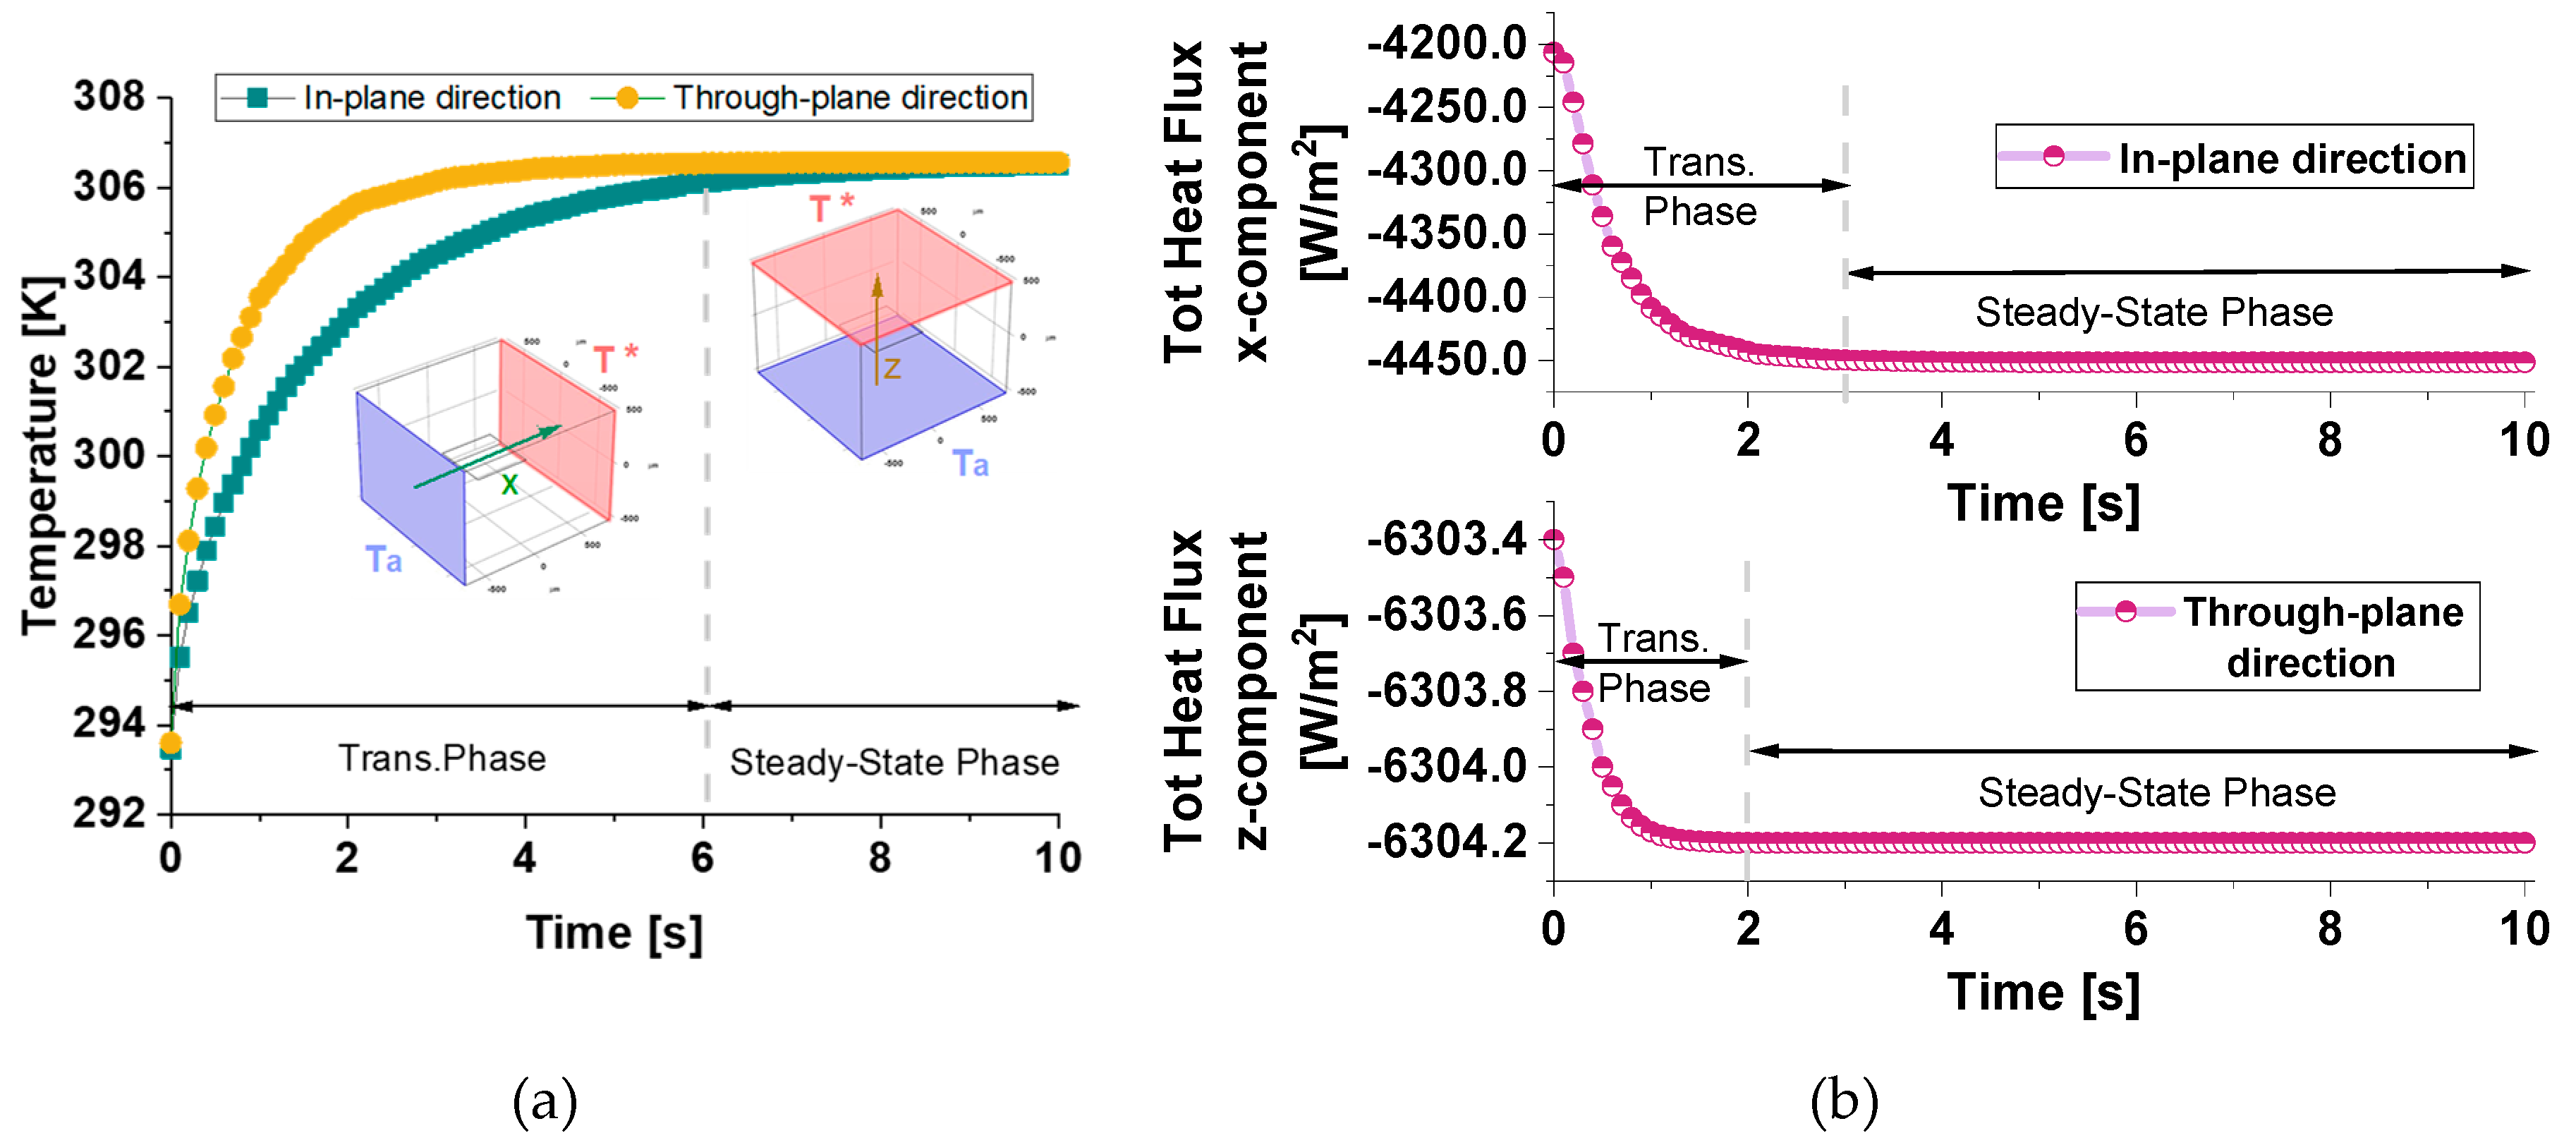
Figure 9.
Temperature profiles along the symmetry axes in both the in-plane in (a) and through-plane directions in (b).
Figure 9.
Temperature profiles along the symmetry axes in both the in-plane in (a) and through-plane directions in (b).
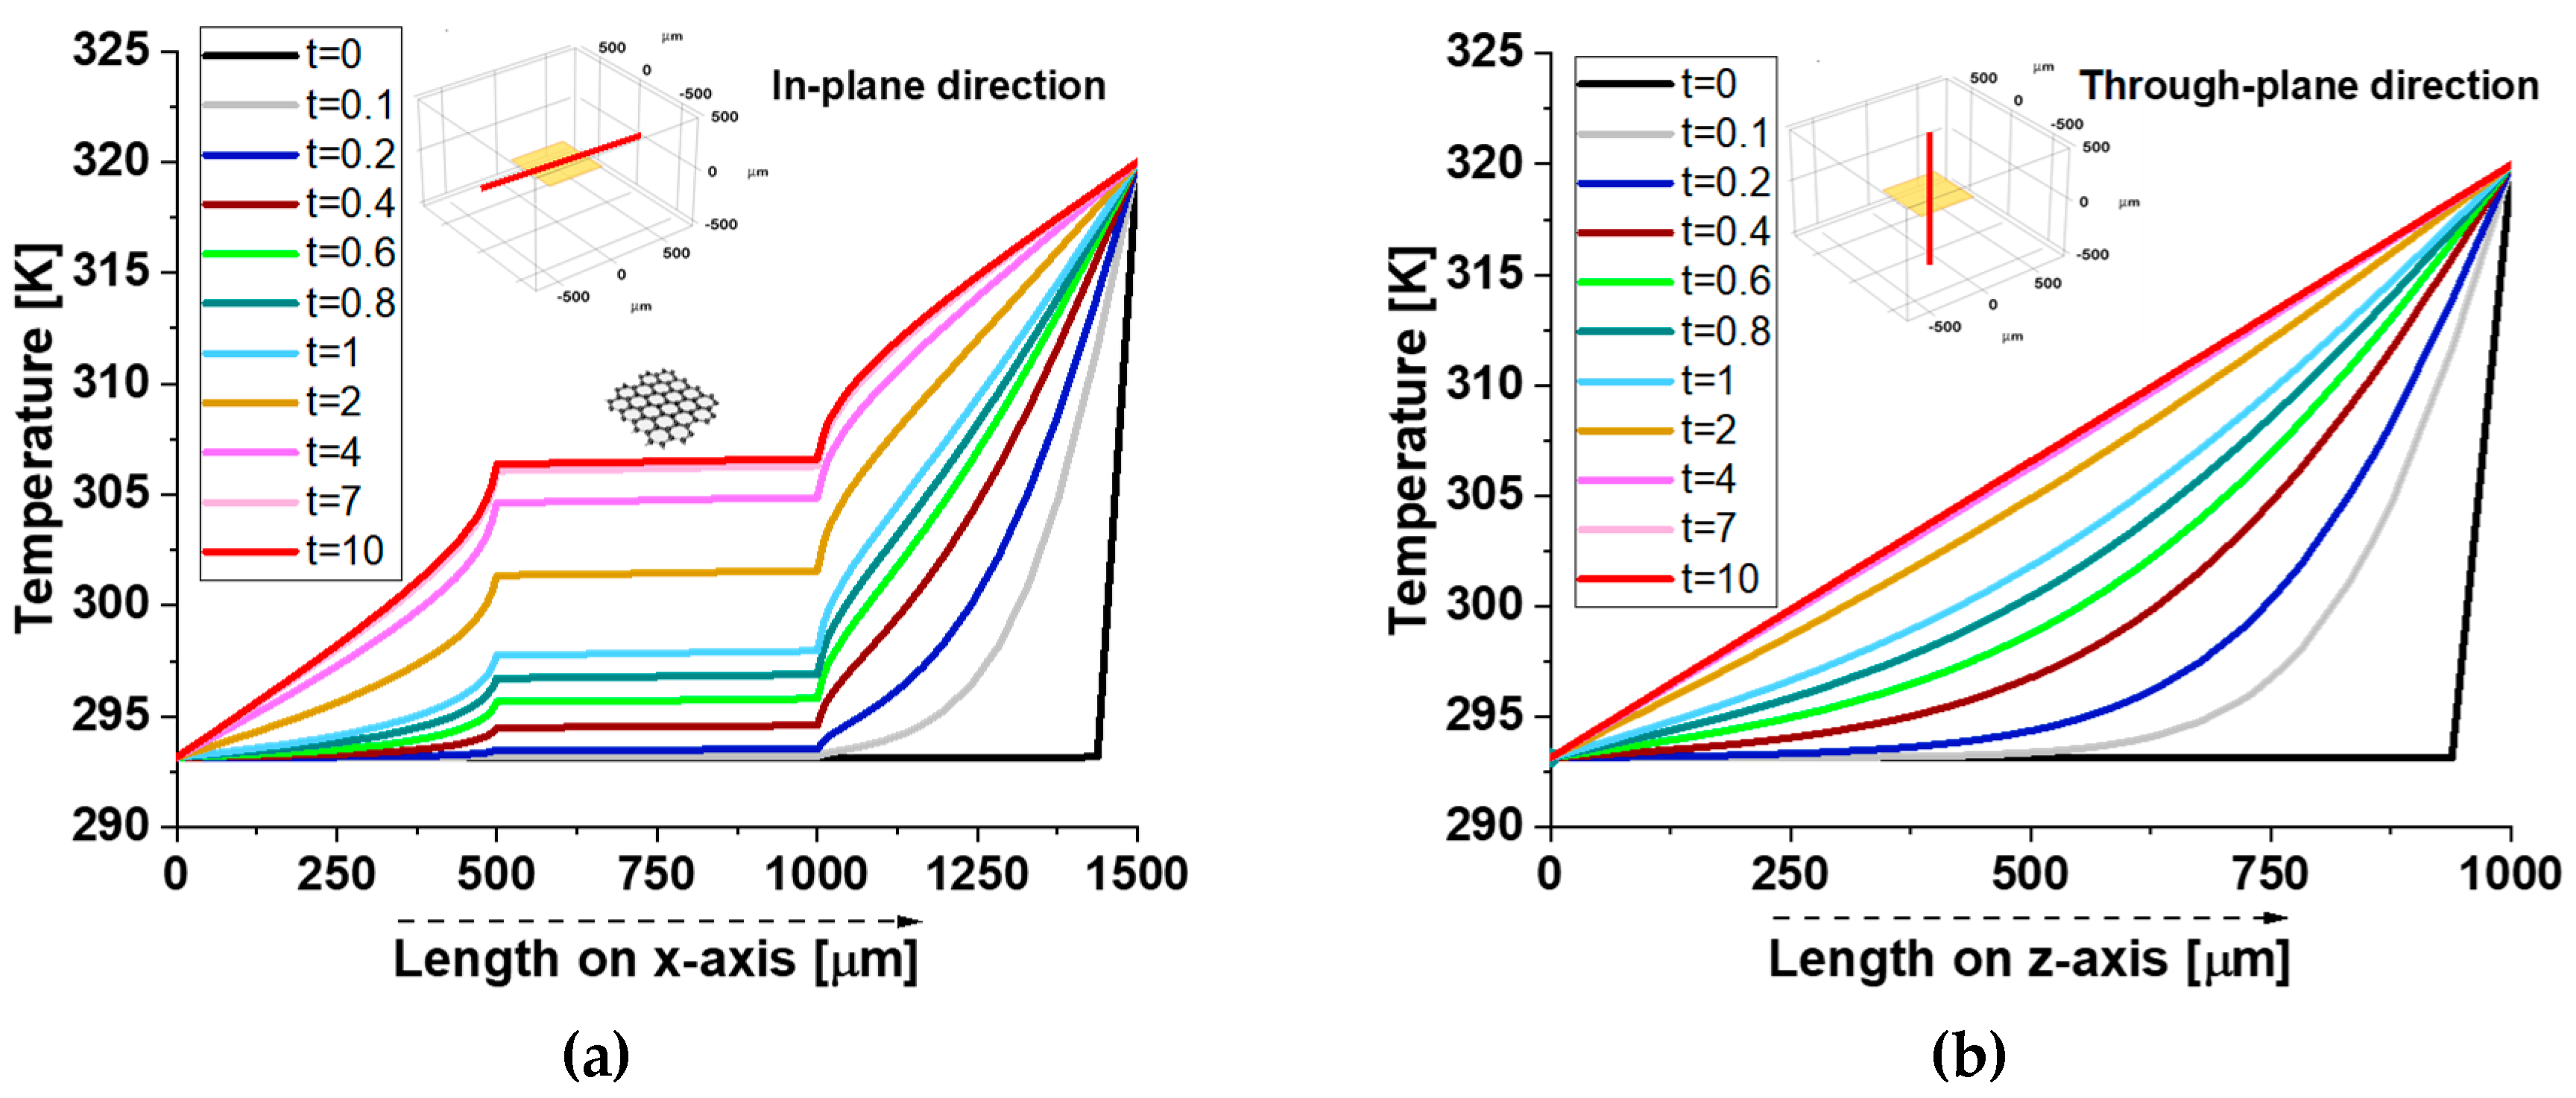
Figure 10.
Temperature profiles along the in-plane direction (I-p dir.) at t = 1 s (transient phase, panel a) and t = 10 s (steady state, panel b), evaluated on a plane intersecting the graphene sheet. Panels (c) and (d) show the corresponding temperature distributions along the through-plane direction (T-p dir.) at the same time points, computed on cross-sectional planes perpendicular to the graphene’s xy-plane.
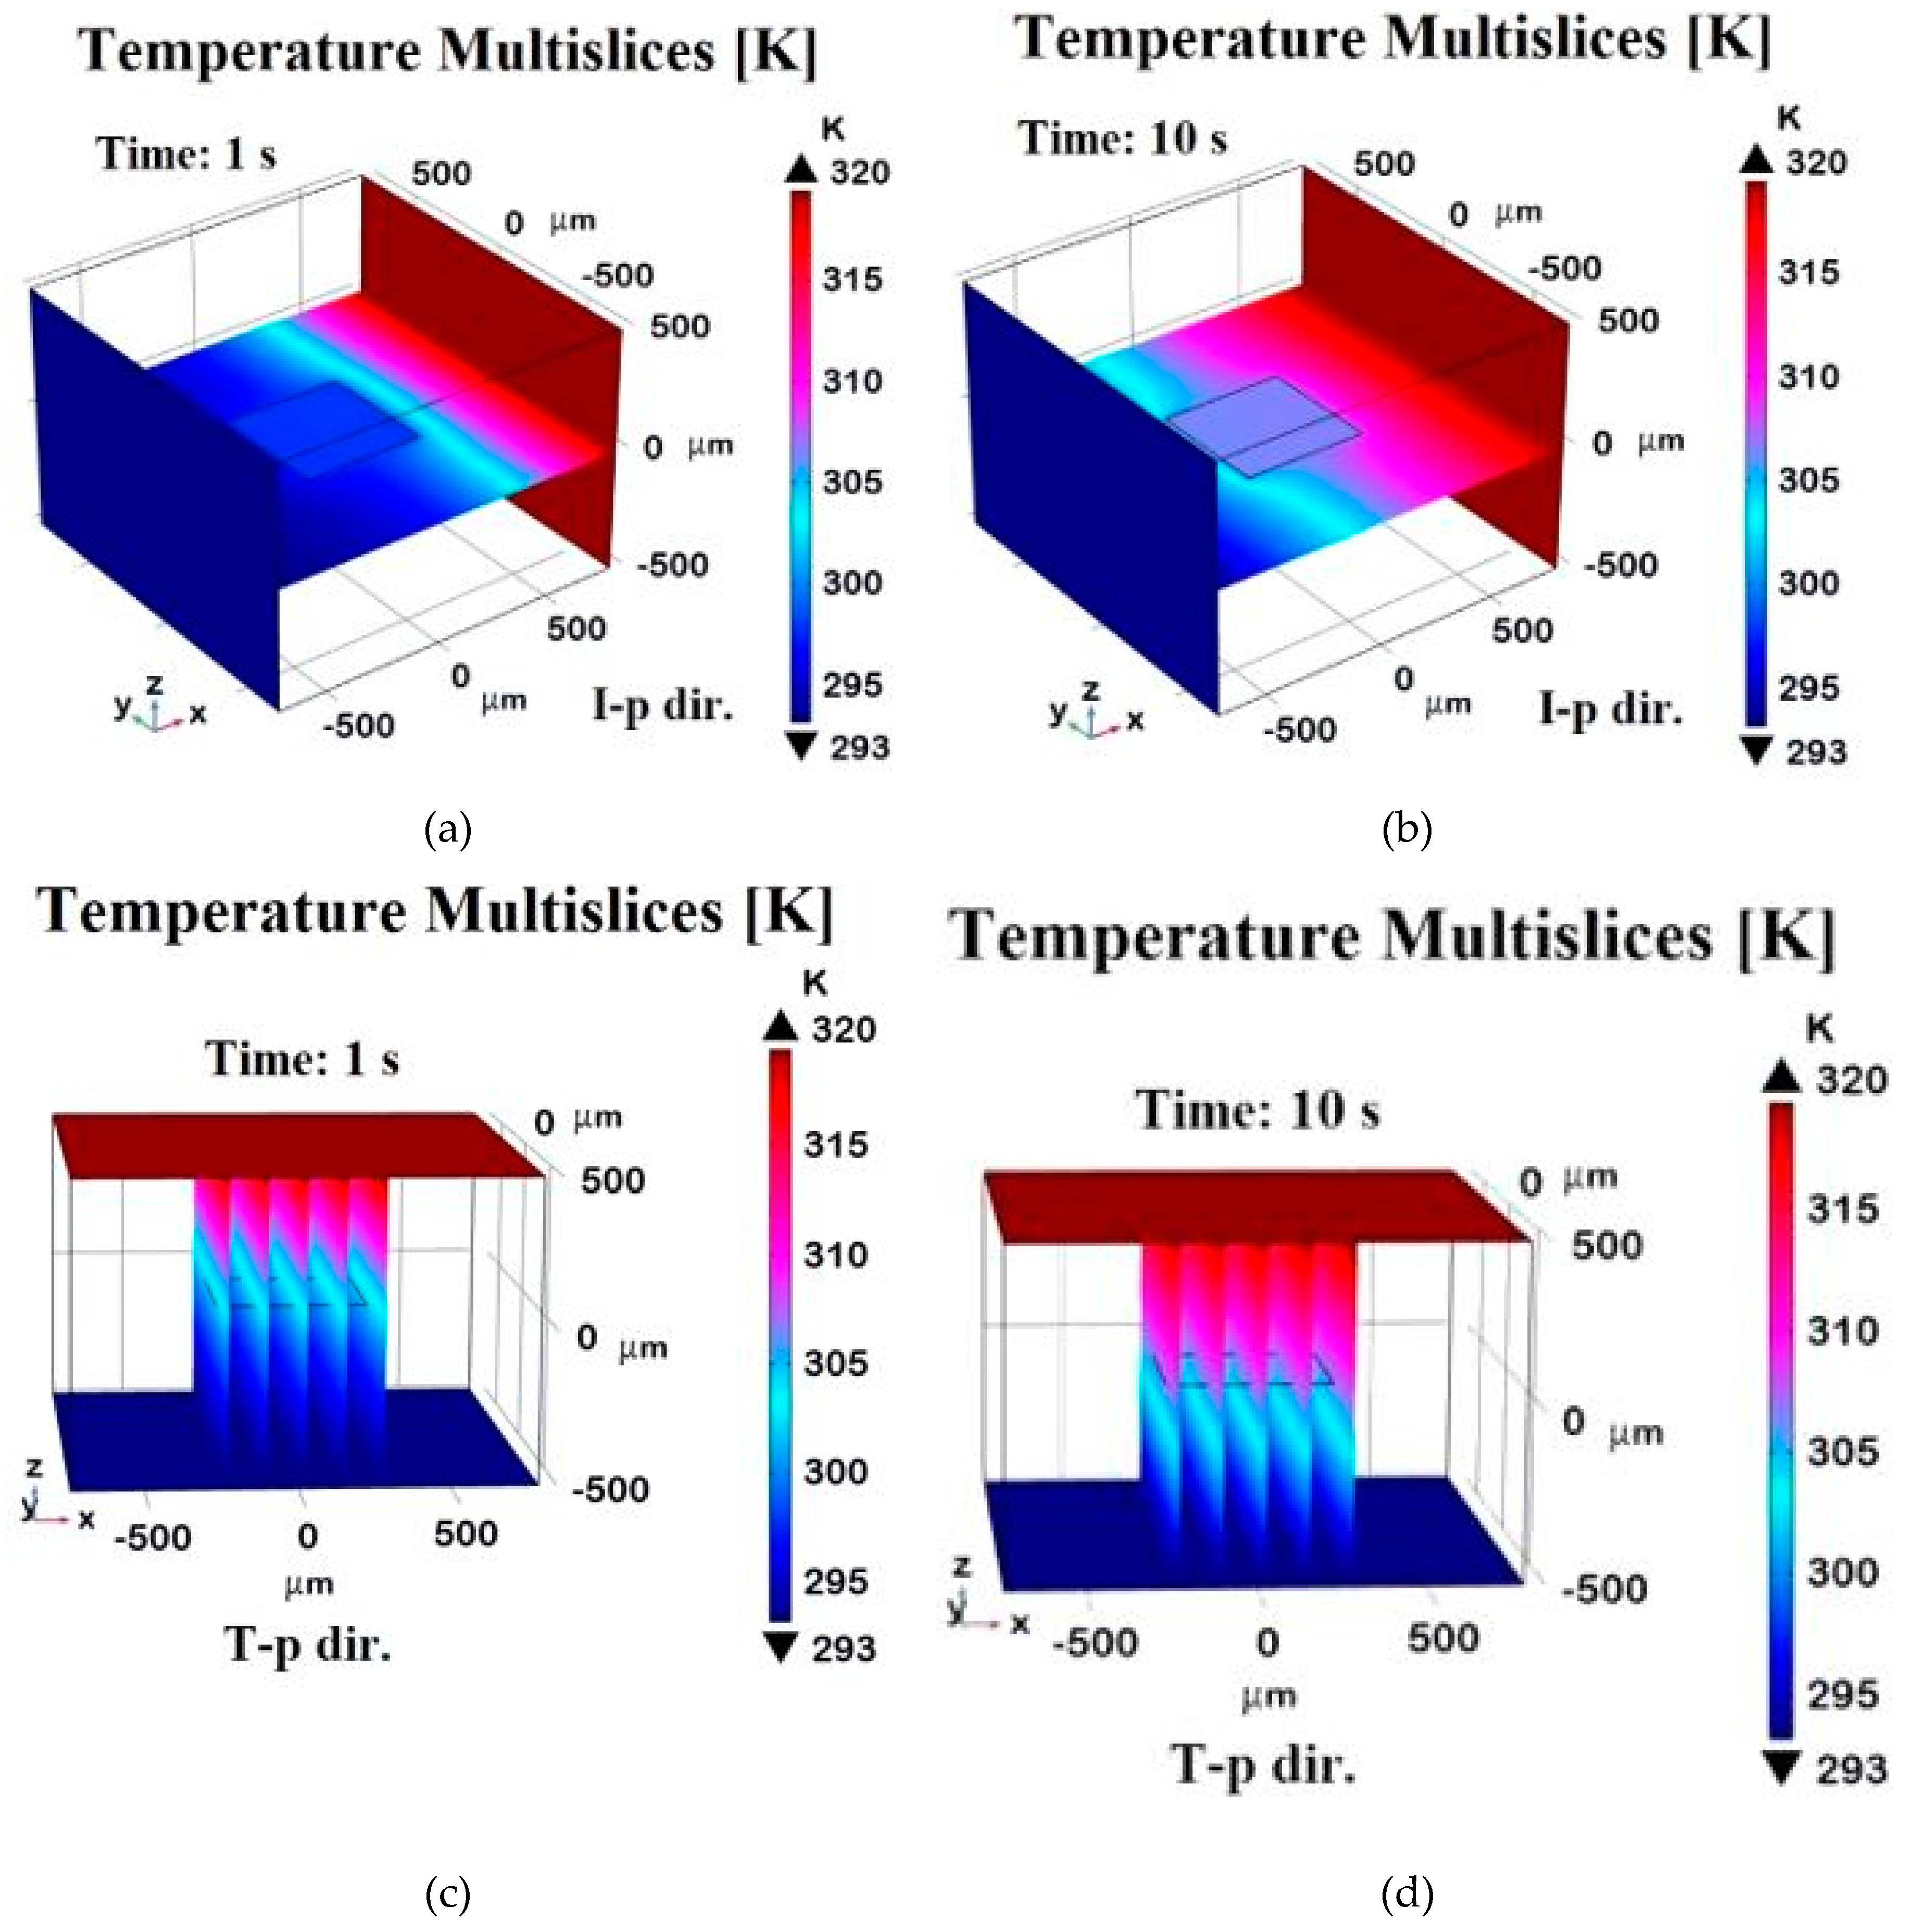
Figure 11.
Total heat flux x-component evaluated in in-plane direction (a) and z-component evaluated in through-plane direction (b) at different time instants.
Figure 11.
Total heat flux x-component evaluated in in-plane direction (a) and z-component evaluated in through-plane direction (b) at different time instants.
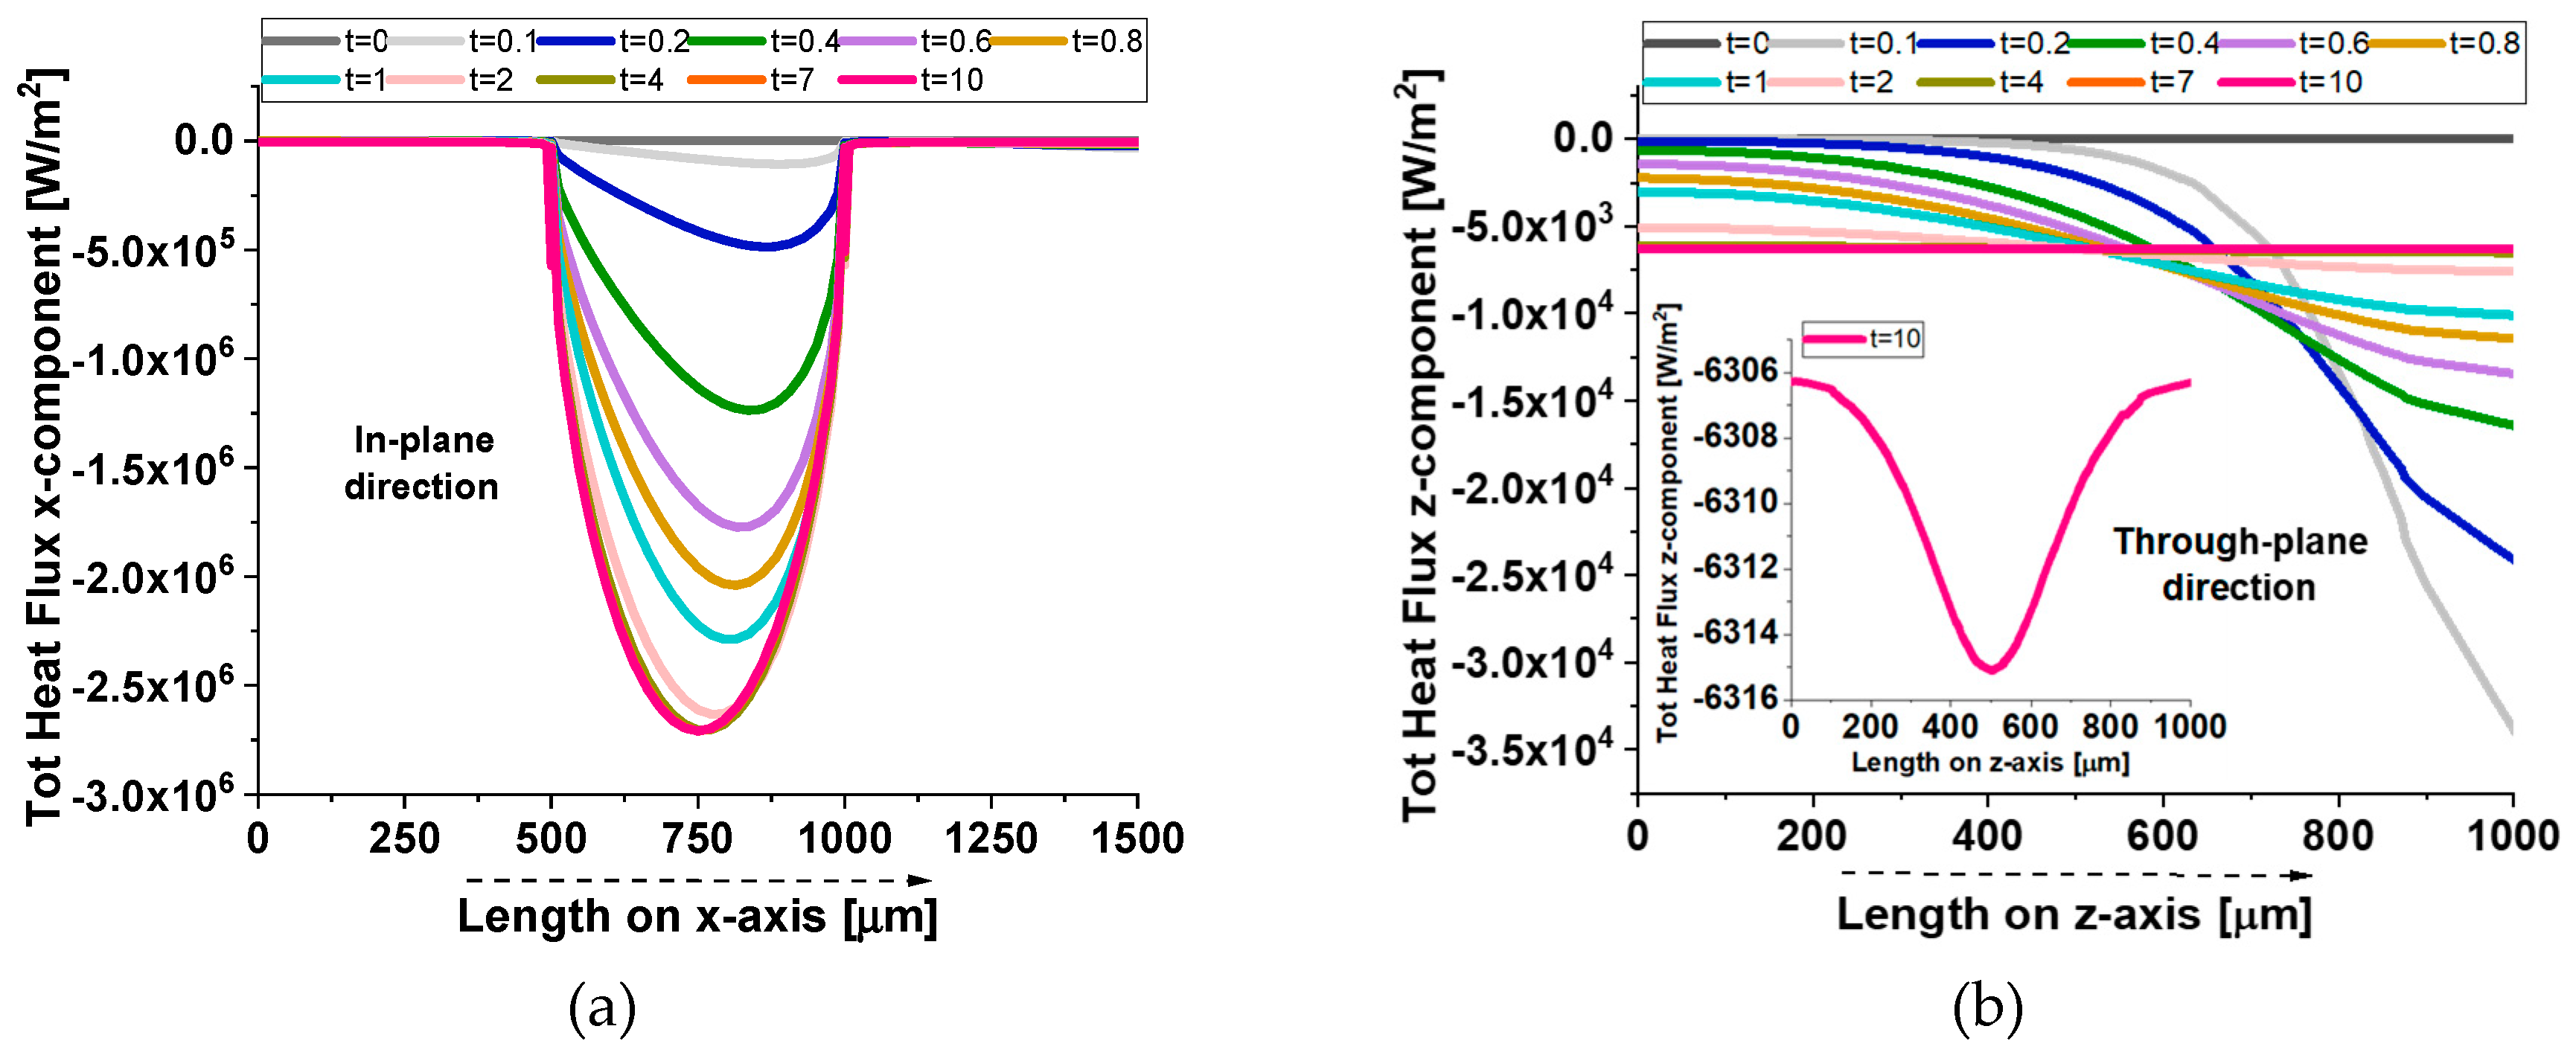
Figure 12.
Total heat flux profiles along the in-plane direction (I-p dir.) at t = 1 s (transient phase, panel a) and t = 10 s (steady state, panel b), evaluated on a plane passing for the symmetric axis of the zy-plane and intersecting the graphene sheet. Panels (c) and (d) show the total heat flux distributions along the through-plane direction (T-p dir.) at the same time points, computed on a transversal plane with respect to the graphene sheet. This plane passes for the symmetric axis of the xy-plane.
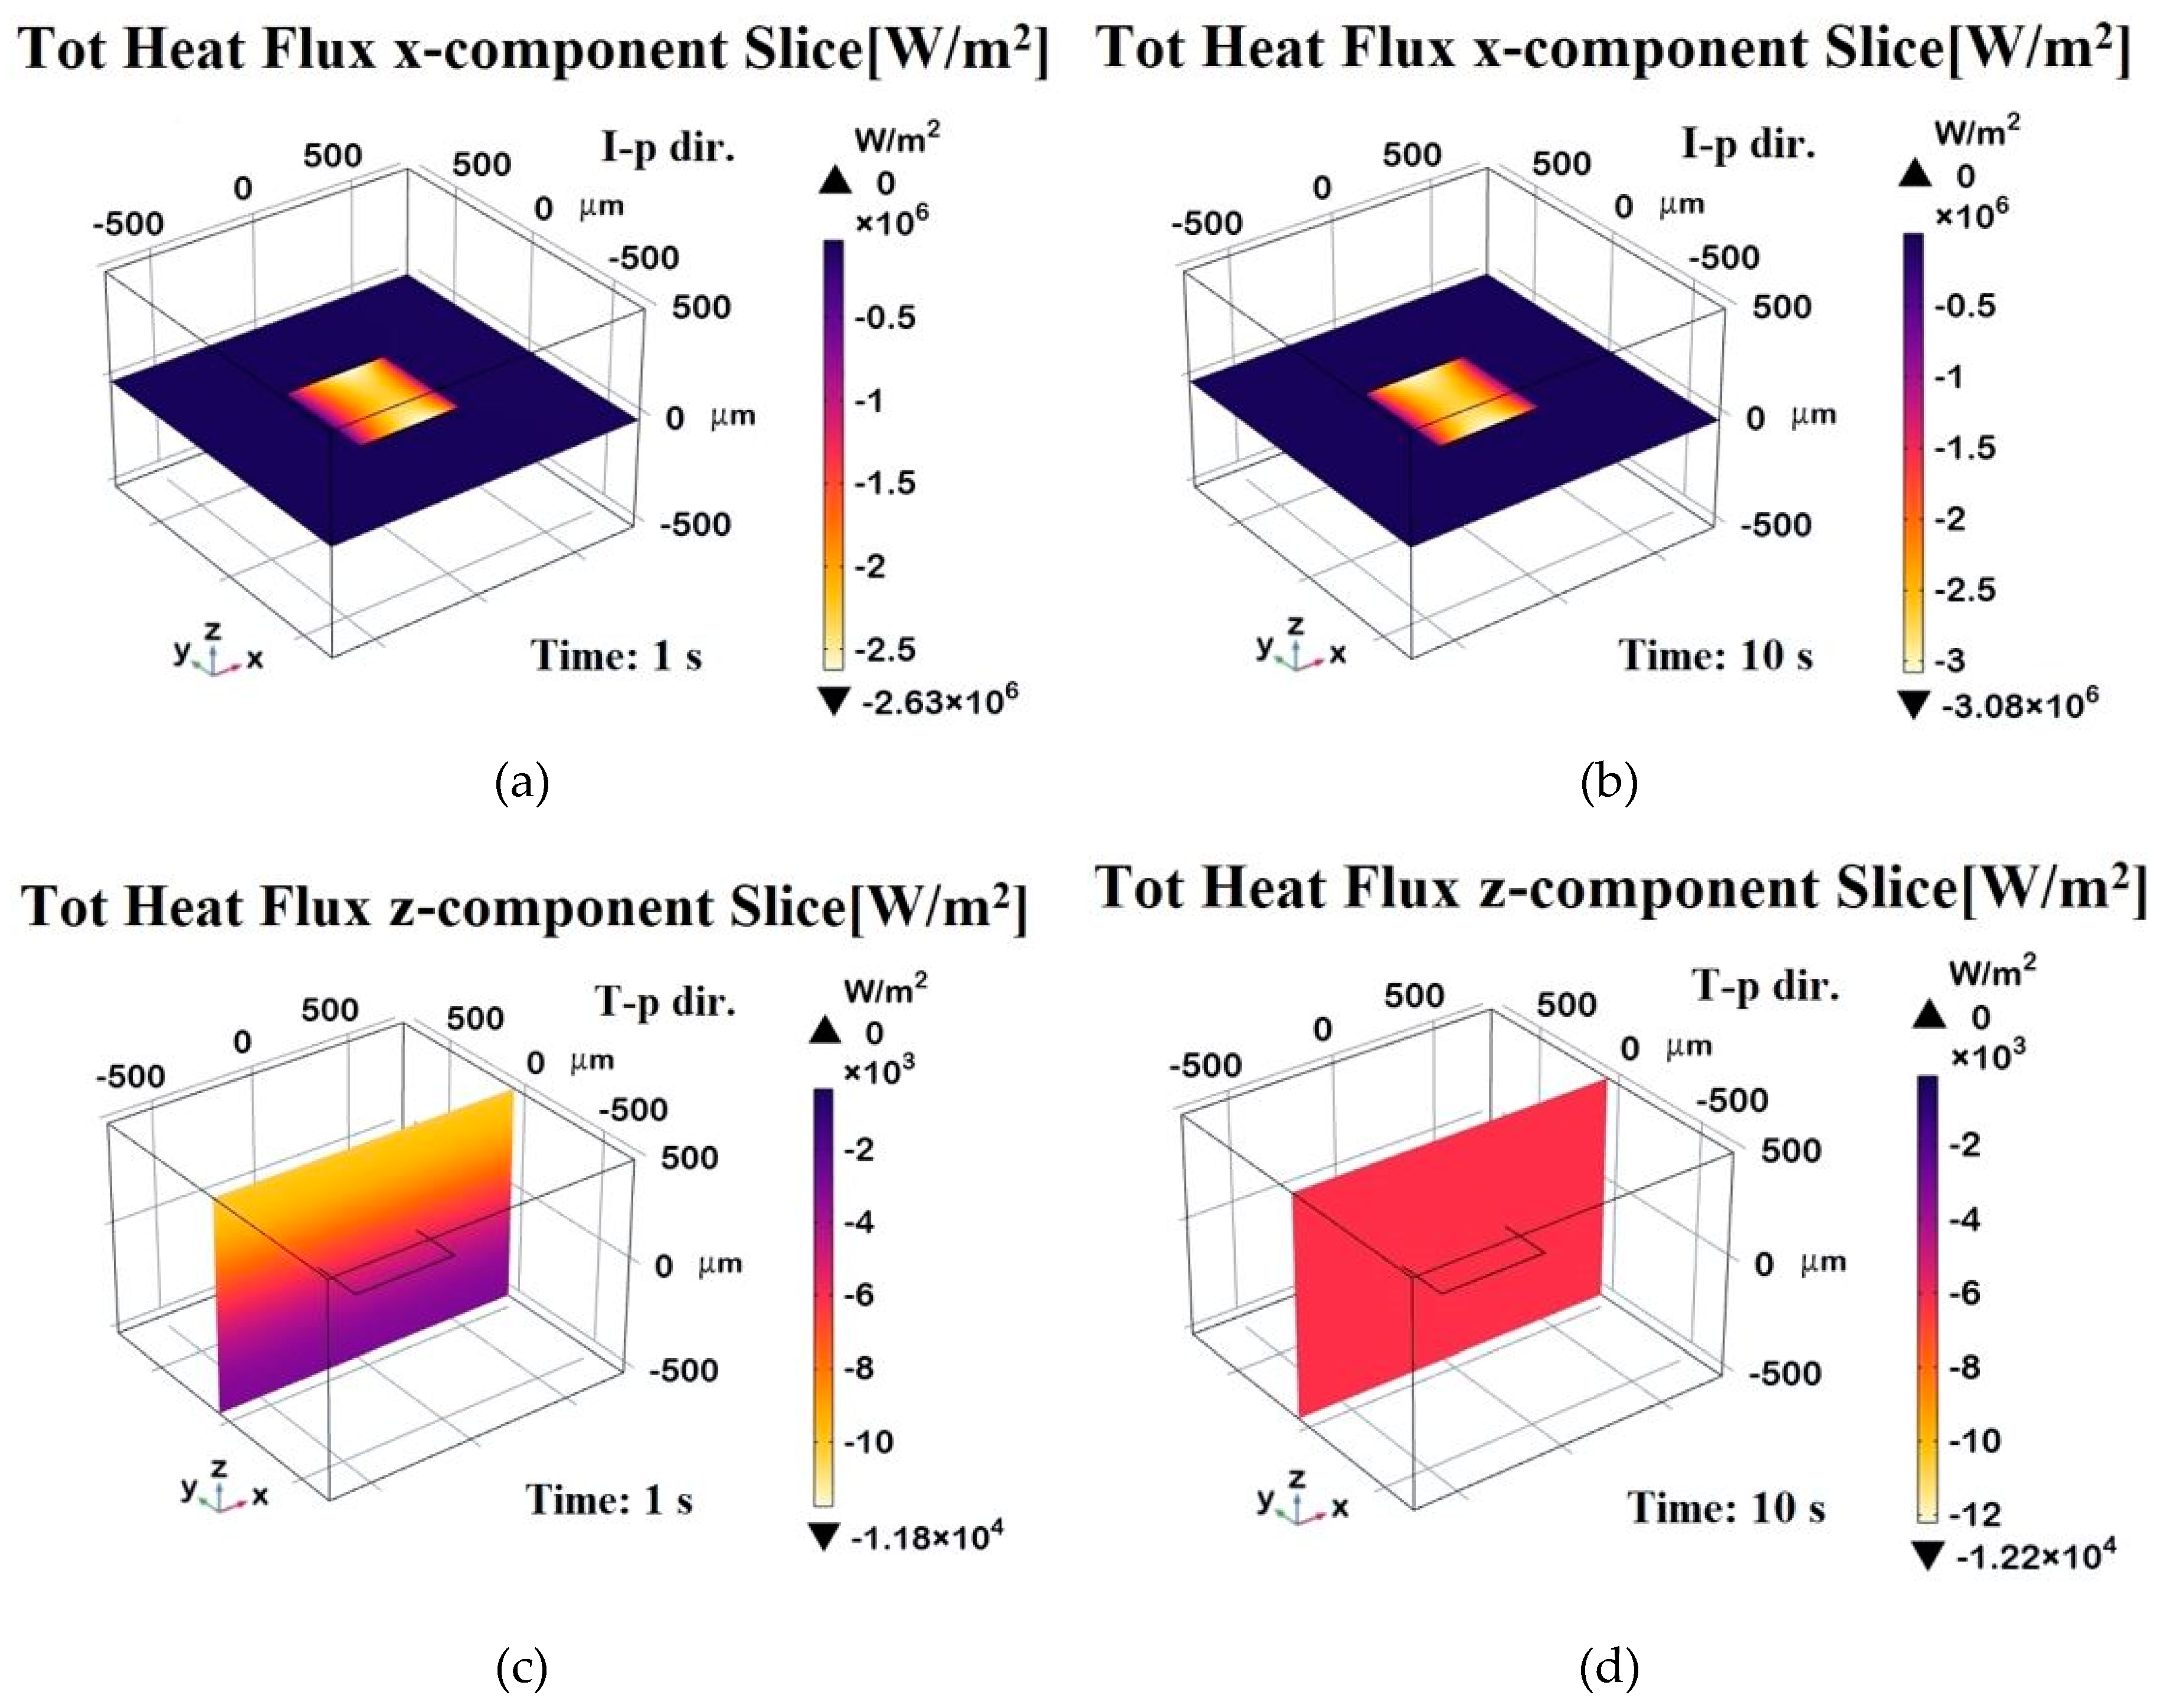
Figure 13.
Evolution of total heat flux, x-component, over time for various angles (from 0 to π/2) between the heat flow direction and the graphene plane.
Figure 13.
Evolution of total heat flux, x-component, over time for various angles (from 0 to π/2) between the heat flow direction and the graphene plane.
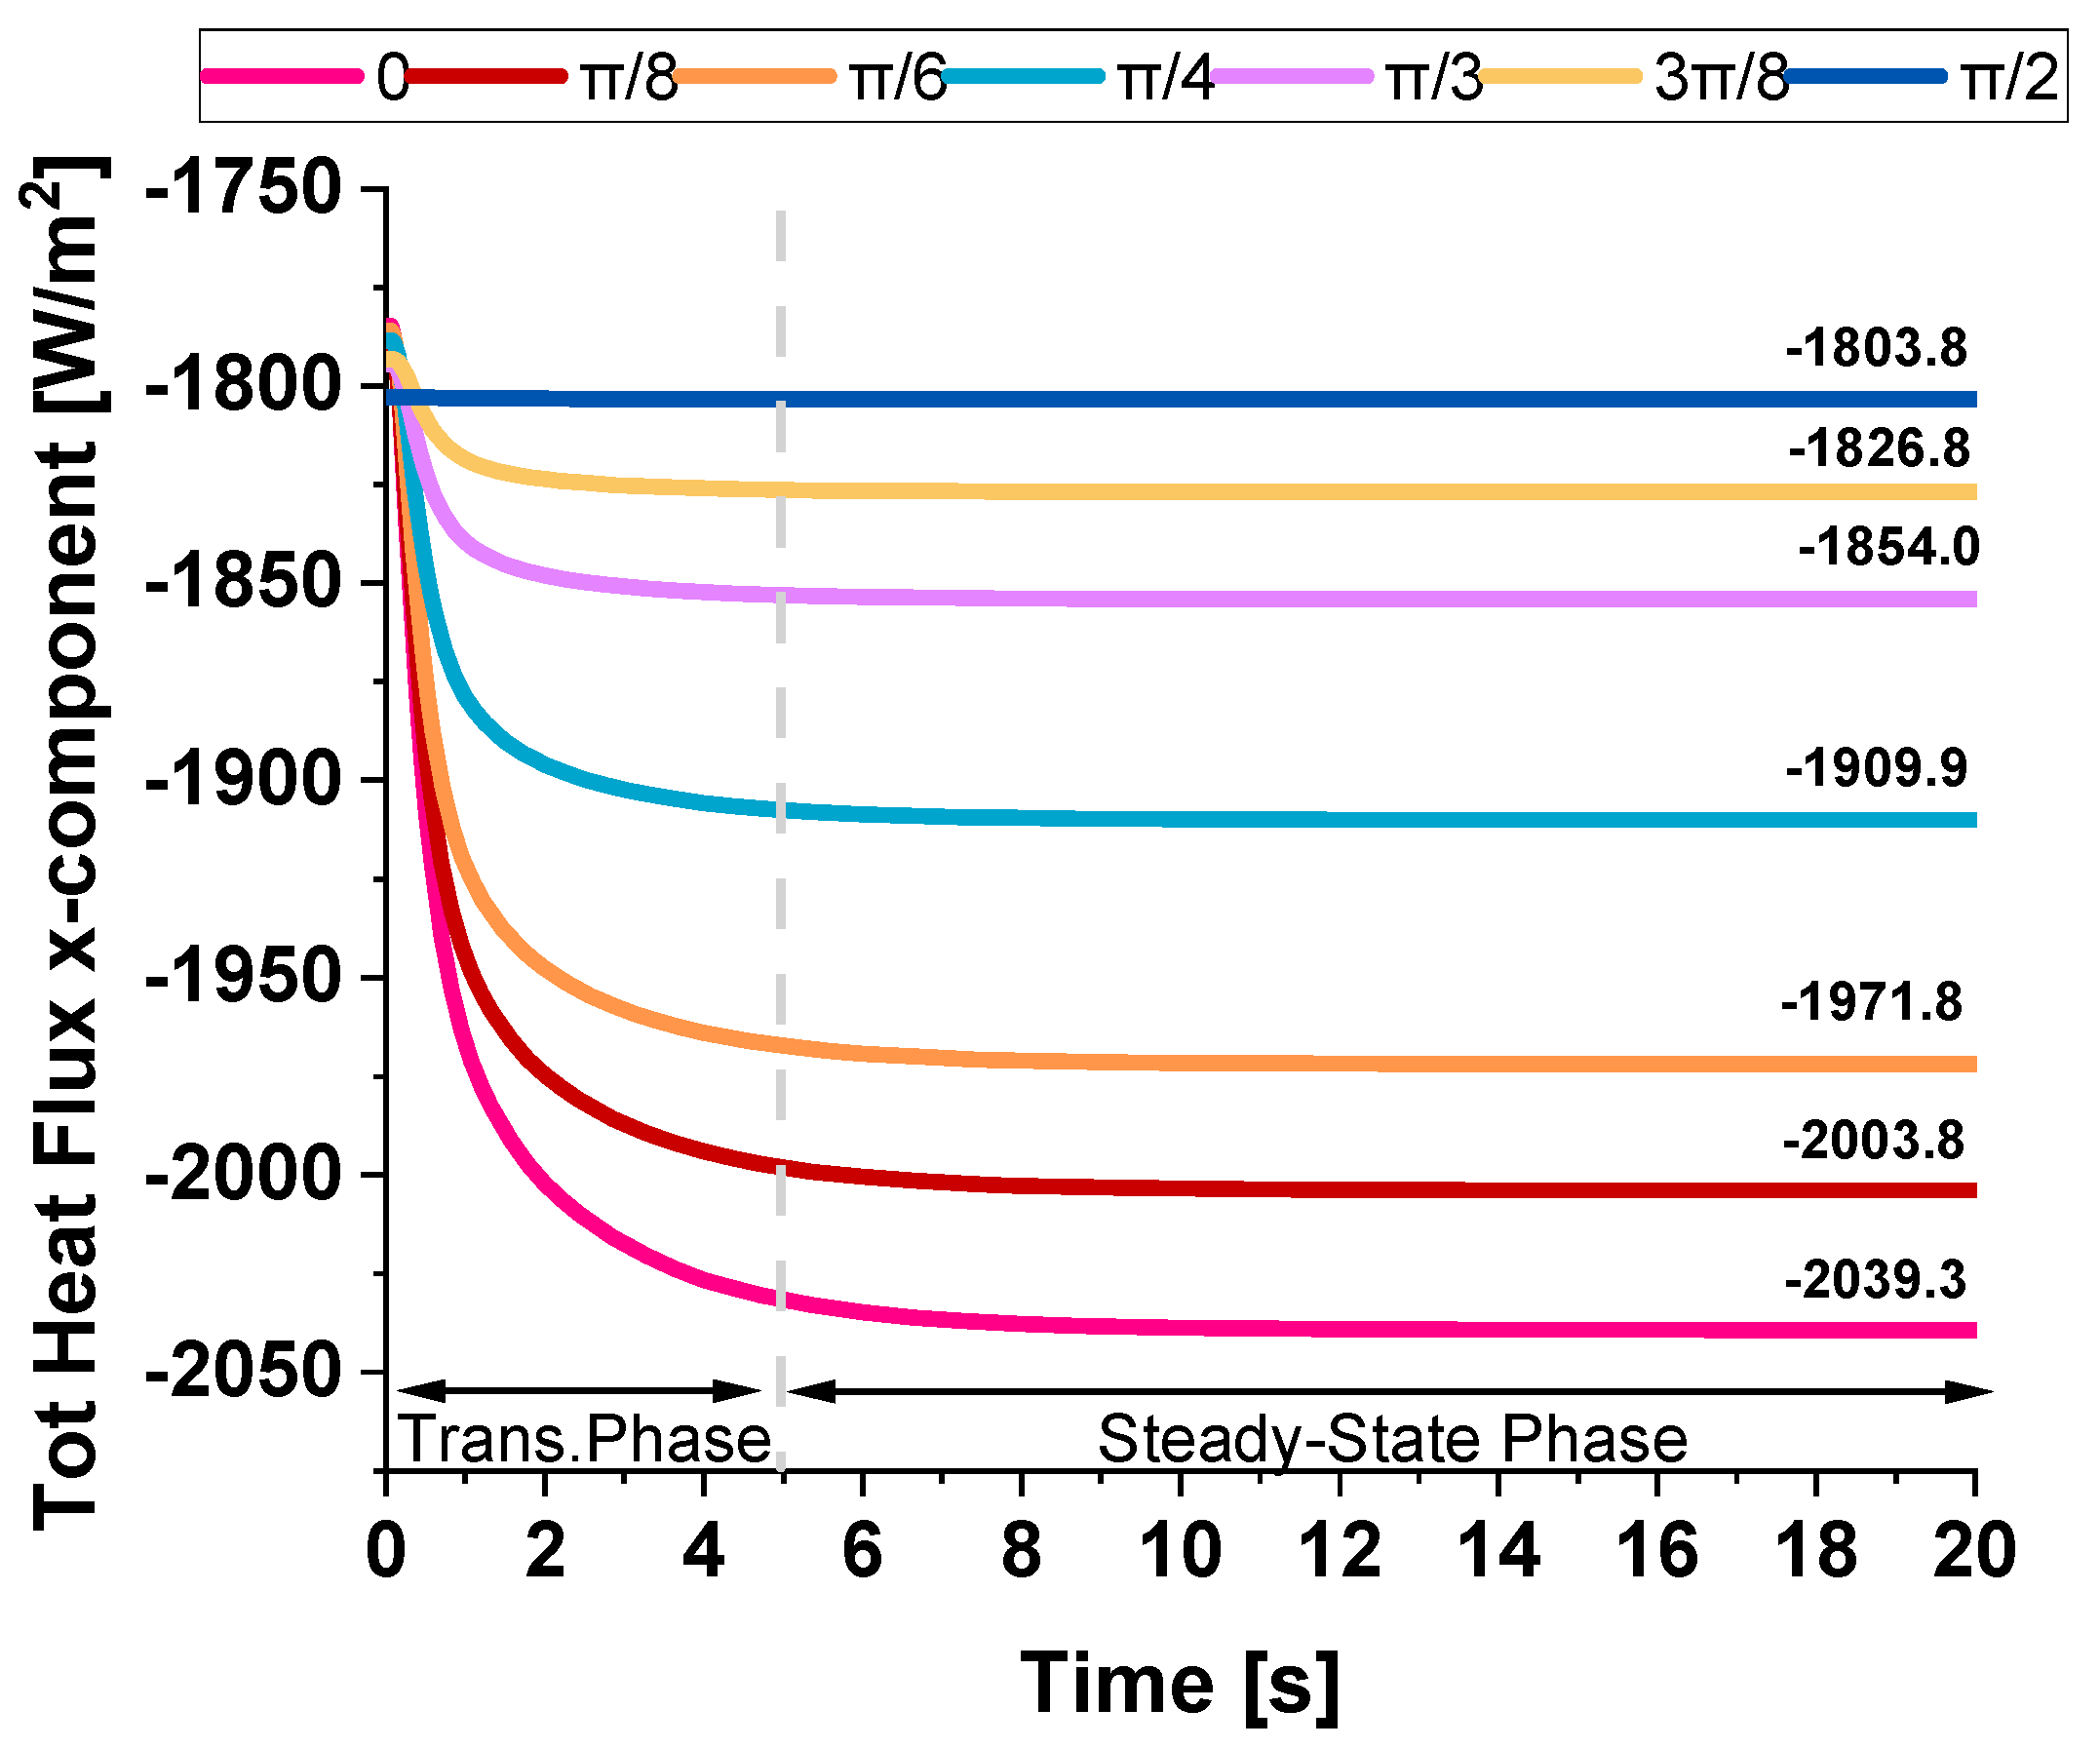
Figure 14.
Fitting curve for determining an empirical law for the numerical thermal conductivity as a function of the GNPs orientation inside the polymeric host matrix.
Figure 14.
Fitting curve for determining an empirical law for the numerical thermal conductivity as a function of the GNPs orientation inside the polymeric host matrix.
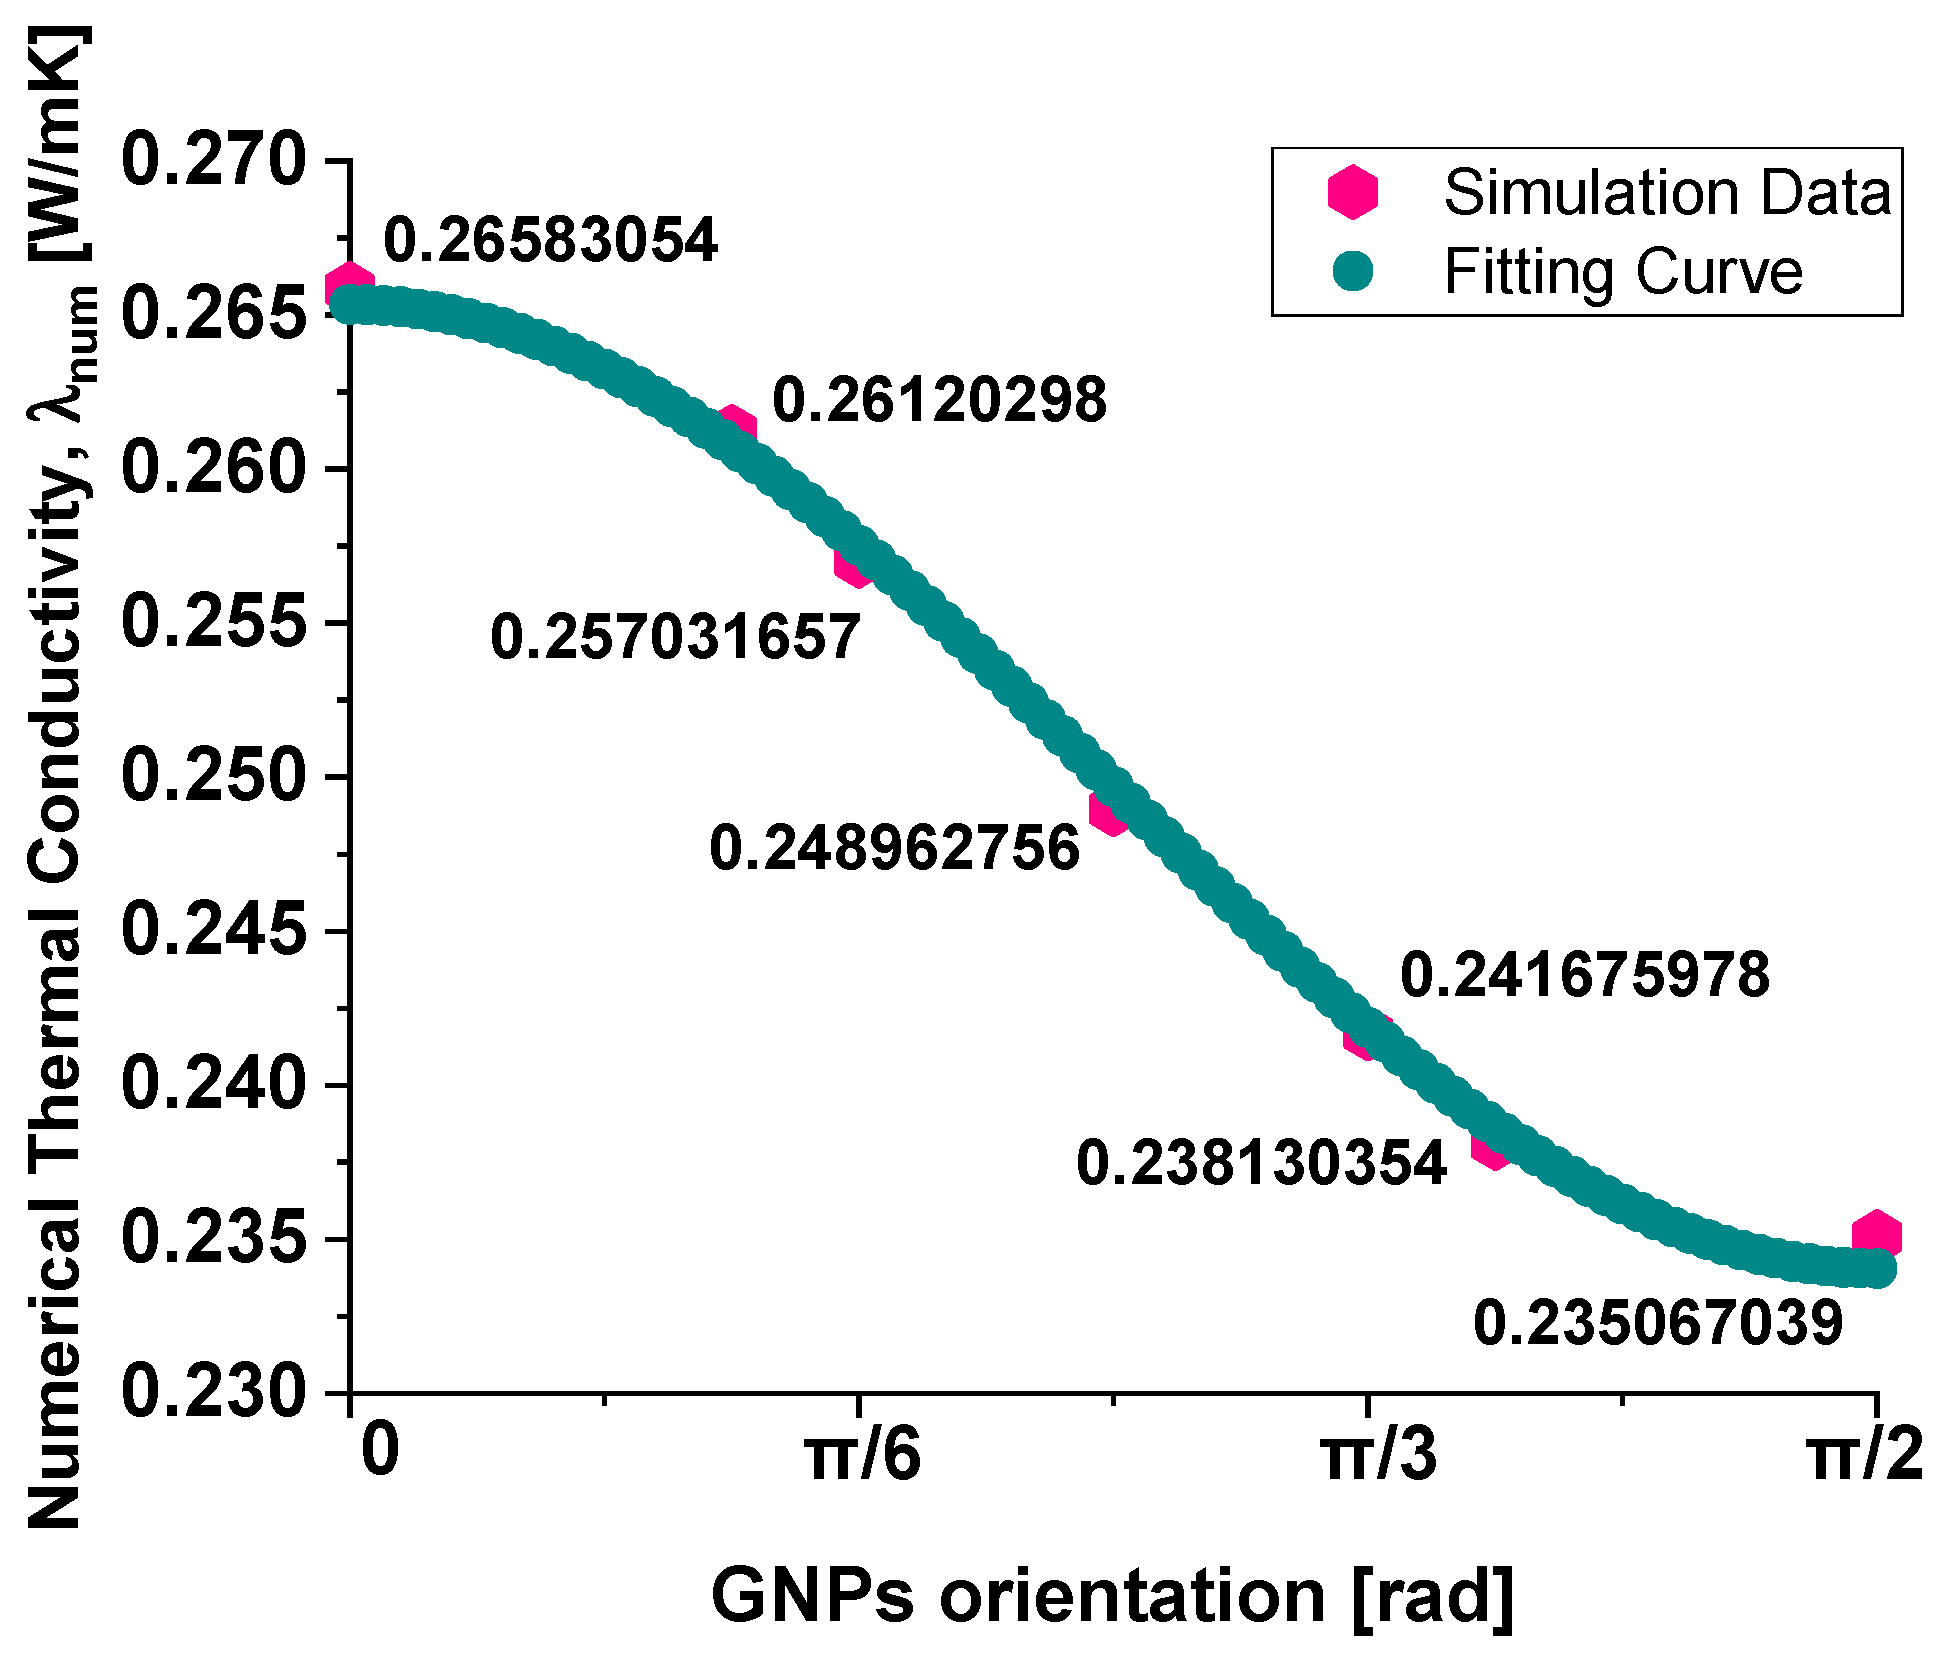
Figure 15.
Temperature evolution over the time (probe domain) when the temperature difference is applied along the in-plane direction in (a) and through-plane direction in (b) for different graphene nanoplatelet orientations (0, random, π/2) respect to the xy-plane.
Figure 15.
Temperature evolution over the time (probe domain) when the temperature difference is applied along the in-plane direction in (a) and through-plane direction in (b) for different graphene nanoplatelet orientations (0, random, π/2) respect to the xy-plane.
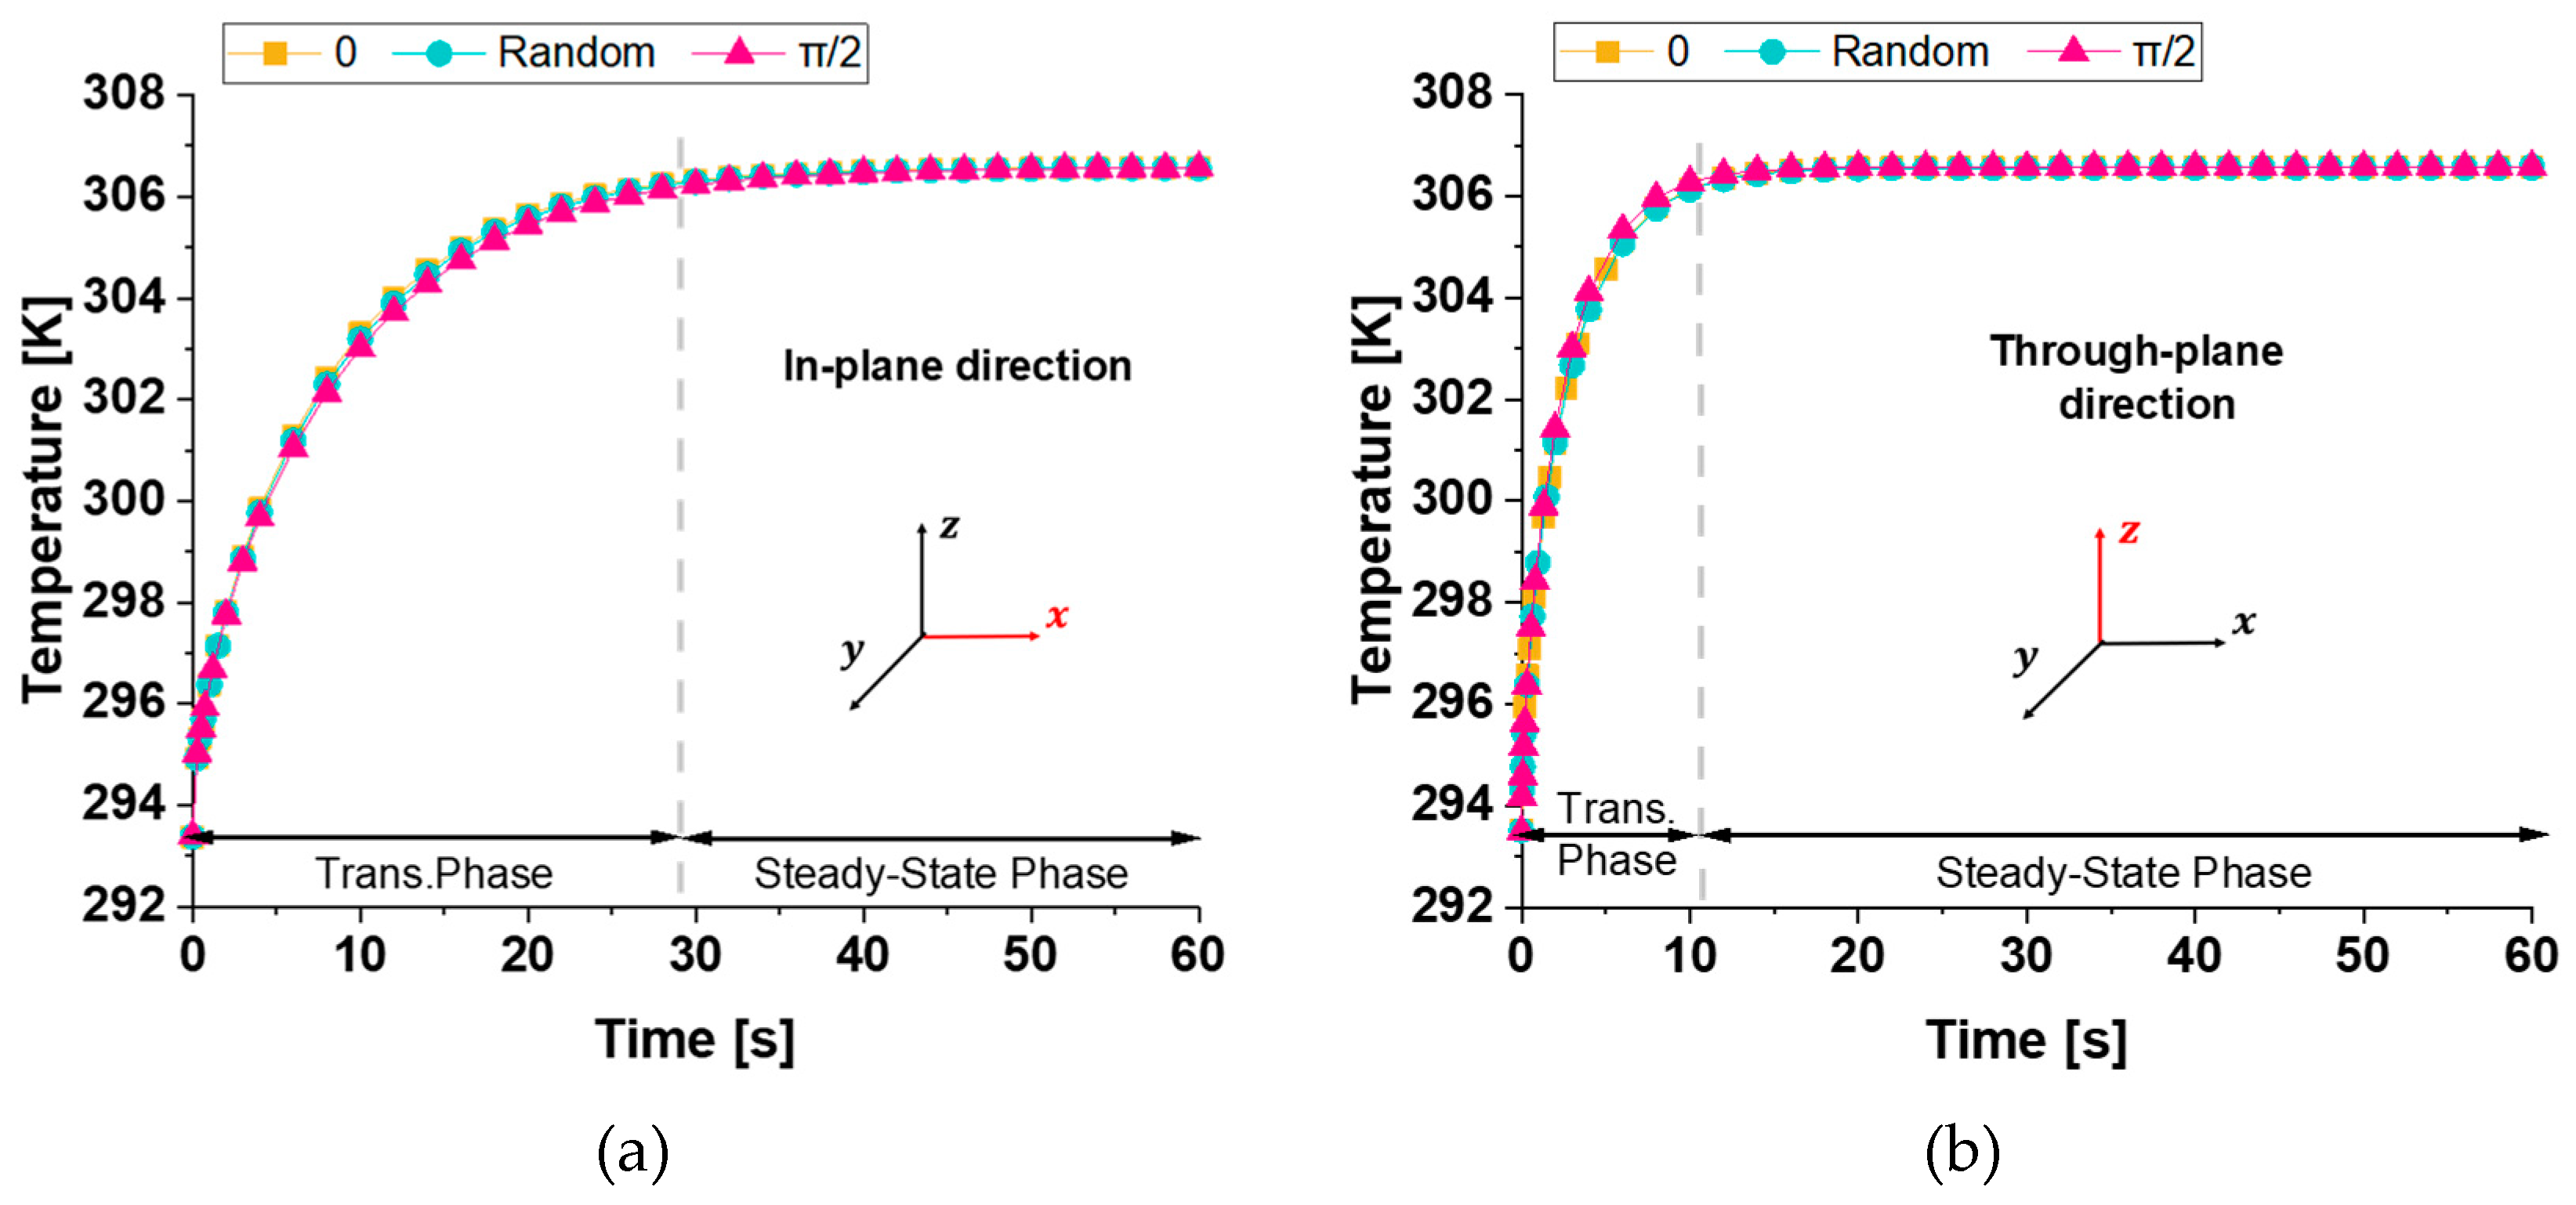
Figure 16.
Total heat flux, x-component, computed in-plane direction (a) and total heat flux, z-component, evaluated in through-plane direction (b) vs. time up to 20 s for different graphene nanoplatelet orientations (0, random, π/2).
Figure 16.
Total heat flux, x-component, computed in-plane direction (a) and total heat flux, z-component, evaluated in through-plane direction (b) vs. time up to 20 s for different graphene nanoplatelet orientations (0, random, π/2).
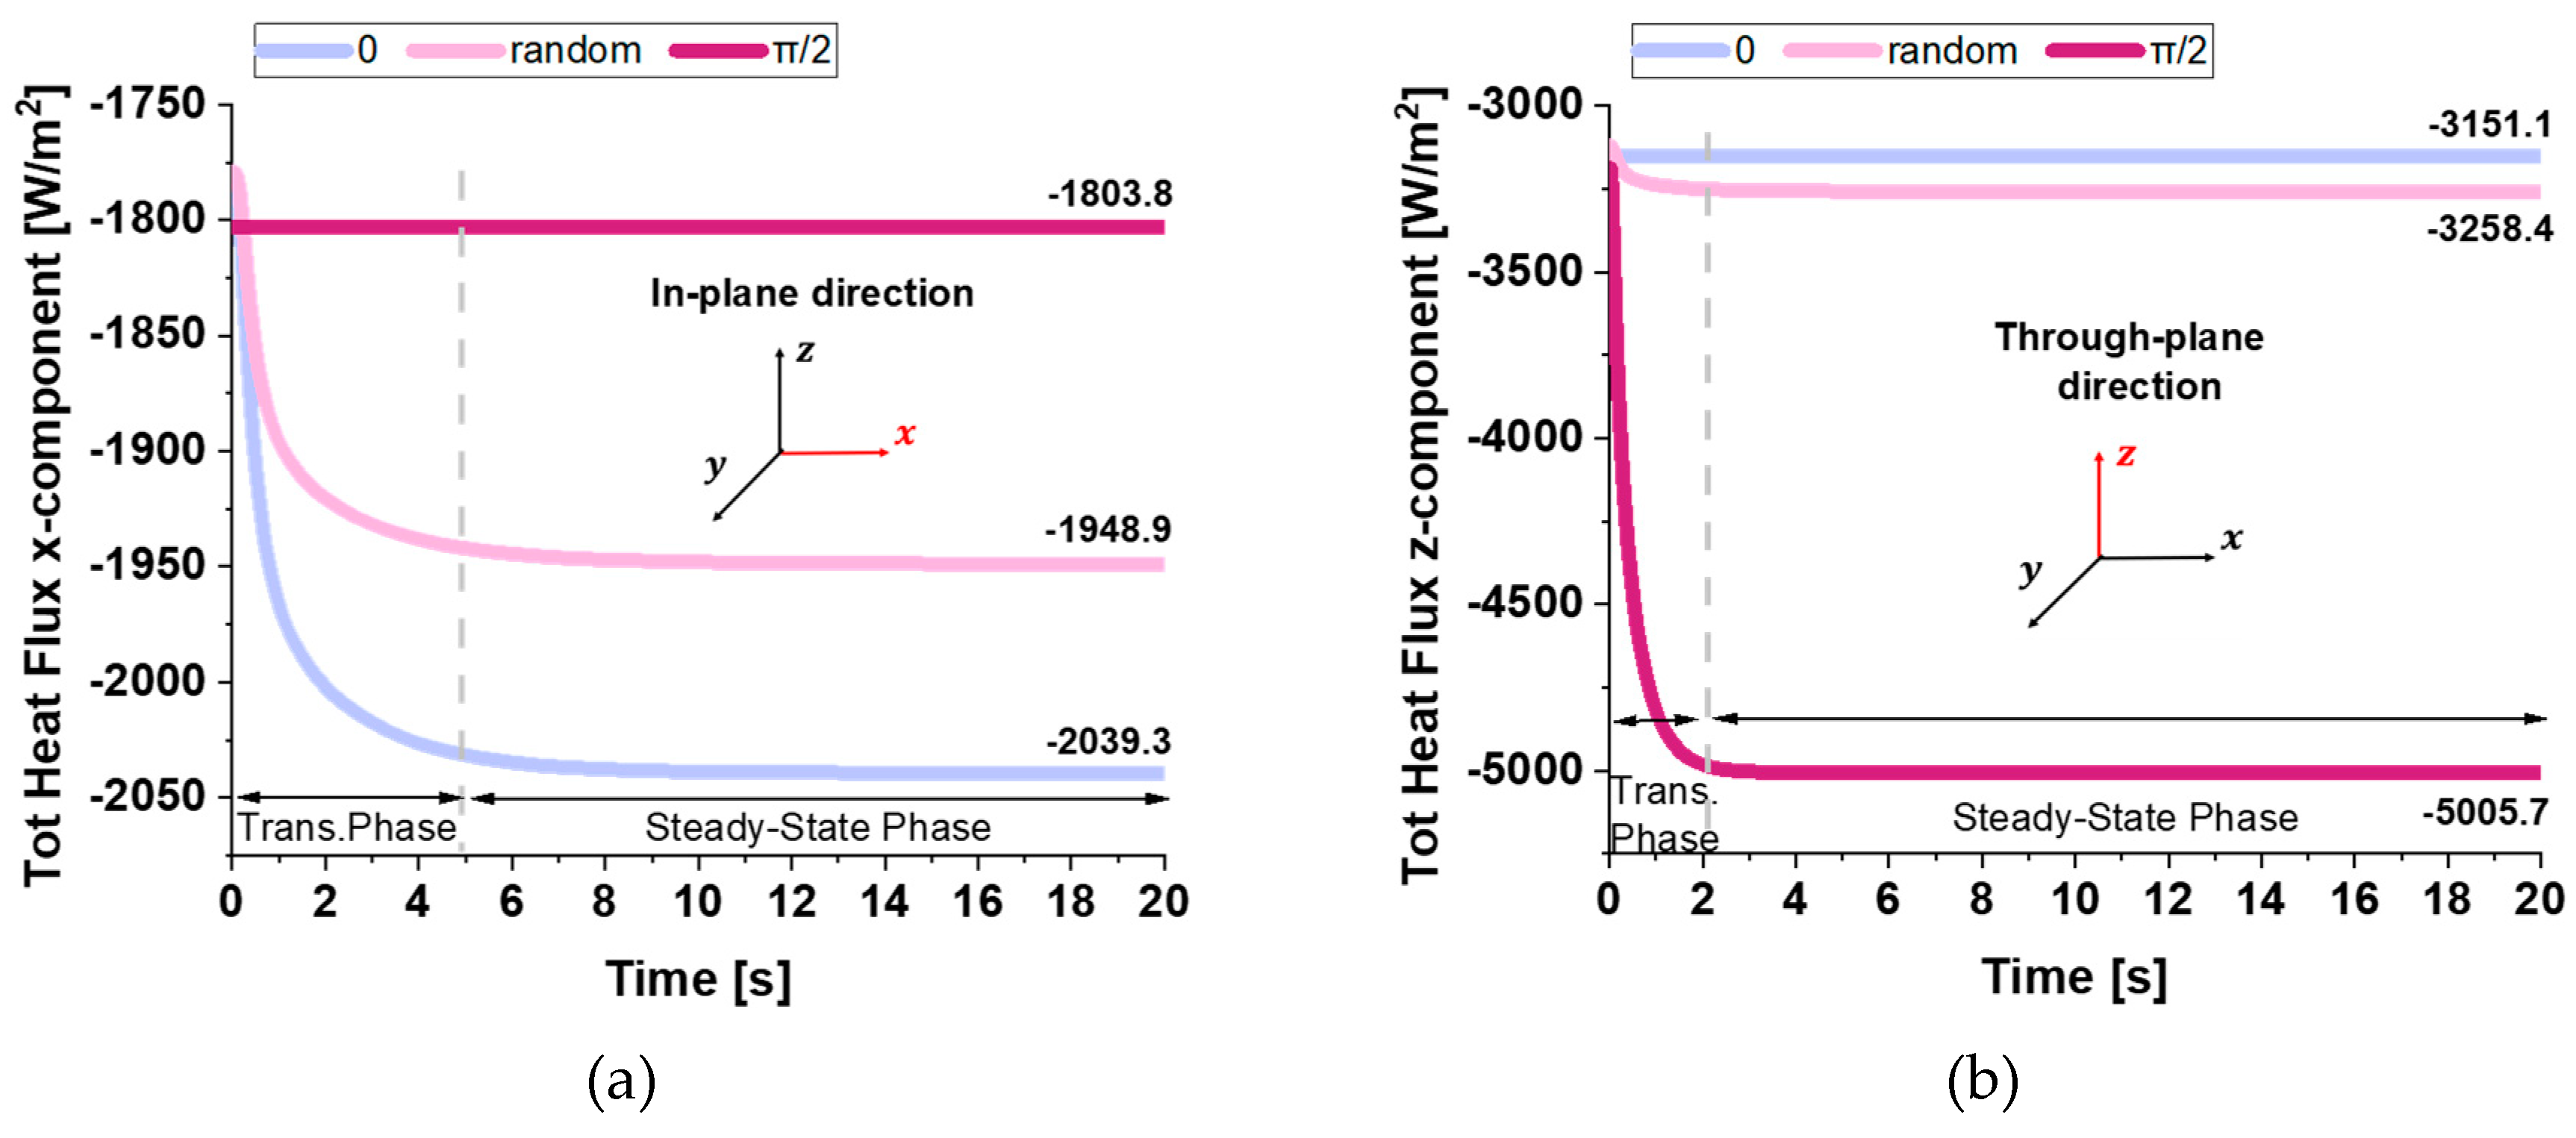
Figure 17.
Temperature profiles along the symmetry axes in both the in-plane in (a) and through-plane directions in (b).
Figure 17.
Temperature profiles along the symmetry axes in both the in-plane in (a) and through-plane directions in (b).
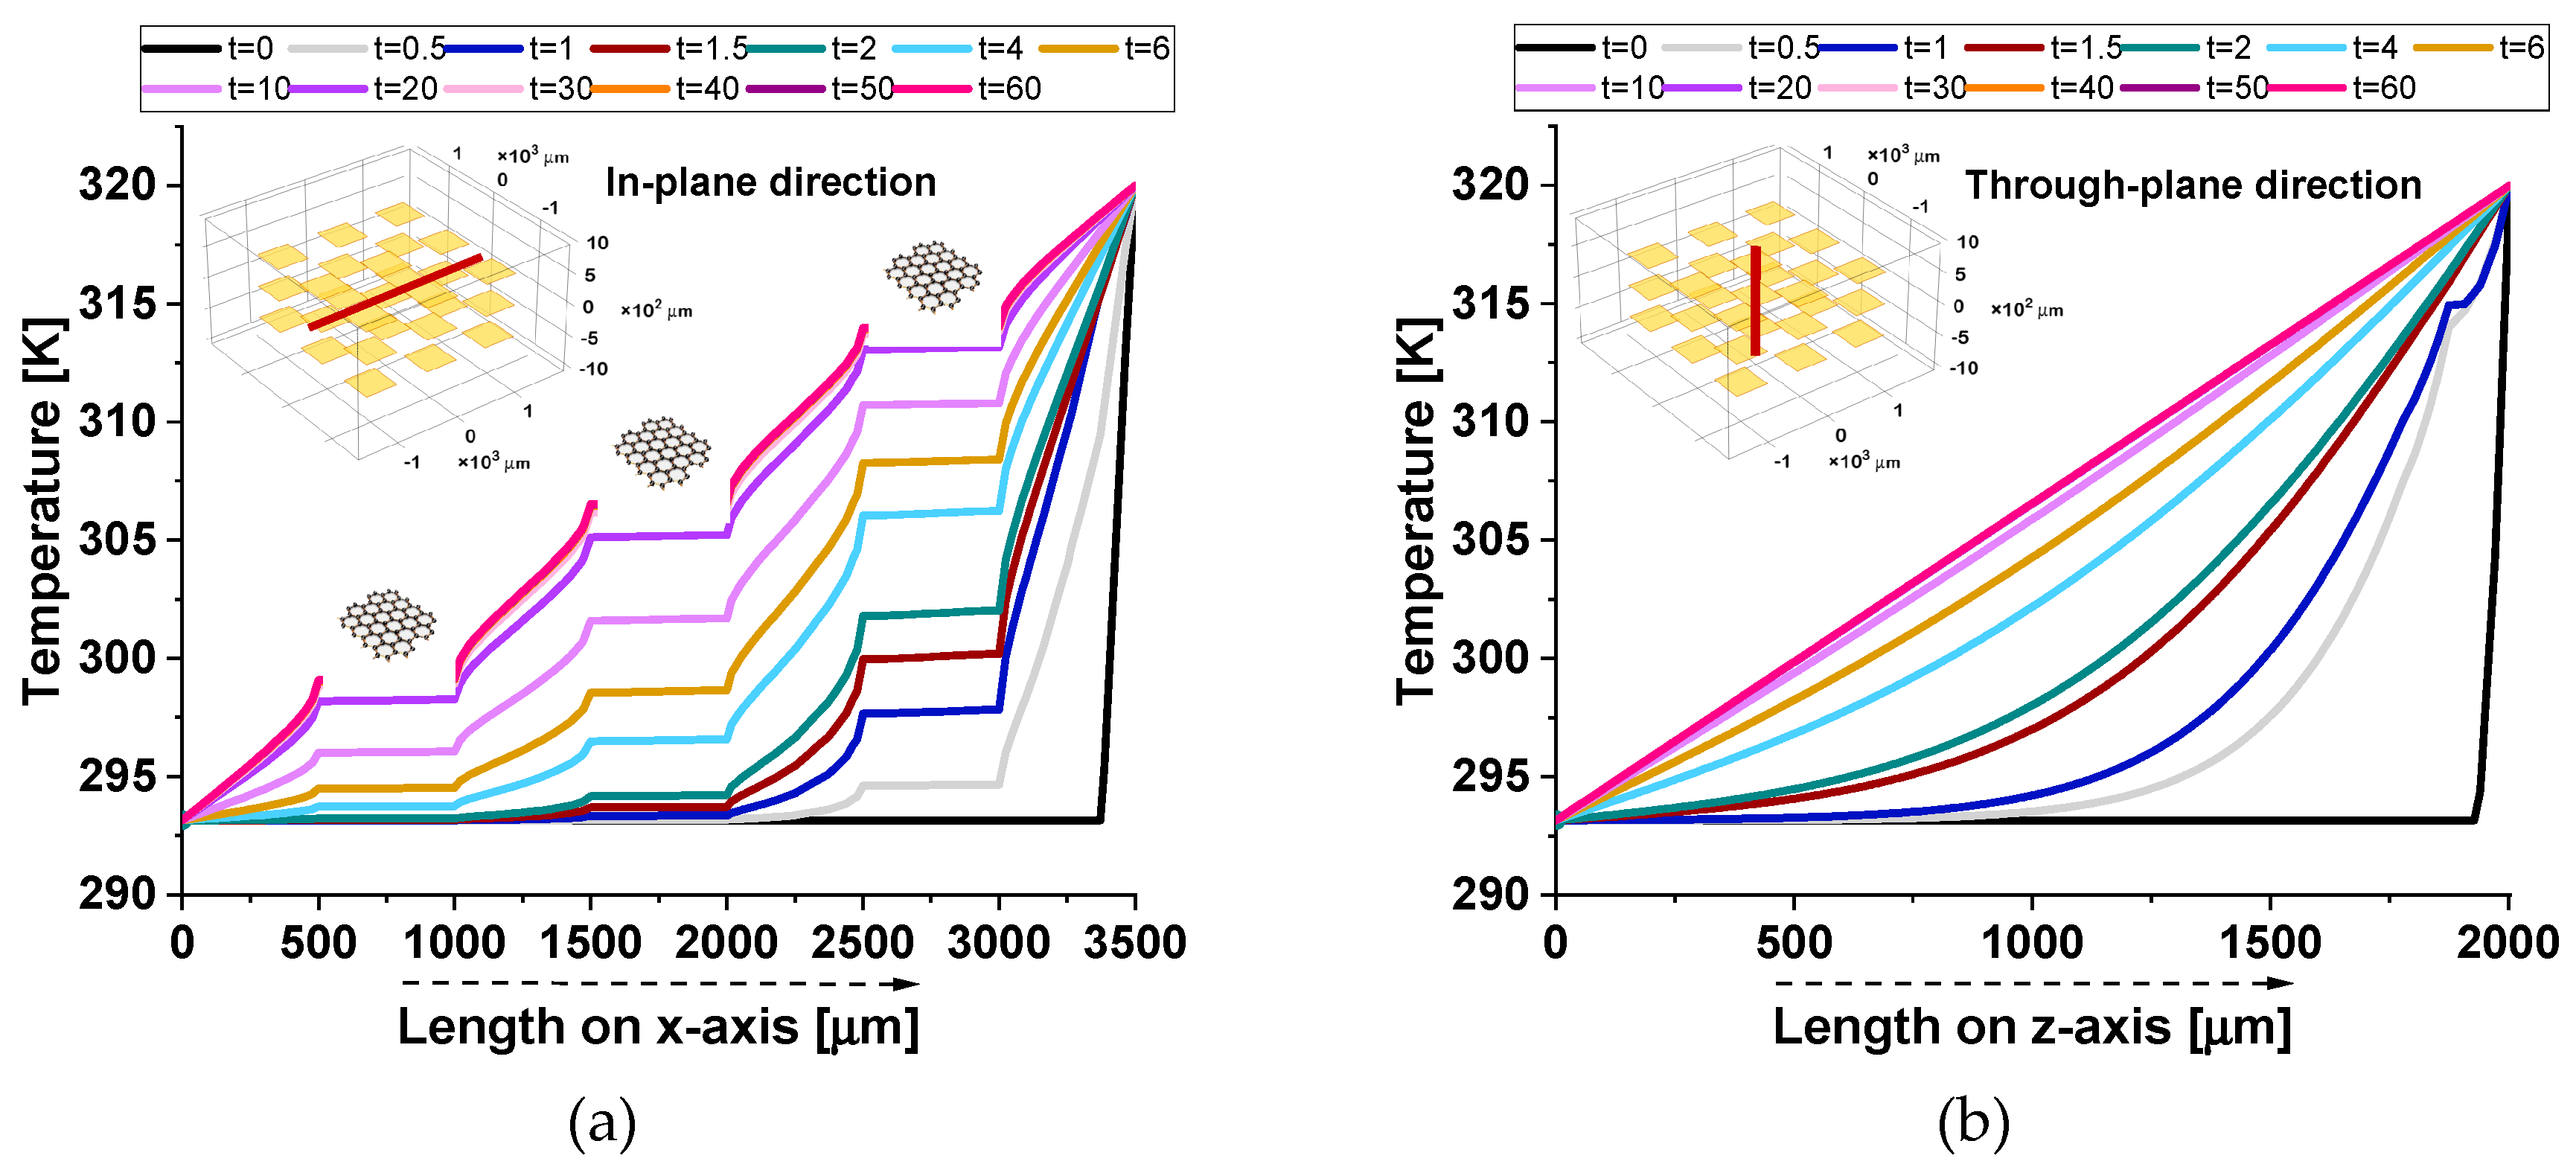
Figure 18.
3D surface temperature distributions along the in-plane direction (I-p dir.) at t = 5 s (transient phase, panel a) and t = 60 s (steady state, panel b). Panels (c) and (d) display the corresponding temperature profiles in the through-plane direction (T-p dir.) at t = 5 s and t = 60 s, respectively.
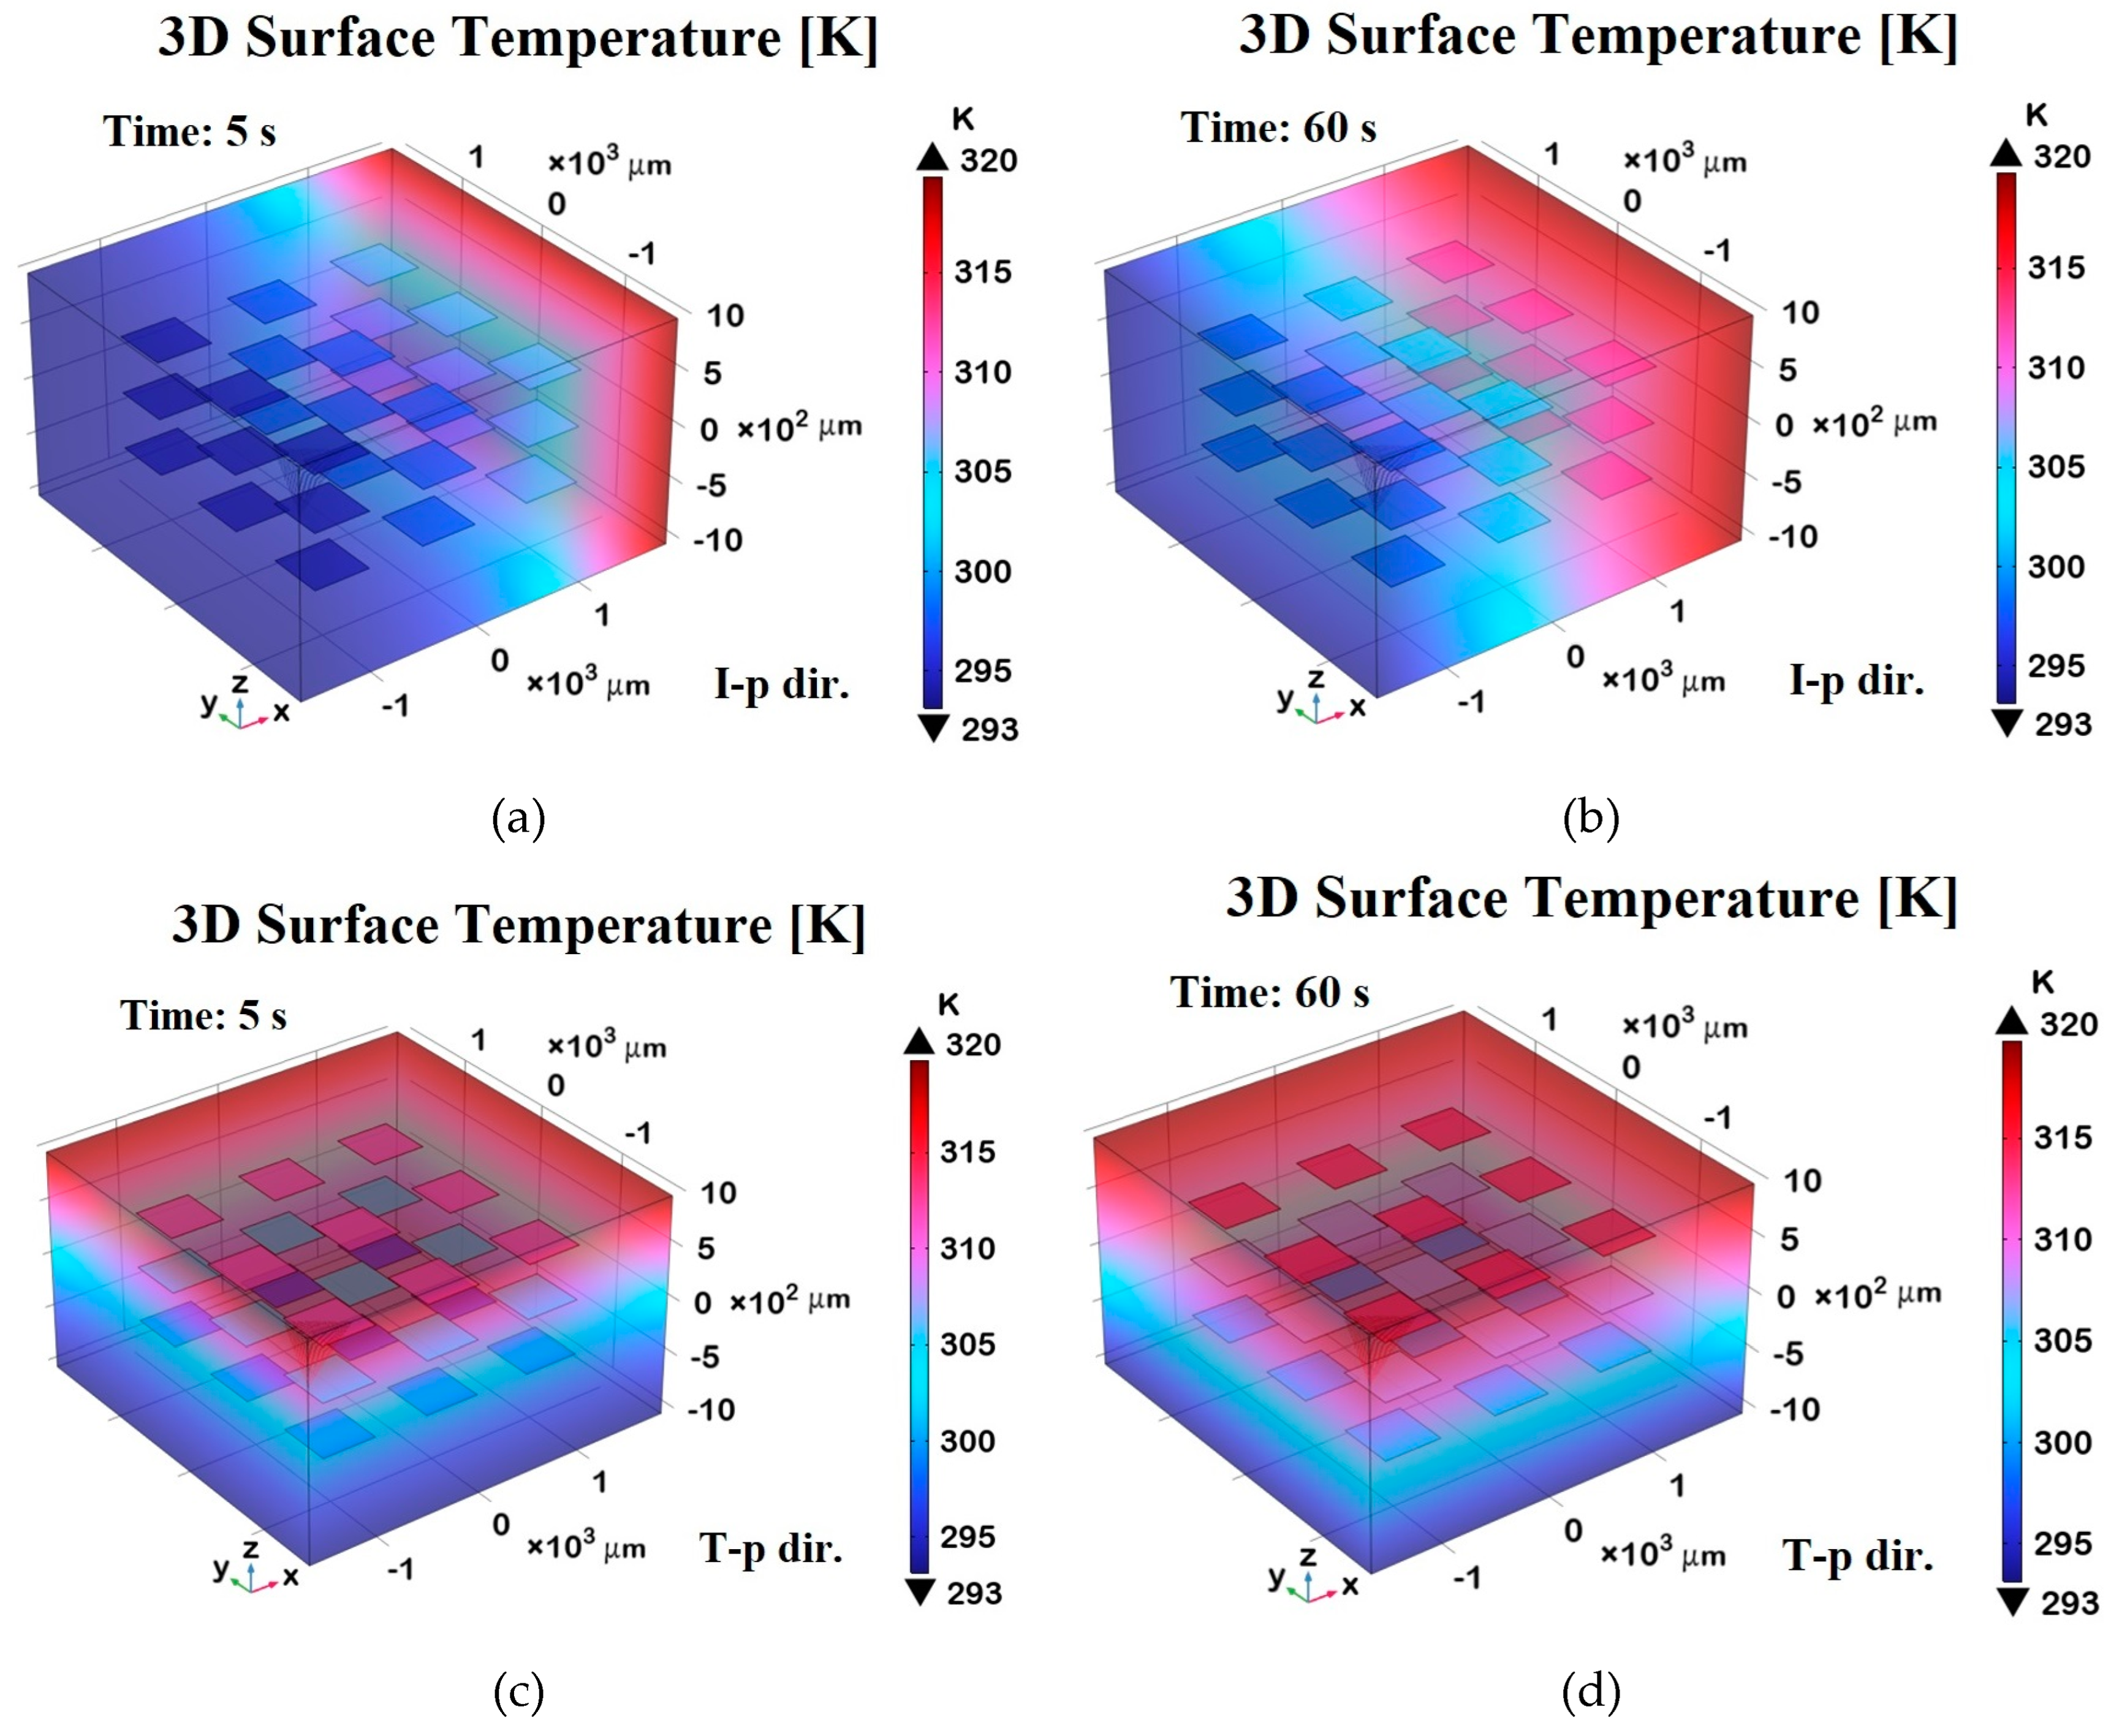
Figure 19.
Total heat flux x-component evaluated in in-plane direction (a) and z-component evaluated in through-plane direction (b) at different time instants.
Figure 19.
Total heat flux x-component evaluated in in-plane direction (a) and z-component evaluated in through-plane direction (b) at different time instants.
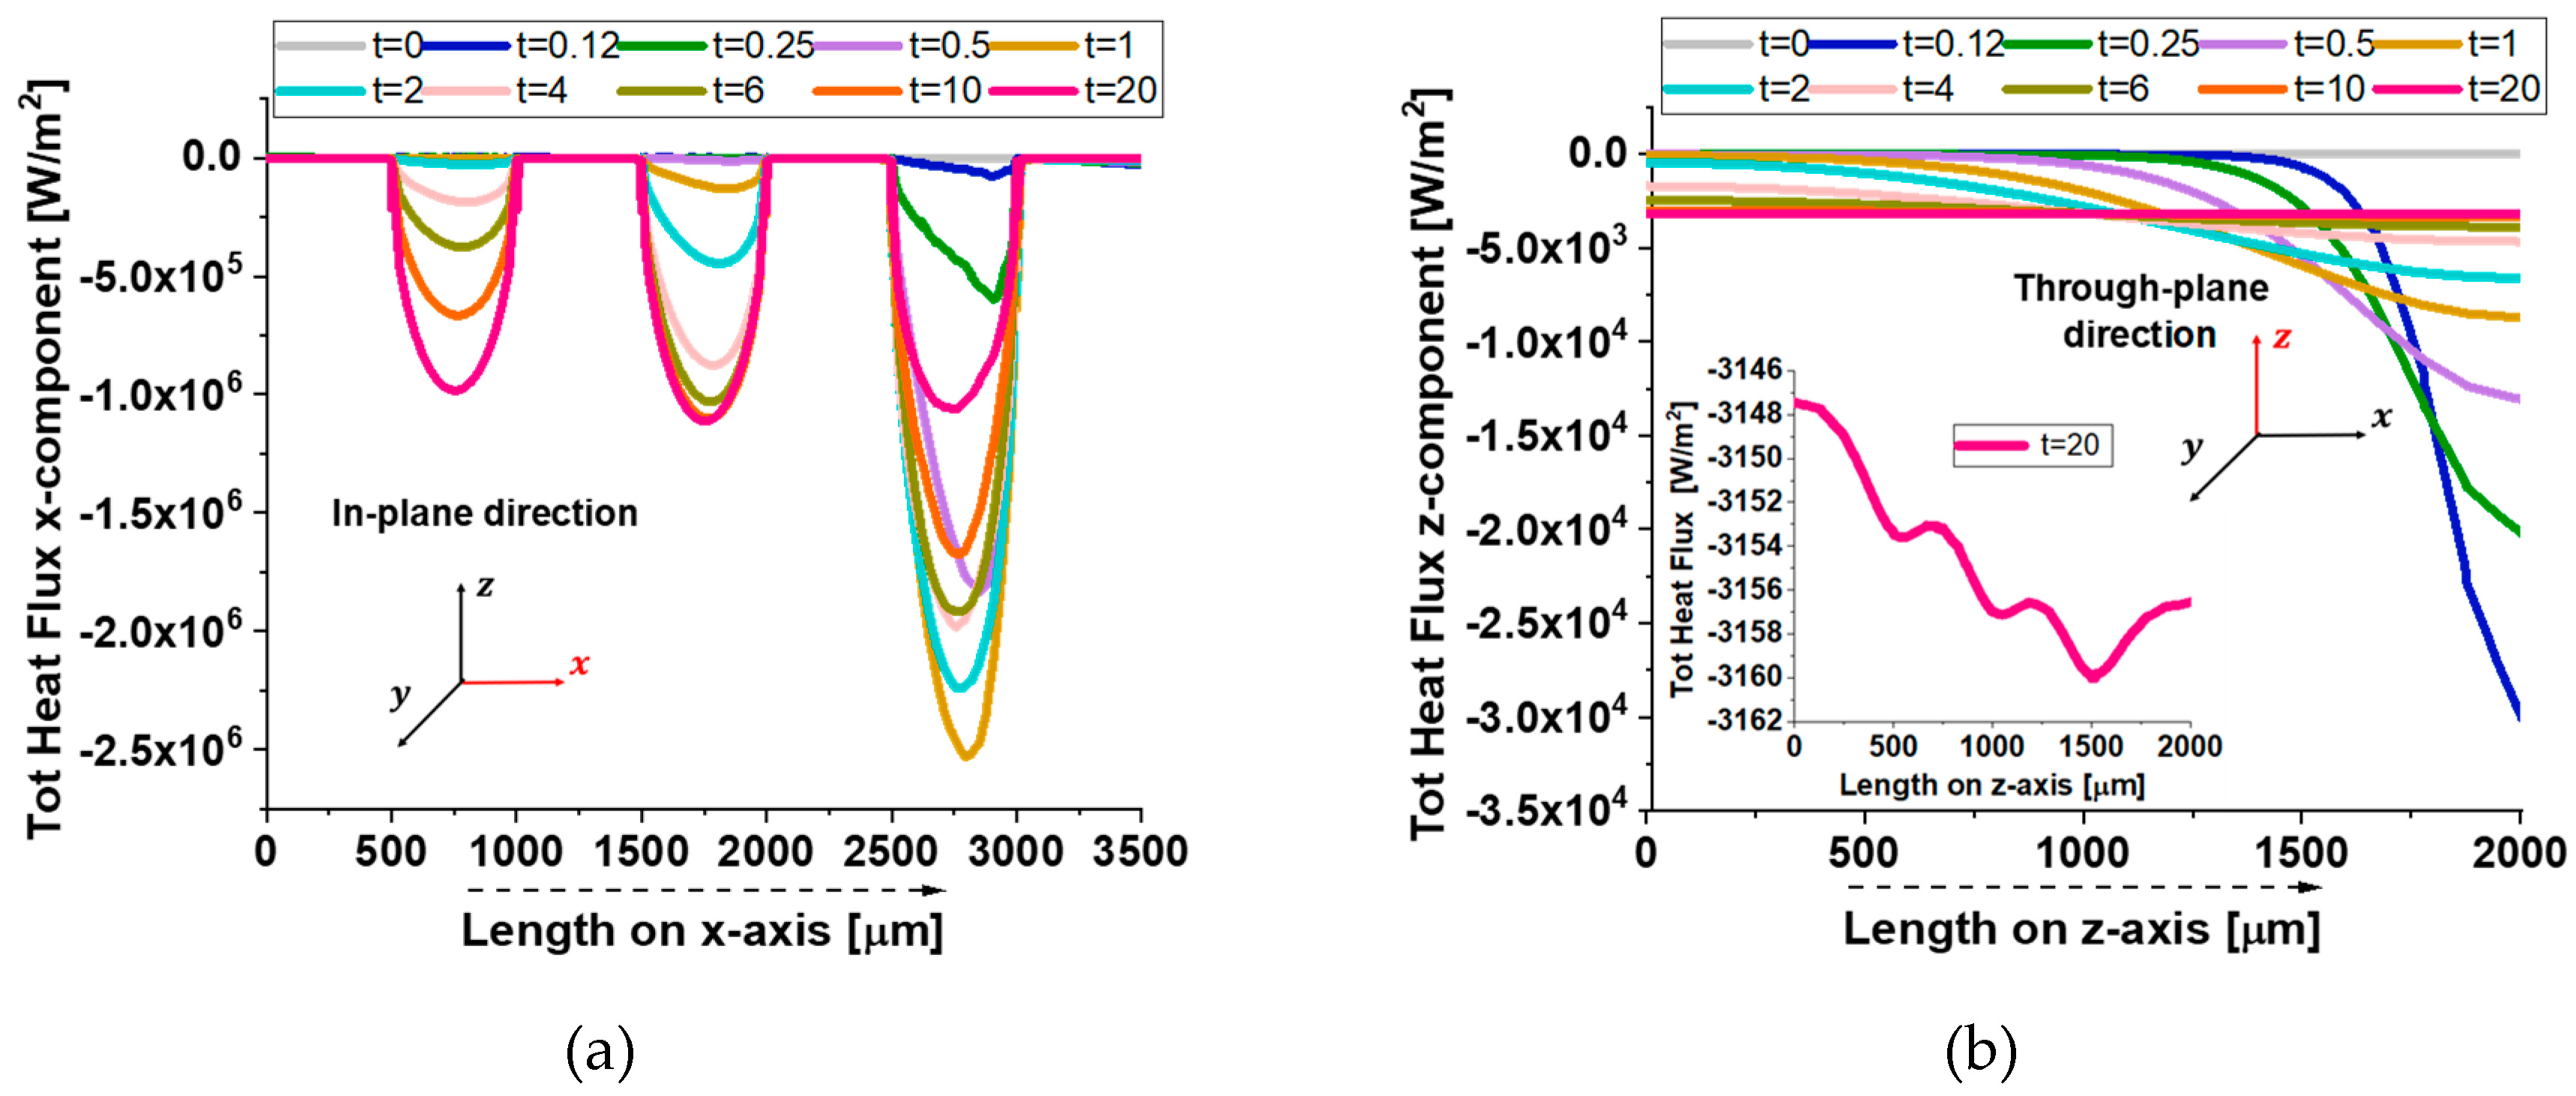
Figure 20.
3D surface distributions of the total heat flux. Panels (a) and (b) display the x-component along the in-plane direction (I-p dir.) at t = 1 s (transient phase) and t = 20 s (steady state), respectively. Panels (c) and (d) show the z-component of the total heat flux along the through-plane direction (T-p dir.) at the same time points.
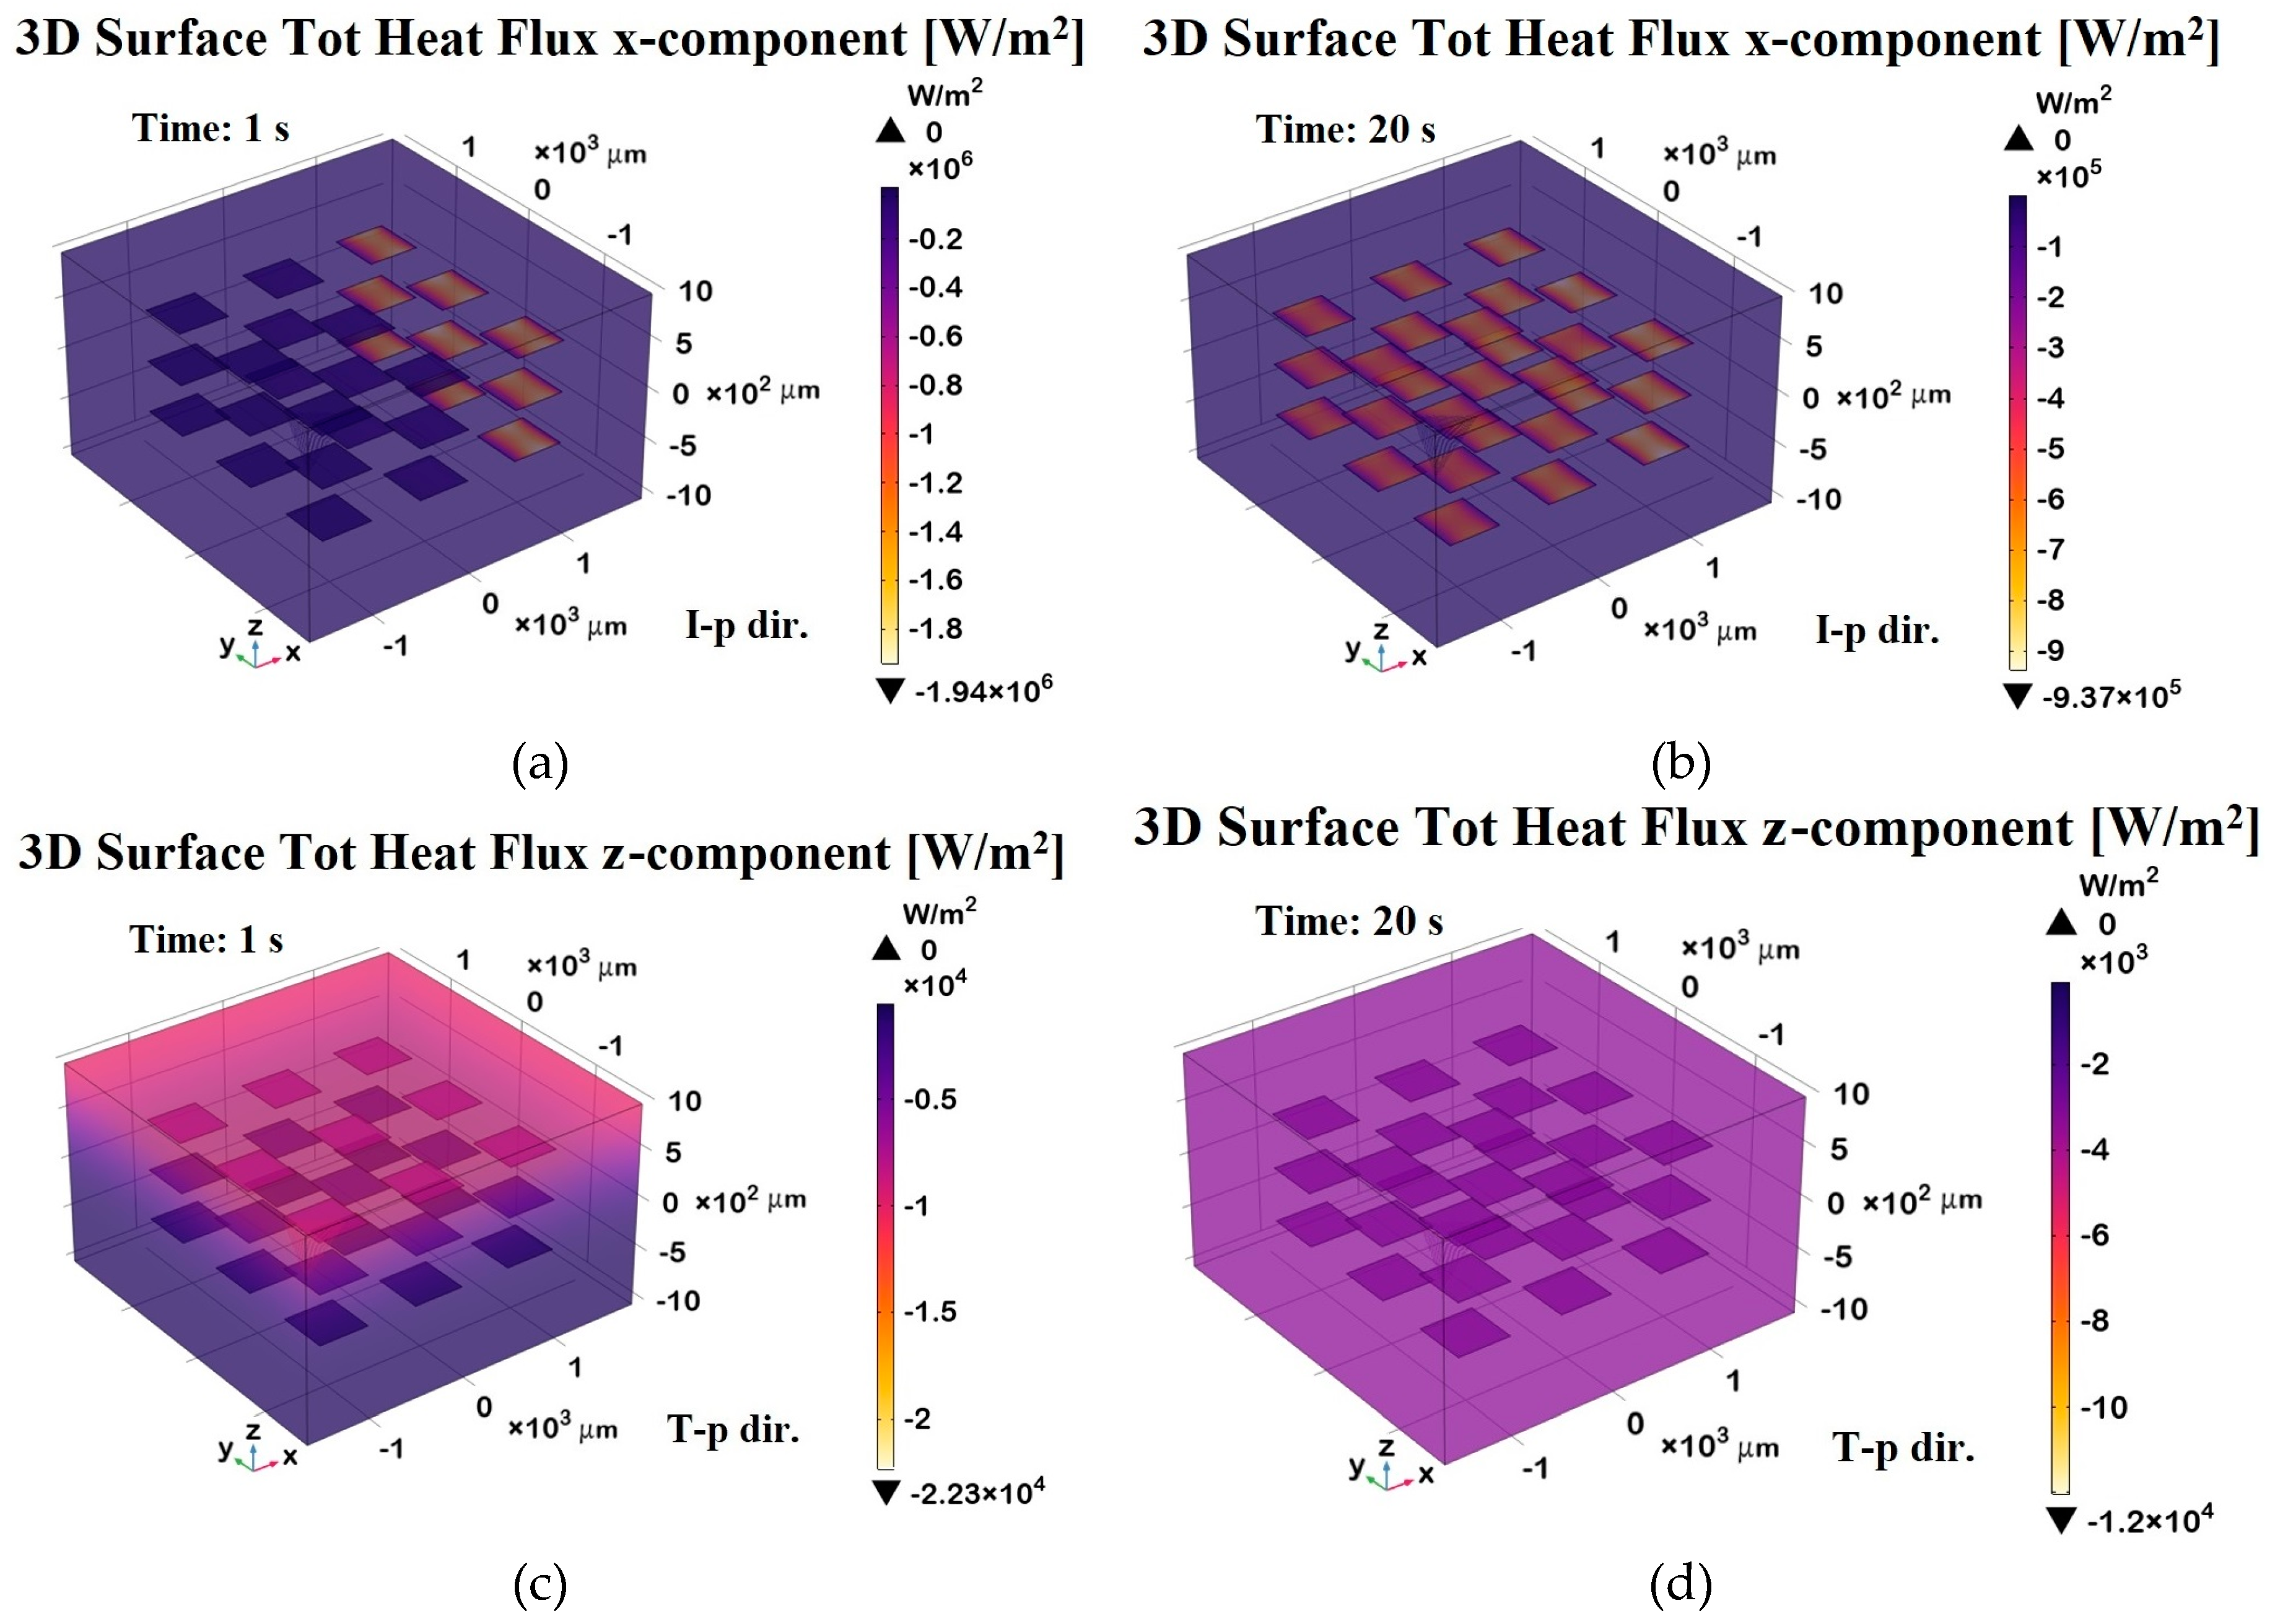
Figure 21.
Temperature profiles along the symmetry axes of the composite with a random distribution of 27 graphene platelets, shown in the in-plane direction in panel (a) and in the through-plane direction in panel (b).
Figure 21.
Temperature profiles along the symmetry axes of the composite with a random distribution of 27 graphene platelets, shown in the in-plane direction in panel (a) and in the through-plane direction in panel (b).
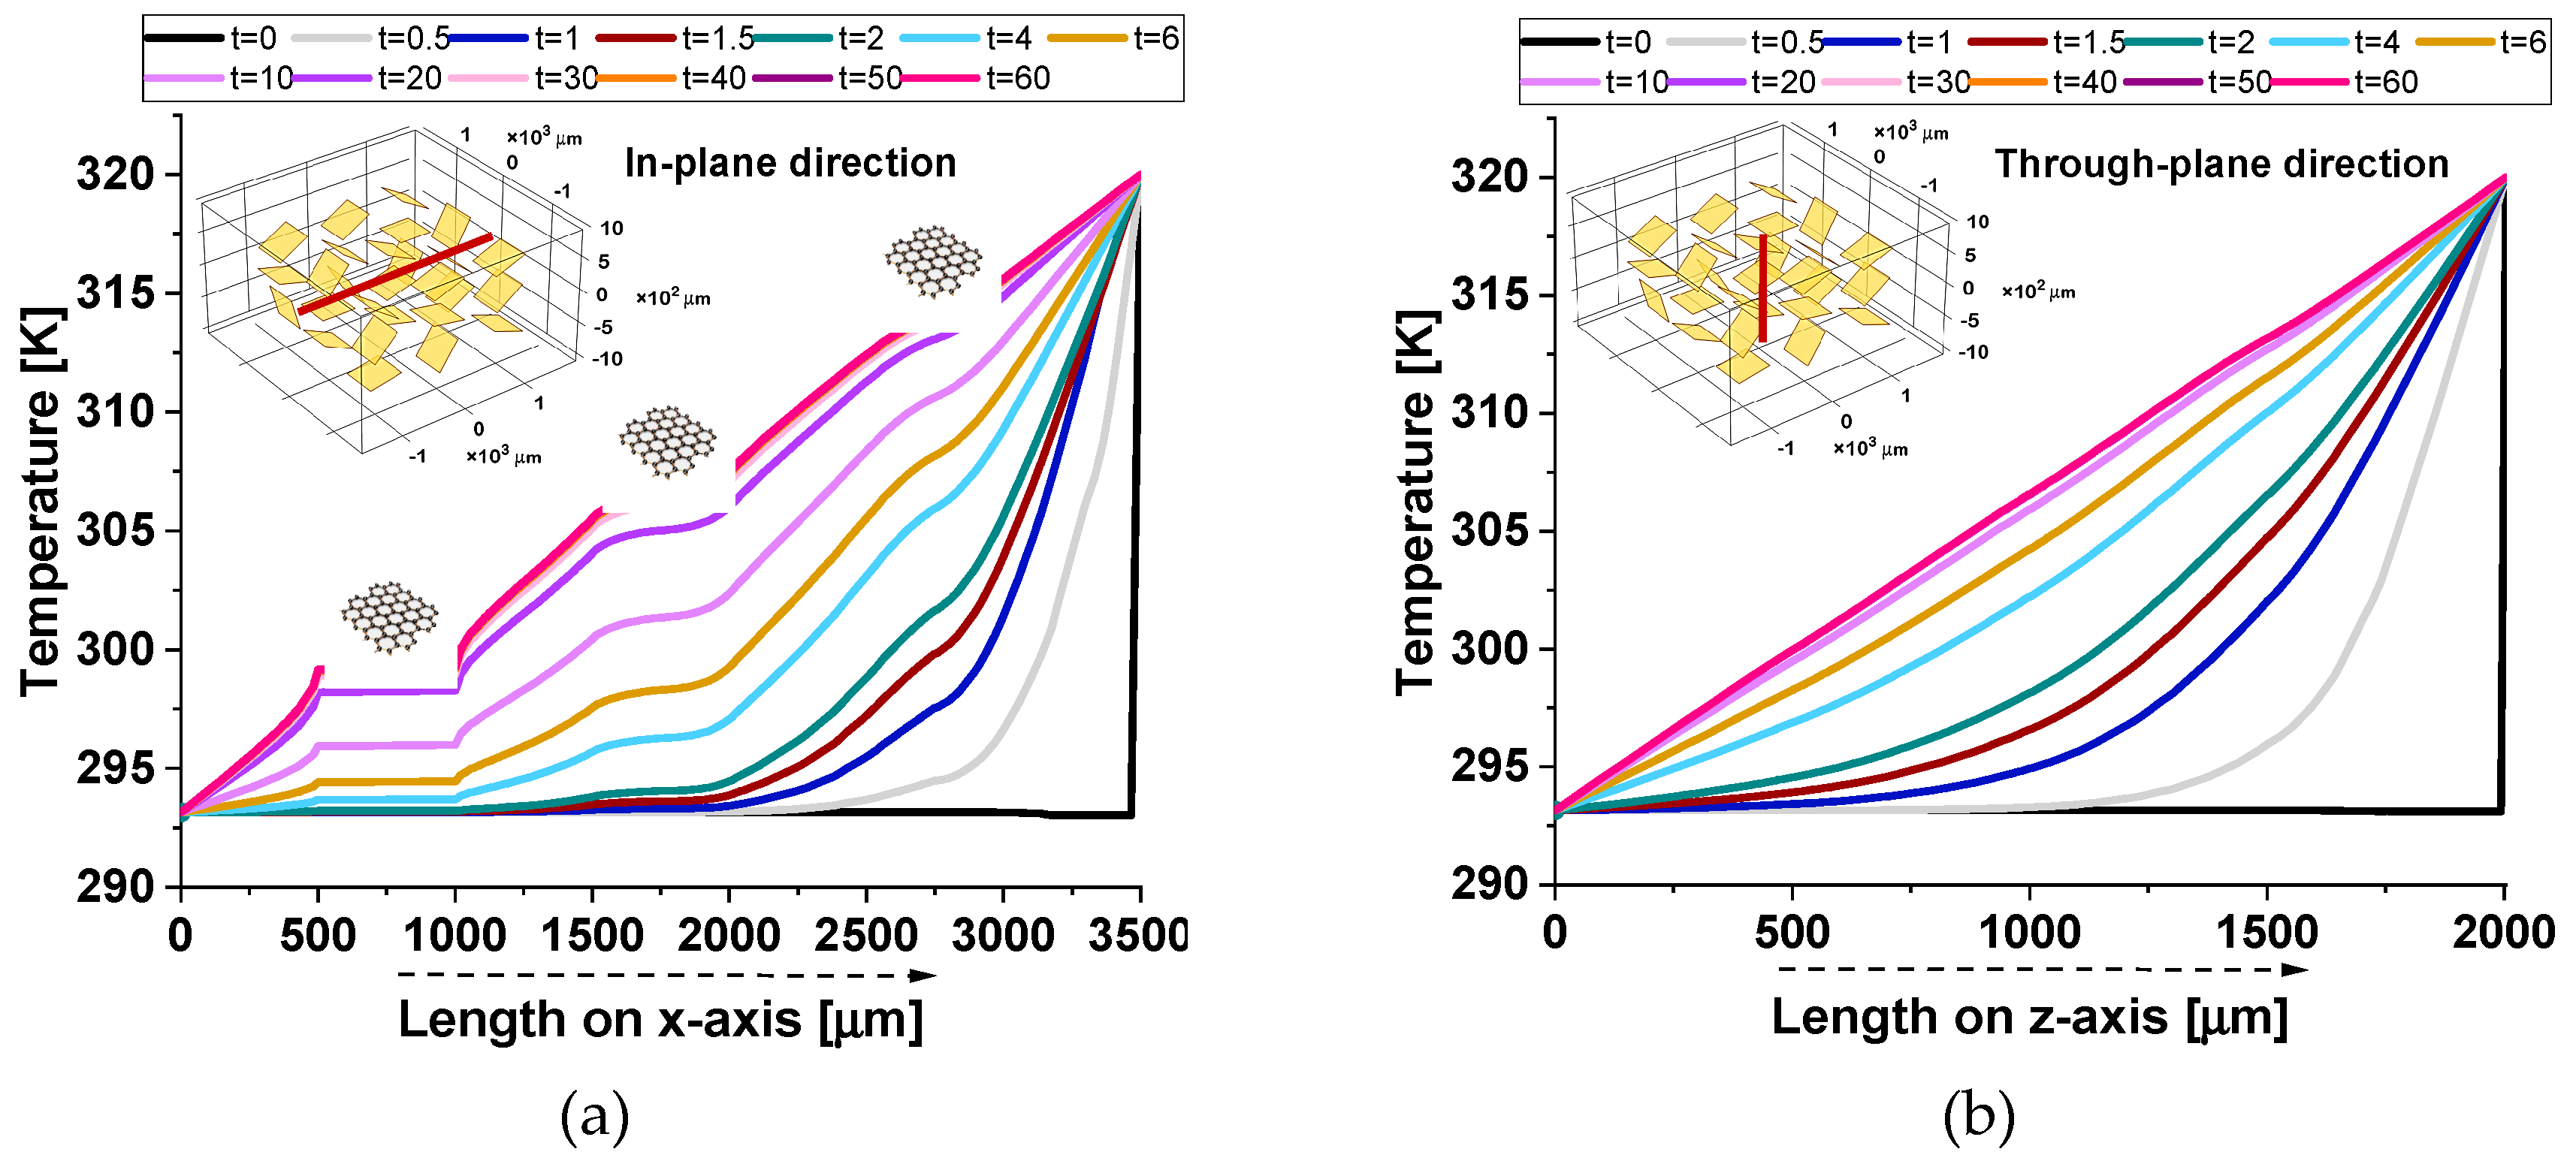
Figure 22.
3D surface temperature distributions in the case of randomly oriented GNPs the in-plane direction (I-p dir.) at t = 5 s (transient phase, panel a) and t = 60 s (steady state, panel b). Panels (c) and (d) display the corresponding temperature profiles in the through-plane direction (T-p dir.) at t = 5 s and t = 60 s, respectively.
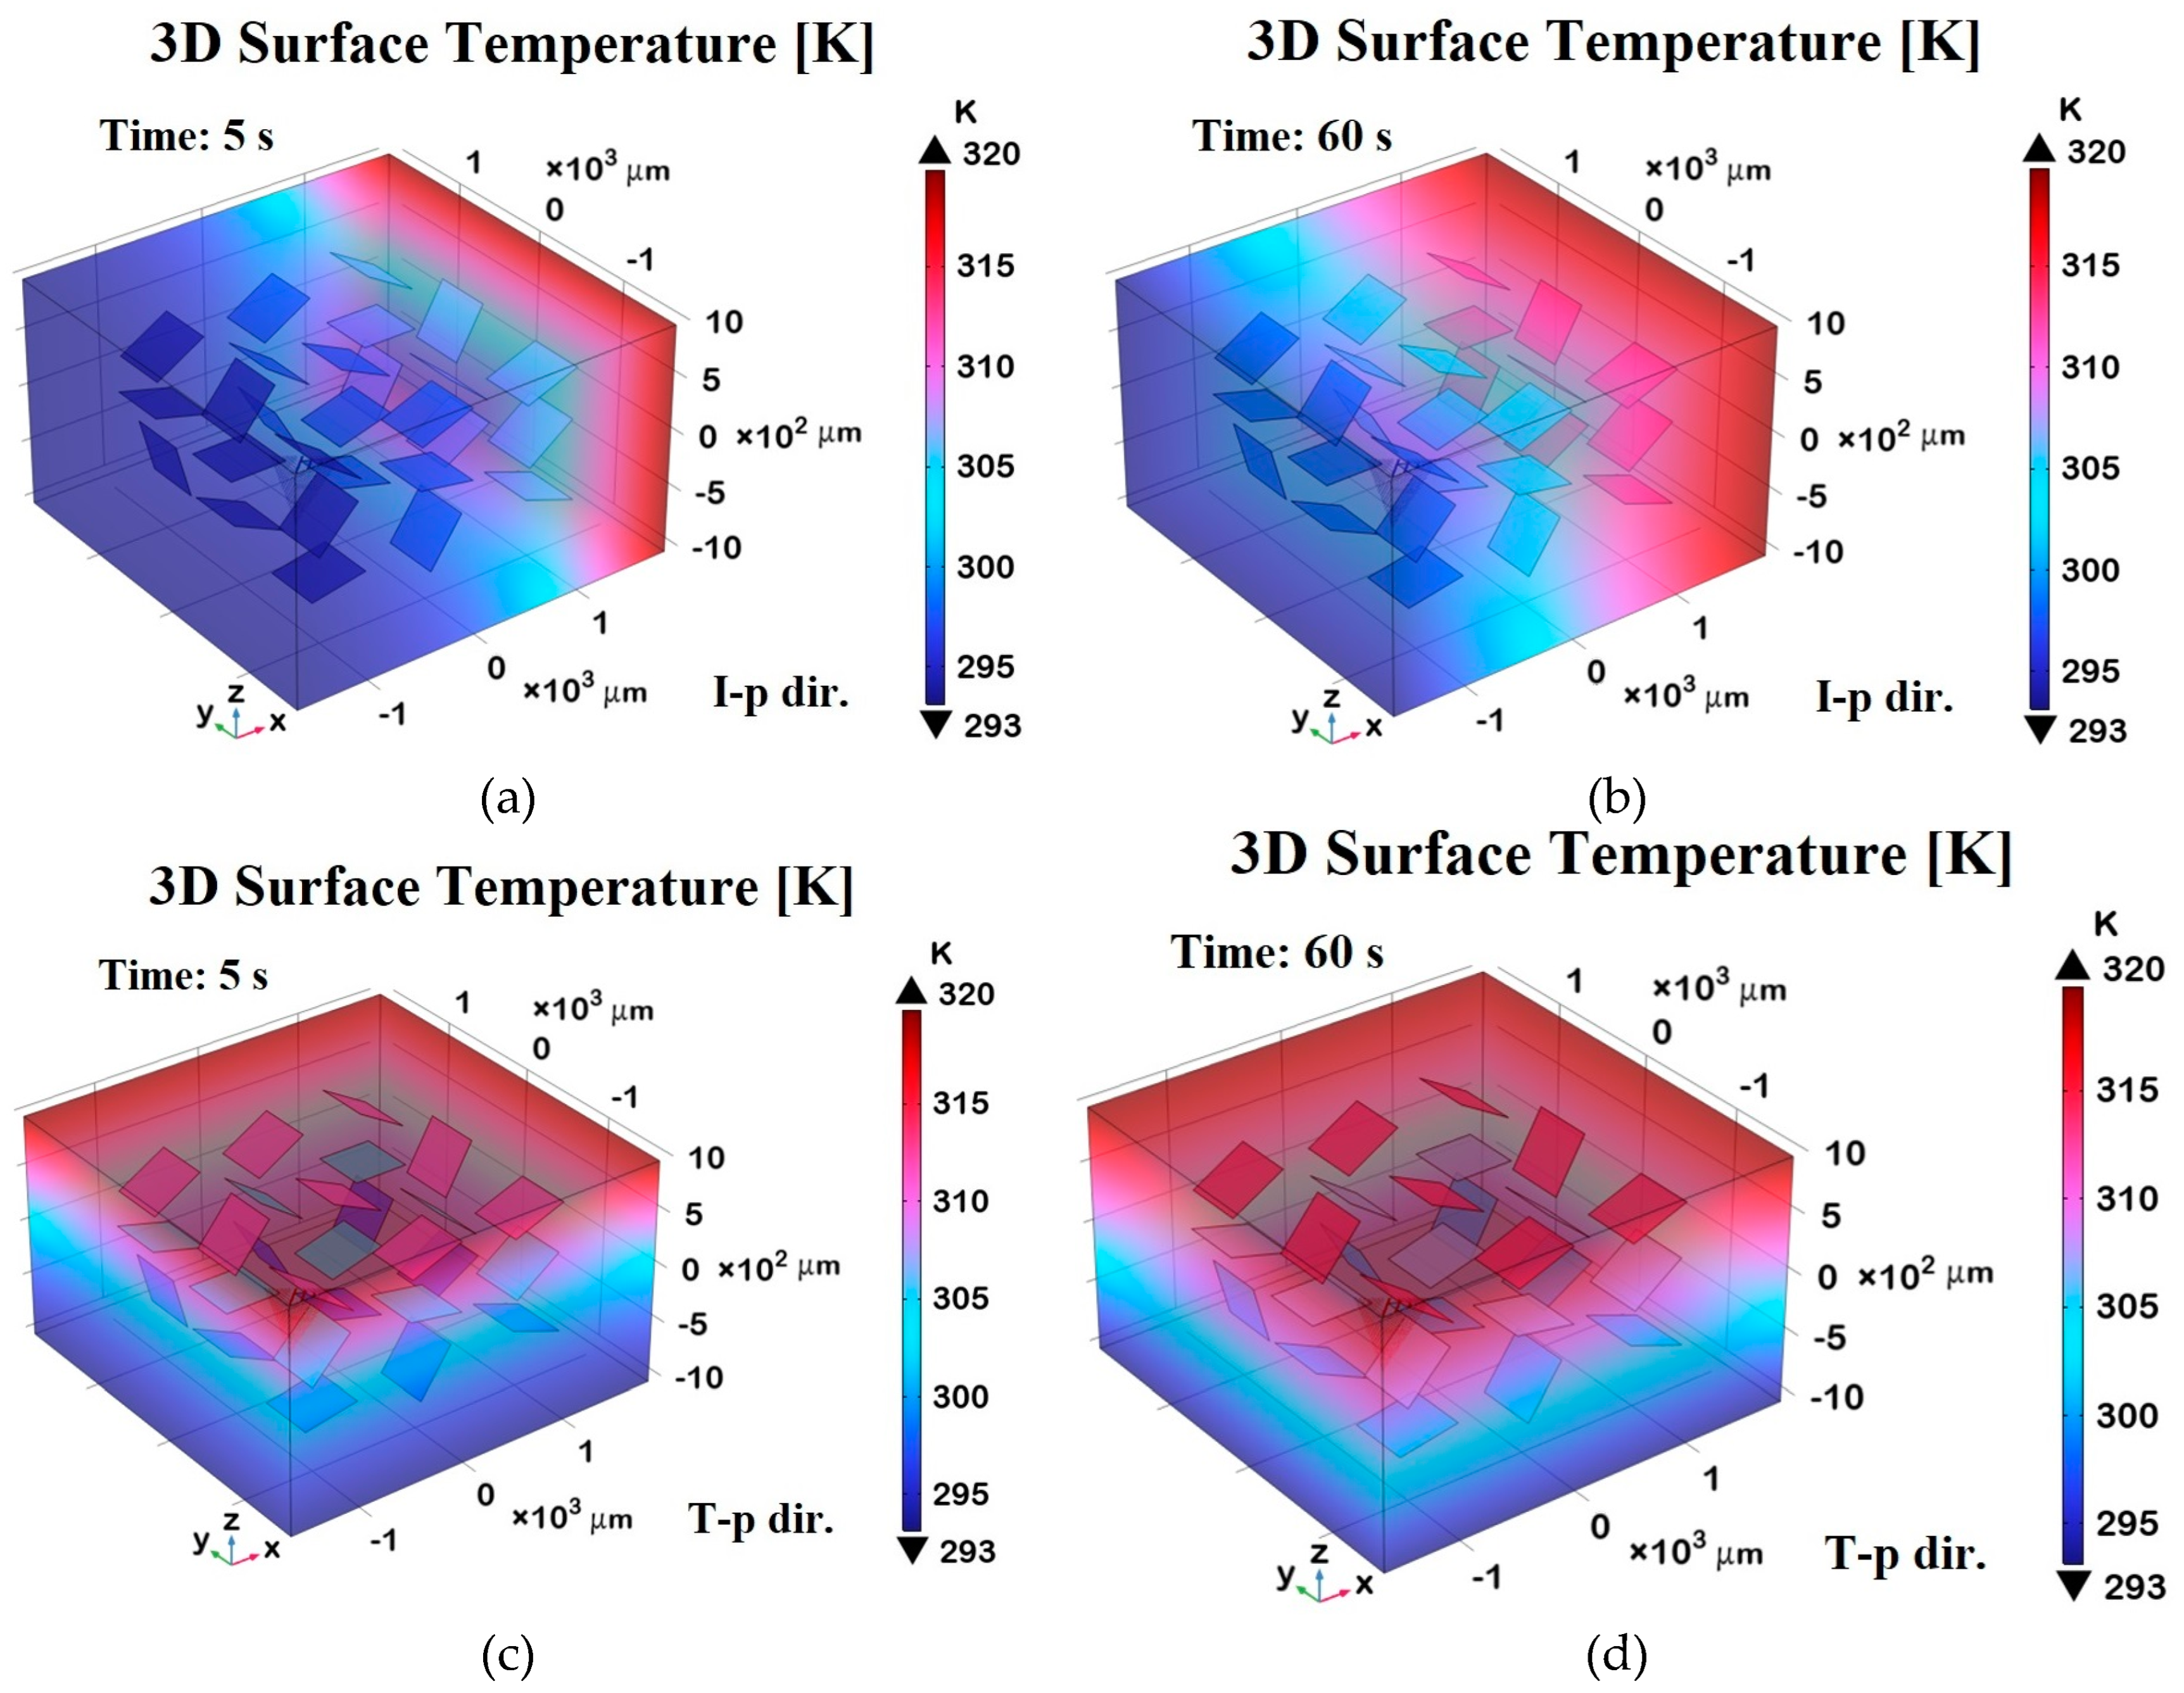
Figure 23.
Total heat flux x-component evaluated in in-plane direction (a) and z-component evaluated in through-plane direction (b) at different time instants.
Figure 23.
Total heat flux x-component evaluated in in-plane direction (a) and z-component evaluated in through-plane direction (b) at different time instants.
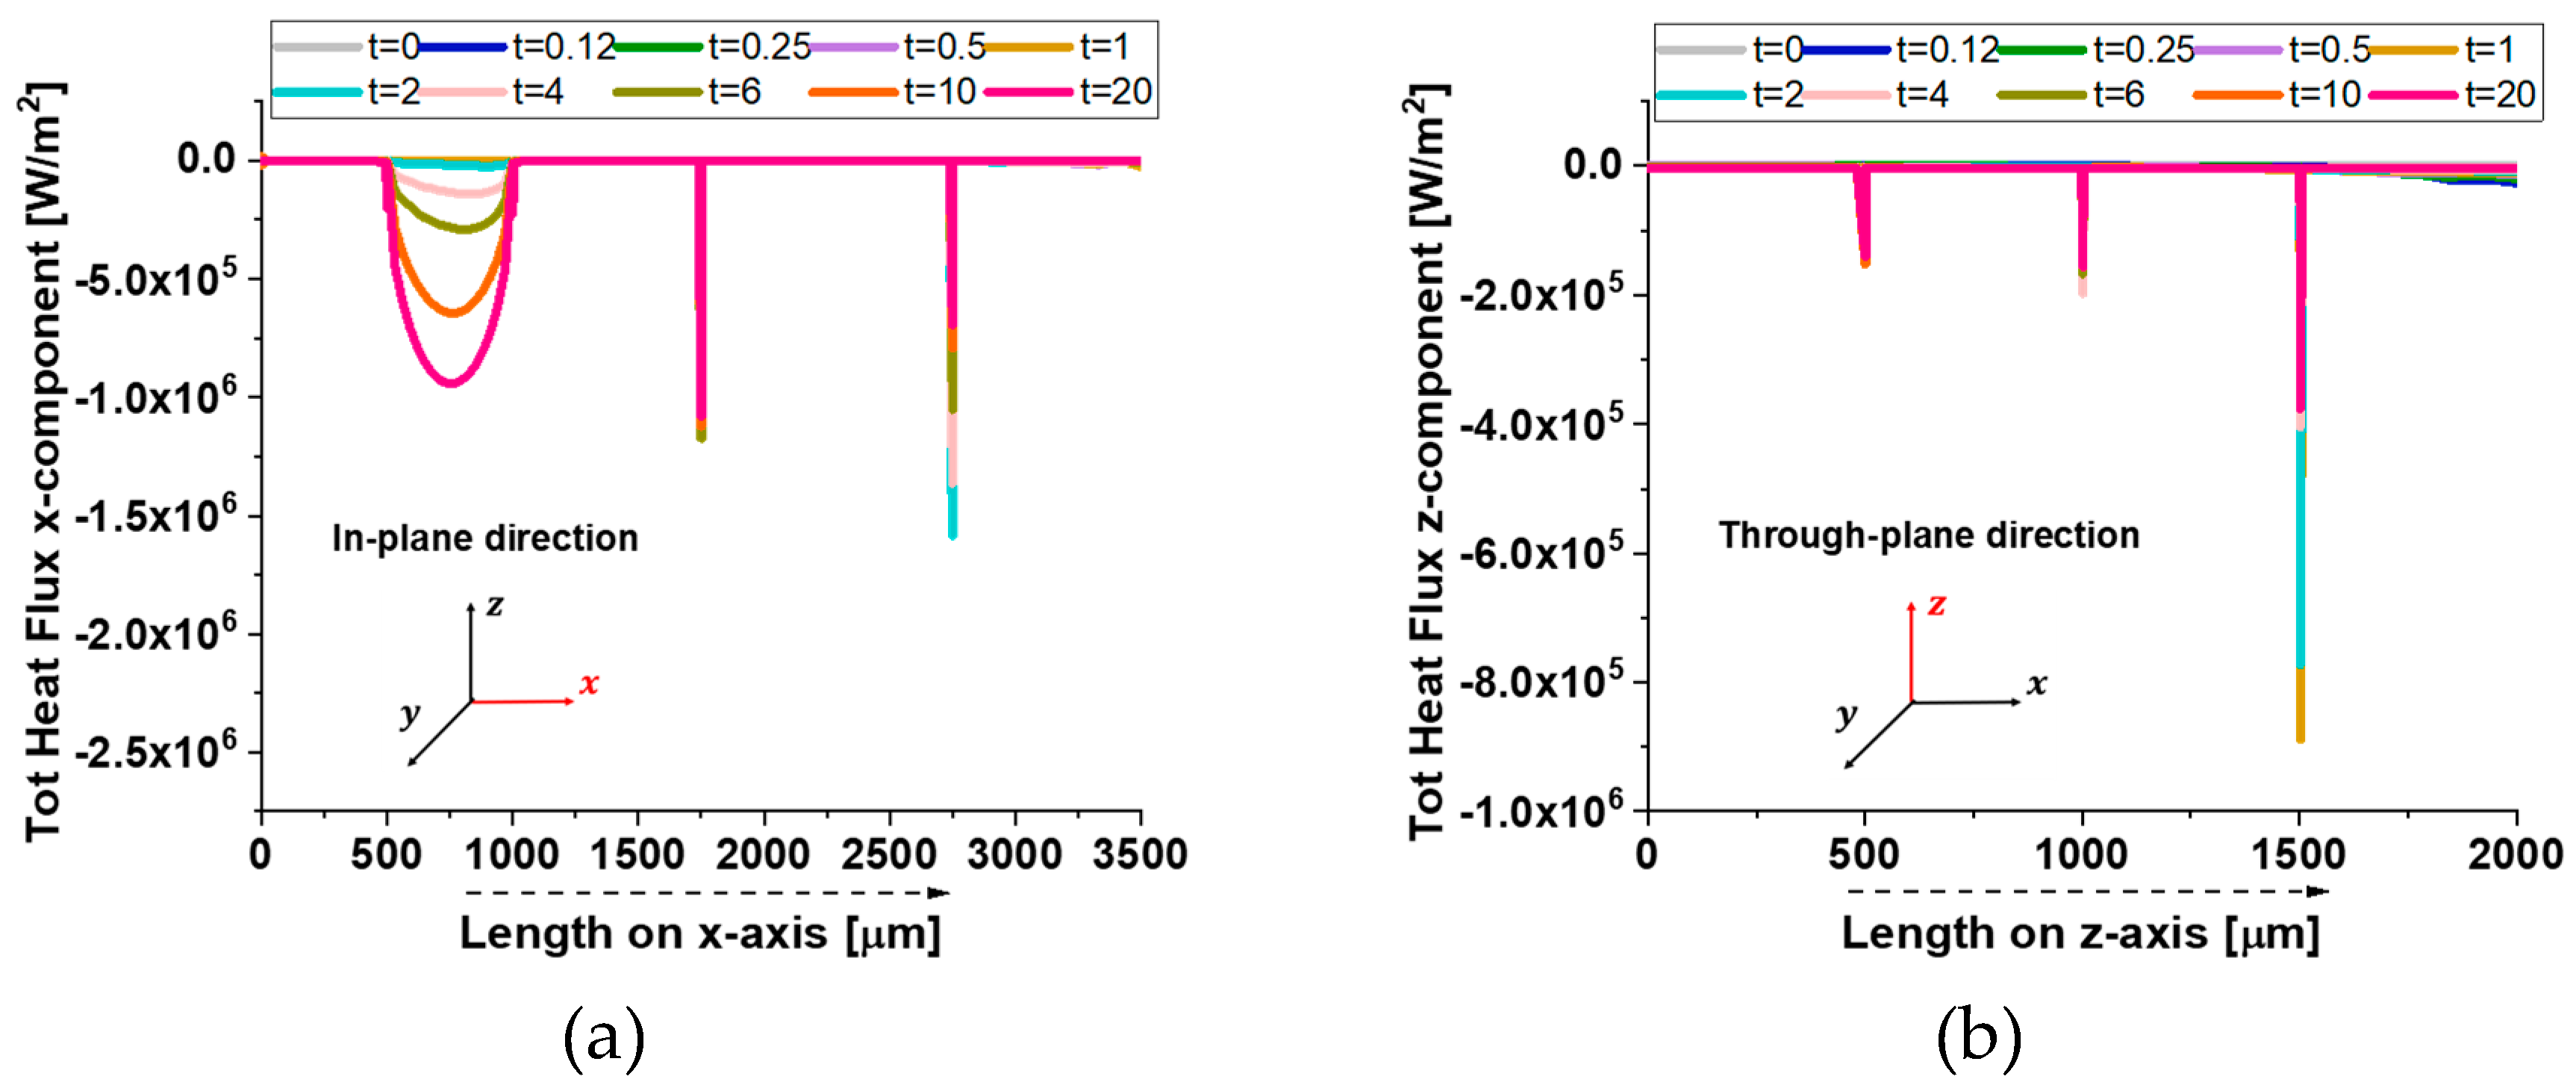
Figure 24.
3D surface distributions of the total heat flux in the case of randomly oriented GNPs within the resin. Panels (a) and (b) display the x-component along the in-plane direction (I-p dir.) at t = 1 s (transient phase) and t = 20 s (steady state), respectively. Panels (c) and (d) show the z-component of the total heat flux along the through-plane direction (T-p dir.) at the same time points.
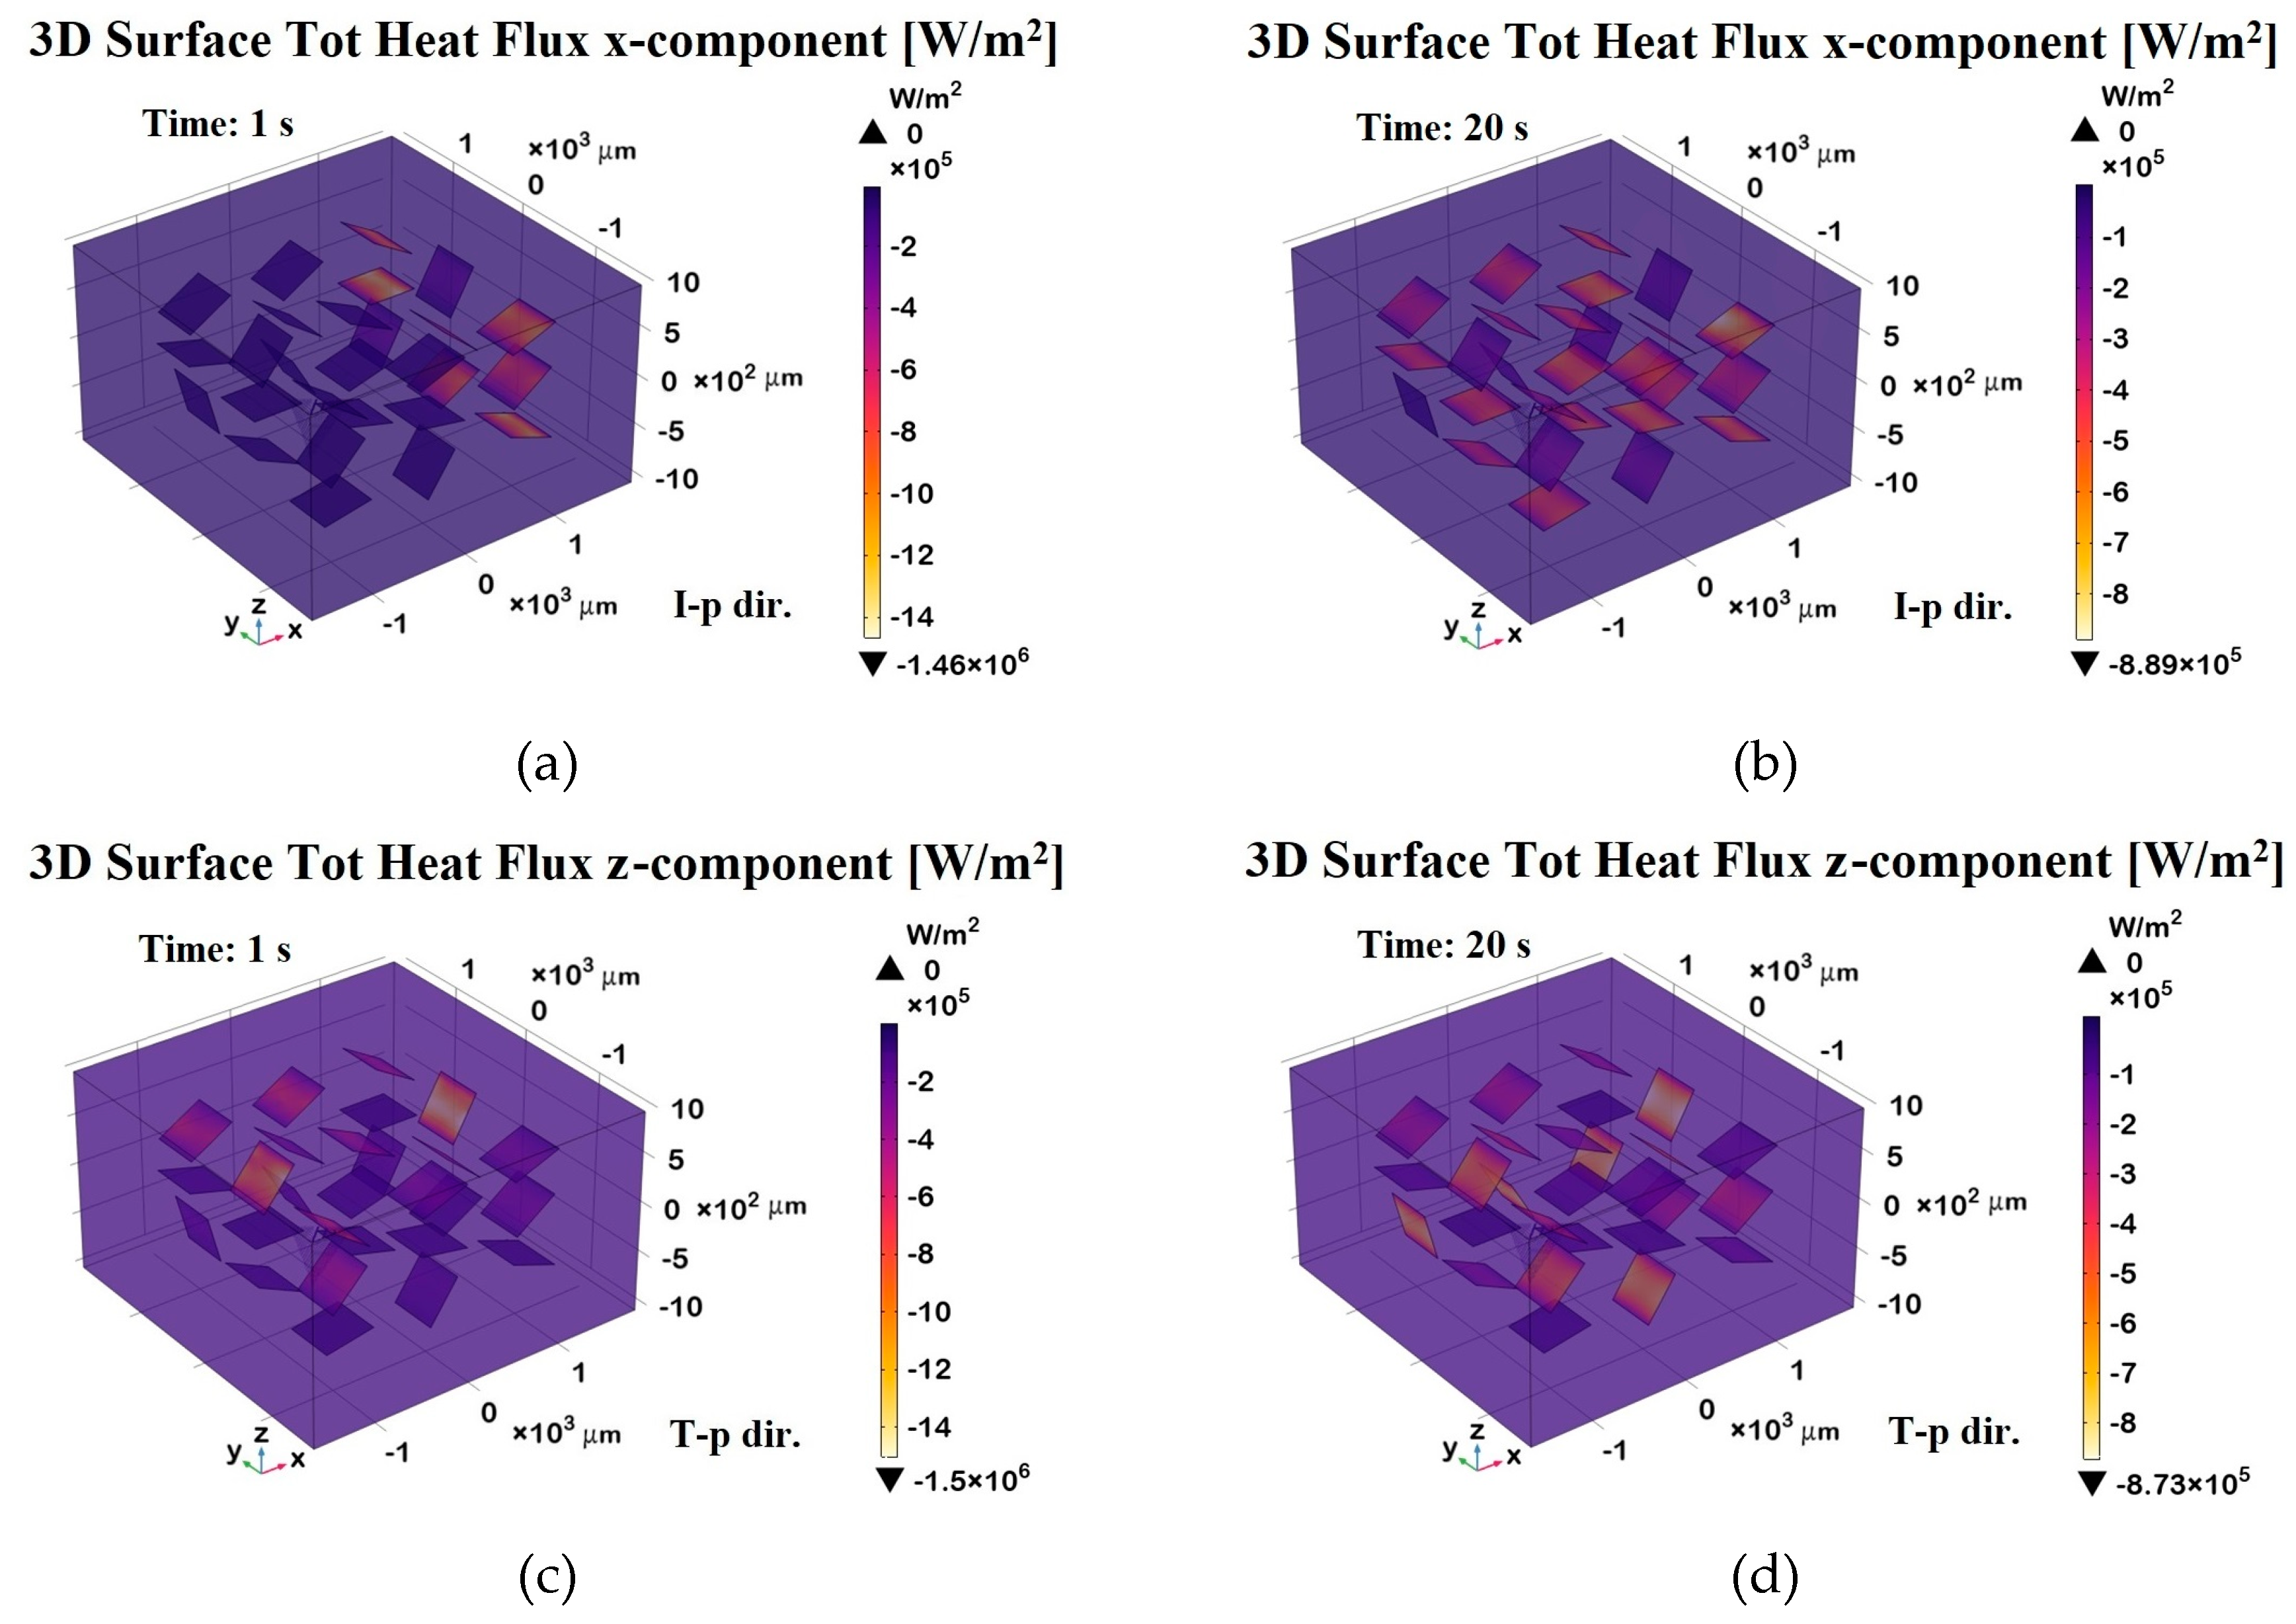
Figure 25.
Thermal resistance network representation for a graphene-based structure.
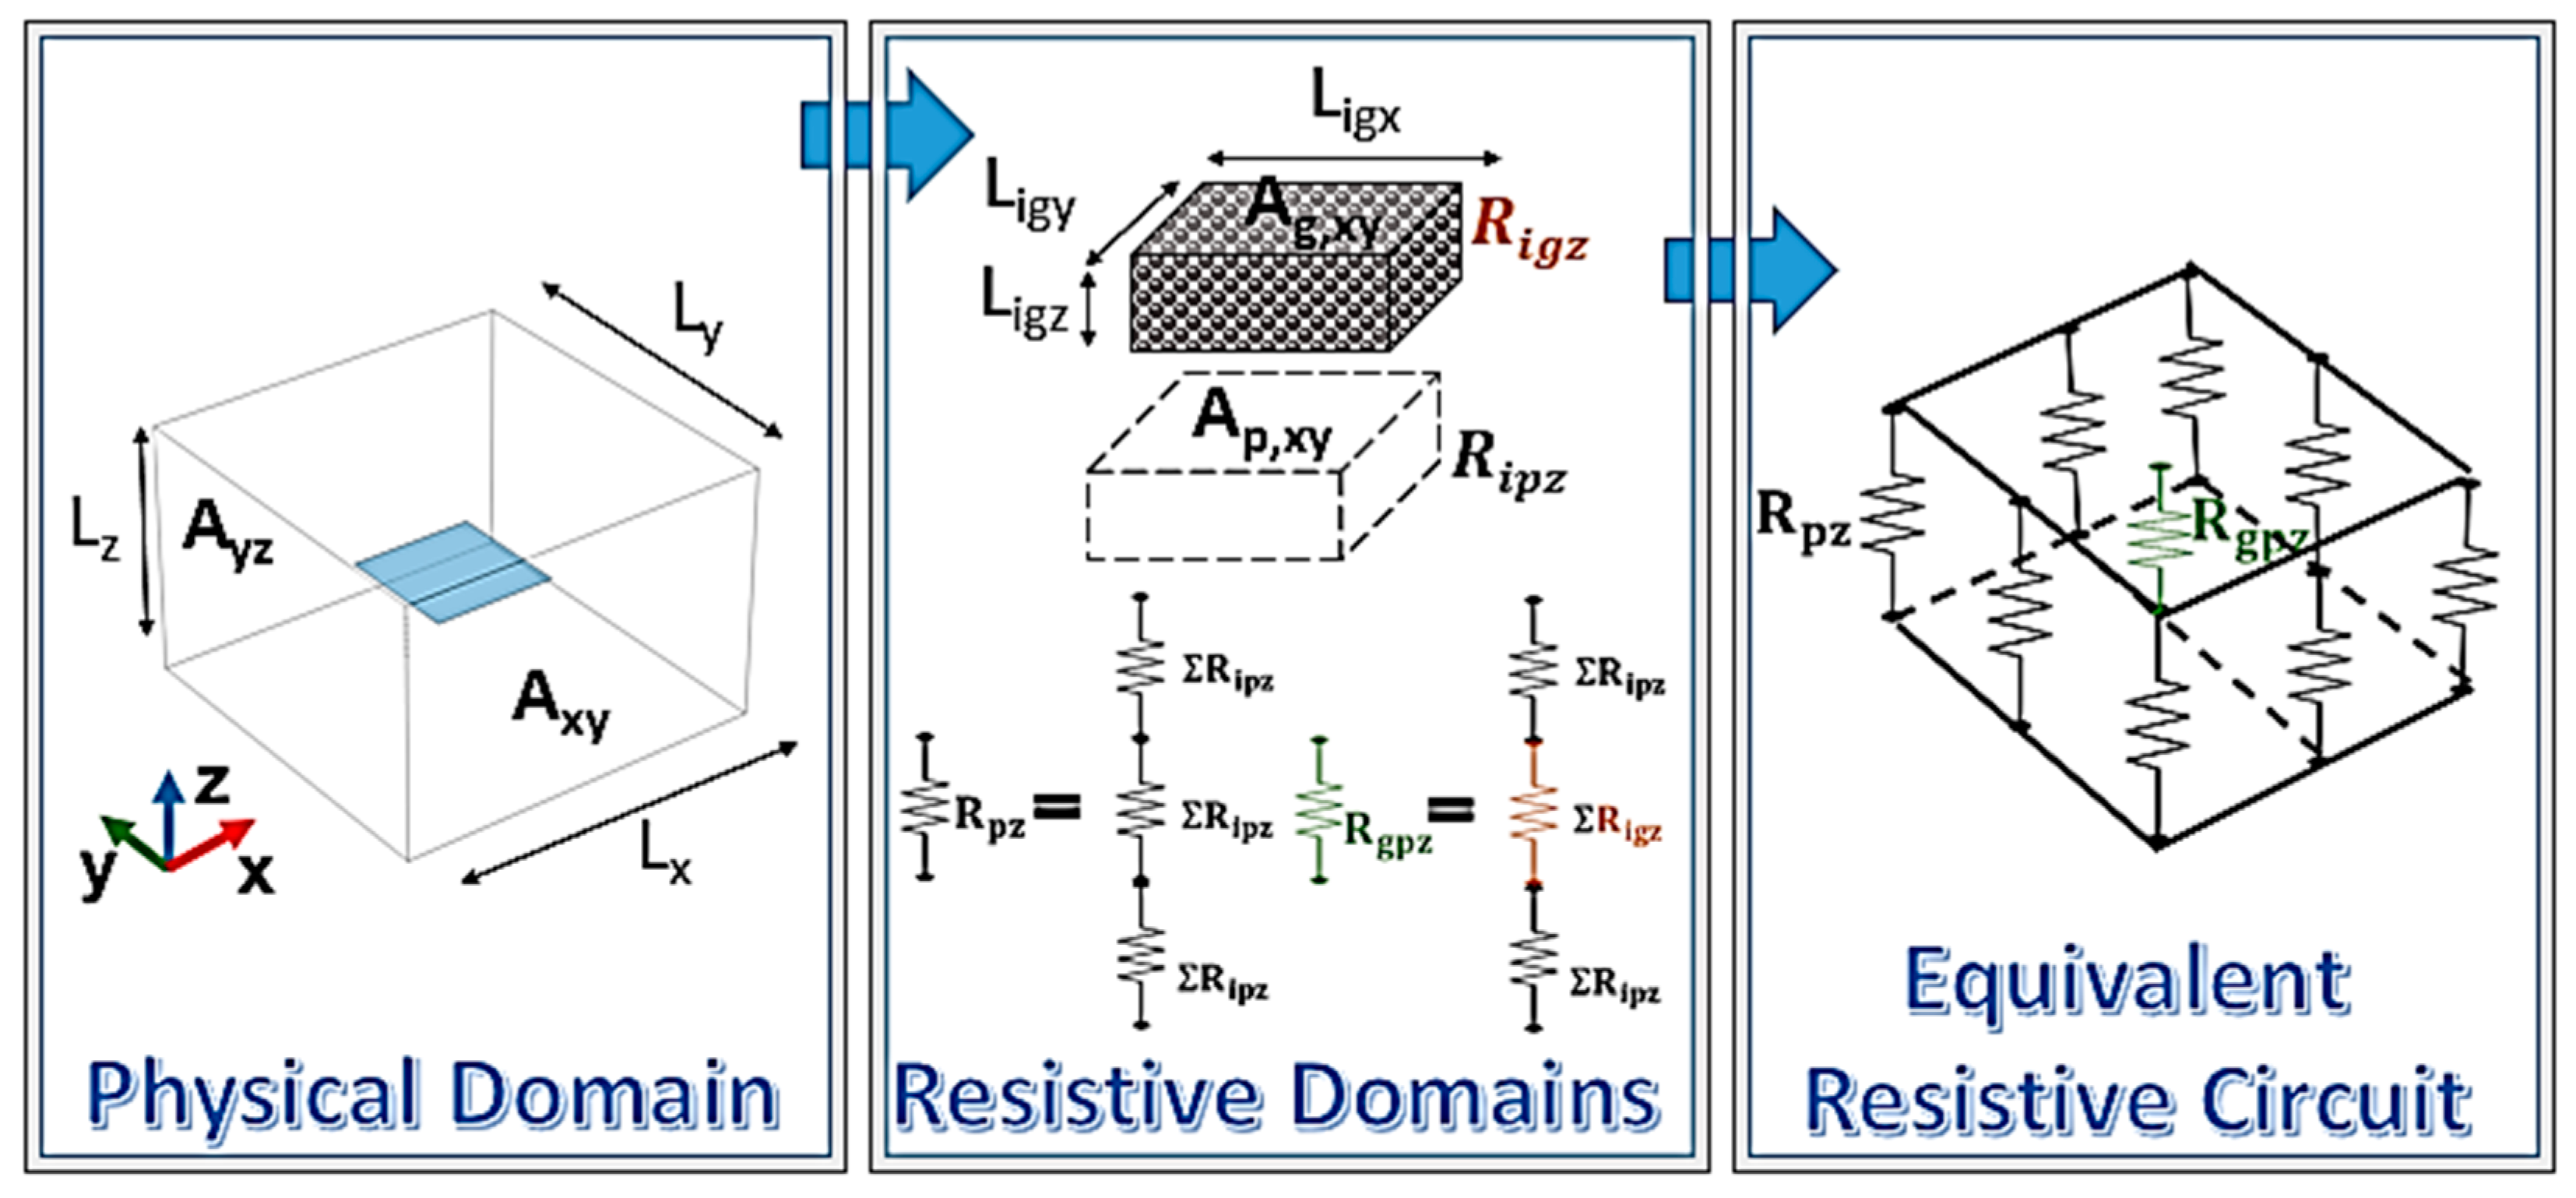

Table 1.
Initial and boundary conditions for solving the thermal energy equations 1 and 2.
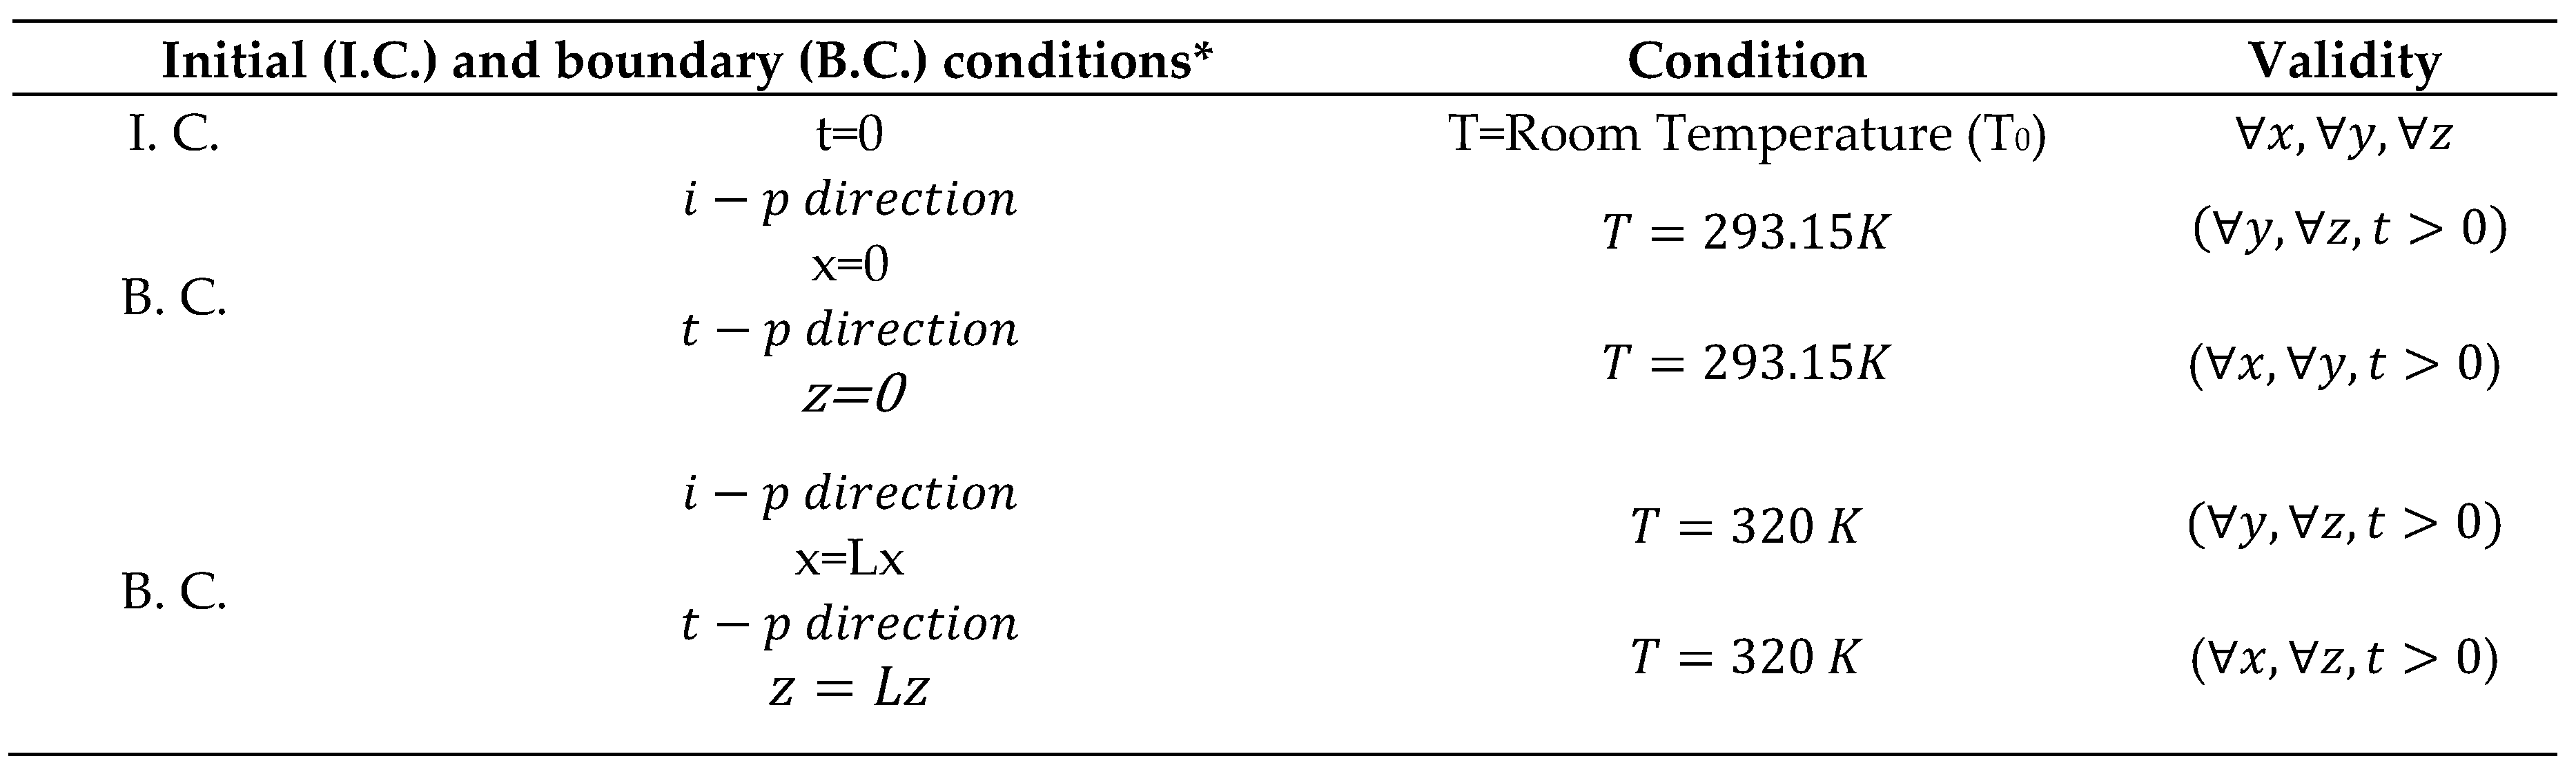 |
*All other external surfaces, if not subjected to imposed temperatures, have been considered adiabatic while the continuity condition was applied to all internal contact surfaces between different materials.
Table 2.
Thermal properties evaluated for the case study of a single graphene platelet parallel to the x-y plane.
Table 2.
Thermal properties evaluated for the case study of a single graphene platelet parallel to the x-y plane.
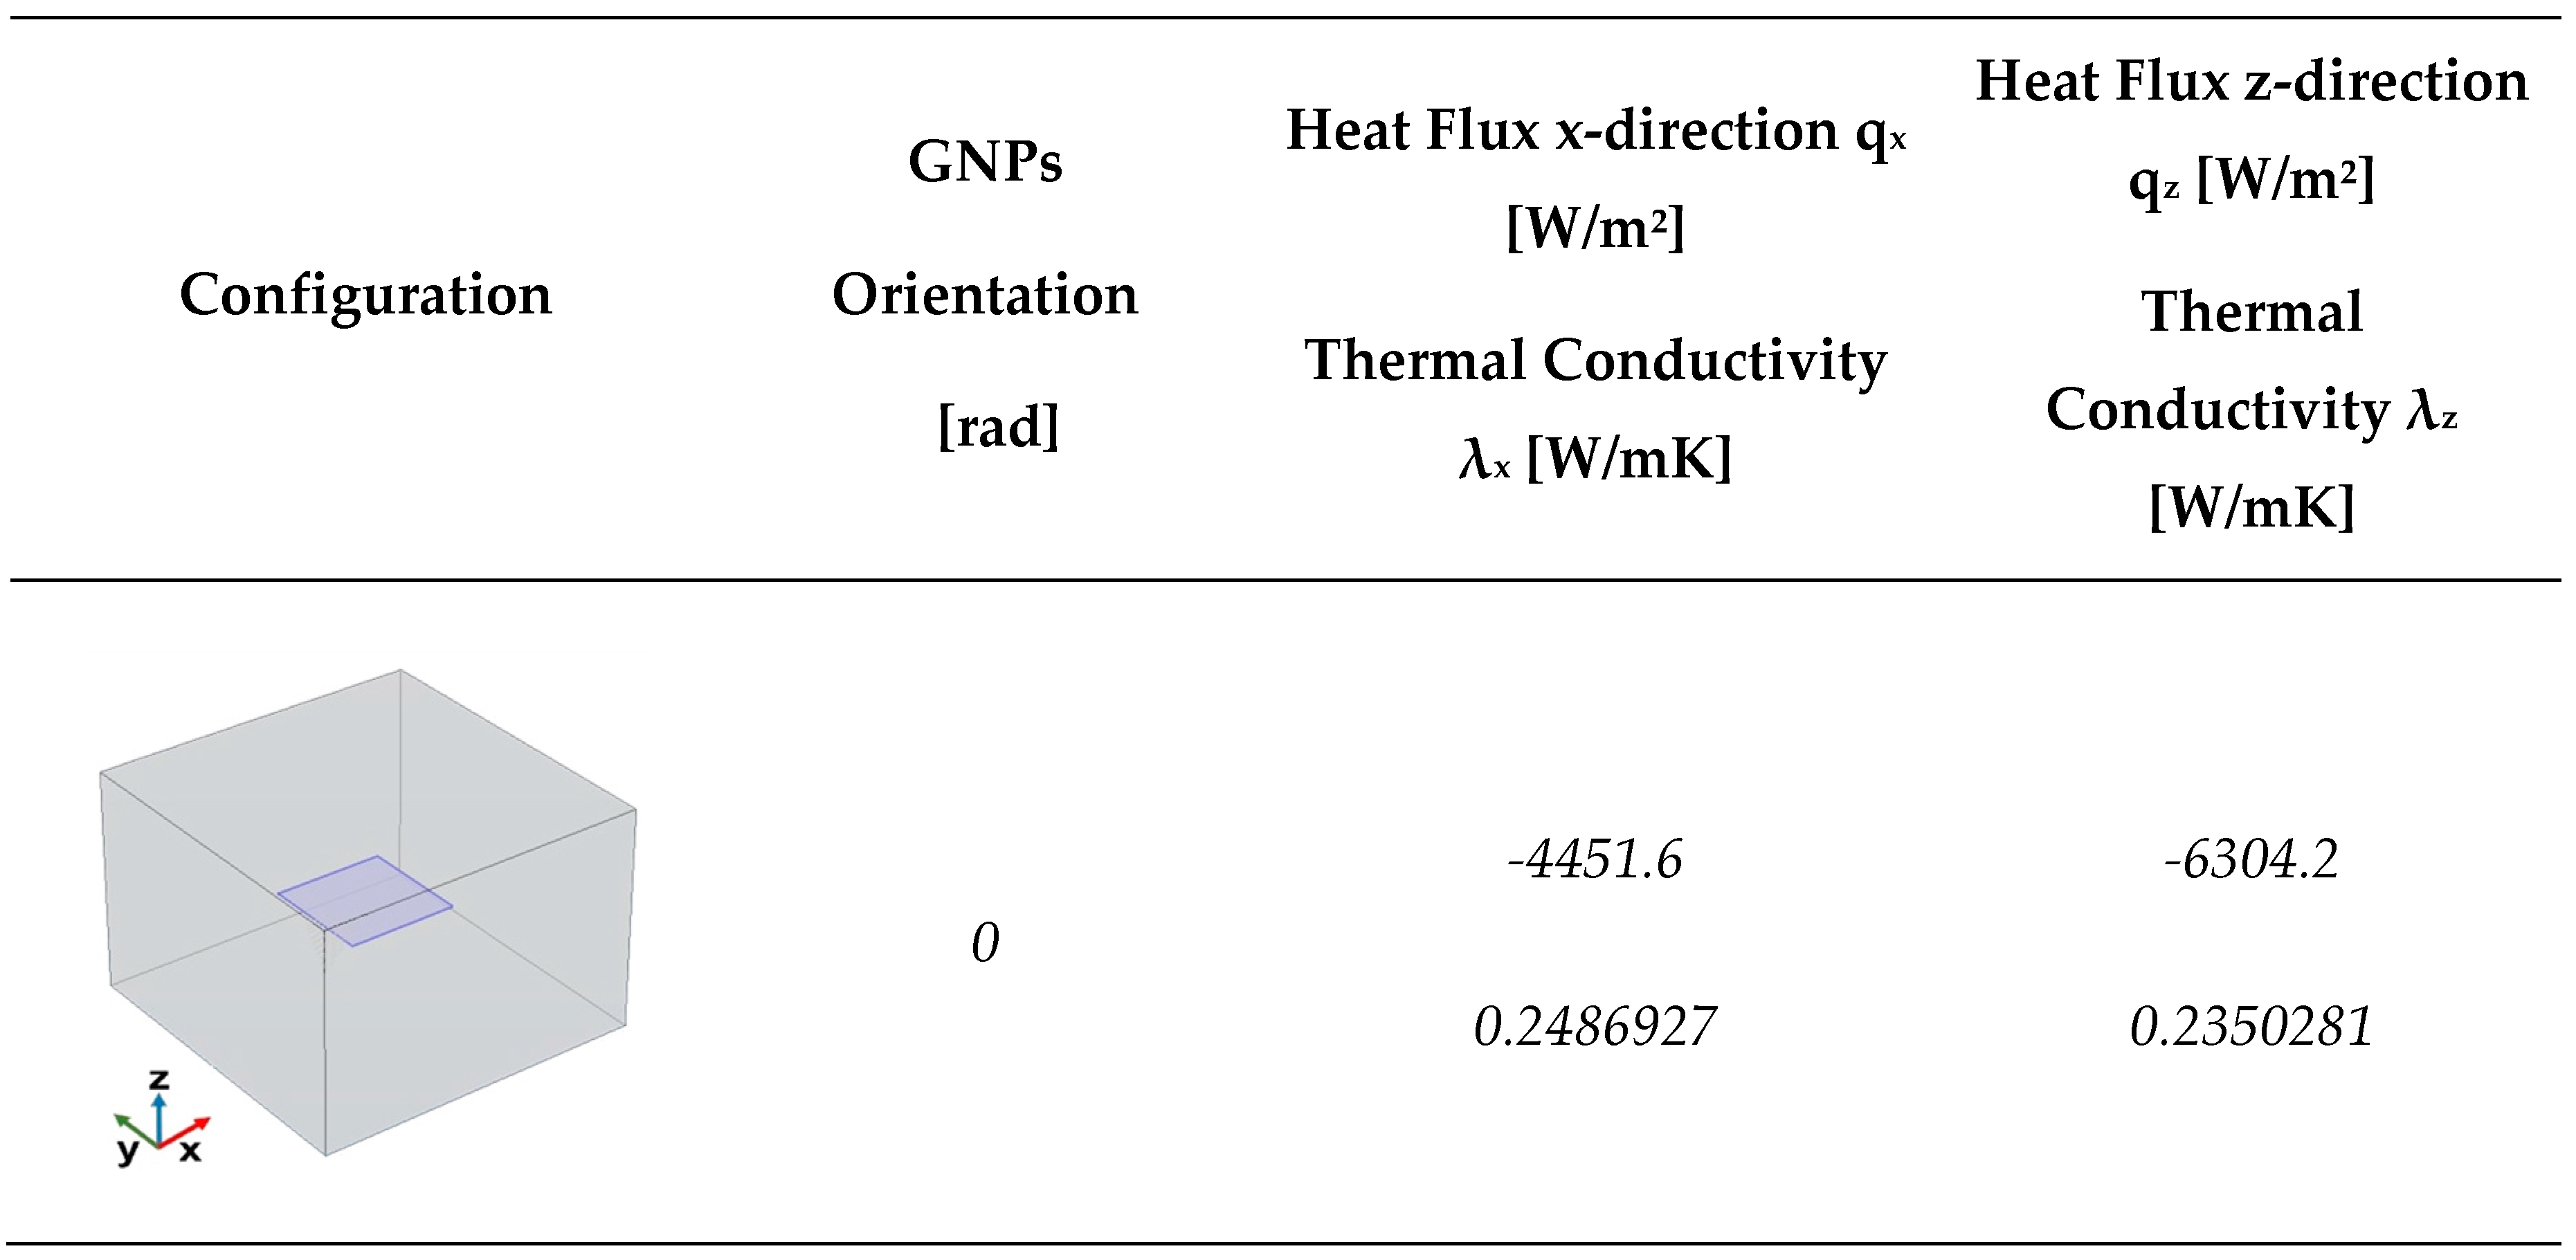 |
Table 3.
Thermal properties evaluated for the case study of multiple graphene platelets -27- arranged in different fixed orientations respect to the x-y plane.
Table 3.
Thermal properties evaluated for the case study of multiple graphene platelets -27- arranged in different fixed orientations respect to the x-y plane.
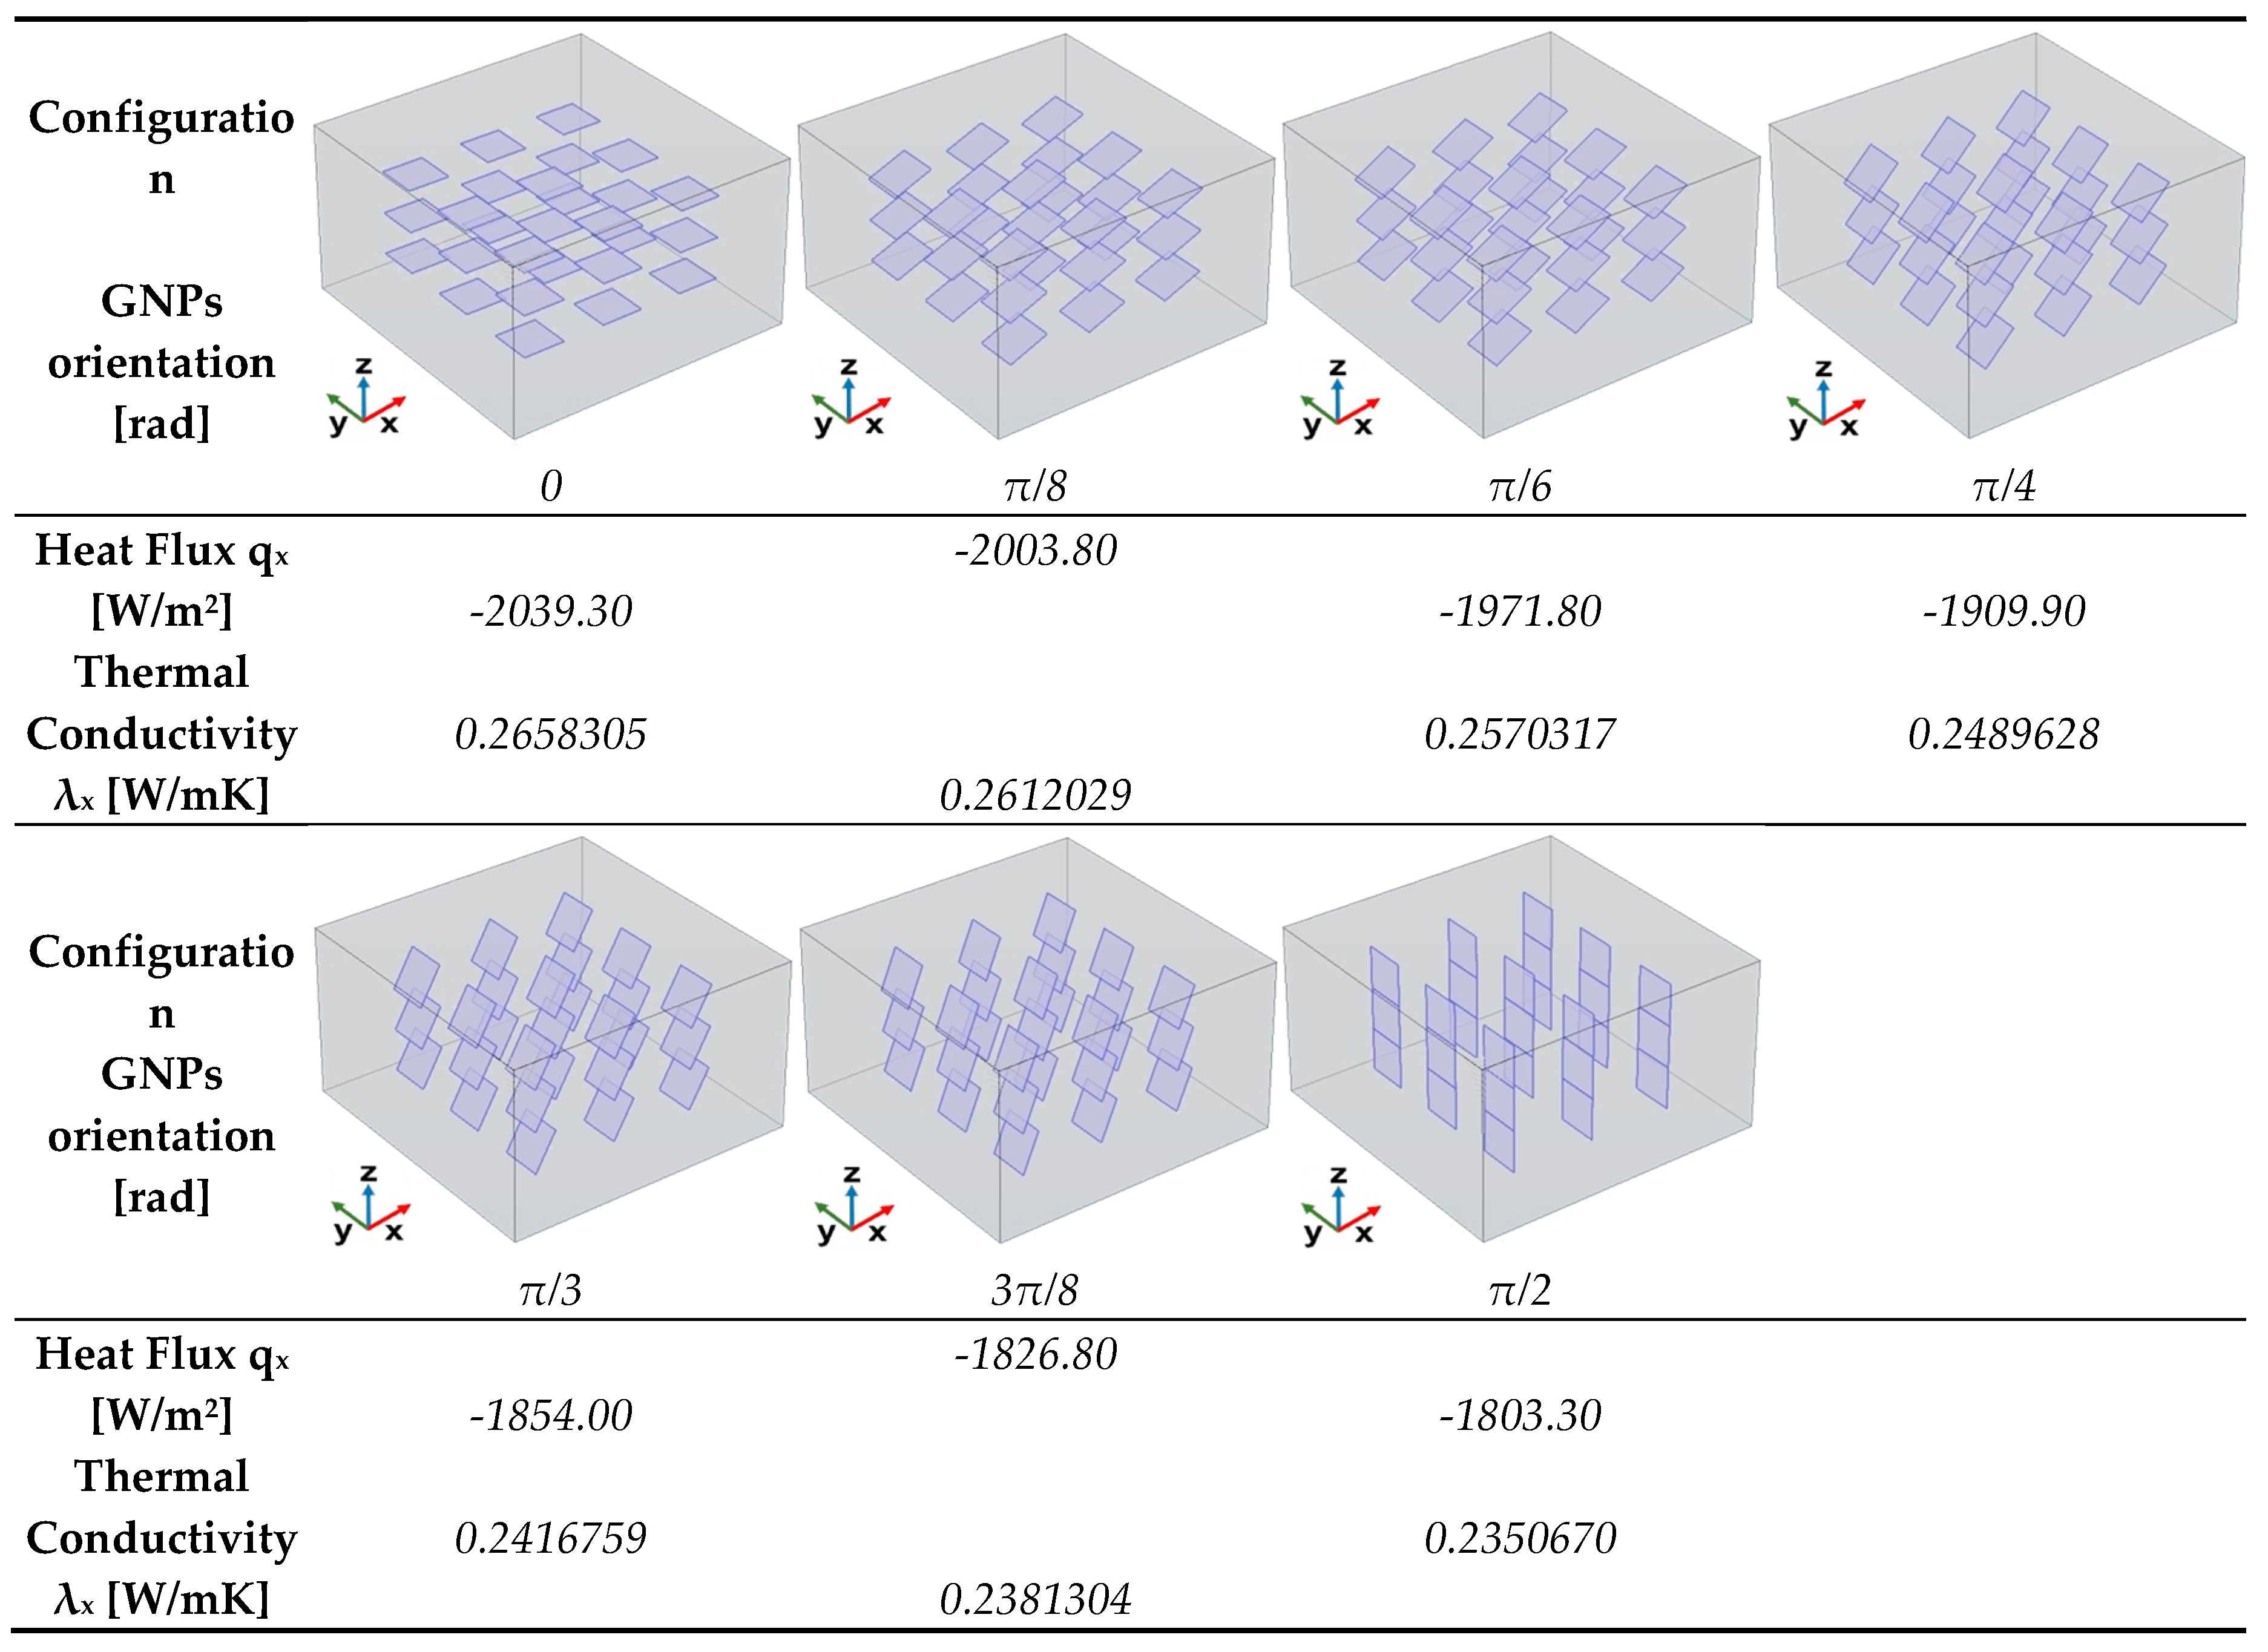 |
Table 4.
Thermal properties evaluated for the case study of a multiple graphene platelets -27- arranged in 3 different orientation respect to the x-y plane, i.e. aligned (0), random and transverse (π/2).
Table 4.
Thermal properties evaluated for the case study of a multiple graphene platelets -27- arranged in 3 different orientation respect to the x-y plane, i.e. aligned (0), random and transverse (π/2).
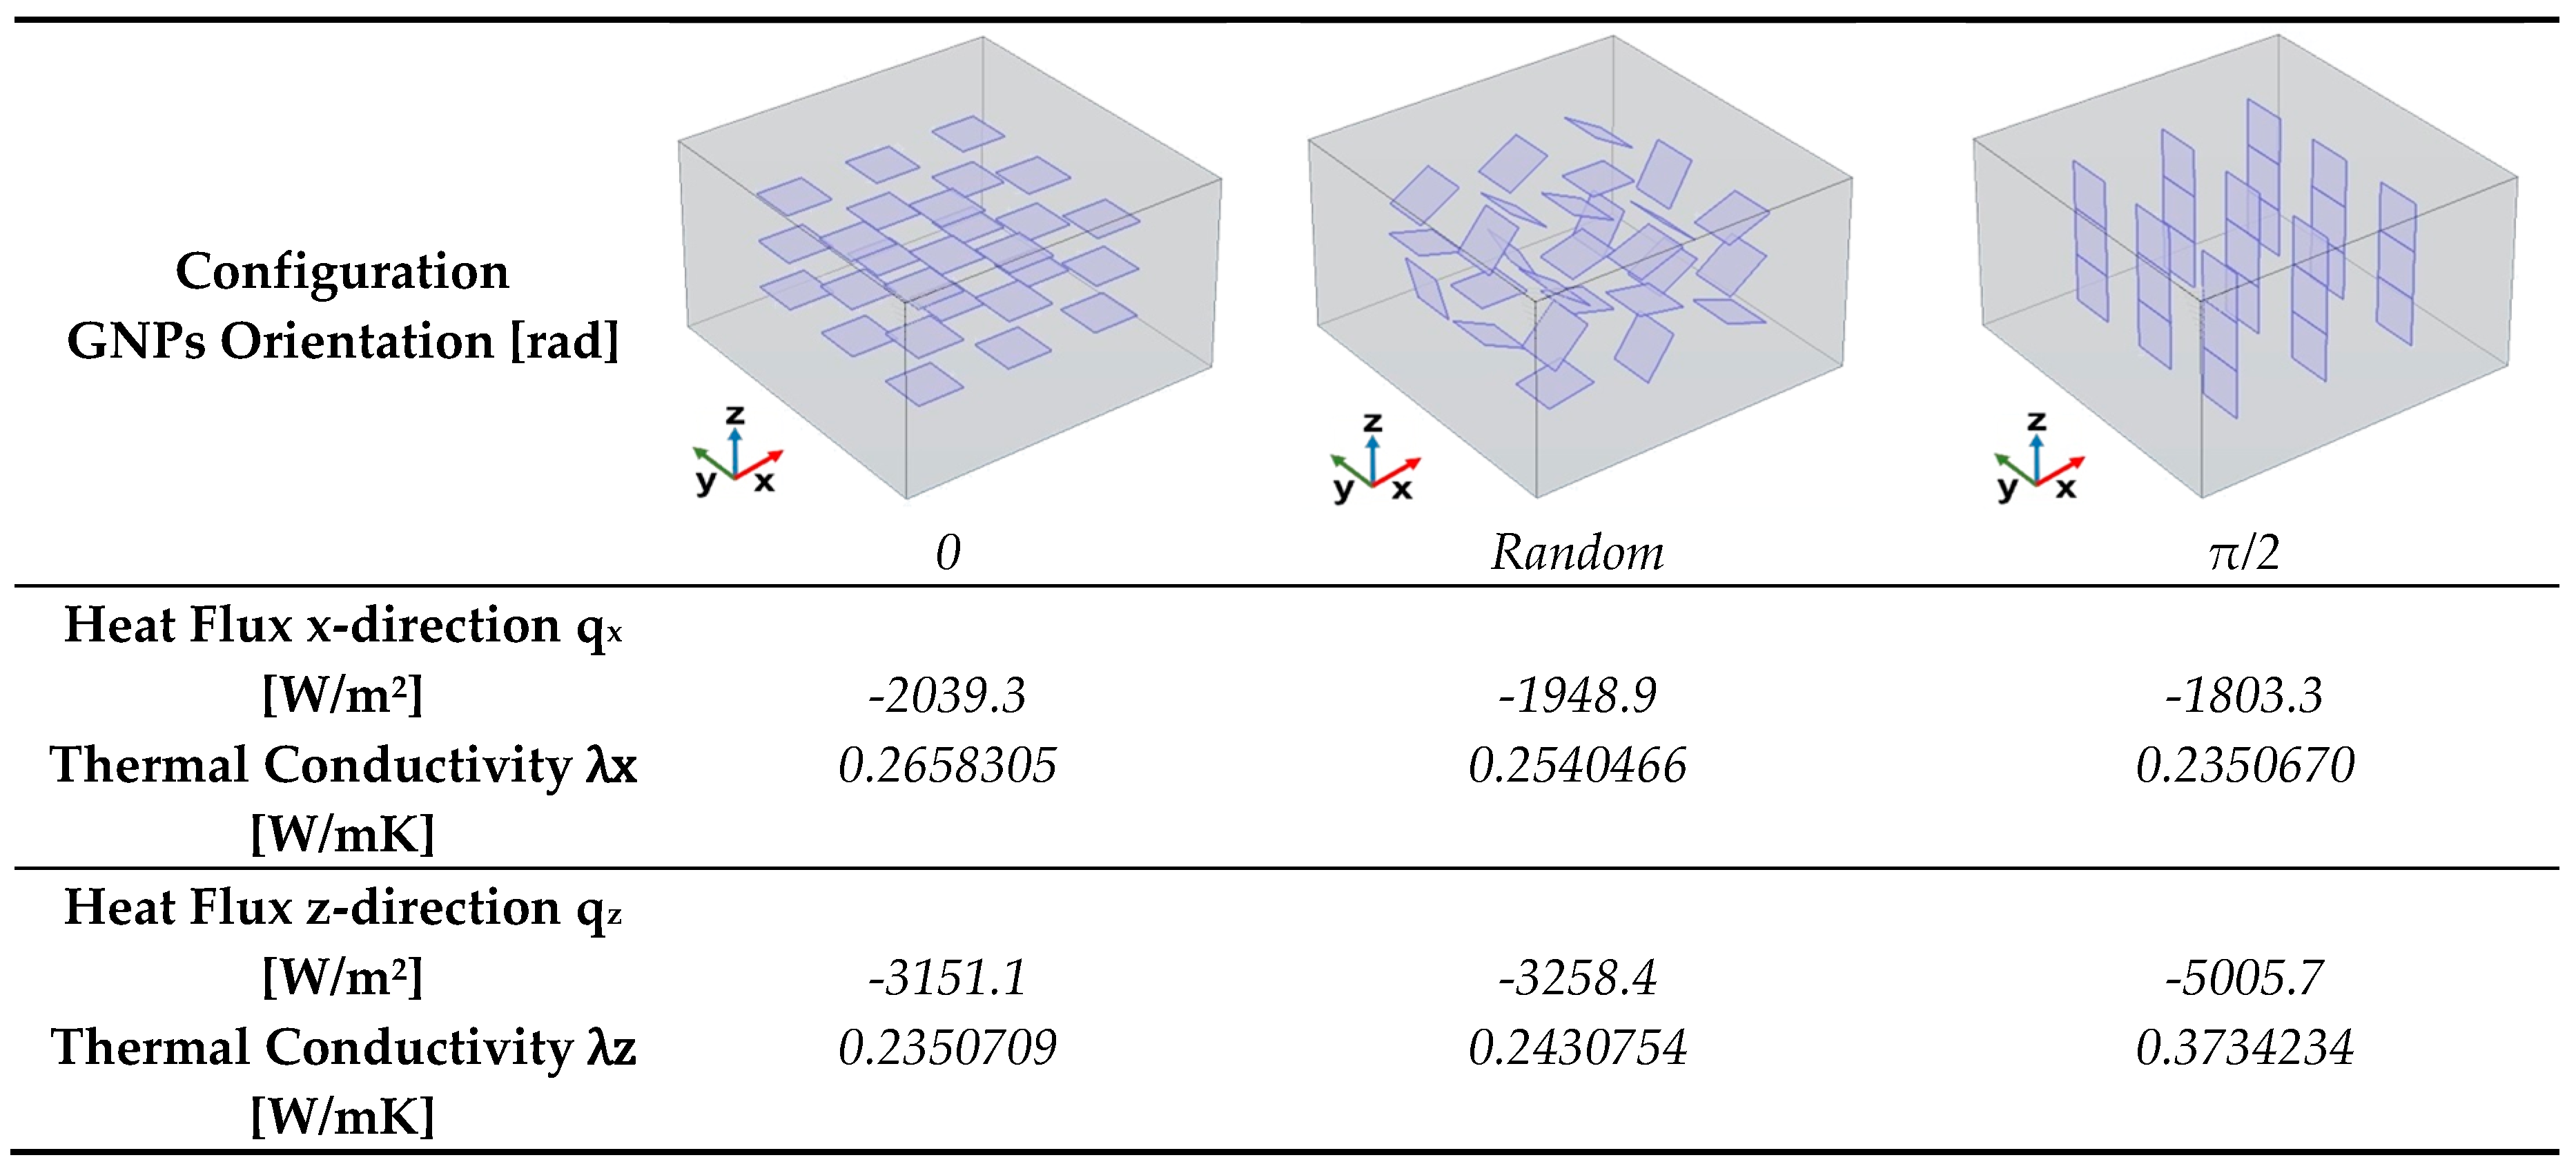 |
Table 5.
Thermal subdomain properties within the discretized physical domain.
| Configuration: | αj | βj | γj | δj |
| 1 GNP z-direction | 1 | 8 | 1 | 10+6 - 1 |
| 1 GNP x-direction | 1 | 3∙10+6 - 1 | 1 | 2 |
| 27 GNPs z-direction | 9 | 40 | 3 | 3∙10+6 - 3 |
| 27 GNPs x-direction | 9 | 14∙10+6 - 9 | 3 | 4 |
Table 6.
Calculated values for the thermal parameters based on the presented thermal circuit theory.
Table 6.
Calculated values for the thermal parameters based on the presented thermal circuit theory.
| Property/Sample | 1 GNP x-direction |
1 GNP z-direction |
27 GNPs x-direction |
27 GNPs z-direction |
|
Total Thermal Resistance Graphene / Polymer [W] |
Rgpx = 8.036⋅10+9 |
Rgpz = 1.702⋅10+4 |
Rgpx = 1.502⋅10+10 | Rgpz = 3.404⋅10+4 |
|
Total Thermal Resistance Polymer [K/W] |
Rpx = 1.205⋅10+10 | Rpz = 1.702⋅10+4 | Rpx = 2.629⋅10+10 | Rpz = 3.404⋅10+4 |
|
Total Thermal Conductance Structure [W/K] |
1/Rx = 2.489⋅10-4 | 1/Rz = 5.288⋅10-4 | 1/Rx = 5.326⋅10-4 | 1/Rz = 1.439⋅10-3 |
|
Heat Flow Q [W] |
Qx = -6.683⋅10-3 |
Qz = -1.420⋅10-2 |
Qx = -1.430⋅10-2 |
Qz = -3.865⋅10-2 |
|
Heat Flux q [W/m2] |
qx= -4455.31 | qz= -6309.75 | qx= -2042.90 | qz= -3154.87 |
Table 7.
Comparison between simulated and theoretical results, including relative error percentage (% Change), for the heat flux in trough-plane direction (qz) and in-plane direction (qx).
Table 7.
Comparison between simulated and theoretical results, including relative error percentage (% Change), for the heat flux in trough-plane direction (qz) and in-plane direction (qx).
| Configuration: |
qz Simul. [W/m2] |
qz Theoret. [W/m2] |
% Change |
qx Simul. [W/m2] |
qx Theoret. [W/m2] |
% Change |
| 1 GNP | -6304.02 | -6309.75 | 0.091 | -4451.60 | -4455.31 | 0.083 |
| 27 GNPs | -3151.10 | -3154.87 | 0.119 | -2039.30 | -2042.90 | 0.176 |
Disclaimer/Publisher’s Note: The statements, opinions and data contained in all publications are solely those of the individual author(s) and contributor(s) and not of MDPI and/or the editor(s). MDPI and/or the editor(s) disclaim responsibility for any injury to people or property resulting from any ideas, methods, instructions or products referred to in the content. |
© 2025 by the authors. Licensee MDPI, Basel, Switzerland. This article is an open access article distributed under the terms and conditions of the Creative Commons Attribution (CC BY) license (http://creativecommons.org/licenses/by/4.0/).
Copyright: This open access article is published under a Creative Commons CC BY 4.0 license, which permit the free download, distribution, and reuse, provided that the author and preprint are cited in any reuse.


