
Submitted:
18 September 2025
Posted:
21 September 2025
You are already at the latest version
Abstract
The leather industry is a key driver of economic growth, especially in developing countries where it supports employment and generates substantial export revenues. However, the tanning process produces effluents laden with hazardous pollutants, including chromium species (Cr(VI) and Cr(III)), sulfates, chlorides, and other inorganic compounds that degrade water quality and pose serious health risks. This study investigates the environmental impact of tannery effluents in Kenya by analyzing key physicochemical parameters—such as pH, BOD, COD, TSS, TDS, and chromium concentrations—and comparing them against the standards set by the National Environment Management Authority (NEMA).Findings reveal elevated levels of pollutants in several samples, indicating potential non-compliance with regulatory thresholds. Notably, certain toxic elements like arsenic and lead are not currently included in the Fourth Schedule of NEMA’s effluent standards for tanneries, suggesting a need for policy revision. The study emphasizes the importance of strengthening environmental regulations and promoting sustainable waste management practices to ensure that Kenya’s leather industry can grow responsibly while safeguarding public health and ecological integrity.
Keywords:
tannery effluents
; chromium pollution
; environmental regulation
; leather industry
; sustainable waste management
Introduction
The leather industry has long been a cornerstone of global economic development, contributing billions annually through exports, job creation, and value addition. Countries like Italy, Brazil, India, and China dominate the market, supplying high-quality leather to industries such as fashion, automotive, and furniture. Despite its economic significance, the tanning process within this sector poses serious environmental and health risks. Effluents from tanneries often contain hazardous pollutants—including chromium species (Cr(VI) and Cr(III)), chlorides, sulfates, and sulfides—that degrade water quality by altering parameters such as pH, BOD, COD, TSS, and TDS. Of particular concern is hexavalent chromium (Cr(VI), a known carcinogen linked to severe health effects in humans and toxicity in ecosystems.(Were, Moturi et al. 2014)
In Africa, and especially Kenya, the leather industry remains underutilized despite growing global demand for finished leather goods. Most African nations primarily export semi-processed wet blue leather, which accounts for nearly 89% of their output, limiting their participation in high-value markets. This imbalance not only restricts economic gains but also places the environmental burden of leather processing on local communities, where regulatory oversight and waste treatment infrastructure may be insufficient. The tanning process, while economically beneficial, generates substantial waste that threatens both ecological integrity and public health if not properly managed.(Oruko, Edokpayi et al. 2021, Kipkemoi, Sitati et al. 2025)
Given these challenges, this study aims to evaluate the levels of chromium and other pollutants in tannery effluent in Kenya, benchmarking them against standards set by the National Environment Management Authority (NEMA). By identifying gaps in compliance and environmental safety, the research seeks to inform policy recommendations and promote sustainable practices within the leather industry—ensuring that economic growth does not come at the expense of environmental and human well-being.
Methodology
This study employed a field-based and laboratory analytical approach to assess the quality of tannery effluent in Kenya. Effluent samples were collected from selected tannery discharge points using standard sampling procedures. The samples were then analyzed for key physicochemical parameters including pH, BOD, COD, TSS, TDS, and concentrations of chromium species (Cr(VI) and Cr(III), among others). Analytical techniques such as spectrophotometry and titration were used to quantify pollutant levels.
The results were compared against the National Environment Management Authority (NEMA) standards outlined in the Fourth Schedule of the Environmental Management and Coordination (Water Quality) Regulations. Parameters not currently included in the schedule, such as arsenic and lead, were noted for potential inclusion in future regulatory revisions based on observed concentrations and environmental relevance.
Data interpretation involved statistical analysis to determine compliance levels and identify significant deviations from regulatory thresholds. The findings aim to inform policy recommendations and promote sustainable waste management practices within the leather industry.
Tannery Effluent Characteristics and Compliance with NEMA Standards
The objective of this study was to evaluate the levels of chromium, lead, and arsenic in tannery effluent against the set standards for effluent discharge into the environment or public sewer as outlined in the Environmental Management and Co-ordination (Water Quality) Regulations, 2006. Effluent discharge analysis reports from six facilities were obtained and analyzed. It is important to note that while the study targeted ten active tanneries, effluent data was only available for six of these facilities. The concentrations of various parameters in the effluent from these facilities were compared against the maximum permissible levels stipulated by NEMA standards for effluent discharge into the environment

Table 1.
Effluent Quality Parameters from Sampled Tanneries vs. NEMA Discharge Standards.
| Parameter | Max Perm Levels | Facility | ||||||
| A | B | C | D | E | F | Mean | ||
| SS (mg/L) | 250.00 | 9.20 | 16 | 15 | 15 | 13.80 | ||
| TDS (mg/L) | 2000.00 | 1778 | 346 | 105.35 | 743.12 | |||
| pH | 9.00 | 8.04 | 7.56 | 8.08 | 6.9 | 7.8 | 7.8 | 7.70 |
| Oil & Grease (mg/L) | 10.00 | Nil | 189 | 144 | 144 | 159.00 | ||
| BOD (mg/L) | 500.00 | 26.30 | 28 | 190 | 30 | 30 | 60.86 | |
| COD (mg/L) | 1000.00 | 30 | 250 | 250 | 176.67 | |||
| Arsenic (mg/L) | 0.02 | n/a | n/a | n/a | n/a | n/a | n/a | |
| Lead (mg/L) | 1.00 | n/a | n/a | n/a | n/a | n/a | n/a | |
| Chromium (Total) (mg/L) | 2.00 | 1.91 | 0.01 | 1.17 | nd | 1.6 | 1.6 | 1.27 |
| Nitrates (mg/L) | 20.00 | 5.1 | 5.10 | |||||
| Phosphates (mg/L) | 30.00 | 0.1 | 0.10 | |||||
| Sulphide (mg/L) | 2.00 | 28 | 9.75 | nd | nd | 18.88 | ||
| Colour (HU) | 40.00 | 12 | 12.00 | |||||
Figure 1.
Compliance Status of each Tannery’s Effluent against NEMA Standards.
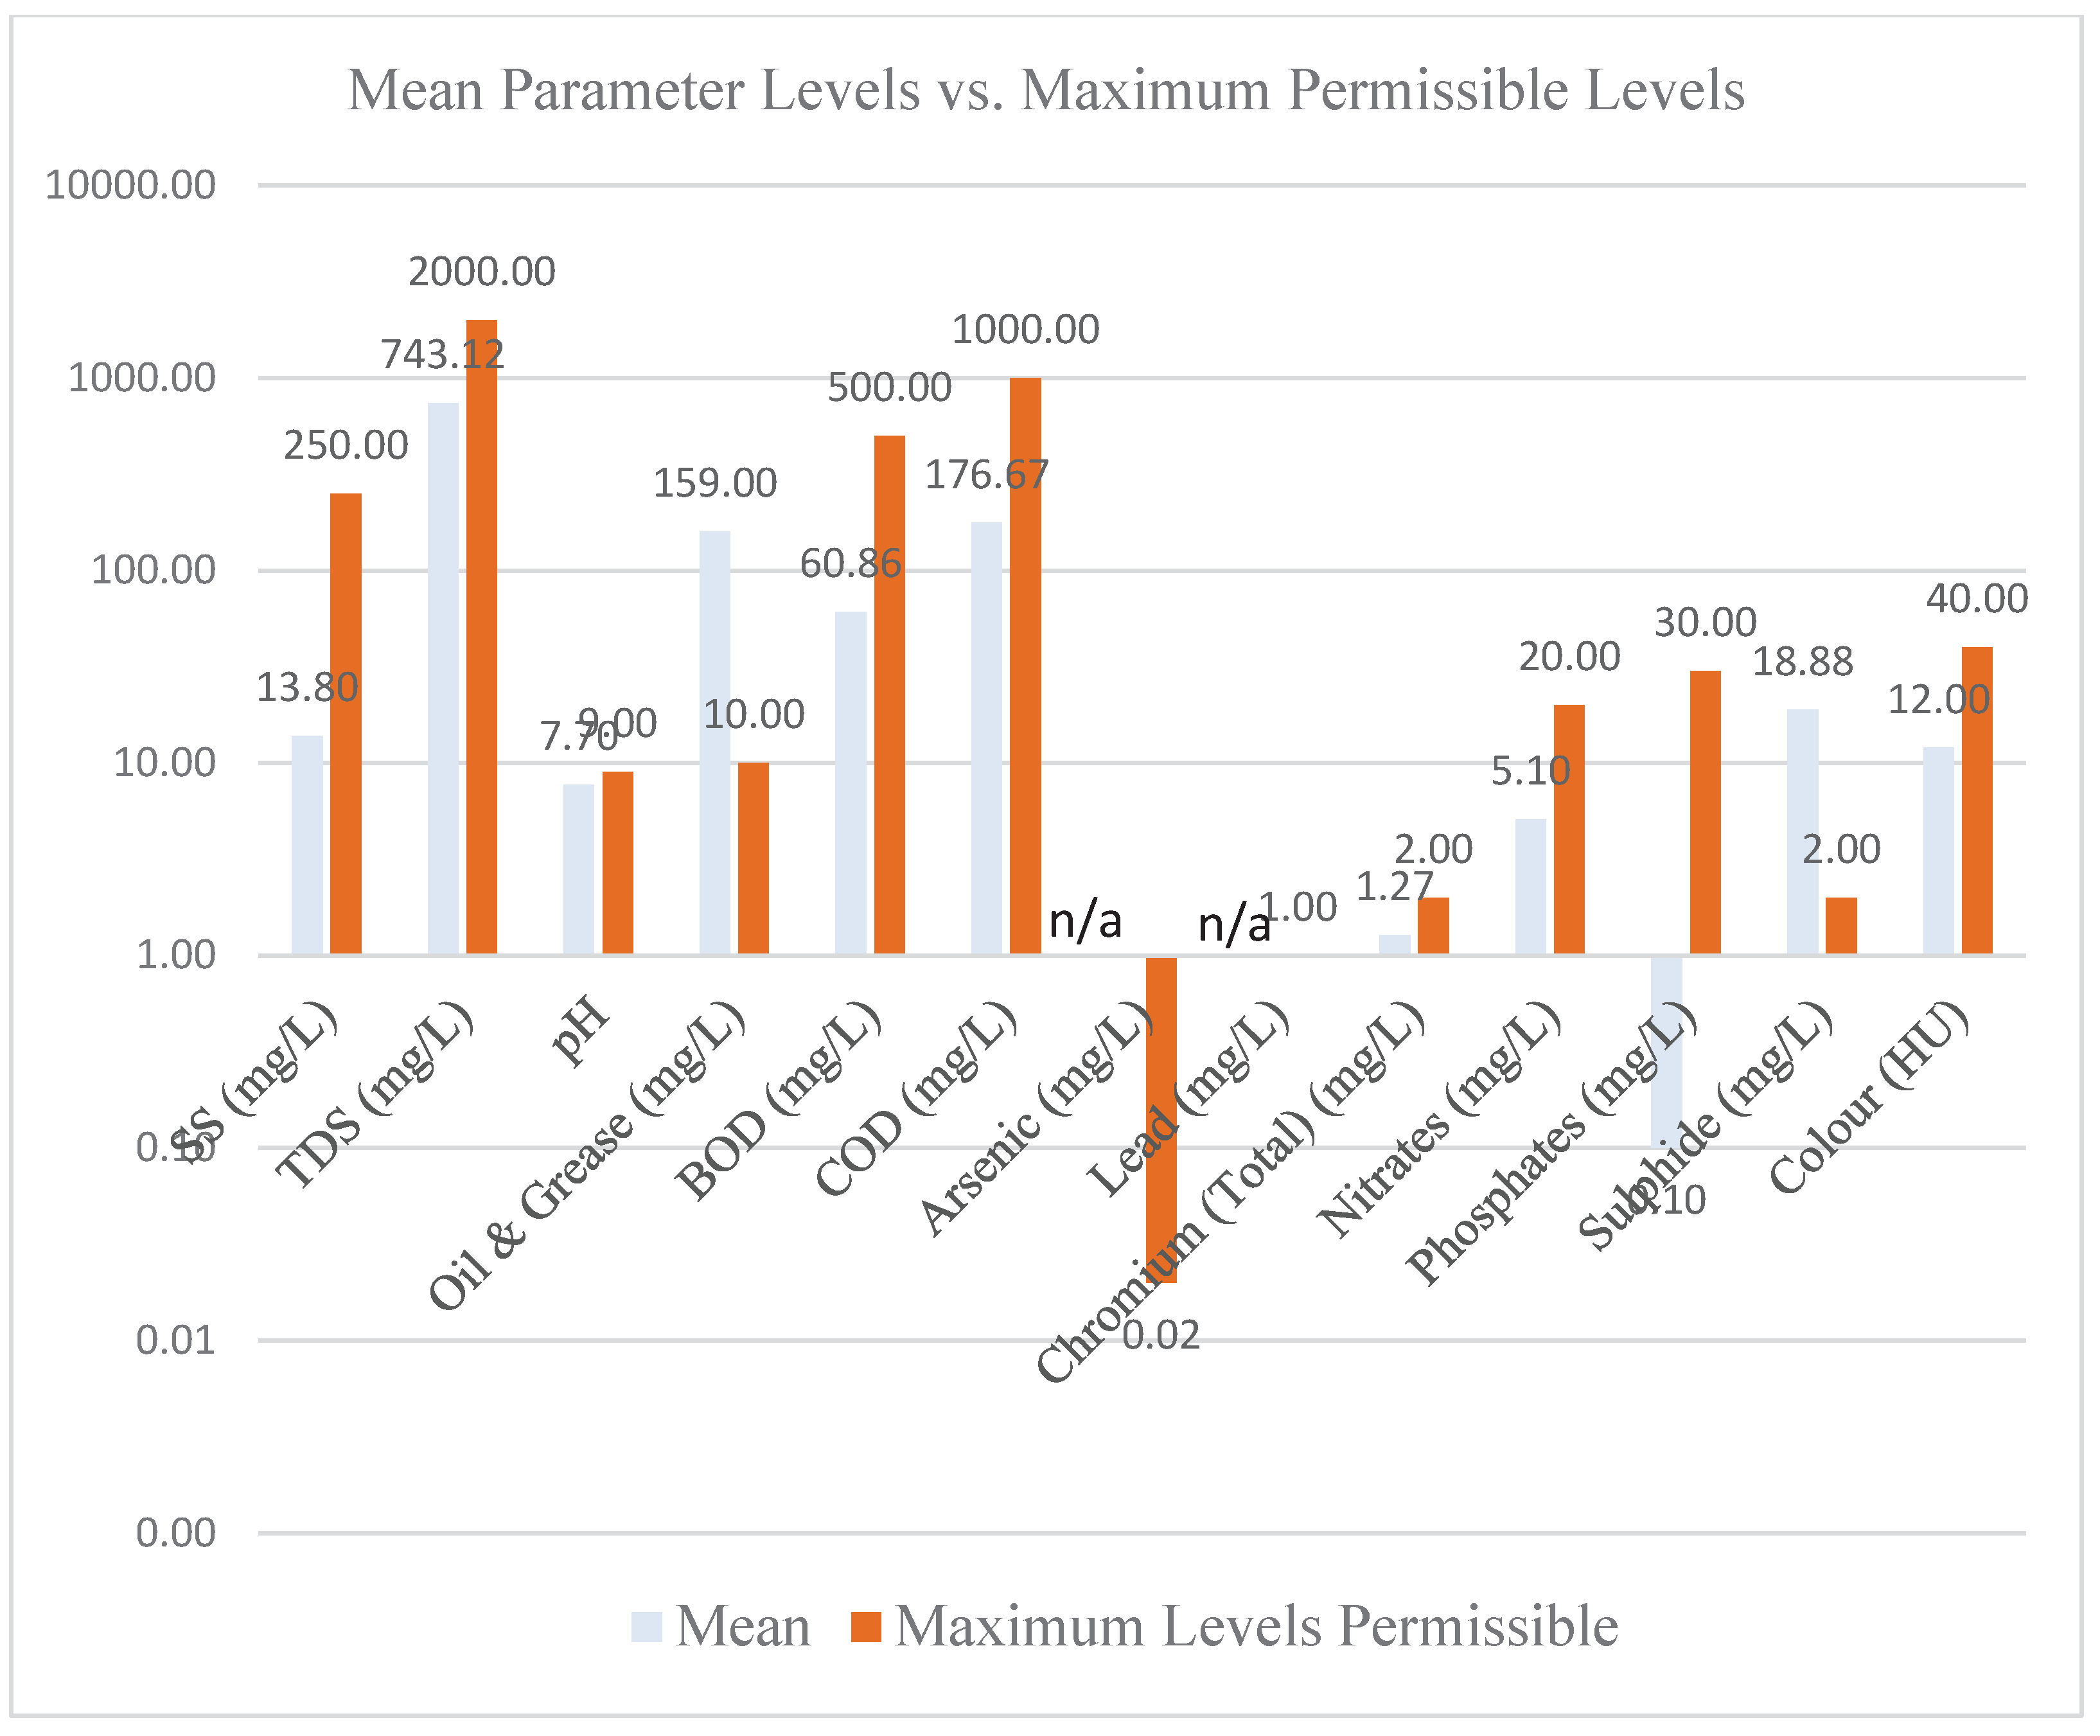
The mean SS concentration across the sampled facilities was 13.8 mg/L, which is well below the NEMA permissible limit of 30 mg/L (Appendix v). This suggests that the tanneries generally manage to remove suspended particulate matter effectively, preventing physical pollution of receiving water bodies. The average TDS concentration was 743.12 mg/L, falling within the NEMA standard of 1200 mg/L (Appendix v). While within limits, high TDS can still contribute to changes in water salinity and affect aquatic life, indicating that ongoing monitoring is necessary.
The mean pH value was 7.70, which is within the acceptable range of 6.5-8.5 for non-marine effluent discharge (Appendix v). Maintaining pH within this range is crucial for preventing harm to aquatic ecosystems and ensuring the effectiveness of biological treatment processes. This parameter showed significant non-compliance, with a mean concentration of 159 mg/L against a permissible limit of “Nil” (Appendix 5). Facility B reported 189 mg/L, and Facilities E and F reported 144 mg/L. The presence of oil and grease, even in small quantities, can form a film on the water surface, reducing oxygen transfer, harming aquatic organisms, and posing aesthetic issues. This widespread exceeding points to a critical failure in the treatment processes for this specific pollutant.
The mean BOD was 60.86 mg/L, exceeding the NEMA standard of 30 mg/L (Appendix v). Facility D reported a particularly high BOD of 190 mg/L. High BOD indicates a large amount of organic matter in the effluent, which consumes dissolved oxygen in water bodies, leading to anaerobic conditions detrimental to aquatic life. This suggests that biological treatment processes in some facilities may not be sufficiently effective.
The mean COD was 176.67 mg/L, also exceeding the NEMA standard of 50 mg/L (Appendix v). Facilities E and F reported 250 mg/L. COD measures the total amount of oxygen required to oxidize organic and inorganic matter in wastewater. High COD values, similar to BOD, indicate significant organic pollution that can deplete oxygen in receiving waters, impacting ecosystem health. Critically, the data provided for Arsenic and Lead consistently showed “n/a” (not available) or “nd” (not detected) across all sampled facilities. Despite NEMA having clear maximum permissible limits for Arsenic (0.02 mg/L) and Lead (0.01 mg/L) (Appendix v), the absence of reported data for these highly toxic heavy metals is a significant concern. This lack of data prevents a direct assessment of compliance for these specific pollutants and suggests a potential gap in routine monitoring or reporting practices by the tanneries or the regulatory bodies. Without this information, the full environmental risk posed by these tanneries cannot be accurately determined.
The mean total Chromium concentration was 1.27 mg/L, slightly exceeding the NEMA standard of 1 mg/L (Appendix v). Facility A reported 1.91 mg/L, and Facilities E and F reported 1.64 mg/L. While the exceeding is marginal on average, individual facility values indicate a need for improved chromium removal, especially considering the severe toxicity of hexavalent chromium, even if total chromium is reported. The mean concentrations for Nitrates (5.1 mg/L) and Phosphates (0.1 mg/L) were well within their respective NEMA limits of 20 mg/L and 2 mg/L (guideline value) [ (Appendix 5)]. This indicates effective management of nutrient discharge, which helps prevent eutrophication in receiving water bodies.
Sulphide concentrations showed a substantial exceedance, with a mean of 18.88 mg/L against a NEMA standard of 0.1 mg/L (Appendix 5). Facility C reported 28 mg/L, and Facility D reported 9.75 mg/L. Sulphide is highly toxic to aquatic life and can produce offensive odors, indicating a significant environmental impact from these discharges. The mean colour was 12 Hazen Units (HU), within the NEMA permissible limit of 15 HU (Appendix 5). This suggests that the effluent generally meets aesthetic standards regarding discoloration.
The analysis of effluent quality parameters reveals a mixed picture of compliance within the sampled Kenyan tanneries. While some conventional parameters like SS, TDS, pH, Nitrates, Phosphates, and colour are generally within regulatory limits, significant challenges persist in managing organic load (BOD, COD), oil and grease, and sulphide. The consistent absence of reported data for Lead and Arsenic is a critical gap that prevents a comprehensive assessment of compliance for these highly toxic heavy metals. This data gap suggests that current monitoring practices may not be robust enough to capture the full spectrum of hazardous pollutants, potentially leaving communities and ecosystems exposed to unquantified risks. Chemical users are supposed to follow Material Safety Data Sheet (MSDS) recommendations focusing on its properties, handling, safety, and environmental considerations.
Effectiveness of Tannery Wastewater Treatment
The effectiveness of the various wastewater treatment methods employed by tanneries in Kenya was evaluated by comparing the mean concentrations of key effluent parameters against the maximum permissible levels outlined in the Fourth Schedule of the Environmental Management and Co-ordination (Water Quality) Regulations, 2006. This analysis, which directly addresses objective (ii), focused on SS, TDS, pH, oil and grease, BOD, COD, Total Chromium, Nitrates, Phosphates, Sulphide, and Colour.
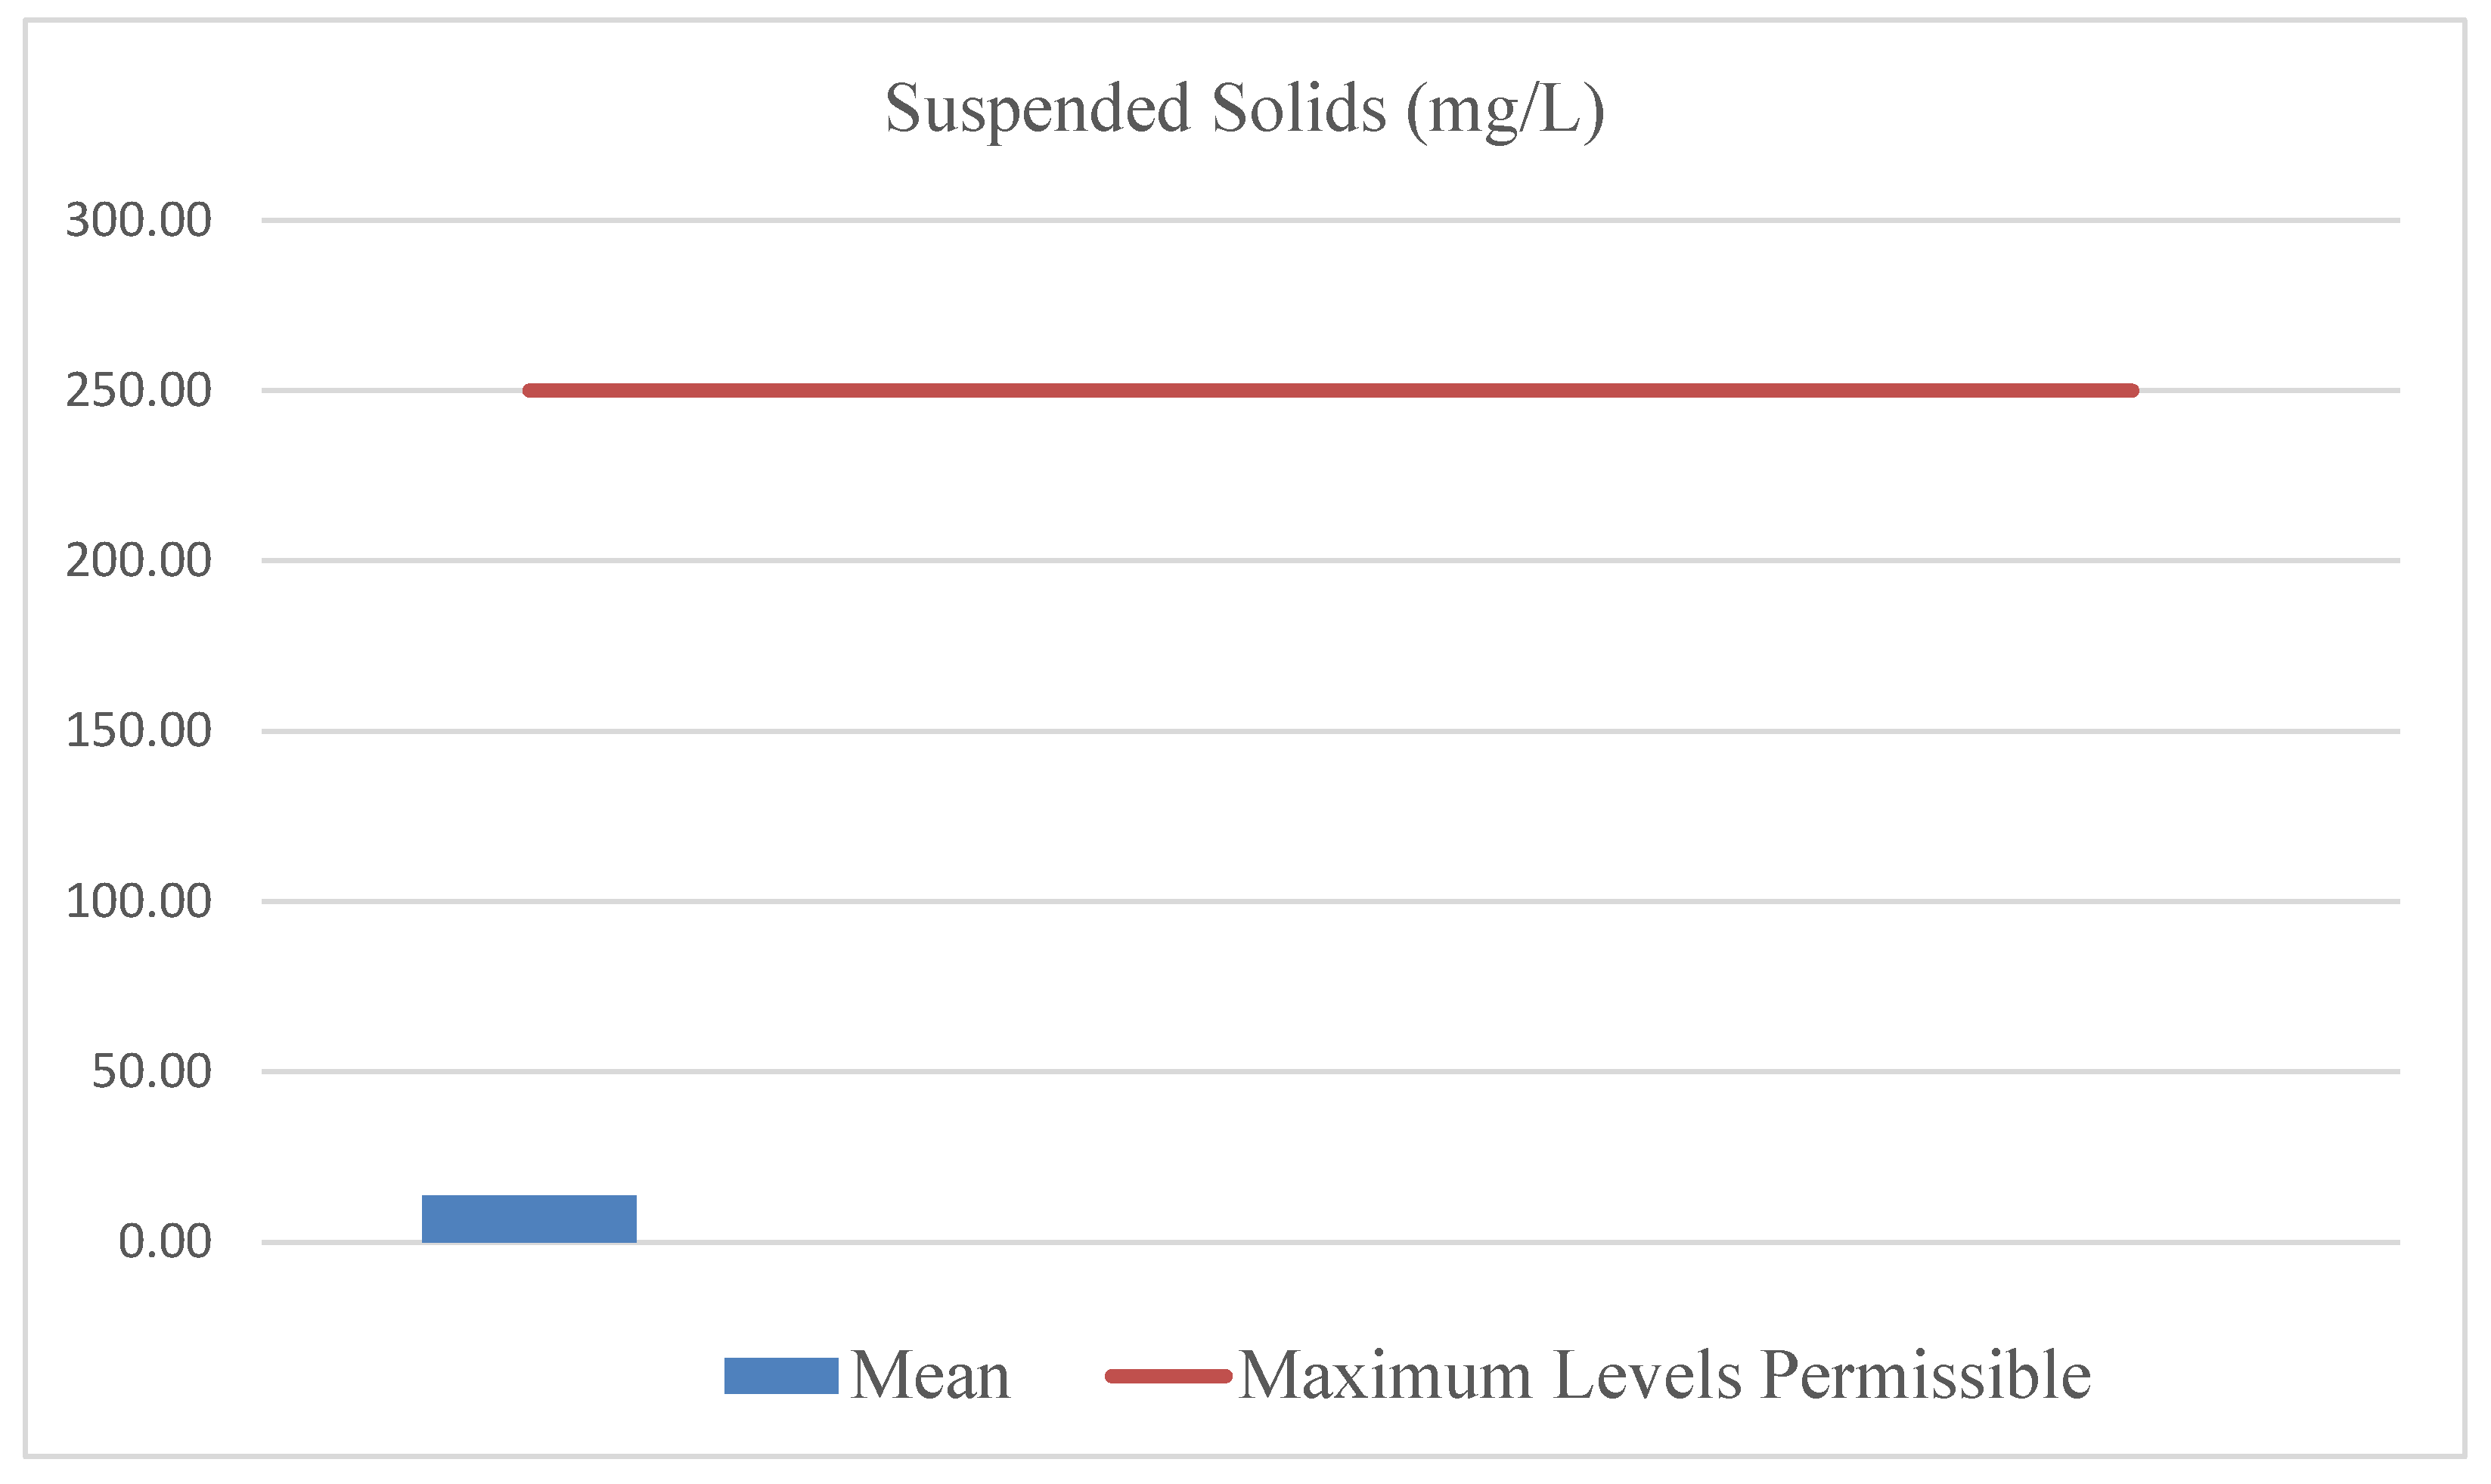
Suspended Solids (SS)
As demonstrated in the chart, the mean concentration of SS was 13.80 mg/L, which is well below the maximum permissible level of 250.00 mg/L. This indicates that, on average, the treatment plants were highly effective in removing solid particles from the effluent before discharge, thereby mitigating the risk of increased turbidity and negative impacts on aquatic ecosystems.
Figure 2.
Suspended Solids Analysis Results.
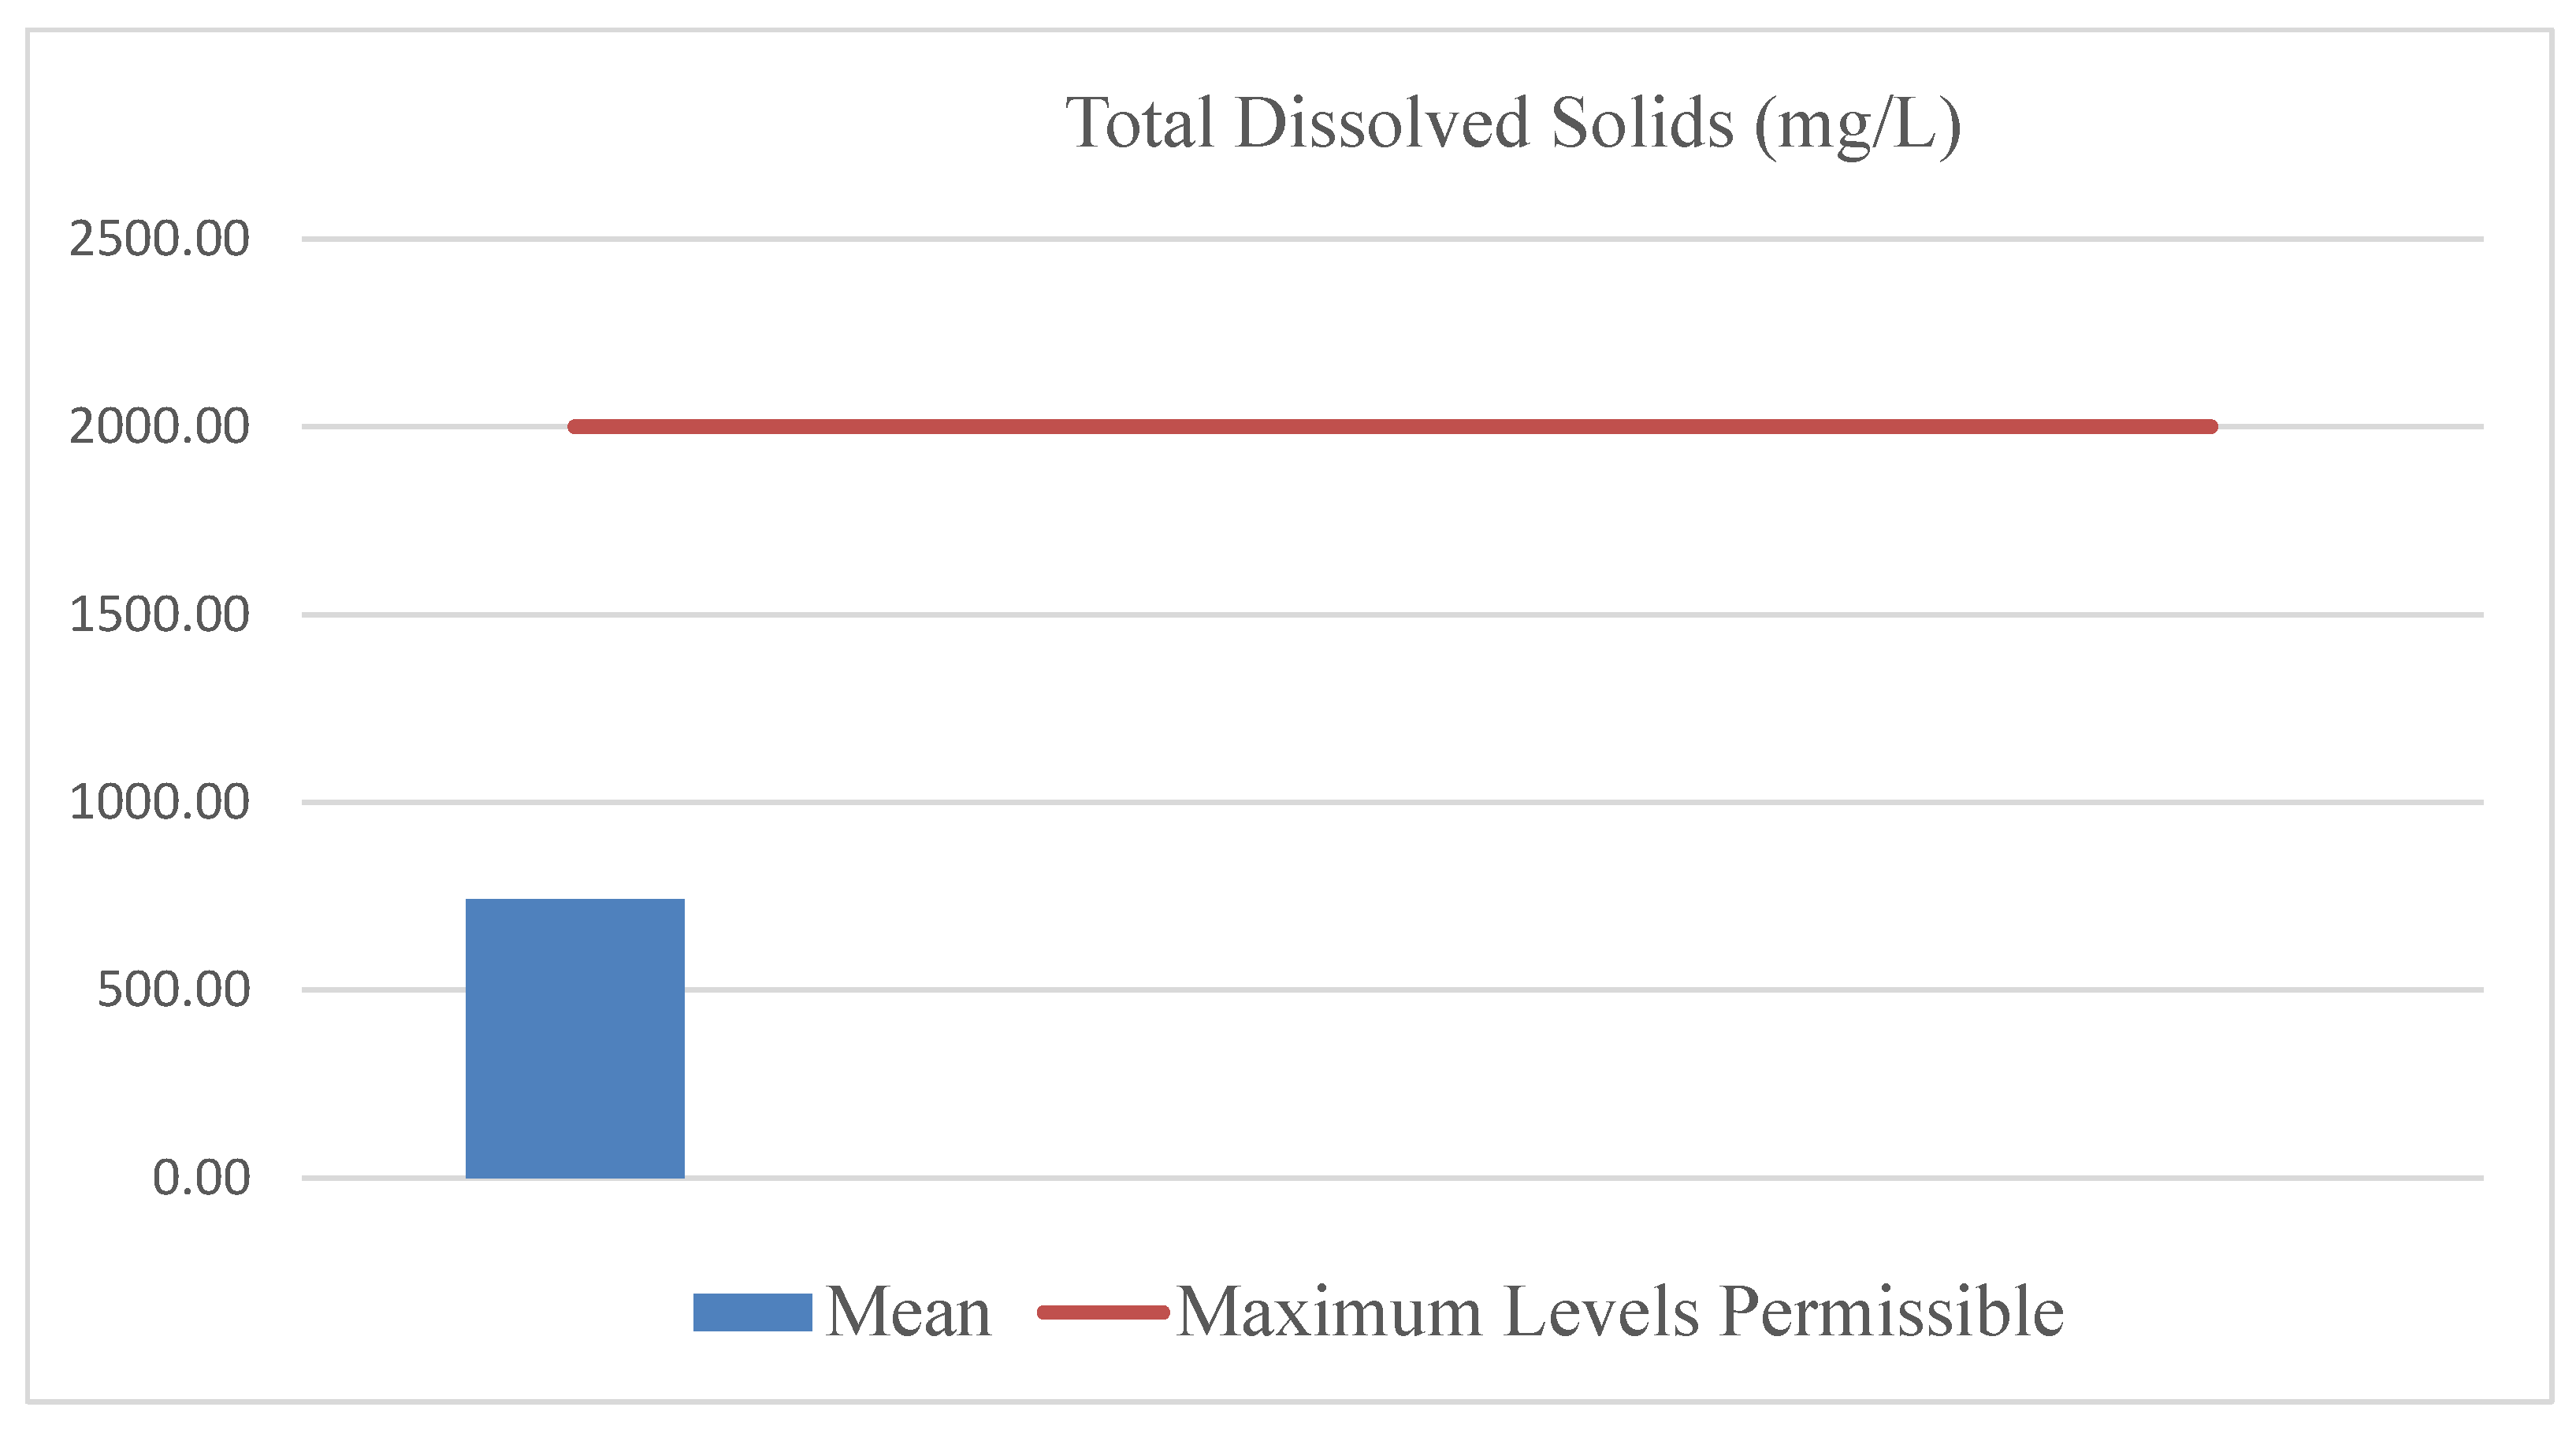
Total Dissolved Solids (TDS)
The mean concentration of TDS was 743.12 mg/L, a value well within the maximum permissible limit of 2000.00 mg/L. This finding, as visually represented in the chart, suggests that the treatment processes were, on average, successful in reducing the levels of dissolved inorganic and organic substances to an acceptable range.
Figure 3.
Total Dissolved Solids Analysis Results.
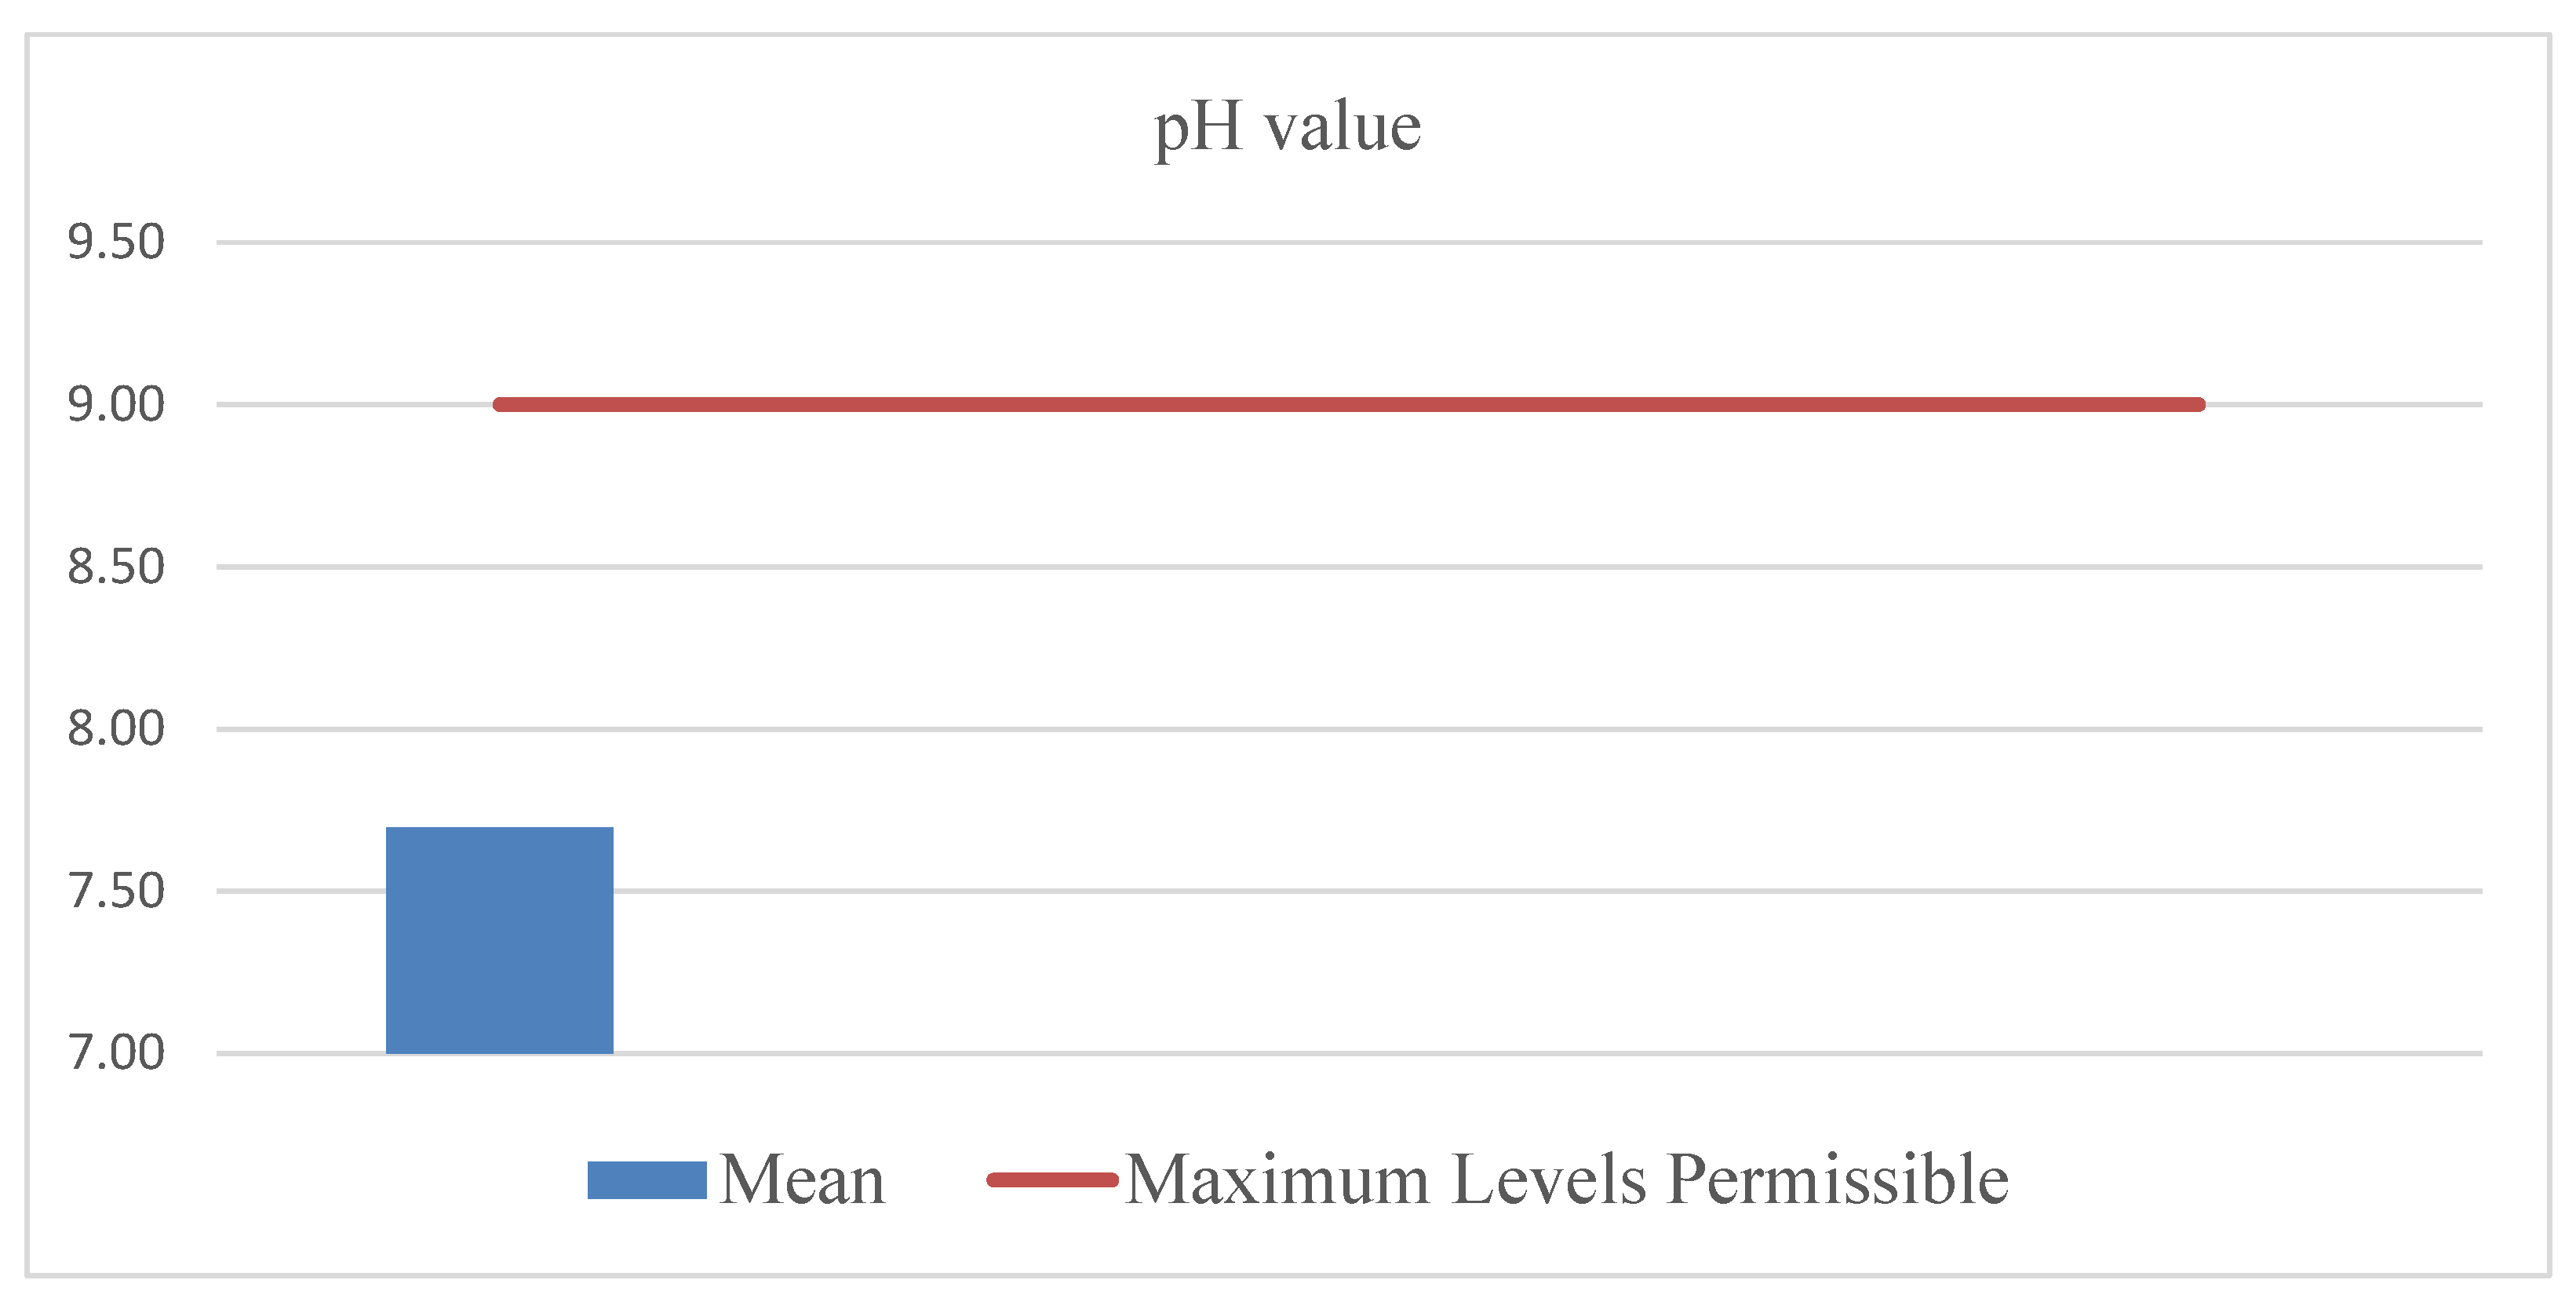
pH
The mean pH of the treated effluent was 7.70. This value falls squarely within the maximum permissible range of 6.5 to 9.0, as shown in the chart. This indicates that the treatment plants were, on average, effective in neutralizing the effluent to a safe level for discharge, which is a critical step in environmental protection.
Figure 4.
pH Results.
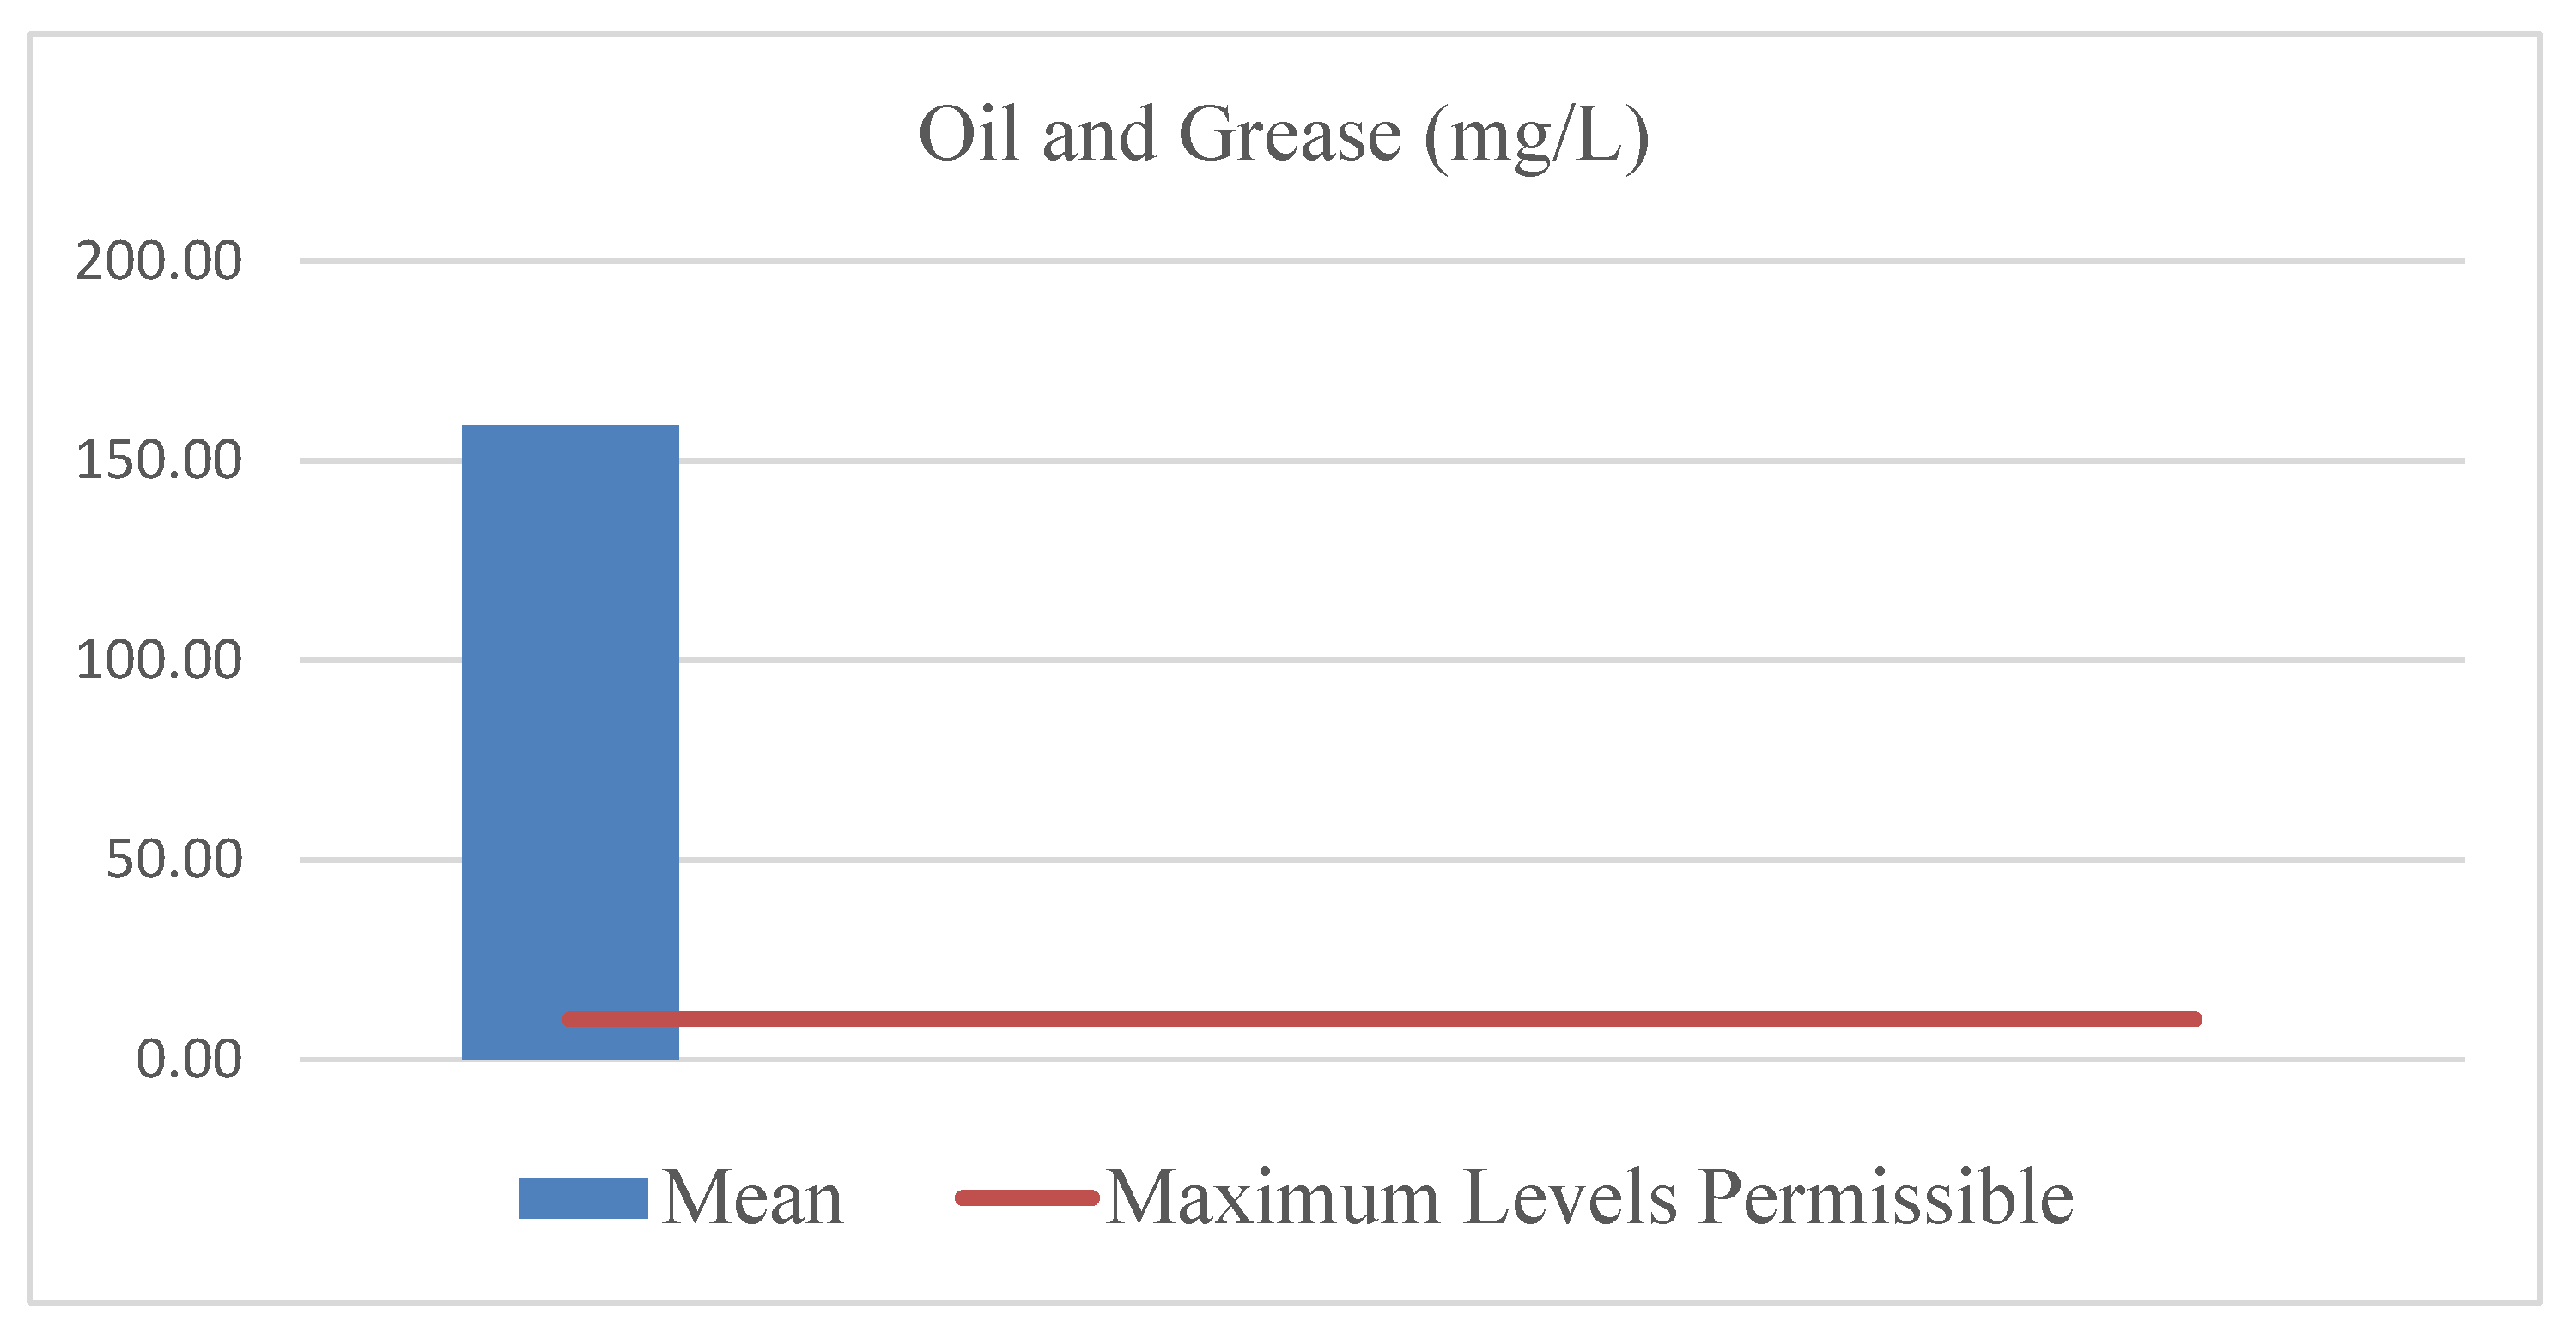
Oil and Grease
The analysis for Oil and Grease revealed a significant area of non-compliance. The mean concentration was found to be 159.00 mg/L, which drastically exceeds the maximum permissible level of 10.00 mg/L. The chart visually highlights this severe discrepancy, indicating a major and consistent failure in the treatment plants to adequately separate and remove these pollutants.
Figure 5.
Oil and Grease Results.
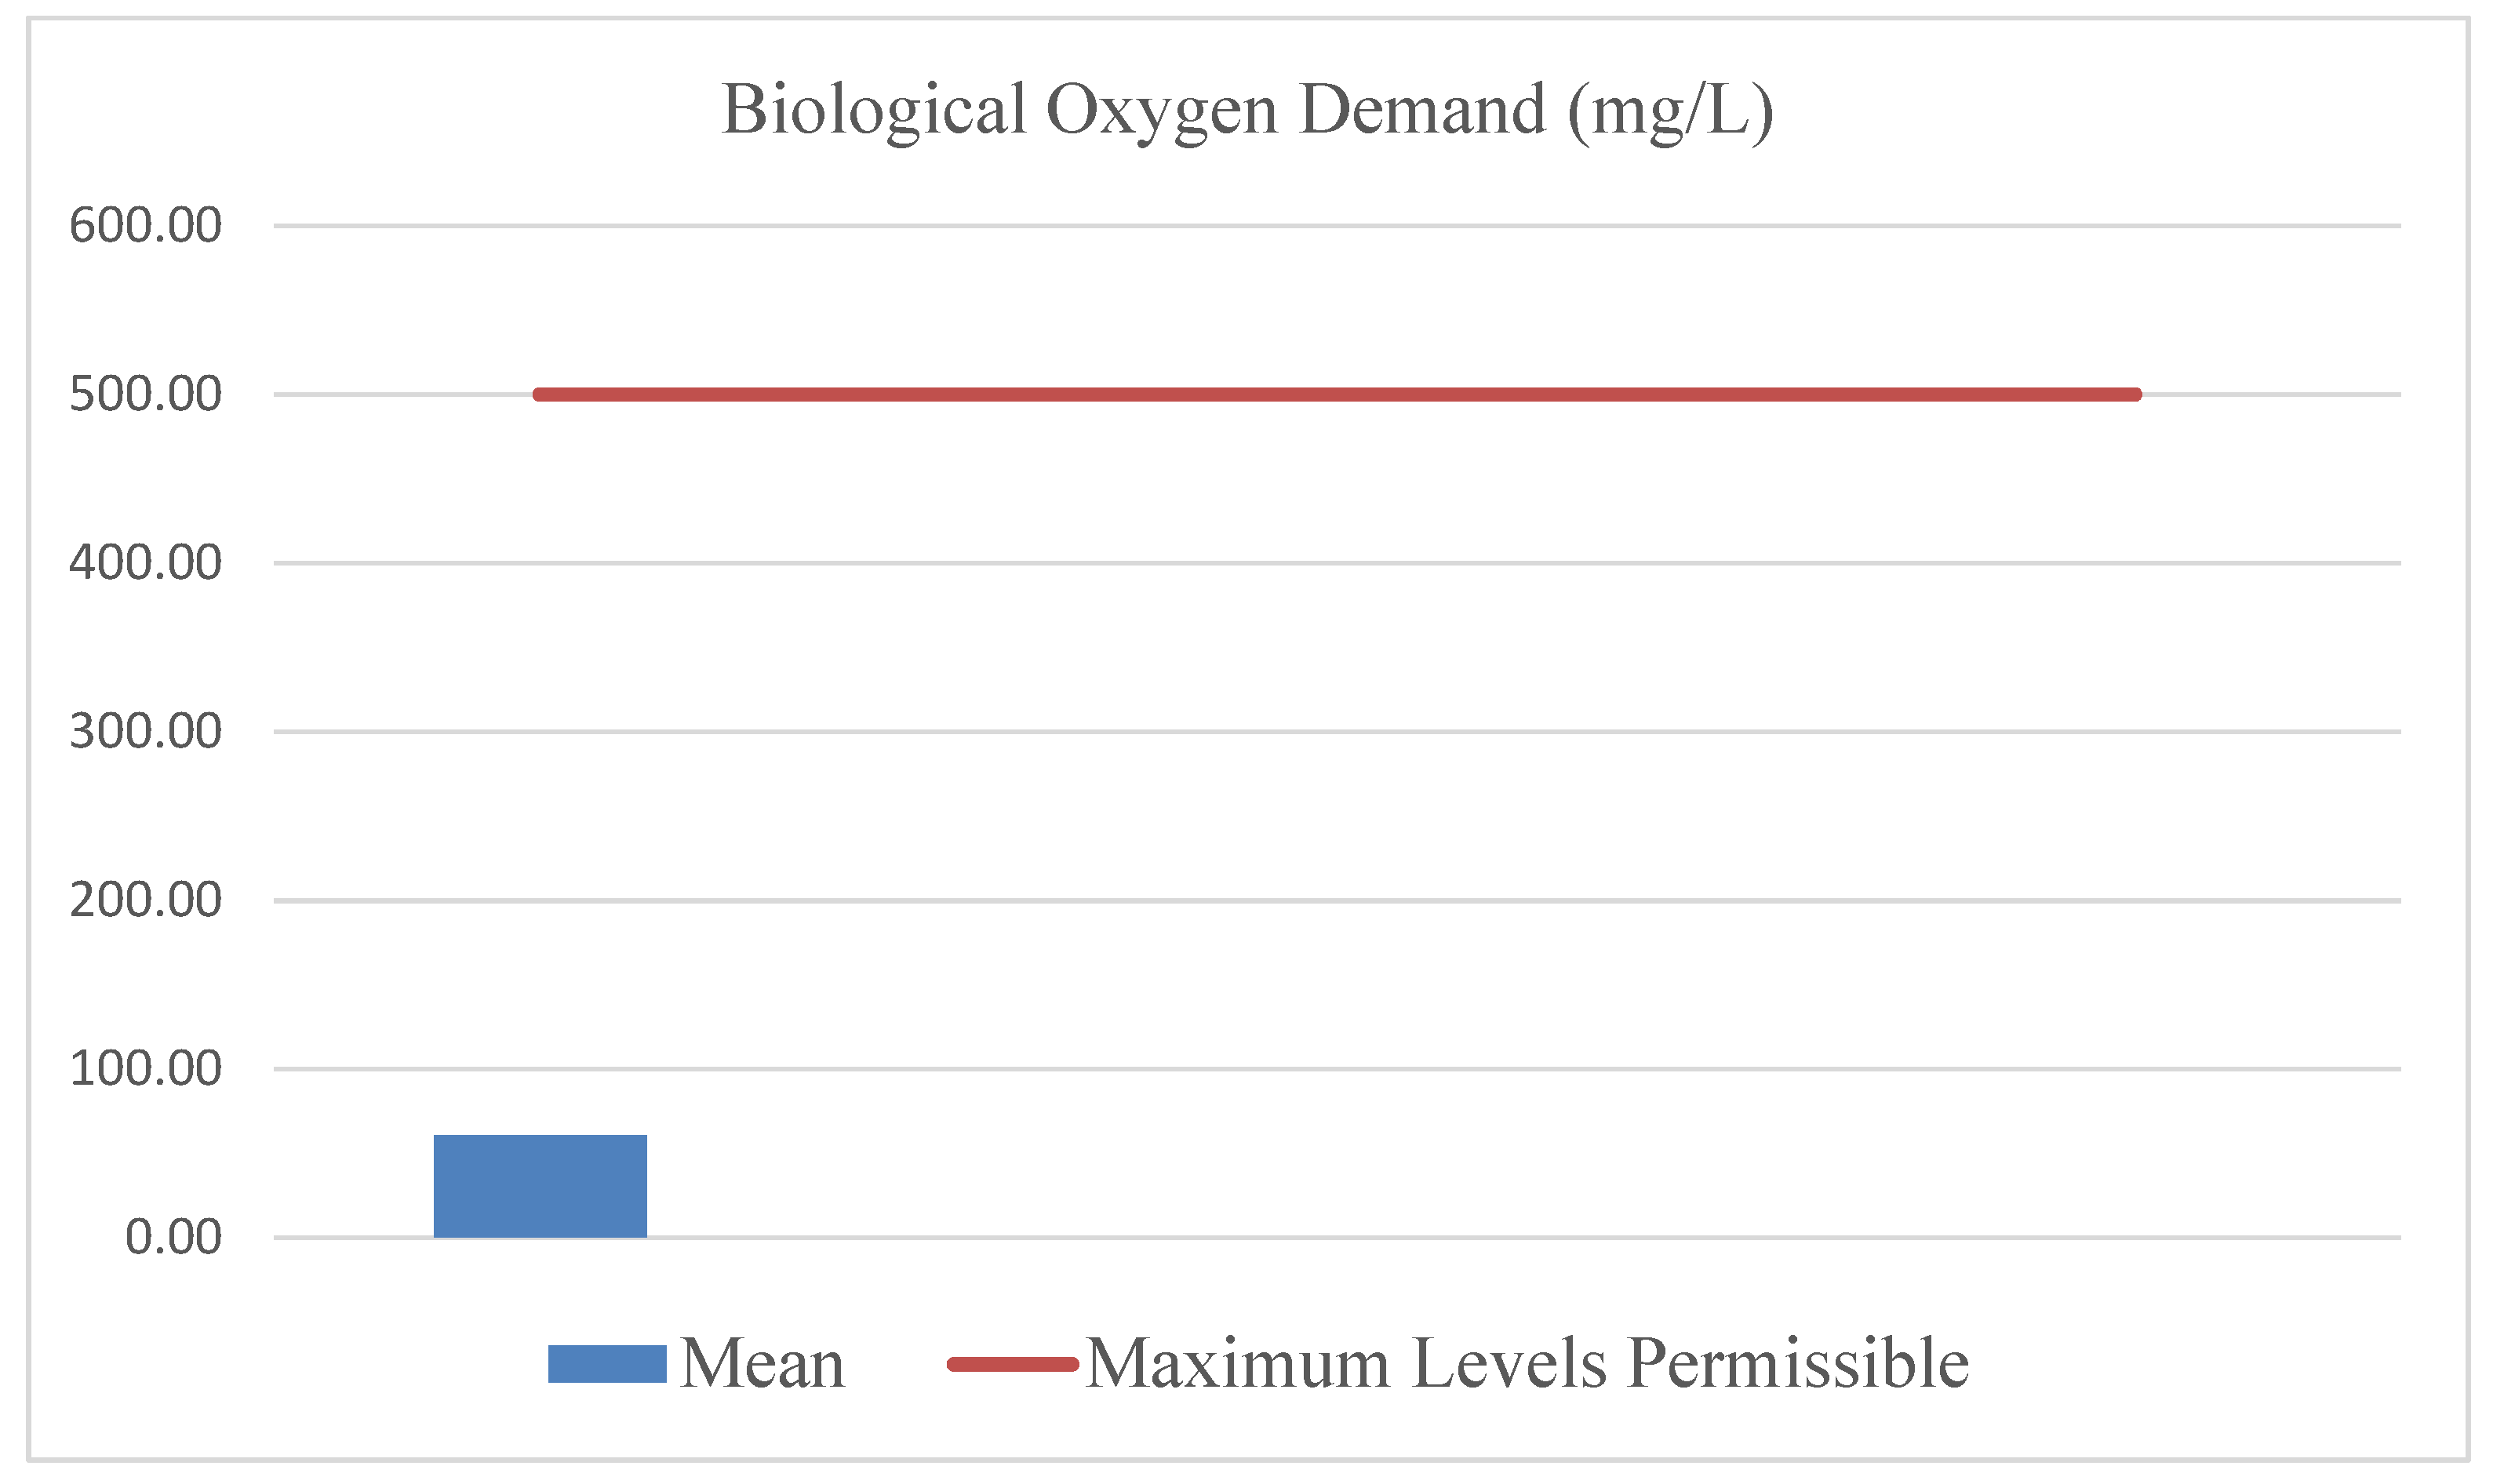
Biological Oxygen Demand (BOD)
The mean BOD concentration was 60.86 mg/L, which is significantly lower than the maximum permissible level of 500.00 mg/L. This finding, as depicted in the chart, shows that the treatment processes were highly effective, on average, in removing biodegradable organic matter, thereby reducing the oxygen demand of the discharged effluent on receiving water bodies.
Figure 6.
Biological Oxygen Demand Results.
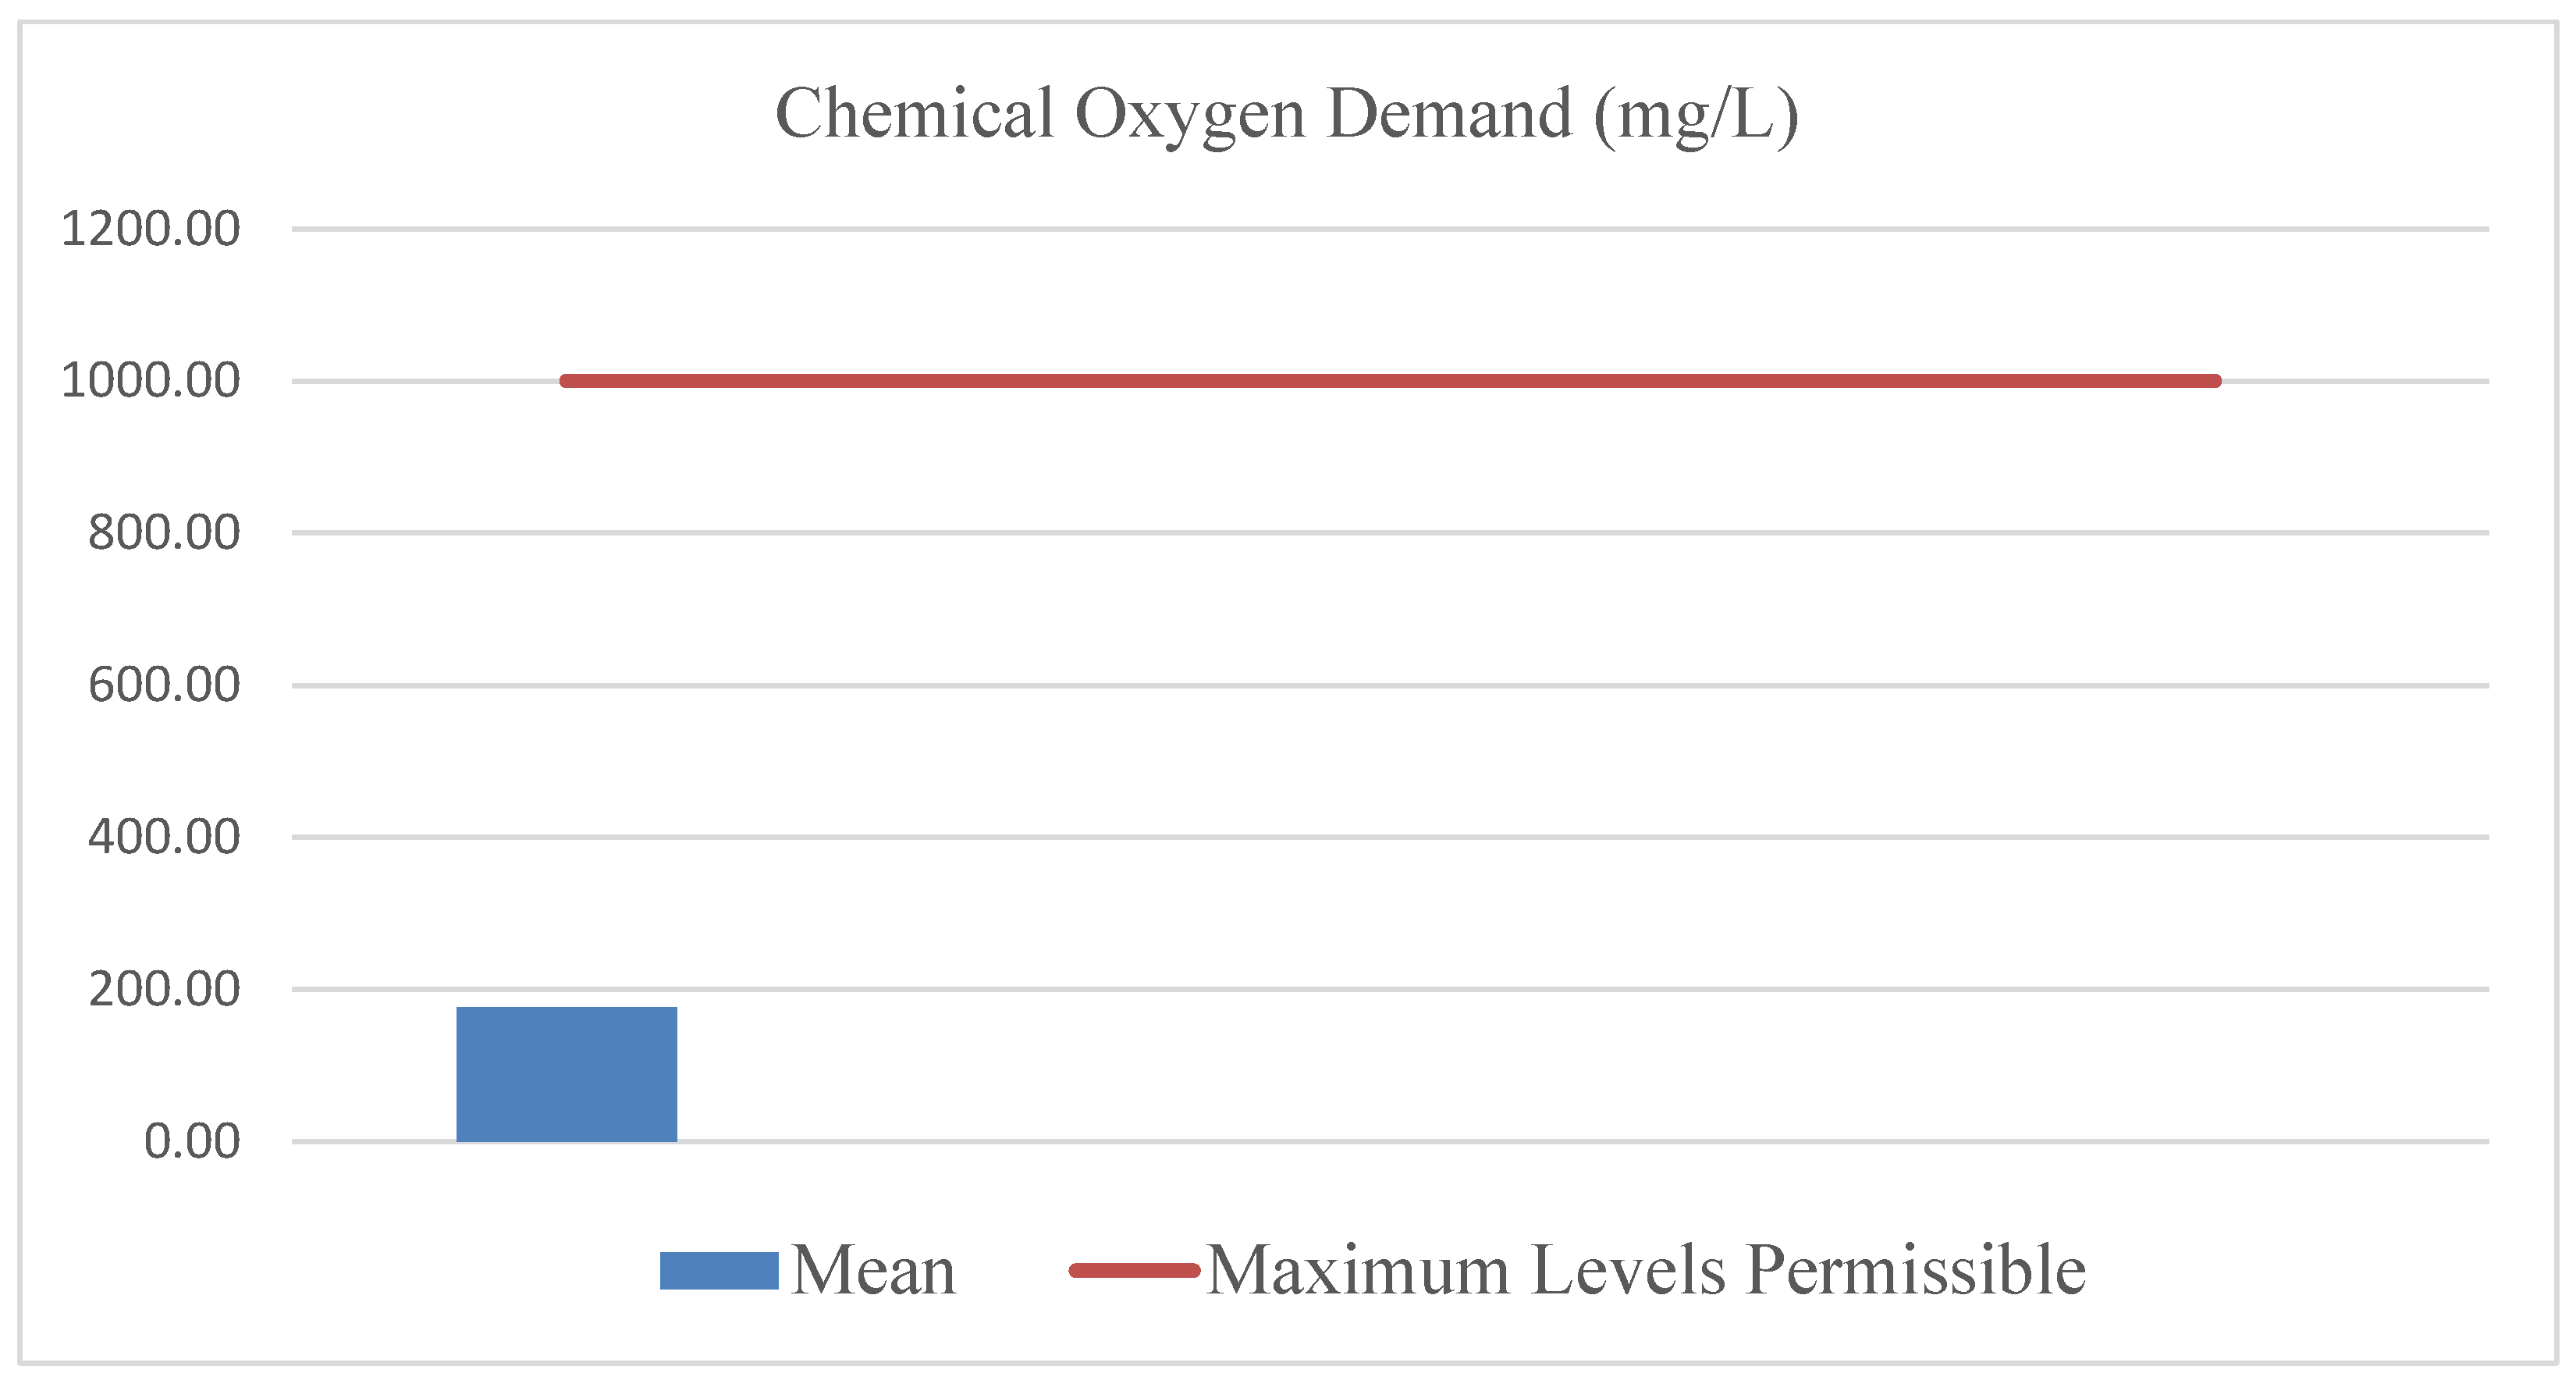
Chemical Oxygen Demand (COD)
Similar to BOD, the mean COD concentration was 176.67 mg/L, falling well within the maximum permissible level of 1000.00 mg/L. The chart visually confirms this successful reduction, indicating that the treatment plants were, on average, effective in breaking down both biodegradable and non-biodegradable organic pollutants.
Figure 7.
Chemical Oxygen Demand.
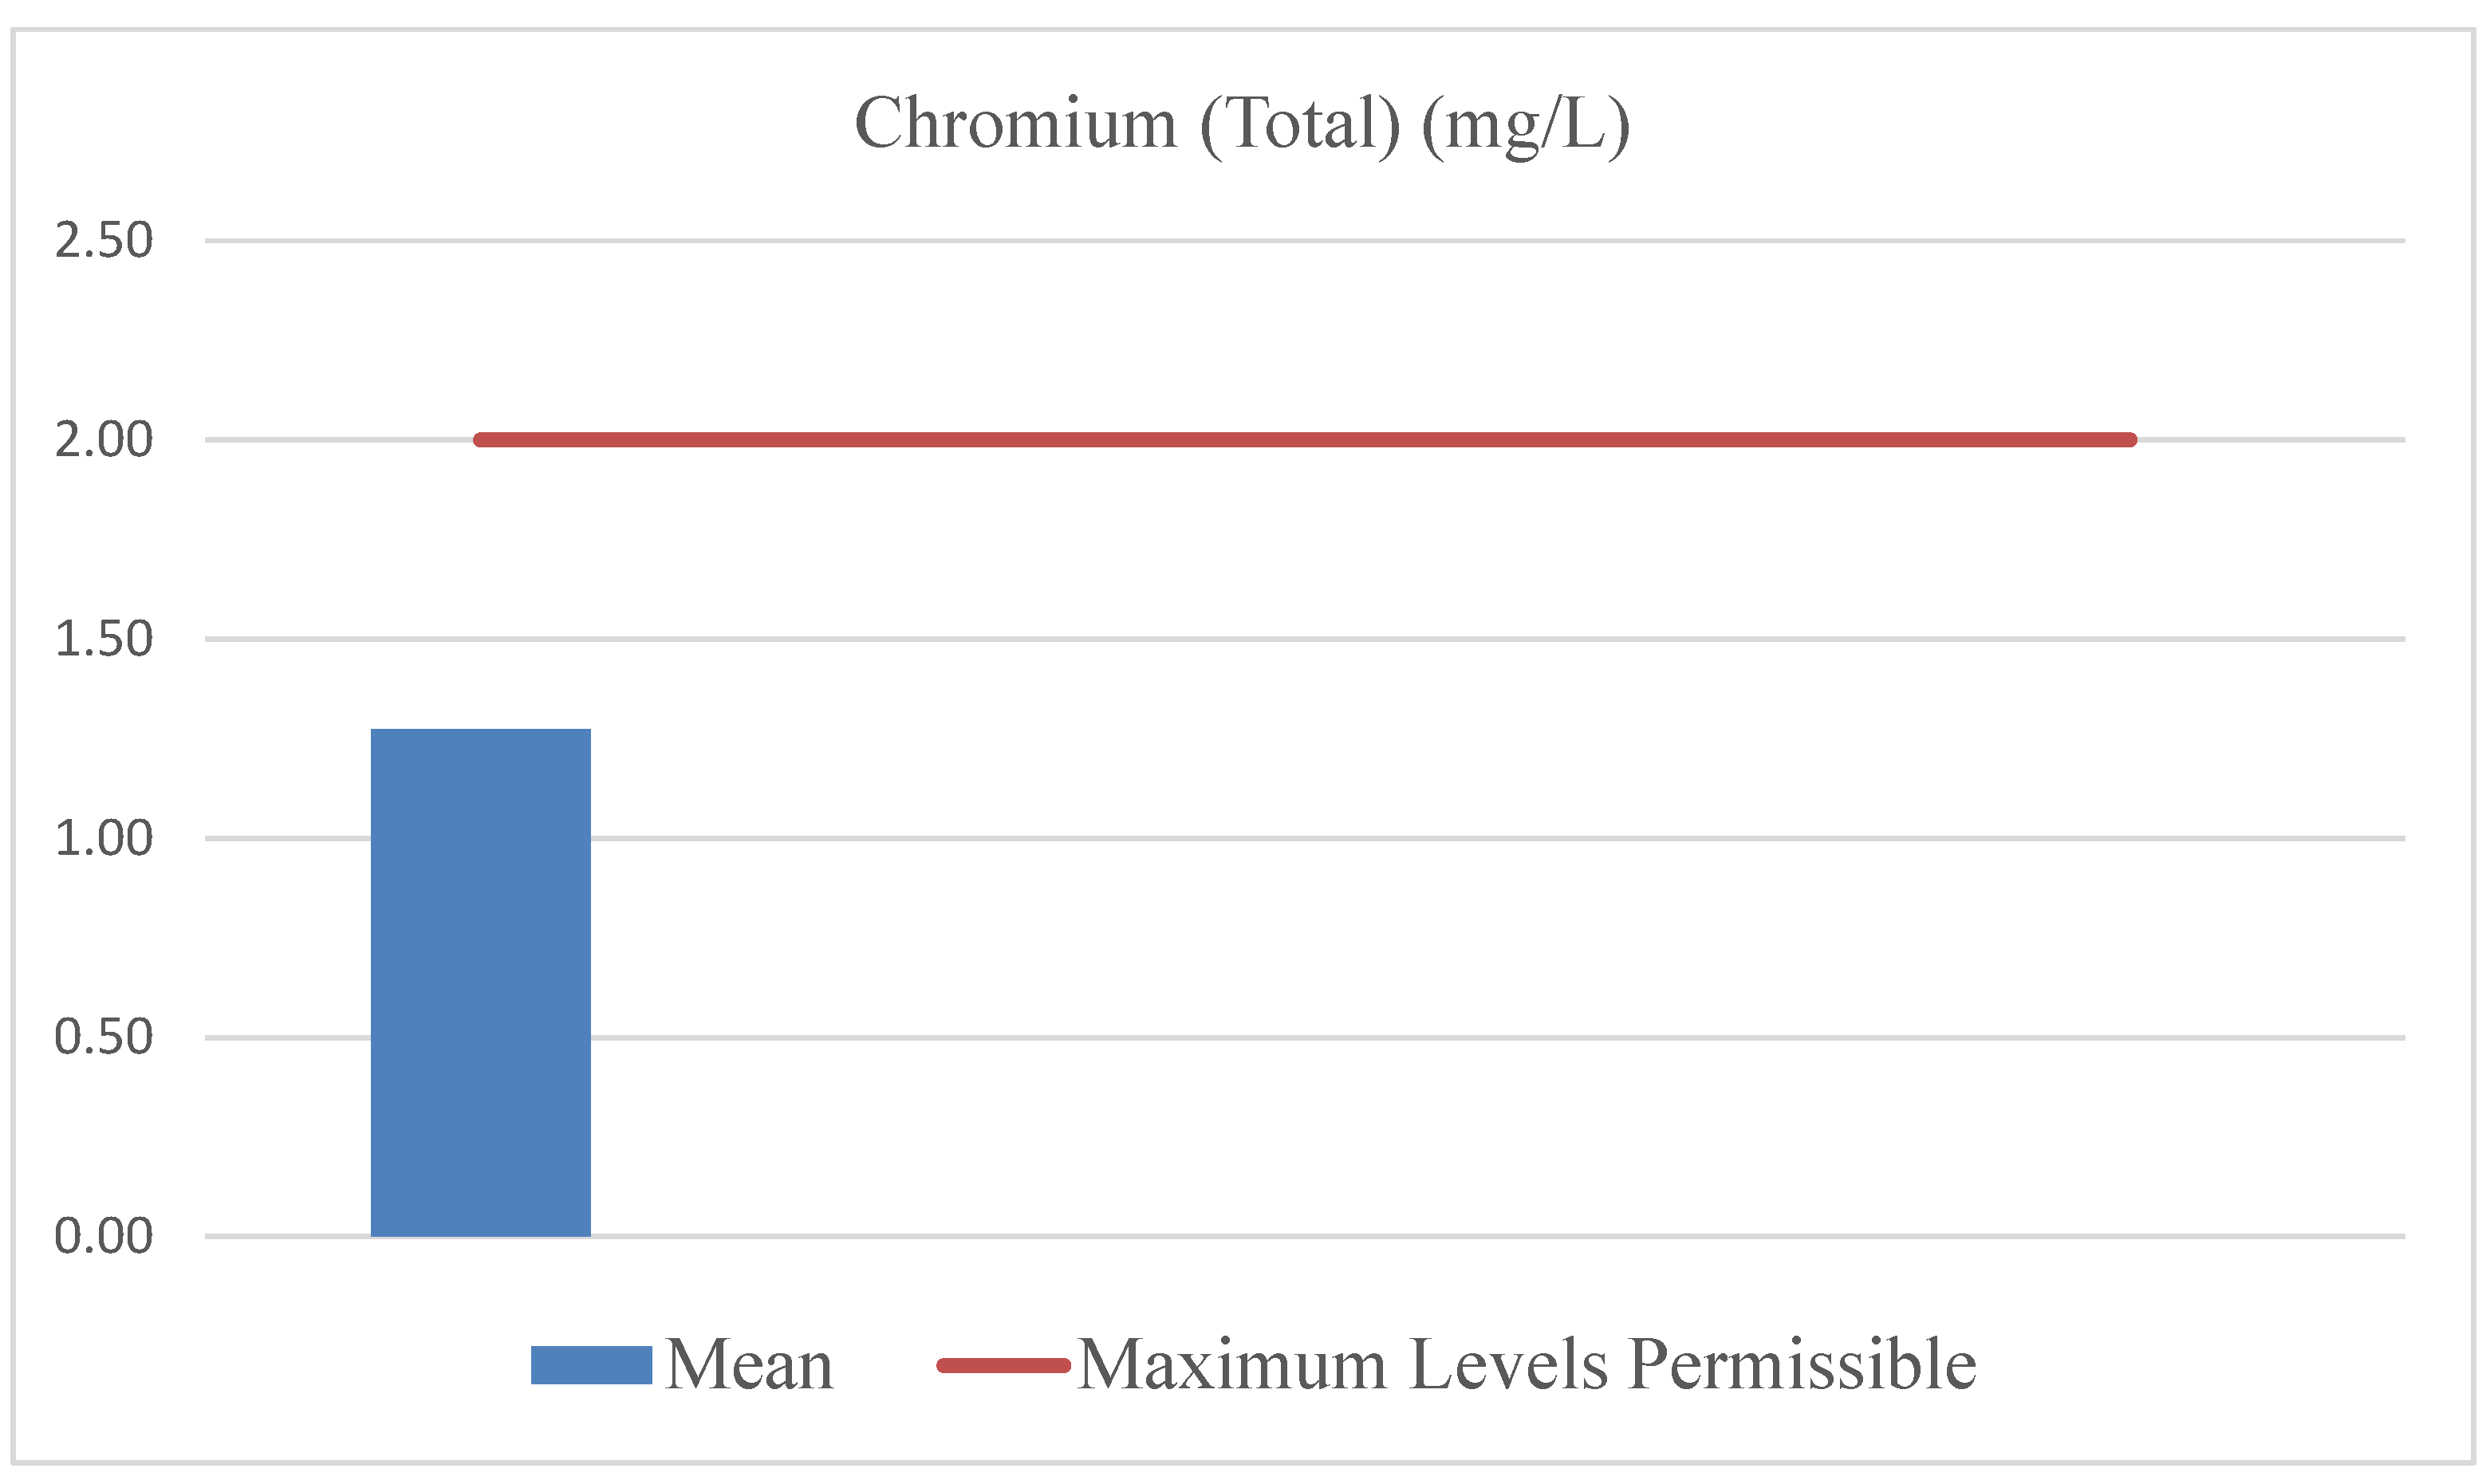
Total Chromium
The mean concentration of Total Chromium was 1.27 mg/L, which is below the maximum permissible level of 2.00 mg/L. The chart reinforces this finding, demonstrating that on average, the treatment plants were successful in mitigating this highly toxic heavy metal to within regulatory standards.
Figure 8.
Total Chromium.
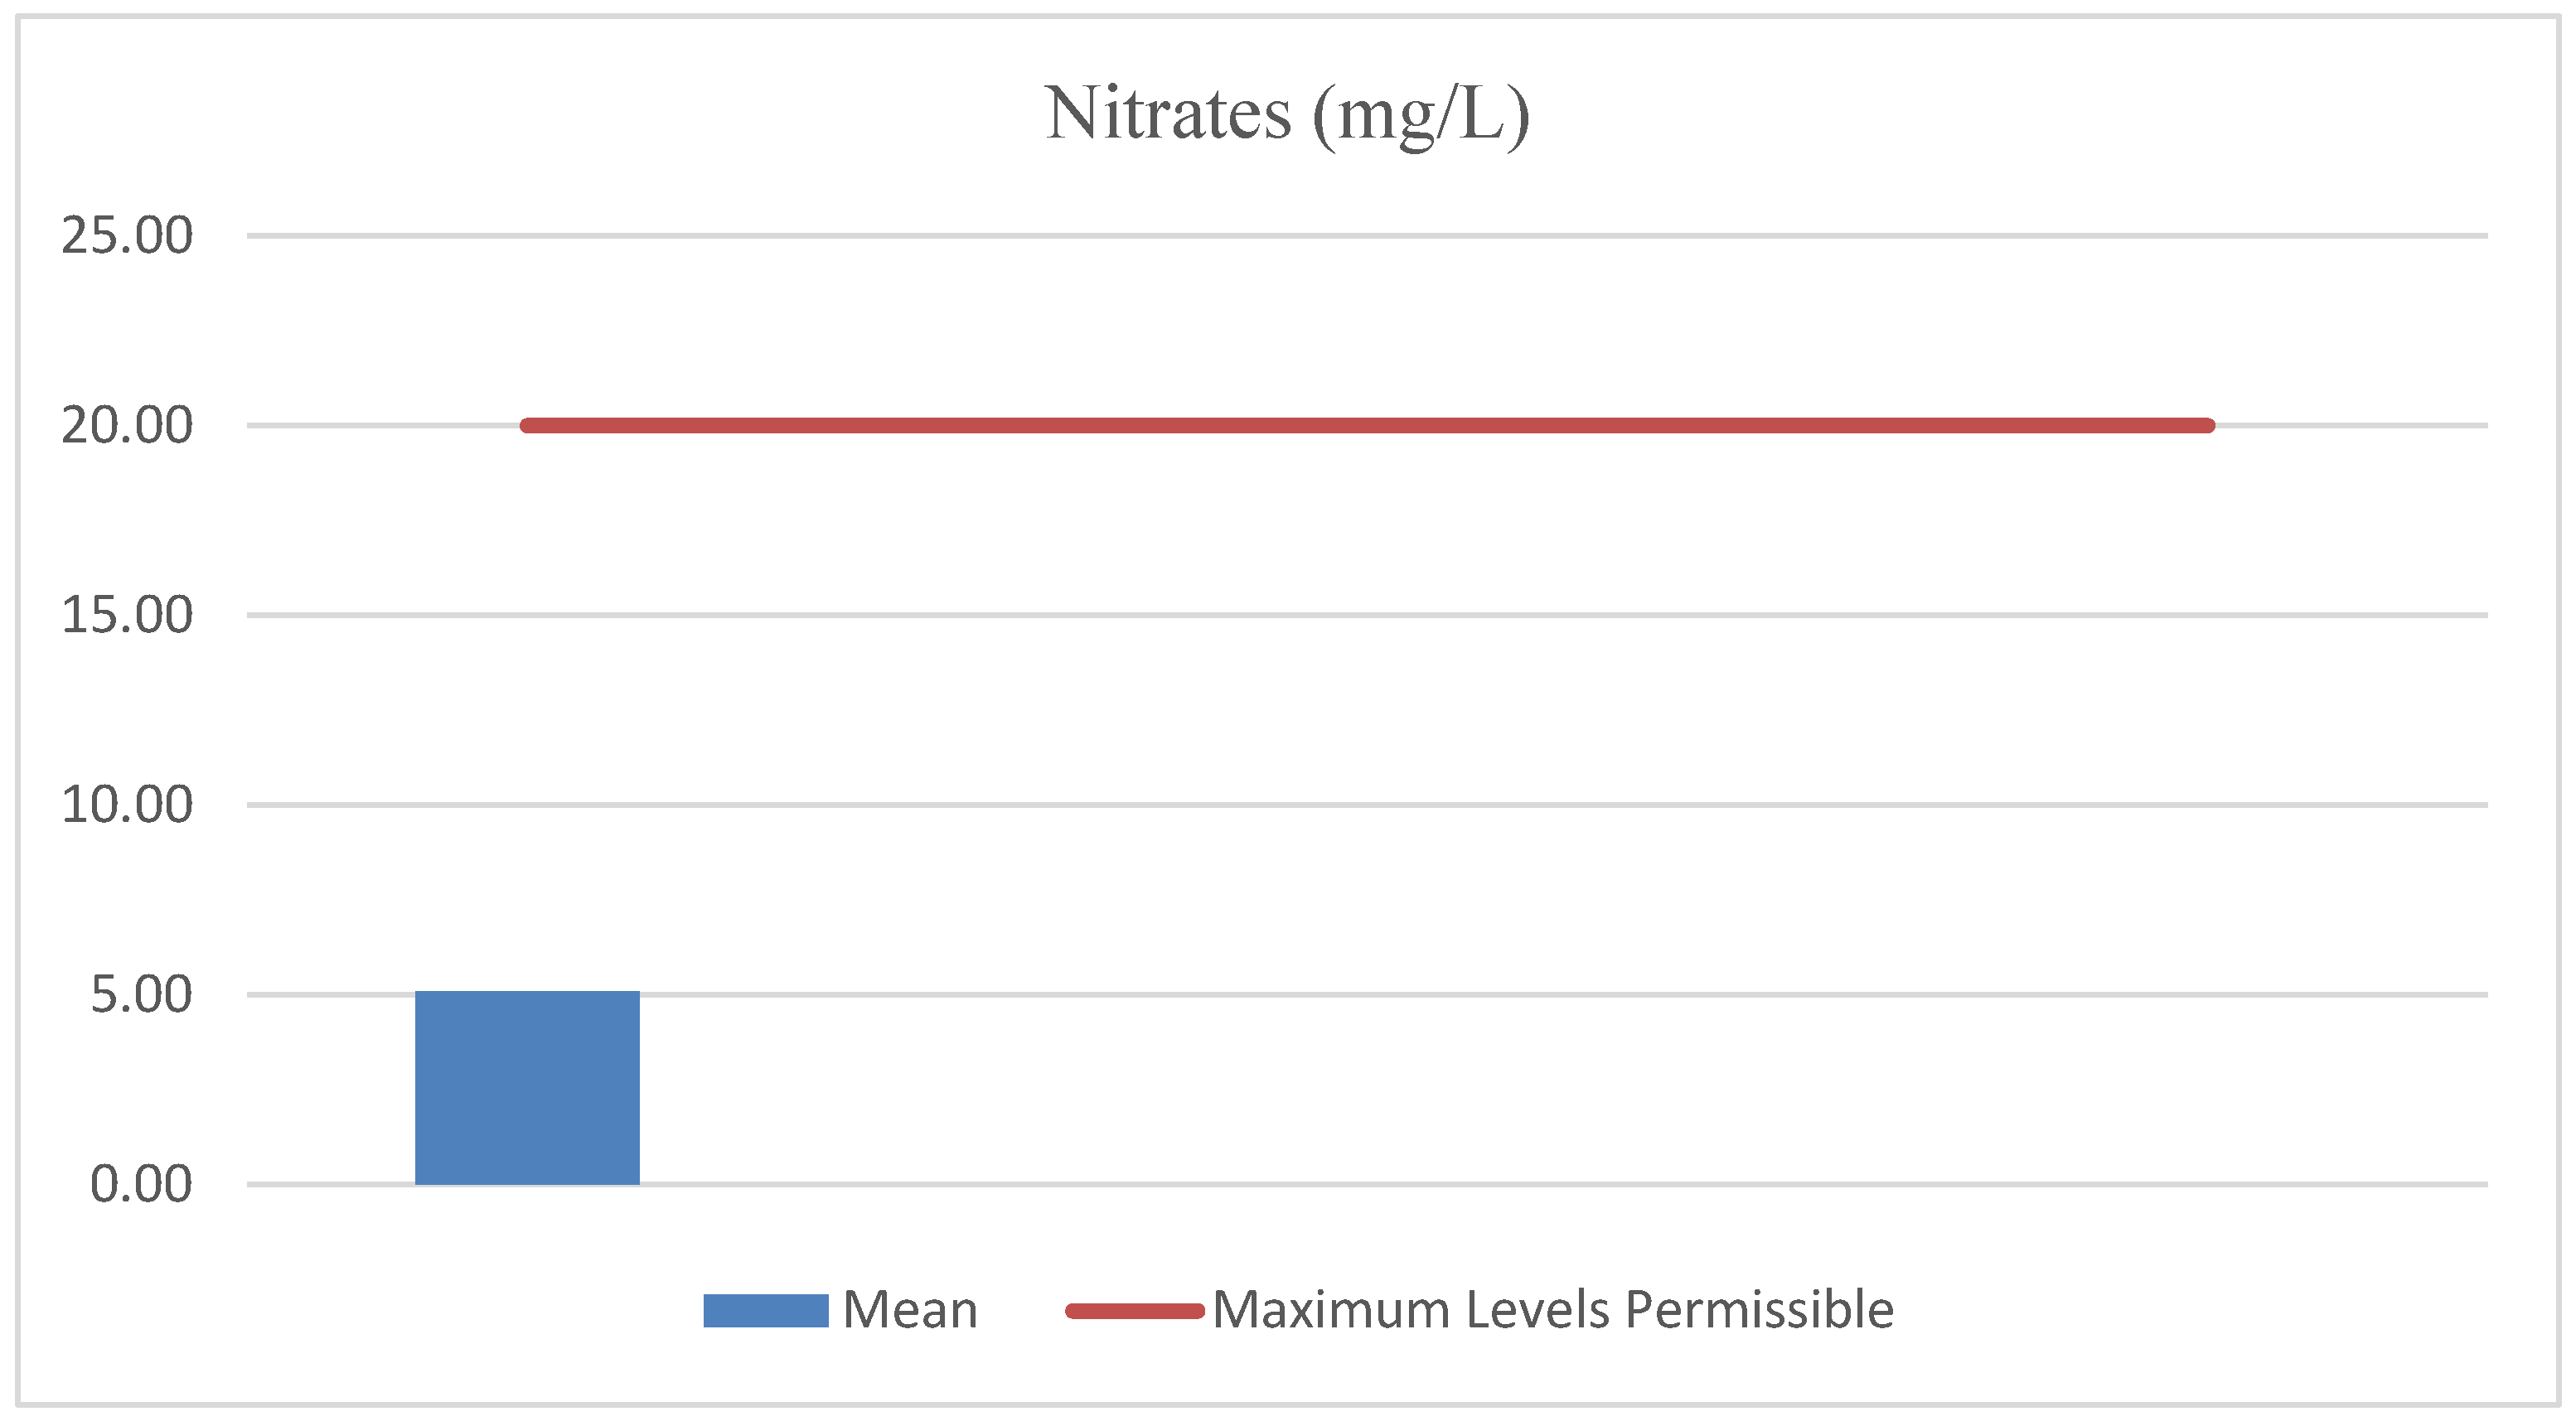
Nitrates
The mean concentration of Nitrates was 5.10 mg/L, which is well within the maximum permissible level of 20.00 mg/L. As shown in the chart, this indicates that the treatment processes were effective in removing nutrients that could otherwise contribute to eutrophication of receiving water bodies.
Figure 9.
Nitrates Concentration.
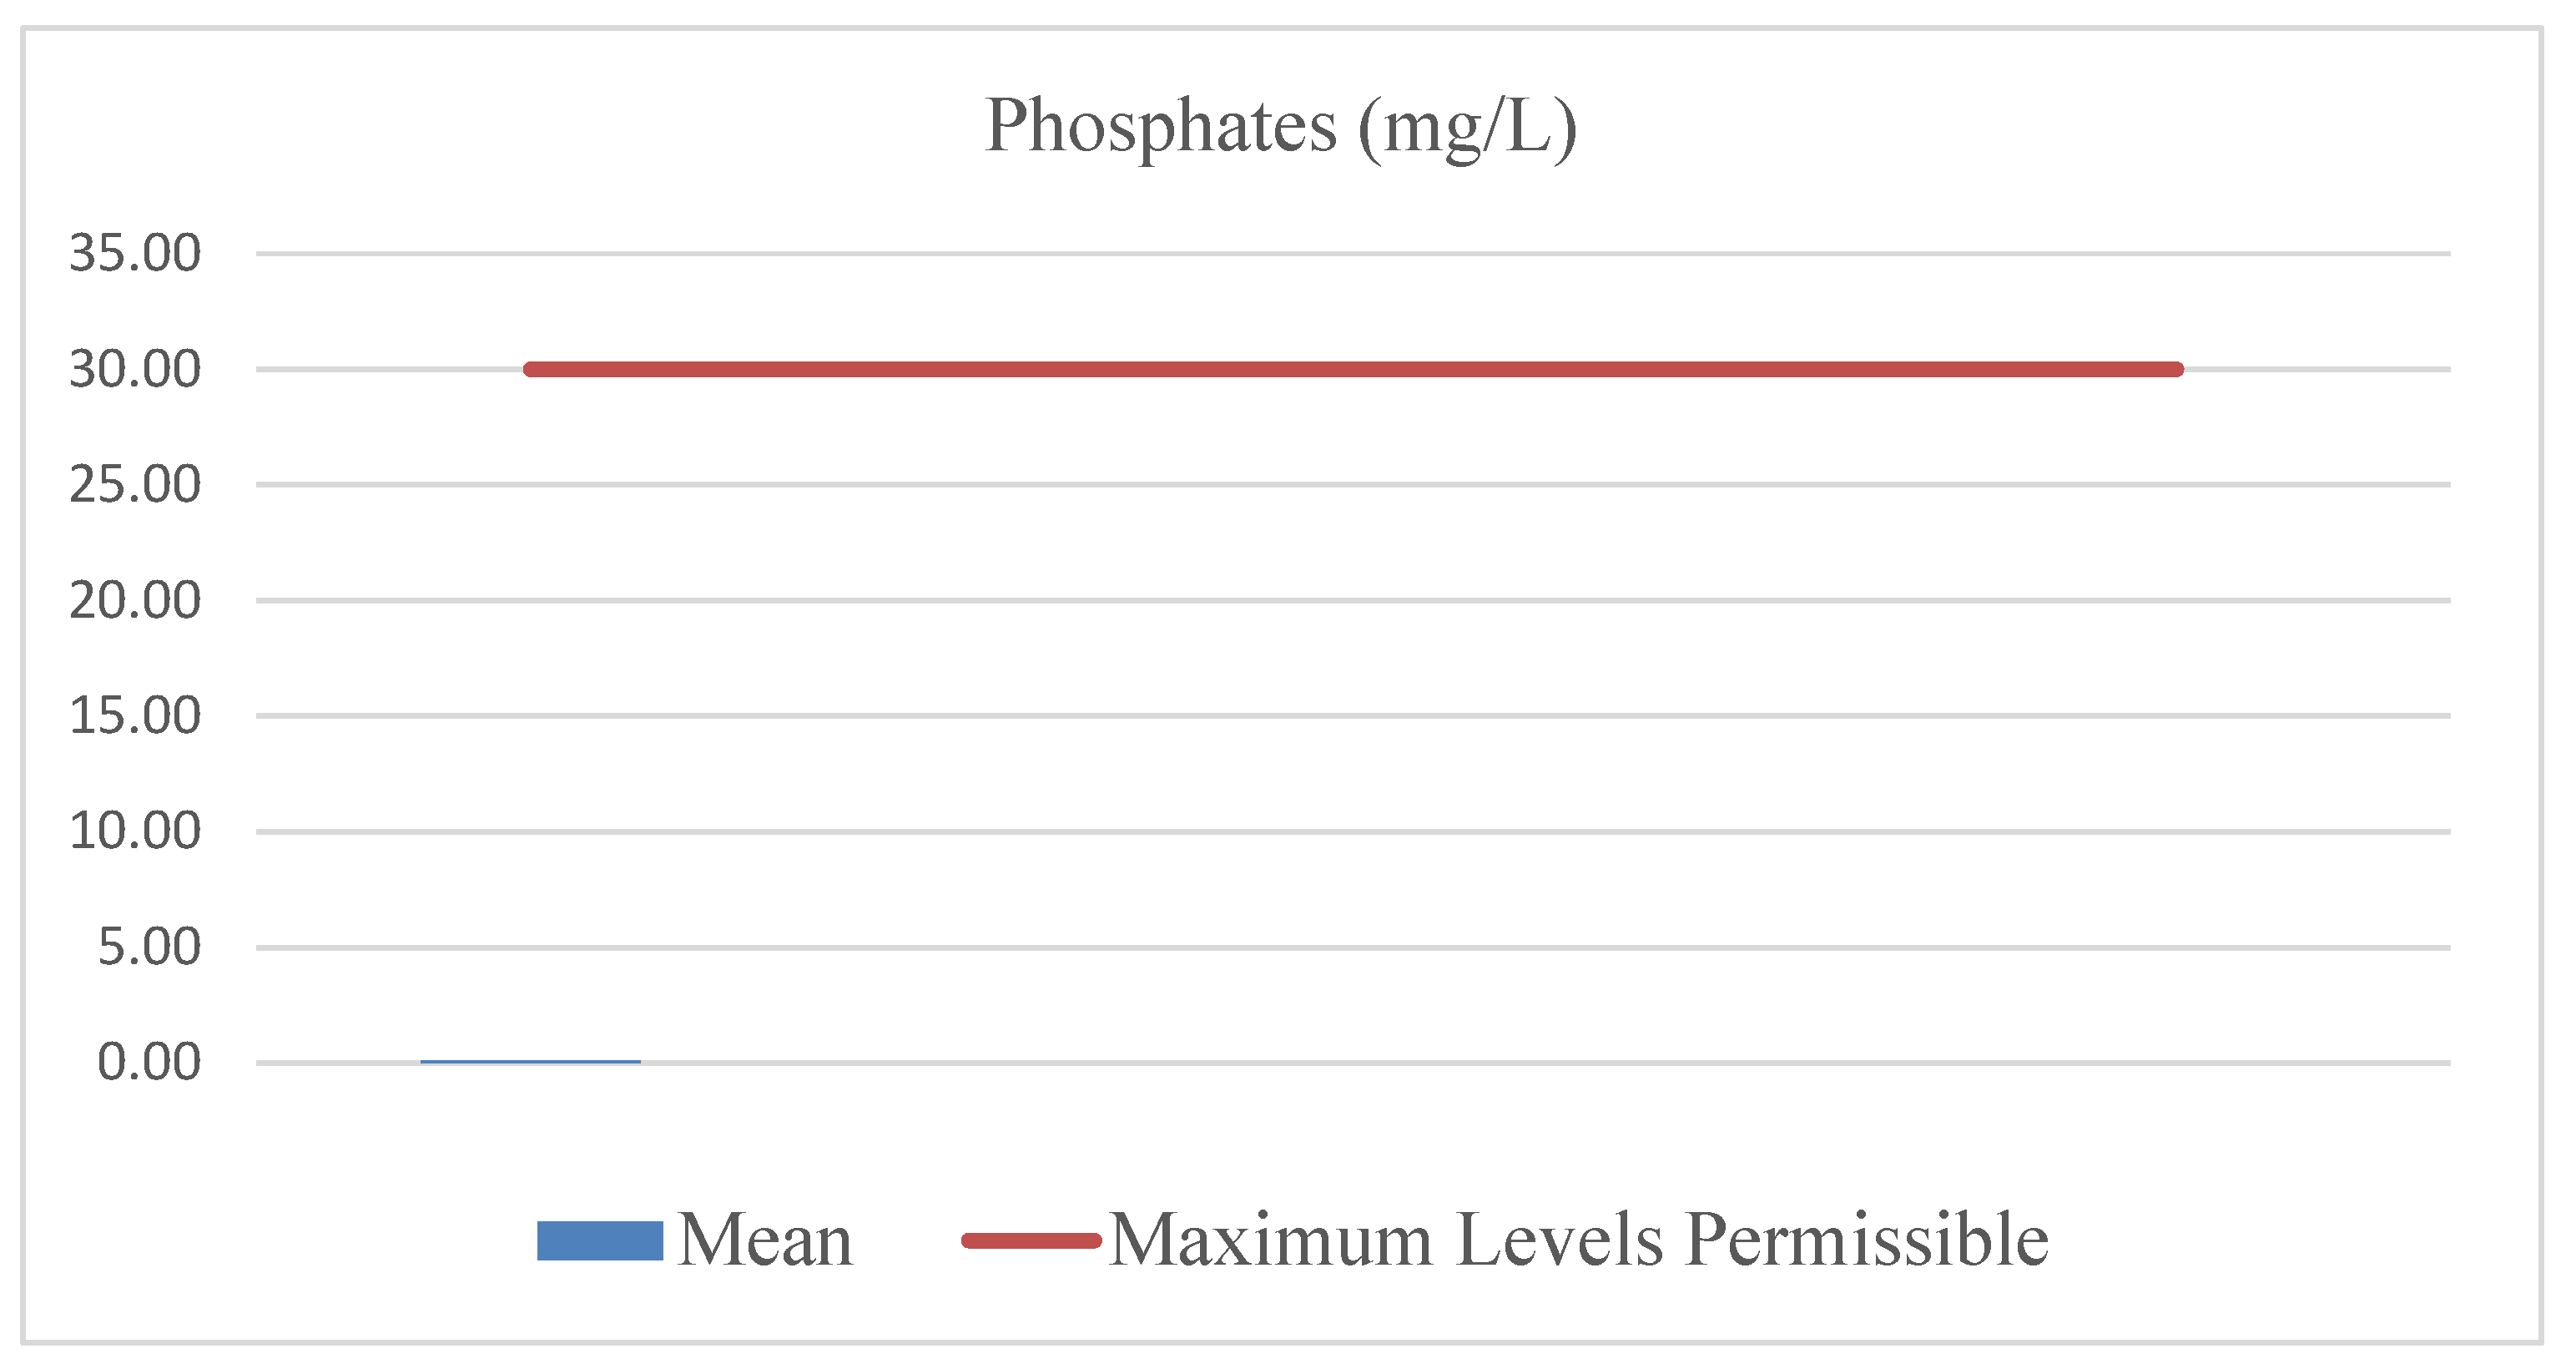
Phosphates
The mean concentration of Phosphates was 0.10 mg/L, a value significantly lower than the maximum permissible level of 30.00 mg/L. The chart visually confirms this success, highlighting the effective removal of a nutrient that can negatively impact aquatic ecosystems at high concentrations.
Figure 10.
Phosphate Results.
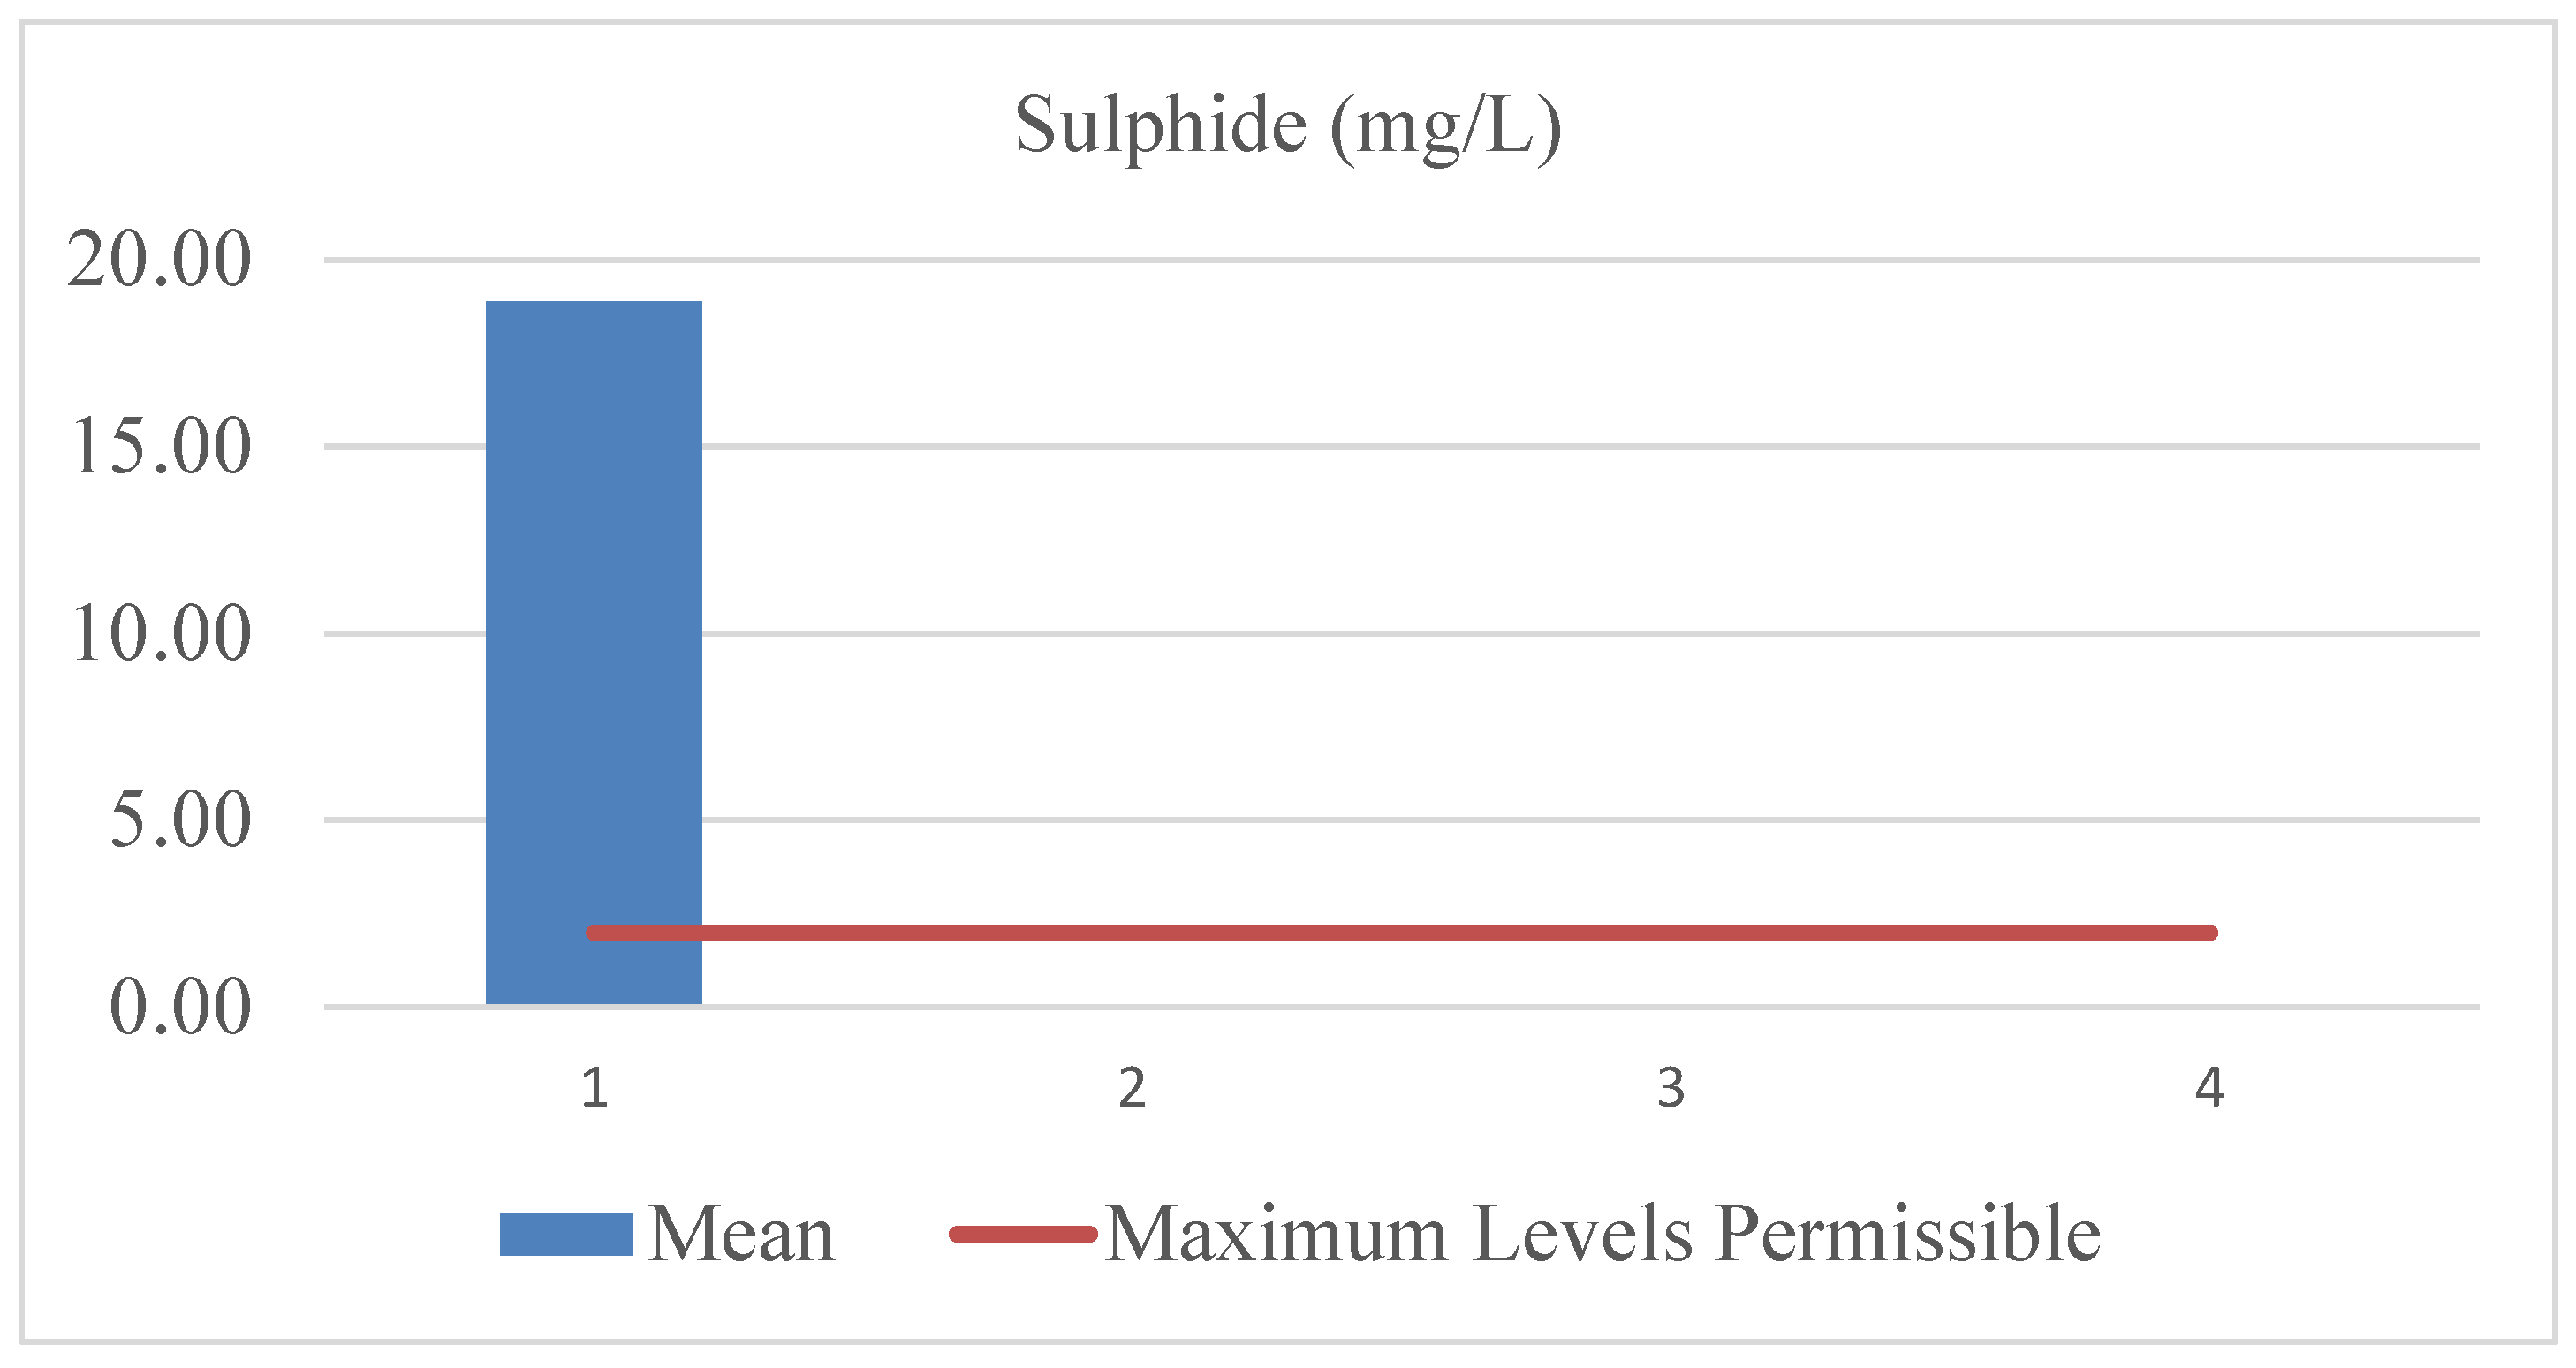
Sulphide
The analysis of Sulphide revealed a critical area of non-compliance. The mean concentration was found to be 18.88 mg/L, which is an order of magnitude higher than the maximum permissible level of 2.00 mg/L. The chart visually demonstrates this severe failure, indicating a consistent challenge in adequately treating this toxic pollutant.
Figure 11.
Sulphide Results.
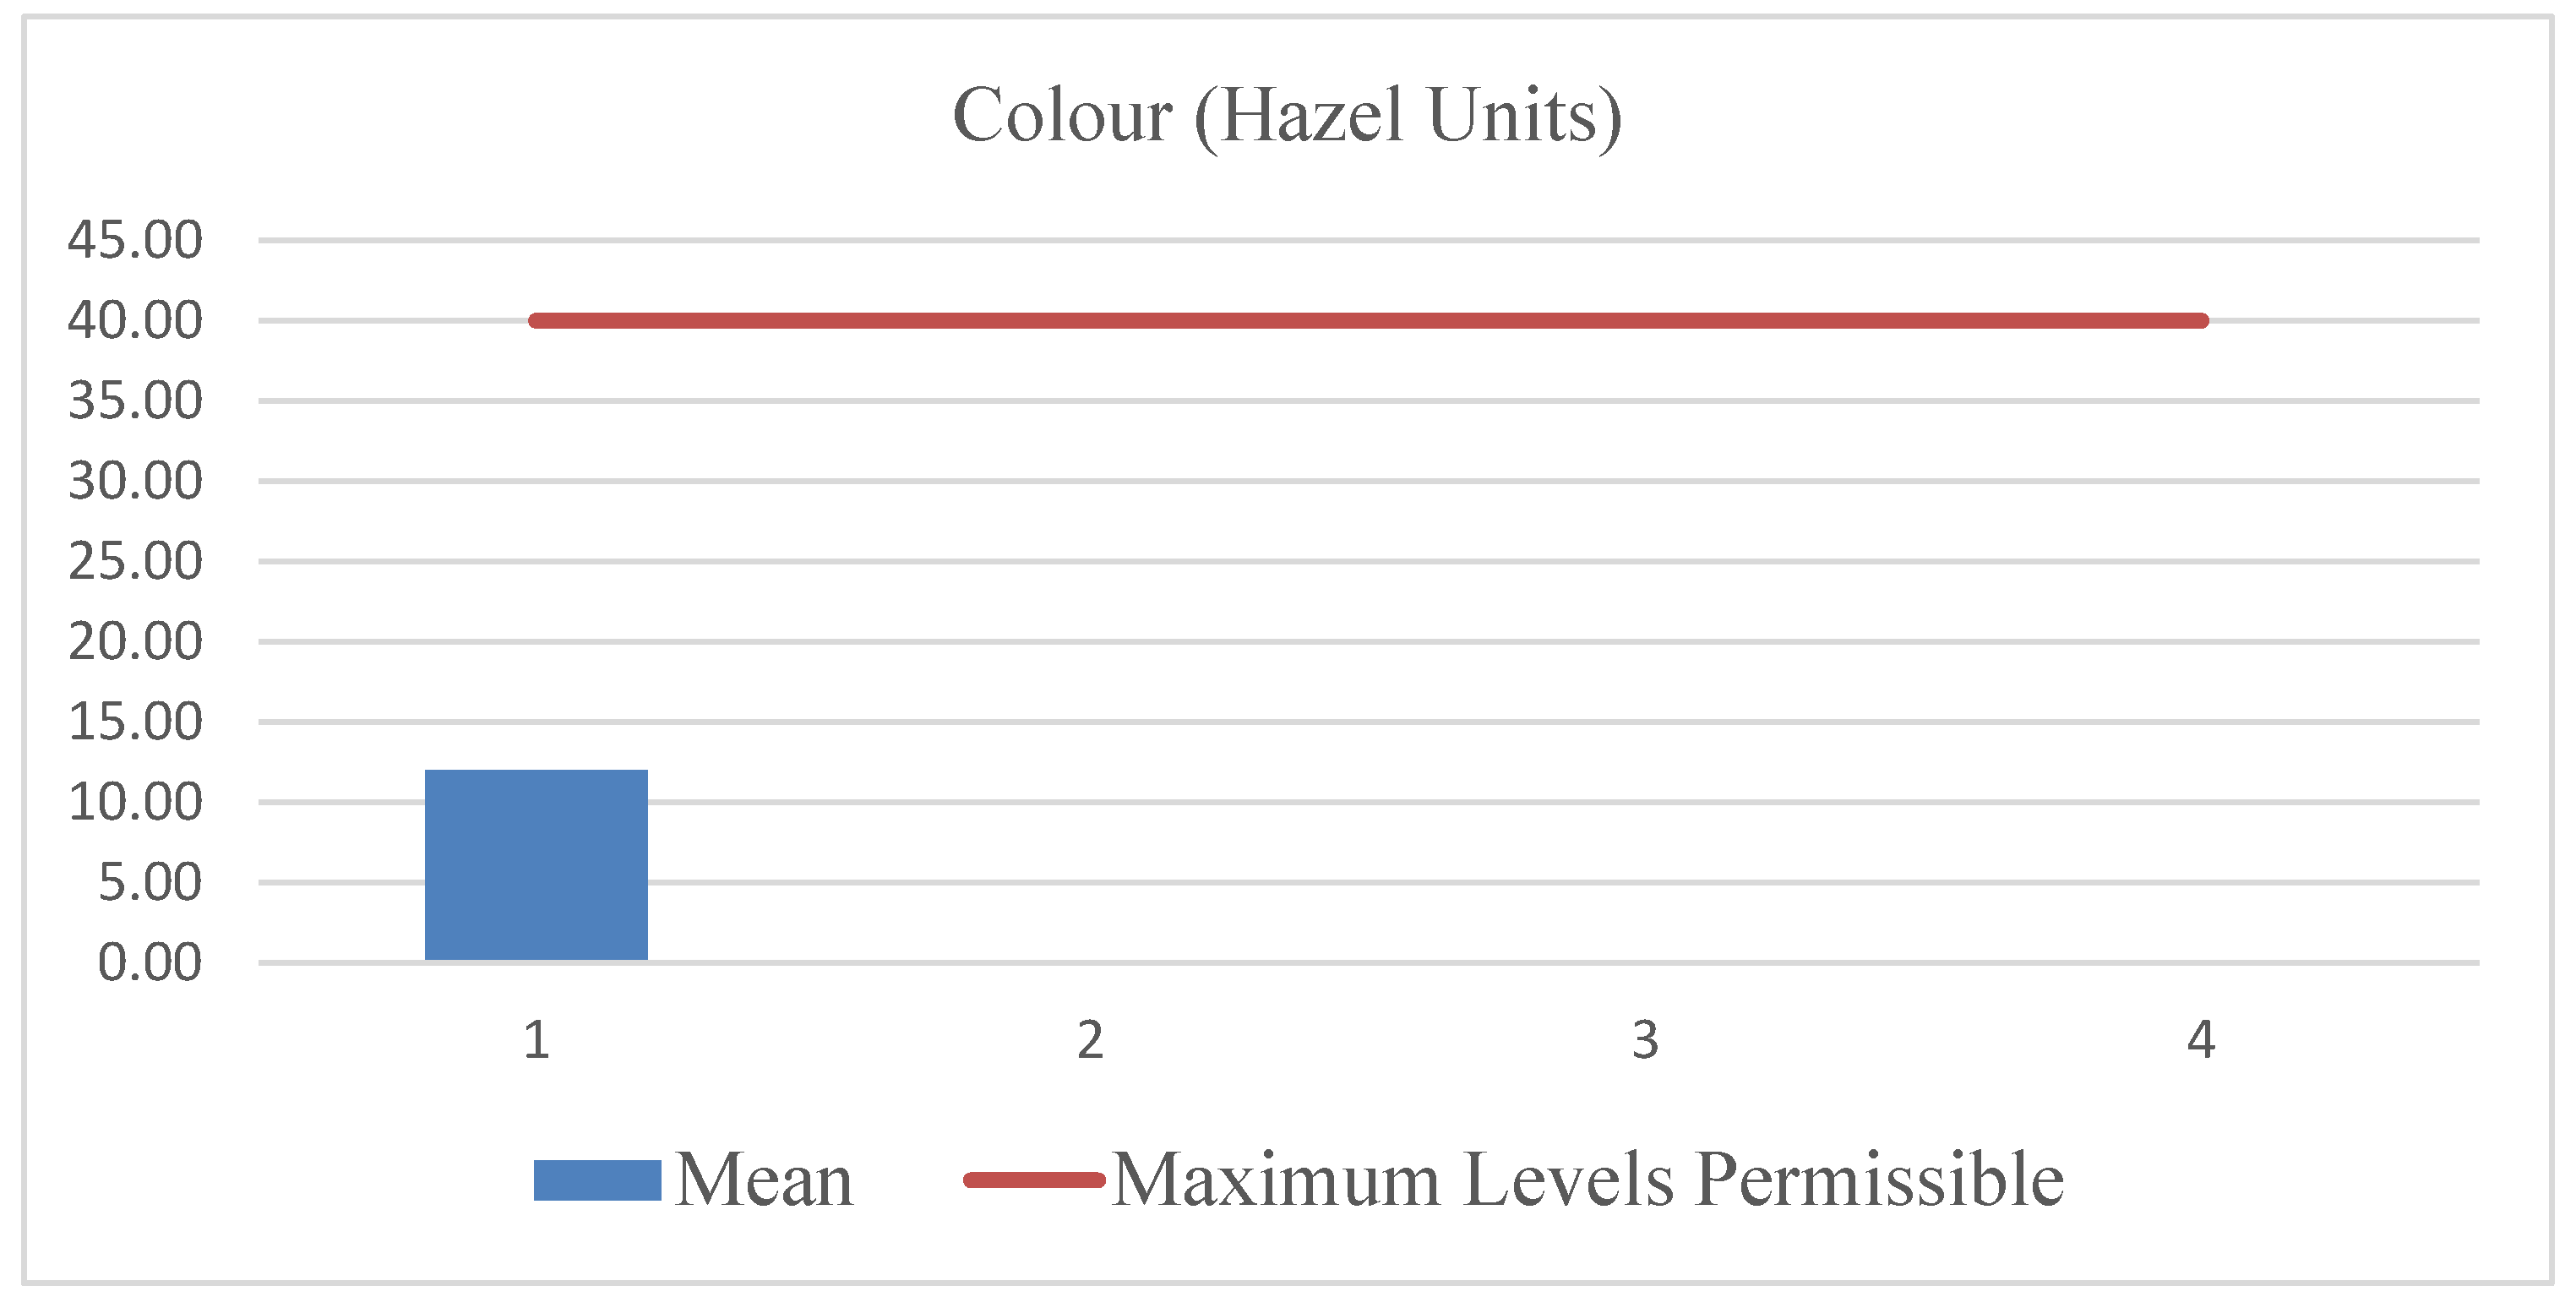
Colour
The mean colour of the treated effluent was 12.00 HU, which is well below the maximum permissible level of 40.00 HU. This finding, as represented in the chart, demonstrates that the treatment processes were, on average, effective in improving the aesthetic quality of the effluent before discharge.
Figure 12.
Color Results.
Conclusions
The leather industry remains a vital contributor to global and national economies, particularly through employment, exports, and industrial growth. However, the environmental challenges posed by tannery effluents—especially the presence of hazardous substances like chromium—underscore the urgent need for sustainable waste management practices. In Kenya, where the sector is still developing, the predominance of semi-processed leather exports limits economic potential while amplifying environmental burdens.
This study highlights the importance of monitoring effluent quality against established standards, such as those set by the National Environment Management Authority (NEMA). The findings not only reveal compliance gaps but also suggest the need to revise regulatory frameworks to include emerging pollutants like arsenic and lead, which are currently excluded from the Fourth Schedule. Strengthening these standards will be essential for safeguarding public health, protecting ecosystems, and enabling the leather industry to grow responsibly.
Ultimately, aligning industrial practices with environmental regulations will ensure that Kenya’s leather sector can thrive economically without compromising ecological integrity. This balance is key to unlocking the full potential of the industry while fostering long-term sustainability.
References
- Kipkemoi, I., G. K. Sitati and P. K. Gakai (2025). “Exploring the impact of sister city partnerships on emerging African cities.” Discover Cities 2(1): 1-17. [CrossRef]
- Oruko, R. O., J. N. Edokpayi, T. A. Msagati, N. T. Tavengwa, H. J. Ogola, G. Ijoma and J. O. Odiyo (2021). “Investigating the chromium status, heavy metal contamination, and ecological risk assessment via tannery waste disposal in sub-Saharan Africa (Kenya and South Africa).” Environmental Science and Pollution Research 28(31): 42135-42149. [CrossRef]
- Were, F. H., M. C. Moturi and G. A. Wafula (2014). “Chromium exposure and related health effects among tannery workers in Kenya.” Journal of Health and Pollution 4(7): 25-35. [CrossRef]
Disclaimer/Publisher’s Note: The statements, opinions and data contained in all publications are solely those of the individual author(s) and contributor(s) and not of MDPI and/or the editor(s). MDPI and/or the editor(s) disclaim responsibility for any injury to people or property resulting from any ideas, methods, instructions or products referred to in the content. |
© 2025 by the authors. Licensee MDPI, Basel, Switzerland. This article is an open access article distributed under the terms and conditions of the Creative Commons Attribution (CC BY) license (http://creativecommons.org/licenses/by/4.0/).
Copyright: This open access article is published under a Creative Commons CC BY 4.0 license, which permit the free download, distribution, and reuse, provided that the author and preprint are cited in any reuse.


