Submitted:
25 May 2025
Posted:
27 May 2025
You are already at the latest version
Abstract
The aim of the presented work was to determine the emission of malodorous pollutants into the air, as well as the emission of bioaerosol from potential emission sources of the selected Waste Management Plant / Municipal Waste Mechanical and Biological Processing Plant, and to determine the immission of pollutants and bioaerosol at sites located on the premises of the plant and in its vicinity. It should be clearly emphasized that this issue has been a significant challenge in recent years throughout the country and often raises social concern.The structure of the publication includes, in addition to the theoretical part describing the course of processes at the selected Plant, a practical part describing the course of research into the potential odour and microbiological impact together with a summary of their results, as well as indicating solutions for reducing the odour nuisance of the discussed Plant.
Keywords:
odors
; waste management
; model dispersion
; chromatography
; olfactometry
; microbiological tests
The concentrations of microorganisms in the air at the tested installation and in its vicinity showed considerable variation (Table 9). The concentrations of mould fungi in the mechanical waste treatment hall (station 1) and in the control outside the plant (station 5) were very similar. Emission of mould fungi. Emission from membrane-covered bioreactors in which municipal waste was composted was low (stations 2 and 3). The emission of mould fungi from containers for collecting waste from residents was even lower. The number of mould fungi at all the test stations was within the limits that the Team of Experts for Biological Factors considered acceptable for atmospheric air. The number of mould fungi in the sorting hall was lower than the permissible level in public and residential premises, even though this hall is a workroom with organic dust. According to the criteria of PN-89/Z-04111/03, withdrawn in 2015, the air at all research sites would be classified as averagely clean atmospheric air, especially in late spring and early autumn.
The highest concentration of mesophilic bacteria was found in the indoor air of the mechanical waste processing hall. This was a closed room where waste was screened. Emission from the bioreactor containing municipal waste in the late composting phase was moderate. The emission of mesophilic bacteria from containers for collecting waste from residents was slightly lower (site 6). The lowest concentration of mesophilic bacteria in the air was found at the control site (site 5). The number of mesophilic bacteria in the air of the sorting hall was lower than the concentrations proposed by the Biological Factors Expert Team for public and residential premises. However, this hall is a workroom with organic dust. At the other sites, the concentrations of mesophilic bacteria were acceptable according to the proposals developed by the Biological Factors Expert Team. These values allowed the air at these locations to be classified as unpolluted air, according to PN-89/Z-04111/02, withdrawn in 2015.
No mannitol-positive staphylococci were detected at any of the study sites. Mannitol-negative staphylococci were most numerous at the control site, so it can be concluded that waste processed in the tested installation did not constitute a significant source of their emissions into the air.
Bacteria from the family Enterobacteriaceaelactose-negative bacteria were most abundant in the indoor air of the mechanical waste processing hall. A comparison of their concentrations in the ambient air at the control station and in the air suspended directly above the waste indicates that although they could be present in the waste, the waste was not a significant source of their emission to the ambient air.
Variation in the concentration of staphylococci and bacteria from the family Enterobacteriaceae at individual stations indicated that a significant portion of these bacteria suspended in the air outside the plant originated from sources other than the waste treatment facility. The concentration of these bacteria was also negligible in the hall waste sorting plant. Some species of the Enterobacteriaceae family are pathogenic to humans and animals, but infection occurs through the alimentary tract. Therefore, the presence of a negligible number of them in the air does not pose a significant health risk.

Table 1.
Concentrations of microorganisms in the air in the area of the tested installation and its vicinity.
Table 1.
Concentrations of microorganisms in the air in the area of the tested installation and its vicinity.
| Group of microorganisms | Position | |||||
|---|---|---|---|---|---|---|
| 1 | 2 | 3 | 4 | 5 | 6 | |
| Number of j.t.k./m3 (mean and standard deviation) | ||||||
| Mould fungi | 1117±503 | 650±35 | 843±240 | 347±66 | 1012±315 | 900±243 |
| Mesophilic bacteria | 1287±467 | 387±140 | 608±181 | 332±147 | 258±137 | 443±225 |
| Staphylococci mannitol+ | 0±0 | 0±0 | 0±0 | 0±0 | 0±0 | 0±0 |
| Staphylococci mannitol- | 63±45 | 83±42 | 75±42 | 75±58 | 105±25 | 10±7 |
| Enterobacteriaceaelac+ | 38±10 | 7±5 | 2±2 | 18±13 | 12±9 | 2±2 |
| Enterobacteriaceaepour- | 0±0 | 0±0 | 0±0 | 2±2 | 0±0 | 0±0 |
| Group bacteria cola | 10±11 | 2±2 | 0±0 | 3±5 | 8±8 | 2±2 |
The concentrations of microorganisms emitted by the tested elements of the mechanical–biological waste treatment installation in Poland were similar to the concentrations found in the atmospheric air in the vicinity of the installation (immission). This indicates a small impact of this installation on the sanitary condition of the air and the origin of most of the airborne bioaerosol from other natural and anthropogenic sources. In the past, waste management facilities have caused a significant decrease in the microbiological quality of the air around them. Their long-term operation could have caused uniform microbiological contamination of the area around them[1]. The authors’ experience indicates that this currently happens less frequently and on a smaller scale. The probable cause is technological changes in waste management. The results obtained in this work indicate that the tested installation for mechanical–biological treatment of municipal waste is an example of the effectiveness of these changes.
However, waste is a source of bioaerosol emissions into the indoor air of waste management facilities and into the ambient air. Its concentrations vary significantly, depending on the distance from the emission sources, their type and nature, and many other factors, such as wind speed and direction [2,3]. Over 200 species have been identified at workstations in waste management plants. bacteria and fungi[4] [Szadkowska-Stańczyk 2007]. This indicates a large species diversity of this bioaerosol. One of the consequences of this diversity is also a significant differentiation of the indicators of the sanitary condition of air used in research. This makes it difficult to compare results and is a significant obstacle to developing generally accepted permissible concentrations of bioaerosol in atmospheric air and indoor air, taking into account their intended use. This also applies to the air surrounding installations in which waste management is carried out[5].
1. Introduction
Human economic and industrial activity is associated with the emission of odorous substances (odours). Odours are often natural and are not clearly defined as toxic or dangerous substances for humans, but their intensity can cause significant psychological discomfort in people living in a given area, i.e., they can cause odour nuisance.
The issue of odours is an important issue in cases of the potential impact of plants from various technological industries on the environment in Poland, as well as in other European Union countries[6]. It should be clearly emphasised that at present, the national legislation, despite many attempts to solve this problem, does not regulate the levels of odour impact and the volume of emissions of individual odorants, and consequently, the environmental standards related to odour emissions are not clearly defined[7].
Waste, its collection points, and the installations intended for its management are a source of malodorous gas emissions and microorganisms in the atmospheric air. The range of impact of large waste management plants on the sanitary condition of the air measured by bioaerosol concentration reaches over 1000 m in the case of unsegregated municipal waste landfills[8,9]. In the case of smaller installations and those using more modern waste management methods, this range is approximately 300 m[10].
It is believed that malodorous substances and bioaerosols emitted by waste management plants have a negative impact on the health of employees and residents of housing estates adjacent to such plants. However, an analysis of 49 reports from epidemiological studies on residents of housing estates adjacent to landfills and waste incinerators showed that, in most cases, there is no clear evidence of a causal relationship between increased morbidity and the proximity of a waste management plant[11]. However, the authors point out numerous limitations of the conducted studies related to insufficient exposure assessment, different levels of analysis, and a lack of information on significant confounding factors. In the case of waste management plant workers, a reduction in lung respiratory capacity and an increased presence of biochemical markers of inflammation and leukocytes in the blood were demonstrated[12], Heidal i wsp. 2003[13], Tehrani i wsp. 2024[14]].
It should be emphasised here that instrumental methods of measuring odorous air pollutants enjoy the greatest recognition in most scientific centres in Poland and around the world. These methods are based on the analysis of air using gas chromatography and multi-sensor devices with sensors selective for various air pollutants. Gas chromatography is an analytical technique used to separate and/or study the composition of mixtures of chemical compounds. This technique enables the determination of the percentage composition of mixtures of chemical compounds, of which there are even several hundred of them (including malodorous air). Depending on the detector used, gas chromatography enables the detection of any type of odorant, both organic and inorganic, even at the trace level. Measurement using the gas chromatography method is simple and fast and enables precise determination of the quality and quantity of odorants in malodorous air. Studies using the dynamic olfactometry method, on the other hand, only indicate the occurrence of odour nuisance (by determining its level), without identifying the type and concentration of malodorous substances in the air. Moreover, studies using gas chromatography are much more easily available because the number of laboratories performing studies using the dynamic olfactometry method is limited in Poland. The results obtained thanks to the use of gas chromatography as a research method in the assessment of odour impact allow for the control of the technological process and further reduction of odour nuisance at the source.
Potentially odorous installations are often simultaneously a source of bioaerosol emissions into the atmospheric air. Among the microorganisms adsorbed on them may be pathogenic and potentially pathogenic microorganisms for humans and animals bred by them. This group of installations includes, among others, waste management plants.
The presence of excessive numbers of certain microorganisms in the air can cause diseases in humans and animals and also cause material losses, e.g., due to the destruction of building materials and food. This problem arouses considerable emotions, especially among residents of housing estates adjacent to plants that are conducting waste management and sewage management and breeding significant numbers of animals. Despite this, the permissible numbers of microorganisms in the atmospheric air and in the air of rooms, other than clean rooms, are currently not specified in any legal or normative act. The standards that were used to classify the sanitary condition of ambient air, i.e., PN-89/Z-04111/02 and PN-89/Z-04111/03, were withdrawn without any consequences in August 2015. The currently applicable standards PN-EN ISO 14698-1:2004, PN-EN ISO 14698-2:2005, PN-EN 14583:2008, and PN-EN 13098:2007 specify selected aspects of the air sampling methodology but do not specify the permissible numbers of microorganisms in the air or the classes of microbiological air contamination. Permissible concentrations of microorganisms in clean rooms where drugs are manufactured are specified in the Regulation of the Minister of Health of 9 November 2015 on the requirements of Good Manufacturing Practice (Journal of Laws 2015.1979). In some other cases, they are specified in design guidelines. The only legal act specifying the permissibility of the occurrence of individual species of microorganisms in the air is the Regulation of the Minister of Health of 22 April 2005 on biological factors harmful to health in the work environment and the protection of the health of employees professionally exposed to these factors (Journal of Laws 2005.81.716). However, the provisions of this regulation do not apply to environments other than the work environment.
Therefore, the aim of the presented work was to determine the emission of malodorous pollutants into the air, as well as the emission of bioaerosols from potential emission sources of the selected waste management plant and municipal waste mechanical and biological processing plant, and to determine the immission of pollutants and bioaerosol at sites located on the premises of the plant and in its vicinity. It should be clearly emphasised that this issue has been a significant challenge in recent years throughout the country and often raises social concerns.
The structure of the publication includes, in addition to the theoretical part describing the course of processes at the selected plant, a practical part describing the course of research into the potential odour and microbiological impact together with a summary of their results, as well as indicating solutions for reducing the odour nuisance of the discussed plant.
An installation for mechanical–biological treatment of waste falls within the category of installations in waste management for non-hazardous waste, for recovery or a combination of recovery and disposal, with a treatment capacity of more than 75 tonnes per day, using biological treatment.
The installation can be carried out, depending on the needs, in two variants:
- Option I – mechanical–biological processing of mixed municipal waste.
- Option II – mechanical processing of waste from selective collection, marked with codes from subgroups 15 01 and 20 01.
Installation for mechanical–biological waste treatment consists of the following:
- Mechanical part – with a total processing capacity (three-shift operation) of 75,000.0 Mg/year, in which the following processes can be carried out:
- ◦
- Mechanical–biological processing of mixed municipal waste, marked with code 20 03 01 (option I), in the amount of up to 60,000.0 Mg/year.
- ◦
- Mechanical processing of waste from selective collection, marked with codes from subgroups 15 01 and 2001 (variant II), in quantities up to 15,000.0 Mg/year.
- Biological part – with a total processing capacity of 26,000.0 Mg/year, in which the biological processing of fractions of 0–80 mm in size (so-called sub-sieve fraction, marked with code 19 12 12) separated from mixed municipal waste is carried out (option I) in the amount of up to 26,000.0 Mg/year.
- Sieves with a mesh size of 20 mm with a total processing capacity of 8 Mg/h, in which the mechanical processing of the produced stabiliser is carried out in the amount of up to 20,800.0 Mg/ year.
There are potential sources of emissions of odorous substances and bioaerosols within the installation area:
- Mechanical waste processing hall – mixed municipal waste and selectively collected waste brought to the plant are stored in the hall. They are then sieved to prepare them for the biological process. The sources of odorant and bioaerosol emissions are the boxes with stored waste and the sieved waste. During sieving, dust, which contains micro-fragments of waste, is also emitted.
- Green waste collection point – green waste, partly in plastic bags, is located in boxes in the storage yard and in the form of a heap outside the boxes. Low frequency of green waste delivery and collection and storage in conditions of limited access to air (in plastic bags) favours putrefactive processes, including the emission of hydrogen sulphide, mercaptans, but above all ammonia, characteristic of these processes occurring in green waste and bioaerosols.
- Bioreactors – the composting process is carried out in them. Increased emission of odours and bioaerosol may accompany filling bioreactors with waste and, to a lesser extent, emptying bioreactors of composted waste, especially if the process is carried out incorrectly.
- Entrance square to the mechanical waste processing hall – a clearly noticeable concentration of odorous gases is associated with the heavy traffic of vehicles transporting waste. Leachates are released from this waste, which can mix with rainwater on rainy days, causing increased emissions of odours on sunny days.
2. Materials and Methods MAT
Research Sites
The research was carried out in the plant’s sorting hall, at the green waste reception site, at the bioreactors in the initial phase of the process and in its final phase, at the waste gazebo located outside the plant. An additional point as a background was located on the southwestern side outside the plant, approximately 200 m from its border.
Odorant and bioaerosol samples were collected once in April 2016 at the following research sites (Figure 1):
- Immissions inside the sorting hall – 1.3 m above the floor level (station 1).
- Bioaerosol emissions from a pile of green waste (0.5 m above the waste) intended for composting before unpacking the plastic bags (station 2).
- Emissions from a bioreactor covered with a membrane (0.5 m above the membrane) filled with municipal waste in the initial phase (station 3).
- Emissions from a membrane-covered bioreactor (0.5 m above the membrane) filled with municipal waste in the late phase (station 4).
- Control on the windward side of the plant: immission at a height of 1.3 m above the lawn located between the car park at a distance of approximately 200 m from the plant boundary (station 5).
- Emissions from waste collection containers from residents located in a box approximately 620 m from the plant boundary (station 6)
Table 2 presents the test results of olfactometric measurements carried out using an accredited method in accordance with the PN-EN 13725 standard.
The highest odour concentration in the air was found in the sorting hall, which is normal because odours accumulate in a closed building. It is worth noting the relatively low concentration of odours in the charged air flowing from the bioreactors and the green waste collection point, where the ammonia concentration exceeded the level of 4000 μg/m3, which with medium SpWW for ammonia at 5.2 ppm[15] gives a significantly higher level of odour units in the air than the one measured currently in 2017. In the authors’ opinion, the application of a technical procedure consisting of covering the waste and successive neutralisation of the leachates in the form of sand filling and sand removal significantly reduces the odour impact of the waste pile. In turn, the odour concentration at the level of 410.5 OUE/m3 clearly indicates a correctly conducted waste composting process and an effective method of reducing odour emissions. Table 1 presents the average concentration of odours generated in biological waste treatment processes. The table differentiates the type of compounds and odour concentration depending on the composting phase. The concentration of odours varies in a wide range from 150 to 25,0000 oug/m3. In turn, the determined concentration of odours at the waste composting site was 410.5 OUE/m3, which is within the lower limits of this range, which additionally confirms the effectiveness of the deodorisation techniques used at the plant.
It should also be noted that the odour concentration at the waste sorting hall gate was significantly lower, at 94.5 OUE/m3.
3. Results
For the operating plant, an analysis of the spread of malodorous compounds in the air was carried out. Only substances that showed different levels of concentration in the air in chromatographic studies were included in the modelling, i.e., ammonia, acetone and mercaptans. Due to the fact that all mercaptans have a very similar odour threshold, these compounds were presented in the modelling under the general namemercaptans. These compounds are odorous substances characteristic of the municipal waste and green waste treatment sector. Due to the fact that the model is very simplified–the differential Pasquille equation–and it does not take into account, for example, the topography of the terrain, the presence of buffering green belts or development, the modelling was performed separately for each source of malodorous substance emissions on the plant premises, on a scale of 1:2000 and for the entire area potentially exposed to emissions, taking into account all emission sources (scale 1:5000).
The calculation methodology uses a universal tool that allows for the analysis of the spread of pollutants in atmospheric air emitted from single emitters or a group of point, linear or surface emitters. It is based on a model consistent with the reference methodology described in the Regulation of the Minister of Environment of 26 January 2010 on the reference values for certain substances in the air, and draws its foundations from calculations for the Gaussian model of the “pollution plume”, shaped by wind and diffusion processes, and the dependence of the pollutant concentration at point P(x,y,z) of the plume (cod,xyz), depends on the following:
- qod – emission stream; [kg/h]
- ū – average wind speed in the air layer from z = 0 do z = H; [m/s]
- H – height of the apparent emission point; [m] (in the figure – He, effective height x=0)
- m – meteorological exponent
- z0 – aerodynamic surface roughness parameter, “surface roughness”; [m]
- σz i σy – atmospheric diffusion coefficients (dependence of σ on miz0describe empirical equations).
The results were visualised as a distribution of concentration isolines on maps for maximum concentration values, as all emission factors were calculated for the situation on the day of sampling, i.e., instantaneous emission, in order to compare the modelling results with the measurements of malodorous compound concentrations determined using the chromatographic method.
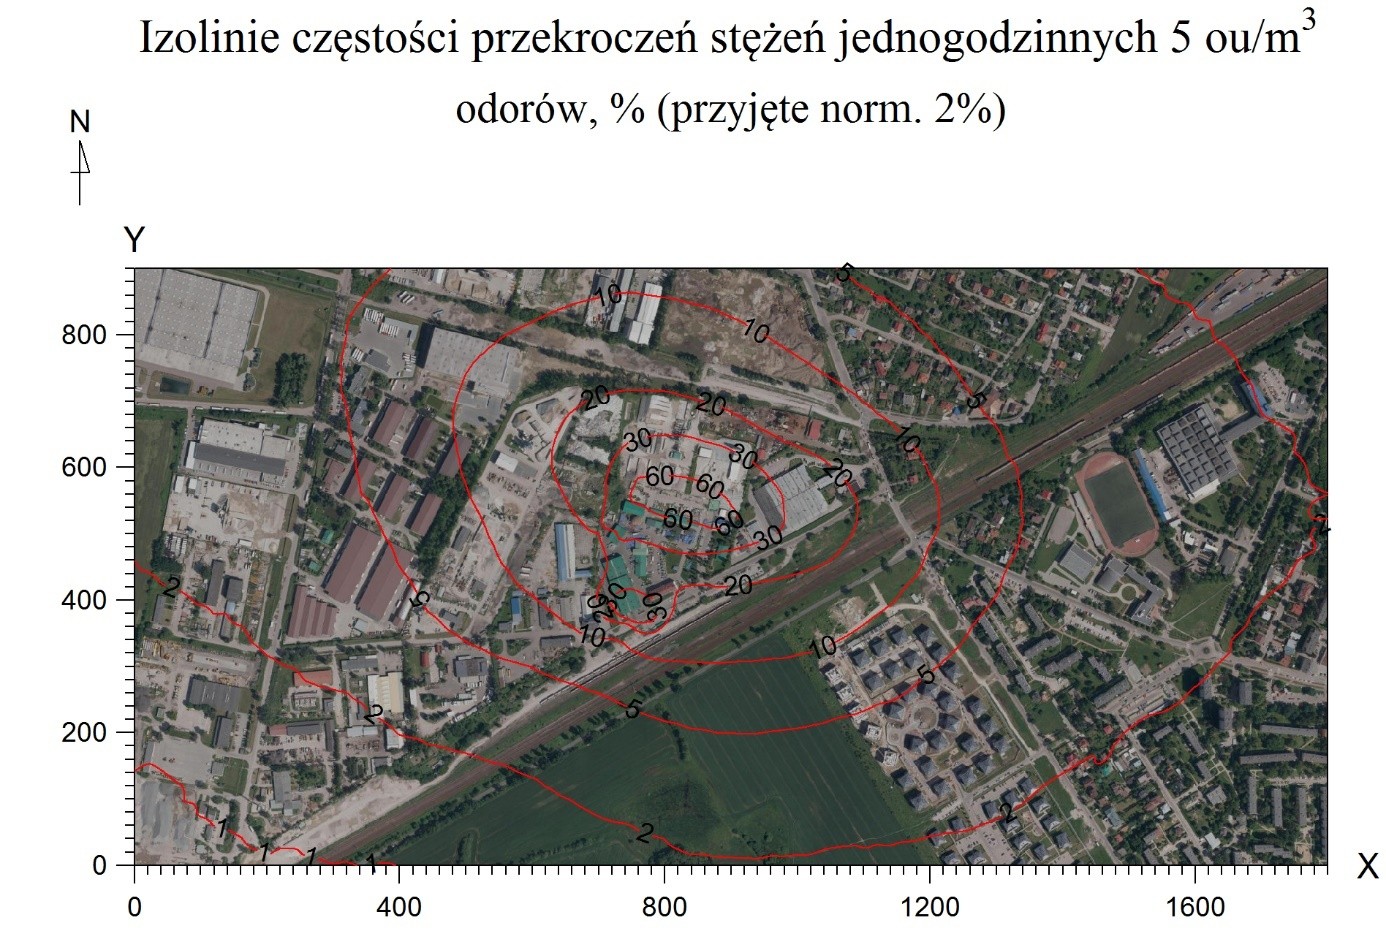
Figure 2 shows the frequency of exceedances of one-hour concentrations of 5ou/m3. Due to the fact that currently, in Poland, there is no law regulating the concentration of odours in the air, an approximate value was adopted from values used in other countries. The permissible frequency of exceedances was adopted based on[16] according to Dutch guidelines, which is equal to 2%.
Modelling studies show that the buildings located closest to the installation may be exposed to an increased frequency of exceedances of one-hour concentrations of 50 u/m3, amounting to <2%. However, as indicated above, model studies that do not take into account regional and local climatic and orographic conditions indicate overestimated odour perception values. Therefore, in the opinion of the authors of the publication, residents of nearby buildings should not be exposed to odours from the analysed installation, or if such exposure occurs, it is felt to a small extent and incidentally. This is confirmed by Figure 3 and Figure 4. Figure 3 presents potential areas of exposure to odours as a result of the operation of the plant estimated based on model studies, while Figure 4 presents actual areas of exposure to odours estimated based on the results of field studies using the extrapolation method.
This confirms the authors’ thesis that the estimation of odour spread using the model method is slightly overstated in comparison to accredited field studies. In the case of model studies, the entire area of the northeastern vicinity of the plant and the nearby housing estate may be exposed to incidental odour sensations (<5%, >2% frequency of exceedances).
In turn, the results of field studies clearly narrow down these areas (Table 1). Only a part of the housing estate in the vicinity of the plant is exposed to incidental odour sensations resulting from the plant’s activity. However, the actual area of odour sensation is limited to the immediate vicinity of the plant in the industrial zone, not including residential areas. It should also be noted that field studies may indicate the accumulation of odours originating from the industrial zone 0, not only from the area of the analysed substance. Moreover, an unnatural increase in odour concentrations was noted in the vicinity of the plant (with a simultaneous decrease in odour concentrations with distance from the plant), which may indicate the influence of other sources of odours (e.g., agriculture).
Chromatographic Studies
The sampling of malodorous compounds was performed using the aspiration method (Figure 5, Figure 6, Figure 7, Figure 8 and Figure 9). The principle of the aspiration method is to pass a known volume of tested air through appropriately selected liquid or solid absorbing substances called sorbents. A different sorbent is used depending on the type of pollutant being tested. Sets of series-connected scrubbers with a sorbing solution were used to measure the concentrations of ammonia and hydrogen sulphide. For mercaptans and PAHs, the sorbent is activated carbon in a glass tube. The air sucked in by the aspirators is combined with the sorbent (solution in scrubbers or activated carbon in glass tubes) as a result of physical phenomena and chemical reactions. After the sampling was completed, the scrubbers and tubes with carbon were sent to the Laboratory for further analysis. The volume of air passed through was recorded. Based on the result of the test of the substance concentration in the sorbent and the volume of air passed through, the concentration of the substance in the air was determined. The volume of air that is passed through must be large enough for the substance being determined to be released in an amount that exceeds the detection limit (sensitivity) of the quantitative determination method used. In the case of low concentrations, even air sampling lasting several hours may be insufficient to reach the detection threshold.
Samples with sorbents were determined using gas chromatography or colorimetric methods as follows:
- Ammonia NH3 – CFA (Continuous Flow Analysis) method with spectrophotometric detection. This is a continuous method with stream segmentation. Samples are introduced into the pipes in the form of regular air bubbles for the purpose of analyte dispersion. This allows for obtaining the best efficiency of determinations (short determination time)[17].
- Hydrogen sulphide H2S – colorimetric method on an EPOLL 20 spectrophotometric apparatus. This method involves a simple determination of the concentration of coloured solutions by means of a visual comparison of the colour intensity of the tested solution with the colour intensity of the standard.
- PAHs – by gas chromatography with mass detection (GC-MS). This method involves introducing gas into the chromatograph and forcing it through the sorbent. The GC technique enables the determination of the percentage composition of mixtures of chemical compounds, of which there are even several hundred of them. Additionally, the chromatograph is equipped with a mass spectrometer (gas chromatography-mass spectrometry, GC-MS), as a detector, which determines the concentration of individual substances based on the measurement of the mass-to-electric charge ratio of a given ion.
- Mercaptans – gas chromatography method with mass detection (GC-MS);
- Acetone – by gas chromatography with flame ionisation detection (GC-FID). This method differs from GC-MS only in the type of detector. In this method, the detector operates by ionising (decomposing into ions) molecules in a flame and recording changes in potential. The basic element of this detector is a flame. The flame is surrounded by a collecting electrode.
Microbiological Tests
Bioaerosol was collected by the impact method onto agarified microbiological substrates in Petri dishes with a diameter of 90 mm (Figure 10).
Using a Duo SAS Super 360 air sampler with two heads with 219 holes, bioaerosol was collected from 200 dm3 in 2 minutes. Microorganisms were incubated in conditions appropriate for each group (Table 3). After incubation, colonies of microorganisms growing on the media were counted, considering the correction recommended by the sampler manufacturer. All samples were taken in triplicate. The results were given as the number of colony-forming units per unit of air volume (1 m3) using the arithmetic mean for three repetitions and standard deviation.
The criteria for selecting the groups of microorganisms included in the study were as follows: the specificity of the study object, recommendations PN-89/Z-04111/02 and PN-89/Z-04111/03, and the Team of Experts for Biological Factors[18].
The assessment of the sanitary condition of the air was carried out based on the criteria withdrawn without consequences in 2015, PN-89/Z-04111/02 and PN-89/Z-04111/03, as well as the criteria proposed by the Team of Experts for Biological Factors[19] (Table 3, Table 4, Table 5 and Table 6).
The results are discussed later in the publication.
4. Research Results and Their Discussion
Studies on the Concentration of Malodorous Compounds
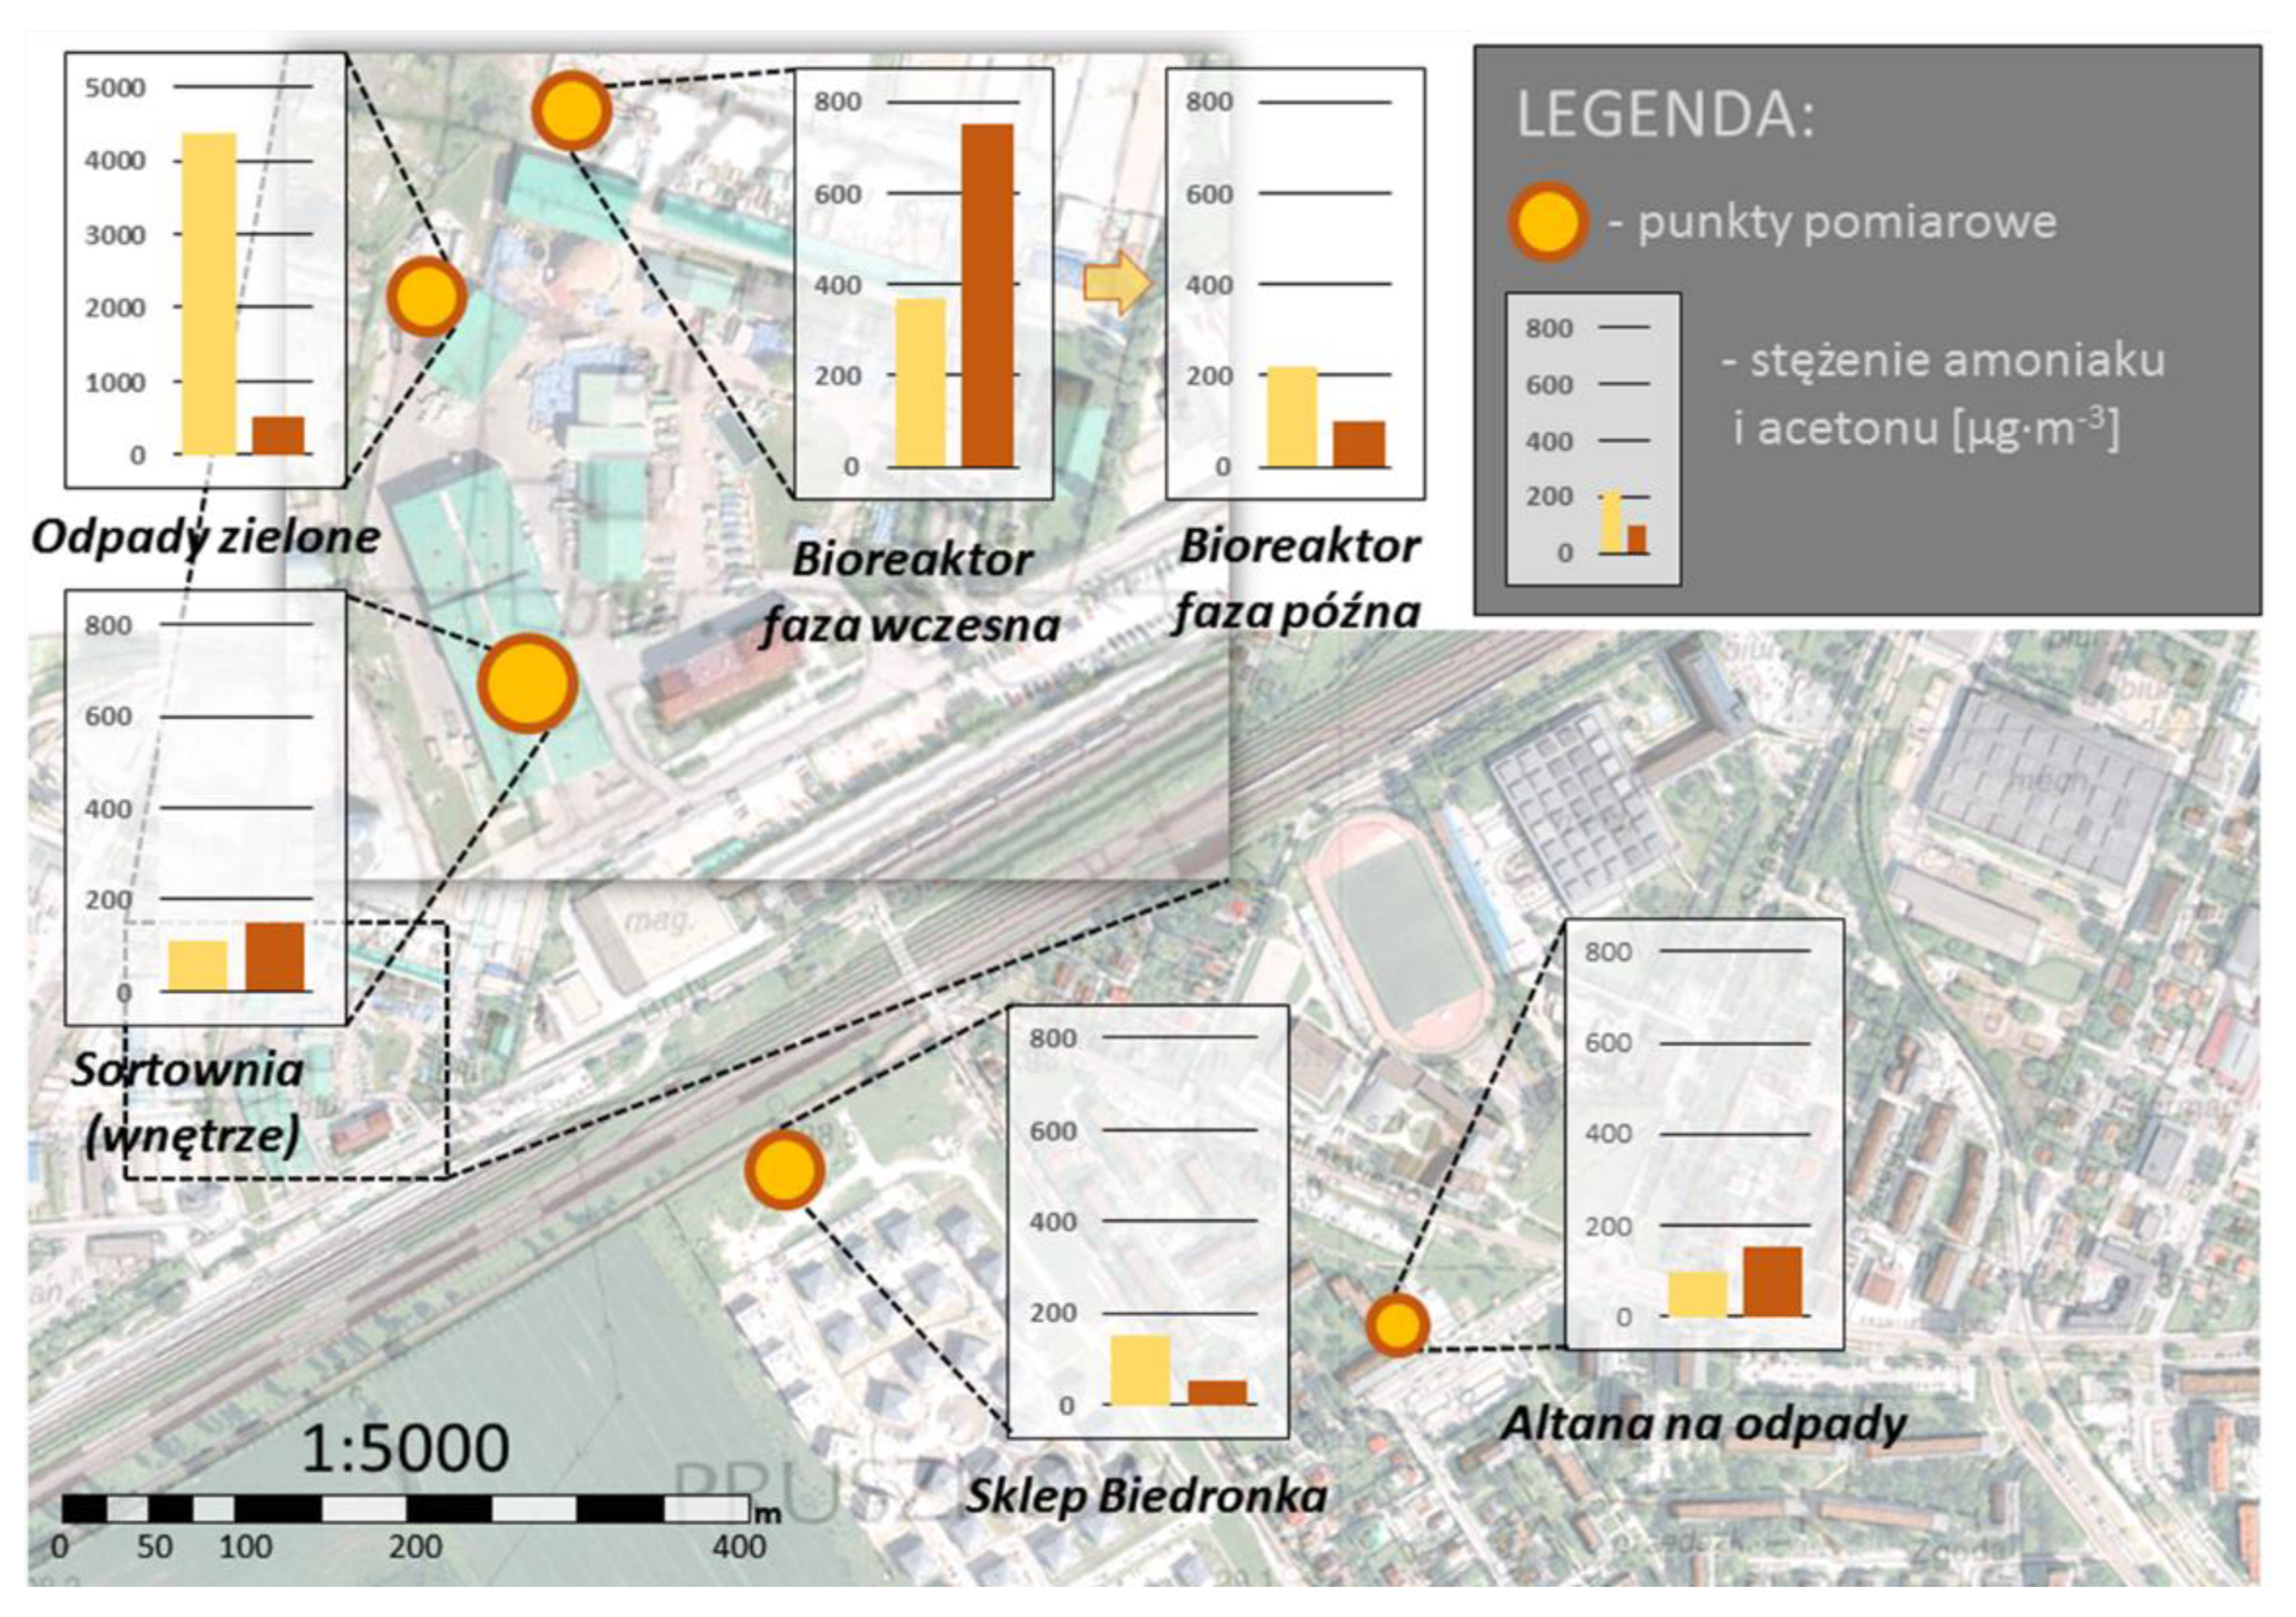
The results of chromatographic studies clearly indicate the differentiation of the concentrations of malodorous substances (especially ammonia and acetone), depending on the place of collection, i.e., the type of process carried out. Table 7 presents the results of the conducted studies. Detailed data are included in the appendix to this publication.
The highest concentration of ammonia was observed at the green waste collection site. The ammonia concentration at this site was 4380 μg/m3air. Much lower concentrations of NH3 were observed in the bioreactors area (220 μg/m3 in the late phase up to 370 μg/m3 in the early phase). The concentration of ammonia in the sorting hall was lower than in the case of the waste arbour. At the same time, it should be noted that the containers in the arbour were only slightly full (10–20%), which could have significantly influenced the underestimation of the obtained results.
The concentration of hydrogen sulphide and PAH (sum) did not exceed the limit of quantification, so it can be assumed that it was insignificant. In the case of the mercaptans (ethyl and butyl), differences in concentrations were observed only in the case of the green waste storage site and in the place where the process was carried out in the early phase in the bioreactor. The concentrations of compounds in the green waste storage site were for ethyl and butyl mercaptan, respectively 0.95 μg/m3 and 0.8 μg/m3, while over the bioreactor in the early phase: 0.25 μg/m3 and 0.22 μg/m3.
Significant variation in acetone concentration was also observed in the analysed installation. The highest acetone concentration was recorded in the bioreactor in the early phase (750 μg/m3) and at the place of storage and processing of green waste (520 μg/m3). In addition, the concentration of acetone in the sorting hall was the same as in the waste arbour and was 150 μg/m3. In turn, the acetone concentration at the bioreactor site in the late phase was 100 μg/m3.
Figure 11, Figure 12 and Figure 13 present the visualisation of ammonia and acetone concentrations in the analysed space.
Nevertheless, in the opinion of the authors of the study, the modelling studies confirm the reliability of the emission analyses conducted using the chromatographic method. The results of both studies in the case of the emission of malodorous compounds from the green waste pile are consistent with each other.
The results of the chromatographic studies indicate that the greatest impact on the air quality at the installation (and indirectly within it) is the collection of green waste. This is confirmed by the highest concentrations of ammonia and acetone in the air.
Table 8 presents the odour detection thresholds of the analysed substances according to various literature data. In the case of ammonia, the most probable value would be the odour detection threshold given by Szynkowska et al. (5750 μg/m3) because the remaining ones are much lower or close to the value specified in the Regulation of the Minister of the Environment of 26 January 2010 on the reference values for certain substances in the air (Journal of Laws 2010.16.87 of 2010.02.03). However, in the authors’ opinion, the concentration of ammonia within the green waste pile was very high, and the smell of ammonia was clearly noticeable.
In the case of hydrogen sulphide, all concentrations were below the limit of quantification. Therefore, it is impossible to clearly determine whether these concentrations were at the threshold of odour detection or were much lower. Nevertheless, in no case did the authors’ team clearly detect the odour of hydrogen sulphide.
Figure 14.
Spatial variation of ammonia and acetone concentration in the air.
In the case of mercaptan concentrations, only within the green waste pile did these concentrations approach the specific detection thresholds and their average, and it should be assumed that, in this case, these substances had a significant impact on the sense of smell within the research site.
It should also be noted that the perception of odours is a subjective experience. Moreover, the overlap of many substances in the air can modify these sensations.
Special attention should also be paid to the concentrations of ammonia and acetone in the garbage shed. These concentrations were at a similar level to those observed in the mechanical waste processing hall, even though the garbage containers were not significantly full. Therefore, it should be stated that the garbage collected in containers in the sheds in residential estates may have a very significant impact on the perception of odours (especially on warm and sunny days). This is also confirmed by the results of modelling the spread of pollutants in the air.
Modelling the Spread of Odours in the Air
The results of the spread of malodorous compounds in the air (acetone, ammonia and mercaptans) largely coincide with the results of the concentrations of pollutants in the air analysed using the chromatographic method.
The results of modelling the spread of odorous compounds in the air for bioreactors showed differences, especially with respect to acetone and mercaptans. In the case of acetone, the maximum concentration in the modelling studies was only 98.4 μg/m3, while the maximum acetone concentration measured in the bioreactors was 100–750 μg/m3. In the authors’ opinion, such high concentrations of acetone were not caused by emissions related to the waste composting process but were related to the use of other preparations applied to the air during the tests. In the safety data sheets of these preparations, acetone is not listed as a carrier of odorous substances. However, in the authors’ opinion, during the application of the solution, conditions most likely occur that are conducive to the formation of this compound, the explanation of which requires detailed chemical tests. The maximum concentration of ammonia in the model tests was 117.4 μg/m3, while emission tests indicated an ammonia concentration ranging from 220 μg/m3 up to 370 μg/m3. It should be noted that such small differences could result from two factors: the height of the measurements (directly above the heap) and the possibility of overlapping ammonia concentrations from additional emission sources (e.g., green waste or the sorting hall). In the case of mercaptans, the maximum concentration of these compounds in the air in the model tests was 8.35 μg/m3 (Figure 6). However, chromatographic studies indicated concentrations much lower at <0.20 μg/m3 up to 0.25 μg/m3. In the authors’ opinion, the assumed 90% efficiency of reducing mercaptan emissions for membranes is too low, and the conducted field studies indicate 99% efficiency of reducing mercaptan emissions by the membranes used in bioreactors.
The results of the model tests carried out for the sorting hall are consistent with the results of the field tests conducted at the installation. The concentration of ammonia within the sorting hall in the model tests was at a level of 40 μg/m3 up to 129.8 μg/m3. The concentration of ammonia determined during the tests was 110 μg/m3 in the case of acetone. The concentration of this compound in the air determined during the tests was 110 μg/m3. Modelling studies indicated very similar concentrations at this location at 40–80 μg/m3. The concentration of mercaptans determined in modelling studies at the sorting hall was <0.3 μg/m3. The concentrations of these compounds in field studies were at the level of 0.20 μg/m3.
Modelling that takes into account the accumulation of all sources on the plant premises, but also outside the plant, indicates a very significant impact of other emission sources on the air quality in the area located in the immediate vicinity of the plant. Despite the assumption of very low emission rates from municipal waste sheds on the estate, the emission of malodorous compounds from these places is significant. The results of modelling the spread of ammonia within the southwestern boundaries of the plant indicate a very high share of the total maximum concentration of emission sources, which are waste sheds. Moreover, it should be noted that only waste sheds on the estate were included in the modelling. However, the impact of other emission sources was not taken into account. At the reference point, where the background (shop) was studied, the ammonia concentration was 150 μg/m3. Modelling results indicate that the ammonia concentration in this region is approximately 50 μg/m3. Therefore, in the authors’ opinion, there are additional sources of ammonia emissions in this region. During the measurements, the authors of the study drew attention to unfavourable emission conditions created in the neighbouring fields. Namely, local waterlogging occurred in this place, and there was corn stubble on the arable land. These conditions were conducive to the rotting of crop residues and could cause additional ammonia emissions in this region, which seems highly probable because, on the day of the measurements (06–07 September 2016), there was high sunshine and high temperature.
The concentration of acetone at the reference point matched the concentration of this compound determined from the modelling. The concentration from the measurements was below 50 μg/m3, while the concentration of acetone at this location, determined by the modelling method, was in the range of 40–50 μg/m3. This indicates a lack of additional sources of emission of this compound into the air in the close vicinity of the installation. However, it is important to note the relatively high momentary concentrations of acetone in the area of waste sheds in the housing estate. In the authors’ opinion, such high momentary concentrations of acetone can occur in these places, and a distinct sweetish smell of waste is often felt in such places.
The concentration of mercaptans measured at the reference point during the field studies was below the limit of quantification <0.20 μg/m3. However, the concentration modelled at this location oscillated around 0.6–0.7 μg/m3 and was significantly higher. The reason for such discrepancies was most likely the incorrect assumption of membrane efficiency at the level of 90% of reducing the emission of these compounds, while this efficiency most probably oscillates at the level of 98–99%. After analysing the results described above, the authors’ team concluded that there are no additional sources of emission of these compounds in this region. Nevertheless, as in the case of acetone and ammonia, the very intensive impact of mercaptan emissions from gazebos on municipal waste should be noted. This type of emission is not insignificant in the authors’ opinion, and it results directly from the accumulation of pollutant emissions.
The concentrations of microorganisms in the air at the tested installation and in its vicinity showed considerable variation (Table 9). The concentrations of mould fungi in the mechanical waste treatment hall (station 1) and in the control outside the plant (station 5) were very similar. Emission of mould fungi. Emission from membrane-covered bioreactors in which municipal waste was composted was low (stations 2 and 3). The emission of mould fungi from containers for collecting waste from residents was even lower. The number of mould fungi at all the test stations was within the limits that the Team of Experts for Biological Factors considered acceptable for atmospheric air. The number of mould fungi in the sorting hall was lower than the permissible level in public and residential premises, even though this hall is a workroom with organic dust. According to the criteria of PN-89/Z-04111/03, withdrawn in 2015, the air at all research sites would be classified as averagely clean atmospheric air, especially in late spring and early autumn.
The highest concentration of mesophilic bacteria was found in the indoor air of the mechanical waste processing hall. This was a closed room where waste was screened. Emission from the bioreactor containing municipal waste in the late composting phase was moderate. The emission of mesophilic bacteria from containers for collecting waste from residents was slightly lower (site 6). The lowest concentration of mesophilic bacteria in the air was found at the control site (site 5). The number of mesophilic bacteria in the air of the sorting hall was lower than the concentrations proposed by the Biological Factors Expert Team for public and residential premises. However, this hall is a workroom with organic dust. At the other sites, the concentrations of mesophilic bacteria were acceptable according to the proposals developed by the Biological Factors Expert Team. These values allowed the air at these locations to be classified as unpolluted air, according to PN-89/Z-04111/02, withdrawn in 2015.
No mannitol-positive staphylococci were detected at any of the study sites. Mannitol-negative staphylococci were most numerous at the control site, so it can be concluded that waste processed in the tested installation did not constitute a significant source of their emissions into the air.
Bacteria from the family Enterobacteriaceaelactose-negative bacteria were most abundant in the indoor air of the mechanical waste processing hall. A comparison of their concentrations in the ambient air at the control station and in the air suspended directly above the waste indicates that although they could be present in the waste, the waste was not a significant source of their emission to the ambient air.
Variation in the concentration of staphylococci and bacteria from the family Enterobacteriaceae at individual stations indicated that a significant portion of these bacteria suspended in the air outside the plant originated from sources other than the waste treatment facility. The concentration of these bacteria was also negligible in the hall waste sorting plant. Some species of the Enterobacteriaceae family are pathogenic to humans and animals, but infection occurs through the alimentary tract. Therefore, the presence of a negligible number of them in the air does not pose a significant health risk.
Table 9.
Concentrations of microorganisms in the air in the area of the tested installation and its vicinity.
Table 9.
Concentrations of microorganisms in the air in the area of the tested installation and its vicinity.
| Group of microorganisms | Position | |||||
|---|---|---|---|---|---|---|
| 1 | 2 | 3 | 4 | 5 | 6 | |
| Number of j.t.k./m3 (mean and standard deviation) | ||||||
| Mould fungi | 1117±503 | 650±35 | 843±240 | 347±66 | 1012±315 | 900±243 |
| Mesophilic bacteria | 1287±467 | 387±140 | 608±181 | 332±147 | 258±137 | 443±225 |
| Staphylococci mannitol+ | 0±0 | 0±0 | 0±0 | 0±0 | 0±0 | 0±0 |
| Staphylococci mannitol- | 63±45 | 83±42 | 75±42 | 75±58 | 105±25 | 10±7 |
| Enterobacteriaceaelac+ | 38±10 | 7±5 | 2±2 | 18±13 | 12±9 | 2±2 |
| Enterobacteriaceaepour- | 0±0 | 0±0 | 0±0 | 2±2 | 0±0 | 0±0 |
| Group bacteria cola | 10±11 | 2±2 | 0±0 | 3±5 | 8±8 | 2±2 |
The concentrations of microorganisms emitted by the tested elements of the mechanical–biological waste treatment installation in Poland were similar to the concentrations found in the atmospheric air in the vicinity of the installation (immission). This indicates a small impact of this installation on the sanitary condition of the air and the origin of most of the airborne bioaerosol from other natural and anthropogenic sources. In the past, waste management facilities have caused a significant decrease in the microbiological quality of the air around them. Their long-term operation could have caused uniform microbiological contamination of the area around them[29]. The authors’ experience indicates that this currently happens less frequently and on a smaller scale. The probable cause is technological changes in waste management. The results obtained in this work indicate that the tested installation for mechanical–biological treatment of municipal waste is an example of the effectiveness of these changes.
However, waste is a source of bioaerosol emissions into the indoor air of waste management facilities and into the ambient air. Its concentrations vary significantly, depending on the distance from the emission sources, their type and nature, and many other factors, such as wind speed and direction[30,31]. Over 200 species have been identified at workstations in waste management plants. bacteria and fungi[32] [Szadkowska-Stańczyk 2007]. This indicates a large species diversity of this bioaerosol. One of the consequences of this diversity is also a significant differentiation of the indicators of the sanitary condition of air used in research. This makes it difficult to compare results and is a significant obstacle to developing generally accepted permissible concentrations of bioaerosol in atmospheric air and indoor air, taking into account their intended use. This also applies to the air surrounding installations in which waste management is carried out[33].
The concentrations of bioaerosol in the air found by other authors studying waste treatment plants were generally higher than those found in this work. The concentration of mesophilic bacteria in the Chinese municipal sewage sludge composting plants was 14,196– 24,549 cfu/m3 (composting in windrows) and 9,090 – 24,628 cfu/m3 (composting in bioreactors), concentration of microscopic fungi: 1,590 – 3,224 cfu/m3 (composting in windrows) and 5,847 – 9,284 cfu/m3(composting in bioreactors) [Liu et al. 2023]. In a suburban horticultural waste composting facility in Illinois, the concentration of bacteria incubated at 25℃ was 480–78,880 cfu/m3, and microscopic fungi: 5,223 – 26,067 cfu/m[34]. The concentration of aerobic bacteria (incubated successively at temperatures of 37 Co, 22 Co, 4 Co) in the municipal waste composting hall in Poland was 4,424 cfu/m3, anaerobic bacteria (incubated successively at temperatures of 37℃ and 30℃): 34,700 cfu/m3. The differences in bacterial bioaerosol concentrations in the air between the installation studied in this work and the installations studied by other authors could be partly caused by different weather conditions, but the main cause was probably the covering of the composted waste with a membrane. The concentration of aerobic bacteria in the waste sorting hall studied[35] was 4,905 cfu/m3 and anaerobic was 4,537 cfu/m3. The methodology used in this work included only aerobic bacteria incubated at 37°C, and the methodology used by Cyprowski et al. [2016] included bacteria that grow colonies at other temperatures. Concentrations of mesophilic bacteria at waste collection containers from residents of a Chinese village studied by[36] were also higher than those found in this study and amounted to 5,053 cfu/m3(open garbage station with an area of 20 m2) and 60,299 cfu/m3 open garbage station with an area of 115 m2). The authors of the works cited here did not take into account the concentrations of pathogenic bacteria in their studies. However, they are present in municipal waste[37], where they discovered, among other things, Staphylococcus aureus and sticks from the family Enterobacteriaceae. This indicates the possibility that they were also released into the air in other installations processing municipal waste.
To sum up, it should be stated that the emission of bioaerosols during the tests carried out for the waste management plant in question was relatively small. The reason for this was the application of a technological regime, including the use of many measures to protect the working environment and the external environment from contamination, such as covering composted waste with membranes, mechanical processing of waste in the hall, and using closed containers for collecting waste in the box. Nevertheless, employees staying in the mechanical waste processing hall should use collective and individual respiratory protection measures against dust and protective glasses.
5. Discussion
When analysing the results of chromatographic, modelling and microbiological tests, the following should be taken into account:
- The air quality within the plant, apart from the processes carried out on its premises, is also shaped by other factors and emission sources.
- As a result of the conducted analyses and research, the team of authors states that the operation of the plant does not lead to a deterioration of air quality in terms of odour impact levels within its area, provided that the processes are conducted correctly.
- Based on the research, it should be stated that during normal operation of the plant, within the housing estates located to the south and southwest, no odour should be felt.
- The largest source of malodorous compound emissions at the plant is the green waste storage site, where an excessive accumulation of this waste occurs, and significant amounts of malodorous compounds (in particular ammonia and mercaptans) are emitted.
- Research carried out in the biological waste treatment area (bioreactors) indicates a very effective reduction in the emission of malodorous compounds during the process, and microbiological tests confirm that there is beneficial waste sanitation resulting in a direct reduction in the emission of bioaerosols into the air.
- The results of modelling studies largely coincide with the research conducted in the field, which in turn confirms that there may be additional sources of emissions of malodorous compounds within housing estates (e.g., arable fields, gazebos with waste).
- The results of microbiological tests indicate that the installation has a minor impact on the sanitary condition of the air and that most of the airborne bioaerosol comes from other natural and anthropogenic sources.
- The results obtained in this work and the literature data indicate the need for further research on bioaerosols suspended in indoor and ambient air, especially in and around plants where waste management, sewage management and industrial animal breeding are carried out. This will allow for the collection of a database sufficient to establish a commonly accepted standard methodology for testing bioaerosols and their permissible concentrations.
6. Conclusion
Based on the environmental analyses conducted and the verification of technological processes carried out at the plant, the author’s team proposes the implementation of actions that will significantly reduce the potential odour impact of the plant. These activities should consist of the following:
- Installing an anti-odour curtain using the OWS biological anti-odour preparation or another effective biological preparation catalysing the decomposition of organic compounds at the entrance to the waste reception hall.
- Applying drainage installation to collect runoff from garbage trucks on the hall premises.
- Designing a ventilation system to discharge air from the waste reception hall and the sorting hall in an integrated manner to the outside and passing it through an air deodorisation system in the form of an installation of “biological odour membrane reactors” selected in consultation with the designer.
- Increasing the frequency of green waste collection from residents (at least once a week) in order to conduct an efficient composting process.
- Conducting additional work at the green waste collection point, including tearing open bags of green waste.
- Considering the additional application of a biological preparation to piles of stored green waste.
- Planting/supplementing protective strips of isolating greenery with appropriately selected species of shrubs and trees that will ultimately constitute an environmental buffer. The species of trees and shrubs should include rugose rose (Rosa rugosa) or juniper (Juniperus sp.) and evergreen species such as Norway spruce (Picea abies).
- Paying attention to vehicle disinfection by establishing disinfection points for all technical vehicles entering and leaving the plant premises in order to limit the spread of solid contaminants (stabiliser) on the chassis and wheels, which will result in a reduction of the odour impact. In the case of high vehicle contamination, the first stage should be washing the vehicle, and in the second, disinfection with a biological OWS preparation or another effective biological preparation catalysing the decomposition of organic compounds using a hand or combustion sprayer.
- Conducting cyclic regular cleaning of drainage and compost fields after each process (emptying the bioreactor) and constant supervision of the work carried out by the shift manager or chief technologist, consisting of keeping records of the work performed.
- Constantly monitoring the processes taking place in bioreactors and places with anaerobic zones and applying a biological preparation to counteract putrefactive processes (occurring in particular at the reactor walls and at the retaining wall at the end of the reactor) causing the emission of malodorous compounds.
- Conducting process control during unloading of bioreactors, which should consist of optimising the organisation of the loading and unloading time of the stabiliser. During unloading, it is recommended to use a biological preparation that limits odour emission, applied directly to the pile stirred during loading. Application is possible through a spray tube with directional nozzles. It is also recommended to minimise the time unloading/loading through appropriate planning of working time and optimal use of existing rolling stock.
- Constantly monitoring the operation and capacity of the sewage system. In cases of increased odour impact, it is recommended to apply the biological preparation OWS or another effective biological preparation catalysing the decomposition of organic compounds.
- Constantly controlling and optimising the processes carried out at the installation site.
- Designing and constructing a buffer zone for receiving vehicles at the hall, taking into account air-tight sealing and automatic gate operation.
References
- Traczewska T.M., Karpińska-Smulikowska J. 2000. Wpływ składowiska odpadów komunalnych na jakość mikrobiologiczna powietrza. Ochrona Środowiska 2(77): 35–38.
- Hryhorczuk D., Curtis L., Scheff P., Chung J., Rizzo M.,Lewis C., Moomey M. 2001. Bioaerosol emission a suburban yard waste composting facility. Annales of Agricultural and Environemntal Medicine, 8: 177–185.
- Liu J., Ai X., Lu Ch., Tian H. 2023. Comparison of bioaerosol release characteristics between windrow and through sludge composting plants: Concentration distribution, community evolution, bioaerosolization behaviour, and exposure risk. Science of the Total Environment, 897, 164925.
- Szadkowska-Stańczyk I. (red.) 2007. Zagrożenia i skutki zdrowotne narażenia na szkodliwe czynniki biologiczne pracowników zakładów gospodarki odpadami. Łódź, Instytut Medycyny Pracy.
- Franchitti E., Pascale E., Fea E., Anedda E., Traversi D. 2020. Methods for Bioaerosol Characterisation: Limits and Perspectives for Human Health Risk Assesment in Organic Waste Treatment. Atmosphere 11: 452.
- Zwoździak J, Szynkowska M. „Współczesna problematyka odorów” - Wydawnictwo WNT, 2010.
- Zwoździak J, Szałata Ł, i in., „Lista substancji i związków chemicznych, które są przyczyną uciążliwości zapachowej” Ministerstwa Środowiska, 2016.
- Traczewska T.M., Karpińska-Smulikowska J. 2000. Wpływ składowiska odpadów komunalnych na jakość mikrobiologiczną powietrza. Ochrona Środowiska 2(77): 35–38.
- Kaźmierczuk M., Bojanowicz-Baklok A. 2014. Bioaerosol concentration in the air surrounding municipal solid waste landfill. Environmental Protection and Natural Resource 25,2(60): 17–25.
- Sánchez-Monedero M.A., Stentiford E.I., Urpilainene S.T. 2005. Bioaerosol Generation at Large-Scale Green waste Composting Plants. Journal of the Air & Waste Management Association 55:612–618.
- Porta D., Milani S., Lazzarino A.I., Perucci C. A. Forastiere F. 2009. Systematic review of epidemiological studies on health effects associated with management of solid waste. Environmental Health 8: 60.
- Raulf M., van Kampen V., Neumann H.D., Liebers V., Deckert A., Brünger J., Hoffmeyer F. 2017. Airway and Blood Inflammatory Markers in Waste Collectors. Advances in Experimental Medicine and Biology – Neuroscience and Respiration DOI 10.1007/5584_2017_25.
- Heldal K.K., A.S. Halstensen A.S., Thorn J., Eduard W., Halstensen T.S. 2003. Airway inflammation in waste handlers exposed to bioaerosols assessed by induced sputum. European Respiratory Journal 21: 641–645.
- Tehrani A.M., Berijani N., Hajiketabi S., Samadi M. 2024. Tracking bioaerosol exposure among municipal solid waste workers using hematological and inflammatory biomarkers. Environmental Pollution 352: 124124.
- Kośmider J., Mazur-Chrzanowska B., Wyszyński B., Odory, Wydawnictwo Naukowe PWN, Warszawa 2012.
- Vincenzo Belgiorno, Vincenzo Naddeo, Tiziano Zarra, Odour impact assessment handbook, 2013, Wiley, 125–174.
- Furman WB. Continuous Flow Analysis. Theory and Practise. Mercel Dekker. New Your 1976.
- Górny R.L. 2010. Aerozole biologiczne – rola normatywów higienicznych w ochronie środowiska i zdrowia. Medycyna Środowiskowa, 13: 41–51.
- Górny R.L. 2010. Aerozole biologiczne – rola normatywów higienicznych w ochronie środowiska i zdrowia. Medycyna Środowiskowa, 13: 41–51.
- Kośmider J., Mazur-Chrzanowska B., Wyszyński B. Odory. Wydawnictwa Naukowe PWN, Warszawa 2002.
- Rutkowski J. D. Dezodoryzacja gazów odlotowych. Monografia. IIOŚ Politechnika Wrocławska, Wrocław 1975.
- Augustyńska D., Pośniak M. (red.). Czynniki szkodliwe w środowisku pracy. CIOP-PIB, Warszawa 2003.
- Makles Z., Galwas-Zakrzewska M. Złowonne gazy w środowisku pracy. Bezpieczeństwo Pracy 9(408)2005 str. 12–16.
- Makles Z., Domański W. Odory w środowisku pracy rolnika i hodowcy. Bezpieczeństwo Pracy 2/2008 str. 10 - 13.
- Szynkowska M. I., Wojciechowska E., Węglińska A., Paryjczak T. Odory. Aktualny problem w ochronie środowiska. Przemysł Chemiczny 88/6 (2009) str. 712–720.
- Higuet I., Vigneron S. Deodorization experience using a neutralising compound. Eurodeur’97, Certech, Universite Catholique de Louvain 1997.
- lenntech.fr/table.htm - Substances Odorantes et seuil de detection, dostęp: 10.2016.
- M. Zamelczyk-Pajewska. Związki węgla w gazach odlotowych z wytwórni kwasu fosforowego. Ochrona powietrza, s. 10–13, 2000.
- Traczewska T.M., Karpińska-Smulikowska J. 2000. Wpływ składowiska odpadów komunalnych na jakość mikrobiologiczna powietrza. Ochrona Środowiska 2(77): 35–38.
- Hryhorczuk D., Curtis L., Scheff P., Chung J., Rizzo M.,Lewis C., Moomey M. 2001. Bioaerosol emission a suburban yard waste composting facility. Annales of Agricultural and Environemntal Medicine, 8: 177–185.
- Liu J., Ai X., Lu Ch., Tian H. 2023. Comparison of bioaerosol release characteristics between windrow and through sludge composting plants: Concentration distribution, community evolution, bioaerosolization behaviour, and exposure risk. Science of the Total Environment, 897, 164925.
- Szadkowska-Stańczyk I. (red.) 2007. Zagrożenia i skutki zdrowotne narażenia na szkodliwe czynniki biologiczne pracowników zakładów gospodarki odpadami. Łódź, Instytut Medycyny Pracy.
- Franchitti E., Pascale E., Fea E., Anedda E., Traversi D. 2020. Methods for Bioaerosol Characterisation: Limits and Perspectives for Human Health Risk Assesment in Organic Waste Treatment. Atmosphere 11: 452.
- Ibidem Hrycholczuk i in.
- Ibidem Cyprowski i wsp. [2016].
- Li P., Li L., Yang K., Zheng T., Liu J., Wang Y. 2021. Characteristics of microbial aerosol particles dispersed downwind from rural sanitation facilities: Size distribution, source tracking and exposure risk. Environment Research 195: 110798.
- Shen D., Yu Q., Xing H., Long Y., Hui C. 2024. Distribution and survival of pathogens from different waste components and bioaerosol traceability in household garbage room. Environmental Research 252: 119016.
Figure 1.
Location of measurement points.
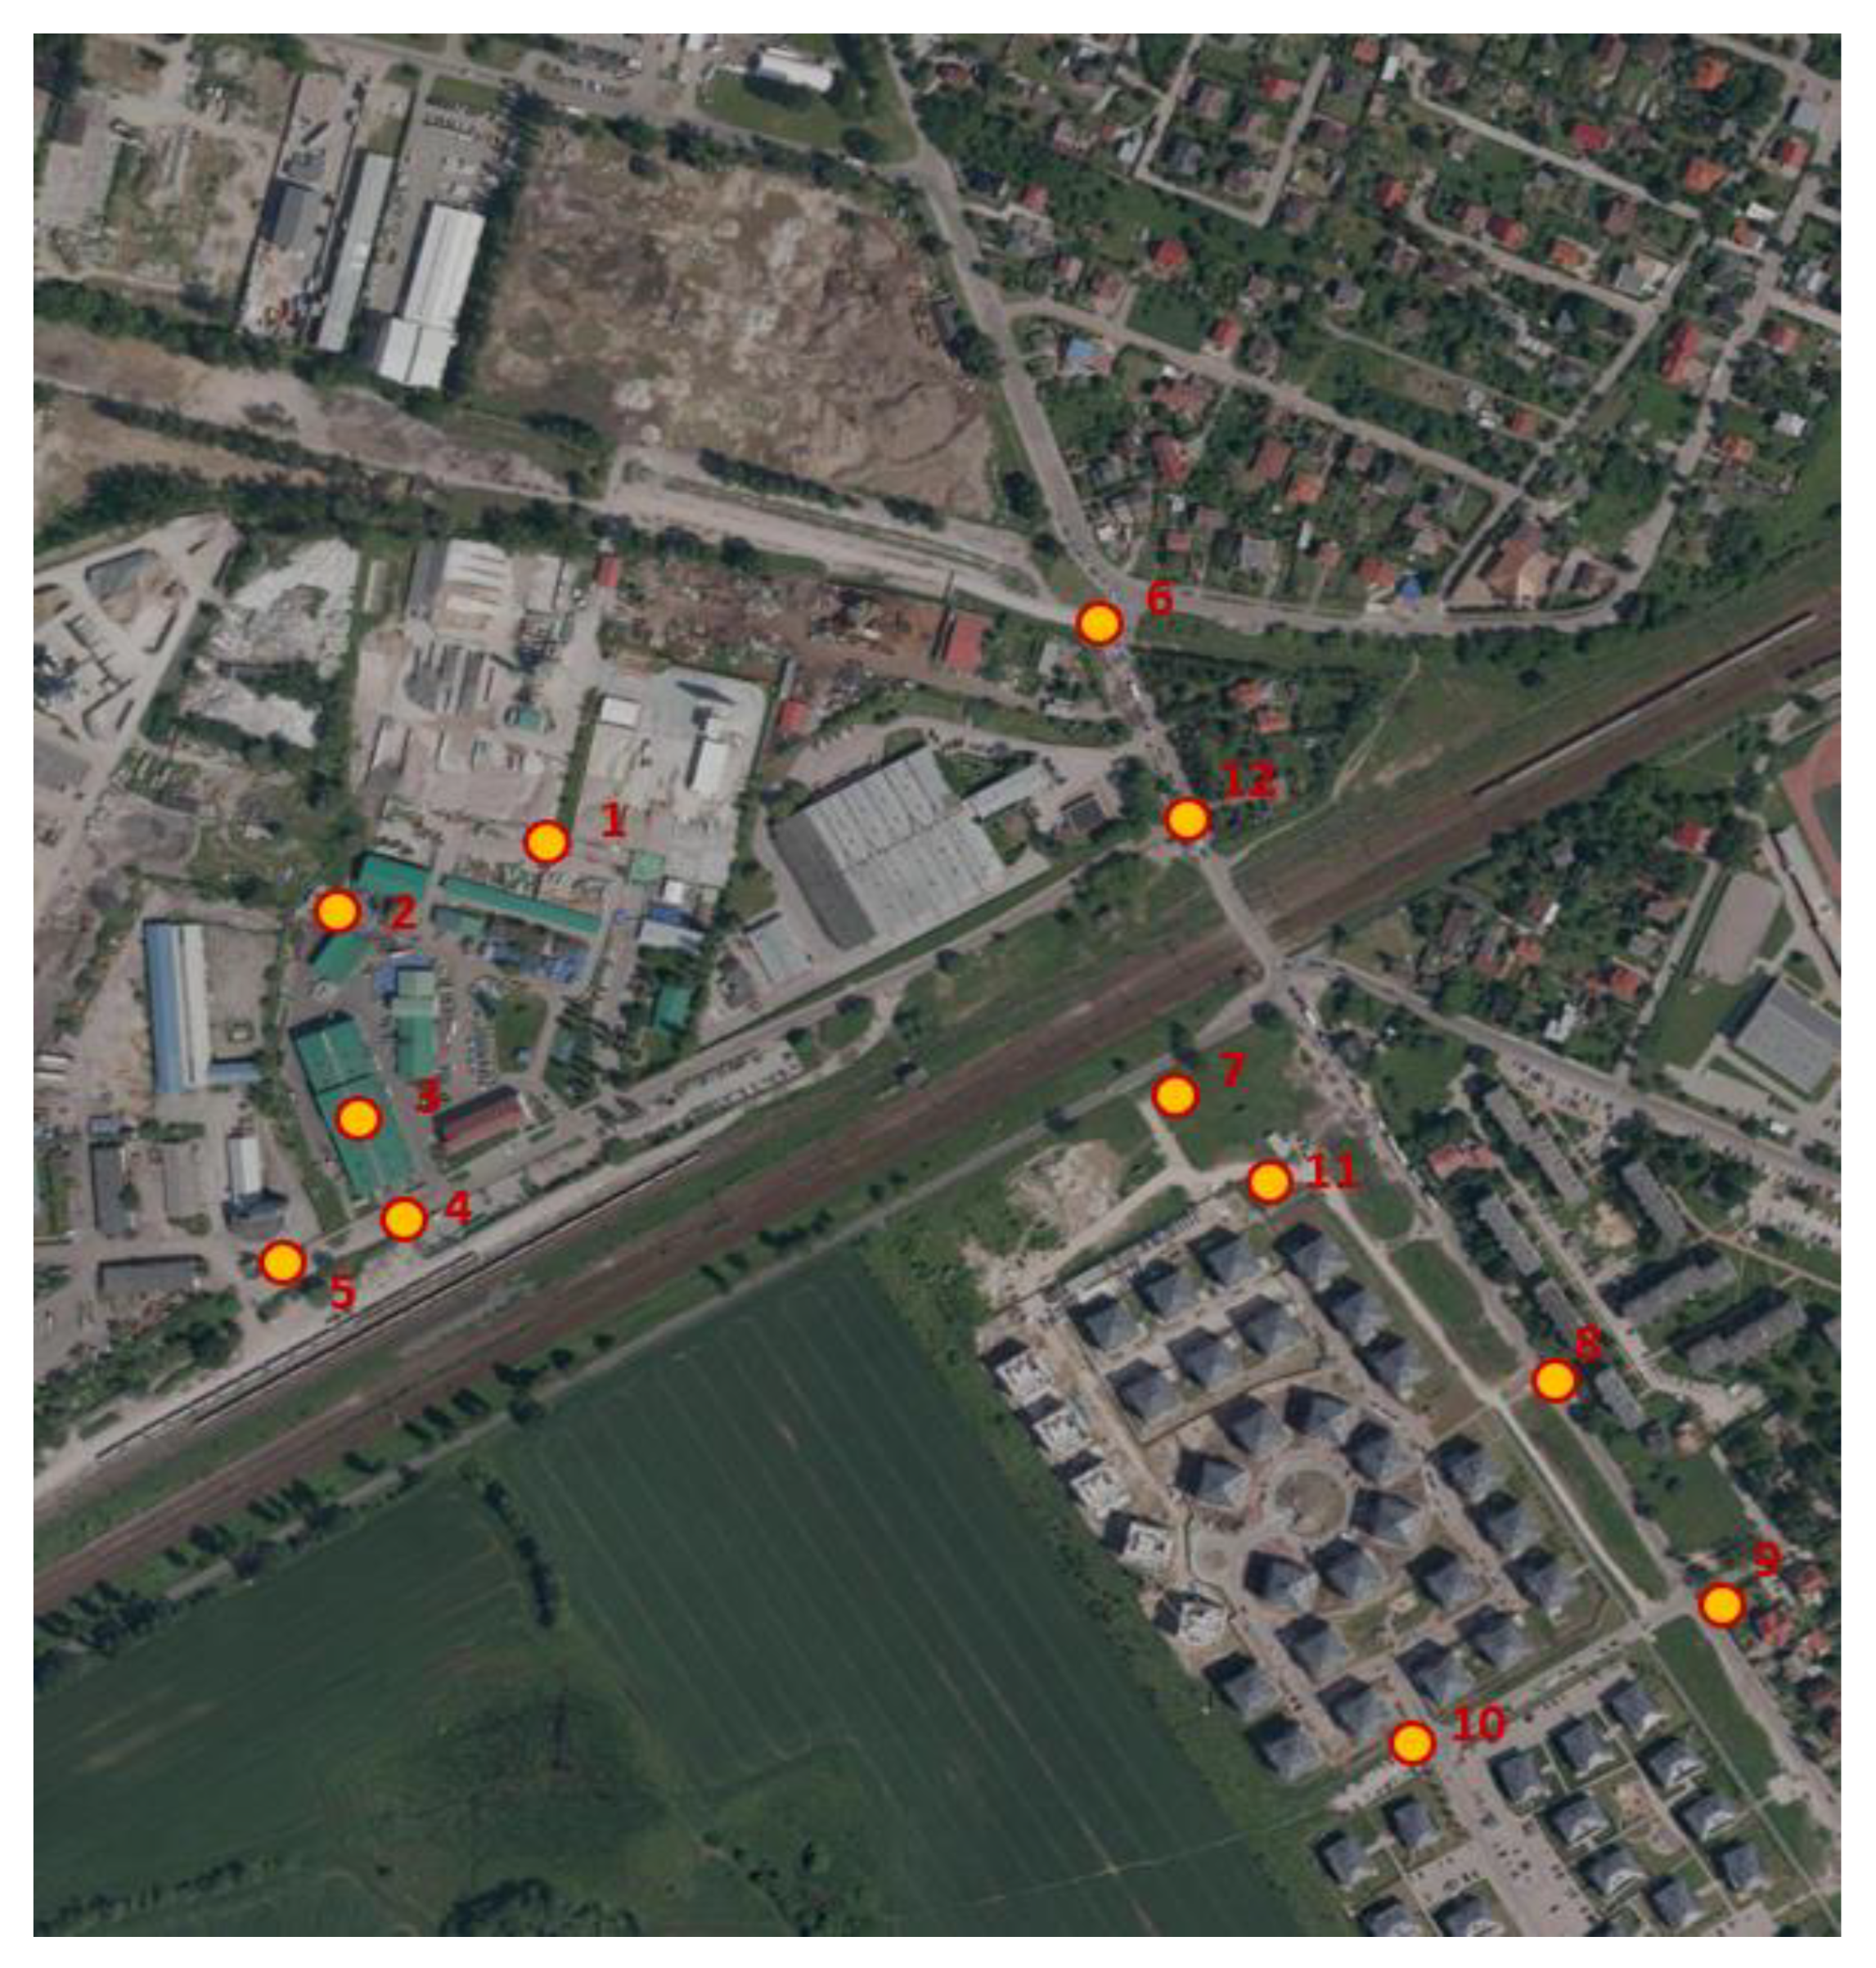
Figure 2.
Frequency of exceedances of one-hour concentrations of 50 u/m3.
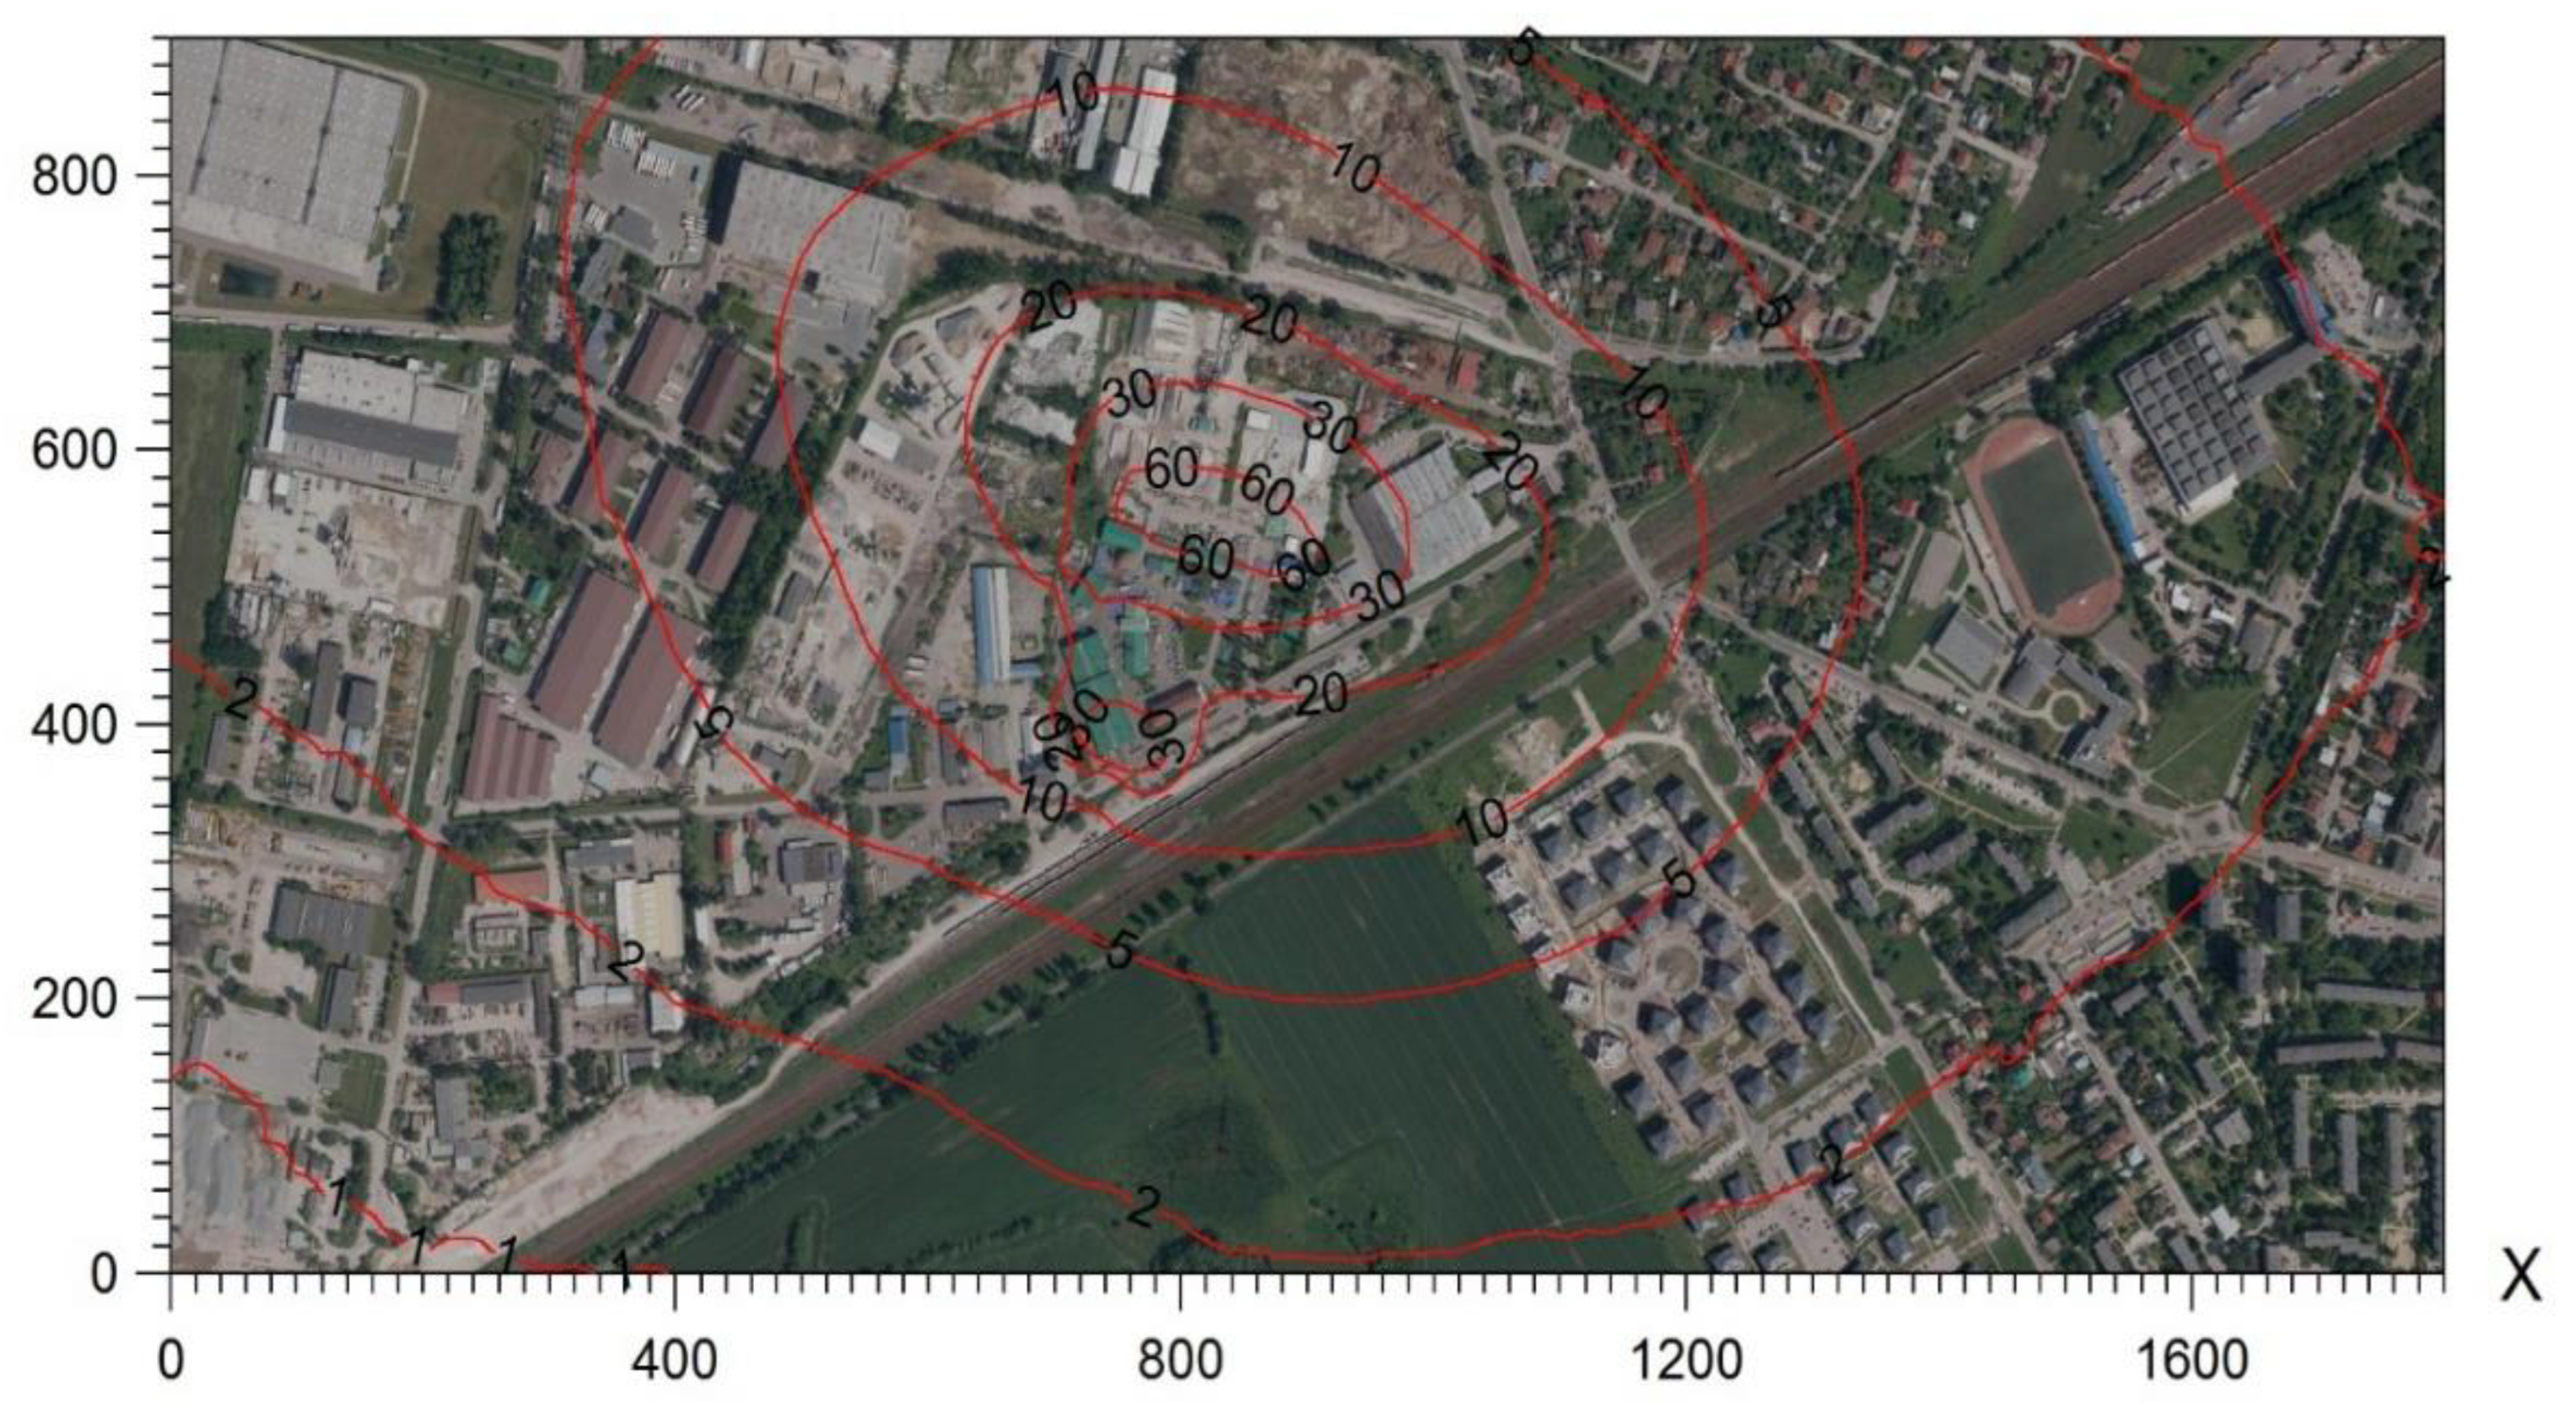
Figure 3.
Potential areas of exposure to odours determined based on modelling studies.
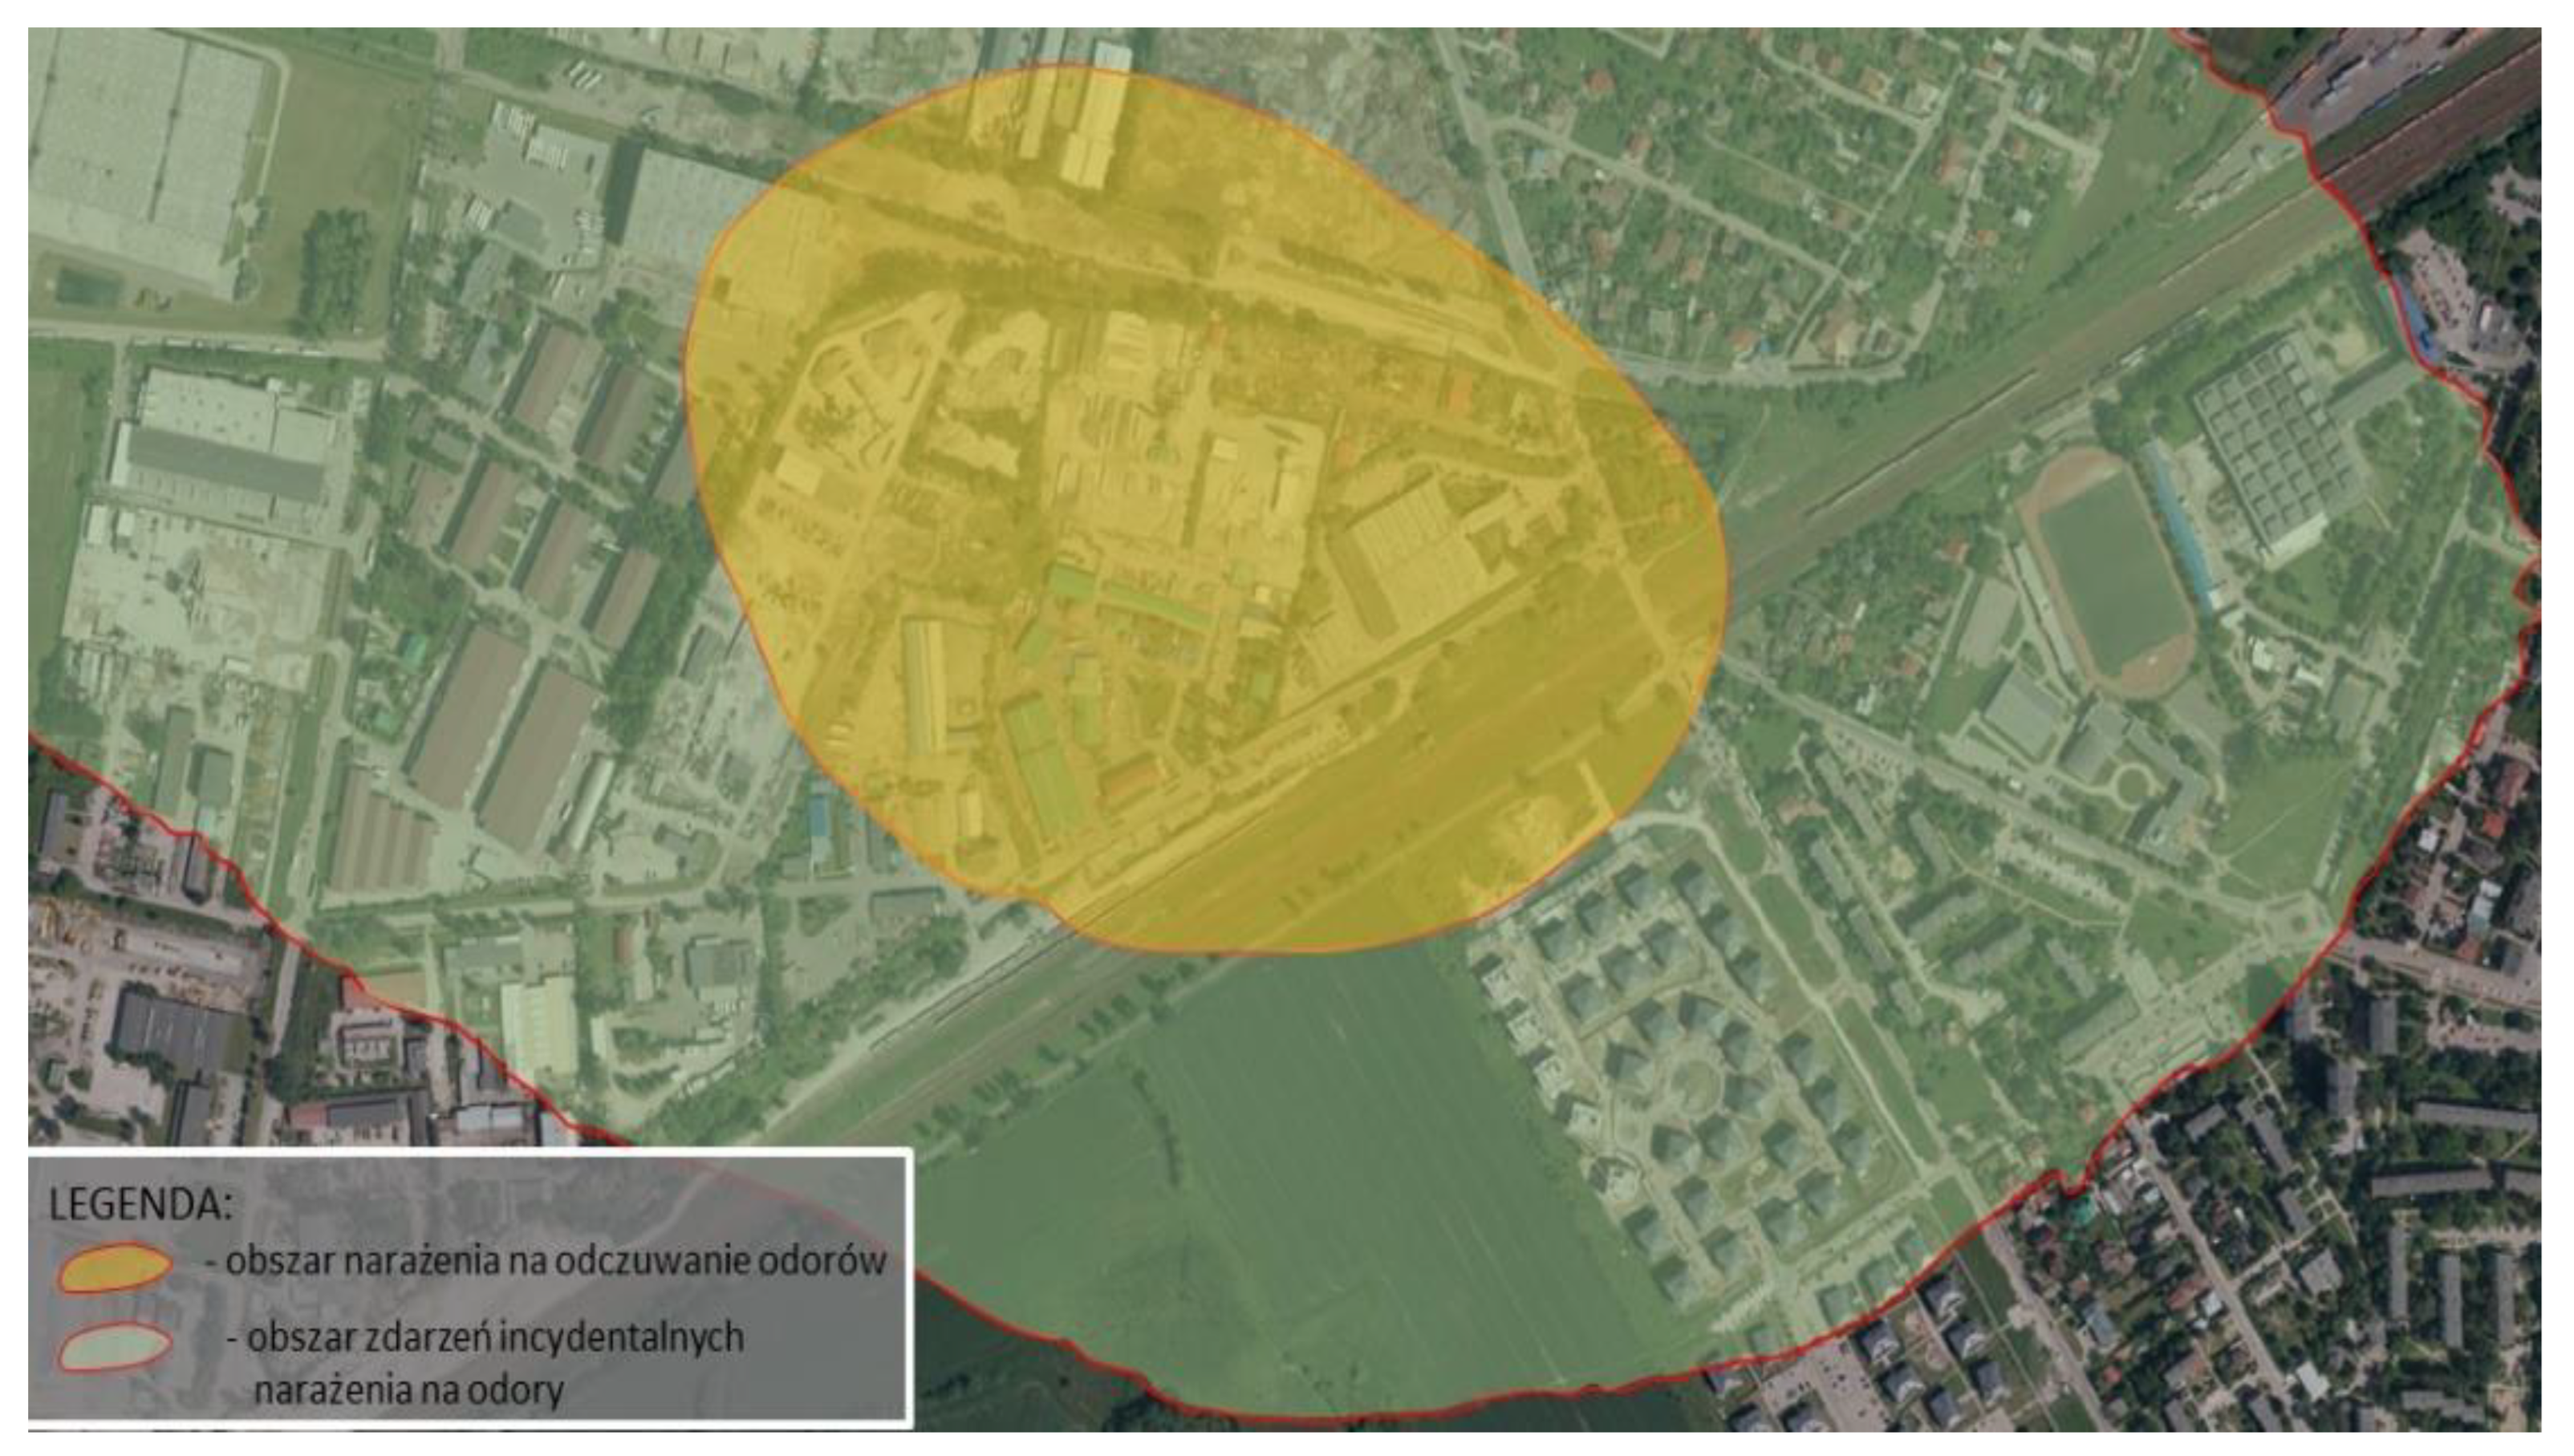
Figure 4.
Real areas exposed to odours determined on the basis of field studies.
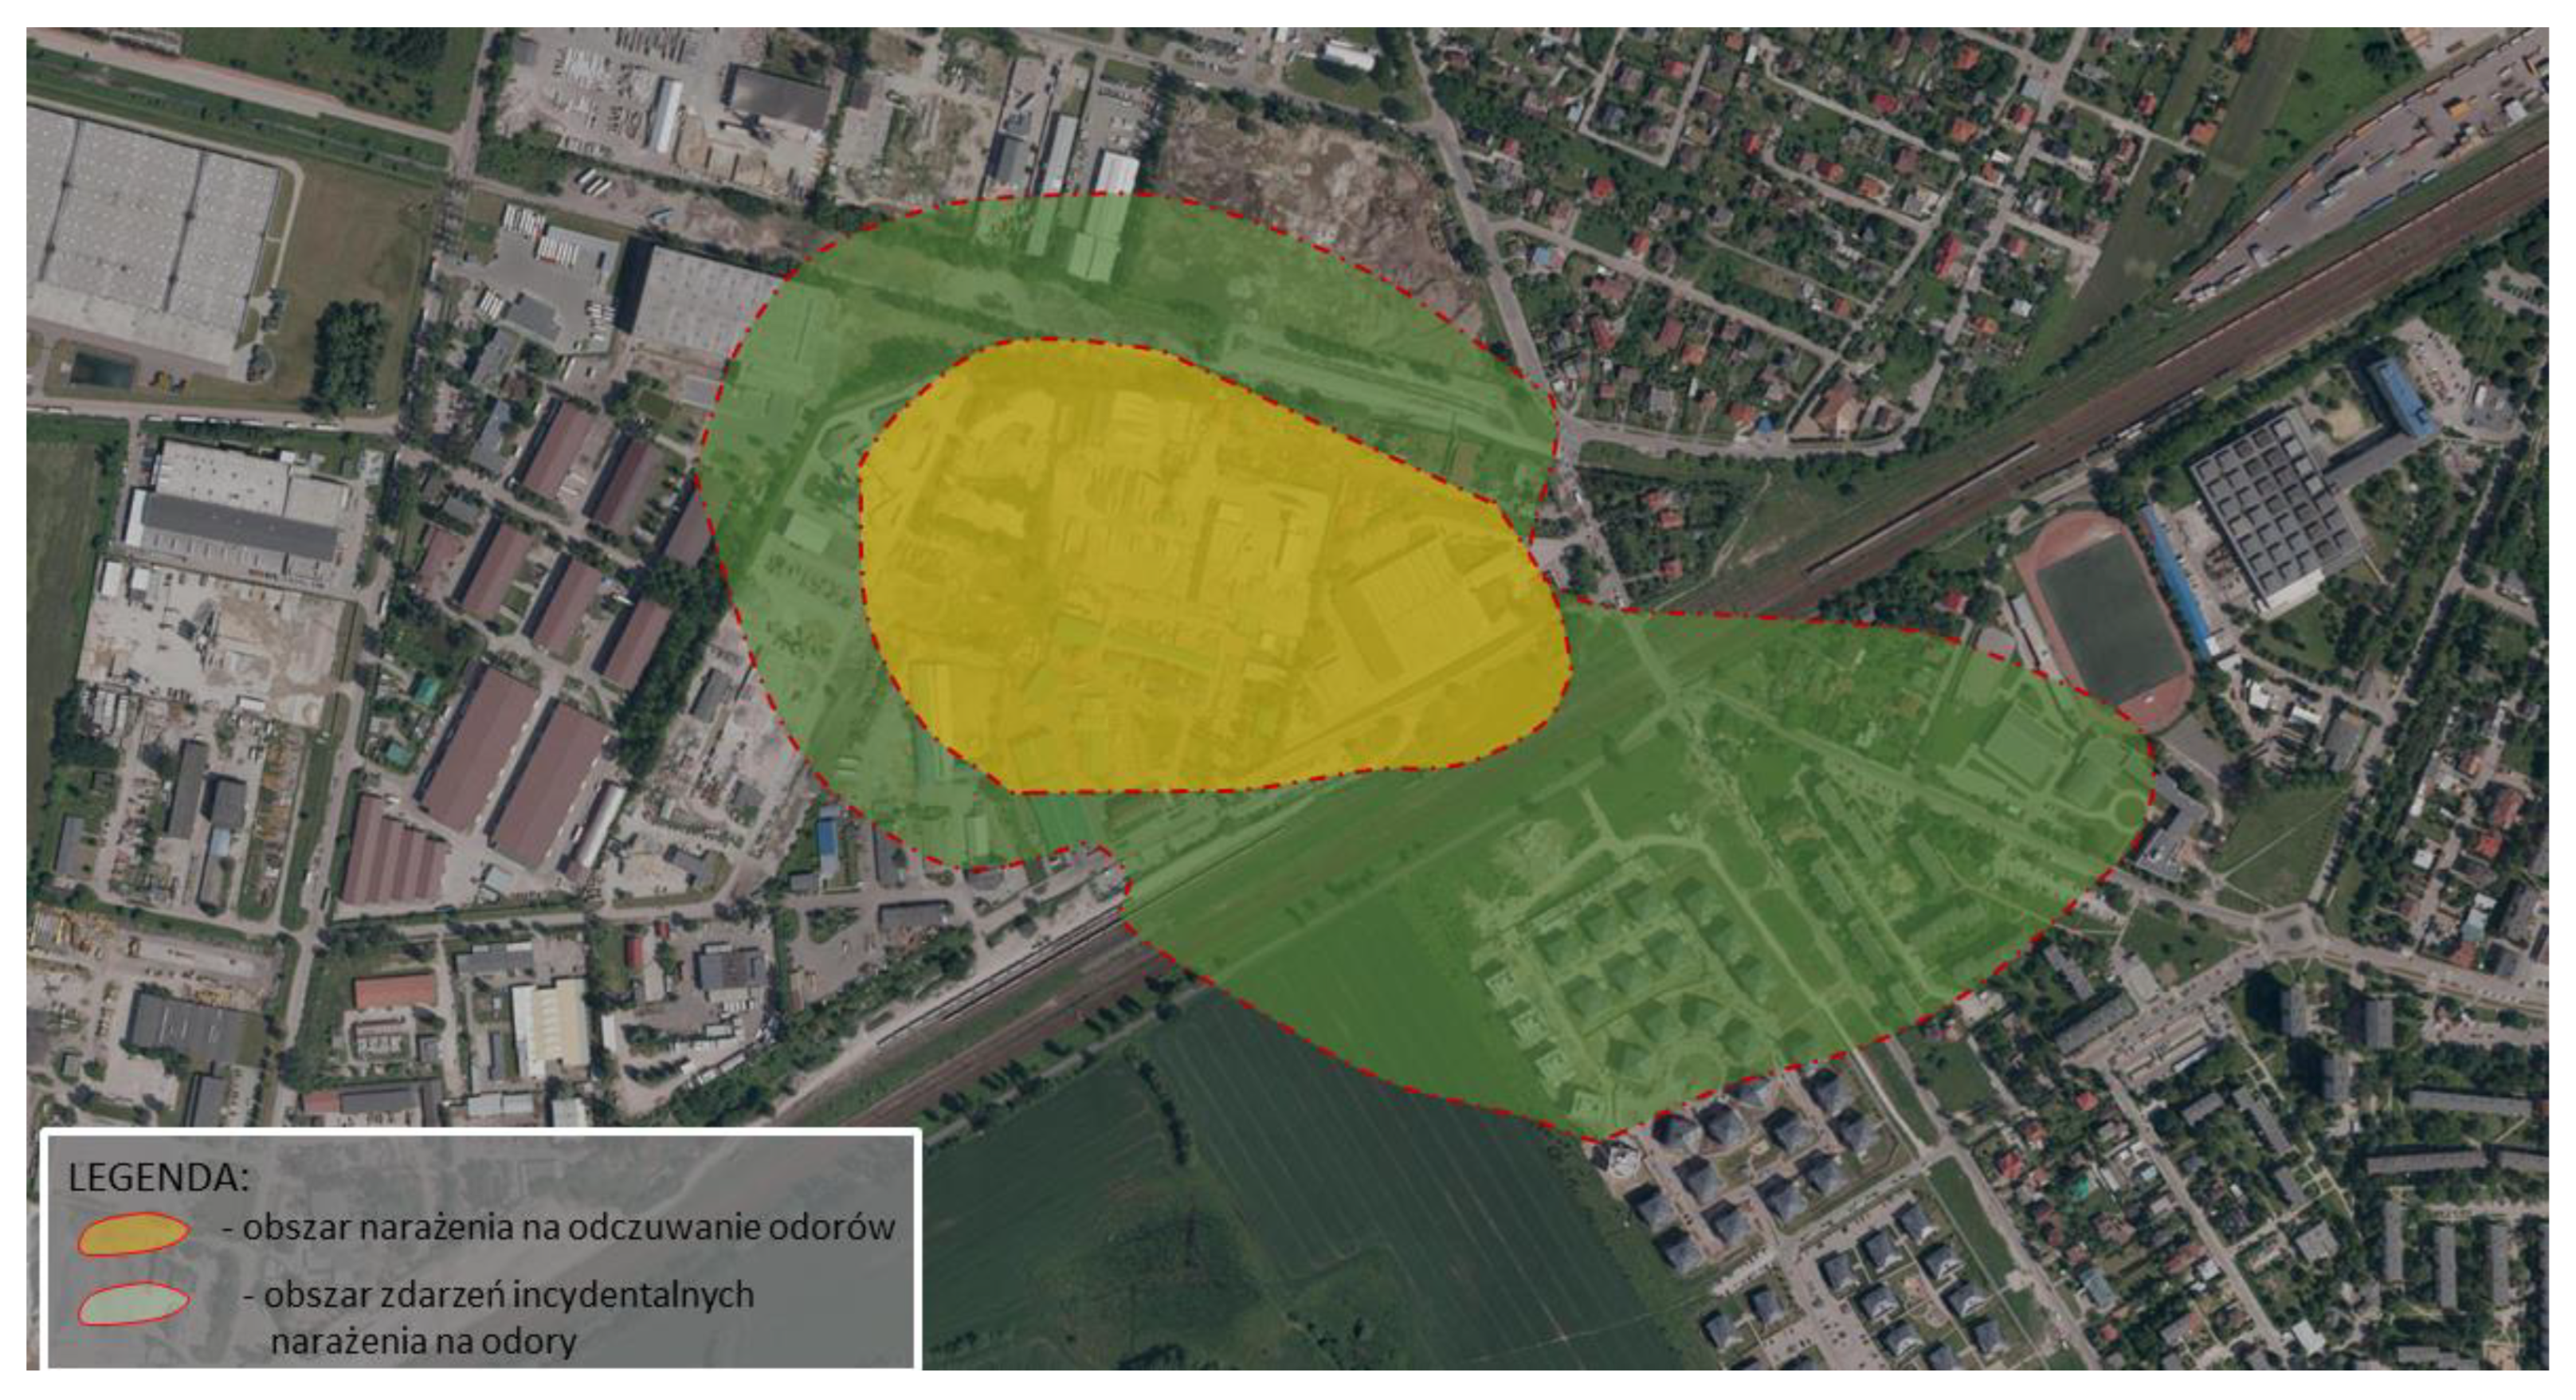
Figure 5.
Position measuring inside the waste treatment hall.
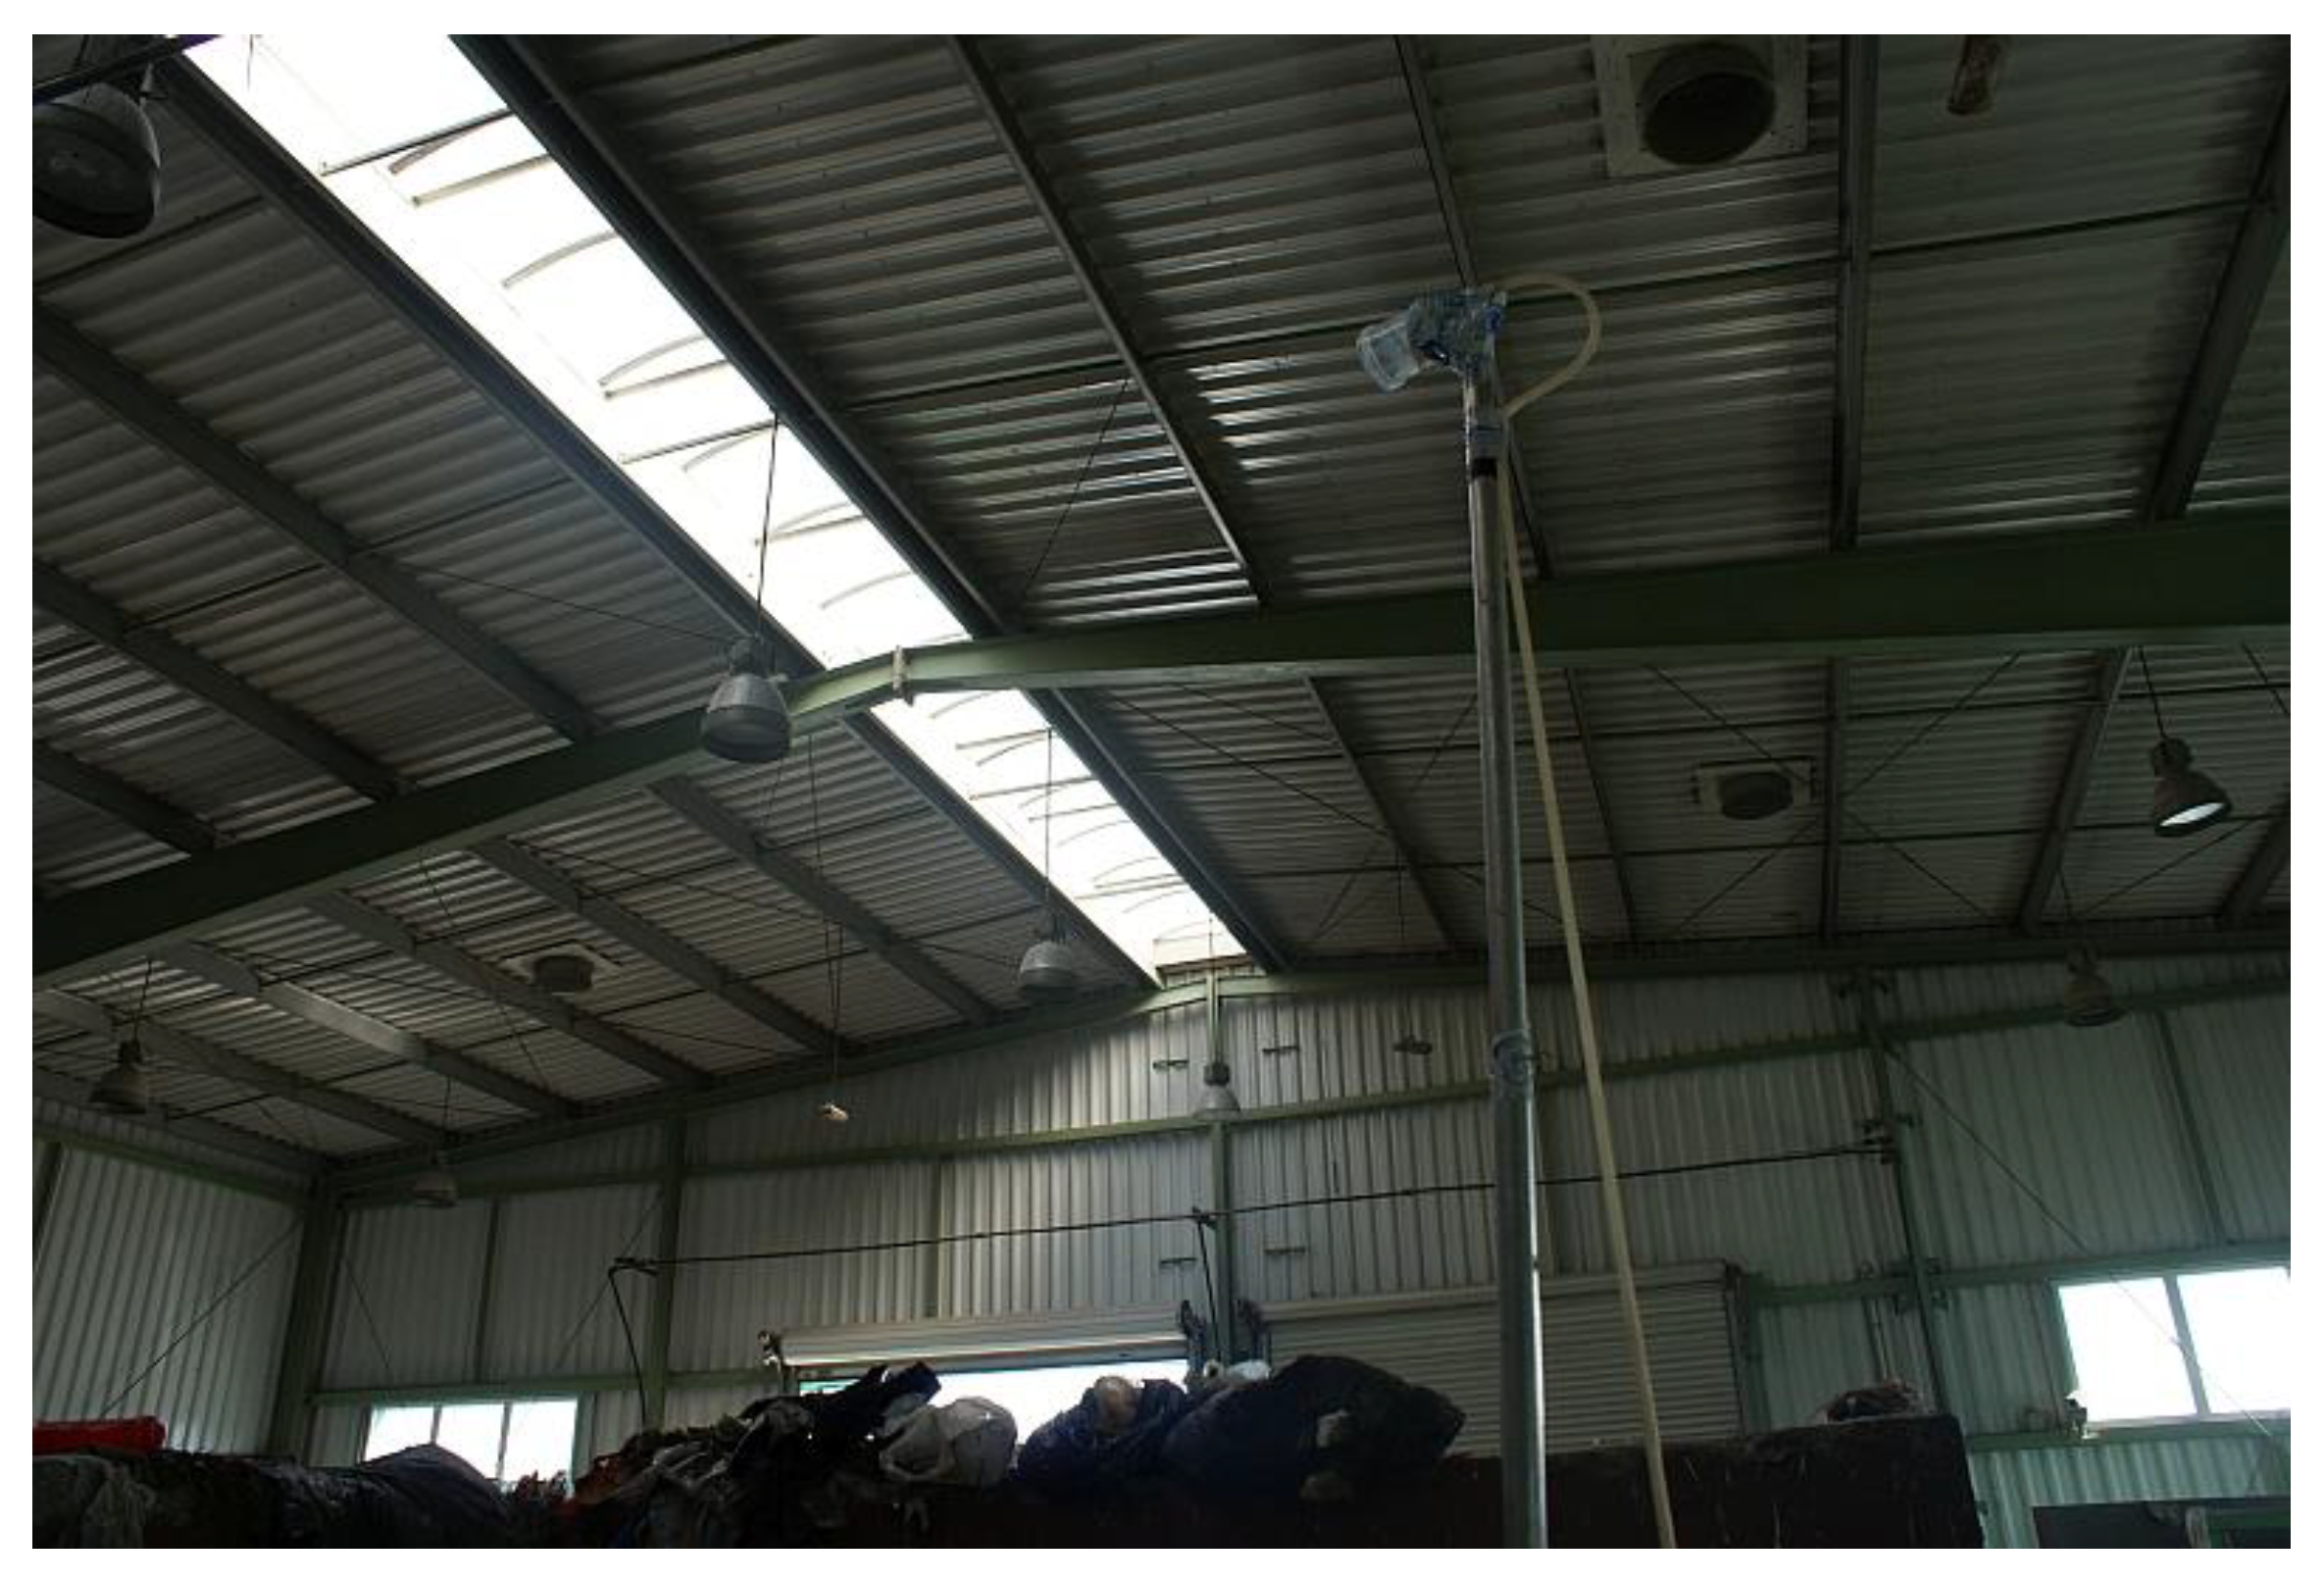
Figure 6.
Green waste measurement station.
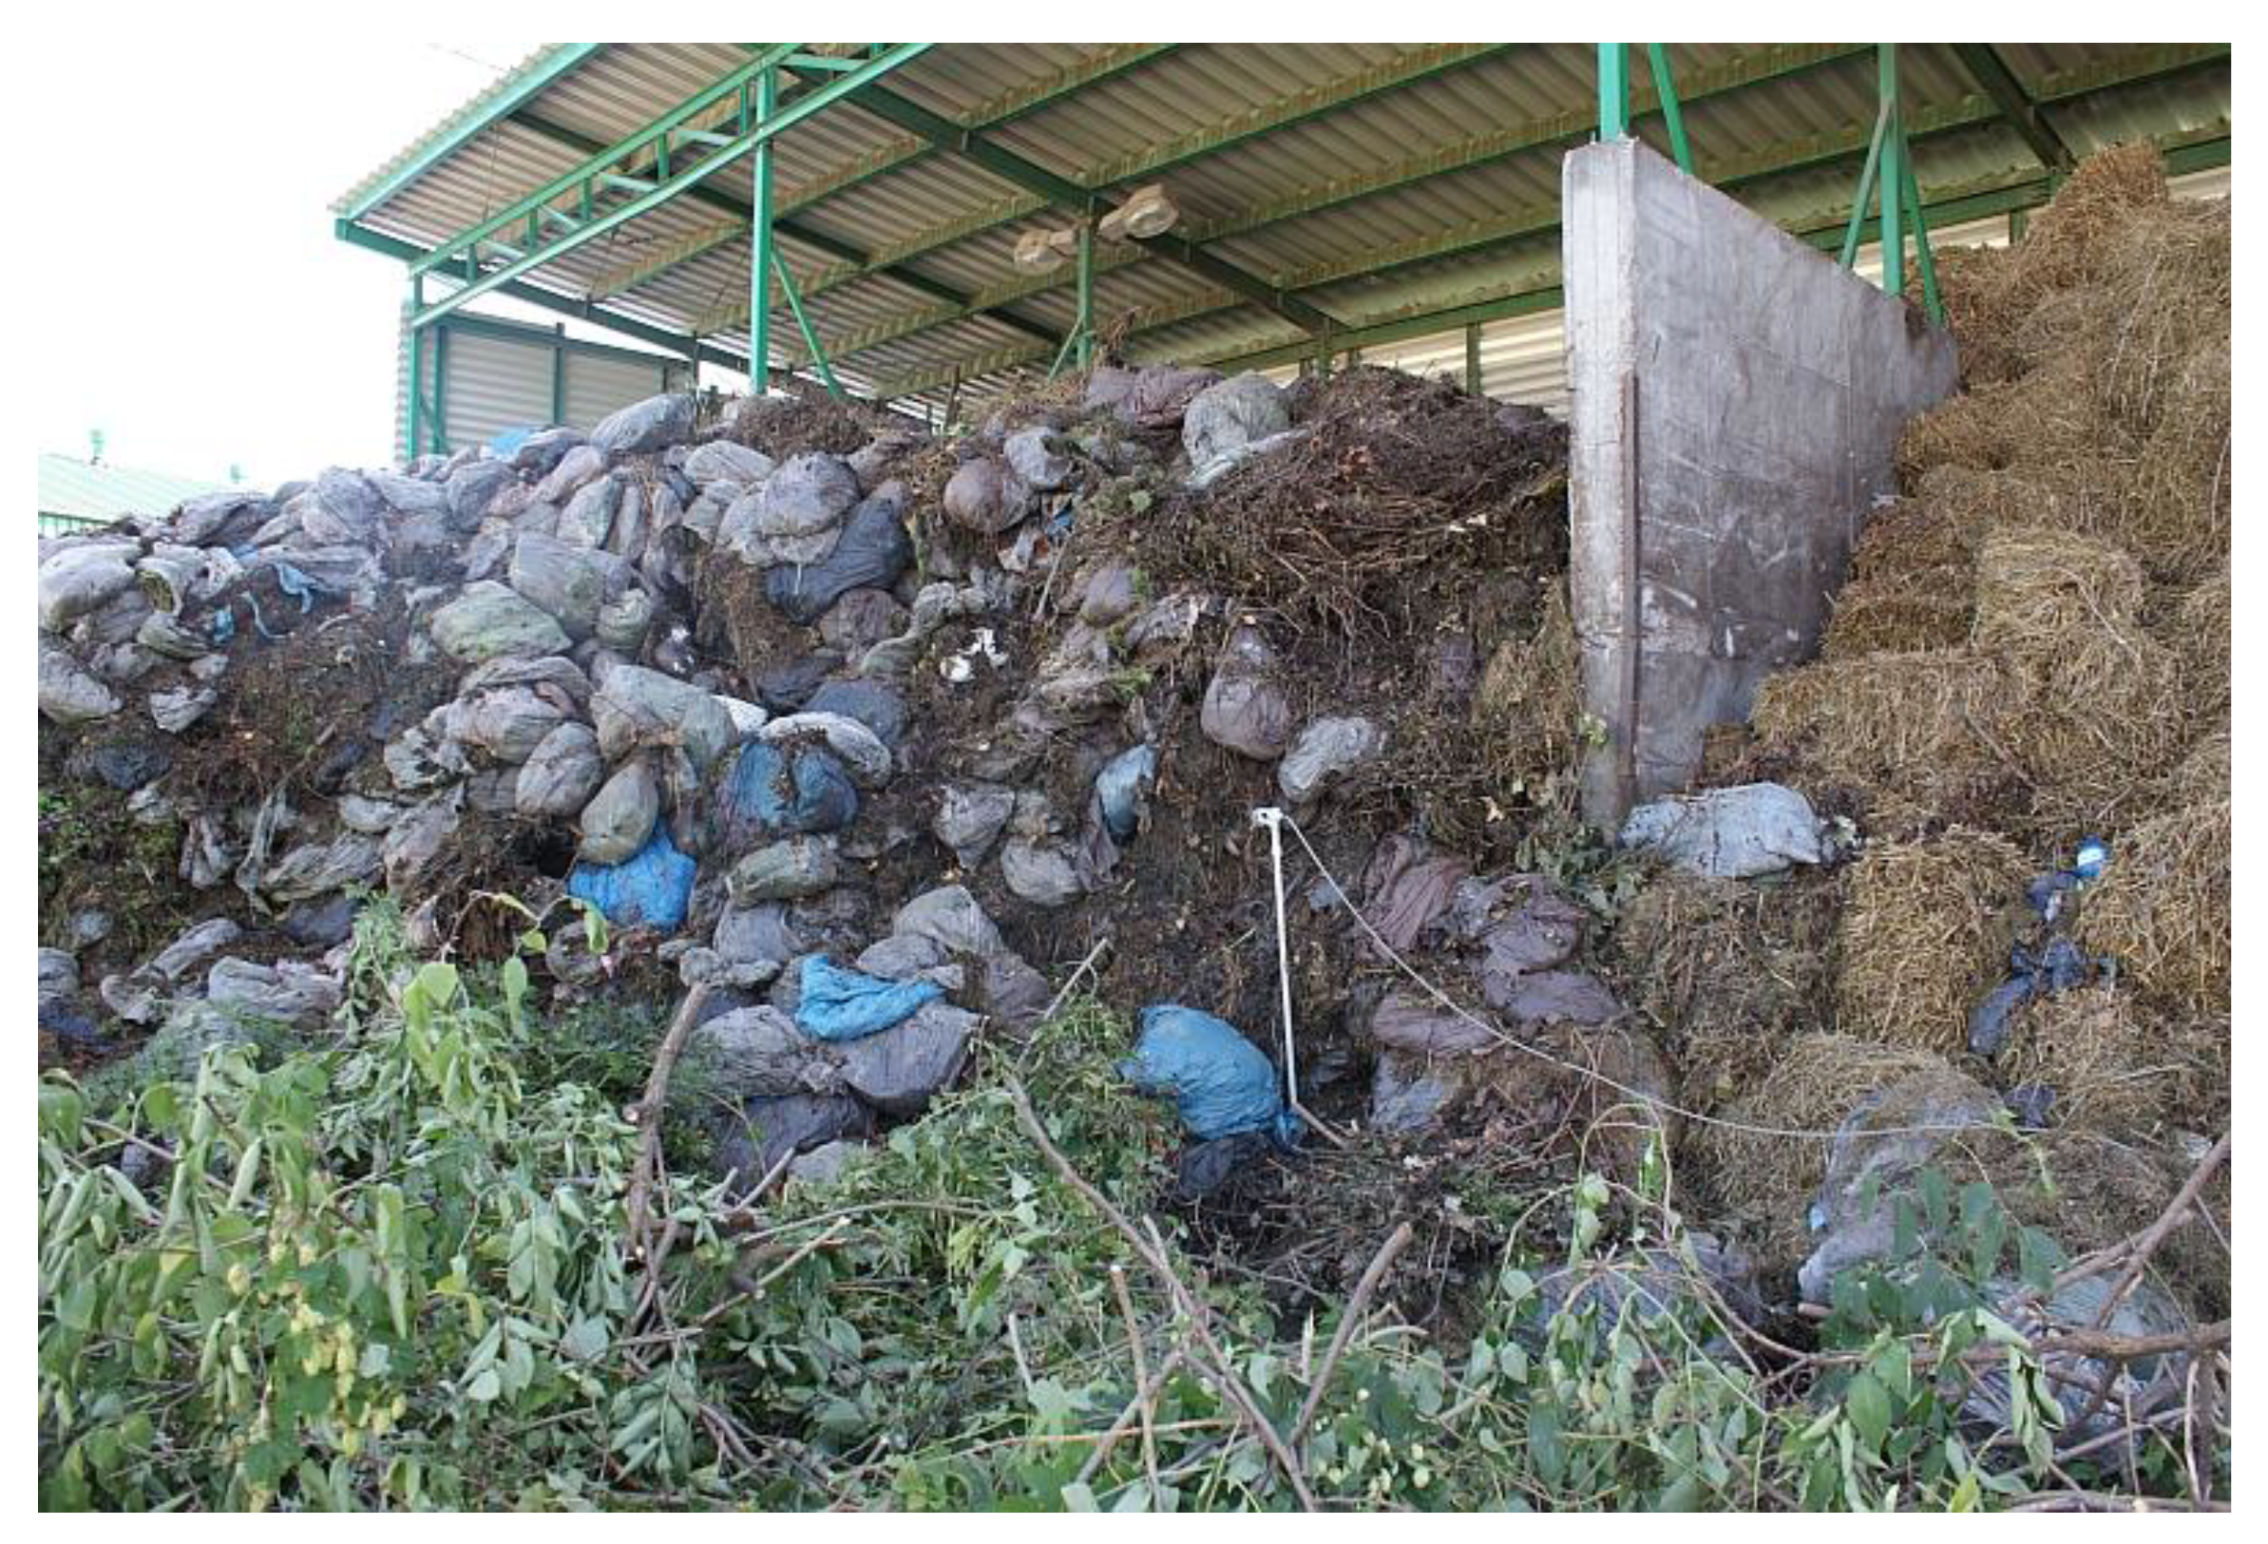
Figure 7.
Measurement station on bioreactors.
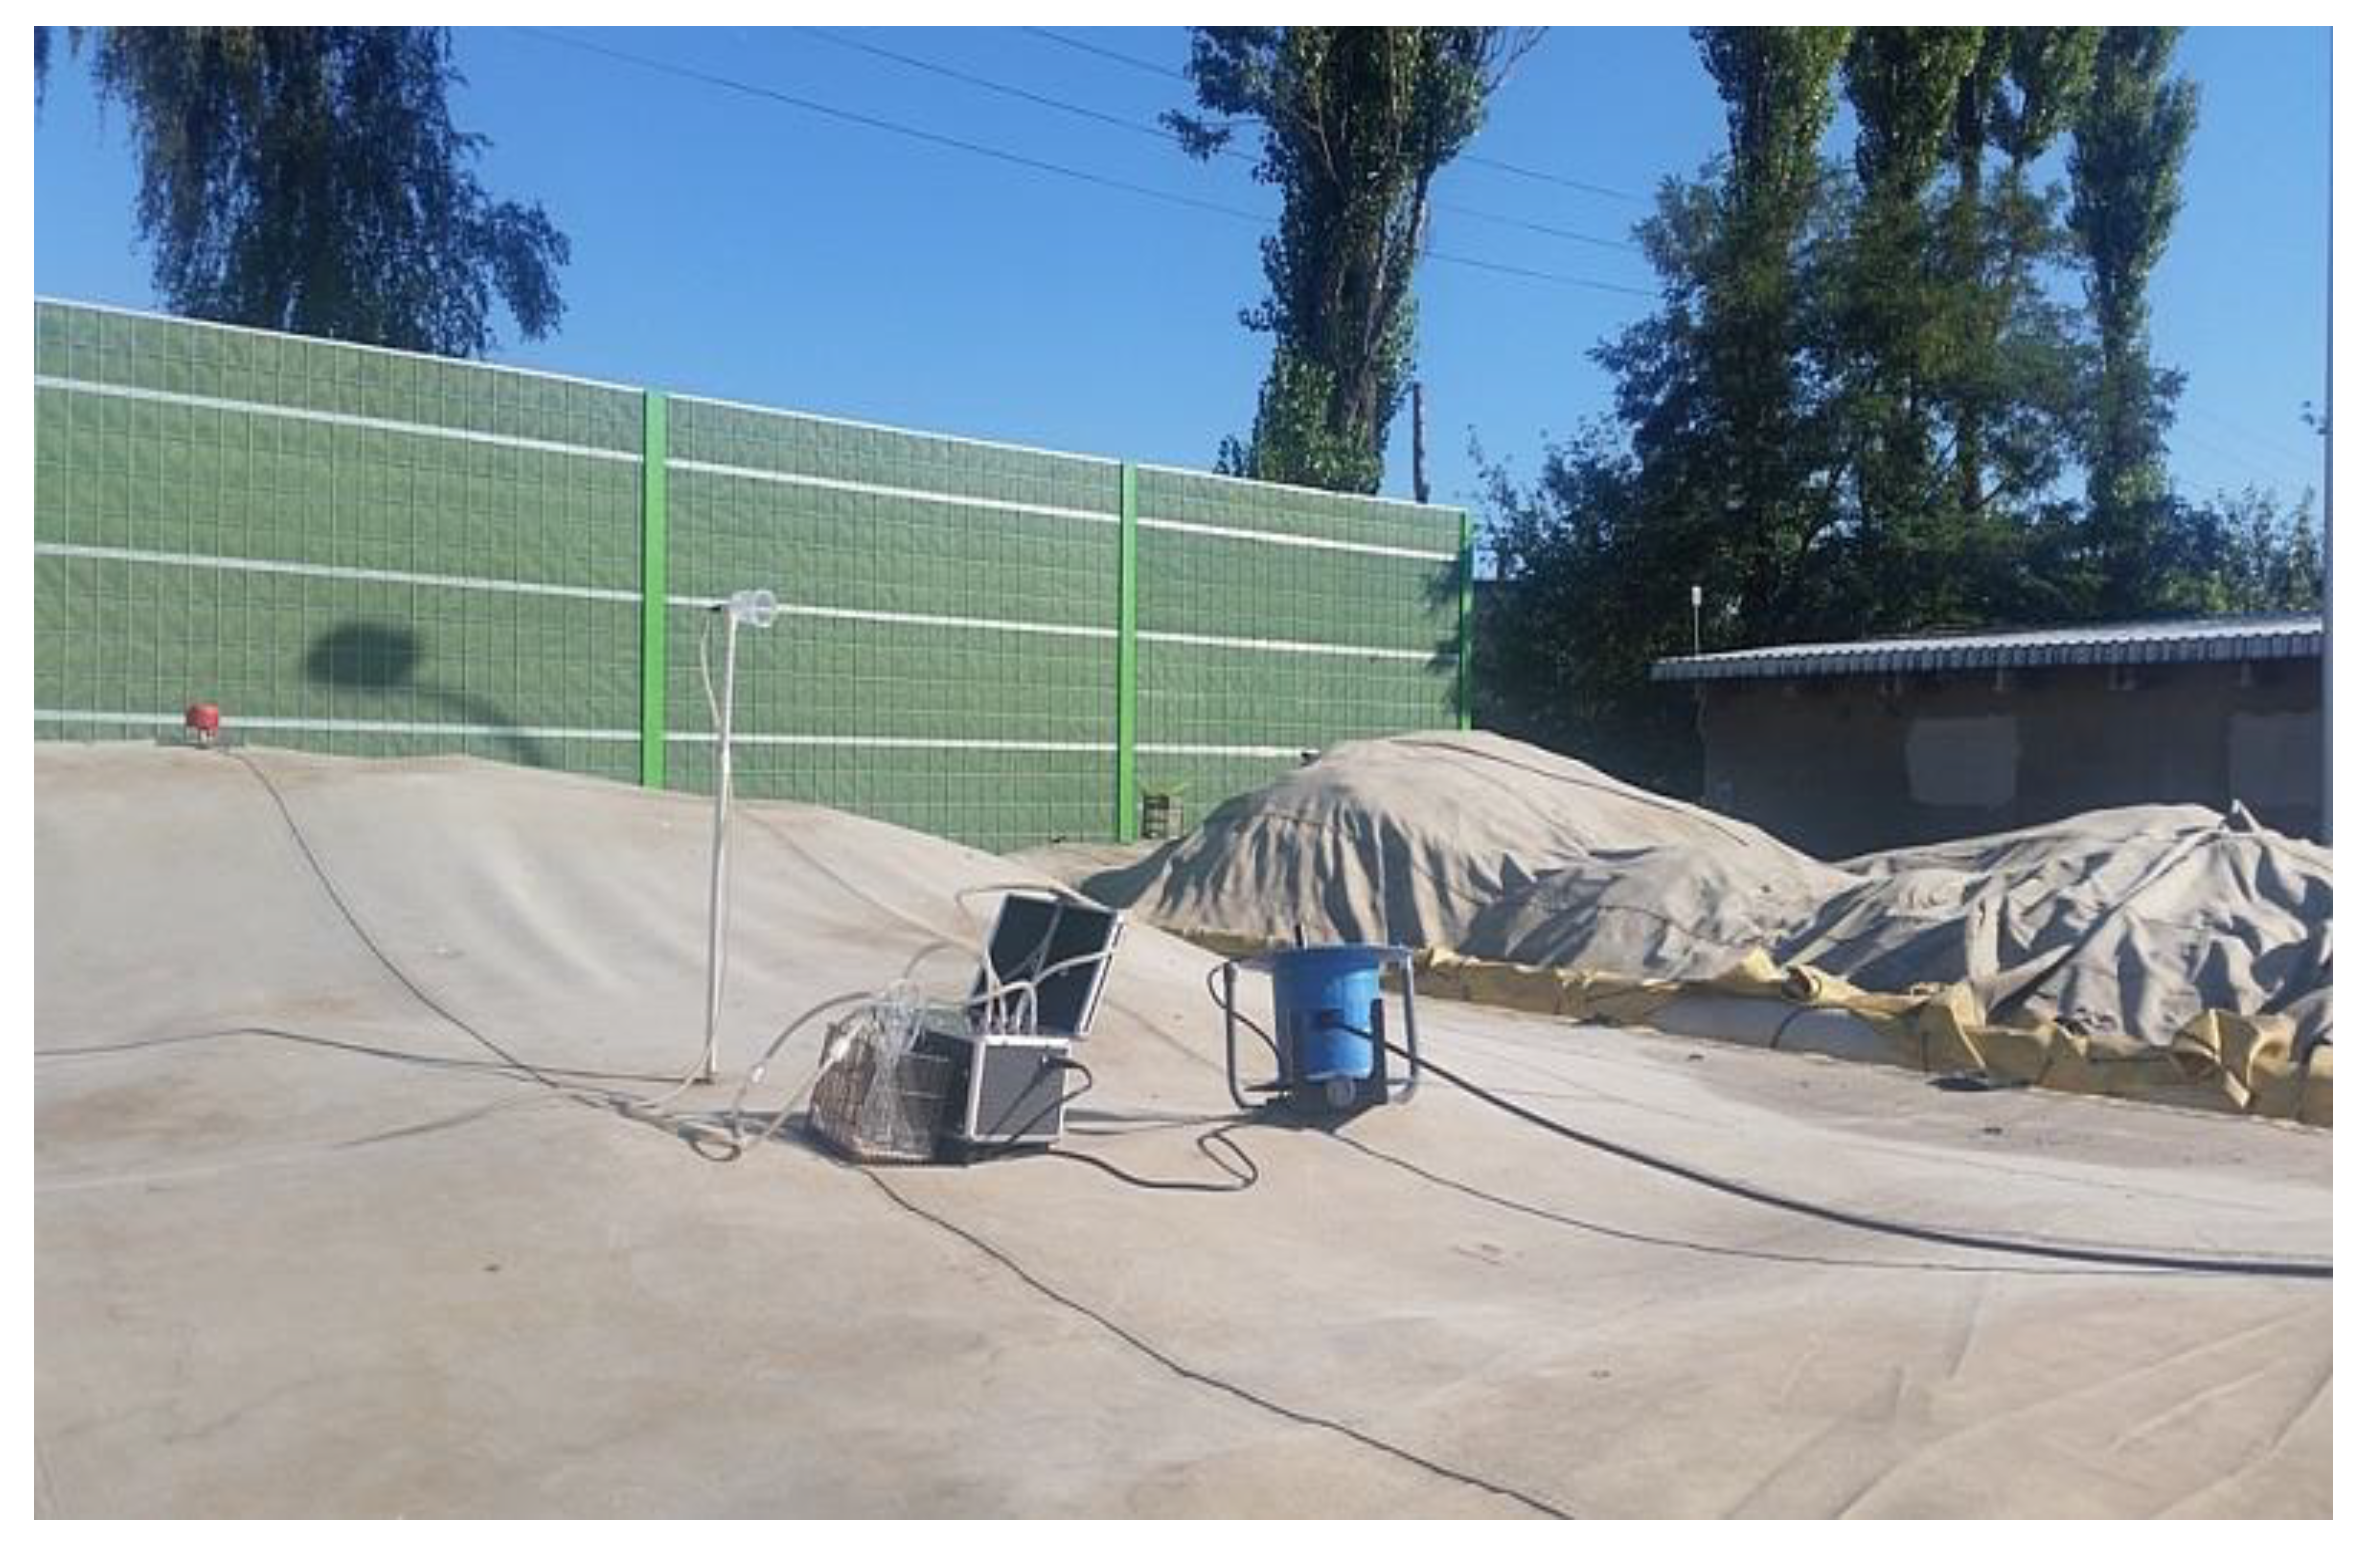
Figure 8.
Measurement station at the waste sheds.
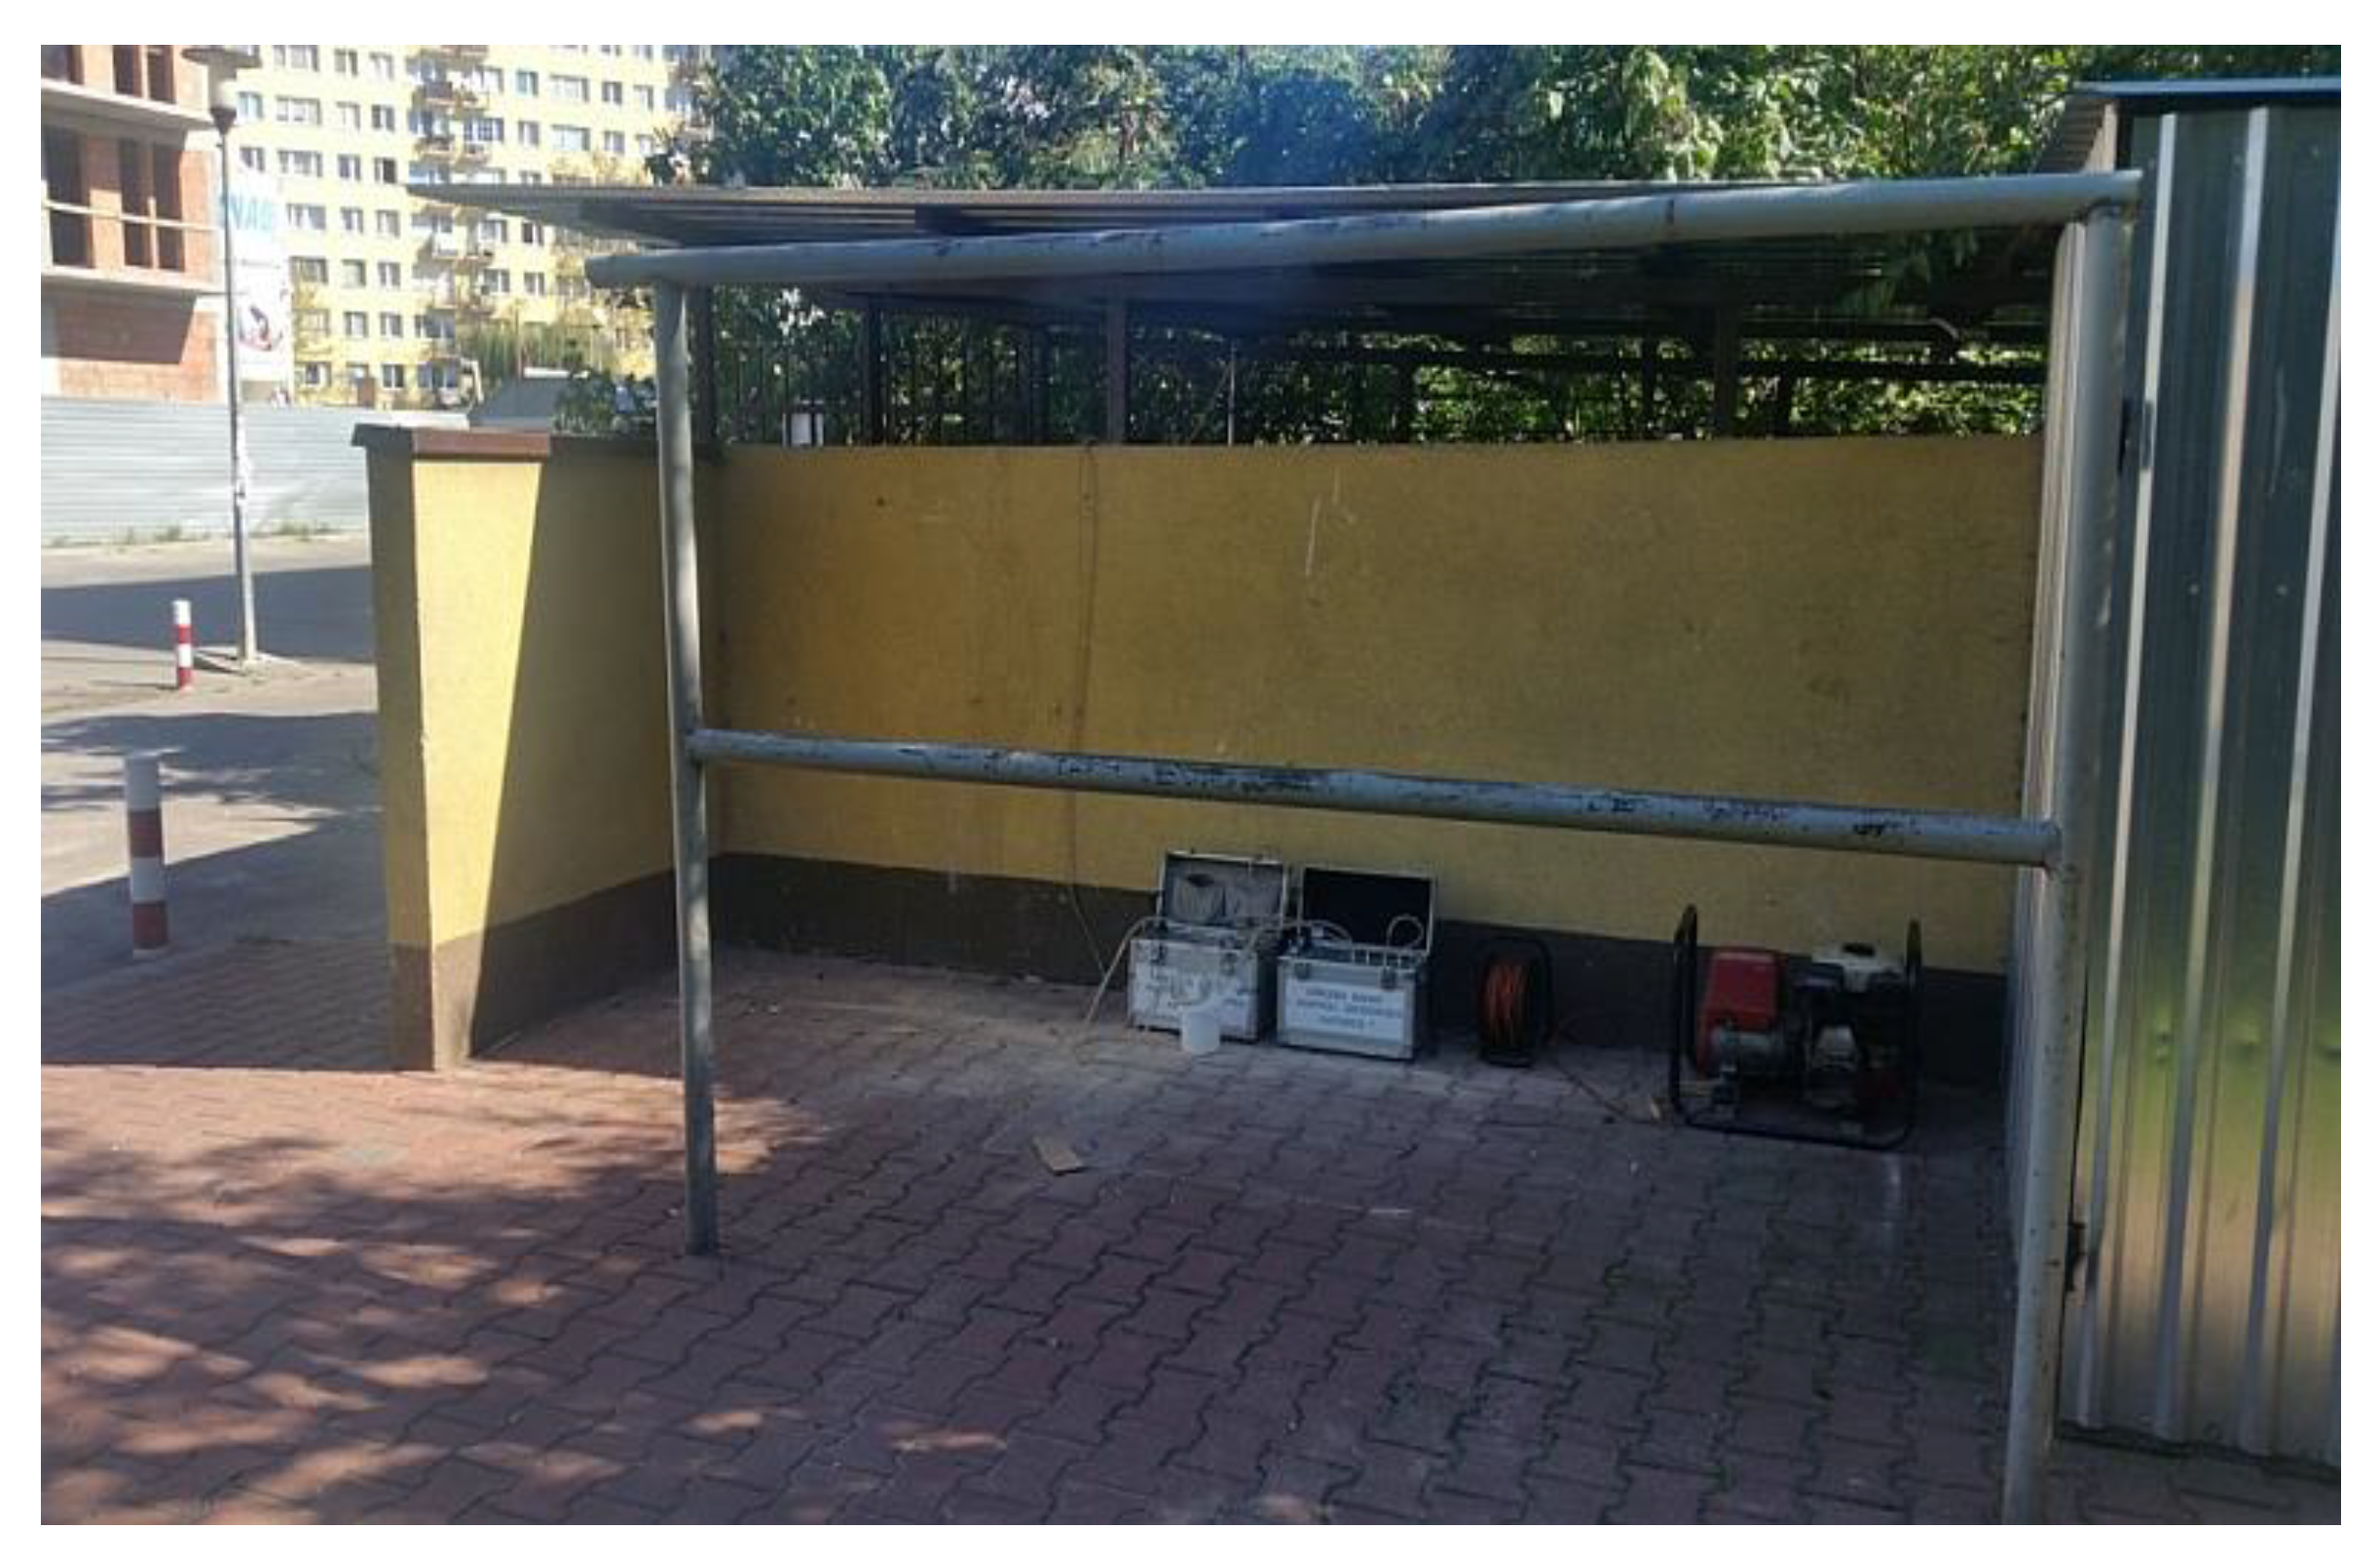
Figure 9.
Collection of gases for scrubbers in the hall.
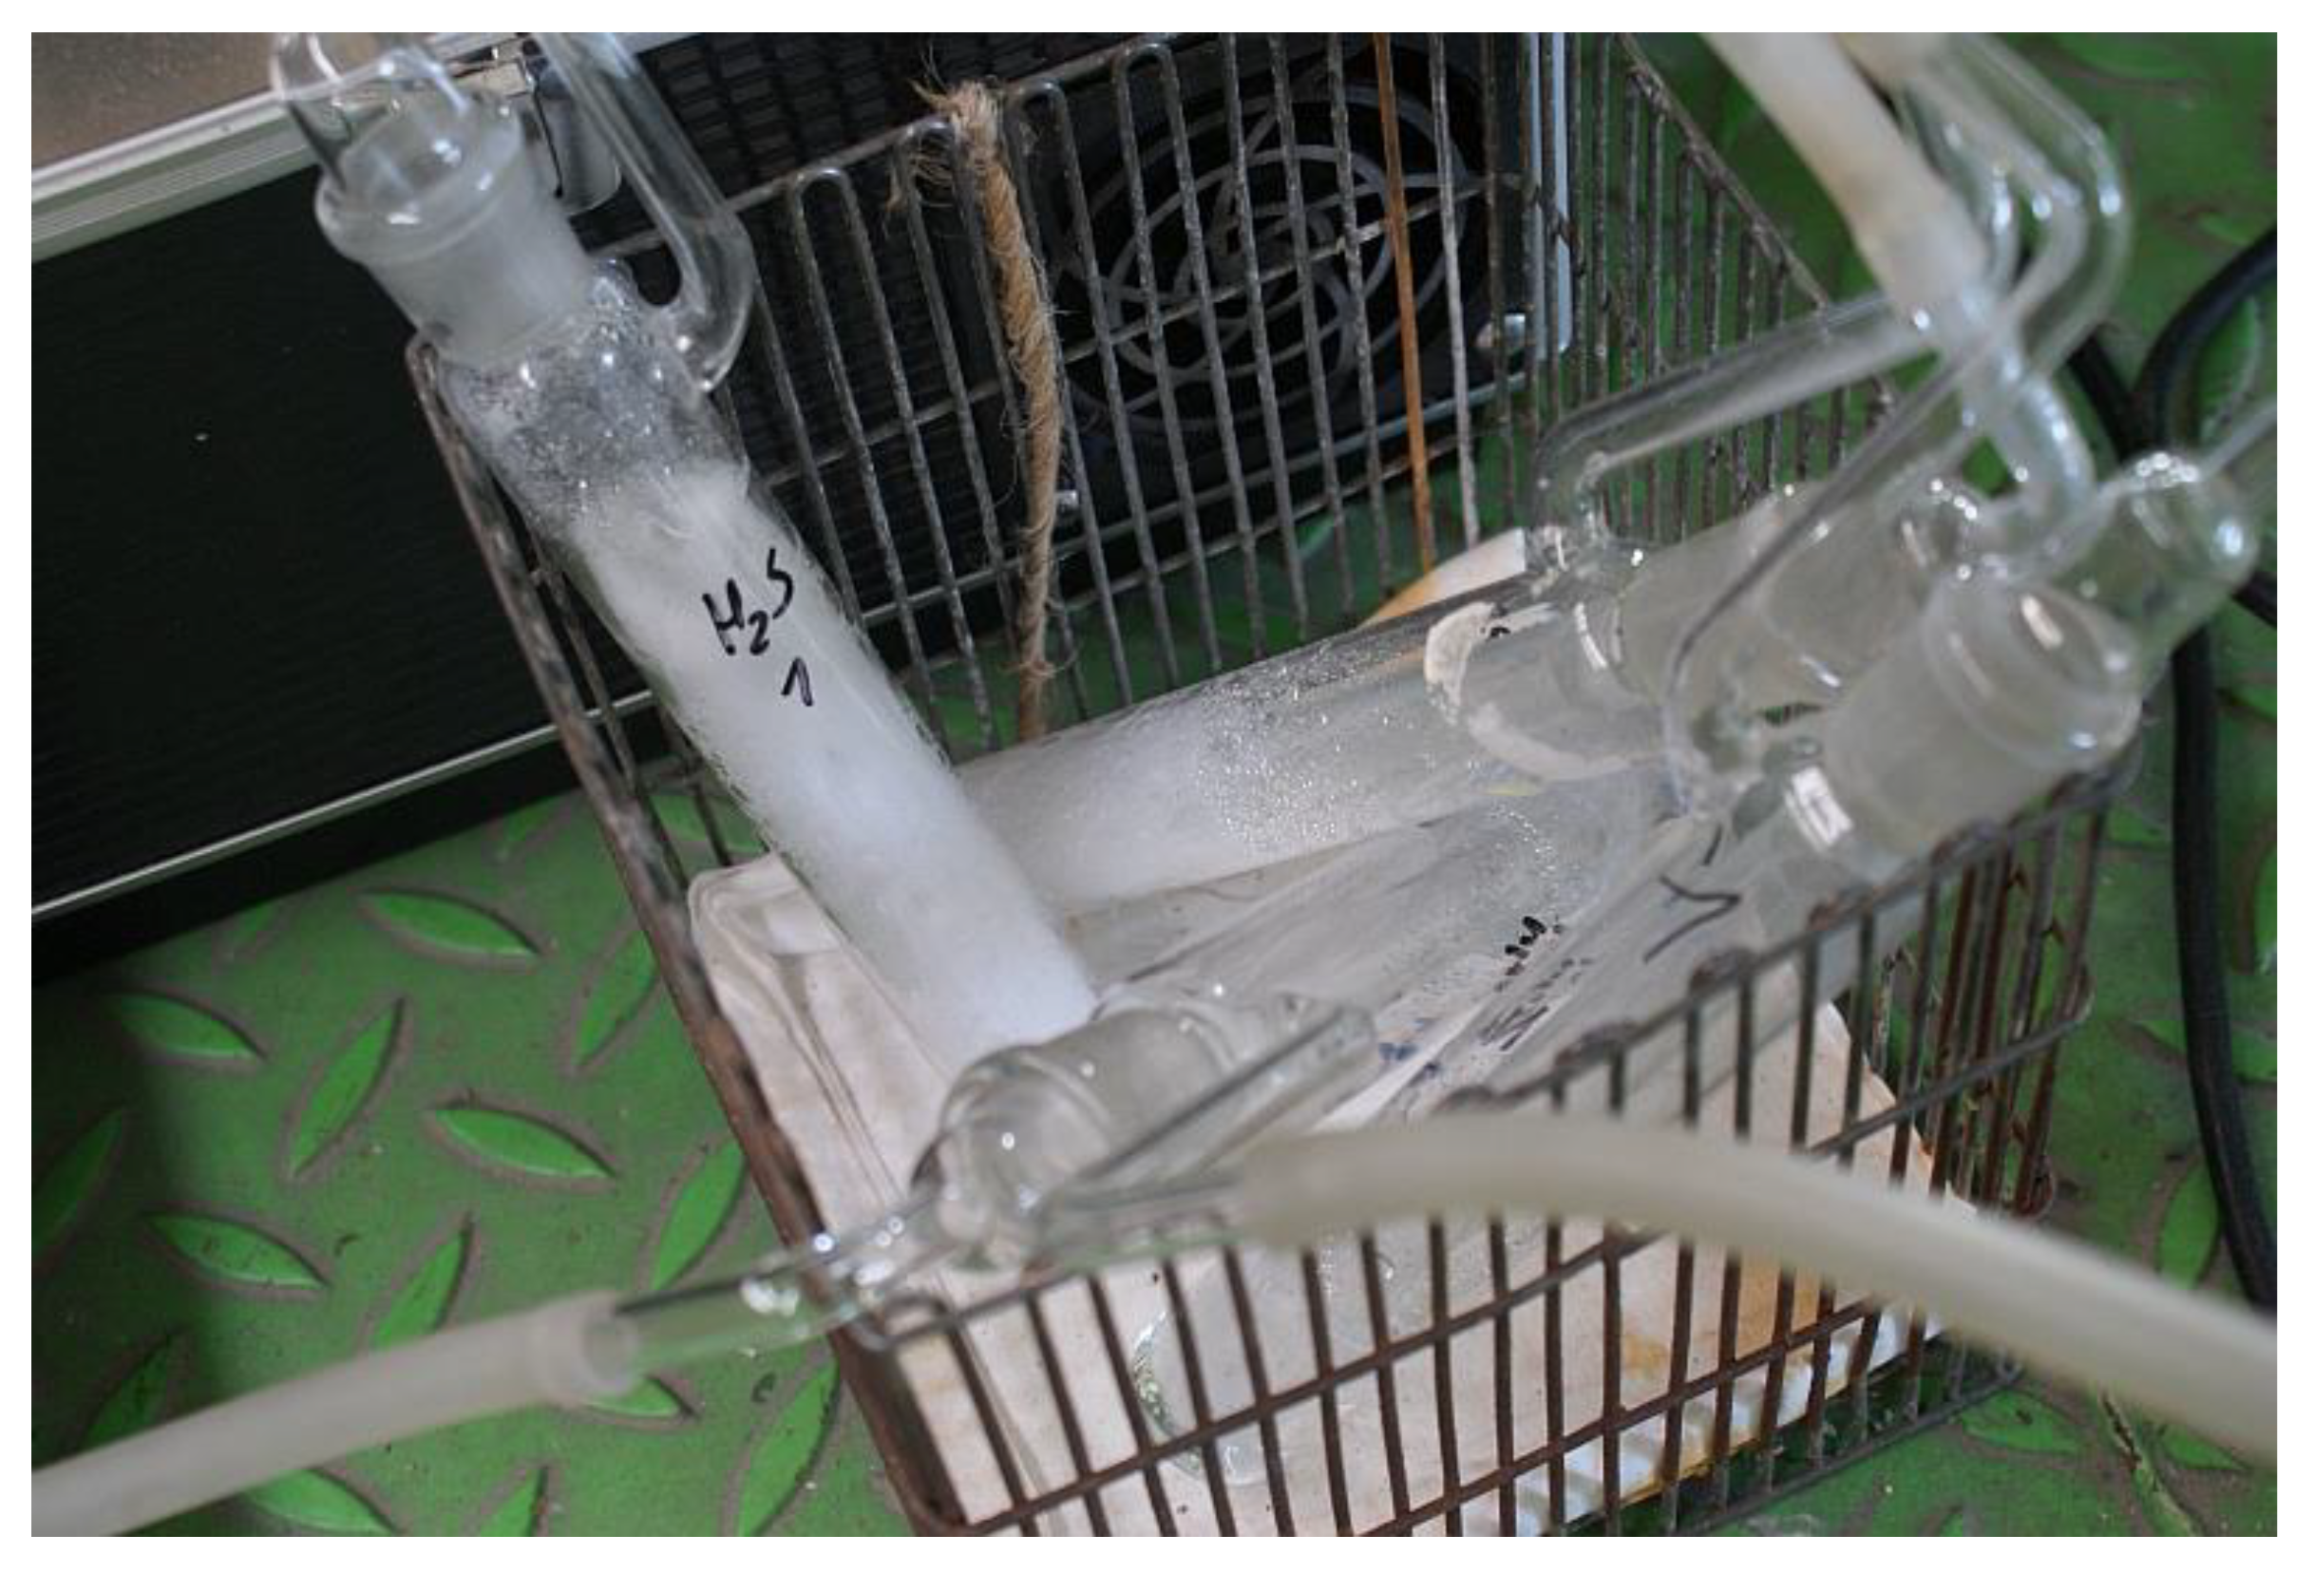
Figure 10.
Bioaerosol collection in the waste treatment hall.
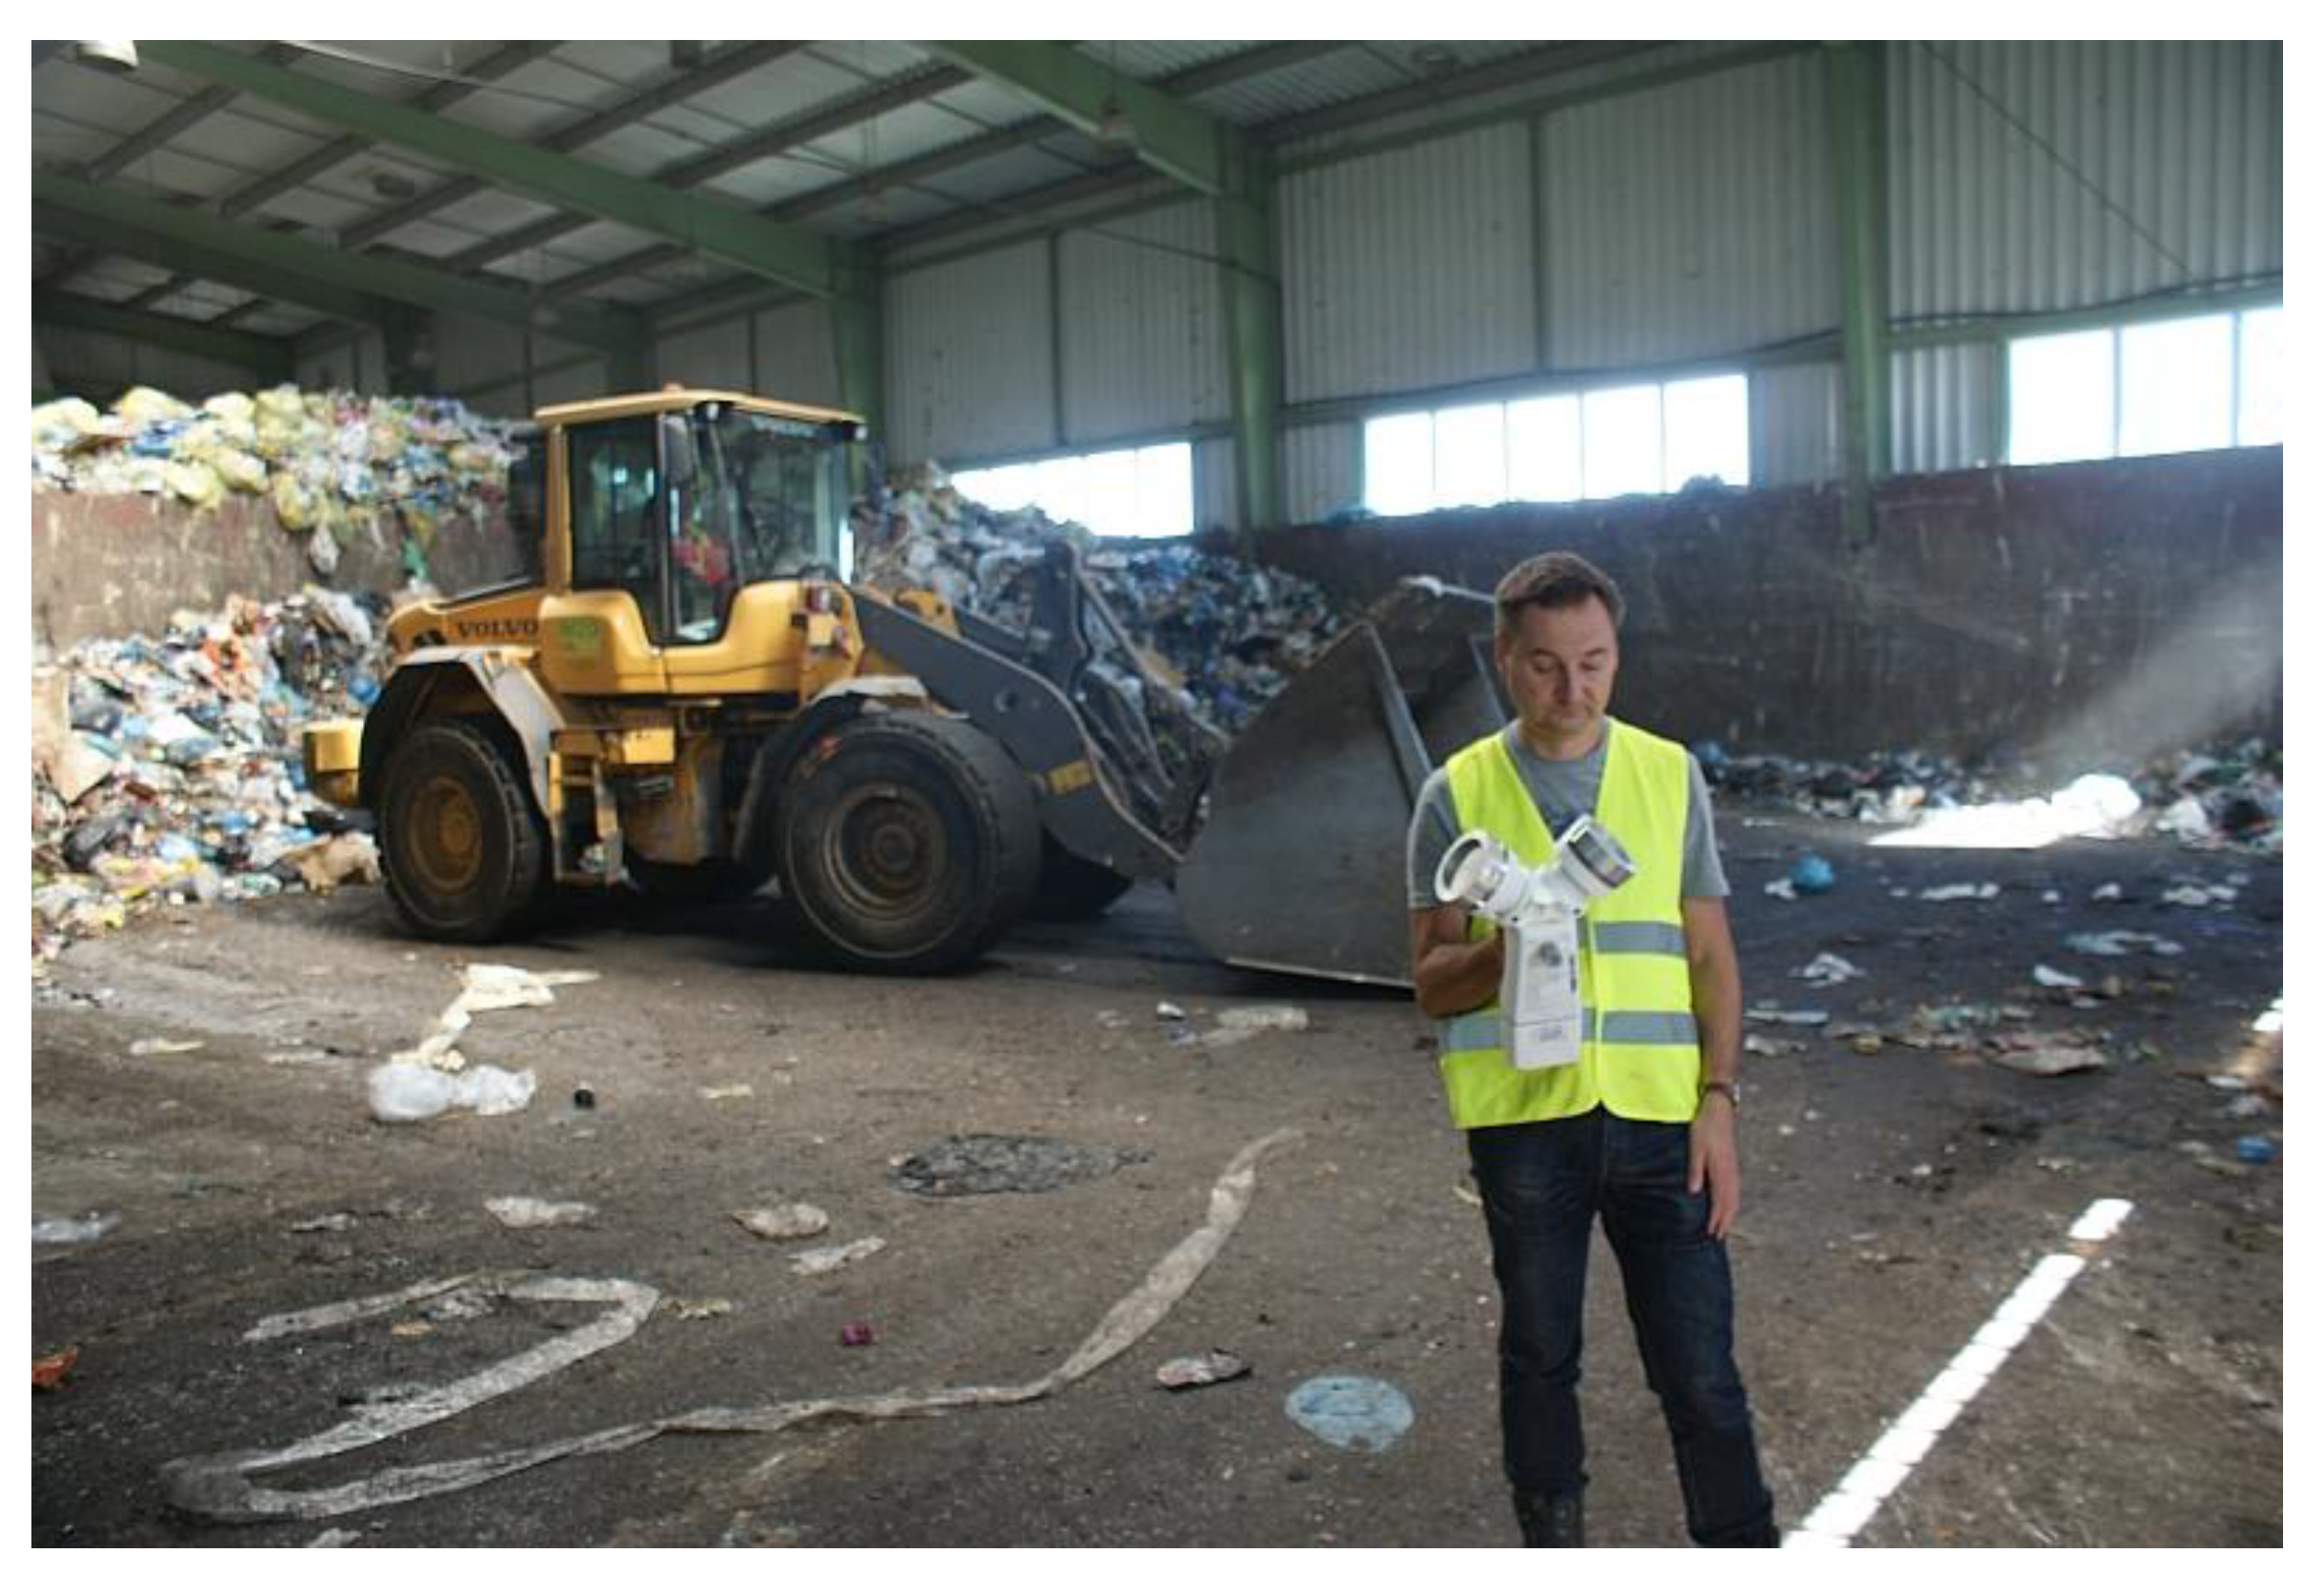
Figure 11.
Isolines of maximum ammonia concentrations, μg/m3(green waste).
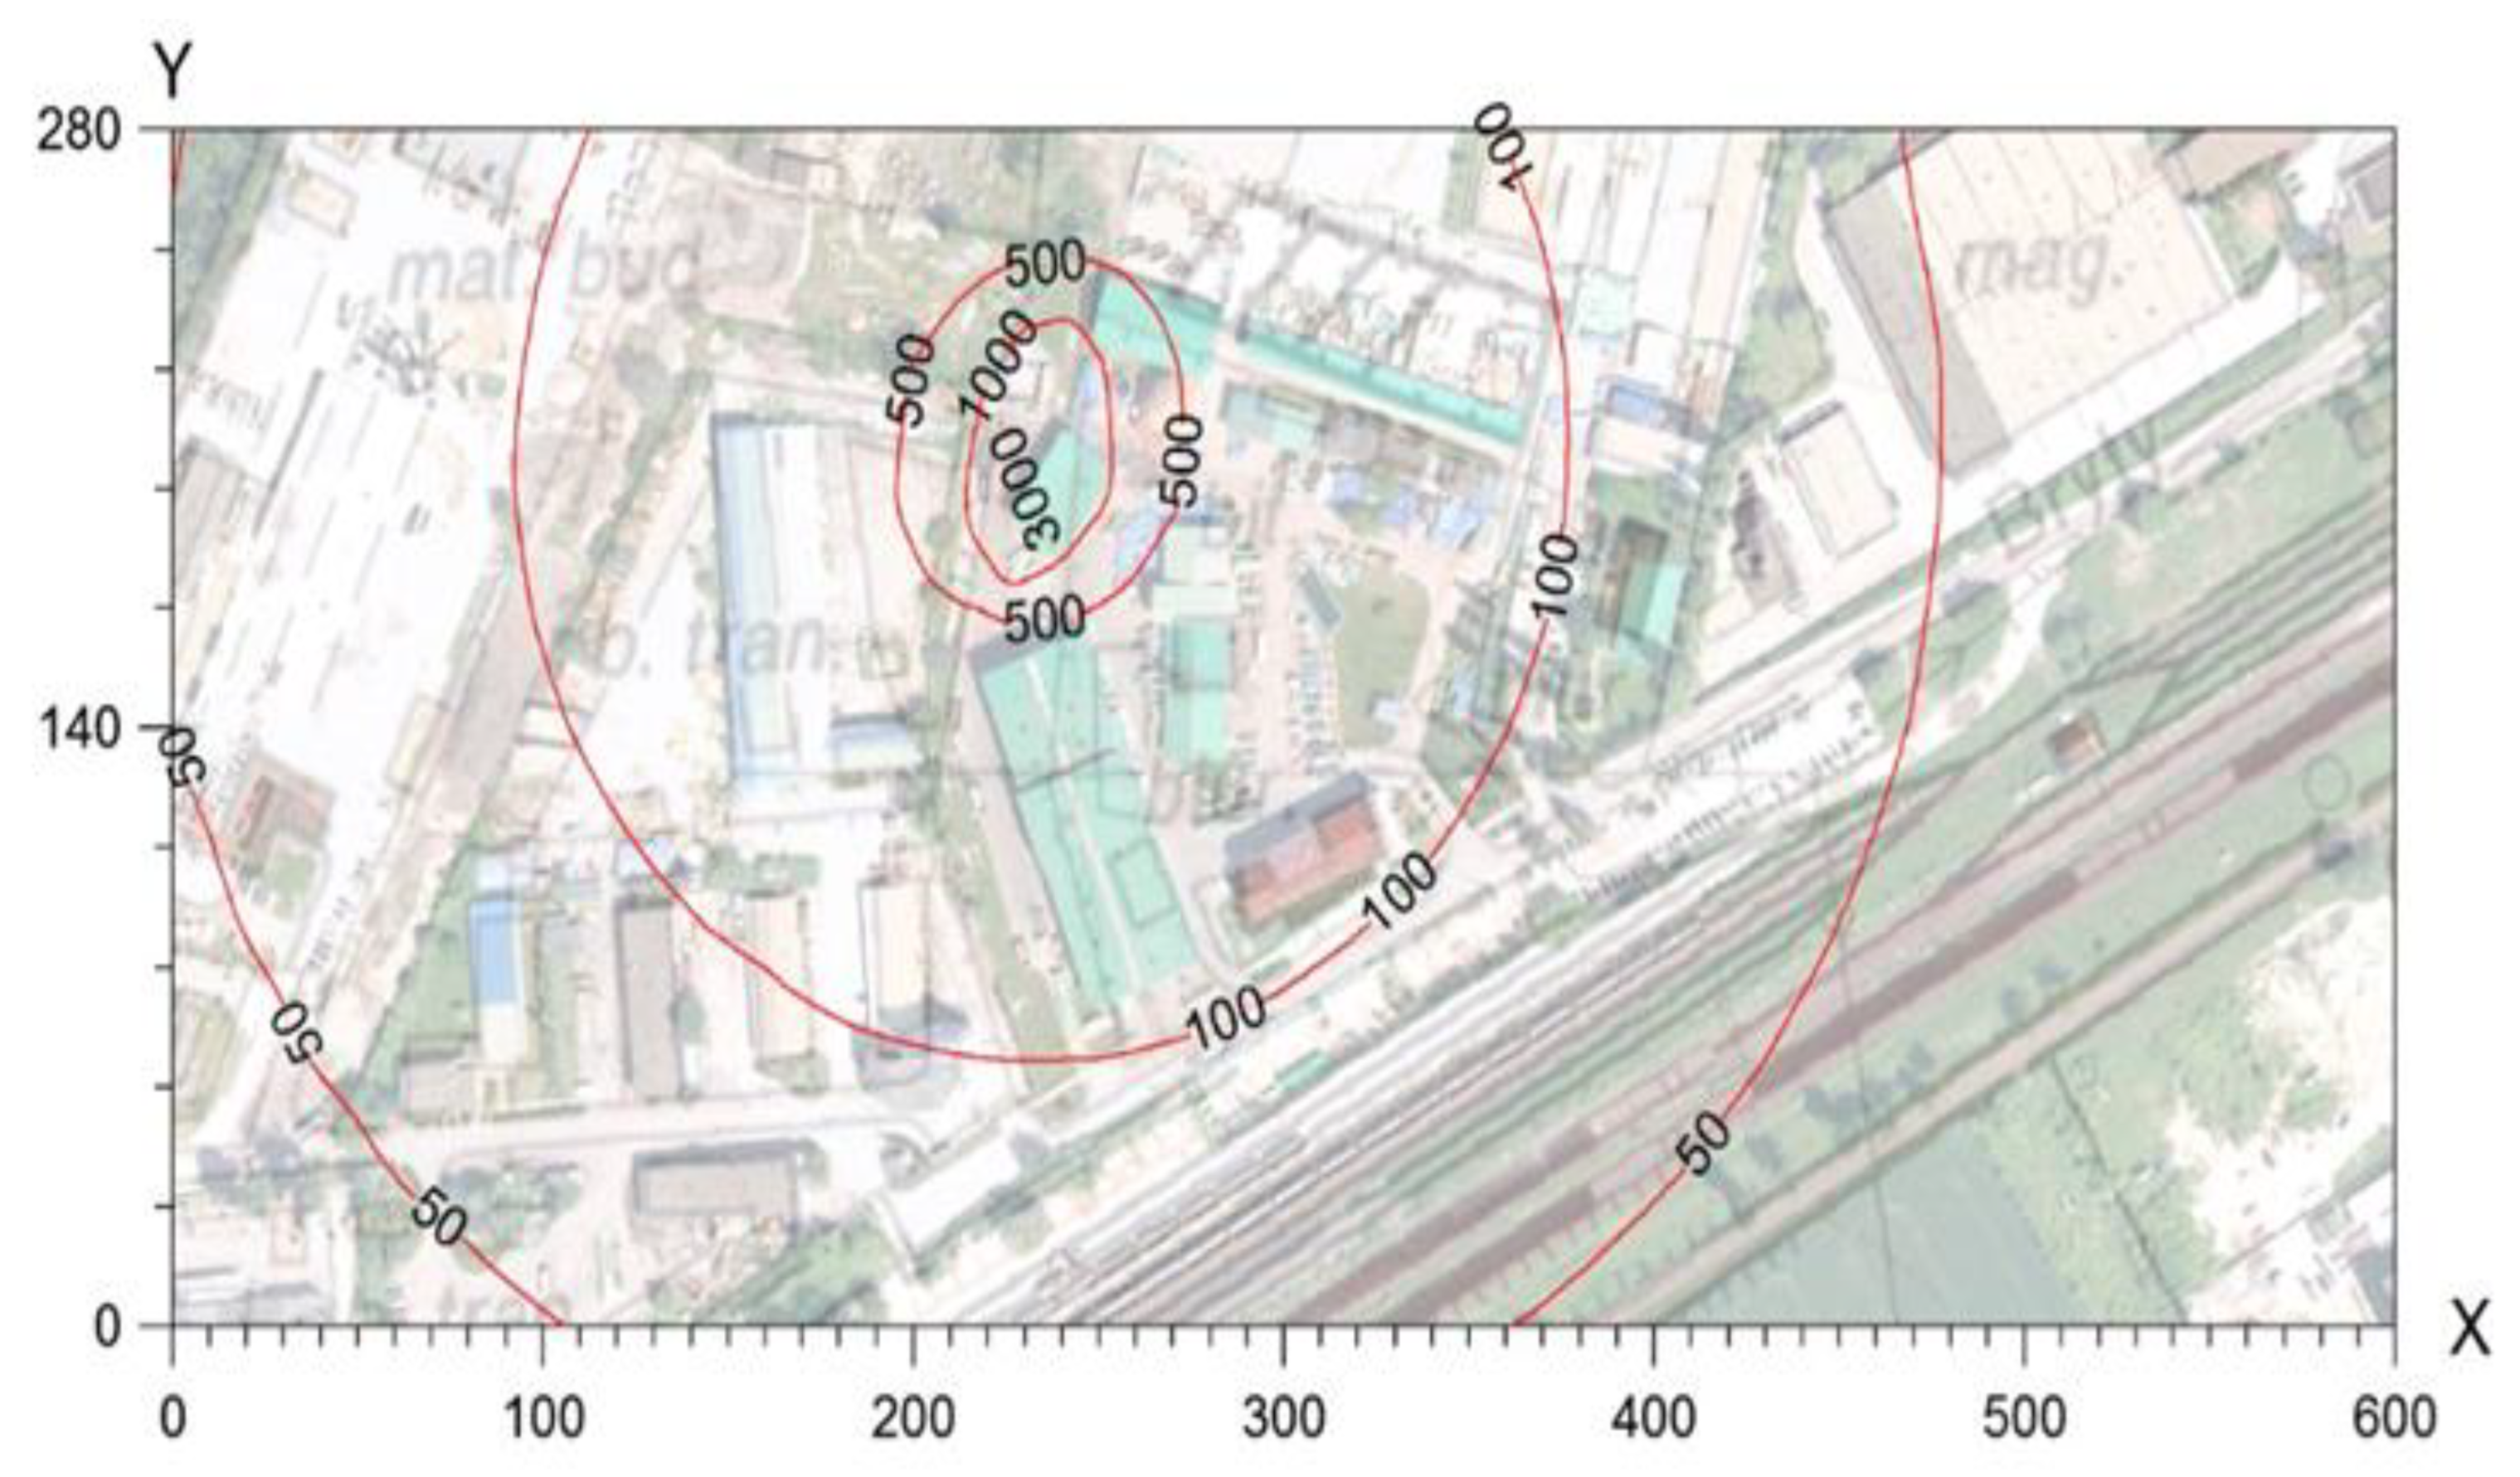
Figure 12.
Isolines of maximum acetone concentrations, μg/m3(green waste).
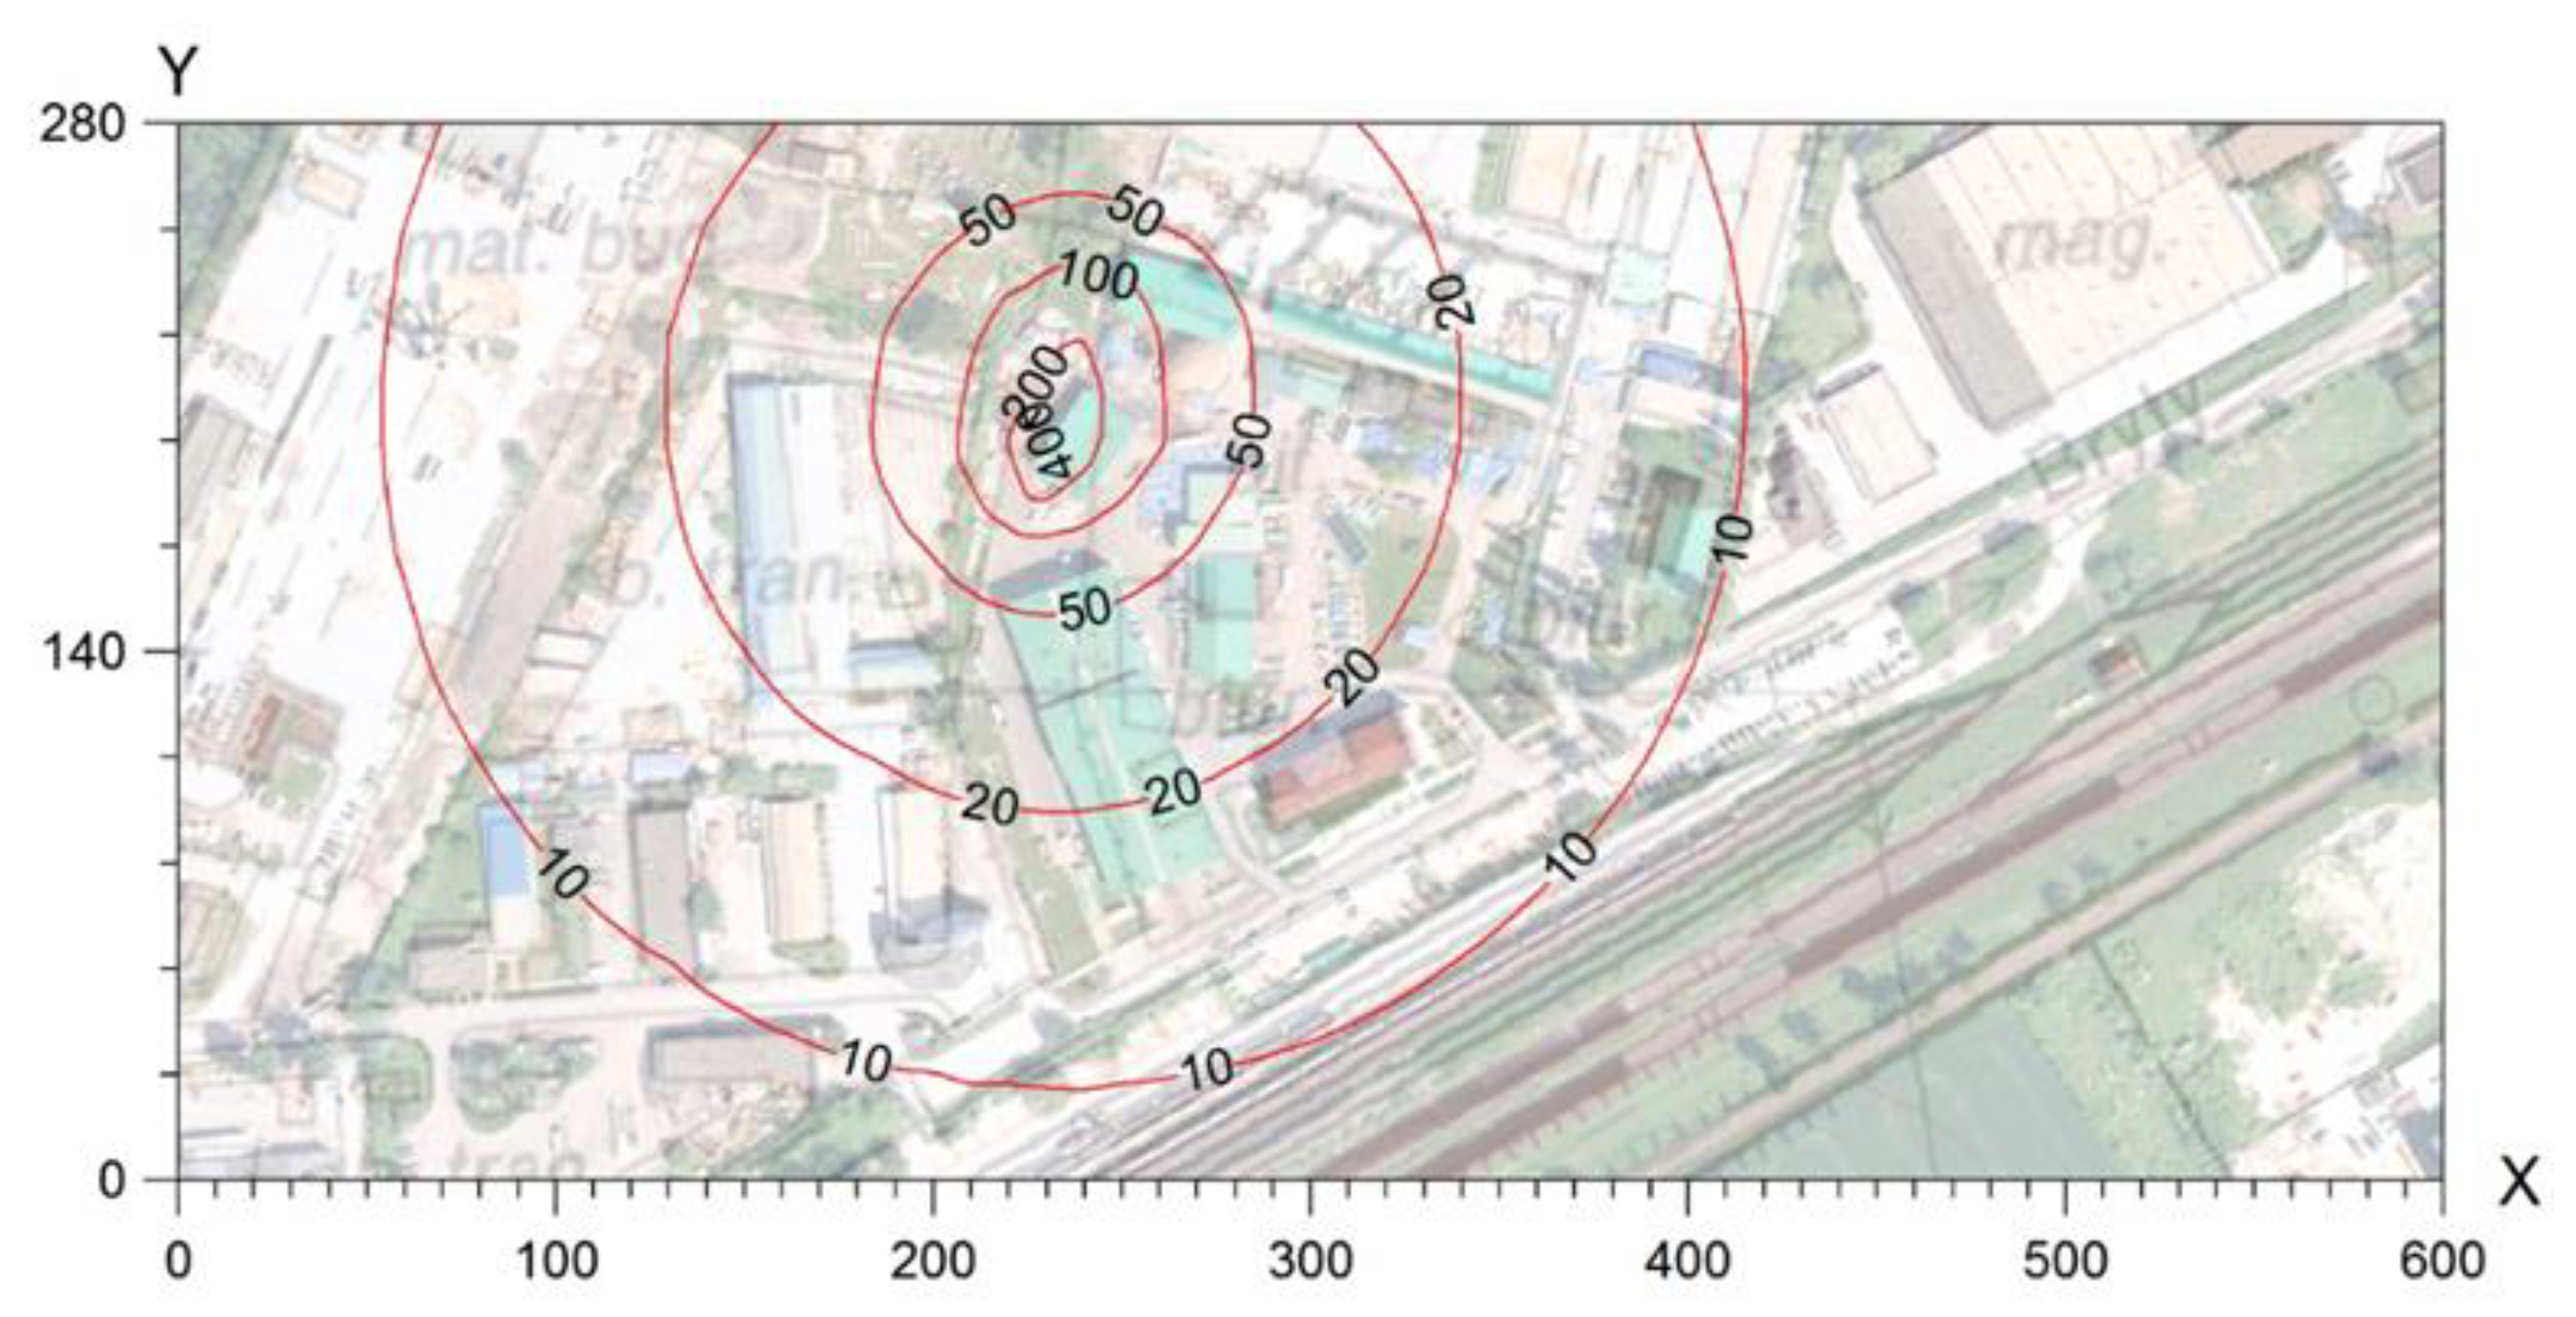
Figure 13.
Isolines of maximum concentrations of mercaptans, μg/m3(green waste).
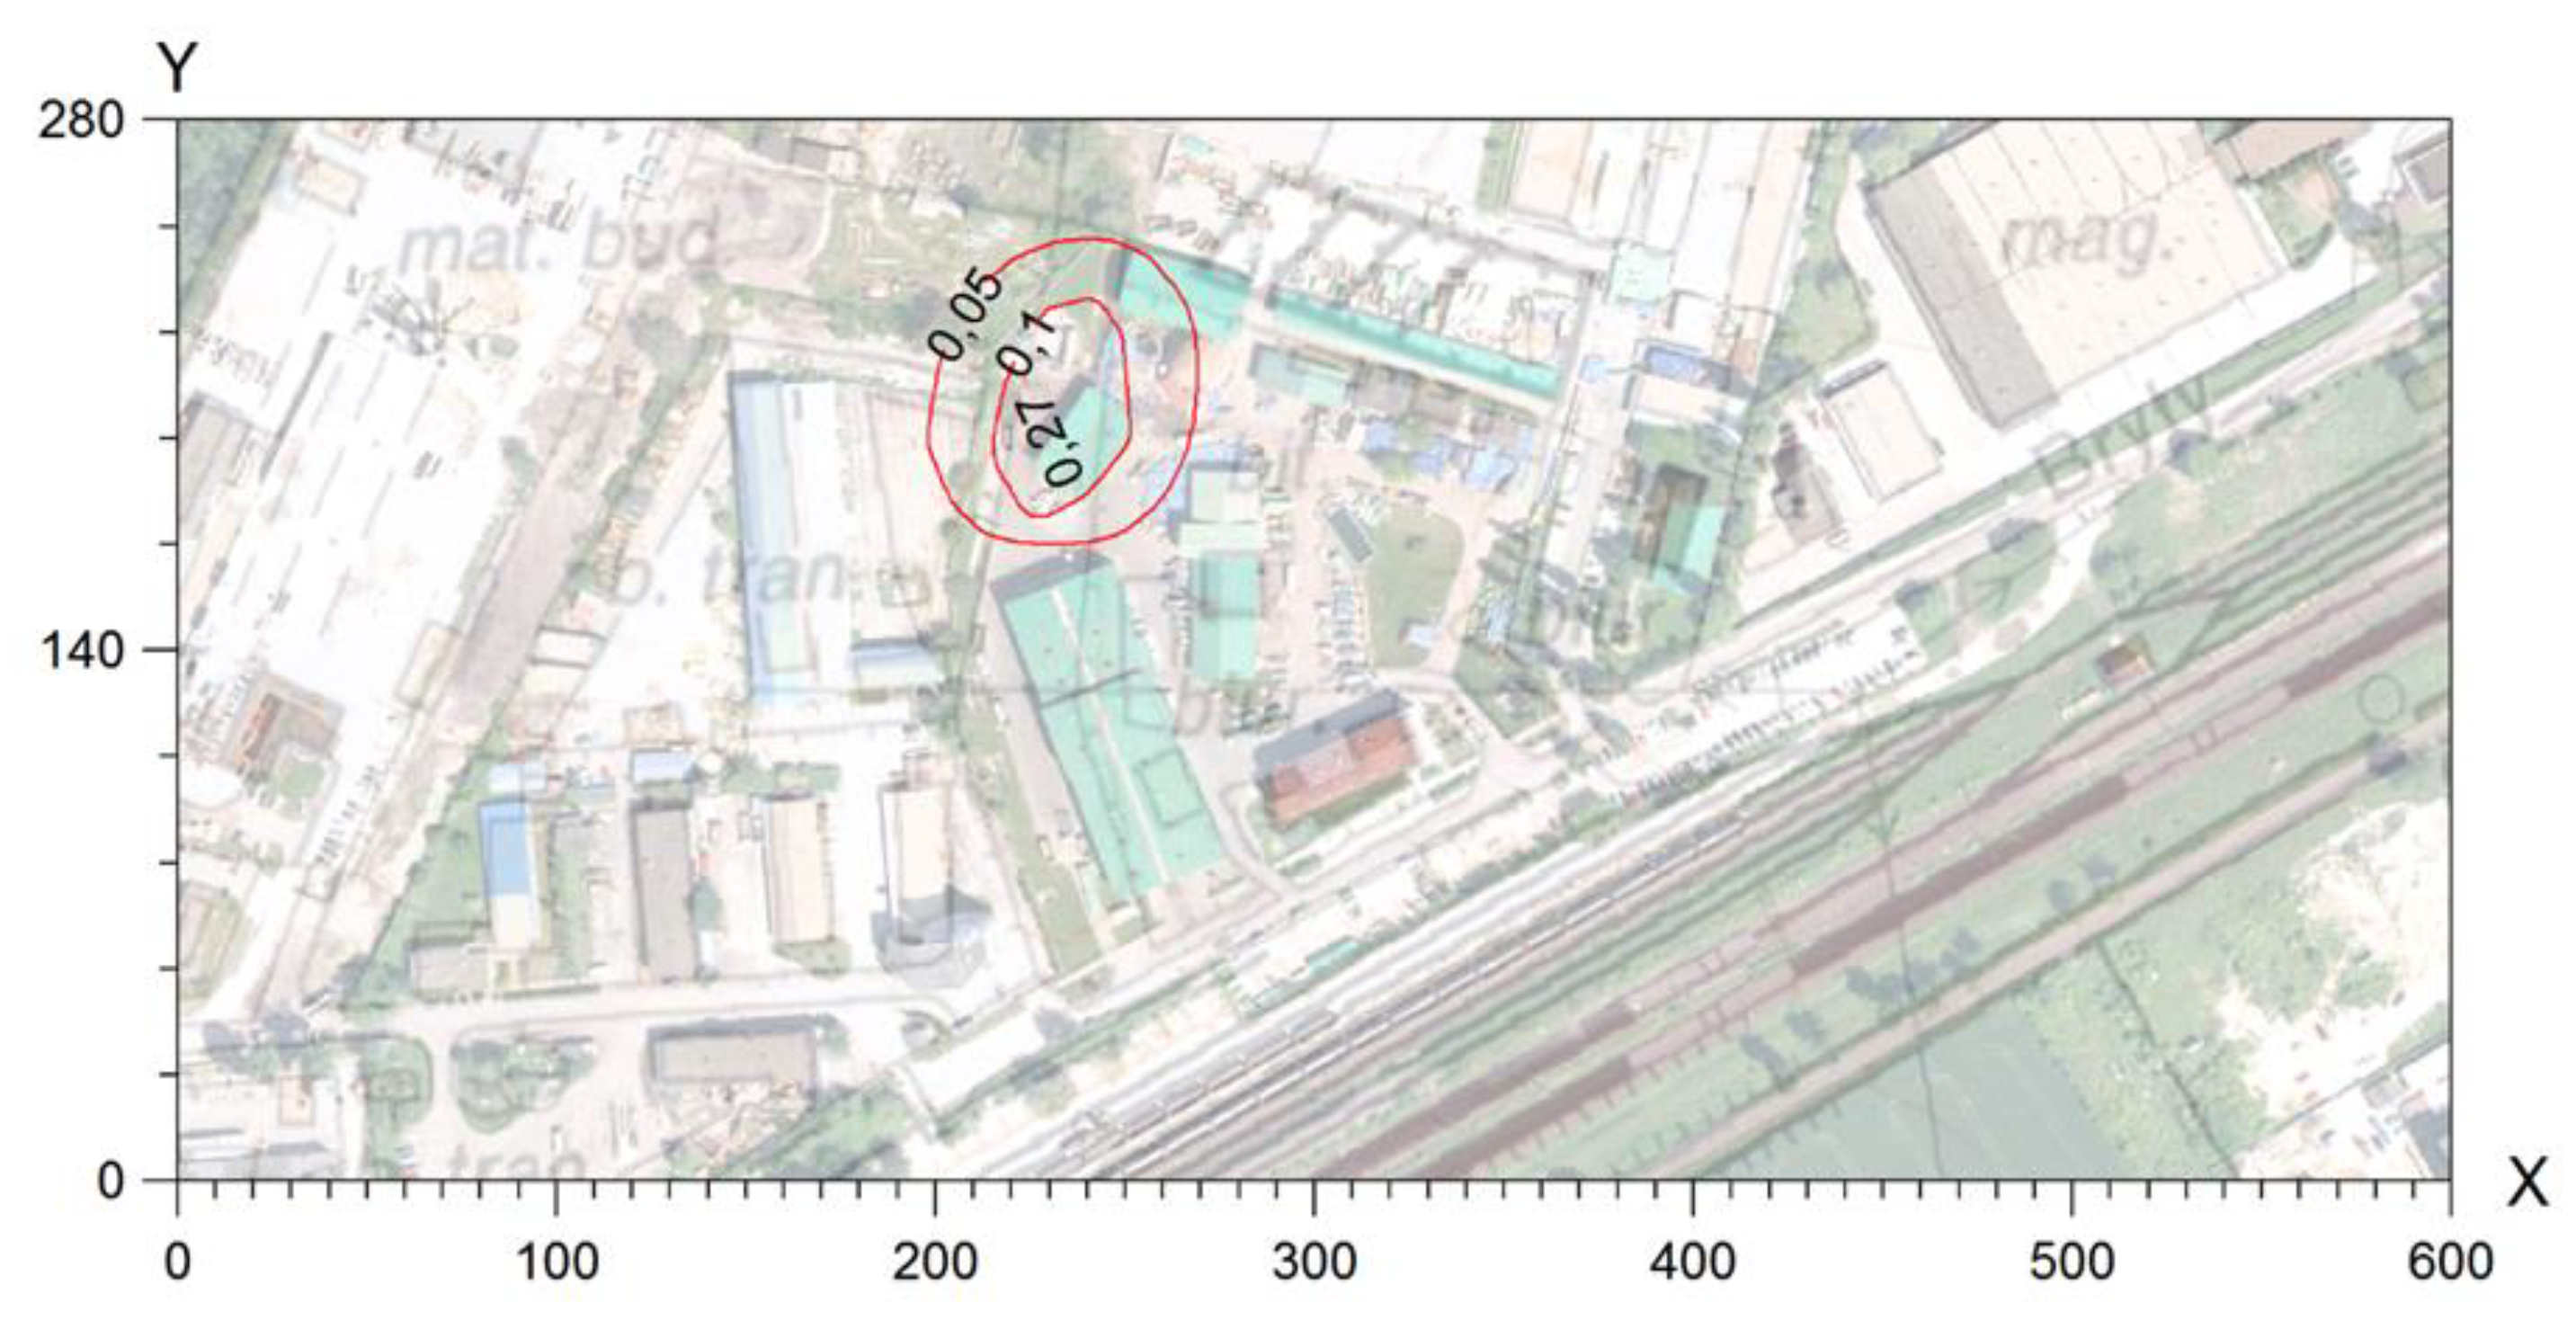
Table 2.
Average results of odour concentration assessment in air samples.
| Point number | Measuring station | Measurement results, OUE/m3 (mean) |
| 1 | Bioreactors | 410.5 |
| 2 | Green waste | 330.5 |
| 3 | Sorting hall | 1,224 |
| 4 | The plant gate in front of the hall | 94.5 |
| 5 | Gate at the entrance to the plant | 131.5 |
| 6 | Level crossing | 107 |
| 7 | Parking in front of the store | 137 |
| 8 | Field point 8 | 113.5 |
| 9 | Field point 9 | 208.5 |
| 10 | Field point 10 | 97 |
| 11 | Store | 118.5 |
| 12 | Field point 12 | 56 |
Table 3.
Methodology of incubation of microorganisms.
| Group of microorganisms | Subsoil microbiological | Incubation temperature (℃) | Incubation time (day) |
|---|---|---|---|
| Mould fungi | Sabourad with chloramphenicol | 26 | 3–5 |
| Mesophilic bacteria | nutrient agar | 37 | 1 |
| Enterobacteriaceae non-lactose fermenting | MacConkey | 37 | 1 |
| Enterobacteriaceae lactose fermenting | MacConkey | 37 | 1 |
| Group cola | Endo-LES | 37 | 1 |
| Mannitol-positive staphylococci | Chapman | 37 | 1–2 |
| Mannitol-negative staphylococci | Chapman | 37 | 1–2 |
Table 3.
Criteria for classification of atmospheric air pollution with bacteria according to PN-89/ Z-04111/02.
Table 3.
Criteria for classification of atmospheric air pollution with bacteria according to PN-89/ Z-04111/02.
| Total number bacteria mesophilic | Number | Degree of pollution air atmospheric | |||
|---|---|---|---|---|---|
| Actinomycetes | Pseudomonas fluorescens | Staphylococci hemolytic | |||
| A | ß | ||||
| <1000 | <10 | Brak | Brak | Brak | Unpolluted |
| 1000–3000 | 10–100 | ≤50 | ≤25 | ≤50 | Average contamination |
| >3000 | >100 | >50 | >25 | >50 | Heavily polluted |
Table 4.
Criteria for contamination of atmospheric air with fungi according to PN-89/Z-04111/03.
| Total number of mushrooms in 1 m3 atmospheric air | Degree of atmospheric air pollution |
|---|---|
| 3000–5000 | Average clean air, especially in late spring and early autumn |
| 5000–10000 | Pollution that may have a negative impact on the human environment |
| >10000 | Pollution that threatens the human environment |
Table 5.
Proposals of recommended concentrations of microorganisms in indoor air developed by the Team of Experts for Biological Factors [Górny 2010].
Table 5.
Proposals of recommended concentrations of microorganisms in indoor air developed by the Team of Experts for Biological Factors [Górny 2010].
| microbiological factor | Permissible concentration [j.t.k./m3] | ||
|---|---|---|---|
| Work rooms with organic dust | Residential and public premises | ||
| Mesophilic bacteria | 100000 | 5000 | |
| Gram-negative bacteria | 20000 | 200 | |
| Thermophilic actinomycetes | 20000 | 200 | |
| Mushrooms | 50000 | 5000 | |
| Factors from groups 3 and 4 of the threat | 0 | 0 | |
Table 6.
Proposals for assessing the degree of microbiological contamination of atmospheric air developed by the Team of Experts for Biological Factors [Górny 2010].
Table 6.
Proposals for assessing the degree of microbiological contamination of atmospheric air developed by the Team of Experts for Biological Factors [Górny 2010].
| Bioaerosol component | Degree of atmospheric air pollution | |
|---|---|---|
| Acceptable | Unacceptable | |
| Mesophilic bacteria | ≤5000 j.t.k. | >5000 j.t.k. |
| Gram-negative bacteria | ≤200 j.t.k. | >200 j.t.k. |
| Thermophilic actinomycetes | ≤200 j.t.k. | >200 j.t.k. |
| Mushrooms | ≤5000 j.t.k. | >5000 j.t.k. |
| Factors from groups 3 and 4 of the threat | 0 j.t.k. | >0 j.t.k. |
Table 7.
Concentrations of malodorous substances.
| Measuring stations | Measurement results, µg/m3 | |||||
|---|---|---|---|---|---|---|
| Ammonia | Hydrogen sulphide | Mercaptan ethyl | Mercaptan butyl | Acetone | PAH -sum | |
| Sorting hall | 110 | <17 | <0,20 | <0,20 | 150 | <10 |
| Green waste | 4380 | <17 | 0,95 | 0,80 | 520 | <10 |
| Bioreactors–early phase | 370 | <17 | 0,25 | 0,22 | 750 | <10 |
| Bioreactors–late phase | 220 | <17 | <0,20 | <0,20 | 100 | <10 |
| Waste shed | 150 | <17 | <0,20 | <0,20 | 150 | <10 |
| Shop (background) | 97 | <17 | <0,20 | <0,20 | <50 | <10 |
Table 8.
Analysed odorous substances and their olfactory thresholds according to various literature data.
Table 8.
Analysed odorous substances and their olfactory thresholds according to various literature data.
| Substance (its names) | SPWW [20,21,22,23,24] | SPWW[25] | SPWW[26] | SPWW[27] | SPWW[28] | Smell |
|---|---|---|---|---|---|---|
| μg/m3 | ||||||
| Ammonia NH3 |
400 | 5750 | - | 28 | - | Ammoniacal, irritant |
| Hydrogen sulphide (Sulfan) H2S |
11,3 | 18 | - | - | 12,1 | Rotten eggs |
| Ethanethiol (Mercaptan ethyl) C2H5SH |
- | 1,1 | - | 0,52 | 2,2 | Skunk secretions, garlic |
| Butanethiol (Mercaptan butyl) CH3(CH2)3SH |
3,64 | - | - | - | - | Mustard, rotting cabbages, skunk secretions |
| Propanone (Acetone) CH3COCH3 | 31 400 | - | - | - | - | Ethereal |
SPWW – olfactory threshold – (minimum concentration detectable by the sense of smell) - concentration at which the smell is detectable by 50% of people in a group representative of the population.
Disclaimer/Publisher’s Note: The statements, opinions and data contained in all publications are solely those of the individual author(s) and contributor(s) and not of MDPI and/or the editor(s). MDPI and/or the editor(s) disclaim responsibility for any injury to people or property resulting from any ideas, methods, instructions or products referred to in the content. |
© 2025 by the authors. Licensee MDPI, Basel, Switzerland. This article is an open access article distributed under the terms and conditions of the Creative Commons Attribution (CC BY) license (http://creativecommons.org/licenses/by/4.0/).
Copyright: This open access article is published under a Creative Commons CC BY 4.0 license, which permit the free download, distribution, and reuse, provided that the author and preprint are cited in any reuse.


