
Submitted:
18 September 2025
Posted:
18 September 2025
You are already at the latest version
Abstract
Excitatory and inhibitory (E/I) interactions are central to neural computation, but most studies of E/I "balance" have focused on functional measurements. Far less is known about how balance is constrained by the anatomical distribution of excitatory and inhibitory synapses. This work introduces an approach that quantifies how synaptic anatomy itself shapes the template for this balance. Here, I introduce the Olivera Bias Metric (OBM), a two-dimensional framework that quantifies synaptic bias at the level of individual neurons using a large-scale connectomic dataset. OBM defines input bias as OBMinput = (Ein - Iin) / (Ein + Iin) and output bias as OBMoutput = (Iout - Eout) / (Eout + Iout) , with values normalized between [-1 and 1]. Applied to the Drosophila melanogaster optic lobe connectome (optic-lobe:v1.1), OBM was computed for 53,979 neurons with defined excitatory and inhibitory synaptic weight counts. The analysis revealed structured, transmitter-specific quadrant motifs, cholinergic neurons were broadly distributed, GABAergic and glutamatergic neurons clustered toward excitatory-biased quadrants, and histaminergic neurons displayed polarized bimodal distributions. The neuromodulatory transmitters: dopamine and octopamine also showed distinct and non-random patterns despite their smaller populations. These results indicate that synaptic bias reflects circuit-specific organization rather than stochastic variation. OBM thus provides a compact and interpretable framework for mapping excitatory-inhibitory balance in large connectomic data. While demonstrated here in the Drosophila melanogaster optic lobe, the metric is general and can be adapted to other brain regions and species as reliable neurotransmitter annotations become available. By revealing structured bias landscapes, OBM offers a foundation for possible hypothesis-driven investigations into how excitatory and inhibitory biases shape neural circuits.
Keywords:
Connectomics
; synaptic bias
; excitatory-inhibitory balance
; Drosophila melanogaster
; optic lobe
; computational neuroscience
; neurotransmitters
Introduction
The balance between excitatory and inhibitory (E/I) signaling is a central feature of the mammalian cortical circuits. Elevations in this balance have shown that it can disrupt information processing and behavior (Yizhar et al., 2011), and disruptions are widely considered a hallmark of neuropsychiatric disorders such as autism (Sohal & Rubenstein, 2019). This framework emphasizes that maintaining an appropriate ratio of excitatory to inhibitory activity is critical for stable computation and brain health (Lam et al., 2023).
Although most of this work focused on the mammalian cortex, it illustrates a principle that is relevant across all nervous systems: balance can act as a structural and functional constraint. For example, Iascone et al. (2020) reconstructed more than 90,000 synapses from across twelve L2/3 PNs and uncovered structured organization of E and I synapses across dendritic domains as well as within individual dendritic segments and found that excitatory and inhibitory inputs were distributed in a highly precise manner across the dendrites. These findings show that balance is not only seen functionally but also emerges with fine spatial precision at the single cell level.
Prior experimental work on the mammalian cortex has shown that disrupting this E/I balance produces clear changes in information processing and behavior (Yizhar et al., 2011). Such findings suggest that E/I balance is not just arbitrary but actively constrained to maintain stable circuit function. At the single neuron level, the summation rule dictates that a spike occurs only if excitatory input outweighs inhibition (Hao et al., 2009). Because this thresholding depends directly on the ratio of excitatory to inhibitory synapses, their distribution cannot be random: biased architectures will necessarily shape how readily a neuron reaches firing threshold. If synaptic inputs were distributed stochastically, additional regulatory mechanisms would have to work disproportionately hard to stabilize the functional E/I balance. Thus, observing structured patterns in synapse numbers would indicate circuit level design rather than noise. From this perspective, biases in excitatory and inhibitory connectivity are unlikely to be random. When examining a large connectomic dataset, such as the 53,979 neurons in the Drosophila melanogaster optic lobe, any pattern observed likely reflects underlying principles of circuit organization, rather than random noise.
However, that balance is not universal. Comparative and pathological studies show that excitation–inhibition ratios vary across contexts. Roberts et al. (2025) used synapse-level comparative connectomics to analyze olfactory circuits in two Drosophila species and found that while much of the circuit blueprint was conserved, species-specific rewiring introduced systematic shifts in synapses. In a different context, Matsumuro et al. (2025) examined a prenatal autism spectrum disorder and identified depth-specific disruptions of synaptic E/I organization in the anterior cingulate cortex (ACC), which was associated with impaired social behavior. Together, these findings suggest that E/I organization is actively maintained but also shaped by both evolutionary pressures and disease states.
In invertebrate systems, especially Drosophila melanogaster, offer a unique opportunity to investigate E/I organization at a connectome-wide scale. Unlike mammals, where glutamate typically serves as an excitatory transmitter, in Drosophila it functions as an inhibitory transmitter via glutamate-gated chloride channels (Liu & Wilson, 2013; Wolstenholme et al., 2012). This highlights that the labels “excitatory” and “inhibitory” are not universal but must be interpreted in a species- and circuit-specific context. With the recent release of large-scale reconstructions such as the optic-lobe:v1.1 dataset (Nern et al., 2025), which provides neurotransmitter annotations for tens of thousands of neurons, it is now possible to examine these relationships systematically across an entire brain region. However, a standardized method for quantifying neuron-level E/I bias across such datasets has not yet been established.
To address this gap, I introduce the Olivera Bias Metric (OBM), a two-dimensional measure of synaptic bias. OBM identifies an input bias, reflecting whether excitatory or inhibitory synapses are overrepresented among a neuron’s presynaptic partners, and an output bias, reflecting whether its synaptic outputs are more frequently directed to excitatory or inhibitory partners. These two measures together place each neuron within a two-dimensional space defined by input and output bias, normalized within a range of [–1 and 1]. Which presents four natural quadrants that capture input–output bias motifs.
I demonstrate OBM with the Drosophila melanogaster optic lobe connectome (53,979 analyzable neurons). This initial demonstration shows clear, neurotransmitter-specific quadrant patterns, revealing that synaptic bias is organized into structured landscapes rather than distributed randomly. The aim of this work is both methodological and exploratory, to establish OBM as a framework that can be applied more broadly and to provide a case study showing how it can possibly uncover circuit-specific bias patterns in connectomic datasets.
Materials and Methods
Dataset
This study used the Drosophila melanogaster optic lobe connectome dataset, optic-lobe:v1.1, which contains 56,435 reconstructed neurons and their synaptic connections (Nern et al., 2025). The dataset includes consensus neurotransmitter annotations. The data was accessed through neuPrint (Plaza et al., 2022), which provides an API for querying the connectomic reconstructions.
Data Analysis and Visualization
All analyses were conducted in Python 3.13, using neuPrint to query the connectome dataset, along with Pandas, NumPy, and Matplotlib for data processing and visualization. The full analysis pipeline is openly available at https://github.com/Maze-In/olivera-bias-metric.
Neurotransmitter Classification
Synaptic partners were classified using the consensus neurotransmitter assignments from optic-lobe:v1.1. In Drosophila melanogaster, acetylcholine (ACh) was treated as excitatory, whereas both GABA and glutamate were treated as inhibitory, consistent with evidence that glutamate acts via glutamate-gated chloride channels (GluCl) to hyperpolarize postsynaptic cells unlike their excitatory role in vertebrates (Liu & Wilson, 2013; Wolstenholme et al., 2012). Serotonin, dopamine and octopamine were analyzed separately as neuromodulatory transmitters without assigning them any excitatory or inhibitory roles and the same was done with Histamine. Neurons labeled as unclear or “unknown” too were retained in separate analyses but not classified as excitatory or inhibitory.
It is important to note that this classification is species-specific. For example, glutamate is inhibitory in Drosophila melanogaster but excitatory in the mammalian cortex (Lodge, 2009). Thus, applying OBM to other organisms requires adapting the classification rules to reflect local transmitter function.
Definition of the Olivera Bias Metric (OBM)
The Olivera Bias Metric (OBM) provides a two-dimensional measure of synaptic bias.
Input bias:
where Ein & Iin are the total numbers of excitatory and inhibitory input connections from a neuron, calculated as the synaptic contacts made onto its presynaptic partners.
Normal OBMinput = (Ein - Iin) / (Ein + Iin)
Output bias:
where Eout & Iout are the total numbers of excitatory and inhibitory output connections from a neuron, calculated as the synaptic contacts made onto its postsynaptic partners.
Normal OBMoutput = (Iout - Eout) / (Eout + Iout)
Each metric is normalized between [–1 and 1]. Together, they locate each neuron within a two-dimensional input–output bias space where neurons are grouped into four quadrants: (excitatory-in/excitatory-out), (excitatory-in/inhibitory-out), (inhibitory-in/excitatory-out), and (inhibitory-in/inhibitory-out) depending on their Normal OBM input and output values.
Treatment of Synaptic Weights
Drosophila melanogaster synapses are polyadic, one presynaptic site (T-bar) can contact multiple postsynaptic densities (PSDs) a single presynaptic bouton may connect to several different postsynaptic partners (Scheffer et al., 2020). As a result, the number of presynaptic release sites is not equal to the number of downstream receiving synapses. Consequently, the sum of outgoing synapses for a neuron can exceed the “outputs” value shown on the neuPrint website. This discrepancy reflects the anatomical reality of polyadic synapses rather than a computational error.
In neuPrint, “weight” refers to the number of anatomical synapses (postsynaptic sites) between two neurons, reconstructed from electron microscopy. In OBM, weights were used exactly as reported by neuPrint, each individual synapse was counted, and totals reflect summed contacts rather than unique partners. Importantly, these anatomical weights do not represent synaptic efficacy in the physiological sense. In computational models, “synaptic weight” typically refers to the strength or efficiency of a neuron, a dynamic parameter modulated by plasticity mechanisms such as spike-timing-dependent plasticity (STDP) (Barbour et al., 2007; Brunel et., 2004). Here, weights represent structural contact counts only. Thus, OBM should be regarded as a structural metric rather than a functional one, although the structural biases it reveals are likely to carry important functional implications for how circuits compute and maintain stability.
The interpretation of synaptic weights is also species-specific. In Drosophila melanogaster, polyadic synapses with T-bars are common (Scheffer et al., 2020), but in mammalian cortex, while multi-synaptic boutons (MSB) exist, most synapses are one to one, with a single synaptic bouton (SSB) contacting a single postsynaptic site (Shepherd & Harris, 1998). Therefore, when applying OBM to other systems, structural conventions of synaptic architecture must be taken into account.
Filtering Criteria
To ensure valid calculations, neurons lacking both excitatory and inhibitory synapses at either inputs or outputs were excluded (i.e., where the denominator of the OBM equations equaled zero):
AChin + GABAin + Glutamatein = 0
AChout + GABAout + Glutamateout = 0
After applying this filter, from 56,435 neurons in the optic lobe dataset, 53,979 neurons remained for OBM analysis.
Results
OBM Reveals Structured Patterns Across the Drosophila Melanogaster Optic Lobe
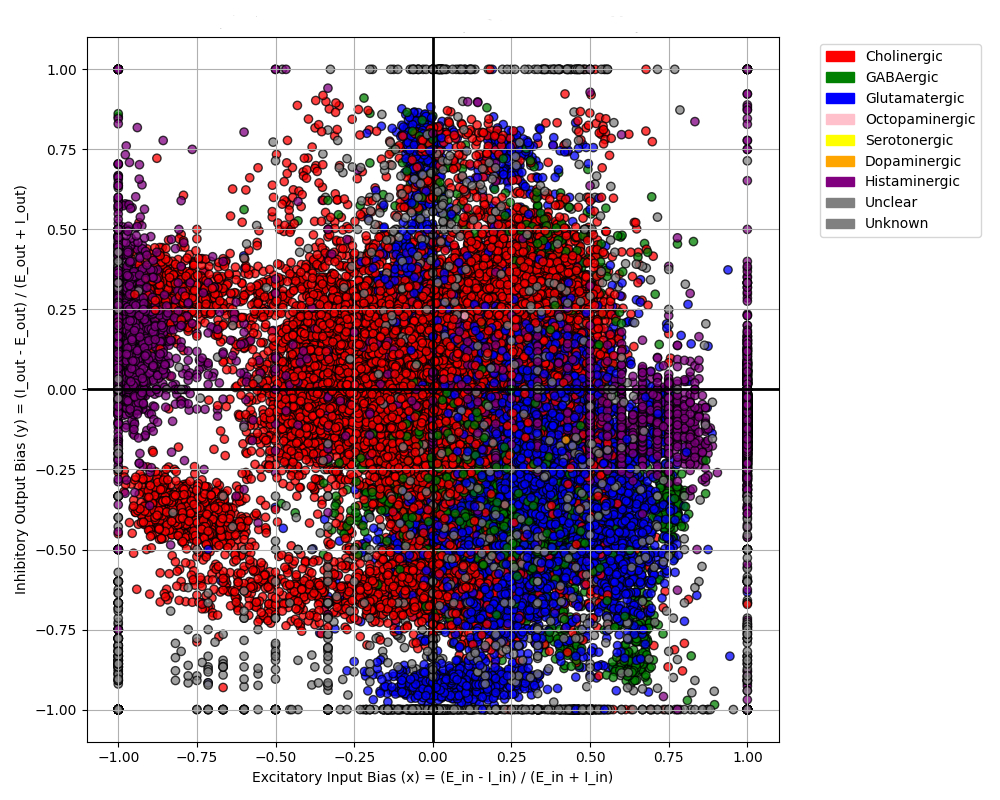
I applied the Olivera Bias Metric (OBM) to 53,979 neurons in the Drosophila melanogaster optic lobe dataset (Nern et al., 2025). Each neuron was positioned in a two-dimensional space defined by input bias (x-axis) and output bias (y-axis). The resulting map (Figure 1) reveals non-random clustering of neurons across the four OBM quadrants. This demonstrates that synaptic bias is not evenly distributed but instead reflects structured bias motifs in the optic lobe connectome.
Structured Bias Landscapes
Taken together, these results demonstrate that OBM reveals structured synaptic bias motifs in the Drosophila melanogaster optic lobe. They reflect neurotransmitter-specific organization of excitatory and inhibitory balance. While some distributions suggest versatility (e.g., ACh), others reveal strong signatures of directional bias (e.g., GABA, glutamate, histamine). These findings are not to be taken as a universal constant for these neurotransmitters but instead a region-specific transmitter property of circuit architecture.
Neurotransmitter-Specific Patterns and Functional Implications
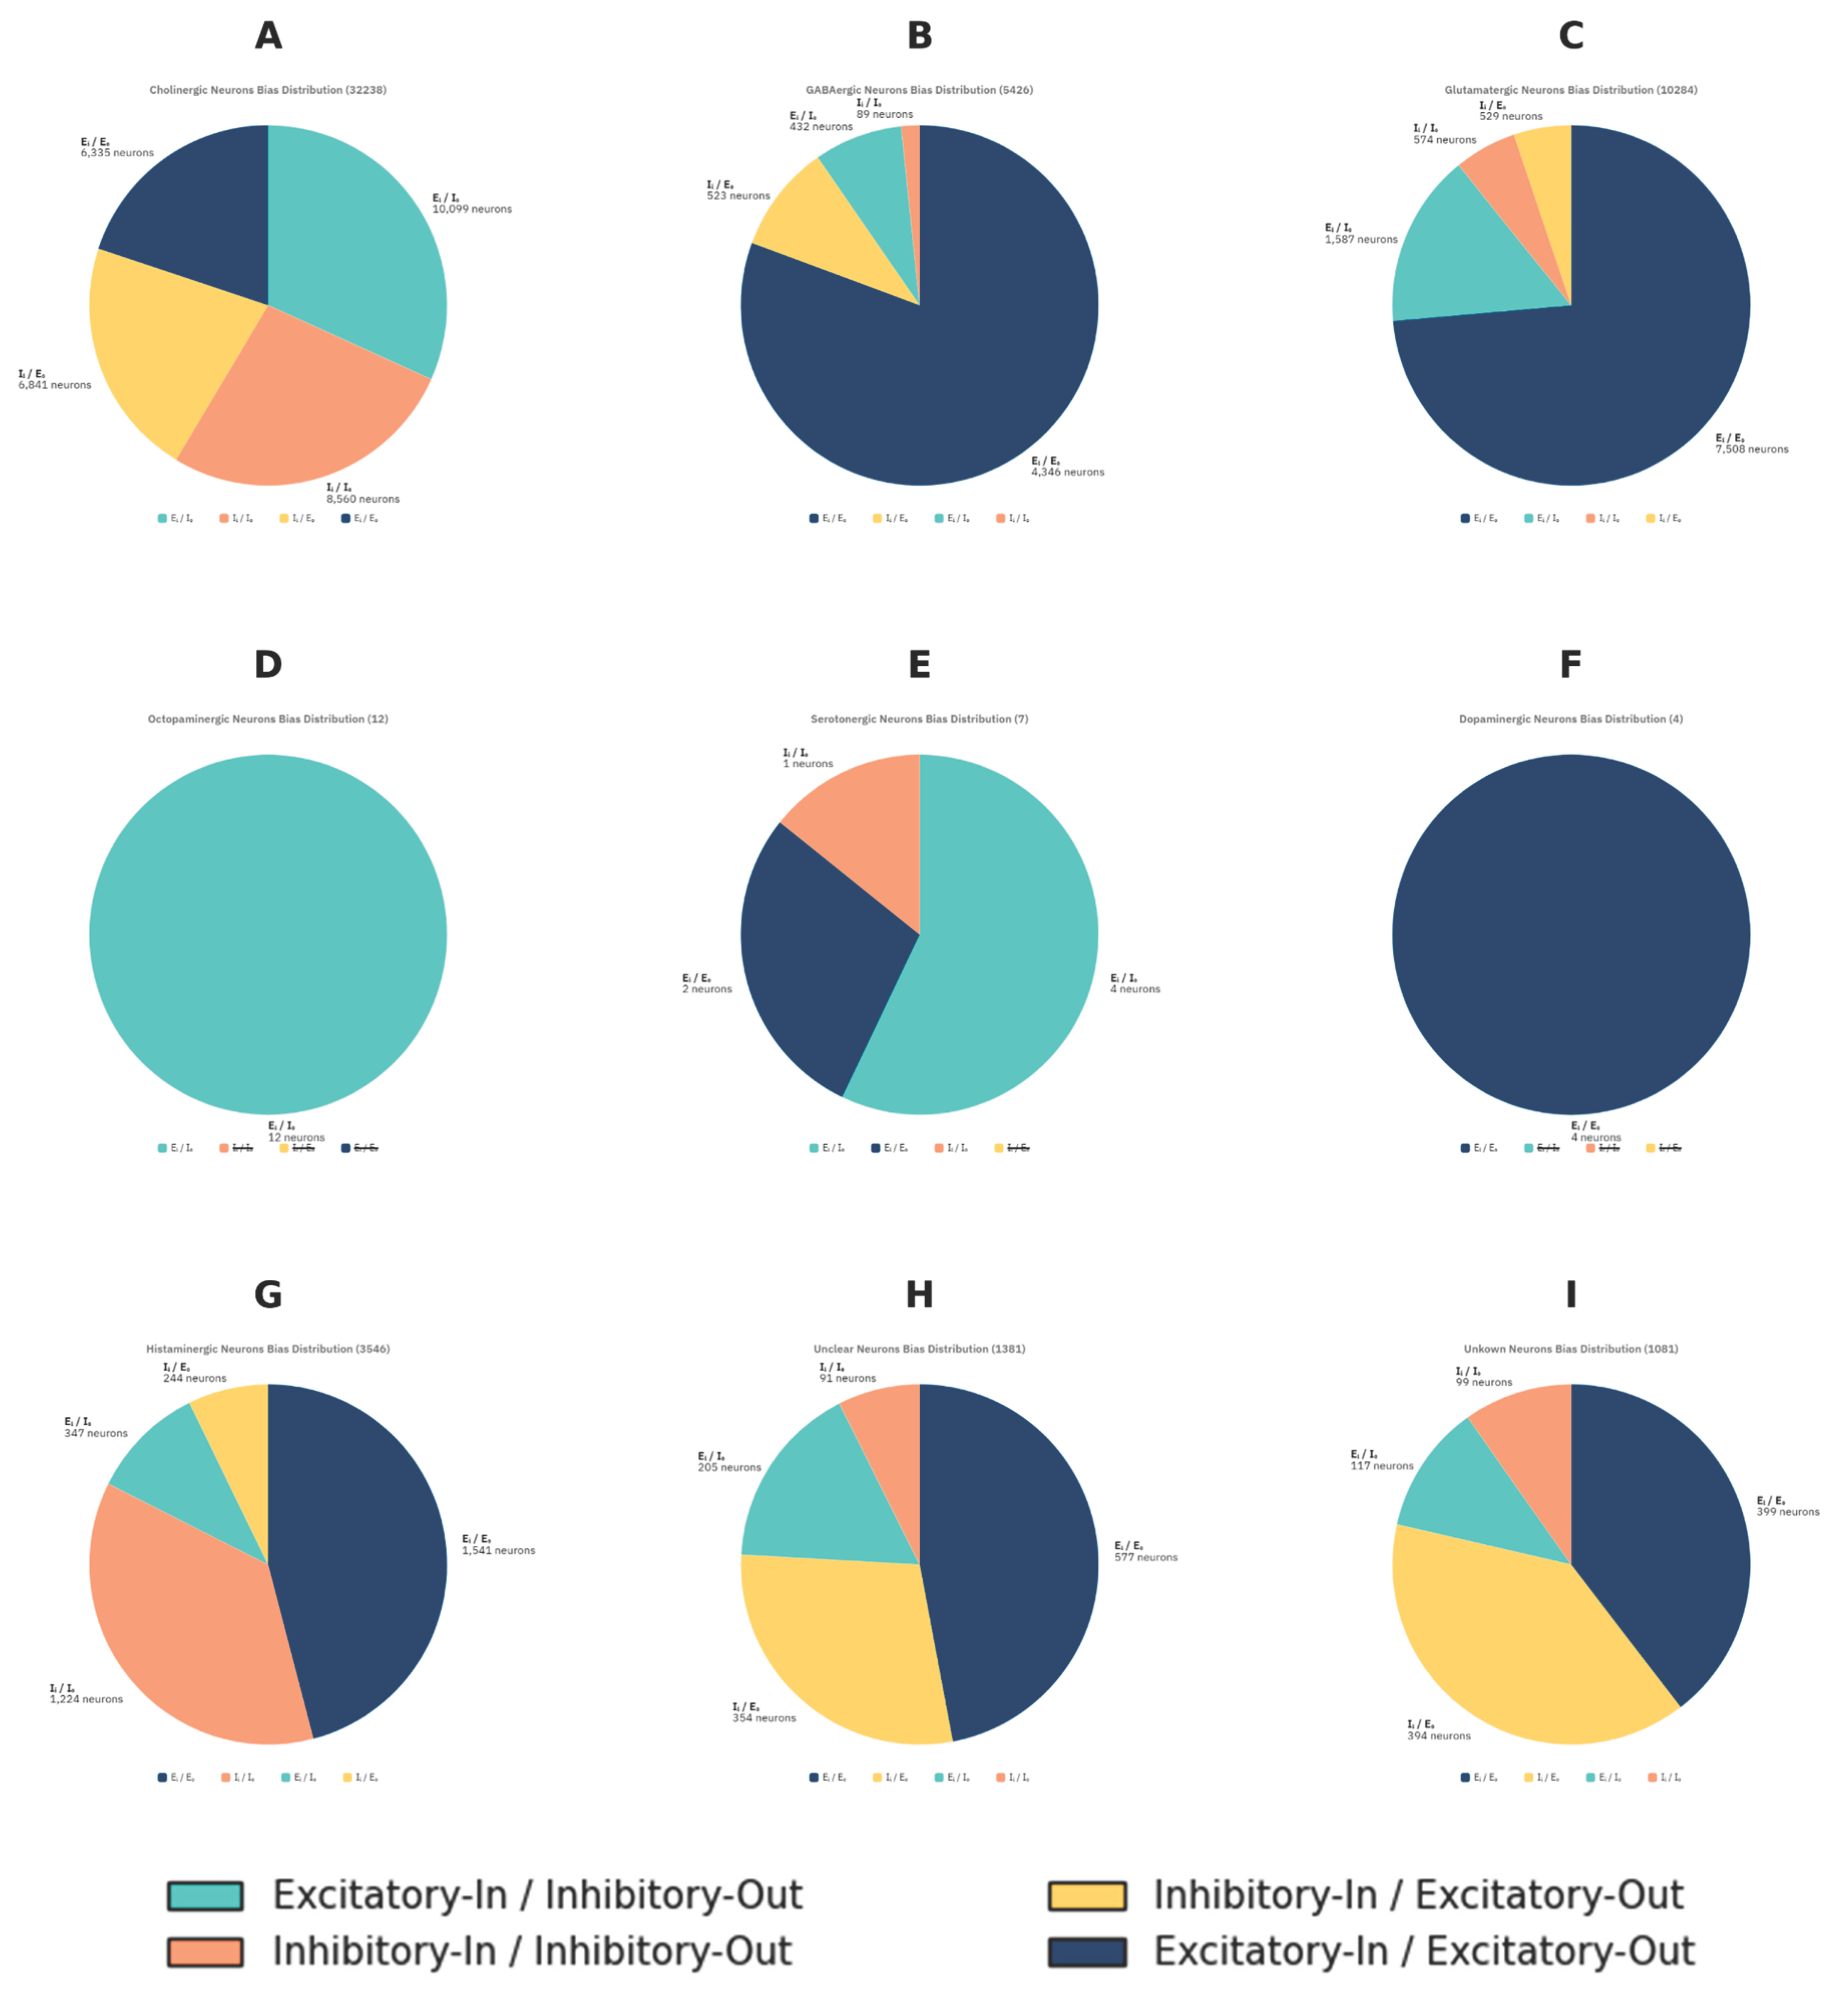
The quadrant profiles revealed systematic signatures. To determine whether bias motifs differed across neurotransmitter classes, I generated separate OBM maps for nine categories: acetylcholine (ACh), GABA, glutamate, serotonin, dopamine, octopamine, histamine, unclear, and “unknown” (Figure 2). Distinctive distributions were observed (Figure 3):
Cholinergic neurons (Excitatory) (N = 32,238). Broadly distributed across all quadrants (31.7% excitatory-in/inhibitory-out; 26.9% inhibitory-in/inhibitory-out; 21.5% inhibitory-in/excitatory-out; 19.9% excitatory-in/excitatory-out), consistent with their diverse roles across the visual system considering they are the only excitatory neurotransmitters in the Drosophila melanogaster.
GABAergic and glutamatergic neurons (Inhibitory) (N = 5,426 and 10,284). Despite being inhibitory in flies, both clustered predominantly in the excitatory-in/excitatory-out quadrant (80.6% and 73.6%, respectively). This pattern is consistent with their network context, inhibitory neurons can only exert suppression on the cells they connect to, and in the optic lobe their inhibitory outputs are embedded within excitatory-dominated circuits, giving them an excitatory-biased position in OBM space.
Histaminergic neurons (N = 3,546). These neurons displayed a striking bimodal distribution: 36.5% fell into the inhibitory-in/inhibitory-out quadrant, while 45.9% were excitatory-in/excitatory-out. This polarization aligns with histamine’s unique role in the visual system. Photoreceptor neurons (R1–R8) use histamine as their primary transmitter, releasing it onto large monopolar cells (LMC) in the first neuropil of the optic lobe, the lamina (Chaturvedi et al., 2014). At this first synapse, histamine produces inhibition via chloride-permeable hclA/hclB channels (Pantazis et al., 2008; Nässel, 1999), consistent with the strong inhibitory-in/inhibitory-out motif. However, downstream processing requires histamine recycling through glia and redistribution of signals into excitatory visual pathways (Chaturvedi et al., 2014). This circuit-level arrangement may explain why a large fraction of histaminergic neurons appear instead in the excitatory-in/excitatory-out quadrant: although histamine acts as an inhibitory transmitter locally, its role in initiating photoreceptor-driven pathways ultimately drives excitatory flow through the visual system. The bimodal OBM pattern thus reflects histamine’s dual function direct inhibition at the first synapse and indirect contribution to excitatory propagation across deeper visual circuits.
Octopaminergic neurons (Neuromodulatory) (N = 12). These neurons were exclusively positioned in the excitatory-in/inhibitory-out quadrant. Octopamine neurons innervating the optic lobes are known to modulate visual processing during flight (Suver et al., 2012) and to broadly shape sensory pathways (Farooqui, 2007). Their positioning in OBM space suggests that such modulation may require exerting strong influence over inhibitory partners, providing a means to suppress or control circuit activity in response to behavioral state.
Dopaminergic neurons (Neuromodulatory) (N = 4). These neurons were exclusively positioned in the excitatory-in/excitatory-out quadrant and were almost packed together. Dopamine is closely linked to reinforcement learning in insects, contributing to both appetitive and aversive associations (Huetteroth et al., 2015; Selcho et al., 2009). The OBM bias observed here is consistent with this role: a predominantly excitatory-in/excitatory-out motif would allow dopaminergic neurons to amplify circuit activity and drive plasticity across downstream partners, providing a structural substrate for their influence on learning and motivational states.
Discussion
The Olivera Bias Metric (OBM) provides a compact framework for mapping the excitatory and inhibitory bias of individual neurons across large connectomic datasets. Applying this metric to the Drosophila melanogaster optic lobe, I found that neurons segregate into structured quadrant motifs that are transmitter-specific. This reveals to us a set of region-specific bias landscapes shaped by local circuit constraints.
Comparison with Established Principles of E/I Balance
In the mammalian cortex, maintaining E/I balance has long been considered a hallmark of stable computation (Lam et al., 2023; Matsumuro et al., 2025; Sohal & Rubenstein, 2019; Yizhar et al., 2011). Dendritic mapping shows that excitatory and inhibitory synapses are precisely distributed spatially (Iascone et al., 2020). Importantly, however, balance does not imply an equal 50:50 ratio of excitatory and inhibitory inputs. Instead, it refers to a dynamic relationship in which inhibition scales with excitation to preserve network stability. Comparative and pathological studies illustrate this point: Roberts et al. (2025) showed that while olfactory circuits in two Drosophila species shared a conserved blueprint, species-specific rewiring produced systematic shifts in synaptic ratios; Matsumuro et al. (2025) found that disruption of depth-specific E/I organization in the anterior cingulate cortex of a prenatal autism model impaired social behavior. These findings highlight that E/I organization must be maintained within functional bounds, but that the ratio itself can be flexibly tuned across species, brain regions, and disease states.
From this perspective, the structured distributions revealed by OBM cannot be explained by random synapse placement. If synaptic inputs were distributed stochastically, additional regulatory mechanisms would be required to restore stability/balance that is emphasized in literature, which is inconsistent with the clear transmitter-specific bias motifs observed. Instead, the bias patterns uncovered here suggest that the Drosophila Melanogaster optic lobe is organized according to distinct, non-random principles. In this way, OBM provides an anatomical counterpart to classical functional studies of E/I balance, showing that what is preserved is not perfect equality, but species-specific and circuit-specific structure in the organization of excitation and inhibition.
Limitations
Several caveats are to be considered. Firstly, OBM relies on consensus neurotransmitter annotations, which are not yet uniformly available across all Drosophila melanogaster connectomes (Nern et al., 2025). Datasets such as the MANC (Male Adult Nerve Cord) which relies on predictive labeling, limiting interpretability, and datasets like the hemibrain and mushroombody do not have any neurotransmitter labelling. Secondly, OBM quantifies structural bias, not physiological efficacy. It does not account for neuromodulation, receptor distribution, vesicle availability, or any pathological and physiological discrepancies, each of which can strongly influence output. Thirdly, OBM is context-dependent. In mammals, glutamate is excitatory, whereas in flies it is inhibitory (Liu & Wilson, 2013; Wolstenholme et al., 2012). Therefore, applying OBM across species requires adapting the classification rules and structural assumptions to the biology of each system. This extends not only to transmitter identity but also to the way synaptic weights are defined. For example, in Drosophila melanogaster, presynaptic T-bars often contact multiple postsynaptic partners (Scheffer et al., 2020), and so calculating Eout & Iout requires summing across postsynaptic connections rather than counting presynaptic sites alone. These conventions may vary across species and datasets, and must be treated carefully, as discussed in the subsection Treatment of synaptic weights in Materials and Methods.
Future Directions
Future work could extend OBM analysis to other connectomes as neurotransmitter annotations improve. Cross-species comparisons may test whether bias motifs are conserved or divergent, as suggested by recent comparative work in olfactory circuits (Roberts et al., 2025). Another promising direction for future research is to investigate how structural bias relates to neuronal excitability. For example, neurons with strongly inhibitory input bias may operate with elevated spiking thresholds, shaping their responsiveness within circuits. Beyond single cell properties, integrating OBM with computational models could help bridge structural connectomics and functional circuit dynamics, linking synaptic bias patterns to emergent network behavior. Such approaches will be essential to determine how anatomical bias translates into functional computation across species and brain regions.
Conclusion
The Olivera Bias Metric (OBM) does not change the global rules of neurotransmission, but it offers a new way to measure synaptic bias in specific circuits. When applied to the Drosophila melanogaster optic lobe, OBM shows organized input-output patterns and segregation based on transmitters. This demonstrates that synaptic distributions are not random; they reveal the structure of the circuit. Since neuronal spiking relies on the balance of excitatory and inhibitory drive, these anatomical biases are not just neutral descriptions. They directly constrain excitability and shape the function of each neuron. In this way, OBM adds to traditional studies of E/I balance by showing that anatomical structure reflects bias at the synaptic level, which may influence how the circuit operates. Moving forward, using OBM across different species and brain regions will help in comparing connectomics. This can test whether bias patterns are universal design principles or specific solutions that different species use to maintain circuit stability and computation.
Acknowledgments
I would like to thank the Janelia Research Campus teams responsible for curating the Drosophila melanogaster optic lobe connectome dataset (Nern et al., 2025). I also acknowledge the developers of the neuPrint platform (Plaza et al., 2022), which provided the query tools used for this analysis.
Data and Code Availability
All code used in this study is openly available at https://github.com/Maze-In/olivera-bias-metric. The source connectomic dataset (optic-lobe:v1.1) can be accessed through the neuPrint platform (Nern et al., 2025).
Author Contributions
I conceived the project, performed all the analyses, created the figures in this paper, and wrote the manuscript.
Competing interests
The author declares no competing interests.
References
- Barbour, B., Brunel, N., Hakim, V., & Nadal, J. P. (2007). What can we learn from synaptic weight distributions?. TRENDS in Neurosciences, 30(12), 622-629. [CrossRef]
- Brunel, N., Hakim, V., Isope, P., Nadal, J. P., & Barbour, B. (2004). Optimal information storage and the distribution of synaptic weights: perceptron versus Purkinje cell. Neuron, 43(5), 745-757. [CrossRef]
- Chaturvedi, R., Reddig, K., & Li, H. S. (2014). Long-distance mechanism of neurotransmitter recycling mediated by glial network facilitates visual function in Drosophila melanogaster. Proceedings of the National Academy of Sciences, 111(7), 2812-2817. [CrossRef]
- Farooqui, T. (2007). Octopamine-mediated neuromodulation of insect senses. Neurochemical research, 32(9), 1511-1529. [CrossRef]
- Hao, J., Wang, X. D., Dan, Y., Poo, M. M., & Zhang, X. H. (2009). An arithmetic rule for spatial summation of excitatory and inhibitory inputs in pyramidal neurons. Proceedings of the National Academy of Sciences, 106(51), 21906-21911. [CrossRef]
- Huetteroth, W., Perisse, E., Lin, S., Klappenbach, M., Burke, C., & Waddell, S. (2015). Sweet taste and nutrient value subdivide rewarding dopaminergic neurons in Drosophila melanogaster. Current biology, 25(6), 751-758. [CrossRef]
- Iascone, D. M., Li, Y., Sümbül, U., Doron, M., Chen, H., Andreu, V., ... & Polleux, F. (2020). Whole-neuron synaptic mapping reveals spatially precise excitatory/inhibitory balance limiting dendritic and somatic spiking. Neuron, 106(4), 566-578. [CrossRef]
- Lam, N. H., Borduqui, T., Hallak, J., Roque, A., Anticevic, A., Krystal, J. H., ... & Murray, J. D. (2022). Effects of altered excitation-inhibition balance on decision making in a cortical circuit model. Journal of Neuroscience, 42(6), 1035-1053. [CrossRef]
- Liu, W. W., & Wilson, R. I. (2013). Glutamate is an inhibitory neurotransmitter in the Drosophila melanogaster olfactory system. Proceedings of the National Academy of Sciences, 110(25), 10294-10299. [CrossRef]
- Lodge, D. (2009). The history of the pharmacology and cloning of ionotropic glutamate receptors and the development of idiosyncratic nomenclature. Neuropharmacology, 56(1), 6-21. [CrossRef]
- Matsumuro, M., Ichinose, S., & Iwasaki, H. (2025). Integrated Profiling of Synaptic E/I Balance Reveals Altered Synaptic Organization and Phenotypic Variability in a Prenatal ASD Model. bioRxiv, 2025-06. [CrossRef]
- Nässel, D. R. (1999). Histamine in the brain of insects: a review. Microscopy research and technique, 44(2-3), 121-136.
- Nern, A., Loesche, F., Takemura, S. Y., Burnett, L. E., Dreher, M., Gruntman, E., ... & Reiser, M. B. (2025). Connectome-driven neural inventory of a complete visual system. Nature, 1-13. [CrossRef]
- Pantazis, A., Segaran, A., Liu, C. H., Nikolaev, A., Rister, J., Thum, A. S., ... & Hardie, R. C. (2008). Distinct roles for two histamine receptors (hclA and hclB) at the Drosophila melanogaster photoreceptor synapse. Journal of Neuroscience, 28(29), 7250-7259. [CrossRef]
- Plaza, S. M., Clements, J., Dolafi, T., Umayam, L., Neubarth, N. N., Scheffer, L. K., & Berg, S. (2022). neu Print: An open access tool for EM connectomics. Frontiers in Neuroinformatics, 16, 896292. [CrossRef]
- Roberts, R. J., Giez, C., Dhawan, S., Pang, S., Randel, N., Lu, Z., ... & Prieto-Godino, L. L. (2025). Cross-species comparative connectomics reveals the evolution of an olfactory circuit. bioRxiv, 2025-06. [CrossRef]
- Sarthy, P. V. (1991). Histamine: a neurotransmitter candidate for Drosophila melanogaster photoreceptors. Journal of neurochemistry, 57(5), 1757-1768. [CrossRef]
- Scheffer, L. K., Xu, C. S., Januszewski, M., Lu, Z., Takemura, S. Y., Hayworth, K. J., ... & Plaza, S. M. (2020). A connectome and analysis of the adult Drosophila melanogaster central brain. elife, 9, e57443. [CrossRef]
- Selcho, M., Pauls, D., Han, K. A., Stocker, R. F., & Thum, A. S. (2009). The role of dopamine in Drosophila melanogaster larval classical olfactory conditioning. PloS one, 4(6), e5897. [CrossRef]
- Shepherd, G. M., & Harris, K. M. (1998). Three-dimensional structure and composition of CA3→ CA1 axons in rat hippocampal slices: implications for presynaptic connectivity and compartmentalization. Journal of Neuroscience, 18(20), 8300-8310. [CrossRef]
- Sohal, V. S., & Rubenstein, J. L. (2019). Excitation-inhibition balance as a framework for investigating mechanisms in neuropsychiatric disorders. Molecular psychiatry, 24(9), 1248-1257. [CrossRef]
- Suver, M. P., Mamiya, A., & Dickinson, M. H. (2012). Octopamine neurons mediate flight-induced modulation of visual processing in Drosophila melanogaster. Current Biology, 22(24), 2294-2302. [CrossRef]
- Waddell, S. (2013). Reinforcement signalling in Drosophila melanogaster; dopamine does it all after all. Current opinion in neurobiology, 23(3), 324-329. [CrossRef]
- Wolstenholme, A. J. (2012). Glutamate-gated chloride channels. Journal of Biological Chemistry, 287(48), 40232-40238. [CrossRef]
- Yizhar, O., Fenno, L. E., Prigge, M., Schneider, F., Davidson, T. J., O’shea, D. J., ... & Deisseroth, K. (2011). Neocortical excitation/inhibition balance in information processing and social dysfunction. Nature, 477(7363), 171-178. [CrossRef]
Figure 1.
scatterplot of all 53,979 neurons, with OBM input bias on the x-axis and OBM output bias on the y-axis.
Figure 1.
scatterplot of all 53,979 neurons, with OBM input bias on the x-axis and OBM output bias on the y-axis.
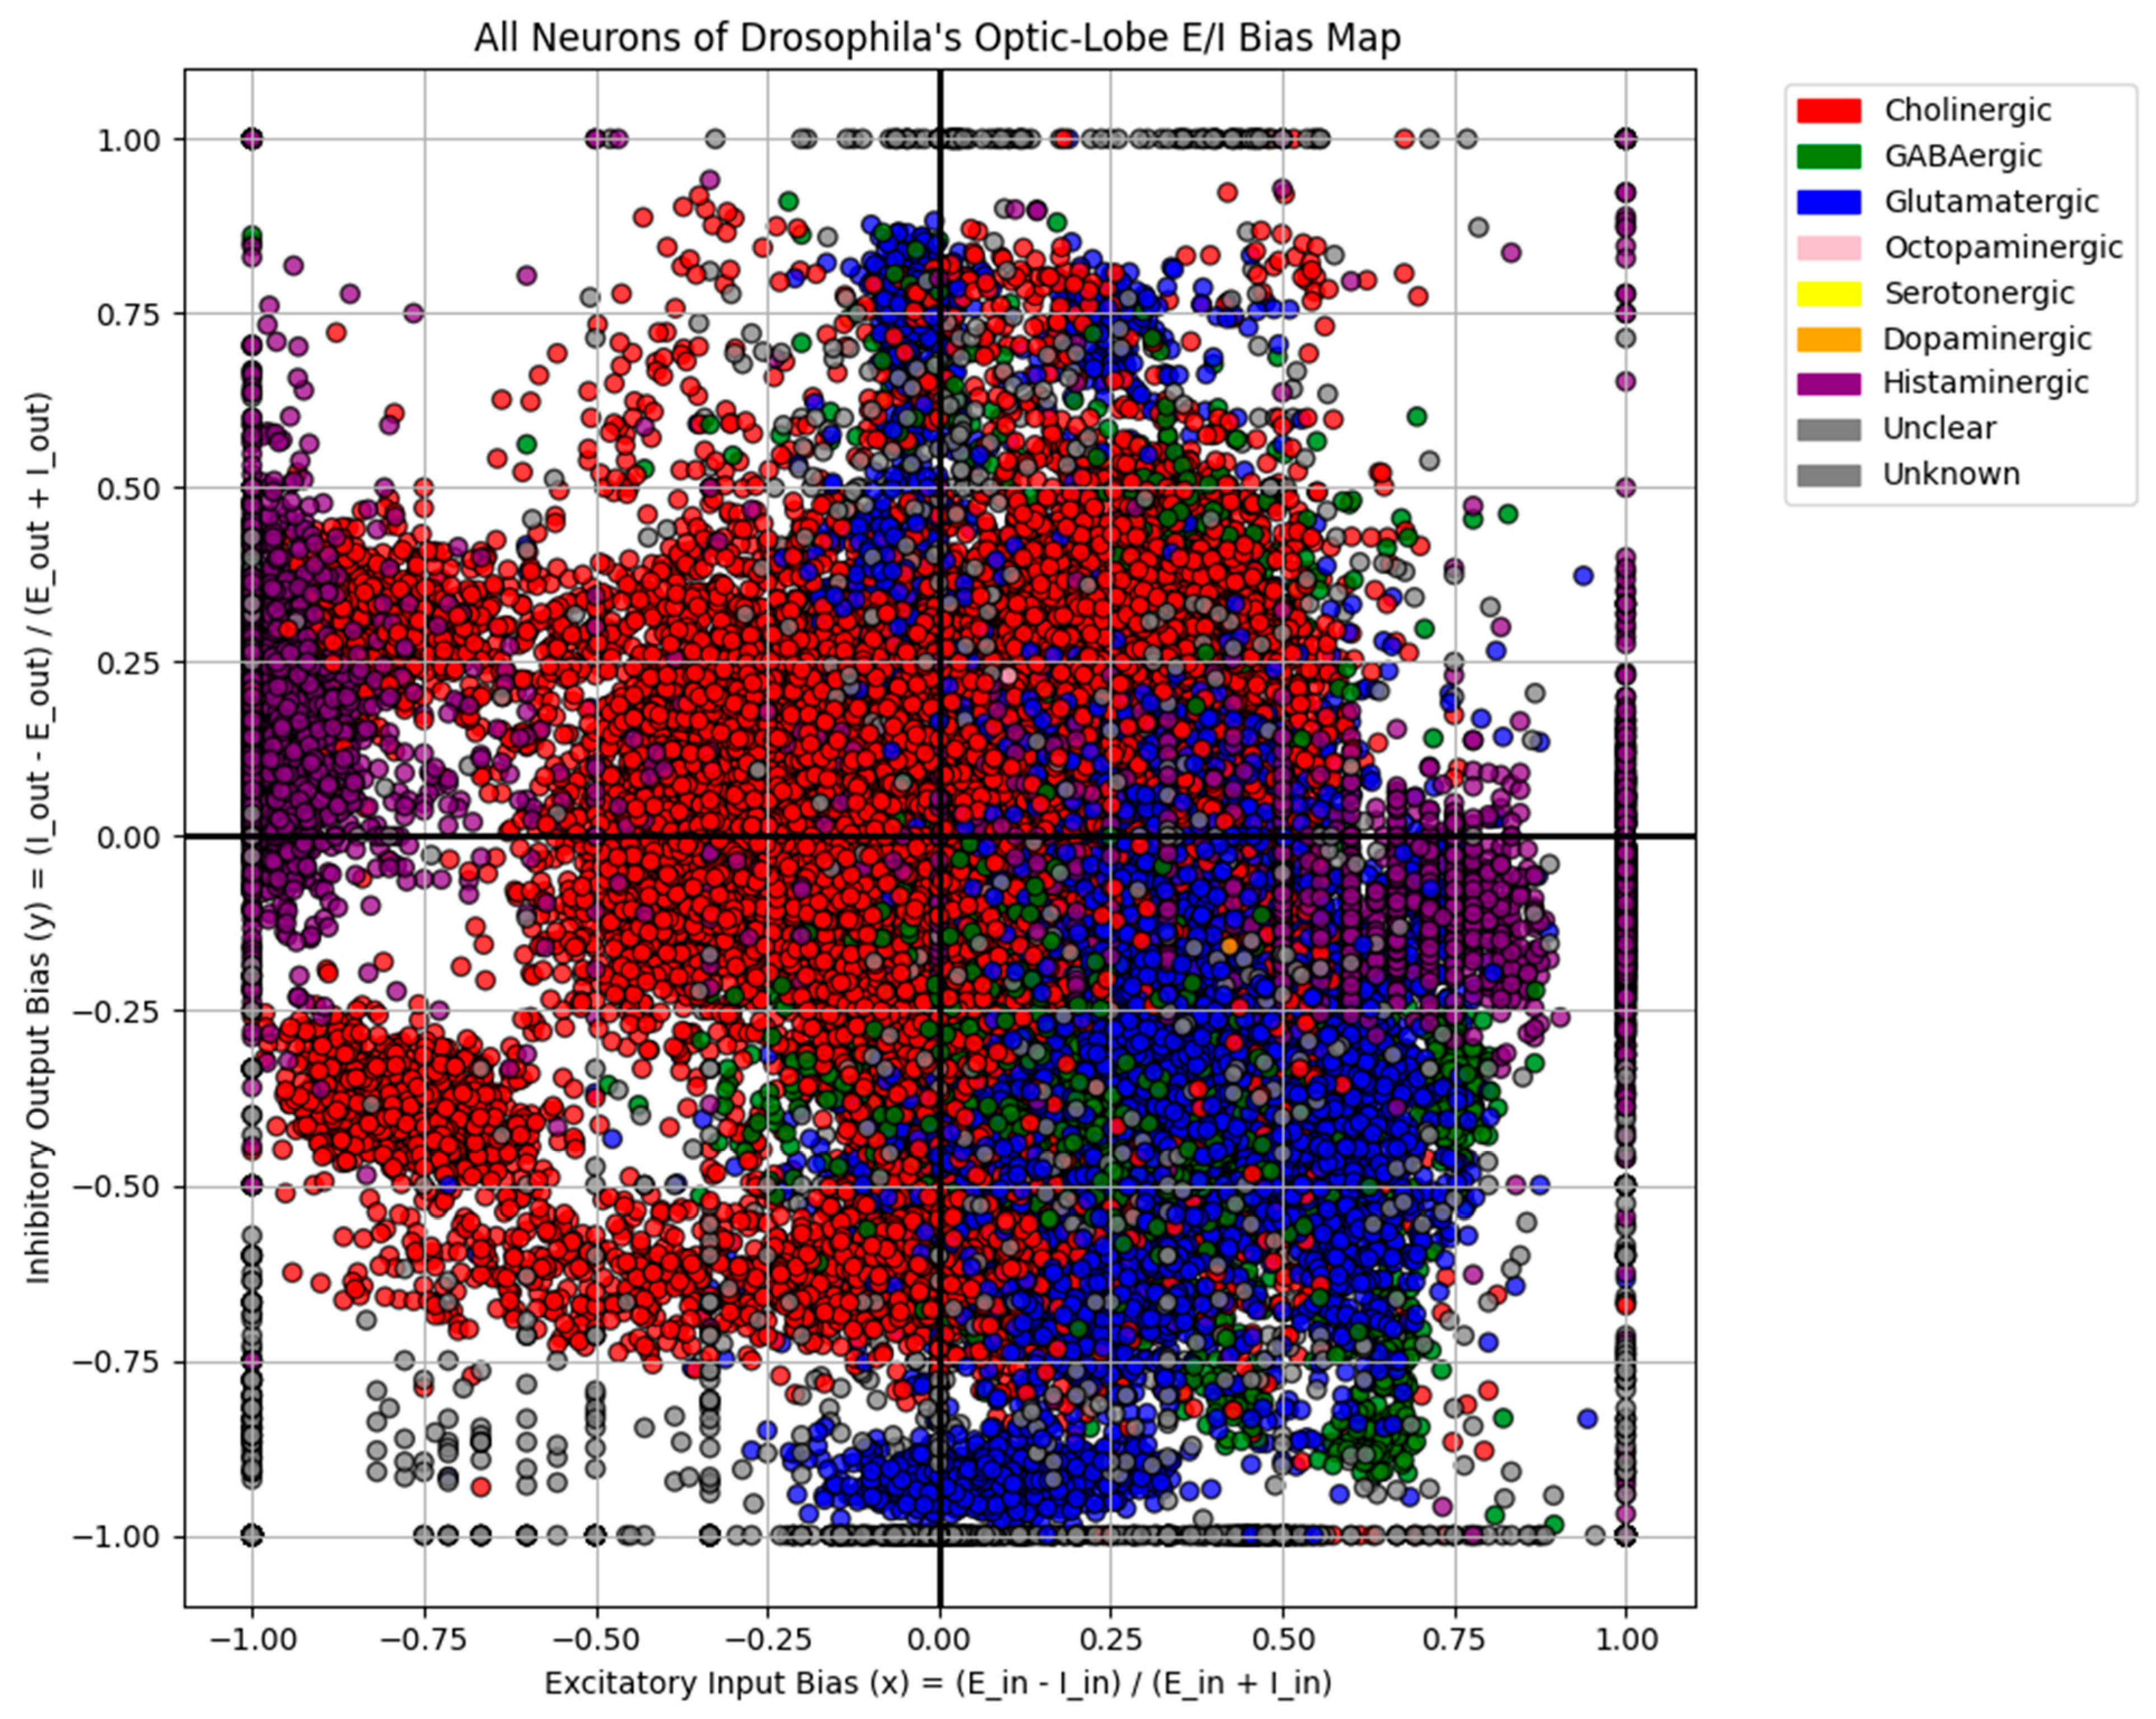
Figure 2.
nine panel layout of scatterplots grouped by neurotransmitter class ( A – Cholinergic, B – GABAergic, C – Glutamatergic, D – Octopaminergic, E – Serotonergic, F – Dopaminergic, G – Histaminergic, H – Unclear, I – Unknown.).
Figure 2.
nine panel layout of scatterplots grouped by neurotransmitter class ( A – Cholinergic, B – GABAergic, C – Glutamatergic, D – Octopaminergic, E – Serotonergic, F – Dopaminergic, G – Histaminergic, H – Unclear, I – Unknown.).
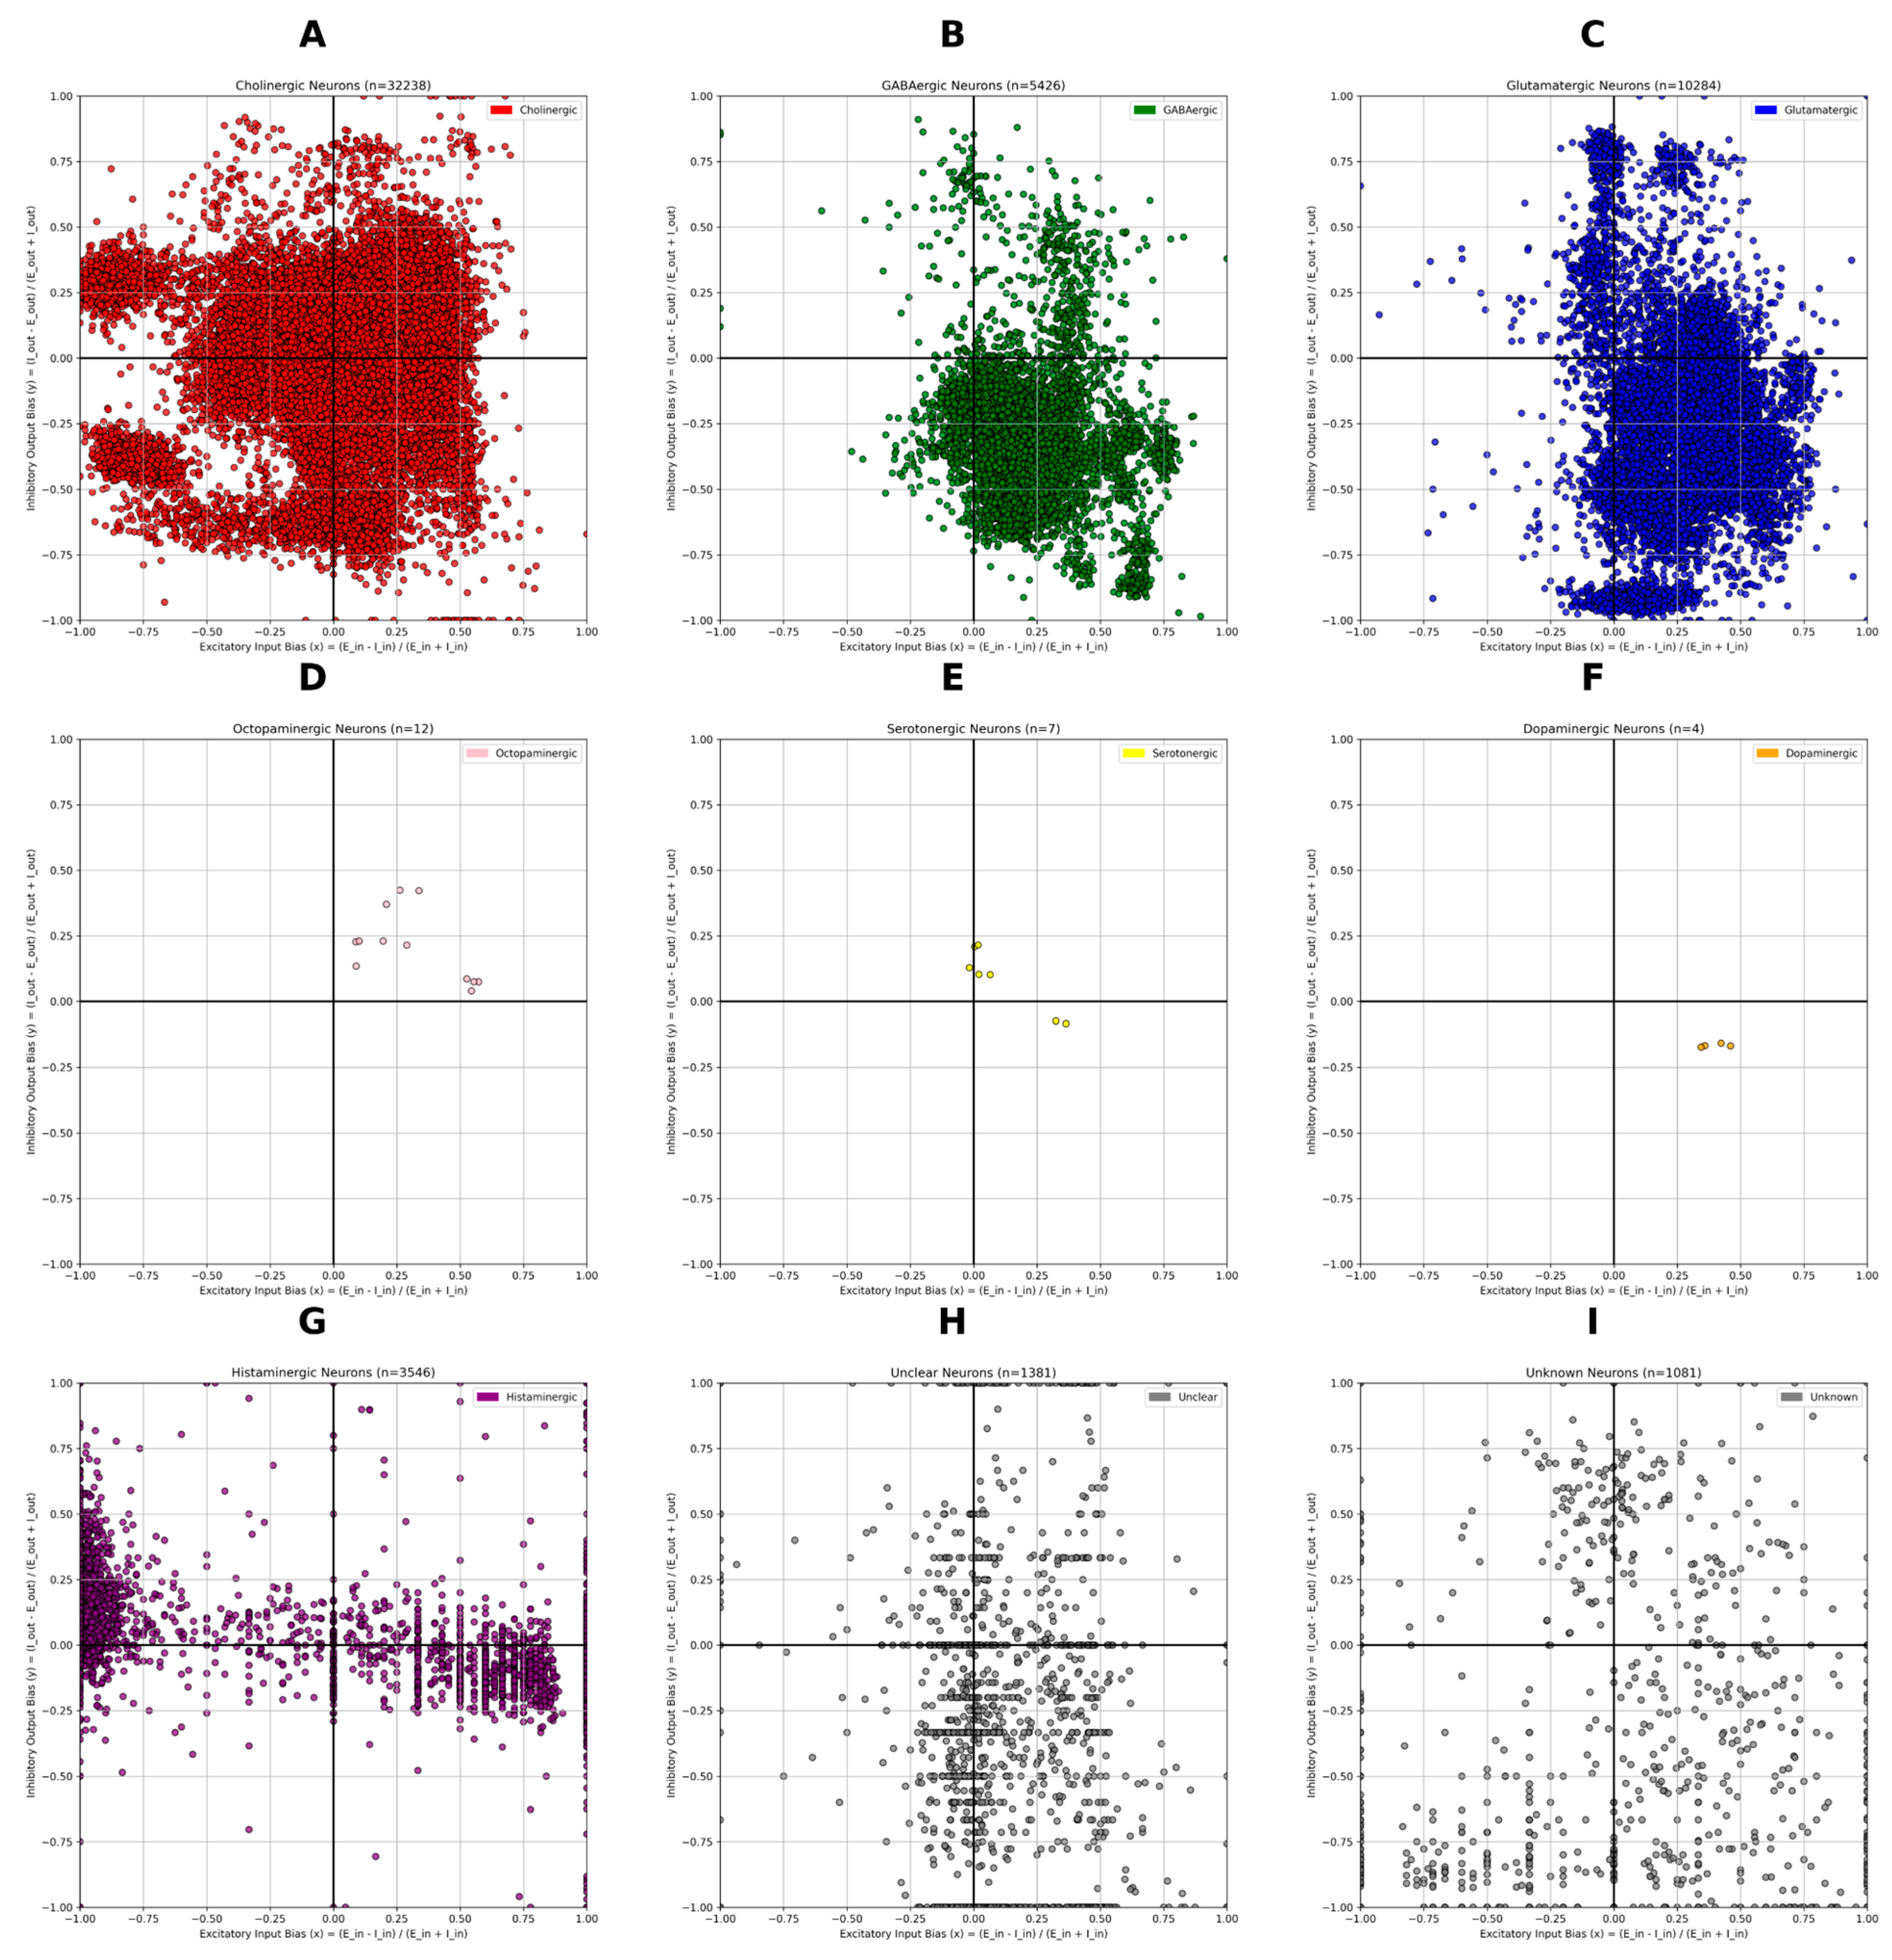
Figure 3.
pie chart showing the proportion of neurons in each OBM quadrant, grouped by neurotransmitter class. ( A – Cholinergic, B – GABAergic, C – Glutamatergic, D – Octopaminergic, E – Serotonergic, F – Dopaminergic, G – Histaminergic, H – Unclear, I – Unknown.).
Figure 3.
pie chart showing the proportion of neurons in each OBM quadrant, grouped by neurotransmitter class. ( A – Cholinergic, B – GABAergic, C – Glutamatergic, D – Octopaminergic, E – Serotonergic, F – Dopaminergic, G – Histaminergic, H – Unclear, I – Unknown.).
Disclaimer/Publisher’s Note: The statements, opinions and data contained in all publications are solely those of the individual author(s) and contributor(s) and not of MDPI and/or the editor(s). MDPI and/or the editor(s) disclaim responsibility for any injury to people or property resulting from any ideas, methods, instructions or products referred to in the content. |
© 2025 by the author. Licensee MDPI, Basel, Switzerland. This article is an open access article distributed under the terms and conditions of the Creative Commons Attribution (CC BY) license (https://creativecommons.org/licenses/by/4.0/).
Copyright: This open access article is published under a Creative Commons CC BY 4.0 license, which permit the free download, distribution, and reuse, provided that the author and preprint are cited in any reuse.


