
Submitted:
17 September 2025
Posted:
23 September 2025
You are already at the latest version
Abstract
This study investigated the impact of using genetic engineering strategies to obtain a cell-free Xylanase with application to the baking industry. The xynA1 gene from the nonpathogenic bacterium Caulobacter vibrioides was integrated into the pAS22 vector with a xylose-inducible promoter and introduced back into the bacteria, resulting in the creation of the BS-xynA1. This construct exhibited substantial secreted xylanase 1 (XynA1) activity, reaching 17.22 U/mL, and a specific activity of 278.64 U/mg after an 18-hour growth period with 0.3% (w/v) xylose plus 0.2% (w/v) corn straw. RT-qPCR analysis confirmed that higher xylanase activity in C. vibrioides cells was correlated with increased transcription of the xynA1 gene in the induction medium. Moreover, BS-xynA1 cells coexpress other enzymes, including xylanase 2 (XynA2), cellulase, pectinase, α-amylase, β-glycosidase, β-xylosidase, and α-L-arabinosidase, at low levels (≤2 U/mL). In vitro comparison of cell-free xylanases from BS-xynA1 with three commercially available xylanase-containing mixtures commonly utilized in baking protocols revealed its superior specific activity (163.4 U/mg) across a broad temperature range (30-100 °C), with optimal performance at 50 °C. In practical baking tests, the addition of cell-free XynA1 led to a reduction in dough kneading time and increase in bread height compared to those of the control. Notably, the incorporation of XynA1 resulted in enhanced alveolar structure formation within the bread crumb. Specifically, the following changes were observed in the mass parameters compared to those of the control: an increase in extensibility, elasticity and deformation energy, and subsequent improvements in strength. Additionally, XynA1addition led to a reduction in toughness and toughness/elasticity index, indicating a reduction in the mass stiffness of the enzyme-treated bread. To date, this is the first successful application of recombinant XynA1 from C. vibrioides in biotechnological processes related to baking, underscoring the potential and prospects in the food industry.
Keywords:
enzyme technology
; secretion
; synthetic biology
; bread structure
; use of agro-industrial waste
1. Introduction
Xylan is a representative part of the lignocellulosic mass in plants, and its degradation involves the synergistic action of different enzymes, with endo-β,4-D-xylanases (E.C.3.2.1.8) and β-D-xylosidases (E.C. 3.2.1.37) being the most important [1]. Endo-β-1,4-D-xylanases cleave the xylan main chain, producing xylo-oligosaccharides that can be converted to xylose by β-D-xylosidases [2]. In many biotechnological and industrial applications, bacterial xylanases have shown better performance than fungal xylanases [3,4].The significant differences found were low cellulase activity, low cellulase stability, low cellulase activity in the alkaline range, and high cellulase thermostability, among others [5,6]. Moreover, superxylanases are very difficult to produce when all these features are combined, implying that most of the available bacterial xylanases have only one or two of these properties, leading industrial processes to depend on expensive and hazardous chemical processes or strategies for designing or engineering superenzymes [5,7].
In baking, xylanases are desirable because they improve dough extensibility and bread volume. Cellulase, on the other hand, can degrade cellulose and structural components associated with the wheat cell wall matrix, compromising the gluten network. This results in loss of gas retention, weakened dough, and, consequently, smaller-volume, worse-textured breads. Therefore, xylanases with low or minimal cellulase activity act selectively on the target polysaccharides (arabinoxylans), optimizing dough rheology without causing undesirable side effects on the flour’s technological quality. In short, this allows for better technological performance, to name a few, volume, texture, and tenderness, without compromising the integrity of the protein network that supports the dough structure[8].
Xylanases have been widely used in the baking industry for decades. They are employed in baking together with α-amylase, maleate amylase, glucose oxidase and proteases. Xylanases breakdown hemicellulose in wheat flour, helping to redistribute water and make the dough softer and easier to knead. During the bread baking process, they generate greater flexibility and elasticity, allowing the dough to grow. The use of xylanases in baking assures an increase in bread volume, better water absorption and greater resistance to fermentation [9]. In the manufacture of cookies and crackers, xylanase is recommended to make them creamy and lighter and to improve their texture, palatability, and uniformity [1].
Xylanases are widely used as processing aids in the grain milling industry to produce flour. In this industry, xylanases are often referred to as hemicellulases or pentosanases. Thus, the term hemicellulase refers to the ability of xylanase to hydrolyze insoluble nonstarch compounds found in flour, while the term pentosanase indicates that the substrate for the xylan enzyme is composed of pentose monomers [10]. Therefore, xylanases can improve the quality of the baking process and bread dough. In Bacillus sp., for instance, the xynHB gene encoding xylanase was cloned and inserted into an antibiotic-free vector and integrated into the yeast genome. The yeast strain A13 overexpressing xylanase was applied in baking and showed a reduction in the time required for kneading and an increase in bread dough height and diameter [10].
Several species, primarily from the Bacillus genus (B. pumilus, B. circulans, B. amyloliquefaciens, B. stearothermophilus, B. halodurans, B. subtilis), as well as Streptomyces, Geobacillus, Actinomadura, Saccharopolyspora, and Thermotoga, are described as producers of thermostable and hyperthermophilic xylanases [11]. Other genera, such as Micrococcus, Staphylococcus, Paenibacillus, Cellulomonas, Arthrobacter, and Microbacterium, also contribute to the diversity of these enzymes. In practical applications, the xylanase from Aureobasidium pullulans NRRL Y-2311-1 has shown efficacy in gluten-free cookie formulations, improving the rheological properties of the dough and the softness of the product [12].
Bacterial xylanases mostly belong to the GH10 and GH11 glycosyl hydrolase families, according to the CAZy (Carbohydrate-Active enZYmes Database) classification [13]These enzymes present broad functional and structural diversity. GH10 xylanases are generally enzymes with higher molecular mass, more open active sites and the ability to act on highly substituted xylans, while GH11 xylanases have a more compact structure, high specificity and greater catalytic efficiency on linear xylans, which reflects different adaptive strategies and biotechnological applications [14,15,16]. Recent studies demonstrate that variants of these families exhibit additional properties, such as thermostability, halo-tolerance and resistance to adverse industrial conditions, expanding the potential for use in sectors such as baking, biofuels and functional foods [14,15,16,17].
The genome of Caulobacter vibrioides Henrici and Johnson 1935 (C. crescentus heterotipic) [18]contains eight genes [19], which are directly involved in biomass degradation and are therefore relevant for biotechnological applications. Among these genes, only one encodes cellulase (celA1), two encode enzymes with endoxylanase activity (xynA1-2), and five encode enzymes with β-xylosidase activity (xynB-xynB5) [2]. This bacterium is an interesting source for studying hydrolytic enzymes since they are abundant and recurrent throughout the globe. According to the bacterial diversity metadatabase (BacDive) [20], there are currently records of 6,141 Caulobacter isolates on the planet, of which 2,002 isolates were identified in water bodies, 1,503 in soil, 969 in plants and 1,667 in different animals, of which 731 in humans [20,21]. C. vibrioides has traditionally been considered nonpathogenic and assumed to be nontoxic to humans, making it a promising bioengineering vector for environmental remediation, the food industry, and medical applications [22]
The C. vibrioides xynA1 gene [3]was previously characterized through the overexpression and purification from E. coli. Different properties was defined, highlighting that the recombinant enzyme XynA1 exhibited an optimal pH equal to 6 and peaked at 50 °C. XynA1 has demonstrated remarkable thermal stability for biotechnological applications, retaining 80% of its activity over a span of 4 hours at 50 °C. Studies using thermostable xylanases with an optimum of 50°C is justified by their greater stability and efficiency under typical baking thermal conditions, ensuring better technological performance and a lower risk of contamination in the process [23]. Then, the present study introduces a novel process approach in which a new strain was engineered in a way that xynA1 gene cloned express the XynA1 enzyme under control of a xylose inducible promoter and not by the native promoter. This approach allows that in the controlled conditions of a process only xynA1 gene cloned would be more expressed by the new strain since its native promoter is not regulated by xylose [24,25].
As mentioned before, C. vibrioides possesses a second xylanase encoding by xynA2 gene that as XynA1 is characterized as GH10 [4]Although XynB2 display 50% of activity at temperatures ranging from 40 to 90°C, it has an optimum pH of 8 and less than 35% activity at pH 6. In addition to these biochemical characteristics that do not suit applications in baking processes, the xynA2 gene is regulated by xylose [24], which would not allow exclusive control of its expression by xylose addition, as is possible with the xynA1 gene. Thus, in a context in which both genes, xynA1 and xynA2, are expressed, it is clear whether the resulting enzymatic activity comes from the expression of the XynA1 or XynA2 enzyme, simply because they have different biochemical analysis parameters. So, in the present work resulting expressed and secreted C. vibrioides XynA1 was incorporated into flour and applied throughout baking processes.
2. Materials and Methods
2.1. Bacterial Strains and Growing Conditions
The strains and plasmids used in the present work are described in Table 1. Escherichia coli DH5α and S17 bacterial strains [26] were used for subcloning and conjugation, respectively. Both strains were grown at 37 °C and maintained at 4 °C in Luria–Bertani (LB) medium [27].
The E. coli strain containing the pAS22-xynA1 [29,30]construct was grown at 37 °C and maintained at 4 °C in LB media supplemented with chloramphenicol (1 µg/mL). The bacterial strain C. vibrioides NA1000 was grown at 30 °C and maintained at 4 °C in PYE (Peptone–Yeast Extract medium) media (0.2% bactopeptone, 0.1% yeast extract, 1.7 mM MgSO4, 0.5 mM CaCl2). The BS-xynA1 strain was isolated by conjugation with E. coli-pAS22-xynA1 at 30 °C. BS-xynA1 was maintained at 4 °C in PYE media supplemented with chloramphenicol (1 µg/mL) and nalidixic acid (20 µg/mL).
To induce the expression of xynA1 gene (XynA1) and other enzymes, the wide type NA1000 strain and C. vibrioides BS-xynA1 were cultivated at 30 °C and 120 rpm in minimal medium (M2) (Na2HPO4 12 mM, NH4Cl 9 mM, KH2PO4 8 mM, MgSO4 1 mM, CaCl2 0.5 mM, FeSO4 10 mM) [19] supplemented with 0.2% (w/v) glucose or 0.3% (w/v) xylose or 0.3% (w/v) xylose containing different agro-industrial residues at 0.2% (w/v) like corn straw (CS), corn cob (CC), hemicellulose from corn straw (HPM), wheat straw (WS), polisher residue (PR), vacuum cleaner residue from industry (WF); rice flour (RF); sugarcane bagasse (SB); rice straw (RS) and soybean residue (SR).
2.2. Cloning of the xynA1 Gene in the pAS22 Expression Vector
The DNA fragment corresponding to the xynA1 gene (CCNA_02894) was isolated from the pJET1.2-xynA1 construct [3] as described below. The xynA1 gene of interest containing 1,158 base pairs present in the pJET1.2-xynA1 construct, along with the priming methionine and its stop codon, was digested with the restriction enzyme XhoI (Thermo Fischer Scientific®). This enzyme cleaves this construct only to promote the linearization of the same construct. Then, a reaction with the enzyme DNA Blunting (Fermentas®) was carried out to obtain a noncohesive end, which allowed the subcloning process in the pAS22 vector to another noncohesive site in subsequent steps. With the gene still partially attached to the pJET1.2 vector at one end but containing a noncohesive end, it was digested with the restriction enzyme EcoRI (Thermo Fischer Scientific®). After digestion, the genetic material was resolved by 1% agarose gel electrophoresis in TAE buffer. The 1,793 bp gel band, corresponding to the xynA1 gene and an untranslated portion of the pJET1.2 blunt plasmid that remained attached after the stop codon of the xynA1 gene, was cut from the agarose gel using a scalpel and recovered with a DNA extraction kit (Pure Link Gel Extraction Kit - Invitrogen®).
The plasmid used for xynA1 expression [3]in C. vibrioides was pAS22 [29,30]This plasmid has a xylose-inducible promoter, which allows for an increase in the expression of the cloned xylanase gene upstream of the promoter. Construction planning was based on experimental evidence that the C. vibrioides xynA1 gene is not regulated by xylose according to transcriptomic analysis [24,25]. Furthermore, the gene was also cloned without the control of its original promoter. The increase in gene expression in this case can easily be accompanied by an increase in xylanase activity, dispensing with evidence for the accumulation of essential protein mass in the case of proteins that do not present measurable enzymatic function. Double plasmid digestion was performed with EcoRI and EcoRV restriction enzymes (Thermo Fischer Scientific®). This linearized vector was ligated to the DNA fragment corresponding to the xynA1 gene (EcoRI/Blunt) with the aid of T4 DNA Ligase (BioLabs®). Subsequently, the pAS22-xynA1 construct was used for transformation of the E. coli strain DH5α. Transformants were selected by growth in media supplemented with chloramphenicol (1 μg/mL), a resistance marker of the pAS22 vector. After the transformants were selected, the plasmid material was extracted by mini plasmid preparation, double-digested with the restriction enzymes EcoRI/KpnI and resolved by 1% (w/v) TAE agarose gel electrophoresis to confirm the gene size.
2.3. Construction of the BS-xynA1 Strain
The pAS22-xynA1 construct was used to transform the E. coli strain S17, which has conjugative functions. Transformants were selected by growth in media supplemented with chloramphenicol (1 μg/mL), the resistance marker of the pAS22 vector. After selection of the transformant, plasmid material was extracted by mini plasmid preparation, double-digested with the restriction enzymes EcoRI/KpnI and resolved by 1% (w/v) TAE agarose gel electrophoresis to confirm the recombinant size. E. coli S17 transformant strains containing the pAS22-xynA1 construct were used for the transformation of the C. vibrioides NA1000 strain by conjugation. An aliquot of a fresh E. coli strain containing the pAS22-xynA1 vector was mixed with twice the amount of fresh C. vibrioides cells of the NA1000 strain in solid PYE media. After 48 hours of growth at 30 °C, samples of the bacterial cultures grown on the plate were streaked on a new solid PYE plate containing chloramphenicol (1 μg/mL), the pAS22 vector selection mark and nalidixic acid (20/μg mL), a selection mark of the NA1000 strain and not the E. coli strain, at 30 °C for 48 hours. Isolated colonies grown on these plates were again streaked onto a new PYE plate containing the same amount of chloramphenicol and nalidixic acid. Microscopy analysis was carried out to confirm that only C. vibrioides cells were present in the medium. Aliquots of the BS-xynA1 cells were then named BS-xynA1 and stored at -20 °C and 80 °C for subsequent characterization. In parallel to the construction of the BS-xynA1, a control strain of the NA1000 strain was constructed via conjugation of the empty plasmid pAS22 to generate the strain control WT-pAS22.
2.4. Growth, Xylose Consumption and Xylanase Production
C. vibrioides strains Cc-pAS22 and BS-xynA1 were preinoculated in 10 mL of liquid PYE medium supplemented with chloramphenicol (1 µg/mL) and nalidixic acid (20 µg/mL) and grown for 12 hours at 30 °C and 120 rpm. When the cells reached the stationary phase of growth, they were diluted (OD λ600 nm= 0.1) in flask of 250 or 500 mL M2 medium supplemented with 0.3% (w/v) xylose and grown at 30 °C and shaking of 120 rpm. Every two hours of growth, a 2 mL aliquot of the growing culture was collected. From this volume, 1 mL was used to measure spectrophotometer cell growth, 1 mL was centrifuged at 15,000 x g for 5 min at 4 °C, and the supernatant was reserved for extracellular xylanase activity analysis (optimizing for xylanase 1, pH6 and temperature of 50 °C ) in addition to the dosage of xylose consumption by the Orcinol method for pentoses [31]. Cell precipitates from centrifugation were frozen for further quantification of intracellular xylanase. The frozen cell pellet was lysed with 350 μL of 50 mM phosphate buffer, pH 6.0, under vigorous vortexing until thawing. The samples were kept on ice, and the overall activity levels of xylanolytic enzymes were determined. The assay and dosages were performed in biological and experimental triplicates, respectively.
2.5. XynA1 Production in Different Agro-Industrial Residues
Preinoculation and inoculation were performed as described in the previous section, but the M2 medium was supplemented with 0.3% (w/v) xylose and 0.2% (w/v) different agro-industrial residues. Corn straw (CS); corn cob (CC); hemicellulose from corn straw (HCS); wheat straw (WS), polisher residue (PR), vacuum cleaner residue from the industry (WF), rice flour (RF), Sugarcane bagasse (SB), rice straw (RS) and soybean residue (SR). All residues were prepared as described previously [25]. Cultures were incubated at 30 °C with shaking at 120 rpm for 18 hours. Then, the samples were centrifuged at 15,000 × g for 5 min at 4 °C. The supernatants were used to quantify XynA1 activity. The supernatant with the highest XynA1 activity was also characterized by the presence of xylanase 2, cellulase, pectinase, α-L-arabinofuranosidase, β-glucosidase, β-xylosidase and α-amylase. Since the bacterium has two genes for xylanases (xynA1: CCNA_02894 and xyn2: CCNA_03137), two enzymes can be expressed under induced conditions. In these experiments, the NA1000 strain containing only the pAS22 (Cc-pAS22) vector was used as a control.
2.6. Dosages of Different Enzymes
Reactions to verify XynA1 and XynA2 activity were performed using 1% (w/v) xylan from beechwood (Sigma®) as substrate (50 mM sodium phosphate buffer pH 6.0 for XynA1 and buffer McIvaine pH 8.0 for XynA2) followed by incubation at 50 and 60 °C, respectively. Reactions to verify cellulase and α-amylase activity were performed using 1% (w/v) carboxymethylcellulose (CMC) as the substrate in 50 mM sodium citrate buffer (pH 5.5) and 1% starch as the substrate (w/v) in 50 mM sodium citrate buffer (pH 5.0), respectively, followed by incubation at 40 °C. Reducing sugars were measured using 3,5-dinitrosalicylic acid (DNS) [32]. Xylanolytic and cellulolytic activities were defined in U/mL as the amount of enzyme capable of releasing 1 μmol of xylose per mL of solution per min of reaction (U). The enzymatic activities of β-glucosidase, β-xylosidase, and α-L-arabinosidase were determined using ρ-nitrophenyl-β-D-glucopyranoside (ρNPG) and ρ-nitrophenyl-β-D-xylopyranoside (ρNPX) reagents and ρ-nitrophenyl-α-L-arabinofuranoside (ρNPA) (Sigma®), respectively, according to the adapted methodology described by Justo et al. [33], estimating the amount of ρ-nitrophenol (ρNP) released from the respective reagents. The total protein concentration was estimated by the Bradford method [34], which uses bovine serum albumin (BSA; Bio-Rad®) as a standard.
2.7. Commercially Available Xylanases Versus Xylanase of BS-xynA1
Xylanolytic activity was also measured in different commercial xylanase mixtures available for application in the bakery industry. Among the variants tested were Spring CA 400 (produced by Granotec from Brail S.A. Nutrition and Biotechnology), Mega Cell 899 and Xylamax 292 (produced by Prozin Industrial and Comercial Ltd.). Enzymatic assays were performed as described in the previous section, with varying incubation temperatures (40, 50, 60, 70, 80, 90 and 100 °C) and pH 6. The same procedure was performed for the extracellular crude extract containing the C. vibrioides enzyme XynA1.
2.8. Test for Confirmation of the Absence of Viable Bacteria in Enzyme Extracts
The total enzyme extracts produced were centrifuged at 5,000 × g at 4 °C for 10 min. The centrifuged supernatant containing C. vibrioides XynA1 was sterilized with a 0.22 µm polystyrene vacuum filtration system containing sterile, pyrogen-free low protein binding polyether sulfone (Ciencor®). The complete absence of viable bacteria in the extracellular extracts was tested by plating a 100 µl aliquot of extracellular enzymatic crude extract into each of the three PYE media plates at 30 °C and LB at 37 °C followed by incubation for 48 hours for microbial growth investigation. Aliquots of the filtrates and cell-free XynA1was used for enzymatic assay testing after centrifugation and filtration to confirm the maintenance of xylanase activity.
2.9. mRNA xynA1 Gene Expression Analysis: RNA Extraction and RT-qPCR Assay
Analysis of xynA1 and xynA2 mRNA expression was performed by RT-qPCR using RNA extracted with Trizol (Thermo Fisher Scientific®) as indicated by the fabricant. The culture growth overnight in PYE medium at 30 °C and shaking at 120 rpm was diluted in M2 minimal culture medium containing different carbon sources separately: 0.2% (v/v) glucose (non-induced control); 0.3% (v/v) xylose; 0.3% (v/v) xylose + 0.2% (w/v) corncob (CC); 0.3% (v/v) xylose + 0.2% corn straw (CS). Parental and BS-xynA1 strains were grown to ODλ 600nm=0.8-1.0 and total RNA was extracted. The primers xynA1-Forw (5’tgcgcgtttttcttggagcg3′) and xynA1-Rev (5′tcccgcgccggcgcggccttcag3′) were used to amplify cDNA from the xynA1 gene, and the primers xynA2-Forw (5’atgtcacggctcacccgc3’) and xynA2-Rev (5’ctaccccgacagcacctc3’) were obtained for amplify the xynA2 gene, both after global transcription with Reverse Transcriptase and random bacterial primers. cDNA was synthesized using 5 μg of RNA, 500 ng of random primers and Superscript II, according to the supplier’s instructions (Thermo Fisher Scientific®). Approximately 200 ng of cDNA was used for quantitative amplification in the presence of 10 ρmoles of each oligonucleotide and 10 μl of Platinum SYBR Green (Applied Biosystems®). The reference gene 16S rRNA constitutively expressed in C. vibrioides was used to normalize the quantities of target genes (16S-rRNA-Forw: gtacggaagaggtatgtggaac and 16S-rRNA-Rev: tatctaatcctgtttgctcccc), and parental strain grown in glucose 0.2% was used as a calibrator in all tests, emphasizing that this sample was used as a basis for the comparative study of the expression results (ΔΔCT) [35]. All primers were designed using Primer Express Software (Applied Biosystems®). The presence of nonspecific products, formation of dimers between the oligonucleotides were verified by the dissociation curve using the StepOne system software (Applied Biosystems®). The relative gene expression, ΔΔCT, was calculated by the ratio of the CT (cycle threshold) of the sample in the presence of glucose or testes conditions (xylose containing or not agroindustrial residue). The data presented in this work are representative of two independent biological experiments performed in duplicate. The relative gene expression level was calculated from a group of replicates and expressed graphically. The variances of the data obtained were analyzed by the Anova test with a significance level of 99% (P = 0.01).
2.10. Software and IA Tools
Proteins and gene sequences were obtained from Kyoto Encyclopedia of Genes and Genomes (KEGG) [36]. Restriction map sequence for cloning was carried out using Restriction-Map algorithms from the Bioinformatics Sequence Manipulation Suite [37]. Primer design was carried out using Primer Express Software (Applied Biosystems®).
Glycoside hydrolases families were found according to Carbohydrate-Active enZYmes Database (CaZY) classification [13]. XynA1 structure prediction was performed by alpha-fold generative AI [38].
The literature search was performed using the ScisSpace (2025) platform, which employs artificial intelligence to identify relevant articles (https://scispace.com/copilot) through the personal signature of correspondent author: ritabioq@icloud.com profile). The detection of similarities and originality in the present academic text was carried out using Turnitin software (https://www.turnitin.com) through an institutional signature.
To survey bacterial biodiversity in the environmental context, the BacDive platform (Bacterial Diversity Metadatabase) was used [20]. “The bibliographic references in this article were managed using the Mendeley Reference Manager (Standard Pack).
The AlveoPC alveograph operates with Chopin’s proprietary software referred to as “Alveograph®” (AlveoPC / Alveograph software) — the Chopin package for acquisition analyzes the parameters (P, L, W, toughness, extensibility, baking strength, etc.) and automatically issues the test certificate. RT-qPCR data was analyzed using StepOne/ StepOnePlus Software v2.3 (Thermo®). Anova and Tukey teste was performed using the software Microsoft Excel -v16.100.4/2025 (Microsoft Corporation®). Figure 2B and the graphical abstract of this work were created using the BioRender tool under the personal profile of the corresponding author (Simão, R. profile). The remaining figures were created using Excel and PowerPoint through an institutional license for the Microsoft Office suite.
2.11. Application of C. vibrioides XynA1 Cell-Free in Bread Formulation
To ensure food safety, the C. vibrioides BS-xynA1 was grown in the absence of chloramphenicol since the cells maintained the pAS22 plasmid and xylanase production under the tested conditions for up to three consecutive days. The extracellular enzymatic extracts enriched with recombinant homologous XynA1 from C. vibrioides were filtered with a PES (polyestersulfone) vacuum filtration system of 0.1 μm and 500 mL capacity (431475-Corning®) and cell-free XynA1 was used in the baking assays. Therefore, it is certain that the final product used in the tests meets food safety standards. The xylanolytic activity of enzymatic extracts used as processing aids in the production of white wheat flour bread has been investigated. This study aimed to evaluate the effects of these enzyme extracts on bread quality using a standardized loaf formulation adhering to the guidelines of Art. 661 of the Argentine Food Code.
The baking trials were meticulously executed in triplicate, employing carefully defined formulations. The core ingredients consisted of white wheat flour (as specified), sugar, salt, fresh yeast (Fleischmann®), vegetable shortening (Coamo®), and water. To explore the impact of enzyme extracts, two additional formulations were developed based on an experimental design in which the enzyme extract concentrations were manipulated. Adjustments in water content were made according to the volume of enzyme solution employed, ensuring consistency with the standard formulation. Refer to Table 2 for a breakdown of the ingredient quantities in each test formulation. The bread dough was mixed in a 25 kg ALI 25 1G3 bivolt Braesi semi-fast tilting mixer.
The dough preparation procedure included distinct phases, each of which contributed to the final bread characteristics: 1. Mixing (Phase I and Phase II): Initial ingredients, including flour, sugar, salt, and water (also incorporating enzymatic solution for tests T2 and T3), were combined in a trough maintained at a temperature of 4 to 6 °C. This mixture was blended at a constant speed (100 rpm) for 3 min. In Phase II, the blend welcomed vegetable fat and fresh yeast, and mixing was continued at 190 rpm until the desired dough consistency was achieved; 2. Division: The resulting dough was divided into uniform 500 g portions with precision, aided by spatulas and scales; 3. Modeling: The modeling phase involved a single pass through a specialized machine designed to roll, fold, stretch, and thereby homogenize the dough. This three-step process ensured an even dough texture and structure, promoting symmetrical bread formation during fermentation and baking; 4. Fermentation and Growth: The molded dough was shaped into standard forms and positioned within a controlled fermentation chamber set at 28 °C. This allowed for an exact fermentation period of 4 hours, promoting optimal dough development; 5. Baking (Final Step): The fully formed, fermented, and grown dough was placed into a preheated oven set at 180 °C. Baking was carried out for 30 min. After baking, the loaves were allowed to cool to room temperature (25 °C). Bread height measurements were acquired using a measuring tape, and cross-sectional observations were made by halving the loaves to assess alveolar structure. Additionally, photographic documentation facilitated a comprehensive comparison between control loaves and loaves subjected to varying enzyme extract concentrations.
2.10. Alveograph Test: Evaluating Dough Viscoelastic Characteristics
The enzymatic impact on the viscoelastic properties of dough is assessed through alveograph, a technique that emulates dough behavior during fermentation by replicating the formation of air pockets (alveoli) generated by yeast-released carbon dioxide (CO2). This assessment involves the analysis of various parameters to gauge the viscoelastic traits of different dough samples. Employing the Chopin Alveograph model, AlveoPC, crafted by Chopin Technologies (Villeneuve-la-Garenne, France) and adhering to the International Association for Cereal Science and Technology guidelines (https://icc.or.at/icc-standards/standards-overview), this test method provides precision to the characterization process.
For the enzyme addition experiment (Table 3), the enzyme extract volume was determined according to the ratio of enzyme extract per kilogram of flour as utilized in baking test T3. The control run, devoid of enzyme supplementation, served as a baseline. Consistency was maintained in both the control and test groups according to the following parameters: humidity, 14.4%; hydration, 50%; and B concentration, 15% H2O, in line with the AACC methodology recommendations. The preparation involved diluting sodium chloride in sterile water to afford a 2.5% (w/v) saline solution, which was subsequently combined with the enzyme solution in the enzyme addition test. A total of 250 g of flour was introduced into the mixer at 24 ± 2 °C. The process begins, and within 20 seconds, saline solution is added. The mixing continued for one minute, encompassing the 20 seconds prior to saline addition. Following this, the mixer halts, allowing for the clearing of its sides using a spatula – a one-minute procedure. The mixture was mixed for an additional 7 min, resulting in a total of 8 min.
The mixer is then paused to alter the rotation direction of the paddle, leading to the division of the resulting dough into five uniform portions. These portions were placed within an alveograph rest chamber maintained at 25 ± 0.2 °C. Twenty-eight minutes after the initiation of dough mixing, the first portion was placed at the center of the stationary alveograph plate and coated with Vaseline. The lid is positioned and secured, and the plate undergoes two full turns within 20 seconds. Five seconds later, the lid and ring were removed, and the dough was allowed to inflate until a bubble formed. This sequence is repeated for the other four dough portions.
Parameters derived from the alveograph include toughness (P), which represents the peak pressure exerted during mass expansion (measured in millimeters); extensibility (L), which quantifies the length of the curve (measured in millimeters); and mass deformation energy (W), which signifies the mechanical work needed to expand the bubble until rupture, expressed as 10-4 J. The ratio of toughness to extensibility (P/L) offers insight into mass equilibrium, where P signifies the mass’s resistance to deformation, and L indicates mass extensibility.
2.11. Statistical Analysis
For the enzymatic treatment test within the bread formulation that preceding the alveograph analysis, the acquired data were subjected to analysis of variance (ANOVA) with a significance level of 99% (P < 0.01). Subsequently, a Tukey post hoc test was conducted to determine significant differences, maintaining a significance level of 99%.
3. Results and Discussion
3.1. Subcloning of the xynA1 Gene and Construction of the BS-xynA1 Strain
The xynA1 gene coding a Xylanase that belongs to GH10 family according CaZY is displayed in Figure 1A. The amino acid sequence predicted from xynA1 gene shown an amino terminal signal sequence highlighted in orange. In the present work the amino acid sequence of XynA1 was submitted to structure prediction using Alpha-Fold [38]. The structure obtained display a very high confidence score pLDDT= 91.25 to the most part of protein except to the amino terminal end of the protein that present a signal sequence to secretion from the cytoplasm to the extracellular media (Figure 1B).
To construct BS-xynA1 strain, we generated a C. vibrioides strain harboring a single functional copy of the xynA1 gene. This gene was placed under the control of an inducible xylose promoter [29]The construction process involved assembling a DNA fragment of 1,793 base pairs corresponding to the xynA1 gene (Figure 1C). This DNA fragment was then combined with a portion of the pJET1.2Blunt vector situated after the EcoRI-digested stop codon (Figure 1C). The resulting fragment was inserted into the pAS22 expression vector, which had been predigested with EcoRI and EcoRV enzymes. Validation of the construct, named pAS22-xynA1 (Figure 1D), was carried out by transforming it into E. coli DH5α. Successful cloning was confirmed through mini-plasmid preparation, followed by digestion with EcoRI and KpnI restriction enzymes (Figure 1D). Subsequent resolution on a 1% (w/v) agarose gel in TAE revealed the presence of a distinct 5,230 base pair band indicative of the plasmid pAS22. Another band at 1,793 base pairs, corresponding to the xynA1 insert, further confirmed the successful cloning of the expression vector.
The pAS22-xynA1 construct was transformed into the E. coli strain S17 via a transformation process. The E. coli S17 strain harboring the pAS22-xynA1 vector (Figure 1D) facilitated conjugation with the C. vibrioides NA1000 strain. Transconjugants of E. coli-(S17)-pAS22-xynA1/NA1000 were selectively cultured in PYE media supplemented with chloramphenicol (1 μg/mL) and nalidixic acid (20 μg/mL) at a temperature of 30 °C. The resulting clone was tested to determine the stability of the plasmid pAS22 within the C. vibrioides NA1000 strain after exposure to chloramphenicol, which was subsequently preserved at -80 °C. The derived strain, designated BS-xynA1, exhibited expression of the xynA1 gene and xylanase activity. This strain was subjected to various enzymatic and bakery-related assays, as described in the following sections. All experiment was carried out using NA1000 strain containing pAS22 empty plasmid as control.
3.2. Growth, Xylose Consumption and Xylanase Production of BS-XynA1 Strain
The BS-xynA1 was initially characterized for growth in minimal M2 medium supplemented with 0.3% (w/v) xylose (Figure 2A). The analysis of bacterial growth versus xylose consumption showed that they were very similar in both the parental control strain containing the empty plasmid (WT-pAS22) and the strain BS-xynA1. Xylose consumption occurred in both strains at the same rate as they advanced at different stages of the cell cycle (Figure 2A). In addition, the error bars of the growth curves of the WT-pAS22 and BS-xynA1 strain overlap throughout the cultivation, indicating that both strains show similar growth rates (Figure 2A).
The bacterium C. vibrioides exhibits an atypical asymmetric cell division in a life cycle that lasts an average of 3 hours in a defined culture medium [39]. In C. vibrioides, asymmetric division is a regular process in the life cycle, generating daughter cells with distinct morphologies and sizes. The life cycle begins with a motile cell that loses its flagellum, deconstructs its fimbriae, and begins the process of DNA replication by elongating. At the pole where the flagellum and fimbriae once stood, an adhesive stalk is assembled, and at the opposite pole, a new flagellum, thus forming a pre-divisional cell that will again give rise to two functionally and morphologically distinct daughter cells. The stalk and swarmer cell can have different average growth rates under conditions of abundant nutrients, despite sharing an identical genome and environment. In a standard culture such as the one presented in this work, there is a mixture of all cell types simultaneously (Figure 2B).”
Both the parental (WT) and BS-xynA1 bacteria grow slowly in M2 minimal medium. Figure 1 shows a prolonged log phase of growth. This likely occurs for two distinct reasons. The first is that the growth medium is less rich, impacting the speed at which both strains reach the log phase of growth. The second reason may be related to the bacteria having to replicate the pAS22 plasmid, exhibiting typical slower growth in this condition.
The control strains WT-pAS22 and the BS-xynA1 were grown in minimal media supplemented with 0.2% (v/v) glucose and 0.3% (v/v) xylose, respectively, for 24 hours. The intracellular and extracellular xylanase activities of the strains were measured and showed in the Figure 3. Intracellular xylanase activity was greater in the BS-xynA1 than in the parental strain. Thus, the optimal yield was 6.16 U/mL, which is more than 4 times greater (1.485 U/mL) than found in the extracellular media using BS-xynA1strain after 18 hours of xylose-induced cultivation (Figure 3). In the control strain, xylanase levels remained invariable between 16 and 20 hours of growth and were lower than those in the BS-xynA1 strain (Figure 3).
Even though both strains (WT and BSxynA1) have the same growth profile, it is important to emphasize that the increase in enzymatic activity does not necessarily need to be related to the accumulation of cell mass; it can be derived from an increase or decrease in gene expression and even post-translational changes that can lead to enzymatic activation, among other factors. In this sense, it is possible to clearly see that even with similar growth profiles (Figure 1), the WT and BS-xynA1 strains presented very different enzymatic activity profiles for XynA1 (Figure 2).
In addition, the data indicate that the BS-xynA1 strain, which expresses homologous XynA1 in C. vibrioides secretes part of produced enzyme (Figure 3), since high extracellular enzymatic activity was verified.
Once again it is important to emphasize that both xylanases present in C. vibrioides, XynA1 [3] and XynA2 [4] present different biochemical characteristics, to name a few optimal pH and temperature, so this property is very reliable for differentiating the activity in the measurements prior to xylanases in bacteria. Considering the biochemical parameters used of pH and temperature to measure the Xylanase activity, only XynA1 from C. vibrioides could be detected at pH 6. However, XynA2 support high temperatures like XynA1, it presents an optimum pH of 8 and can display just 35% of its activity when is incubated at pH 6 [4]. Even if XynA2 is expressed in the BS-xynA1 strain, it can be safely stated that the predominant activity seen in Figure 4 refers to XynA1 and not to XynA2. Although extracellular xylanase levels are lower than enzyme levels within the cell, it is noted that part of the enzyme is secreted and allows its application in an easier and safer manner because it is cell-free and does not require expensive enzymatic purification steps.
Although XynA1 activity levels are predominant in the BS-xynA1 strain due to increased expression from the Pxyl-promoter, some XynA2 activity is invariably present, as the xynA2 gene is not suppressed and, unlike xynA1, is upregulated by xylose. However, for the purposes of this study, the expression of both enzymes is favorable, even though XynA1 activity is more than 17-fold greater than XynA2 activity in the BS-xynA1 strain (Figure 4).
3.3. Enzyme Quantification in Extracellular Extracts of the BS-xynA1 Strain
To better characterize the extracellular extract of C. vibrioides XynA1 released by the BS-xynA1 strain, it was also evaluated for its ability to produce other enzymes, such as xylanase 2, cellulase, pectinase, α-amylase, β-glucosidase, β-xylosidase and α-L-arabinosidase (Figure 4). In the presence of 0.2% (w/v) corn straw, the xylanase concentration at pH 6.0 and 50 °C produced by BS-xynA1 was 17.22 U/mL, approximately 8 times greater than that of the control strain (2.08 U/mL). Different C. vibrioides XynA1, the optimal parameters for XynA2 activity previously studied by our group is a pH of 8.0, an optimal temperature of 60 °C [4]and an activity of 1.16 U/mL, which is approximately 15 times lower than that observed for XynA1 in the BS-xynA1 strain (Figure 4).
By comparing the activities of the cellulase, pectinase, α-amylase, β-xylosidase and α-L-arabinosidase enzymes, it was determined that all the enzymes were very weakly coexpressed with XynA1 in the control strain WT-pAS22 (Figure 4). The activity of all these enzymes was still repressed in the BS-xynA1 strain, except for the β-glucosidase, whose activity increased (1.3 U/mL) compared to that of the control strain (0.4 U/mL), although it remained the same at low levels (Figure 4). When observing the activities of the enzymes present in the extracellular extracts of the C. vibrioides BS-xynA1 and WT-pAS22 strains, it was verified a high production of XynA1 and a low production of the enzymes in general in the extracts of BS-xynA1. In contrast, the WT-pAS22 extracts showed low XynA1 enzymatic activity and increased activity of other enzymes. These data demonstrate that, in fact, the induction of xylose promoter activity from the pAS22 vector in the BS-xynA1 strain leads to a peculiar expression and specific activity of C. vibrioides XynA1 in the extracellular medium.
The great advantage of this work is that only XynA1 is induced and expressed; therefore, it is active in the bacterium C. vibrioides, while other enzymes that are commonly coexpressed with xylanases are not (Figure 4). This is because the strategy used in this study involved the use of a small amount of carbon (0.3% (v/v) xylose combined with 0.2% corn straw) to promote the activity of the pAS22 vector and consequently the xynA1 gene. This approach allows us to experimentally show the specific biotechnological role of XynA1 expression in bacterial enzyme cell-free extracts for the bread industry.
Under certain specific experimental conditions, the potential to achieve xylanolytic activities higher than those observed in our current study. However, this heightened activity is often coupled with a diminished degree of control over other contributing factors, particularly other enzymes that are significant within the context of the fermentation processes of the bread industry. An illustrative example of this can be found in the work of Corrêa et al. [40]. In their research, they advocated for the optimization of β-xylosidase expression in C. vibrioides (strain NA1000) through the application of response surface methodology, utilizing corn cob as a carbon source. Within their optimized extract, a notably distinct profile of coexpressed enzymes emerges. Interestingly, the optimized conditions to produce bacterial β-xylosidases using a 3.5% corn cob substrate (393.36 U/mL) are associated with increased xylanase activity, which surpasses the levels observed in our present study (28.28 U/mL). This parallel increase in xylanase activity mirrors the pattern observed for β-xylosidases [40].
Thus, to understand the enzymatic activity profile in the presence of corn straw, as shown in Figure 4, particularly regarding the discrepancy between the enzymatic activity measured for XynA1 and XynA2 enzymes, assays were conducted with total RNA from the BS-xynA1 strain grown in the presence of 0.3% (v/v) xylose, either separately or in combination with corn cob (CC) and corn straw (CC). The total RNA samples of BS-xynA1 were used in the assays with primers specific for the two genes xynA1 and xynA2. As shown in Figure 5, the profile of enzymatic activities shown for XynA1 and XynA2 in the presence of CS (Figure 4), presents a parallel with the variation in the expression of the mRNA xynA1 and mRNA xynA2 (Figure 5). So, these data indicate that the variation in the enzymatic activity is a reflex of a variation in the xynA1 and xynA2 gene expression in the presence of 0.2% (w/v) of corn straw associated with 0.3% (v/v) xylose. Previous data for five genes encoding beta-xylosidases of the xylanolytic complex were also not affected by the addition of corn cob to the culture medium [40]. However, no tests were performed in the presence of corn straw, which appears to be effectively involved in increasing xylanase expression in the BS-xynA1 strain, probably by providing a pXyl-inducing component in the construct or by positively affecting the expression of the xynA1 gene from its own promoter. Additional experiments should be conducted in this regard to determine the reasons for this variation.
There was no significant variation in xynA1 and xynA2 gene expression in the presence of xylose or xylose associated with corn straw. However, xynA1 was clearly induced in the presence of corn straw associated with xylose, with gene expression levels significantly higher (P<0.01), reaching more than 15 times the amount of messenger present in bacterial cells grown only in glucose (Figure 5).
3.4. XynA1 Production in Different Agro-Industrial Residues
From the intriguing result shown in the previous section, the extracellular xylanase activity values obtained for each of the agro-industrial residues were tested to evaluate the most effective residue for xylanase production (Figure 6). Among the residues tested, the highest xylanase activity (17.22 ± 0.22 U/mL) was obtained in expression medium supplemented with 0.2% (w/v) corn straw. The levels were significantly (P<0.01) lower in the other residues, so that in the presence of wheat straw and hemicellulose from wheat straw, there was practically no variation in xylanase activity (2.3 U/mL) or xylanase activity between the polished residue and the wheat flour vacuum cleaner residue from industry (1.9 U/mL).
Different studies have reported that xylanase is an inducible enzyme secreted in media containing pure xylan or xylan-rich residues. Induction is initiated primarily by xylan. Some reports have shown the induction of xylanase by lignocelluloses such as wheat bran, rice straw, corncob, and sugarcane bagasse [5]. Xylose is the preferred carbon source for xylanase production by Arthrobacter sp. [41] and in Streptomyces rameus dextrose is the best inducer of xylanase production [42,43]. Another study has been shown that xylanase induction appears to be species specific in different bacterial strains [41].
3.5. Commercial Xylanases Versus Xylanase from BS-xynA1
Commercial enzymes commonly used in baking flours in industry are spring CA400, Xylamax 292 and MegaCell 899. All of them were compared with cell-free XynA1 in enzymatic dosing assays. As a comparative parameter, the values of the specific activities (U/mg) of commercial enzymes and the XynA1 enzyme present in the crude extracellular extract obtained after BS-xynA1 strain culture filtration were adopted. The highest specific activity observed for XynA1, 163,397 U/mg, was at 50 °C, which coincides with the optimal XynA1 enzyme temperature previously reported [3] (Figure 7). In fact, XynA1 overexpression resulted in the highest specific activity (above 148 U/mg) at temperatures ranging from 50-70 °C in comparative studies. In addition, the specific enzymatic activity remained high at levels that are suitable for diverse applications in the manufacturing industry at all temperatures tested (30-100 °C) (Figure 7). These data show a certain robustness for C. vibrioides XynA1 in the large temperature range in which it has activity, demonstrating the qualities necessary for a baking enzyme (Figure 7).
3.6. The Absence of Bacteria in the Enzyme Extracts Was Tested
The experiment involved testing enzyme extracts for the presence of bacteria using two different growth media: PYE at 30 °C and LB at 37 °C. After an incubation period of 48 hours, no bacterial growth was observed in either of the media, as indicated by the lack of visible bacterial colonies on the agar plates (Figure S1). This suggests that the enzyme extracts were free from viable bacteria. This outcome could be interpreted as a successful result, indicating that the XynA1 extracellular is a cell-free enzyme.
3.7. Application of XynA1 in Bakery
In the present assay, it was considered three groups: “kneading,” which corresponds to the time taken to beat the dough until it reaches the veil point; “fermentation,” defined by the height of the bread after fermentation; and “baking,” determined by the height of the bread after baking. Each group was evaluated with the three previously described treatments, each analyzed in triplicate, totaling nine replicates per group. The data obtained (Table 4) indicated significant differences between the samples within each group, with a 99% significance level, a result confirmed by analysis of variance (Table 4).
The calculated F value greater than the critical F value confirms the existence of inequality between the measurements obtained. Additionally, Tukey’s post hoc test was applied. The least significant difference (LSD) defined by this test also demonstrated statistically significant differences between the analyzed groups. In other words, whenever the difference between the means of two modules (kneading/fermentation; fermentation/baking and kneading/baking) exceeded the LSD value, a significant difference was observed between the groups.
Table 4 clearly demonstrates the existence of significant differences related to dough kneading time. Samples subjected to an additional 1 min of kneading showed statistically significant differences, while those kneaded for 1 min less (T2 and T3) showed no significant variation. In the kneading/cooking modular relationship, a significant difference was also observed depending on the kneading time (3.1; 1.4).
In general, the Tukey test showed that both kneading time and enzyme addition influence the results of the kneading/fermentation and kneading/baking modular (2.2) relationships. Longer kneading times imply greater energy consumption, highlighting the importance of optimizing this parameter to reduce energy expenditure in baking (Table 4). Factors such as flour characteristics, water volume, and the addition of carbohydrate-degrading or debranching enzymes also contribute to reduced kneading time [44].
From another perspective, the significant difference also depended on the enzyme concentration added. In treatment T2, in which a lower amount of enzyme was used compared to treatment T3, a significant difference was observed between the modules tested (1.4) in both enzyme treatments. An inverse effect, still dependent on enzyme concentration, was identified in the fermentation/baking module, as significant differences confirmed by Tukey’s test occurred depending on the presence and concentration of the enzyme (1.2; 1.1). In summary, the results of this study indicate that the application of cell-free XynA1 from C. vibrioides in bread-making trials can reduce kneading time. It was observed that, after just 10 minutes of beating, the samples treated with the enzyme showed quantitative improvements in the final product, notably increase in bread height compared to the untreated control (Table 4). These findings are consistent with previously reported results for breads produced with flours supplemented with commercial xylanases [45].
Other studies have also demonstrated improvements in bread characteristics with the addition of xylanases, but all these studies used commercial enzymes [45,46]. Jiang et al.[47] did not use a commercial enzyme but rather a xylanase isolated from Thermomyces lanuginosus CAU44 using costly enzymatic purification techniques. In the present work, we used a cell free extracellular extract (without previous purification) because xynA1 gene is more expressed (Figure 5) and XynA1 enzyme is predominantly secreted in relation to other enzymes (Figure 4) and presents the advantage of not spending time and costs on complex purification and enzymatic isolation methodologies.
De Queiroz Brito Cunha [48] reported that the enzyme derived from the synthetic gene Streptomyces sp. XynBS27, the cloned S27 expressed in Pichia pastoris, was used in the breadmaking test. After purification, it was used as an additive in the baking process, promoting a decrease in stiffness and improvements in specific volume. In tests involving the enzymatic treatment of bread with the crude extract of C. vibrioides BS-xynA1, similar results were obtained for improving bread characteristics.
3.8. Alveograph Test
The alveograph evaluations were carried out through five replicates, both in the absence and presence of the XynA1 enzyme extract enrichment. The introduction of the bacterial XynA1 notably improved the dough properties, specifically in terms of extensibility (L) and toughness reduction (P). This enhancement indicated a favorable impact due to the presence of XynA1, resulting in a dough that is more pliable and less rigid (Figure 8).
The addition of XynA1 resulted in increased dough extensibility (L) in alveographic tests compared to the control, indicating a significant improvement in dough elasticity while maintaining structural integrity. Furthermore, the addition of XynA1 led to a reduction (from 134 mmH2O to 126 mmH2O) in toughness (P), effectively reducing dough stiffness (Table 5). Furthermore, the combined effect of the increased extensibility (L) and decreased toughness (P) resulted in a reduction (from 1.94 to 1.54) in the toughness/elasticity (P/L) ratio compared to the untreated dough. The original graph generated by the alveograph is shown in Figure 8; the numerical data download from the equipment were considered in the statistical analyses shown in Table 5 that show significant differences obtained and confirmed by analysis of variance (Anova) followed by Tukey’s post hoc test. The modular differences calculated for the parameters P, L and W were lower than the minimum significant limit (LSD) determined by the Tukey test, indicating that the observed differences are statistically significant at the 99% level (p < 0.01) (Table 5).
Remaining within the context of the analysis obtained from the alveograph, the addition of XynA1 reduced the maximum pressure (P) and the tensile strength/extensibility ratio (P/L) (Table 5). It is suggested that these results can be attributed to the hydrolysis of insoluble pentosans during the fermentation process, which leads to the release of water and softening of the dough texture. These data are like those observed in Bacillus subtilis [49], where the addition of xylanase resulted in better dough consistency during kneading and consequently better bread quality.
The present study satisfactorily demonstrated that XynA1, when incorporated into the bread-making process, significantly influences the rheological properties of the dough. This influence resulted in an increase in bread volume (Figure 9) and an overall improvement in the alveolar structure of the crumb (Figure 8; Table 4 and Table 5). Then, the present work demonstrates a novel approach to produce XynA1, previously unexplored to this bacterium, and the homologous expression in C. vibrioides to produce this enzyme represents a groundbreaking advance. The successful application of XynA1 in the baking industry demonstrates its practical, inexpensive utility, with potential free commercial applications yet to be tested.
Recombinant DNA technology and protein engineering offer solutions to common drawbacks associated with native enzymes, such as low yields, inconsistent reproducibility, and suboptimal performance. This allows for the creation of redesigned enzymes with improved properties tailored to specific industrial needs [51]. Although the approach presented in this work is promising, the absence of a purification step can result in the presence of low-molecular-weight secondary metabolites [52], in addition to high-molecular-weight compounds, in the preparation of XynA1 and co-expressed enzymes from C. vibrioides (Figure 4). In the absence of a purification process, the composition and concentration of these compounds present in the XynA1-rich cell-free extract can vary considerably, and in practice, the reproducibility of the process may be limited, potentially affecting its industrial applicability. Furthermore, other heat-stable impurities can also affect product quality [53]. To address this drawback, better characterization of potential impurities generated in the secreted extract would be necessary, beyond better characterization of the BS-xnyA1 secretome using strategies of proteomics associated with LC-MS/MS, which could provide greater safety and reproducibility for future applications.
The alternatives for process improvement for industrial application and obtaining a better product are very broad. It is important to emphasize that cumbersome processes could increase the cost of using the secreted enzyme and undermine the main objective of this work: to propose a low-cost alternative for improving wheat flour, the main raw material for bread. In this sense, it is important to emphasize that bread is one of the most consumed foods in Brazil, a country that still faces high rates of food insecurity [54]. Therefore, proposing lower-cost production alternatives for this food represents not only a technological advancement but also a socially relevant initiative.
Supplementary Materials
The following supporting information can be downloaded at Preprints.org.
Author Contributions
B.S.: investigation, visualization, and writing - original draft; P.M.C.R, A. F, J.L.C.S.; R.F.G. and AM: methodology; M.K.: methodology and resources; RCGS: Software, project administration, funding acquisition, supervision, writing, review, and editing. All authors have read and agreed to the published version of the manuscript.
Funding
B. Simioni; P.M.C. Rocha, A. Favero were fellows of CAPES, the Coordination of Improvement of Higher Education Personnel. M. K. Kadowaki was supported by CNPq (Universal Grant: 407596/2023-2) and Fundação Araucária (Project nº: PRD2023361000397 Agreement nº 180/2025 PDI. R.C.G. Simão was supported by Superintendência Geral de Ciência, Tecnologia e Ensino Superior do Estado do Paraná (TED n° 032/2025 – EG n° 14/2024).
Institutional Review Board Statement
Not applicable.
Informed Consent Statement
Not applicable.
Data Availability Statement
The original contributions presented in this study are included in the article. Further inquiries can be directed to the corresponding author.
Acknowledgments
This work was supported by SETI (Superintendência Geral de Ciência, Tecnologia e Ensino Superior do Estado do Paraná - TED n° 032/2025 – EG n° 14/2024). We thank P. R. Heinen for the critical reading of this manuscript and suggestions for its improvement. The alveograph tests were carried out by B. Simioni under the supervision and technical-professional assistance of P.H. Zanini from Moinho Rio Azul. The authors kindly thank P. H. Zanini for their partnership in the present work. The authors thank Elaine Aparecida Wilges Kronbauer by thecnical support in all labs of our group at Unioeste.
Conflicts of Interest
The authors declare no conflict of interest.
References
- Manicardi, T.; Baioni e Silva, G.; Longati, A.A.; Paiva, T.D.; Souza, J.P.M.; Pádua, T.F.; Furlan, F.F.; Giordano, R.L.C.; Giordano, R.C.; Milessi, T.S. Xylooligosaccharides: A Bibliometric Analysis and Current Advances of This Bioactive Food Chemical as a Potential Product in Biorefineries’ Portfolios. Foods 2023, 12, 3007. [Google Scholar] [CrossRef]
- Bosetto, A.; Justo, P.I.; Zanardi, B.; Venzon, S.S.; Graciano, L.; dos Santos, E.L.; de Cássia Garcia Simão, R. Research Progress Concerning Fungal and Bacterial β-Xylosidases. Appl Biochem Biotechnol 2016, 178, 766–795. [Google Scholar] [CrossRef]
- Graciano, L.; Corrêa, J.M.; Vieira, F.G.N.; Bosetto, A.; Loth, E.A.; Kadowaki, M.K.; Gandra, R.F.; Simão, R. de C.G. Cloning and Expression of the XynA1 Gene Encoding a Xylanase of the GH10 Group in Caulobacter Crescentus. Appl Biochem Biotechnol 2015, 175, 3915–3929. [Google Scholar] [CrossRef] [PubMed]
- Jacomini, D.; Bussler, L.; Corrêa, J.M.; Kadowaki, M.K.; Maller, A.; da-Conceição Silva, J.L.; Simão, R. de C.G. Cloning, Expression and Characterization of C. Crescentus XynA2 Gene and Application of Xylanase II in the Deconstruction of Plant Biomass. Mol Biol Rep 2020, 47, 4427–4438. [Google Scholar] [CrossRef]
- Chakdar, H.; Kumar, M.; Pandiyan, K.; Singh, A.; Nanjappan, K.; Kashyap, P.L.; Srivastava, A.K. Bacterial Xylanases: Biology to Biotechnology. 3 Biotech 2016, 6, 150. [Google Scholar] [CrossRef] [PubMed]
- Dutta, B.; Banerjee, A.; Chakraborty, P.; Bandopadhyay, R. In Silico Studies on Bacterial Xylanase Enzyme: Structural and Functional Insight. Journal of Genetic Engineering and Biotechnology 2018, 16, 749–756. [Google Scholar] [CrossRef]
- Fang, C.; Wang, Q.; Selvaraj, J.N.; Zhou, Y.; Ma, L.; Zhang, G.; Ma, Y. High Copy and Stable Expression of the Xylanase XynHB in Saccharomyces Cerevisiae by RDNA-Mediated Integration. Sci Rep 2017, 7. [Google Scholar] [CrossRef]
- Liu, W.; Ming, J.; Brennan, M.; Brennan, C. Enzymes (α-Amylase, Xylanase, and Cellulase) in Steamed Buckwheat Buns: The Effects on Quality and Predicted Glycemic Response. Foods 2025, 14. [Google Scholar] [CrossRef] [PubMed]
- Putseys, J.A.; Schooneveld-Bergmans, M.E.F. Enzymes Used in Baking. In Industrial Enzyme Applications; Wiley, 2019; pp. 95–123.
- Kumar, V.; Binod, P.; Sindhu, R.; Gnansounou, E.; Ahluwalia, V. Bioconversion of Pentose Sugars to Value Added Chemicals and Fuels: Recent Trends, Challenges and Possibilities. Bioresour Technol 2018, 269, 443–451. [Google Scholar] [CrossRef]
- Kaur, D.; Joshi, A.; Sharma, V.; Batra, N.; Sharma, A.K. An Insight into Microbial Sources, Classification, and Industrial Applications of Xylanases: A Rapid Review. Biotechnol Appl Biochem 2023, 70, 1489–1503. [Google Scholar] [CrossRef]
- Yegin, S.; Altinel, B.; Tuluk, K. Exploitation of Aureobasidium Pullulans NRRL Y-2311-1 Xylanase in Mulberry and Rice Flours–Based Gluten-Free Cookie Formulation: Effects on Dough Properties and Cookie Characteristics. J Food Sci 2024, 89, 2645–2658. [Google Scholar] [CrossRef]
- Lombard, V.; Golaconda Ramulu, H.; Drula, E.; Coutinho, P.M.; Henrissat, B. The Carbohydrate-Active Enzymes Database (CAZy) in 2013. Nucleic Acids Res 2014, 42. [Google Scholar] [CrossRef]
- Lu, L.; Liu, Y.; Zhang, Z. Global Characterization of Gh10 Family Xylanase Genes in Rhizoctonia Cerealis and Functional Analysis of Xylanase RcXYN1 during Fungus Infection in Wheat. Int J Mol Sci 2020, 21. [Google Scholar] [CrossRef]
- Malgas, S.; Mafa, M.S.; Mathibe, B.N.; Pletschke, B.I. Unraveling Synergism between Various GH Family Xylanases and Debranching Enzymes during Hetero-Xylan Degradation. Molecules 2021, 26. [Google Scholar] [CrossRef] [PubMed]
- Glekas, P.D.; Kalantzi, S.; Dalios, A.; Hatzinikolaou, D.G.; Mamma, D. Biochemical and Thermodynamic Studies on a Novel Thermotolerant GH10 Xylanase from Bacillus Safensis. Biomolecules 2022, 12. [Google Scholar] [CrossRef]
- Ma, J.; Sun, Z.; Ni, Z.; Qi, Y.; Sun, Q.; Hu, Y.; Li, C. Molecular Identification and Engineering a Salt-Tolerant GH11 Xylanase for Efficient Xylooligosaccharides Production. Biomolecules 2024, 14. [Google Scholar] [CrossRef] [PubMed]
- Victor Bruce Darlington Skerman; Vicki MacGowan; P. H. A. Sneath Approved Lists of Bacterial Names. Committee on Systematic Bacteriology. Judicial Commission.; Amended ed. American Society for Microbiology, 1989; ISBN 1555810144.
- Marks, M.E.; Castro-Rojas, C.M.; Teiling, C.; Du, L.; Kapatral, V.; Walunas, T.L.; Crosson, S. The Genetic Basis of Laboratory Adaptation in Caulobacter Crescentus. J Bacteriol 2010, 192, 3678–3688. [Google Scholar] [CrossRef] [PubMed]
- Schober, I.; Koblitz, J.; Carbasse, J.S.; Ebeling, C.; Schmidt, M.L.; Podstawka, A.; Gupta, R.; Ilangovan, V.; Chamanara, J.; Overmann, J.; et al. BacDive in 2025: The Core Database for Prokaryotic Strain Data. Nucleic Acids Res 2025, 53, D748–D756. [Google Scholar] [CrossRef]
- Shoki Hosoi-Tanabe, Hongyan Zhang, Daochen Zhu, Shinichi Nagata, S.B. and S.Imura. Comprehensive Analysis of an Antarctic Bacterial Community with the Adaptability of Growth at Higher. Biocontrol Sci 2010, 15, 57–62. [CrossRef]
- Moore, G.M.; Gitai, Z. Both Clinical and Environmental Caulobacter Species Are Virulent in the Galleria Mellonella Infection Model. PLoS One 2020, 15. [Google Scholar] [CrossRef]
- Zhang, D.; Huang, J.; Liu, Y.; Chen, X.; Gao, T.; Li, N.; Huang, W.; Wu, M. Directed Modification of a GHF11 Thermostable Xylanase AusM for Enhancing Inhibitory Resistance towards SyXIP-I and Application of AusMPKK in Bread Making. Foods 2023, 12, 3574. [Google Scholar] [CrossRef]
- Hottes, A.K.; Meewan, M.; Yang, D.; Arana, N.; Romero, P.; McAdams, H.H.; Stephens, C. Transcriptional Profiling of Caulobacter Crescentus during Growth on Complex and Minimal Media. J Bacteriol 2004, 186, 1448–1461. [Google Scholar] [CrossRef]
- Corrêa, J.M.; Mingori, M.R.; Gandra, R.F.; Loth, E.A.; Seixas, F.A.V.; Simão, R. de C.G. Depletion of the XynB2 Gene Upregulates β-Xylosidase Expression in C. Crescentus. Appl Biochem Biotechnol 2014, 172, 1085–1097. [Google Scholar] [CrossRef] [PubMed]
- R. Simon, U.P. and A.P. A Broad Host Range Mobilization System for in Vivo Genetic Engineering: Transposon Mutagenisis in Gram Negative Bacteria. Research Paper 1983, 784–791.
- Green, M.R..; Sambrook, Joseph. Molecular Cloning : A Laboratory Manual; Cold Spring Harbor, N.Y.C.S.H.L.P., Ed.; Fourth Edition.; Cold Spring Harbor Laboratory Press, 2012; ISBN 9781936113422.
- Evinger, M.; Agabian, N. Envelope-Associated Nucleoid from Caulobacter Crescentus Stalked and Swarmer Cells; 1977;
- Meisenzahl, A.C.; Shapiro, L.; Jenal, U. Isolation and Characterization of a Xylose-Dependent Promoter from Caulobacter Crescentus. J Bacteriol 1997, 179, 592–600. [Google Scholar] [CrossRef] [PubMed]
- Jenal, U. An Essential Protease Involved in Bacterial Cell-Cycle Control. EMBO J 1998, 17, 5658–5669. [Google Scholar] [CrossRef]
- Herbert, D.; Phipps, P.J.; Strange, R.E. Chapter III Chemical Analysis of Microbial Cells. In Methods in Microbiology; 1971; Vol. 5-Part B, pp. 209–344.
- Santos, A.A. dos; Deoti, J.R.; Müller, G.; Dário, M.G.; Stambuk, B.U.; Alves Junior, S.L. Dosagem de Açúcares Redutores Com o Reativo DNS Em Microplaca. Brazilian Journal of Food Technology 2017, 20. [Google Scholar] [CrossRef]
- Justo, P.I.; Corrêa, J.M.; Maller, A.; Kadowaki, M.K.; da Conceição-Silva, J.L.; Gandra, R.F.; Simão, R. de C.G. Analysis of the XynB5 Gene Encoding a Multifunctional GH3-BglX β-Glucosidase-β-Xylosidase-α-Arabinosidase Member in Caulobacter Crescentus. Antonie van Leeuwenhoek, International Journal of General and Molecular Microbiology 2015, 108, 993–1007. [Google Scholar] [CrossRef]
- Bradford, M.M. A Rapid and Sensitive Method for the Quantitation of Microgram Quantities of Protein Utilizing the Principle of Protein-Dye Binding; 1976; Vol. 72.
- Bustin, S.A.; Benes, V.; Garson, J.A.; Hellemans, J.; Huggett, J.; Kubista, M.; Mueller, R.; Nolan, T.; Pfaffl, M.W.; Shipley, G.L.; et al. The MIQE Guidelines: Minimum Information for Publication of Quantitative Real-Time PCR Experiments. Clin Chem 2009, 55, 611–622. [Google Scholar] [CrossRef] [PubMed]
- Kanehisa, M.; Furumichi, M.; Sato, Y.; Ishiguro-Watanabe, M.; Tanabe, M. KEGG: Integrating Viruses and Cellular Organisms. Nucleic Acids Res 2021, 49, D545–D551. [Google Scholar] [CrossRef]
- Stothard, P. The Sequence Manipulation Suite: JavaScript Programs for Analyzing and Formatting Protein and DNA Sequences. Biotechniques 2000, 28. [Google Scholar] [CrossRef]
- Jumper, J.; Evans, R.; Pritzel, A.; Green, T.; Figurnov, M.; Ronneberger, O.; Tunyasuvunakool, K.; Bates, R.; Žídek, A.; Potapenko, A.; et al. Highly Accurate Protein Structure Prediction with AlphaFold. Nature 2021, 596, 583–589. [Google Scholar] [CrossRef]
- Glenn, S.; Fragasso, A.; Lin, W.H.; Papagiannakis, A.; Kato, S.; Jacobs-Wagner, C. Coupling of Cell Growth Modulation to Asymmetric Division and Cell Cycle Regulation in Caulobacter Crescentus. Proc Natl Acad Sci U S A 2024, 121. [Google Scholar] [CrossRef] [PubMed]
- Corrêa, J.M.; dos Santos, E.L.; Simões, M.R.; Kadowaki, M.K.; Gandra, R.F.; Simão, R. de C.G. Optimization of C. Crescentus β-Xylosidases and Expression of XynB1–5 Genes in Response to Agro-Industrial Waste. Waste Biomass Valorization 2020, 11, 6169–6178. [Google Scholar] [CrossRef]
- Rai, R.; Samanta, D.; Goh, K.M.; Chadha, B.S.; Sani, R.K. Biochemical Unravelling of the Endoxylanase Activity in a Bifunctional GH39 Enzyme Cloned and Expressed from Thermophilic Geobacillus Sp. WSUCF1. WSUCF1. Int J Biol Macromol 2024, 257. [Google Scholar] [CrossRef] [PubMed]
- Fatokun, E.N.; Nwodo, U.U.; Okoh, A.I. Classical Optimization of Cellulase and Xylanase Production by a Marine Streptomyces Species. Applied Sciences (Switzerland) 2016, 6. [Google Scholar] [CrossRef]
- Zhu, W.; Qin, L.; Xu, Y.; Lu, H.; Wu, Q.; Li, W.; Zhang, C.; Li, X. Three Molecular Modification Strategies to Improve the Thermostability of Xylanase XynA from Streptomyces Rameus L2001. Foods 2023, 12. [Google Scholar] [CrossRef] [PubMed]
- Parenti, O.; Zanoni, B.; Giuffrè, M.R.; Guerrini, L. The Effect of Kneading Speed on Breadmaking from Unrefined Wheat Flour Dough. European Food Research and Technology 2022, 248, 543–551. [Google Scholar] [CrossRef]
- Hu, G.; Hong, X.; Zhu, M.; Lei, L.; Han, Z.; Meng, Y.; Yang, J. Improving the Quality of Wheat Flour Bread by a Thermophilic Xylanase with Ultra Activity and Stability Reconstructed by Ancestral Sequence and Computational-Aided Analysis. Molecules 2024, 29, 1895. [Google Scholar] [CrossRef]
- de Oliveira Simas, A.L.; de Alencar Guimarães, N.C.; Glienke, N.N.; Galeano, R.M.S.; de Sá Teles, J.S.; Kiefer, C.; de Souza Nascimento, K.M.R.; Masui, D.C.; Zanoelo, F.F.; Giannesi, G.C. Production of Phytase, Protease and Xylanase by Aspergillus Niveus with Rice Husk as a Carbon Source and Application of the Enzymes in Animal Feed. Waste Biomass Valorization 2024. [CrossRef]
- Jiang, Z.Q.; Yang, S.Q.; Tan, S.S.; Li, L.T.; Li, X.T. Characterization of a Xylanase from the Newly Isolated Thermophilic Thermomyces Lanuginosus CAU44 and Its Application in Bread Making. Lett Appl Microbiol 2005, 41, 69–76. [Google Scholar] [CrossRef]
- De Queiroz Brito Cunha, C.C.; Gama, A.R.; Cintra, L.C.; Bataus, L.A.M.; Ulhoa, C.J. Improvement of Bread Making Quality by Supplementation with a Recombinant Xylanase Produced by Pichia Pastoris. PLoS One 2018, 13. [Google Scholar] [CrossRef]
- Osella, C. , de la Torre, M., Erbem, M., Galhardo, A>, and Sánchez, H. Effect of Xylanase on the Technological Behavior of Wheat Flours. Academia Journal of Food Research 1(2): 2013, 1, 014–018. [Google Scholar]
- Brasil Law 11.105/2005; Presidência da República; Casa Civil; Subchefia para assuntos jurídicos.: Brasil, 2005; pp. 1–11.
- Trono, D. Recombinant Enzymes in the Food and Pharmaceutical Industries. In Biomass, Biofuels, Biochemicals: Advances in Enzyme Technology; Elsevier, 2019; pp. 349–387 ISBN 9780444641144.
- Puetz, J.; Wurm, F.M. Recombinant Proteins for Industrial versus Pharmaceutical Purposes: A Review of Process and Pricing. Processes 2019, 7, 476. [Google Scholar] [CrossRef]
- Pobiega, K.; Sękul, J.; Pakulska, A.; Latoszewska, M.; Michońska, A.; Korzeniowska, Z.; Macherzyńska, Z.; Pląder, M.; Duda, W.; Szafraniuk, J.; et al. Fungal Proteins: Sources, Production and Purification Methods, Industrial Applications, and Future Perspectives. Applied Sciences (Switzerland) 2024, 14. [Google Scholar] [CrossRef]
- Fernandes, B.; Dias da Silva Guerra, L. Insegurança Alimentar e Nutricional No Brasil. JMPHC | Journal of Management & Primary Health Care | ISSN 2179-6750 2023, 15, e003. [Google Scholar] [CrossRef]
Figure 1.
- Strategies for engineering C. vibrioides strains that overexpress XynA1 in the strain BS-xynA1. (A) The xynA1 gene (accession number: CCNA_02894) coding a Xylanase that belongs to GH10 family. The amino acid sequence predicted from xynA1 gene, and the amino terminal signal sequence highlighted in orange. (B) XynA1 structure prediction using Alpha-Fold Software[38]. (C) Genetic context of the xynA1 construct in the pJet1.2-Blunt cloning vector. The pJet1.2-Blunt construct containing the xynA1 gene was digested with XhoI and treated to produce blunt-end DNA. (D) Next, pJet1.2-Blunt-xynA1 was digested with EcoRI, and the resulting fragment, containing the complete xynA1 gene, was subcloned and inserted into the pAS22 vector (EcoRI/EcoRV) under the control of a promoter induced by xylose, generating the synthetic strain BS-xynA1, which expresses XynA1 when 0.3% (w/v) xylose is added. DNA agarose gel electrophoresis on 1% (w/v) TAE gel. 1: Molecular weight marker 1 kb DNA Ladder (Thermo); 2: Construction of pAS22-xynA1 digested with EcoRI/KpnI enzymes.
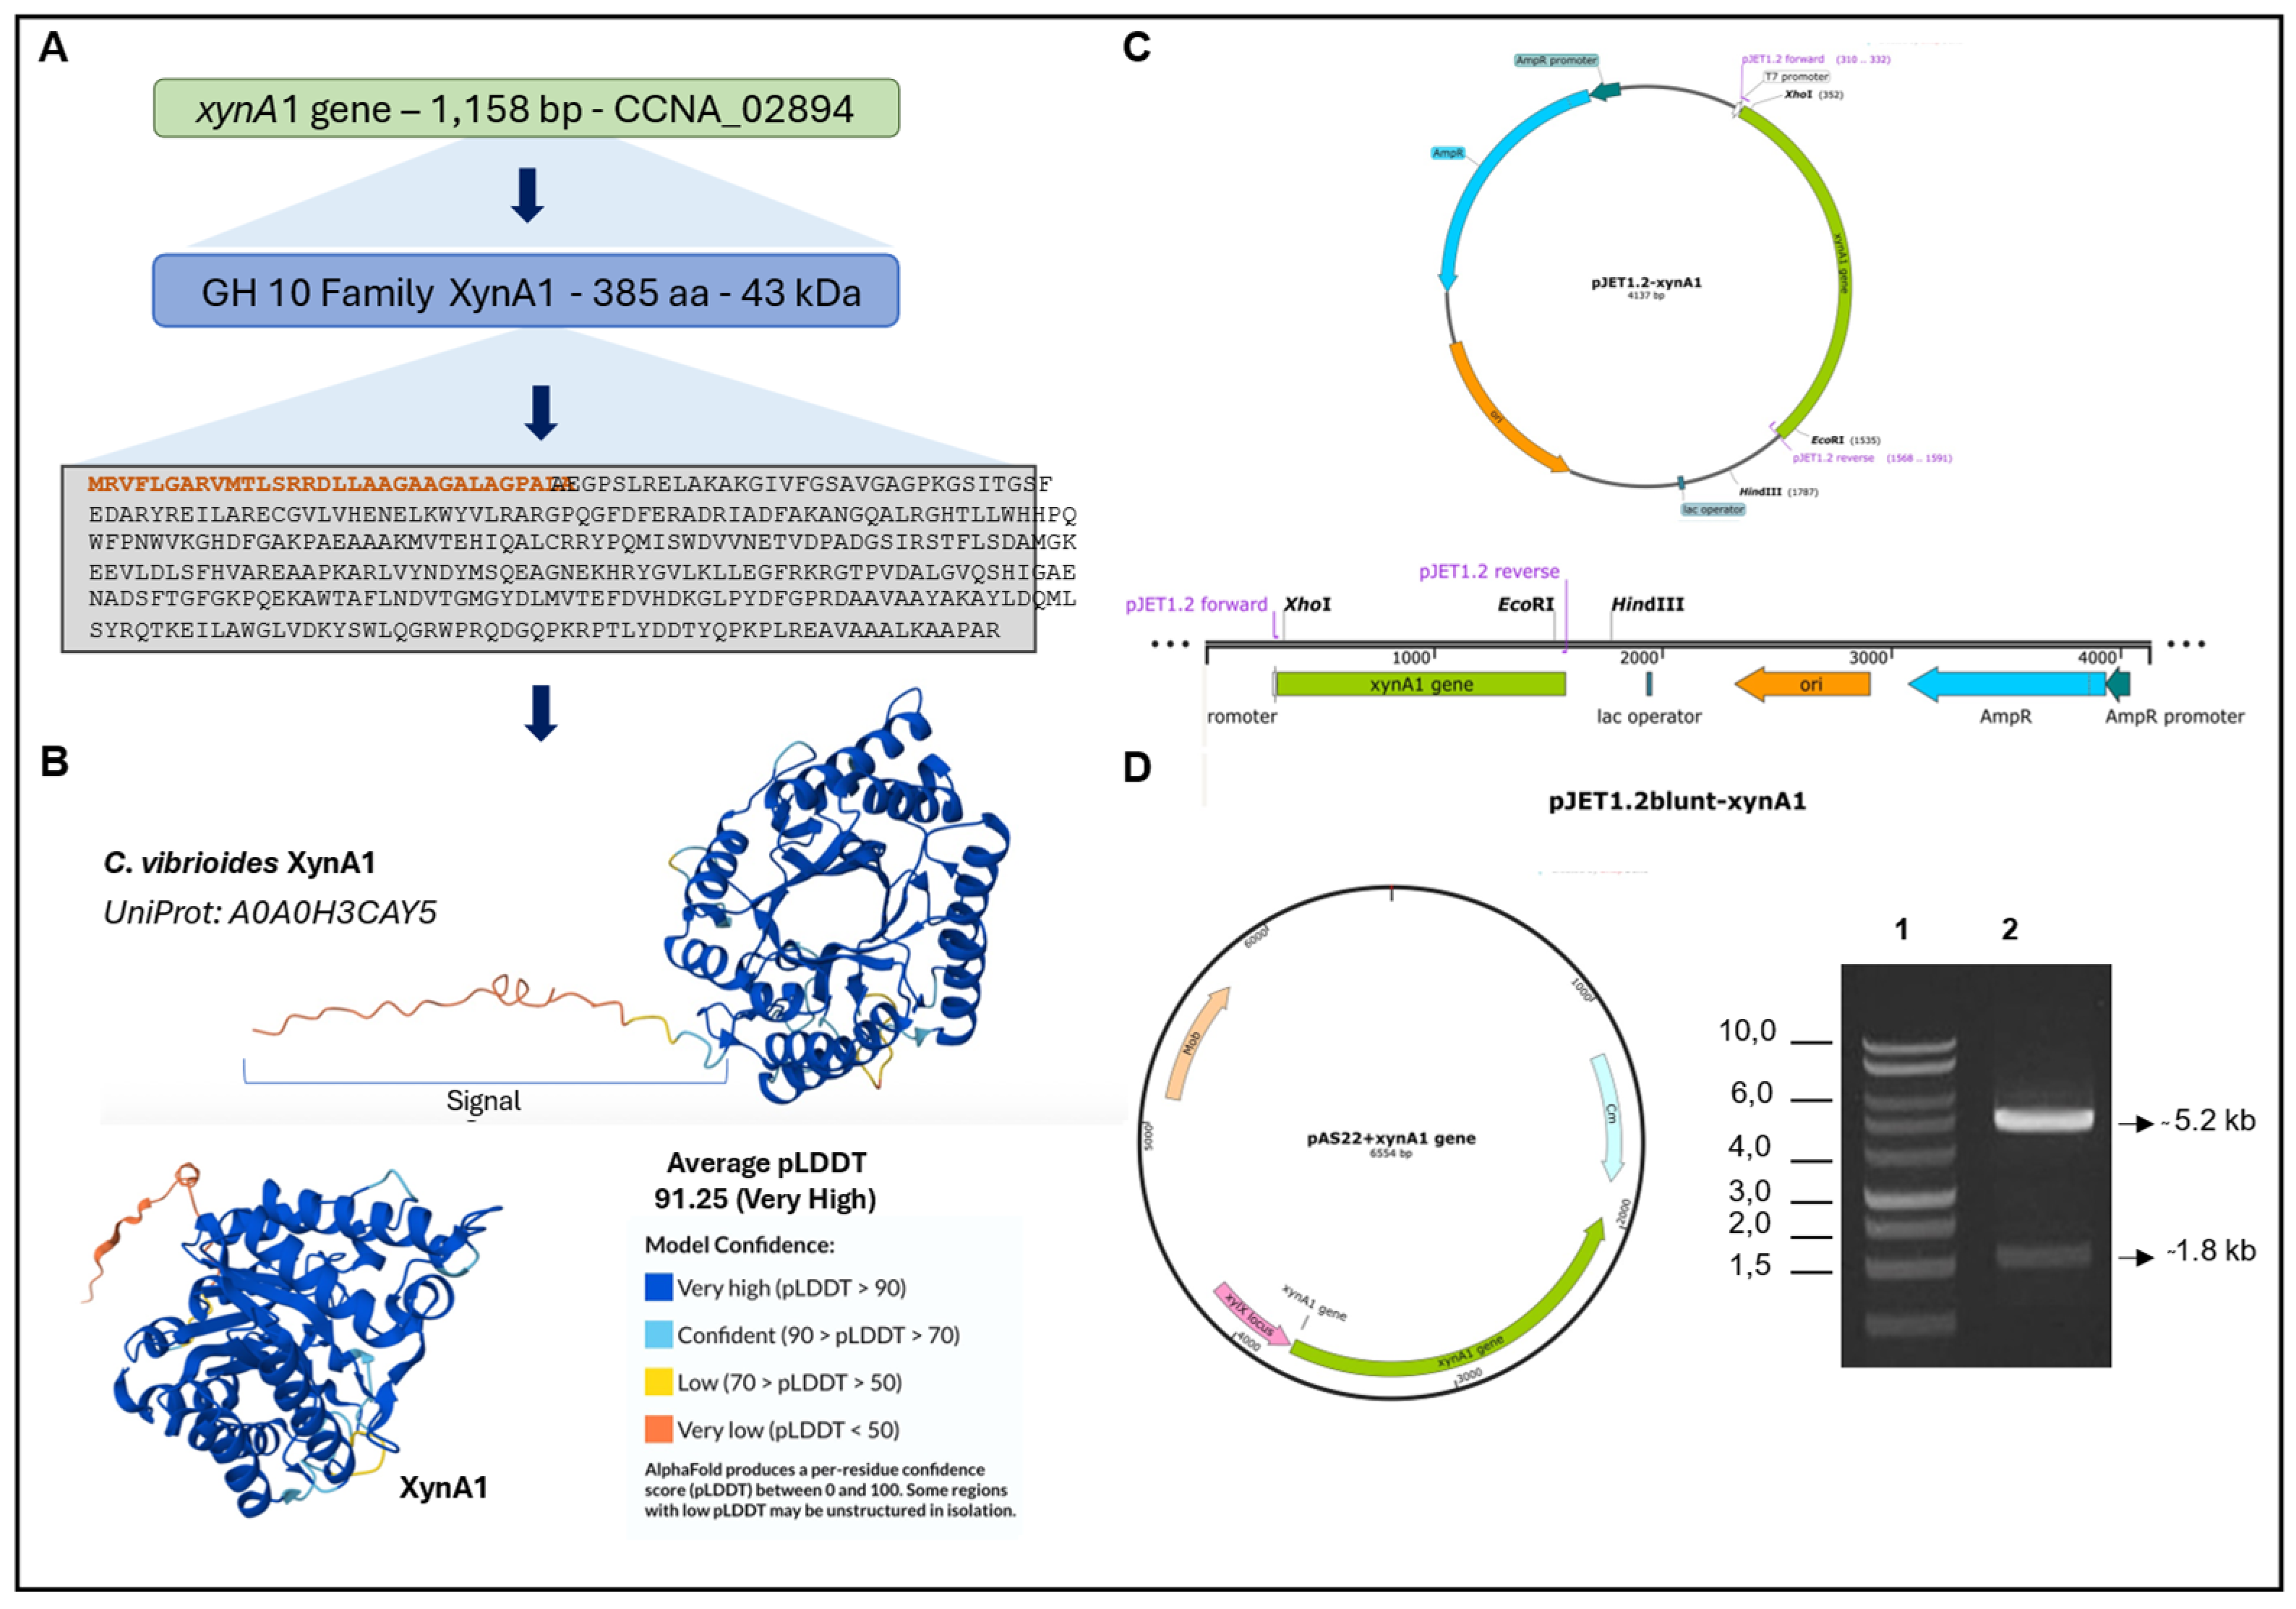
Figure 2.
(A) Xylose consumption and cell growth curves of the wide type of strain (WT-pAS22) and the recombinant strain BS-xynA1 in M2 media supplemented with 0.3% (w/v) xylose at 30 °C and 120 rpm. Cell growth (gray and blue continuous line) is expressed as the O.D.λ = 600 nm. The residual xylose content (gray and blue bars) is expressed as a percentage of the total initial sugar content; (B) Asymmetric life cycle of the bacterium C. vibrioides. (For more details see the text). (Figure 2B was created in BioRender. Simão, R. (2025) https://BioRender.com/9m2r43j).
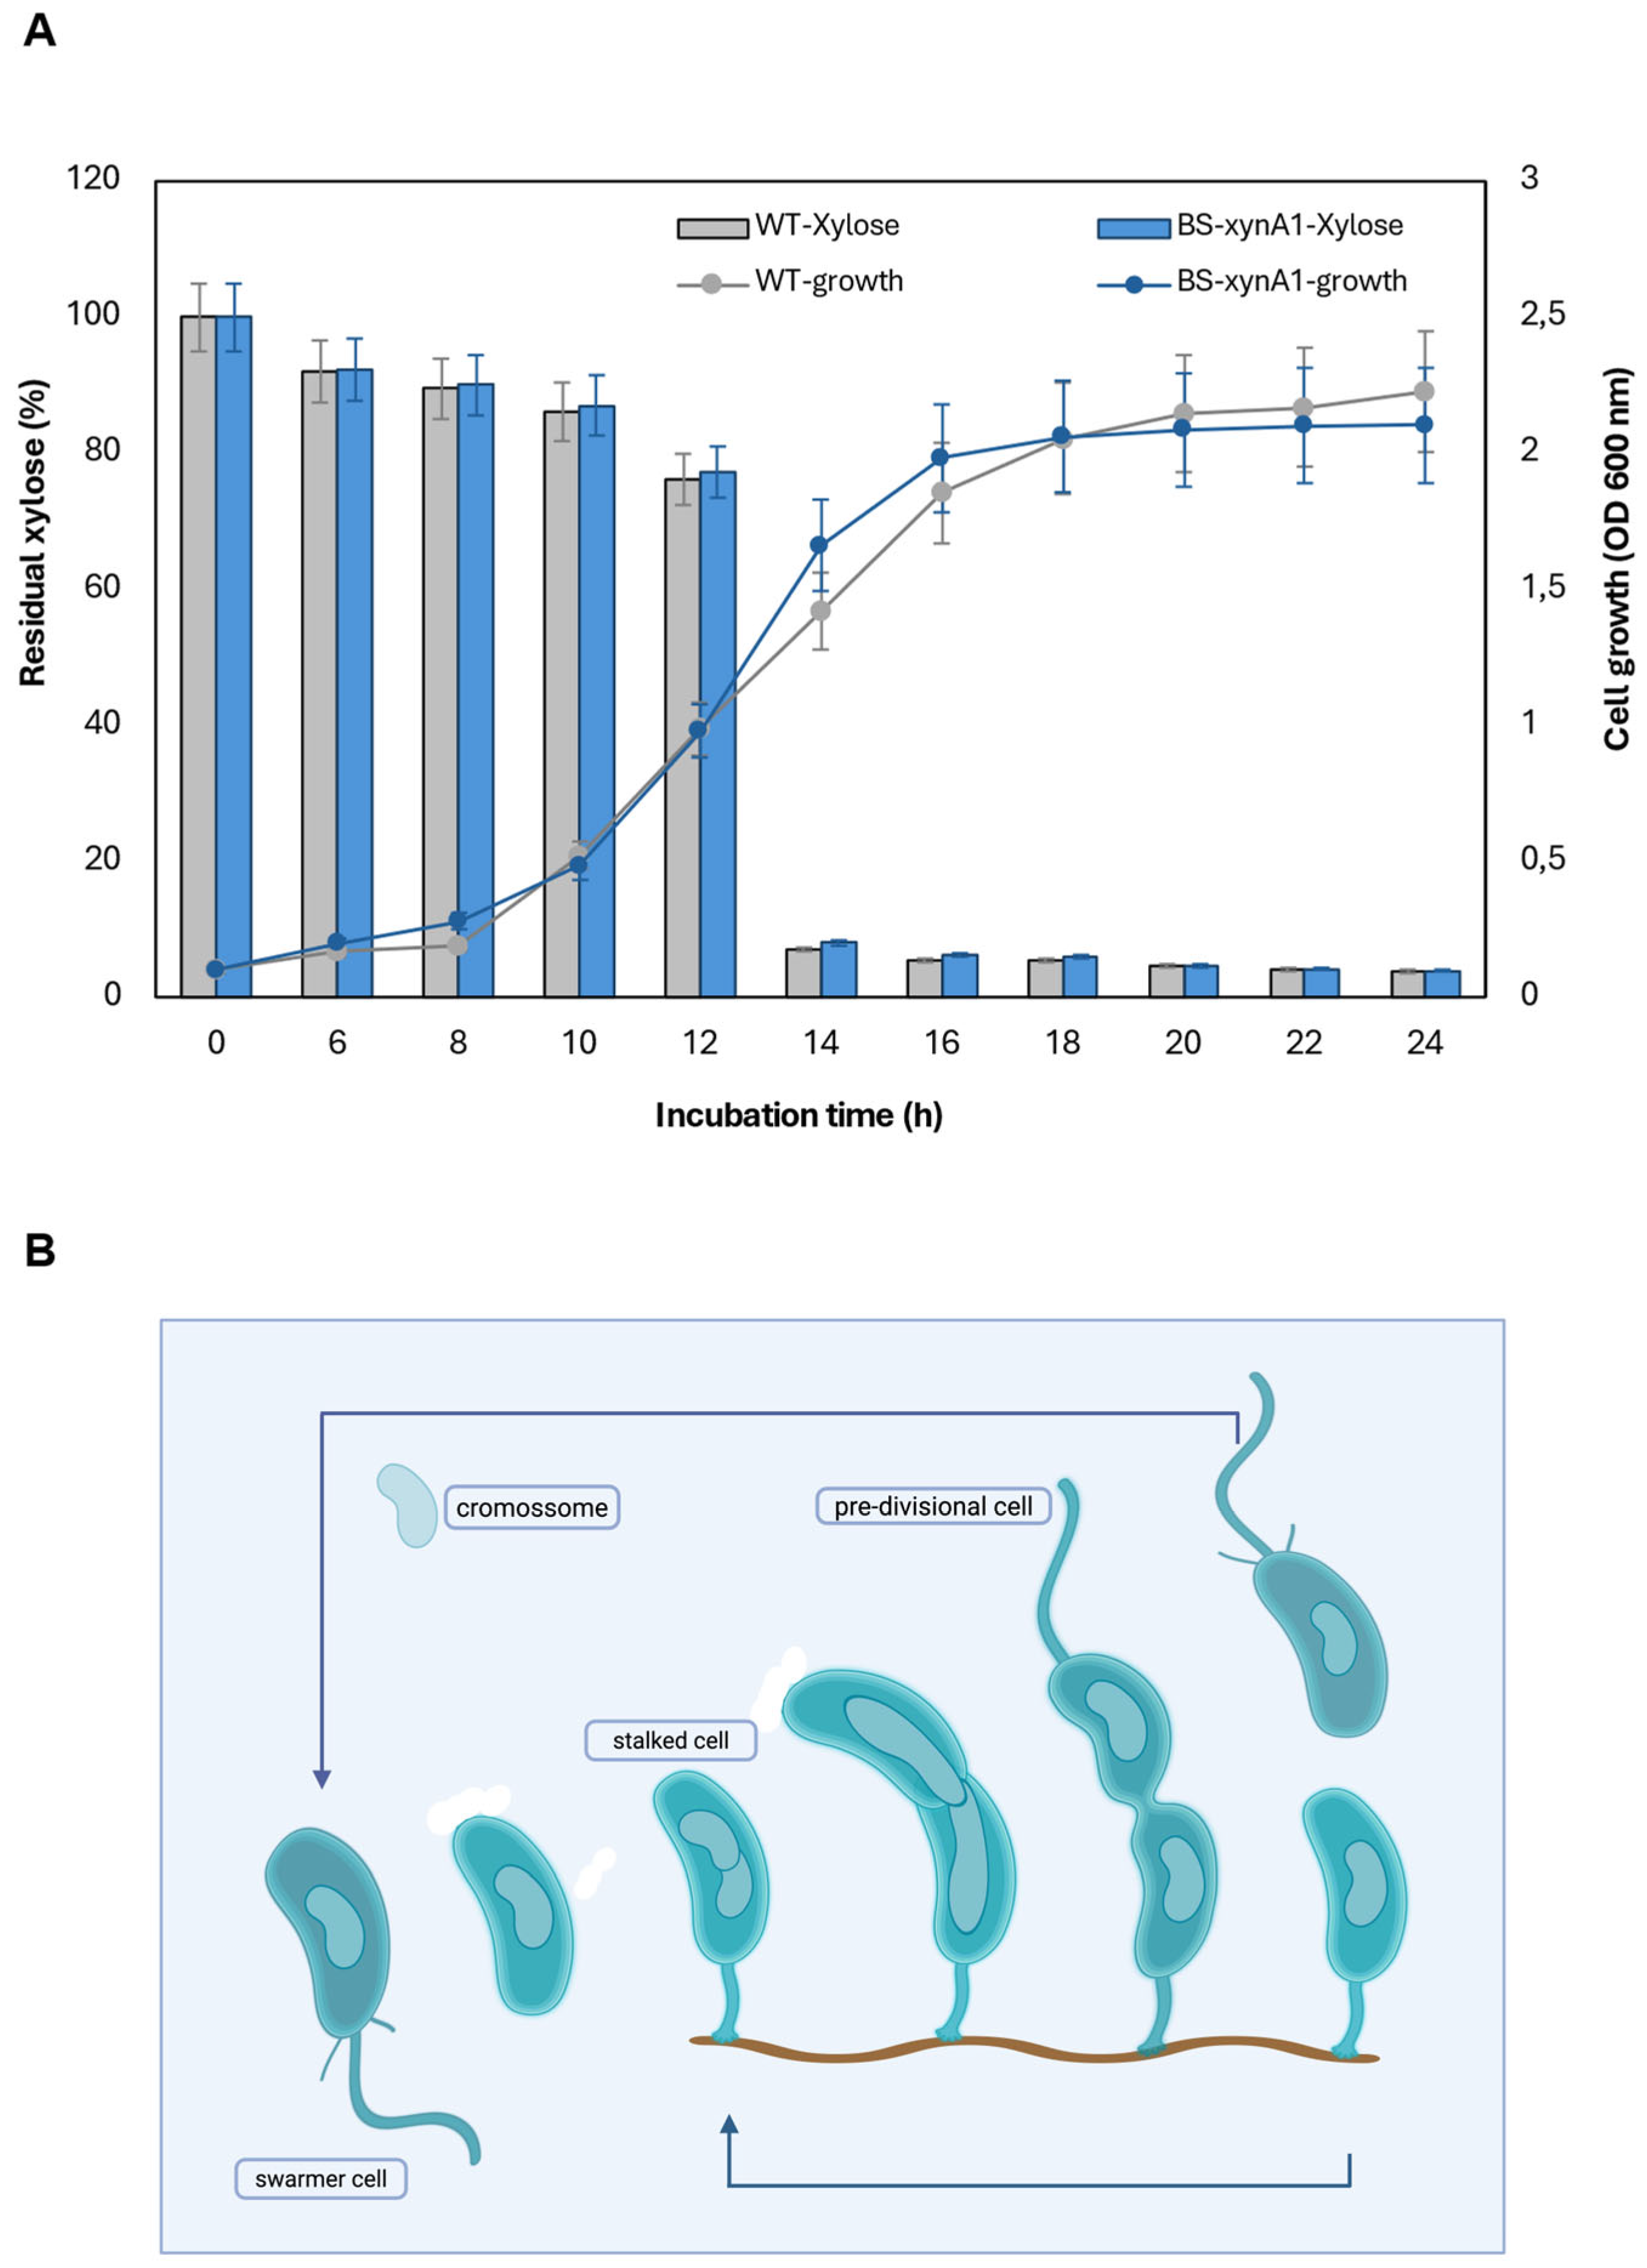
Figure 3.
Intracellular xylanase activity of the wild type of strain (gray continuous line) and BS-xynA1 (blue continuous line). Bacterial cells were grown in M2 media at 30 °C and 120 rpm. Extracellular xylanase activity of the WT (gray bars) and BS-xynA1 (blue bars) strains of C. vibrioides. Bacterial cells were grown in M2 media supplemented with 0.2% (w/v) glucose (WT) and 0.3% (w/v) xylose (BS-xynA1) at 30 °C and 120 rpm for 24 hours. Aliquots of the culture were removed, and xylanolytic activities were measured.
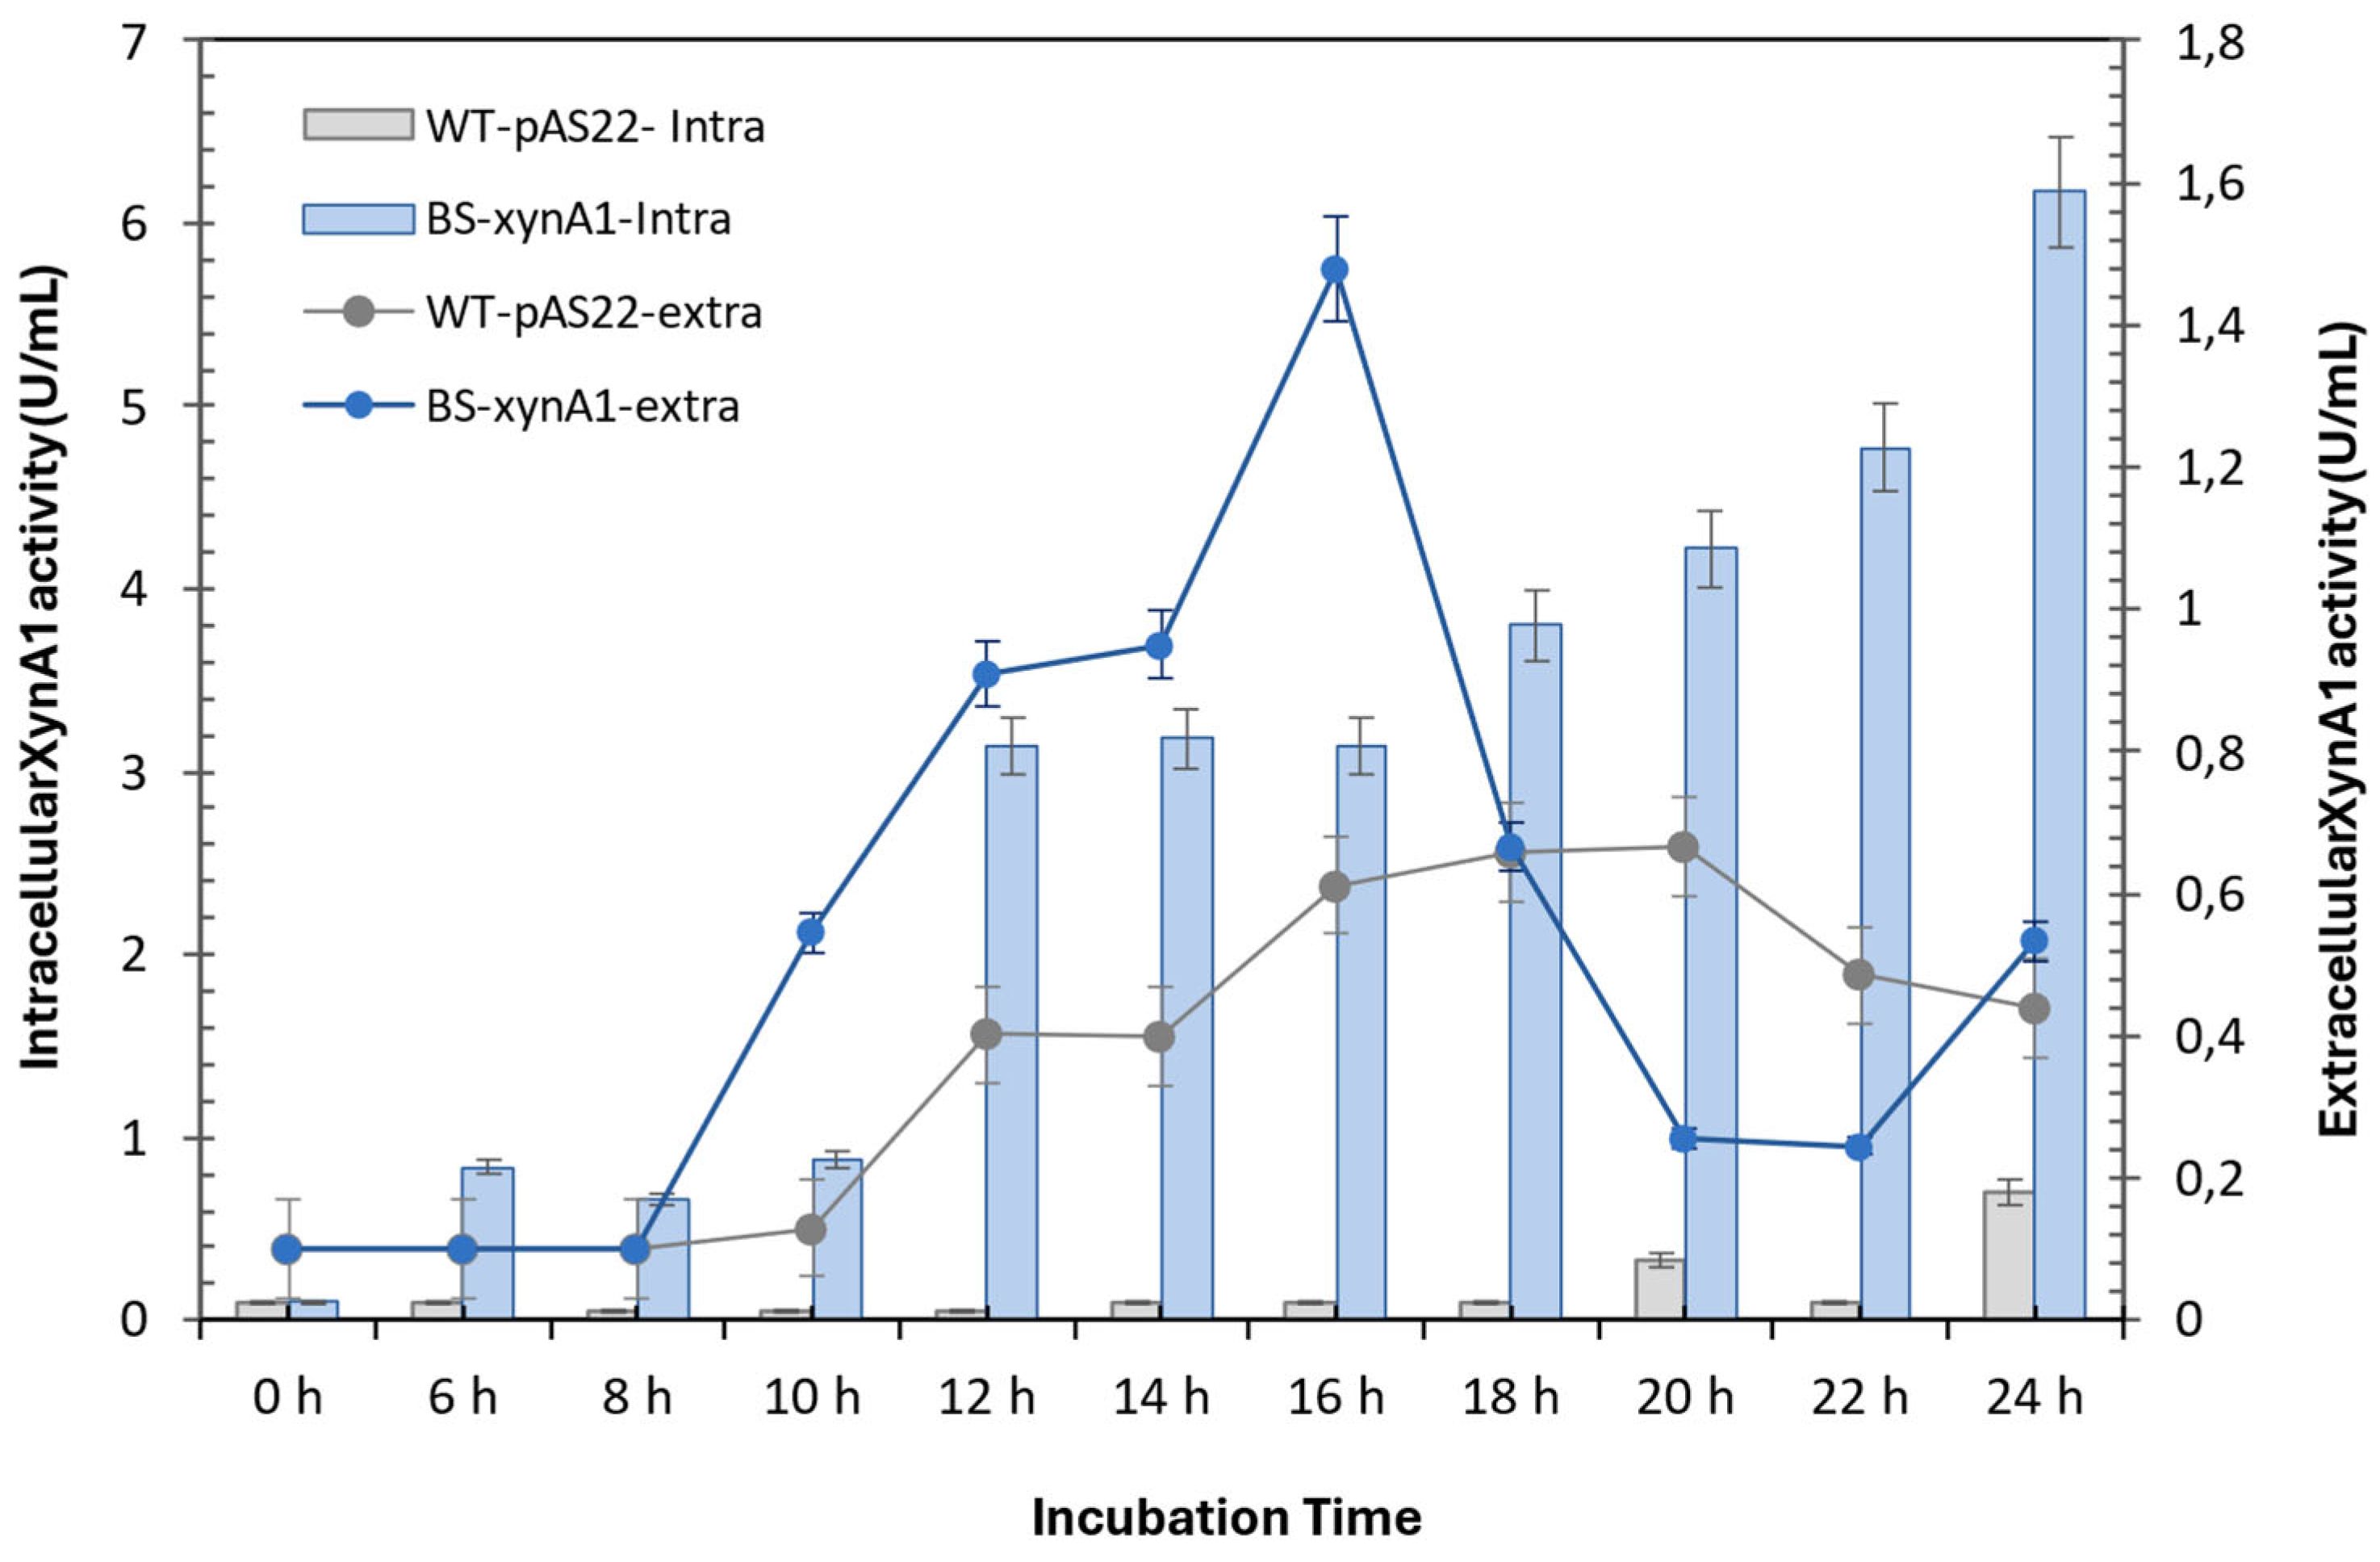
Figure 4.
Enzyme activities produced by different C. vibrioides strains (WT-pAS22 and BS-xynA1) after growth in M2 medium supplemented with 0.3% (v/v) xylose and 0.2% (w/v) corn straw at 30 °C and 120 rpm for 18 hours. [Anova: Degree of freedom: 40; F calculated: 11.70; F critical: 3.12; P value: 5.45 x10⁻⁸ (P=0.01)].
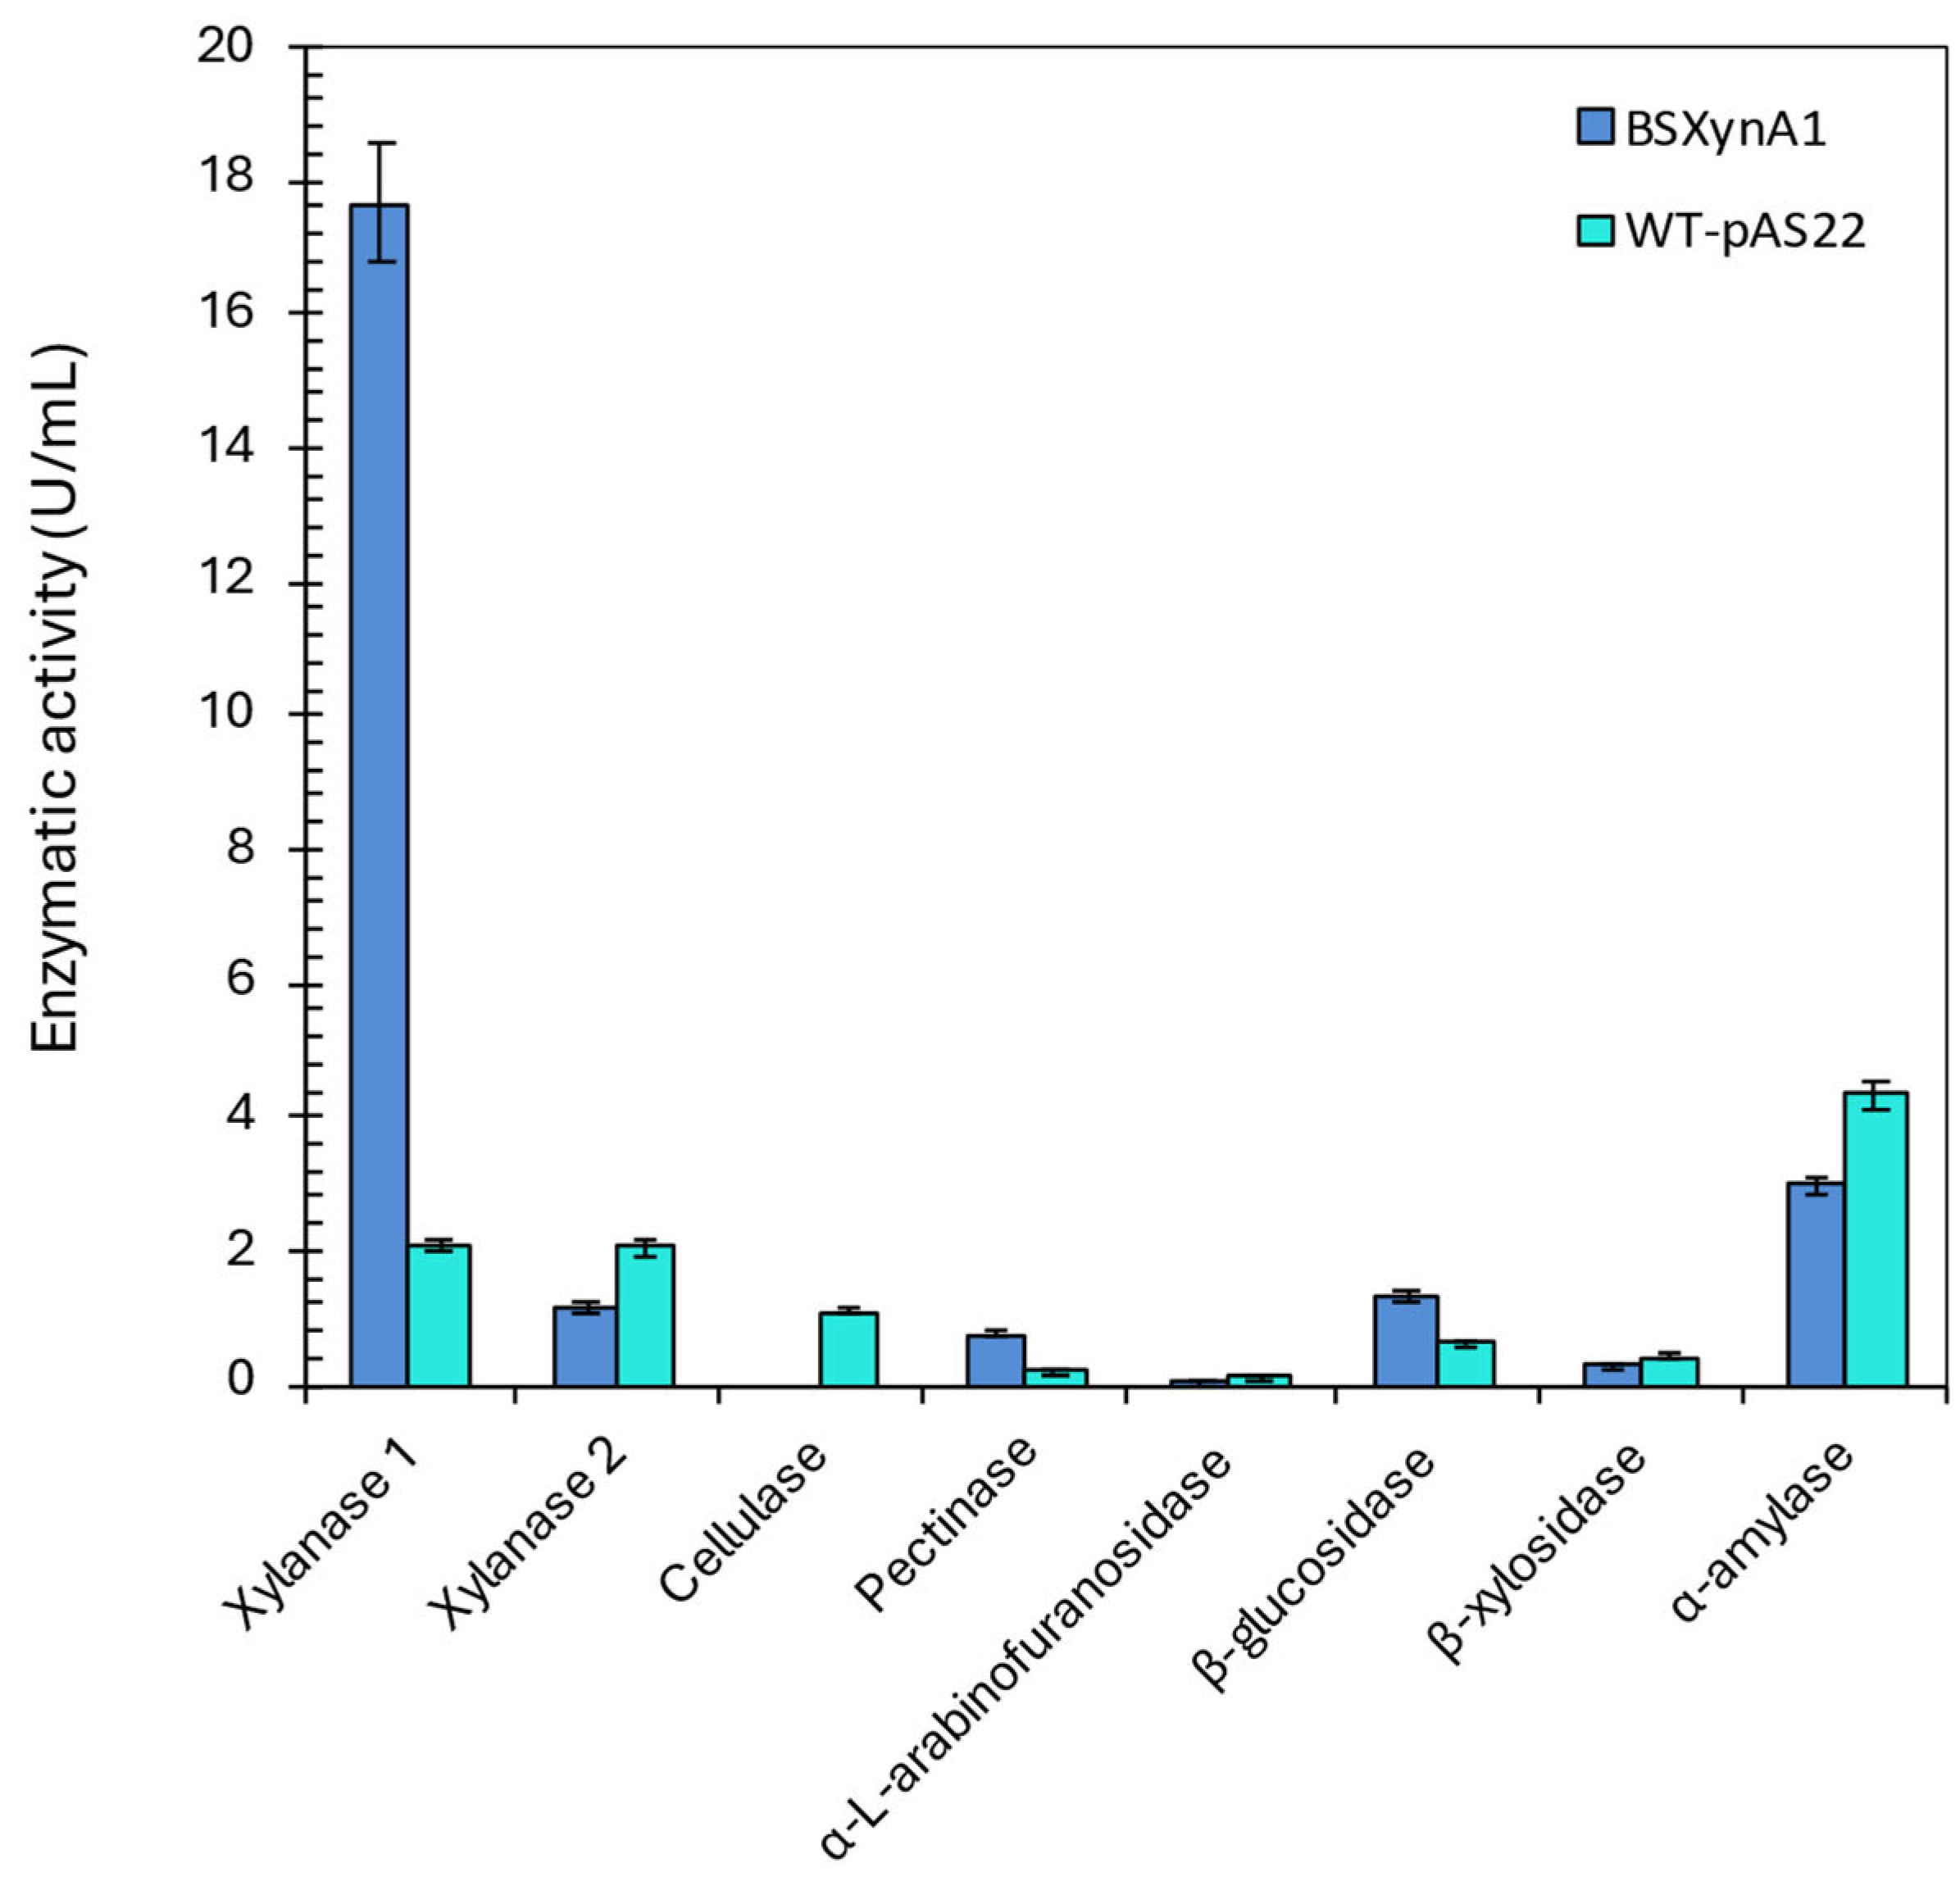
Figure 5.
Relative gene expression of xynA1and xynA2 genes in the C. vibrioides BS-xynA1 strain determined by quantitative real-time PCR (RT‒qPCR). The x-axis shows data on a semi-log scale.This study aimed to understand how nutrient availability and growth conditions affect the expression of the xynA1 and xynA2 genes in C. vibrioides strains. RNA extraction and RT-qPCR protocols followed established procedures. Data normalization was performed using the 16S rRNA gene as an endogenous control, ensuring accuracy and reliability across treatments. Two independent biological experiments with two replicates each were conducted to ensure robustness and consistency. Relative gene expression levels were calculated for treatments under different media conditions. M2 minimum media containing glucose 0.2% (v/v), M2 minimum media containing xylose 0.3% (v/v); M2 minimum media containing xylose 0.3% (v/v) + corn cob (CC) (0.2% w/v); M2 minimum media containing xylose 0.3% (v/v) + corn straw (CS) 0.2% (w/v). [Anova data obtained including xynA1 gene expression profile: degree of freedom: 30; F calculated=11458.62; F critical=3.70 Pvalue 2.98X10-48 (P<0.01)].
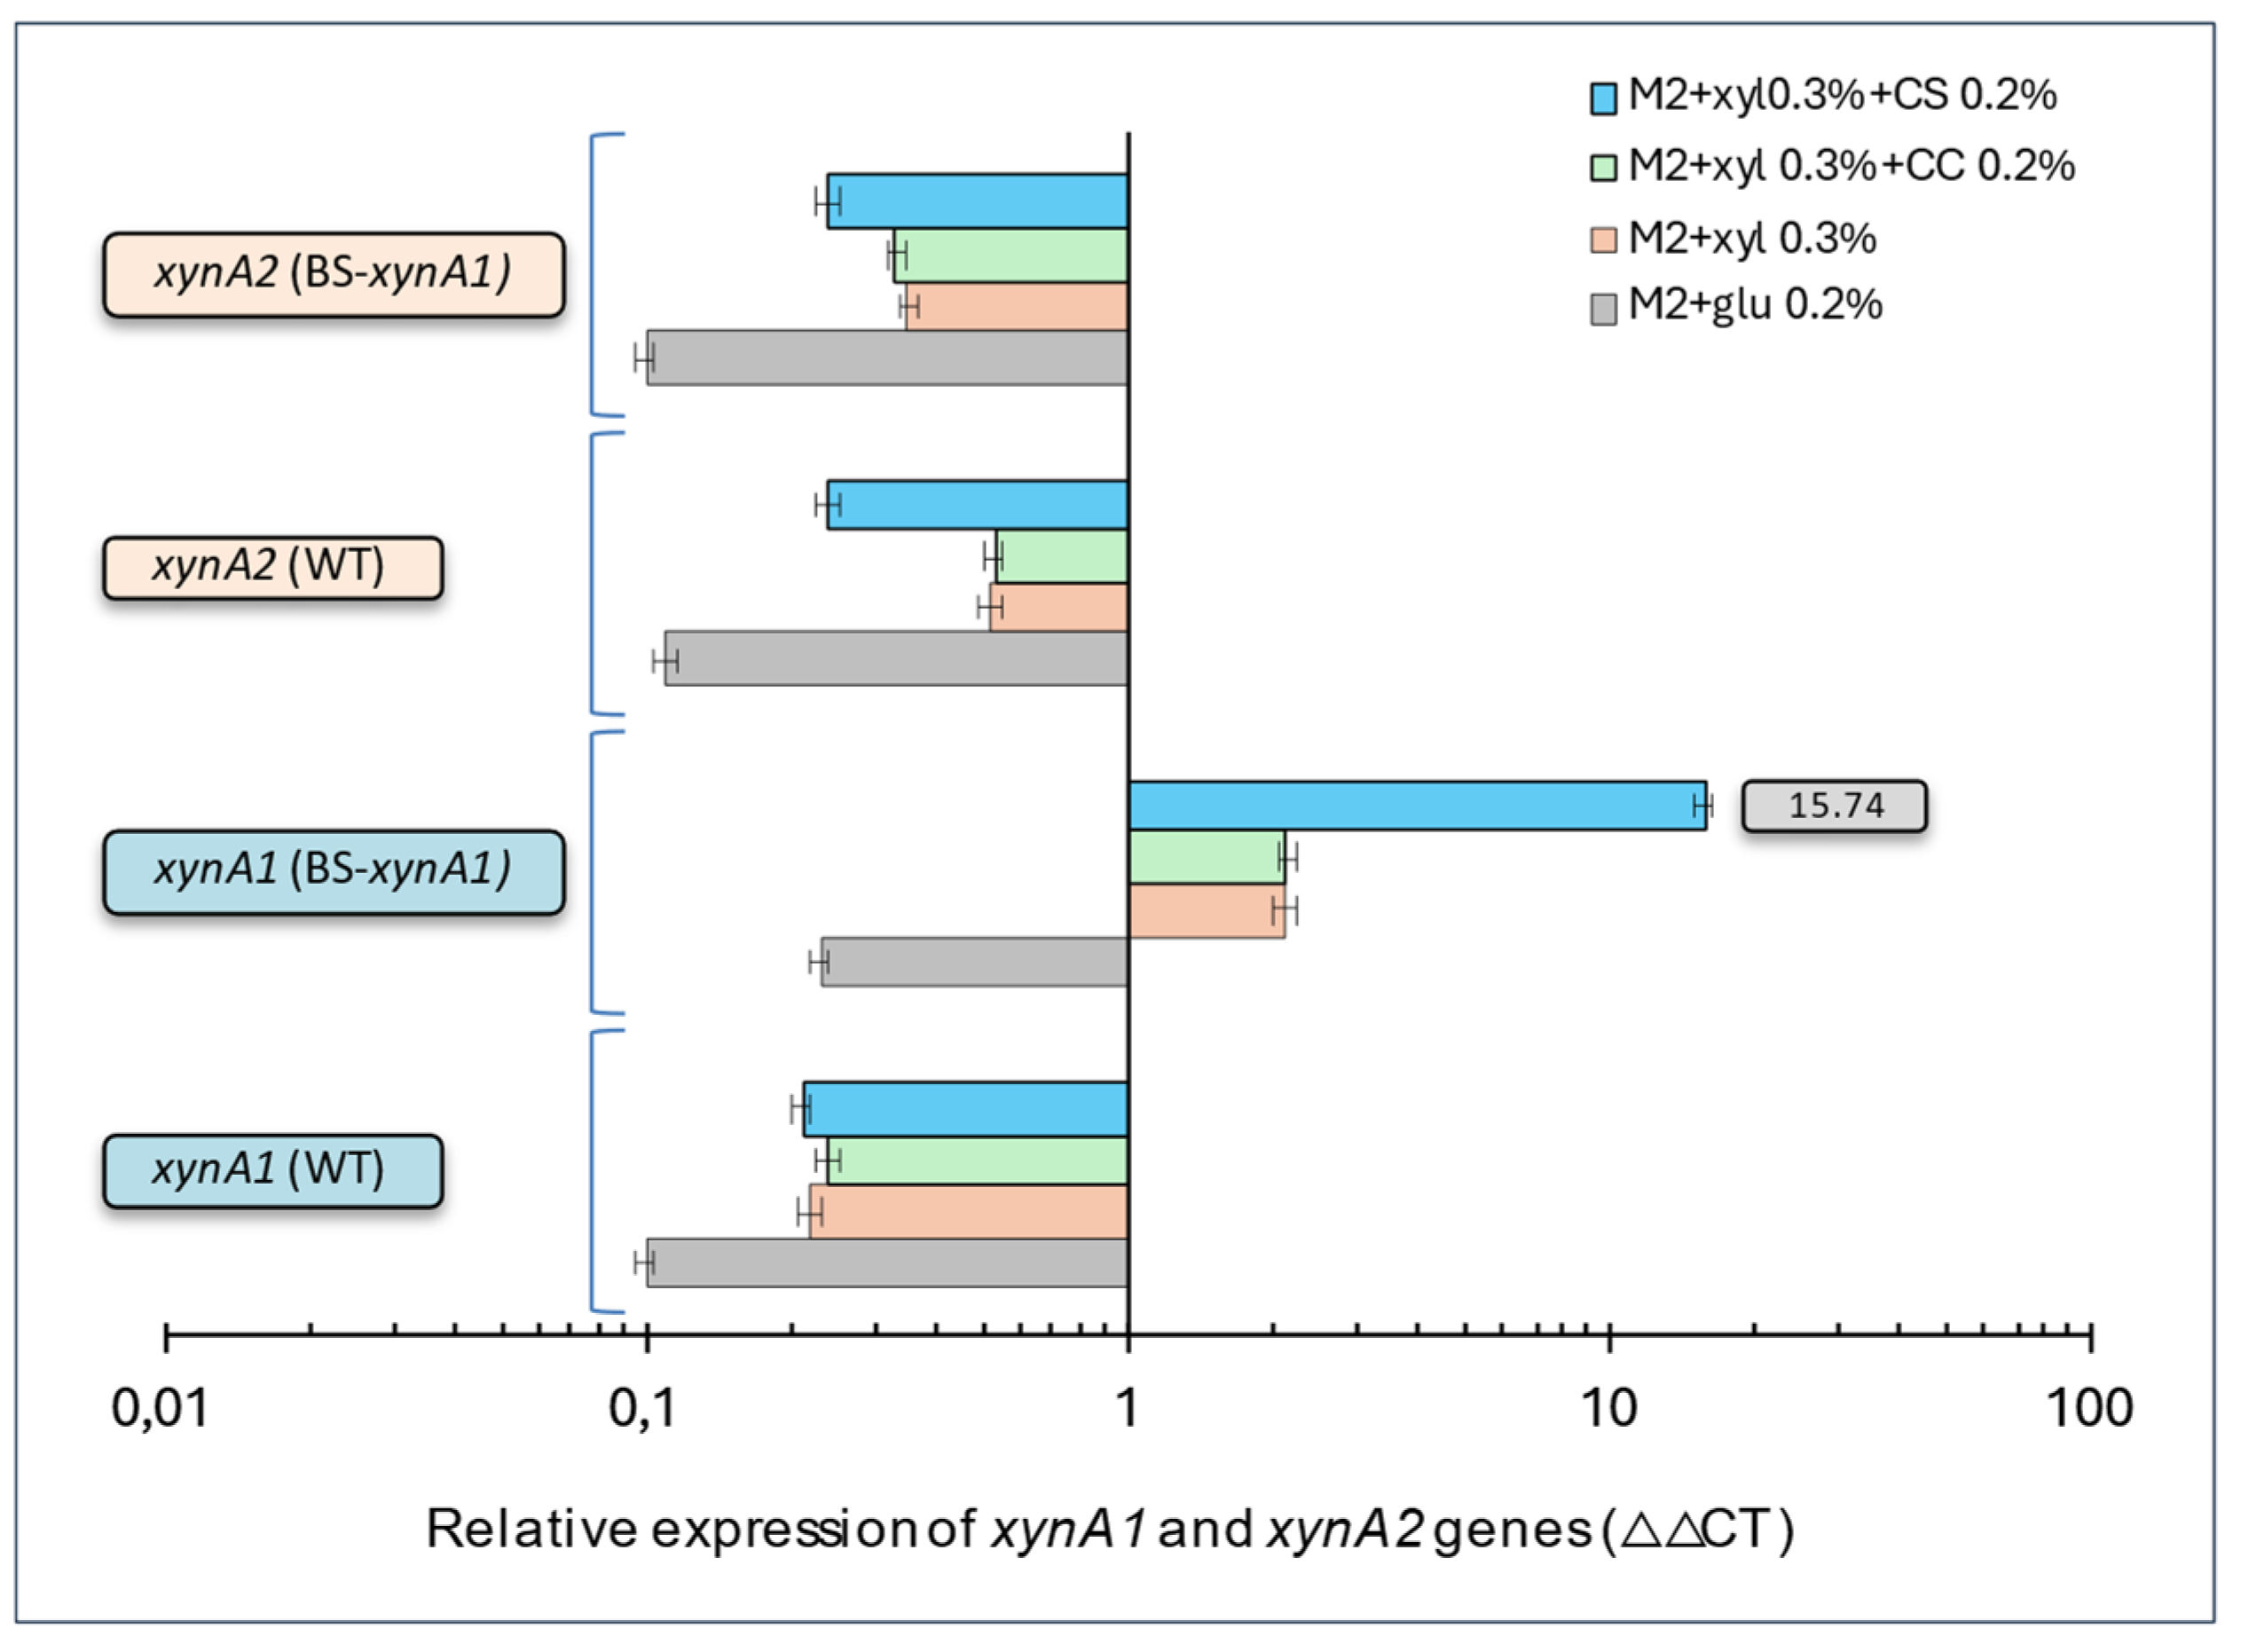
Figure 6.
XynA1production in the presence of different agroindustrial residues. C. vibrioides BS-xynA1 strain cells were grown in minimal M2 medium supplemented with 0.3% (v/v) xylose and supplemented with 0.2% (w/v) agroindustrial residues: corn straw; corn cob; hemicellulose from corn straw; wheat straw; polisher residue, vacuum cleaner residue from industry, rice flour, sugarcane bagasse, rice straw and soybean residue. The inoculum was generated by diluting the cells at the stationary phase to an O.D.λ of 0.1 at 600 nm in the same culture medium containing different carbon sources. Bacterial growth occurred at 30 °C for 18 h with agitation at 120 rpm. [Anova data obtained: degree of freedom=20; F calculated=941.43; F critical =3.36; P value= 2.85 x 10⁻²⁴ (p<0.01)].
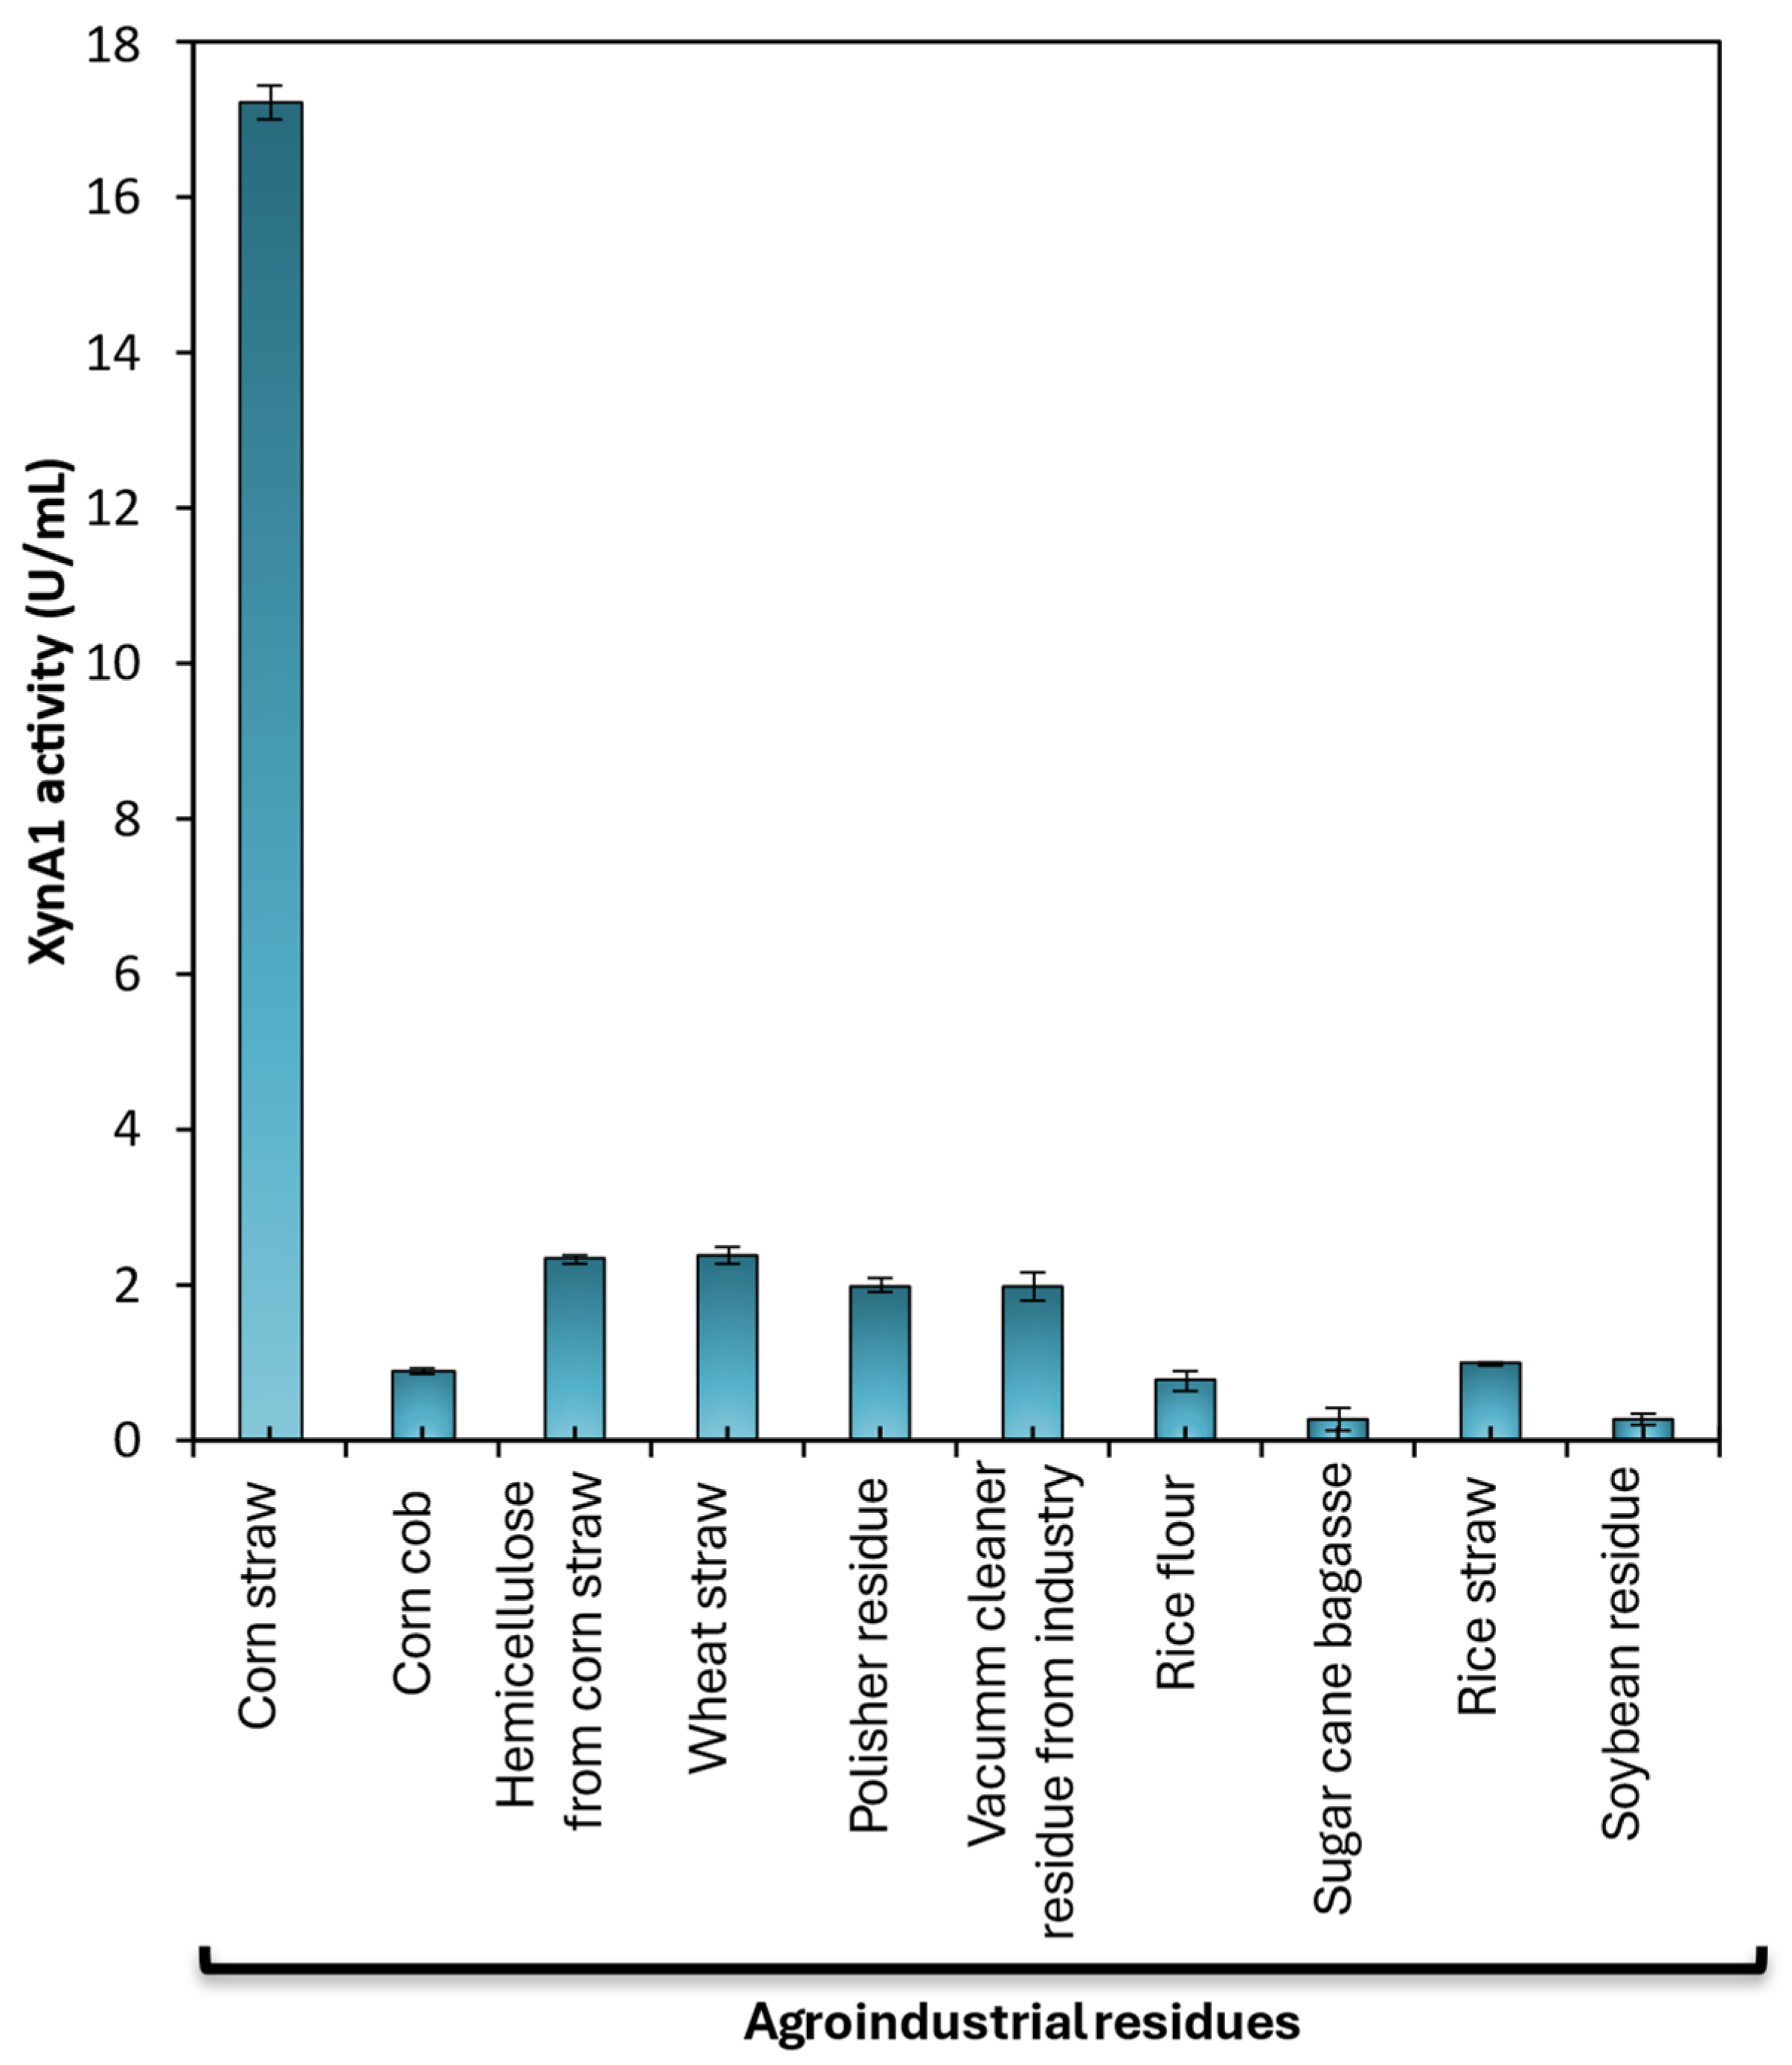
Figure 7.
Comparison between the specific activity (U/mg) of different commercial xylanase, spring CA400 (yellow bars), Xylamax 292 (green bars), Mega Cell 899 (rose bars) and cell-free XynA1 from BS-xynA1 strain (blue bars). [Anova data obtained: degree of freedom: 184; F calculated=14.35; F critical= 2.74; Pvalue=7.88 x10⁻¹⁵ (P<0.01)].
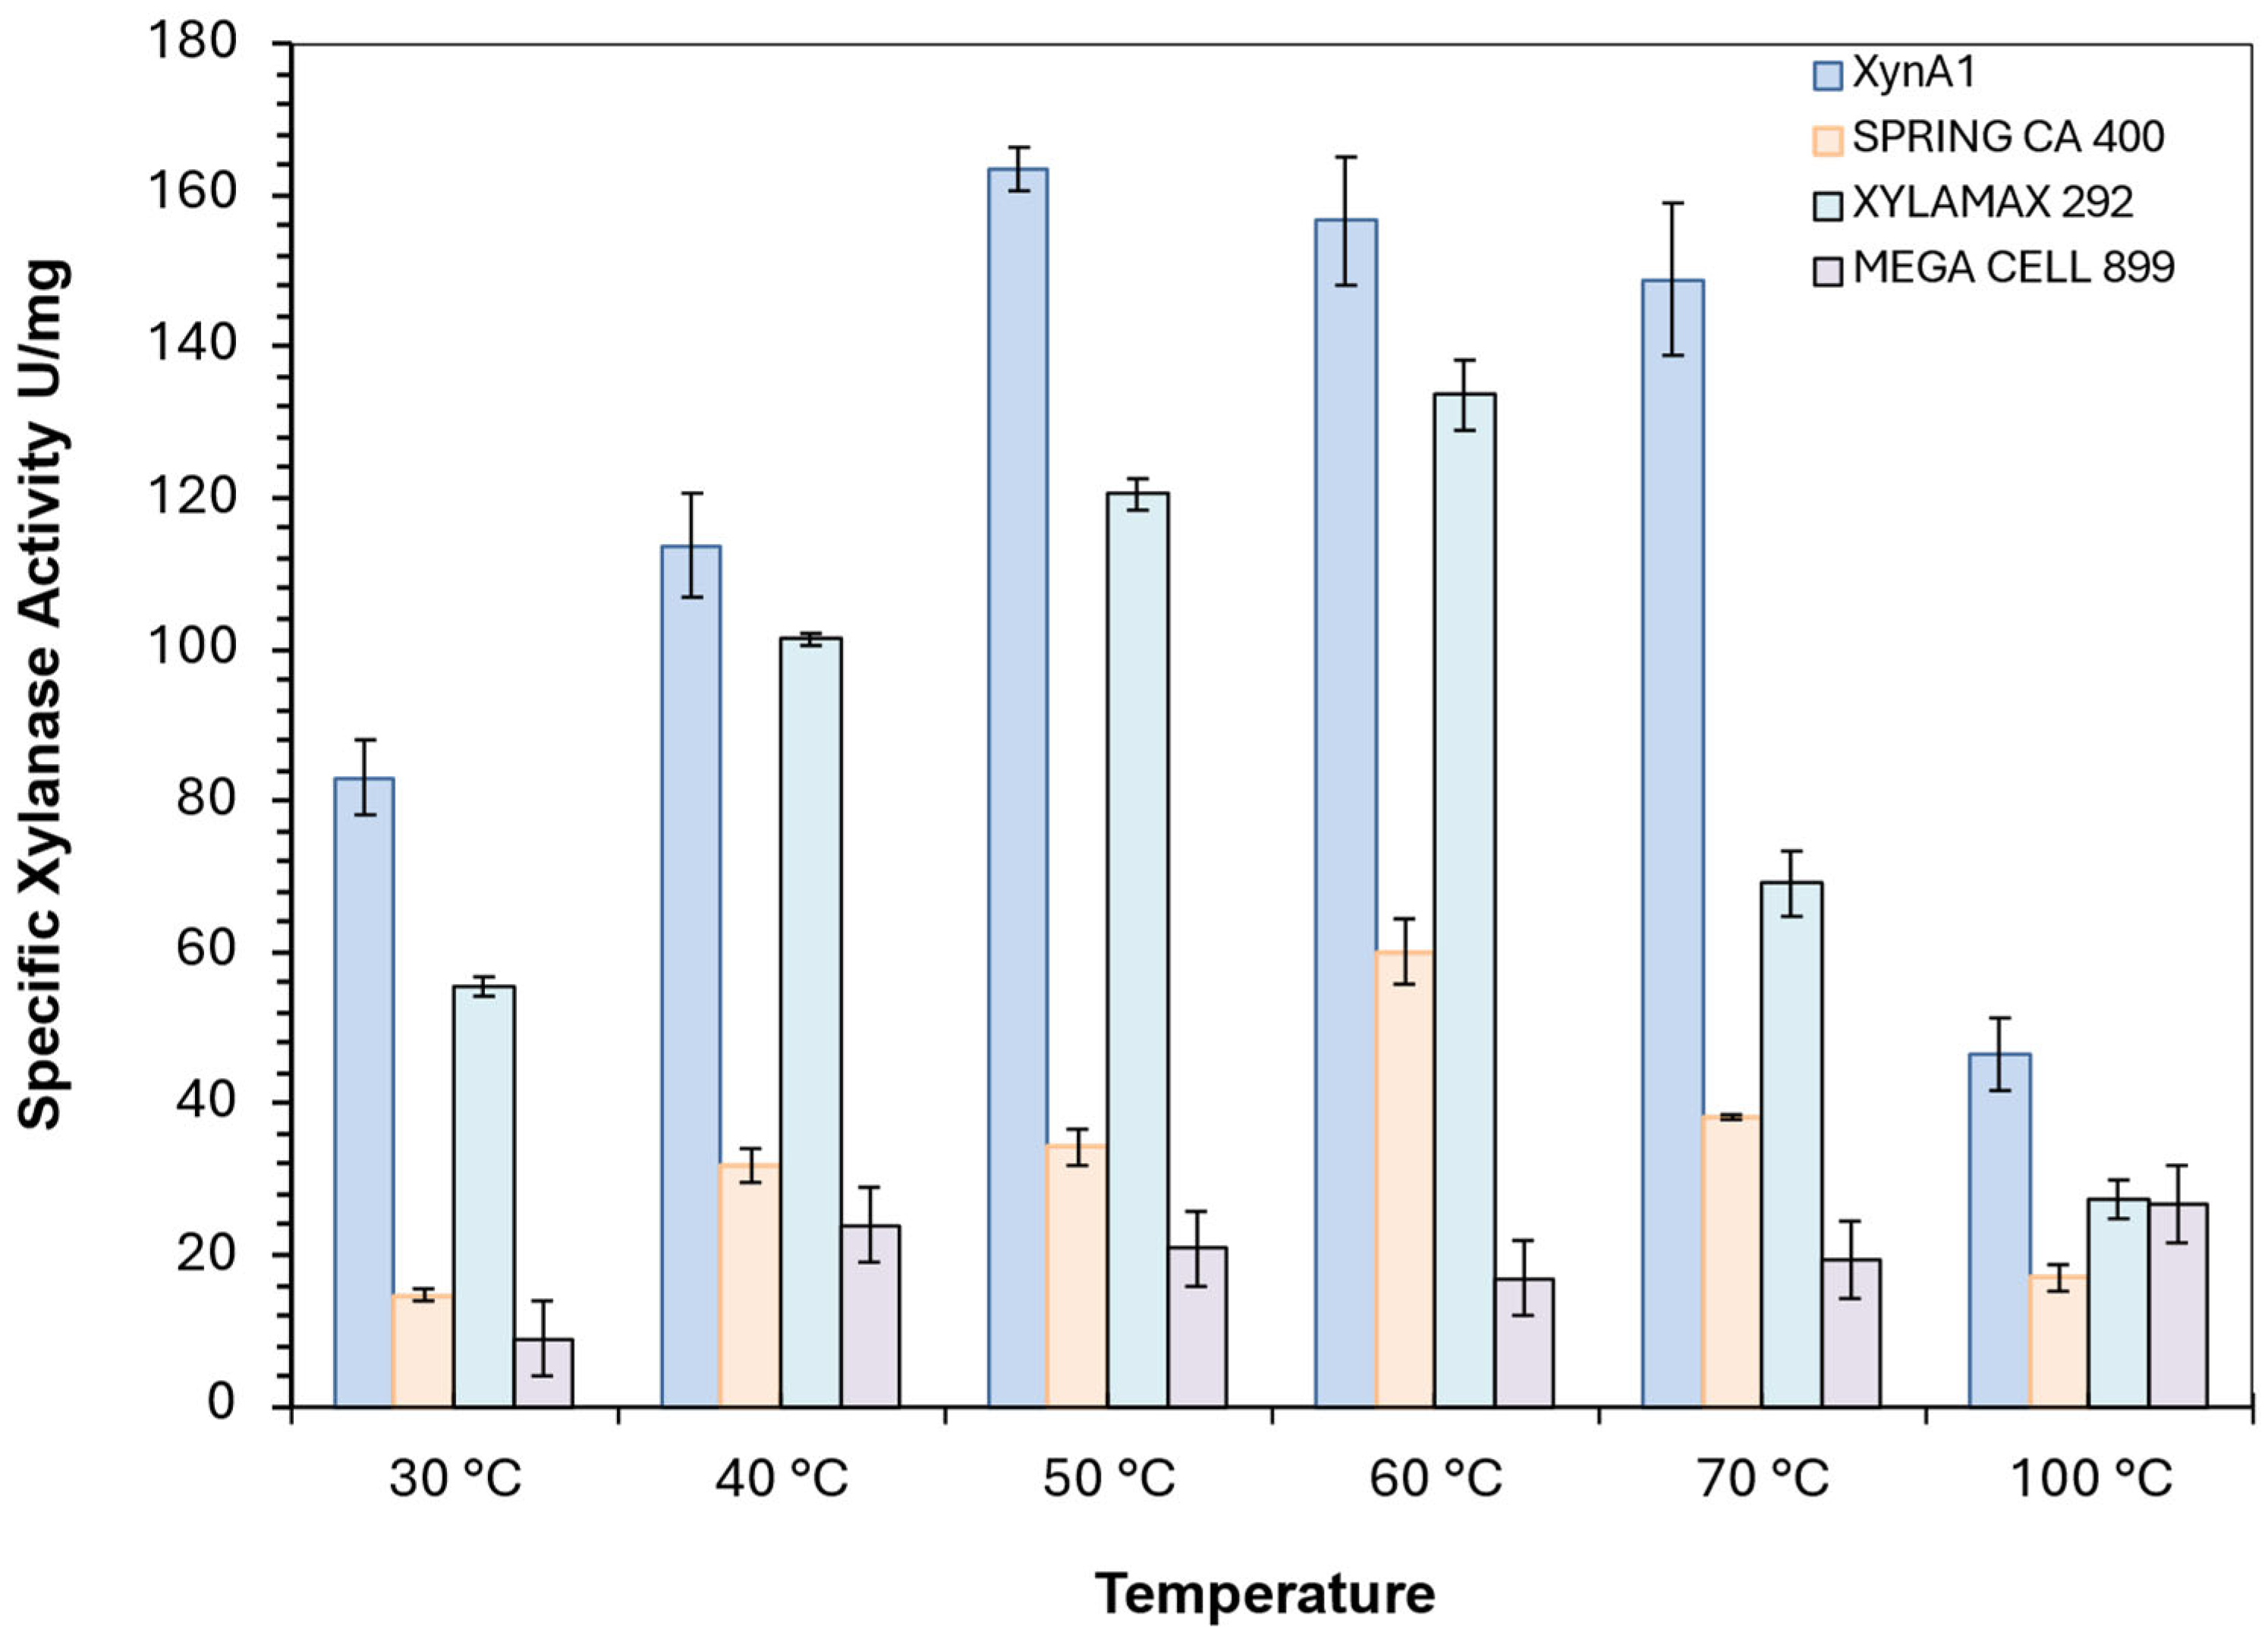
Figure 8.
- Average alveographs provided by the apparatus (alveograph). (A) Control assay. (B) Alveographs obtained after treatment with cell-free XynA1 (30 mL of cell-free XynA1 extract in 250 g of flour). The axis of the abscissa shows the values of elasticity (L) expressed in millimeters (mm). The ordinate axis expresses the toughness (P) values expressed in millimeters of water (mmH2O). The data represent the arithmetic mean of five independent repetitions. The graph is automatically generated by the AlveoPC / Alveograph software/ Chopin Pack.
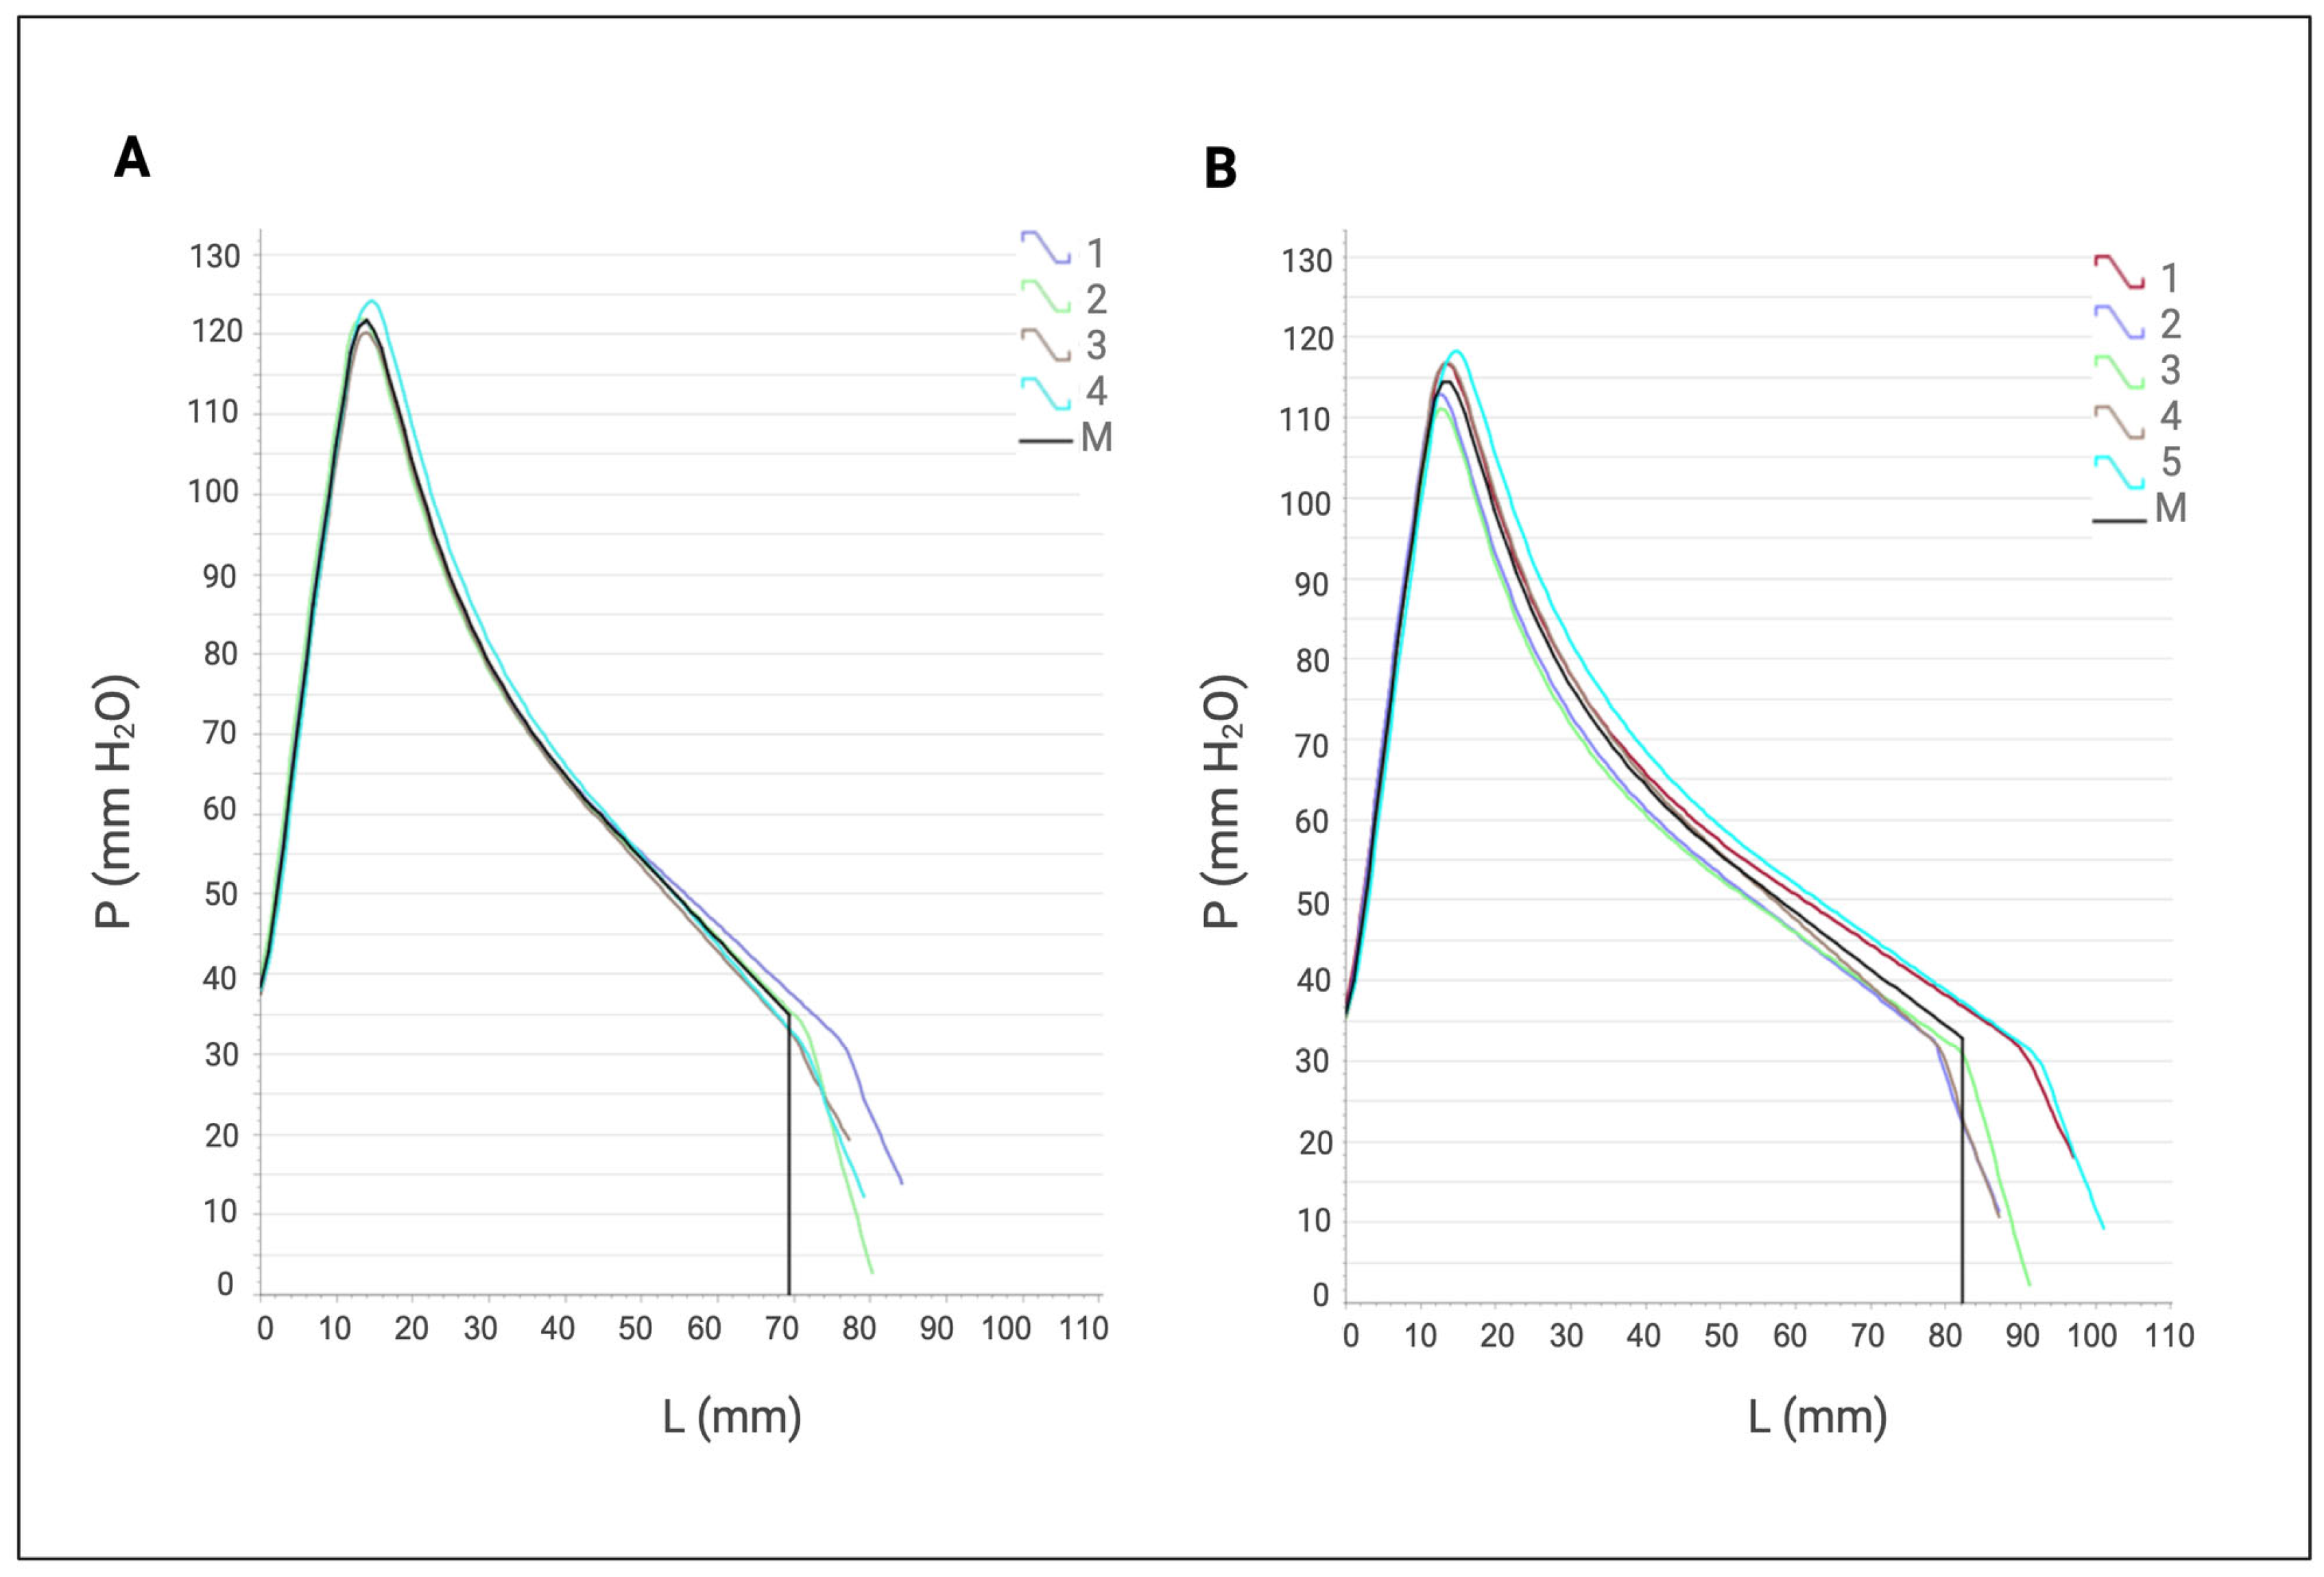
Figure 9.
(A) Representative images of breads after fermentation. (B, C) Images of breads after baking. (B) Whole breads; (C) Breads cut exactly in half. (T1) Control without the addition of the enzyme extract. (T2) Addition of 60 mL of enzyme extract to 1 kg of flour. (T3) A total of 120 mL of enzymatic extract containing cell-free XynA1 (specific activity = 278.64 U/mg) was added to 1 kg of flour.
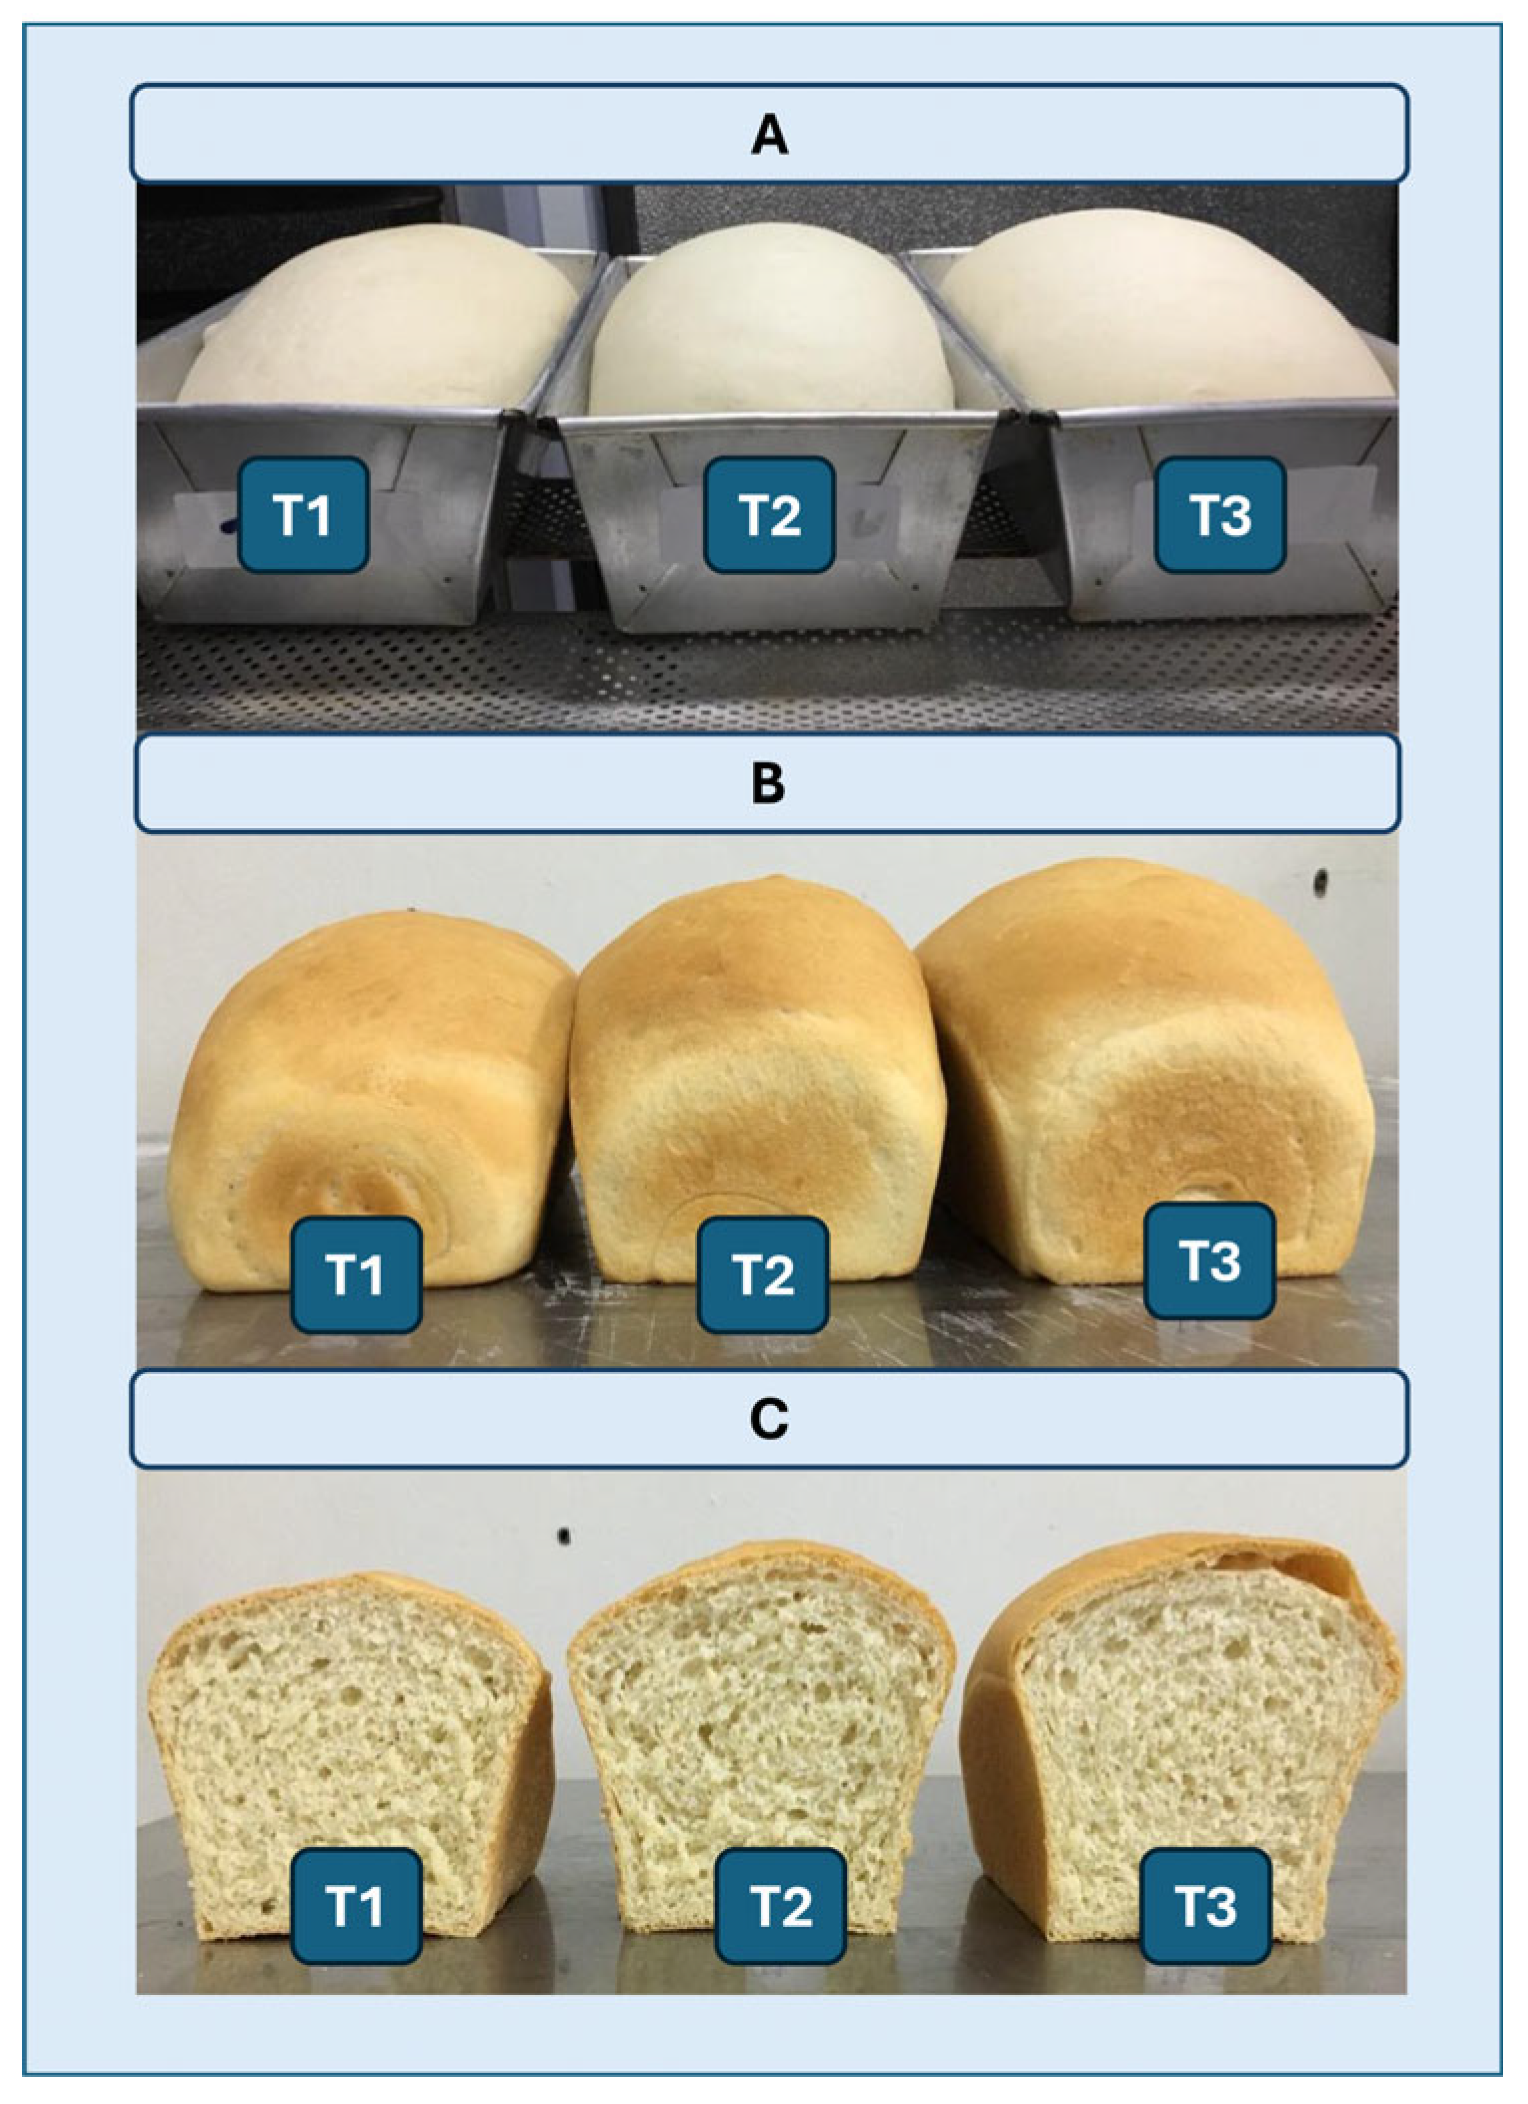

Table 1.
Strains and plasmids used in the present report.
| Strains/Plasmids | Genotype/Description | Source/Reference |
| E. coli | ||
| DH5α |
Δ(lacZYA-argF) U169 deoR recA1 endA1 hsdR17 phoA sup144 thi-1 gyrA96 relA1 (ɸ80 lacZDM15). |
Invitrogen®. |
| S17 | M294::RP4-2 (Tc::Mu) (Km::Tn7) |
[26] |
| DH5α-pAS22-xynA1 | E. coli DH5α carrying pAS22-xynA1. | This study |
| S17-pAS22-xynA1 | E. coli S17 carrying pAS22-xynA1 | This study |
| DH5α-pAS22 | E. coli DH5α carrying pAS22 | This study |
| S17-pAS22 | E. coli S17 carrying pAS22 | This study |
| C. vibrioides | ||
| NA1000 | Holdfast mutant derivative of wild-type strain CB15 |
[28] |
| BS-xynA1 | NA1000 carrying pAS22-xynA1 | This study |
| WT-pAS22 | NA1000 carrying pAS22 | This study |
| Plasmid | ||
| pAS22 | Vector for expression of genes in Caulobacter from the PxylX promoter, ori T, CmR | [29] |
| pAS22-xynA1 | pAS22 containing the xynA1 gene under the control of PxylX promoter | This study |
Table 2.
Test formulations used in the application of xylanase in bread dough preparation.
| Components | T1 | T2 | T3 |
| Flour | 1000 g | 1000 g | 1000 g |
| Salt | 20 g | 20 g | 20 g |
| Sugar | 60 g | 60 g | 60 g |
| Vegetable fat | 40 g | 40 g | 40 g |
| Yeast | 20 g | 20 g | 20 g |
| Water | 500 mL | 440 mL | 380 mL |
| Cell-free XynA1 * | - | 60 mL | 120mL |
*Cell-free XynA1 activity 10 U/mL, specific activity 278.64 U/mg.
Table 3.
Components used in the preparation of bread dough that was subjected to tests using alveograph.
Table 3.
Components used in the preparation of bread dough that was subjected to tests using alveograph.
| Components | XynA1− | XynA1+* |
| Flour | 250 g | 250 g |
| Water | 127.7 mL | 97.7 mL |
| Sodium Chloride | 3,192.5 g | 3,192.5 g |
| Cell-free XynA1* | no addition | 30 mL |
*Cell-free XynA1 activity 10 U/mL; Specific activity of XynA1 (278.64 U/mg).
Table 4.
Parameters checked on breads and statistical analysis of data obtained in the absence and presence of cell-free XynA1 (ANOVA followed by Tukey’s test).
Table 4.
Parameters checked on breads and statistical analysis of data obtained in the absence and presence of cell-free XynA1 (ANOVA followed by Tukey’s test).
| Parameters | XynA1- (T1) |
XynA1+ (T2) |
XynA1++ (T3) |
||
| Kneading time to get the veil point (min) | 11 | 10 | 10 | ||
| Height of bread after fermentation (cm) | 7.9 ± 0.05 | 8.6 ± 0.04 | 9.3 ± 0.05 | ||
| Height of bread after baking (cm) | 8.8 ± 0.07 | 9.8 ± 0.08 | 10.4 ± 0.07 | ||
| Anova | Source of Variation | dF | F | P-value* | Fc |
| Between group | 1 | 980.14 | 2.05 x 10⁻³⁵ |
7.15 | |
| Inside group | 52 | ||||
| Tukey Test |
Between groups |
Ma XynA1- (T1) |
Ma XynA1+ (T2) |
Ma XynA1++ (T3) |
LSD |
| Kneading /Fermentation | 3.1 | 1.4 | 0.7 | 1.007995 | |
| Fermentation/baking | 0.9 | 1.2 | 1.1 | 1.007995 | |
| Kneading /baking | 2.2 | 0.2 | 0.4 | 1.007995 |
*:(P<0.01); dF: degree of Freedom; F: calculated F; Fc: critical F; Ma: Modular averages in different groups at different treatment; LSD: least significant difference.
Table 5.
– Results obtained with alveograph before and after treatment with cell-free-XynA1. The mean data are automatically provided by the alveograph platform and are shown in columns 2 and 3. Anova was performed using data obtained from alveograph and post hoc Tukey test was carried out for compare changes between groups.
| Parameters | Anova | F |
P value* |
Fc | Tukey | LSD | ||||
| XynA1 | - | + | dF=117 | 269,38 |
3,6784x10-79 |
2,34 |
Ma | |||
| P (mm H2O) | 134 | 126 | 8 |
6,56447705 |
||||||
| L (mm) | 69 | 82 | 13 |
6,56447705 |
||||||
| W (J) | 326 x 10-4 | 353 x 10-4 | 27 |
6,56447705 |
||||||
| P/L | 1.94 | 1.54 | ||||||||
| eI | 53.6 % | 56.4 % | ||||||||
(-) absence; (+) presence; *P<0.01; dF: degree of Fredom; Ma: difference in the modular means of the tests without and with enzyme (columns 2 and 3); LSD: minimum significant differences defined in Tukey’s test; F: calculated F; Fc: critical F; P: tenacity; L: extensibility; W: mass deformation; P/L: tenacity/extensibility; eI (elasticity index).
Disclaimer/Publisher’s Note: The statements, opinions and data contained in all publications are solely those of the individual author(s) and contributor(s) and not of MDPI and/or the editor(s). MDPI and/or the editor(s) disclaim responsibility for any injury to people or property resulting from any ideas, methods, instructions or products referred to in the content. |
© 2025 by the authors. Licensee MDPI, Basel, Switzerland. This article is an open access article distributed under the terms and conditions of the Creative Commons Attribution (CC BY) license (http://creativecommons.org/licenses/by/4.0/).
Copyright: This open access article is published under a Creative Commons CC BY 4.0 license, which permit the free download, distribution, and reuse, provided that the author and preprint are cited in any reuse.


