
Submitted:
16 September 2025
Posted:
17 September 2025
You are already at the latest version
Abstract
Background: MicroRNA-133 (miR-133) has been implicated in diverse cancers as a tumor suppressor, yet the isoform-specific contributions of miR-133A1, miR-133A2, and miR-133B in colorectal cancer (CRC) remain unclear. Methods: We established stable colorectal cancer cell lines expressing each miR-133 isoform and performed iso-form-level transcriptomic profiling. Differentially expressed genes (DEGs) were iden-tified relative to parental cells and subjected to gene ontology (GO) and KEGG en-richment analyses. Comparative analyses highlighted both shared and distinct bio-logical pathways regulated by each isoform. Results: Venn diagram and clustering analyses revealed that all three isoforms shared a core regulatory program, with 34 genes consistently upregulated and 195 genes downregulated across all isoforms, while also displaying isoform-specific DEGs. miR-133A1 and miR-133A2 showed strong transcriptional similarity, predominantly modulating extracellular matrix or-ganization, cell migration, and apoptotic pathways. In contrast, miR-133B exhibited a distinct expression profile, preferentially influencing RNA processing, immune sup-pression, and oncogenic signaling pathways including PI3K-Akt, Hippo, and p53 sig-naling. Heatmap analysis of representative genes confirmed both overlapping and isoform-specific expression changes, with survival- and proliferation-associated genes more strongly upregulated in miR-133A2 and miR-133B. Conclusion: These findings suggest that miR-133 isoforms exert both shared and divergent regulatory functions in colorectal cancer, coordinating apoptosis, proliferation, migration, and signaling net-work modulation. Isoform-specific transcriptional regulation of miR-133 may contrib-ute to tumor progression and represents a potential biomarker and therapeutic target in CRC.
Keywords:
miR-133A1
; miR-133A2
; miR-133B
; colorectal cancer
; transcriptomic profiling
Introduction
Colorectal cancer (CRC) is among the most common malignancies worldwide and remains a leading cause of cancer-related mortality [1]. The disease arises through a multistep process involving genetic mutations and epigenetic dysregulation, with well-established hallmarks including activation of the WNT/β-catenin pathway, mutations in KRAS, loss of TP53, and aberrant regulation of apoptosis and proliferation [2,3]. Despite advances in targeted therapy and precision oncology, prognosis for advanced CRC remains poor, highlighting the need to identify novel molecular regulators and therapeutic strategies.
MicroRNAs (miRNAs) are small non-coding RNAs that regulate gene expression post-transcriptionally and play pivotal roles in cancer biology [4,5]. Among them, miR-133A is generally considered a tumor suppressor, with documented functions in regulating apoptosis, proliferation, and metastasis [6,7]. Dysregulation of miR-133A has been reported in several cancers, but most studies have examined it as a single entity, without distinguishing between its isoforms [8]. MIR133 is expressed as three isoforms—miR-133A1, miR-133A2, and miR-133B—each potentially exerting distinct regulatory effects [9,10].
Isoform switching in microRNAs is increasingly recognized as a critical regulatory mechanism in cancer biology [11]. In colorectal cancer, miRNA isoform variation has been implicated in regulating key oncogenic pathways such as KRAS and TP53, highlighting the potential role of isoform-specific expression patterns in tumor heterogeneity, progression, and therapy resistance [12,13]. Therefore, isoform-level characterization is essential to fully understand the biological functions of miRNAs in tumorigenesis. In CRC, the contribution of miR-133 isoforms has not been systematically explored.
The present study sought to characterize the isoform-specific transcriptomic effects of miR-133 in CRC. By integrating differential expression, functional enrichment, and comparative analyses across stable cell lines expressing each isoform, we aimed to uncover both shared and divergent regulatory programs of miR-133A1, miR-133A2, and miR-133B. Our results reveal isoform-specific modulation of key oncogenic pathways, providing novel insights into CRC pathogenesis and highlighting potential avenues for biomarker and therapeutic development.
Materials and Methods
Cell Culture and Establishment of Stable Cell Lines
Human colorectal cancer SW48 cells were obtained from the American Type Culture Collection (ATCC) and maintained in RPMI-1640 medium (Gibco) supplemented with 10% fetal bovine serum (FBS; HyClone), 100 U/mL penicillin, and 100 µg/mL streptomycin at 37 °C in a humidified atmosphere with 5% CO₂. Stable cell lines overexpressing miR-133A1 (SW48-KI133A1), miR-133A2 (SW48-KI133A2), and miR-133B (SW48-KI133B) were generated using lentiviral vectors carrying each isoform under the control of a CMV promoter. Transduced cells were selected in puromycin (2 µg/mL) for two weeks, and expression of each isoform was confirmed by qRT-PCR. Parental SW48 cells served as controls.
RNA Extraction and Quality Assessment
Total RNA was isolated from SW48 parental and stable isoform-expressing cells using TRIzol reagent (Invitrogen) according to the manufacturer’s instructions. RNA concentration and purity were determined by NanoDrop spectrophotometry (Thermo Scientific), and integrity was confirmed using the Agilent 2100 Bioanalyzer. Samples with RNA integrity number (RIN) > 8.0 were used for sequencing.
RNA Sequencing and Data Processing
High-throughput RNA sequencing (RNA-seq) was performed on the Illumina NovaSeq 6000 platform to generate 150 bp paired-end reads. Sequencing libraries were prepared using the NEBNext Ultra II RNA Library Prep Kit (NEB). Raw reads were quality-checked with FastQC, and adapter sequences and low-quality bases were trimmed using Trimmomatic. Clean reads were aligned to the human reference genome (GRCh38/hg38) with STAR aligner. Gene- and isoform-level transcript quantification was performed using Salmon and Kallisto, and count matrices were generated for downstream analyses.
Differential Expression Analysis
Differential expression analysis was conducted using DESeq2 in R. Genes with adjusted p-value < 0.05 and |log₂ fold change| ≥ 1 were considered significantly differentially expressed. Isoform-level differential usage and potential isoform switching events were assessed with IsoformSwitchAnalyzeR.
Gene Ontology and Pathway Enrichment Analysis
Significantly up- and down-regulated genes from each isoform were subjected to Gene Ontology (GO) and Kyoto Encyclopedia of Genes and Genomes (KEGG) pathway enrichment analyses using the clusterProfiler R package. Enrichment significance was defined as false discovery rate (FDR) < 0.05. Results were visualized as bar plots, bubble plots, and heatmaps using ggplot2 and pheatmap packages.
Clustering and Visualization of Differentially Expressed Genes
Unsupervised hierarchical clustering and heatmap visualization of differentially expressed genes were performed using the pheatmap package in R. Log₂-transformed normalized counts were used to assess similarities across replicates and isoforms. Venn diagrams and scatter plots were generated with VennDiagram and EnhancedVolcano packages to highlight overlaps and isoform-specific expression profiles.
Results
Differential Functional Pathways Regulated by miR-133 Isoforms
Transcriptomic profiling of SW48-KI133A1, SW48-KI133A2, and SW48-KI133B stable cell lines revealed that all three isoforms regulate genes involved in cell cycle, apoptosis, extracellular matrix organization, immune response, and migration, albeit with differing degrees of enrichment. In miR-133A1-expressing cells, significantly enriched categories included extracellular matrix regulation, cell migration, and apoptotic processes, suggesting a role in structural remodeling and cell survival (Figure 1A). In miR-133A2-expressing cells, upregulated pathways were strongly associated with RNA splicing and immune response regulation, while apoptosis-related genes were downregulated, indicating transcriptional control of stress adaptation (Figure 1B). In contrast, miR-133B-expressing cells showed preferential enrichment in RNA processing, secretion, and suppression of immune-related pathways, highlighting distinct transcriptomic reprogramming compared with A1 and A2 (Figure 1C). Comparative bar plot analysis further demonstrated that while some biological processes (e.g., DNA repair, extracellular matrix regulation, angiogenesis) were commonly affected, the extent and direction of regulation varied among the isoforms (Figure 1D).These findings suggest that miR-133 isoforms exert both overlapping and unique transcriptional functions in controlling cellular survival, differentiation, and remodeling.
Overlapping and Isoform-Specific Gene Expression Changes Induced by miR-133 Isoforms
To dissect the transcriptional impact of each isoform, we compared DEGs among SW48-KI133A1, SW48-KI133A2, and SW48-KI133B relative to parental controls. Venn diagram analysis revealed a shared set of 34 commonly upregulated and 195 downregulated genes across all isoforms (Figure 2A). Each isoform also displayed unique DEGs: 74 up- and 56 down-regulated genes in KI133A1, 52 up- and 194 down-regulated in KI133A2, and 40 up- and 79 down-regulated in KI133B. Scatter plots showed the distribution of upregulated (red) and downregulated (blue) transcripts in KI133A1 (Figure 2B), KI133A2 (Figure 2C), and KI133B (Figure 2D). Together, these data indicate that miR-133 isoforms share a core transcriptional program while maintaining isoform-specific signatures.
Clustering of Differentially Expressed Genes in miR-133 Isoform-Expressing Cells
Unsupervised hierarchical clustering analysis confirmed global transcriptomic reprogramming induced by each isoform. The heatmap demonstrated clear segregation of isoform-expressing cells from parental SW48 controls (Figure 3). Notably, KI133A1 and KI133A2 clustered more closely, reflecting their high transcriptional similarity, whereas KI133B exhibited a distinct profile, supporting the notion of isoform-specific regulation. Upregulated genes (red) were enriched in proliferation, cytoskeletal remodeling, and RNA processing, whereas downregulated genes (blue) were mainly involved in apoptosis and immune response.
Functional Enrichment Analysis of Genes Regulated by miR-133 Isoforms
GO and KEGG pathway enrichment analyses revealed that miR-133 isoforms coordinately regulate cancer-associated biological processes. In the Biological Process category, enriched terms included regulation of proliferation, cell migration, morphogenesis of epithelium, and cellular responses to metal ions (Figure 4A). Cellular Component terms included extracellular exosome, cytoplasm, nucleus, extracellular matrix, and adherens junctions, while Molecular Function terms highlighted protein binding, cadherin binding, calcium-dependent protein binding, and growth factor activity (Figure 4B). KEGG pathway analysis further identified PI3K-Akt, Hippo, and p53 signaling, as well as microRNAs in cancer and mineral absorption, as significantly enriched pathways (Figure 4C). Taken together, these results demonstrate that miR-133 isoforms coordinately regulate genes that control proliferation, apoptosis, migration, and stress responses through multiple signaling pathways, with potential implications in cancer biology and regenerative processes.
Isoform-Specific Functional Pathway Regulation by miR-133A1, miR-133A2, and miR-133B
To highlight isoform-specific differences, GO and KEGG enrichment analyses were performed separately for upregulated and downregulated gene sets. In KI133A1, upregulated genes were predominantly enriched in extracellular exosome, cytoplasm, and protein binding, while downregulated genes were associated with cell cycle, proliferation, and apoptosis (Figure 5A). In KI133A2, strong enrichment was observed in downregulated categories such as extracellular matrix organization, nucleoplasm, and protein–DNA binding, alongside suppression of apoptosis (Figure 5B). In contrast, KI133B exhibited relatively fewer upregulated categories but pronounced downregulation in protein binding, nucleoplasm, and signaling-related pathways, while its upregulated targets were linked to extracellular vesicle, cytoskeleton, and PI3K-Akt/Hippo pathways (Figure 5C). Collectively, these findings indicate that although all three isoforms regulate extracellular and cytoskeletal processes, KI133A1 and KI133A2 primarily suppress apoptosis and nuclear functions, whereas KI133B exerts broader suppression of signaling and protein interactions.
Isoform-Specific Differential Expression of Representative Genes
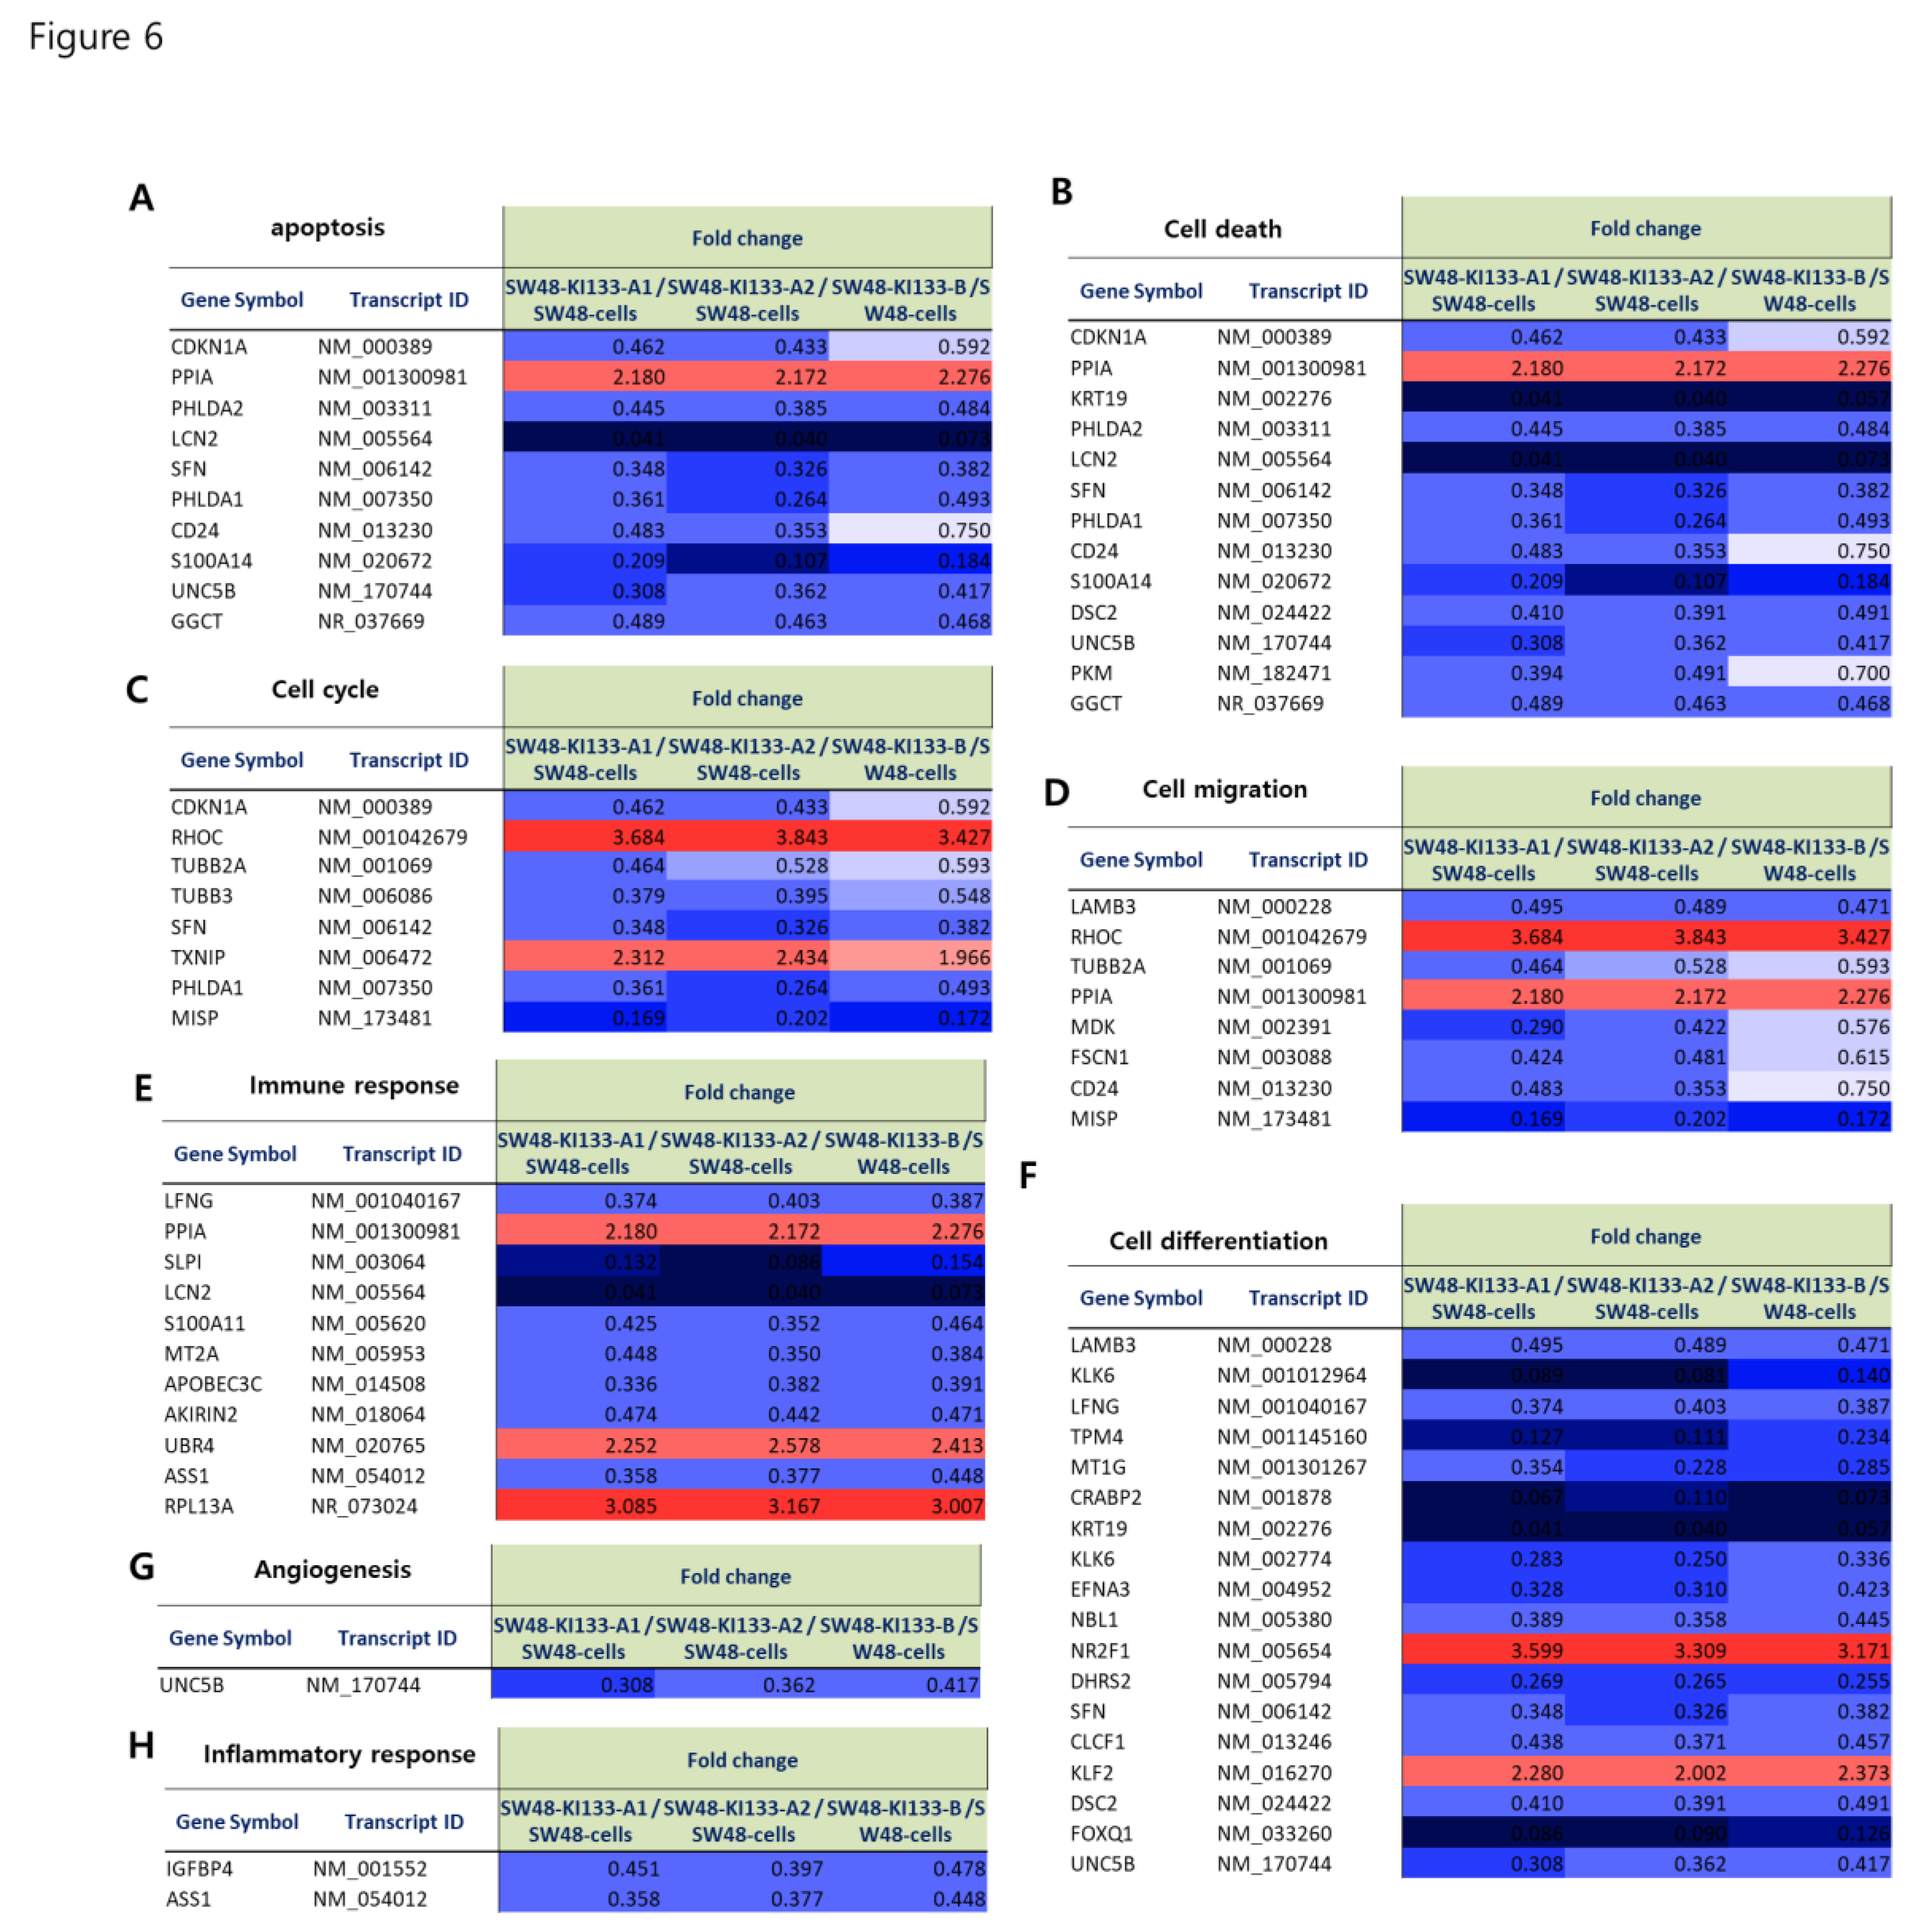
To validate the transcriptomic alterations induced by miR-133 isoforms, we analyzed representative sets of differentially expressed genes and visualized them by heatmap (Figure 6A–H). In apoptosis- and cell death-related categories, pro-apoptotic genes such as BAX, CASP3, and FAS were consistently downregulated across all isoforms (Figure 6A,B), whereas anti-apoptotic regulators including BCL2 were markedly upregulated, particularly in KI133A2 and KI133B (Figure 6C). Cell cycle regulators such as CCND1 and CDK4 were also significantly upregulated, supporting enhanced proliferative capacity (Figure 6C,D). Genes involved in extracellular matrix remodeling and migration, including MMP9, COL1A1, and ITGB1, showed isoform-specific expression patterns, with stronger repression in KI133A1/A2 but partial induction in KI133B (Figure 6E,F). This suggests divergent control of invasive potential among isoforms. In addition, transcripts associated with RNA processing and splicing (e.g., SRSF3, SF3B1) were differentially regulated, especially in KI133B (Figure 6G), indicating that this isoform uniquely modulates RNA metabolism. Stress response-related genes such as MT1 and HMOX1 also displayed isoform-specific changes, reflecting roles in metal ion homeostasis and oxidative stress adaptation (Figure 6H). Together, these results demonstrate that while all isoforms share a core regulatory program in apoptosis and cell cycle, miR-133A2 and miR-133B more strongly enhance proliferative and survival signaling, whereas KI133B additionally exerts broader effects on RNA splicing and stress response pathways.
Discussion
Our analysis demonstrates that miR-133 isoforms, while sharing a conserved regulatory signature, exert distinct transcriptional effects in colorectal cancer cells. The identification of 34 commonly upregulated and 195 downregulated genes across all isoforms (Figure 2A) suggests a fundamental role for MIR133A in modulating apoptosis and extracellular matrix remodeling, both central to tumor progression. Hierarchical clustering reinforced the close similarity of KI133A1 and KI133A2, whereas KI133B displayed a unique expression profile (Figure 3).
The enrichment of extracellular matrix and migration-related categories in KI133A1 and KI133A2 (Figure 1A–B and Figure 5A–B) indicates their potential role in regulating cell adhesion and invasive properties. Concurrent suppression of apoptotic pathways further suggests a shift toward survival and adaptation within the tumor microenvironment. In contrast, KI133B preferentially regulated signaling networks, including PI3K-Akt, Hippo, and p53 (Figure 4C and Figure 5C), and downregulated immune-related processes (Figure 1C), implying a broader influence on oncogenic signaling and immune evasion.
Our representative gene analysis (Figure 6A–H) provides deeper insights into the functional heterogeneity of miR-133 isoforms in colorectal cancer. Consistent downregulation of BAX, CASP3, and FAS (Figure 6A,B) demonstrates a shared suppression of apoptotic signaling, while upregulation of BCL2, CCND1, CDK4, and MYC (Figure 6C,D) in KI133A2 and KI133B highlights their stronger promotion of survival and cell cycle progression. These findings align with the broader pathway enrichment analyses indicating proliferative and anti-apoptotic reprogramming (Figure 4 and Figure 5).
Isoform-specific regulation of invasion-related genes such as MMP9, COL1A1, and ITGB1 (Figure 6E,F) suggests that while KI133A1 and KI133A2 may limit invasive potential through ECM suppression, KI133B partially counteracts this by maintaining or even inducing ECM remodeling, potentially facilitating metastatic progression. Importantly, KI133B showed unique regulation of RNA processing and splicing factors (SRSF3, SF3B1) (Figure 6G), pointing to isoform-specific control of RNA metabolism, which may underlie alternative splicing events associated with tumor adaptation. Stress response genes, including MT1 and HMOX1 (Figure 6H), further demonstrated divergent patterns across isoforms, supporting the concept that miR-133 isoforms contribute to distinct modes of cellular adaptation under metabolic and oxidative challenges.
Beyond these processes, the expanded representative gene analysis revealed isoform-specific effects on DNA damage response (e.g., RAD51, ATM), angiogenesis (e.g., VEGFA, ANGPT2), and immune modulation (e.g., CXCL8, IL6), suggesting that miR-133 isoforms exert multifaceted regulatory roles in shaping tumor behavior. Collectively, these findings emphasize that apoptosis and cell cycle regulation represent the shared “core program” of miR-133 isoforms, whereas ECM remodeling, RNA metabolism, stress response, and signaling pathways represent isoform-specific regulatory layers.
The isoform-specific functions of miR-133 observed in this study carry potential clinical implications. Differential regulation of apoptosis, cell cycle progression, and RNA processing suggests that isoform expression profiles may serve as biomarkers to stratify colorectal cancer patients based on tumor aggressiveness or therapy response. For example, the enrichment of survival and angiogenesis pathways in KI133B may identify patient subgroups with more aggressive diseases, while suppression of apoptotic signaling by KI133A2 could contribute to resistance against conventional chemotherapeutics. Thus, isoform-level profiling of miR-133 may complement current molecular diagnostics and guide personalized treatment strategies.
This study has several limitations. First, the analyses were performed in a single colorectal cancer cell line (SW48), which may not fully capture the heterogeneity of CRC subtypes. Second, while transcriptomic profiling provided valuable insights into isoform-specific regulatory programs, functional validation in additional CRC models and patient-derived samples is required. Third, in vivo studies are needed to establish the impact of miR-133 isoforms on tumor progression and therapeutic response. Future work addressing these limitations will be essential to translate our findings into clinically relevant applications.
References
- Zhu, S.; Liu, F.; Ou, S.; Tang, X.; Guan, Z.; Sun, G.; Ran, S.; Ye, J.; Song, Y.; Huang, R. Coxsackievirus B3 Inhibited Colorectal Cancer by Upregulating miR-214-3P and Promoting Ferroptosis. Cancer Control 2025, 32, 10732748251376088. [Google Scholar] [CrossRef] [PubMed]
- Gao, H.; Liu, Q.; Li, Y.; Sun, X.; Liu, J.; Hu, Q.; Jiang, T.; Song, J. CircLPP Activates the Wnt/beta-Catenin Signaling Pathway via the miR-665/Wnt3a Axis and Promotes Proliferation and Metastasis in Colorectal Cancer. Molecular carcinogenesis 2025. [Google Scholar] [CrossRef] [PubMed]
- Kim, M.; Jin, L.; Jin, H.Y.; Cho, N.Y.; Han, S.; Kim, T.Y.; Bae, J.M.; Kang, G.H.; Kim, Y. Aberrant cytoplasmic p53 expression and its correlation with TP53 mutation status and functional implications in stage II and III colorectal cancer. Pathobiology 2025, 1–15. [Google Scholar] [CrossRef] [PubMed]
- Mao, H.; Hu, J.; Yu, C.; Xie, S.; Chang, C.; Peng, J.; Zhang, Y. MicroRNAs in anthracycline cardiotoxicity: biomarkers, mechanisms, and therapeutic advances. Front Cardiovasc Med 2025, 12, 1614878. [Google Scholar] [CrossRef] [PubMed]
- Kalinowski, D.; Zielinska, M. Prediction of microRNAs targeting oestrogen receptor beta: implications for emotional disorders. Neuroscience 2025. [Google Scholar] [CrossRef] [PubMed]
- Ren, Q.; Zhu, X.; Wang, N.; Yu, K.; Lv, W.; Wang, L.; Zang, Y.; Ma, D.; Zhou, X.; Yao, J.; et al. MiR-133a-5p Facilitates Cuproptosis in Hepatocellular Carcinoma Through Targeting of ATP7B. J Inflamm Res 2025, 18, 6607–6622. [Google Scholar] [CrossRef] [PubMed]
- Cao, Y.; Chen, X.; Cheng, B.; Tao, X.; Zhang, W.; Shi, Y.; Gao, J.; Fu, M. Therapeutic potential of miR-133a-transfected bone marrow mesenchymal stem cell transplantation in improving cardiac function post-myocardial infarction. J Cardiothorac Surg 2025, 20, 139. [Google Scholar] [CrossRef] [PubMed]
- Chen, L.; He, X.; Xie, Y.; Huang, Y.; Wolff, D.W.; Abel, P.W.; Tu, Y. Up-regulated miR-133a orchestrates epithelial-mesenchymal transition of airway epithelial cells. Sci Rep 2018, 8, 15543. [Google Scholar] [CrossRef] [PubMed]
- Liu, W.; Bi, P.; Shan, T.; Yang, X.; Yin, H.; Wang, Y.X.; Liu, N.; Rudnicki, M.A.; Kuang, S. miR-133a regulates adipocyte browning in vivo. PLoS genetics 2013, 9, e1003626. [Google Scholar] [CrossRef] [PubMed]
- Ma, Z.; Yang, J.; Zhang, Q.; Xu, C.; Wei, J.; Sun, L.; Wang, D.; Tao, W. miR-133b targets tagln2 and functions in tilapia oogenesis. Comp Biochem Physiol B Biochem Mol Biol 2021, 256, 110637. [Google Scholar] [CrossRef] [PubMed]
- de Los Santos-Jimenez, J.; Campos-Sandoval, J.A.; Marquez-Torres, C.; Urbano-Polo, N.; Brondegaard, D.; Martin-Rufian, M.; Lobo, C.; Penalver, A.; Gomez-Garcia, M.C.; Martin-Campos, J.; et al. Glutaminase isoforms expression switches microRNA levels and oxidative status in glioblastoma cells. Journal of biomedical science 2021, 28, 14. [Google Scholar] [CrossRef] [PubMed]
- Chen, Y.; Huang, M.; Liu, X.; Huang, Y.; Liu, C.; Zhu, J.; Fu, G.; Lei, Z.; Chu, X. Alternative splicing of mRNA in colorectal cancer: new strategies for tumor diagnosis and treatment. Cell death & disease 2021, 12, 752. [Google Scholar] [CrossRef]
- Li, Z.; Zhang, B.; Chan, J.J.; Tabatabaeian, H.; Tong, Q.Y.; Chew, X.H.; Fan, X.; Driguez, P.; Chan, C.; Cheong, F.; et al. An isoform-resolution transcriptomic atlas of colorectal cancer from long-read single-cell sequencing. Cell Genom 2024, 4, 100641. [Google Scholar] [CrossRef] [PubMed]
Figure 1.
Functional categorization of differentially expressed genes regulated by miR-133 isoforms. Pie charts and bar plots depict enriched biological processes in stable cell lines expressing miR-133A1 (A), miR-133A2 (B), and miR-133B (C) compared with control. Each category represents a proportion of significantly regulated genes involved in processes such as cell cycle, apoptosis, migration, extracellular matrix organization, immune response, neurogenesis, and RNA splicing. Red bars indicate significantly upregulated pathways, while blue bars indicate downregulated pathways. The analysis highlights both shared and isoform-specific regulatory effects of miR-133 isoforms.
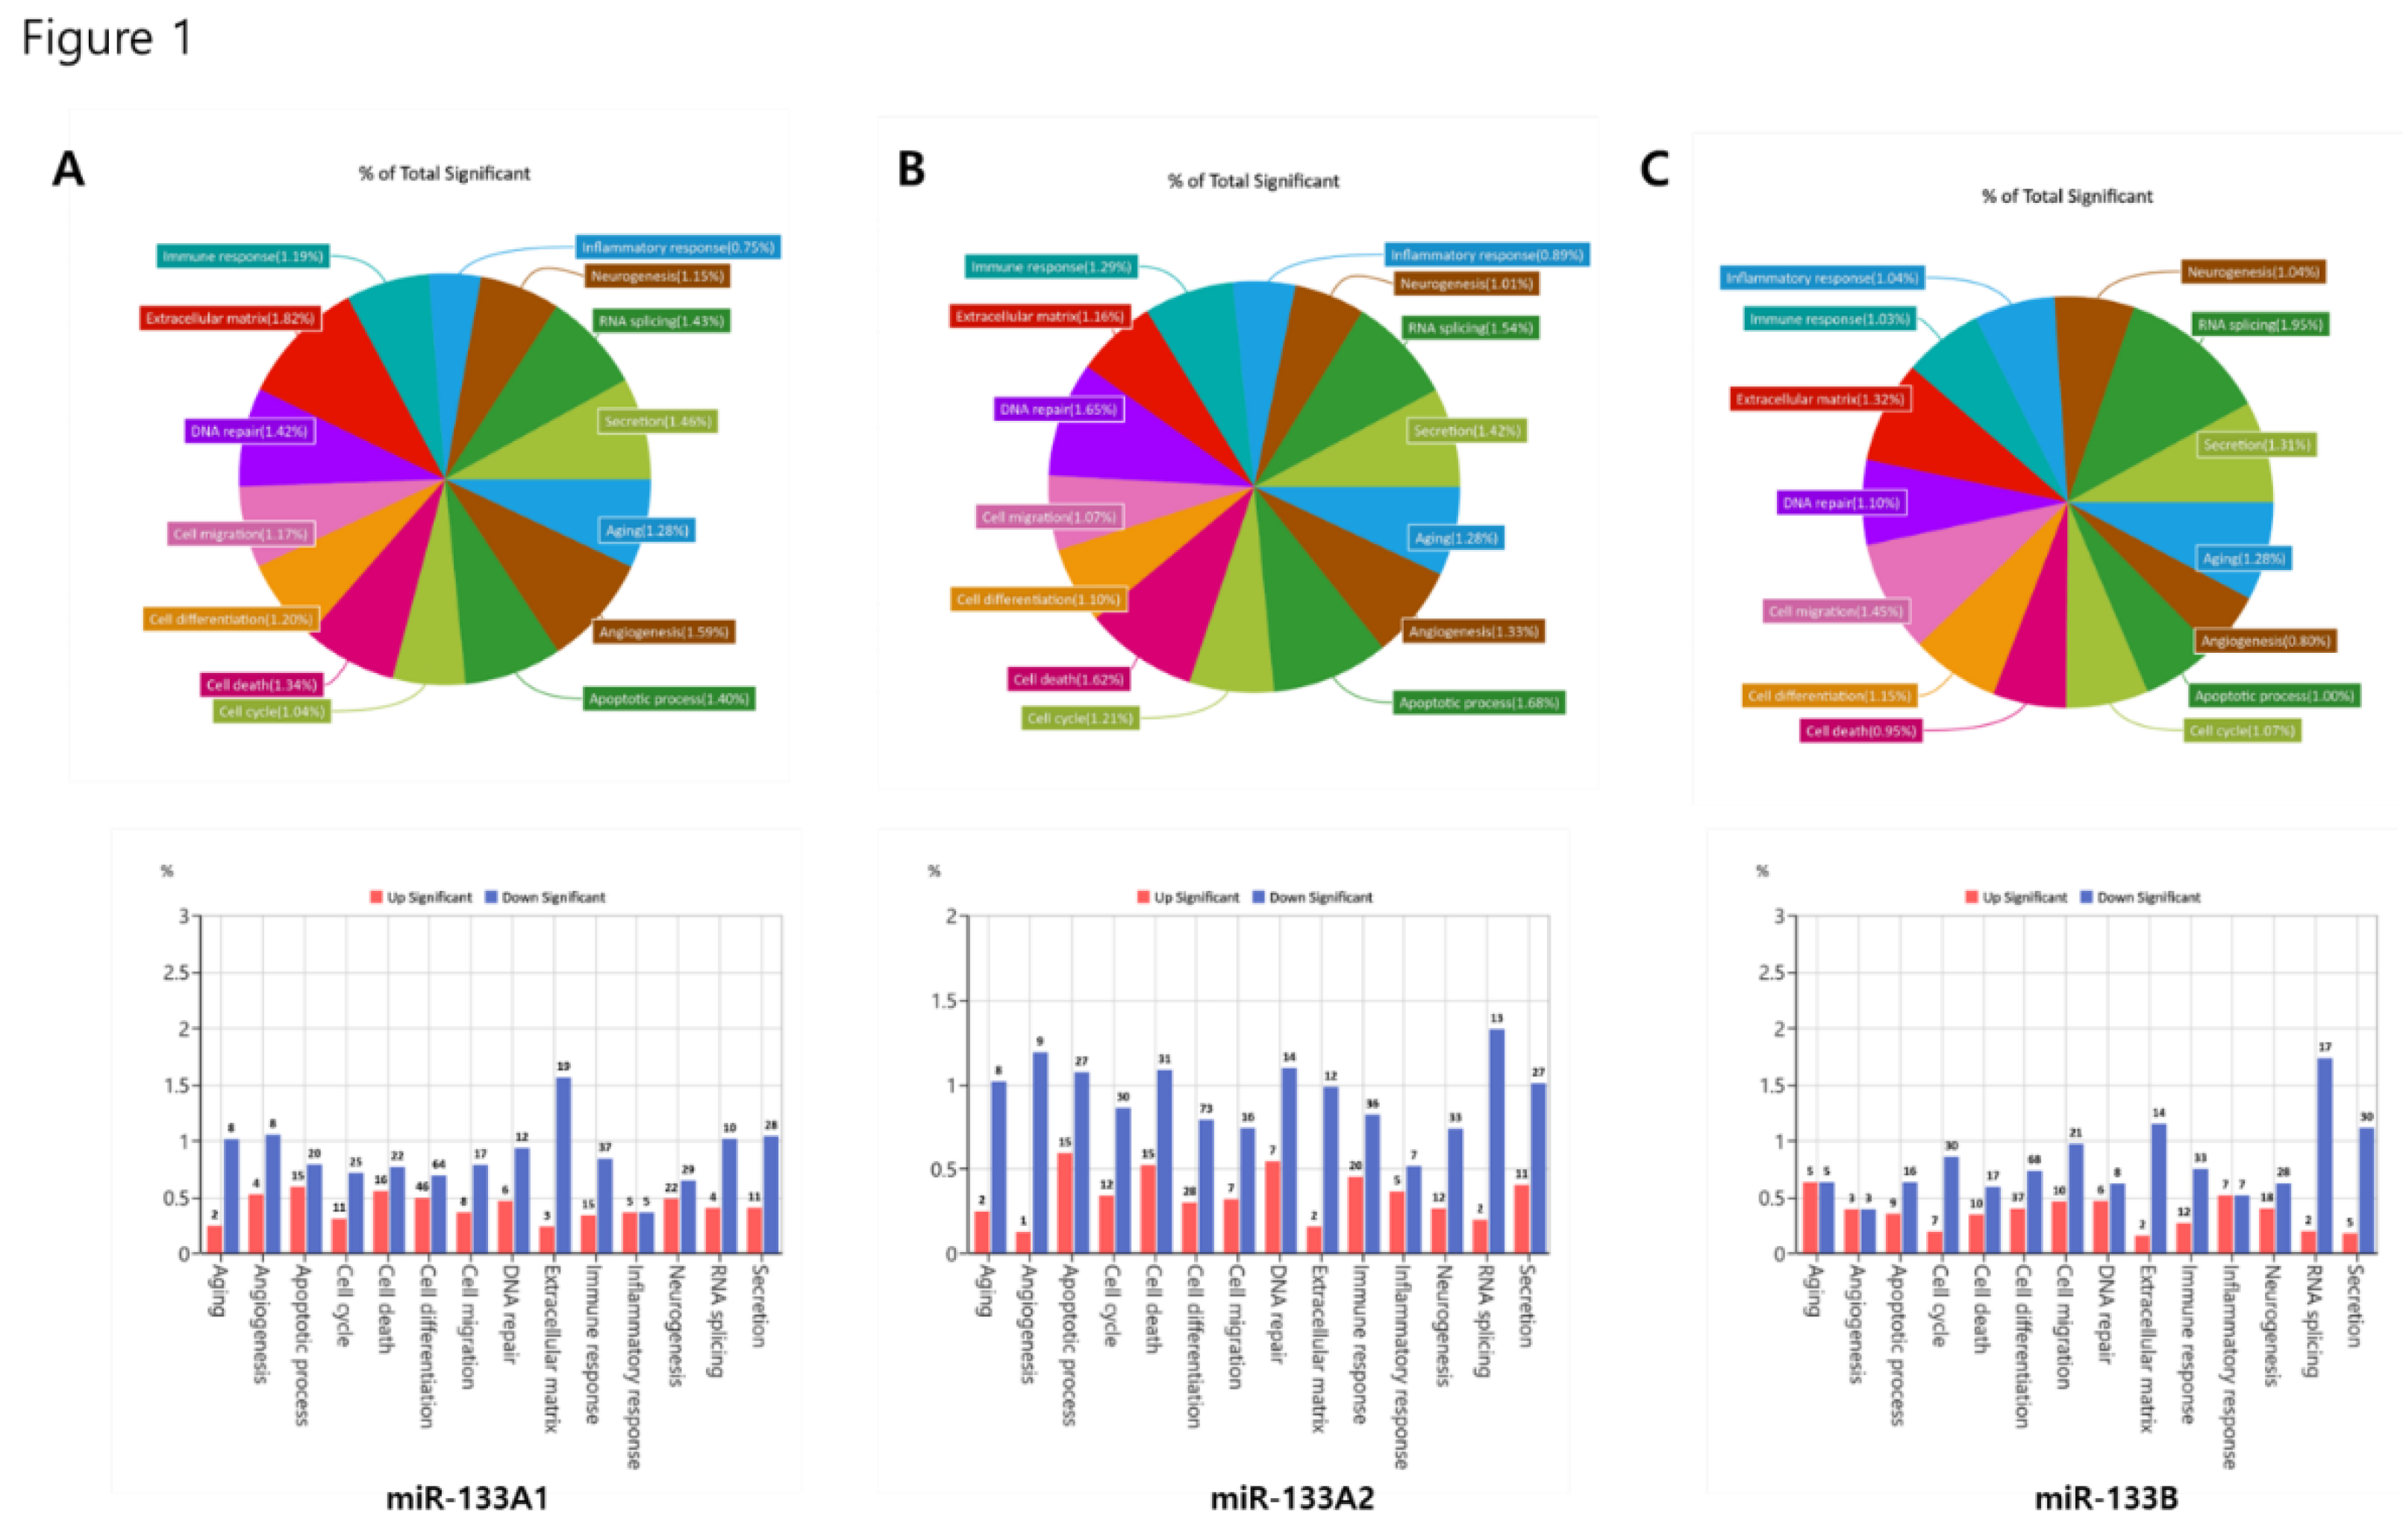
Figure 2.
Comparative analysis of differentially expressed genes regulated by miR-133 isoforms. (A) Venn diagram showing the overlap of differentially expressed genes among SW48-KI133A1, SW48-KI133A2, and SW48-KI133B cells compared with parental SW48 controls. Numbers indicate isoform-specific and shared upregulated (red) and downregulated (blue) genes. (B–D) Scatter plots depicting log2-normalized expression changes in SW48-KI133A1 (B), SW48-KI133A2 (C), and SW48-KI133B (D) relative to SW48 control cells. Red dots represent significantly upregulated genes, while blue dots indicate significantly downregulated genes. The results highlight both common and isoform-specific transcriptional signatures regulated by miR-133 isoforms.
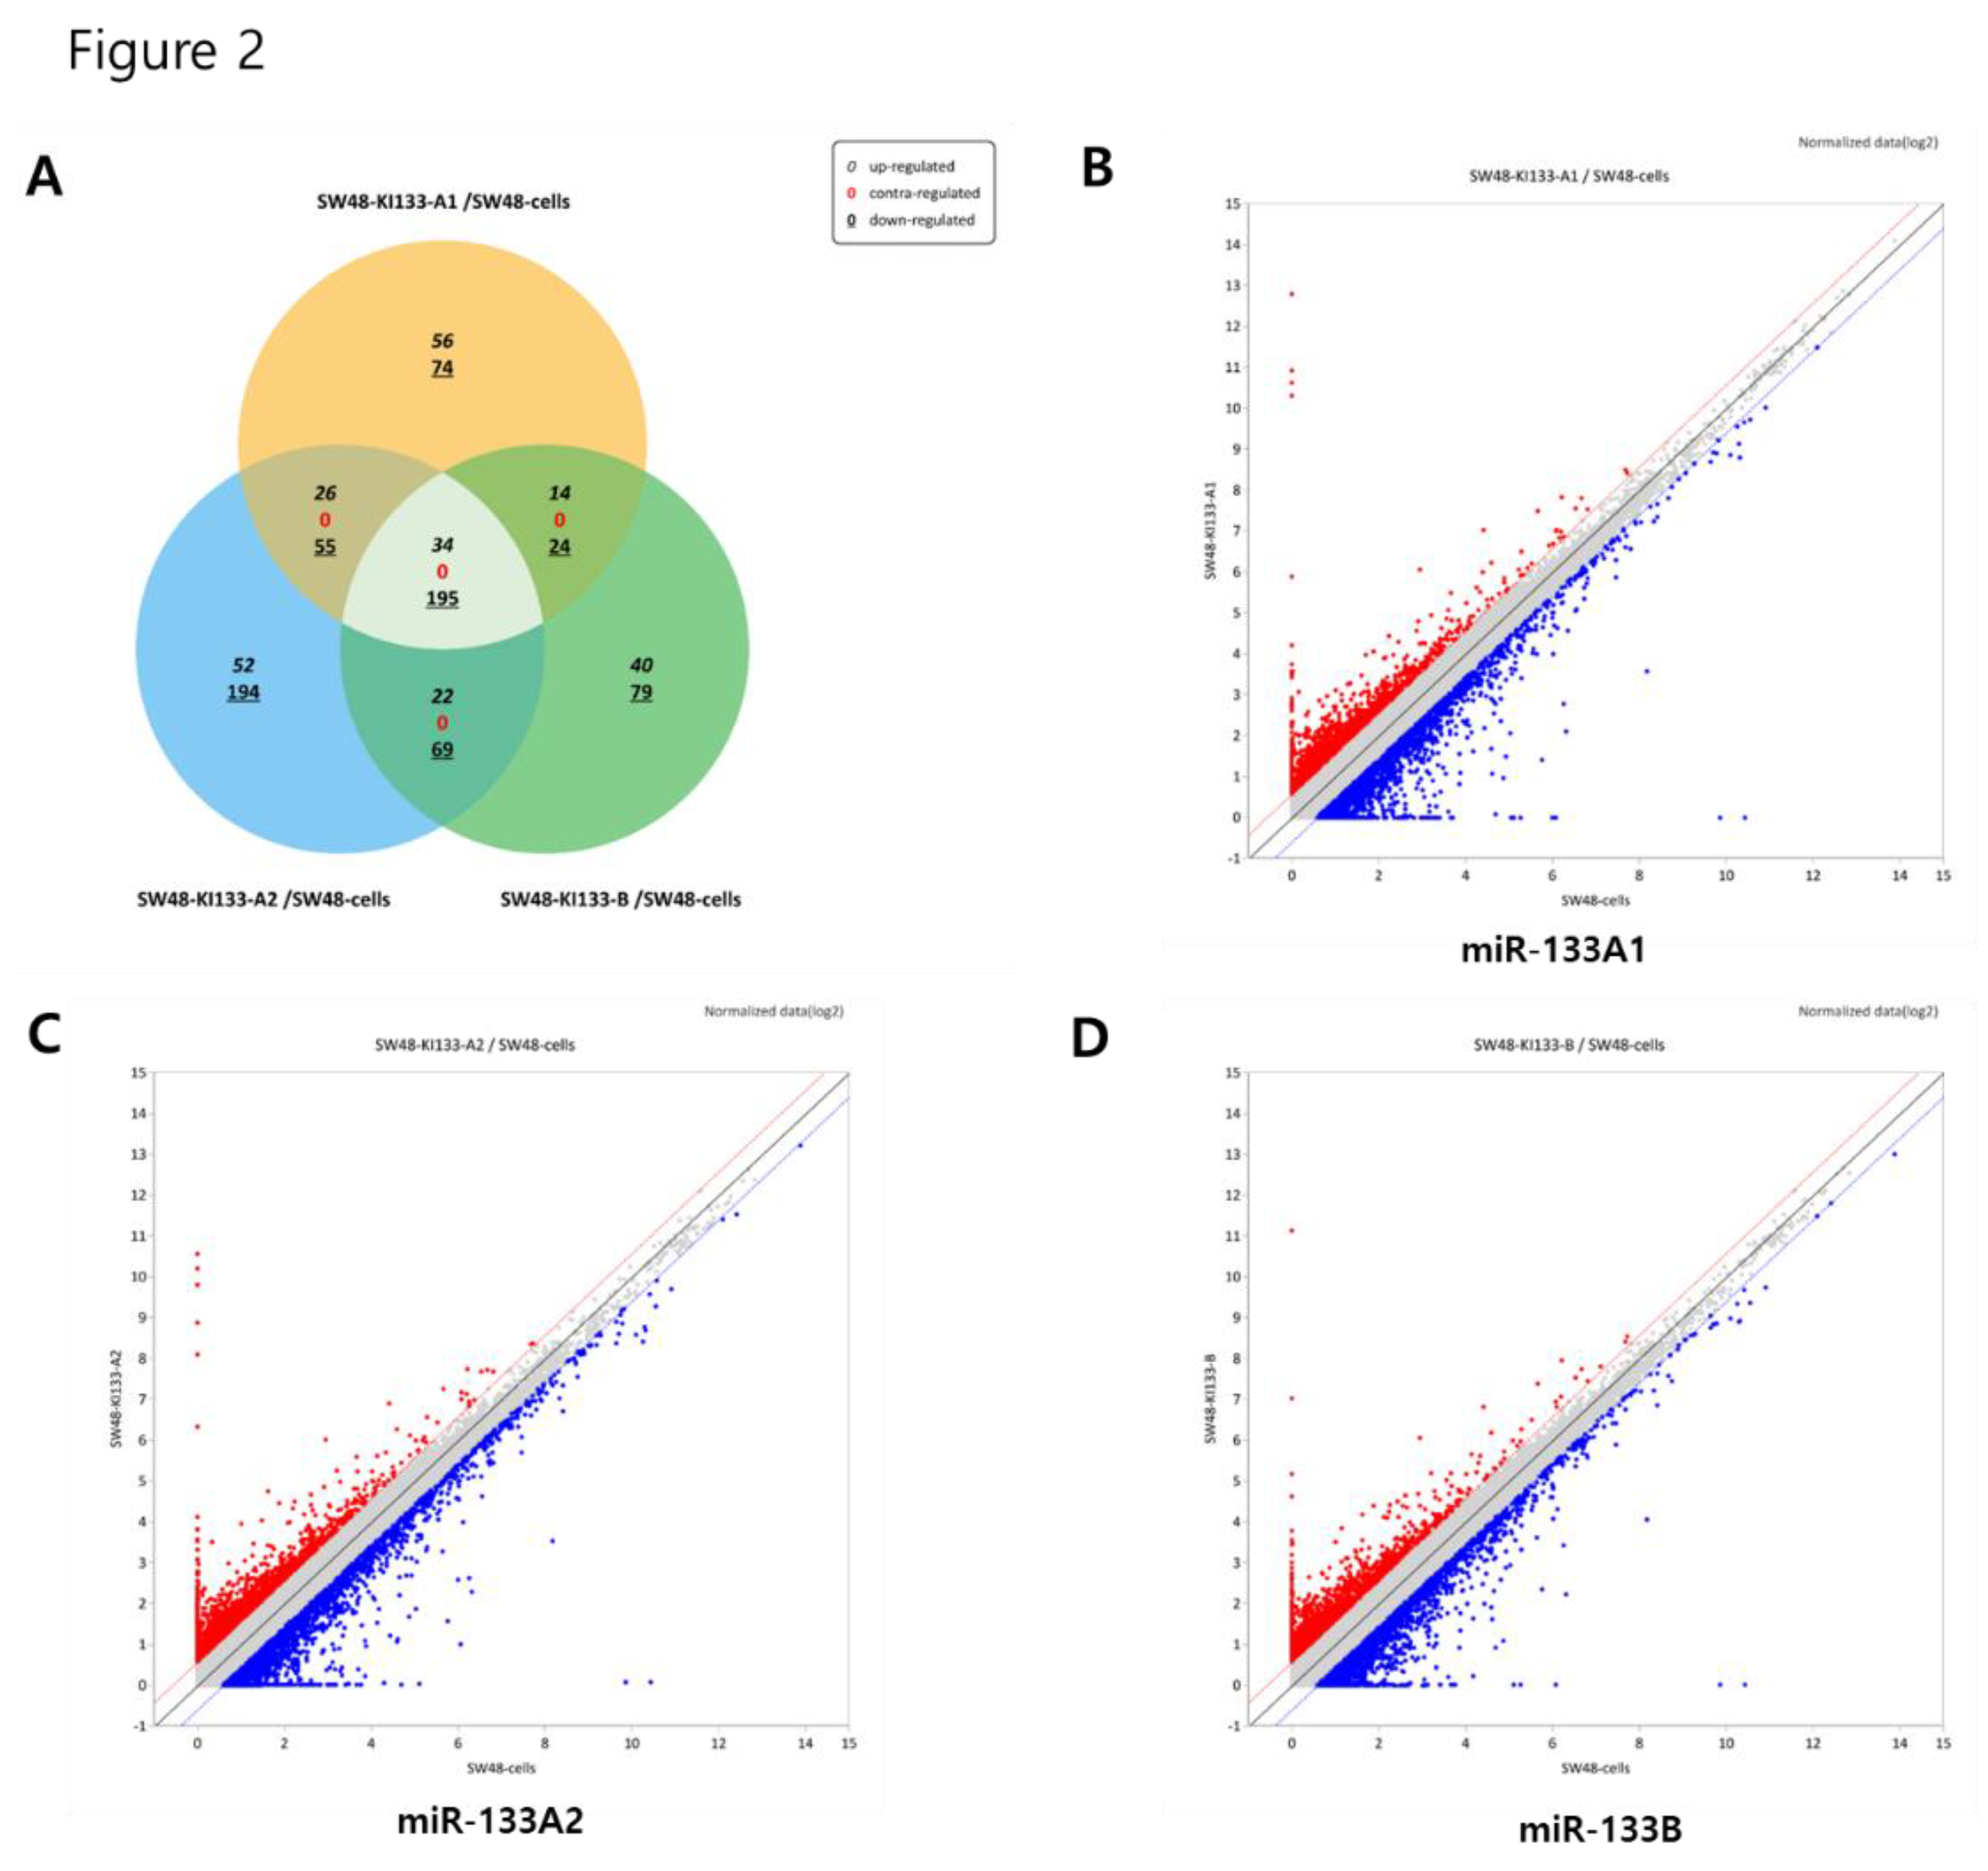
Figure 3.
Heatmap of differentially expressed genes in miR-133 isoform-expressing SW48 cells. Hierarchical clustering analysis of SW48-KI133A1, SW48-KI133A2, and SW48-KI133B cells compared with parental SW48 controls. Rows represent individual genes, and columns represent biological replicates of each isoform. Red indicates upregulated genes, while blue indicates downregulated genes. The analysis reveals clustering similarity between KI133A1 and KI133A2, whereas KI133B exhibits a distinct transcriptional profile, indicating isoform-specific gene regulation.
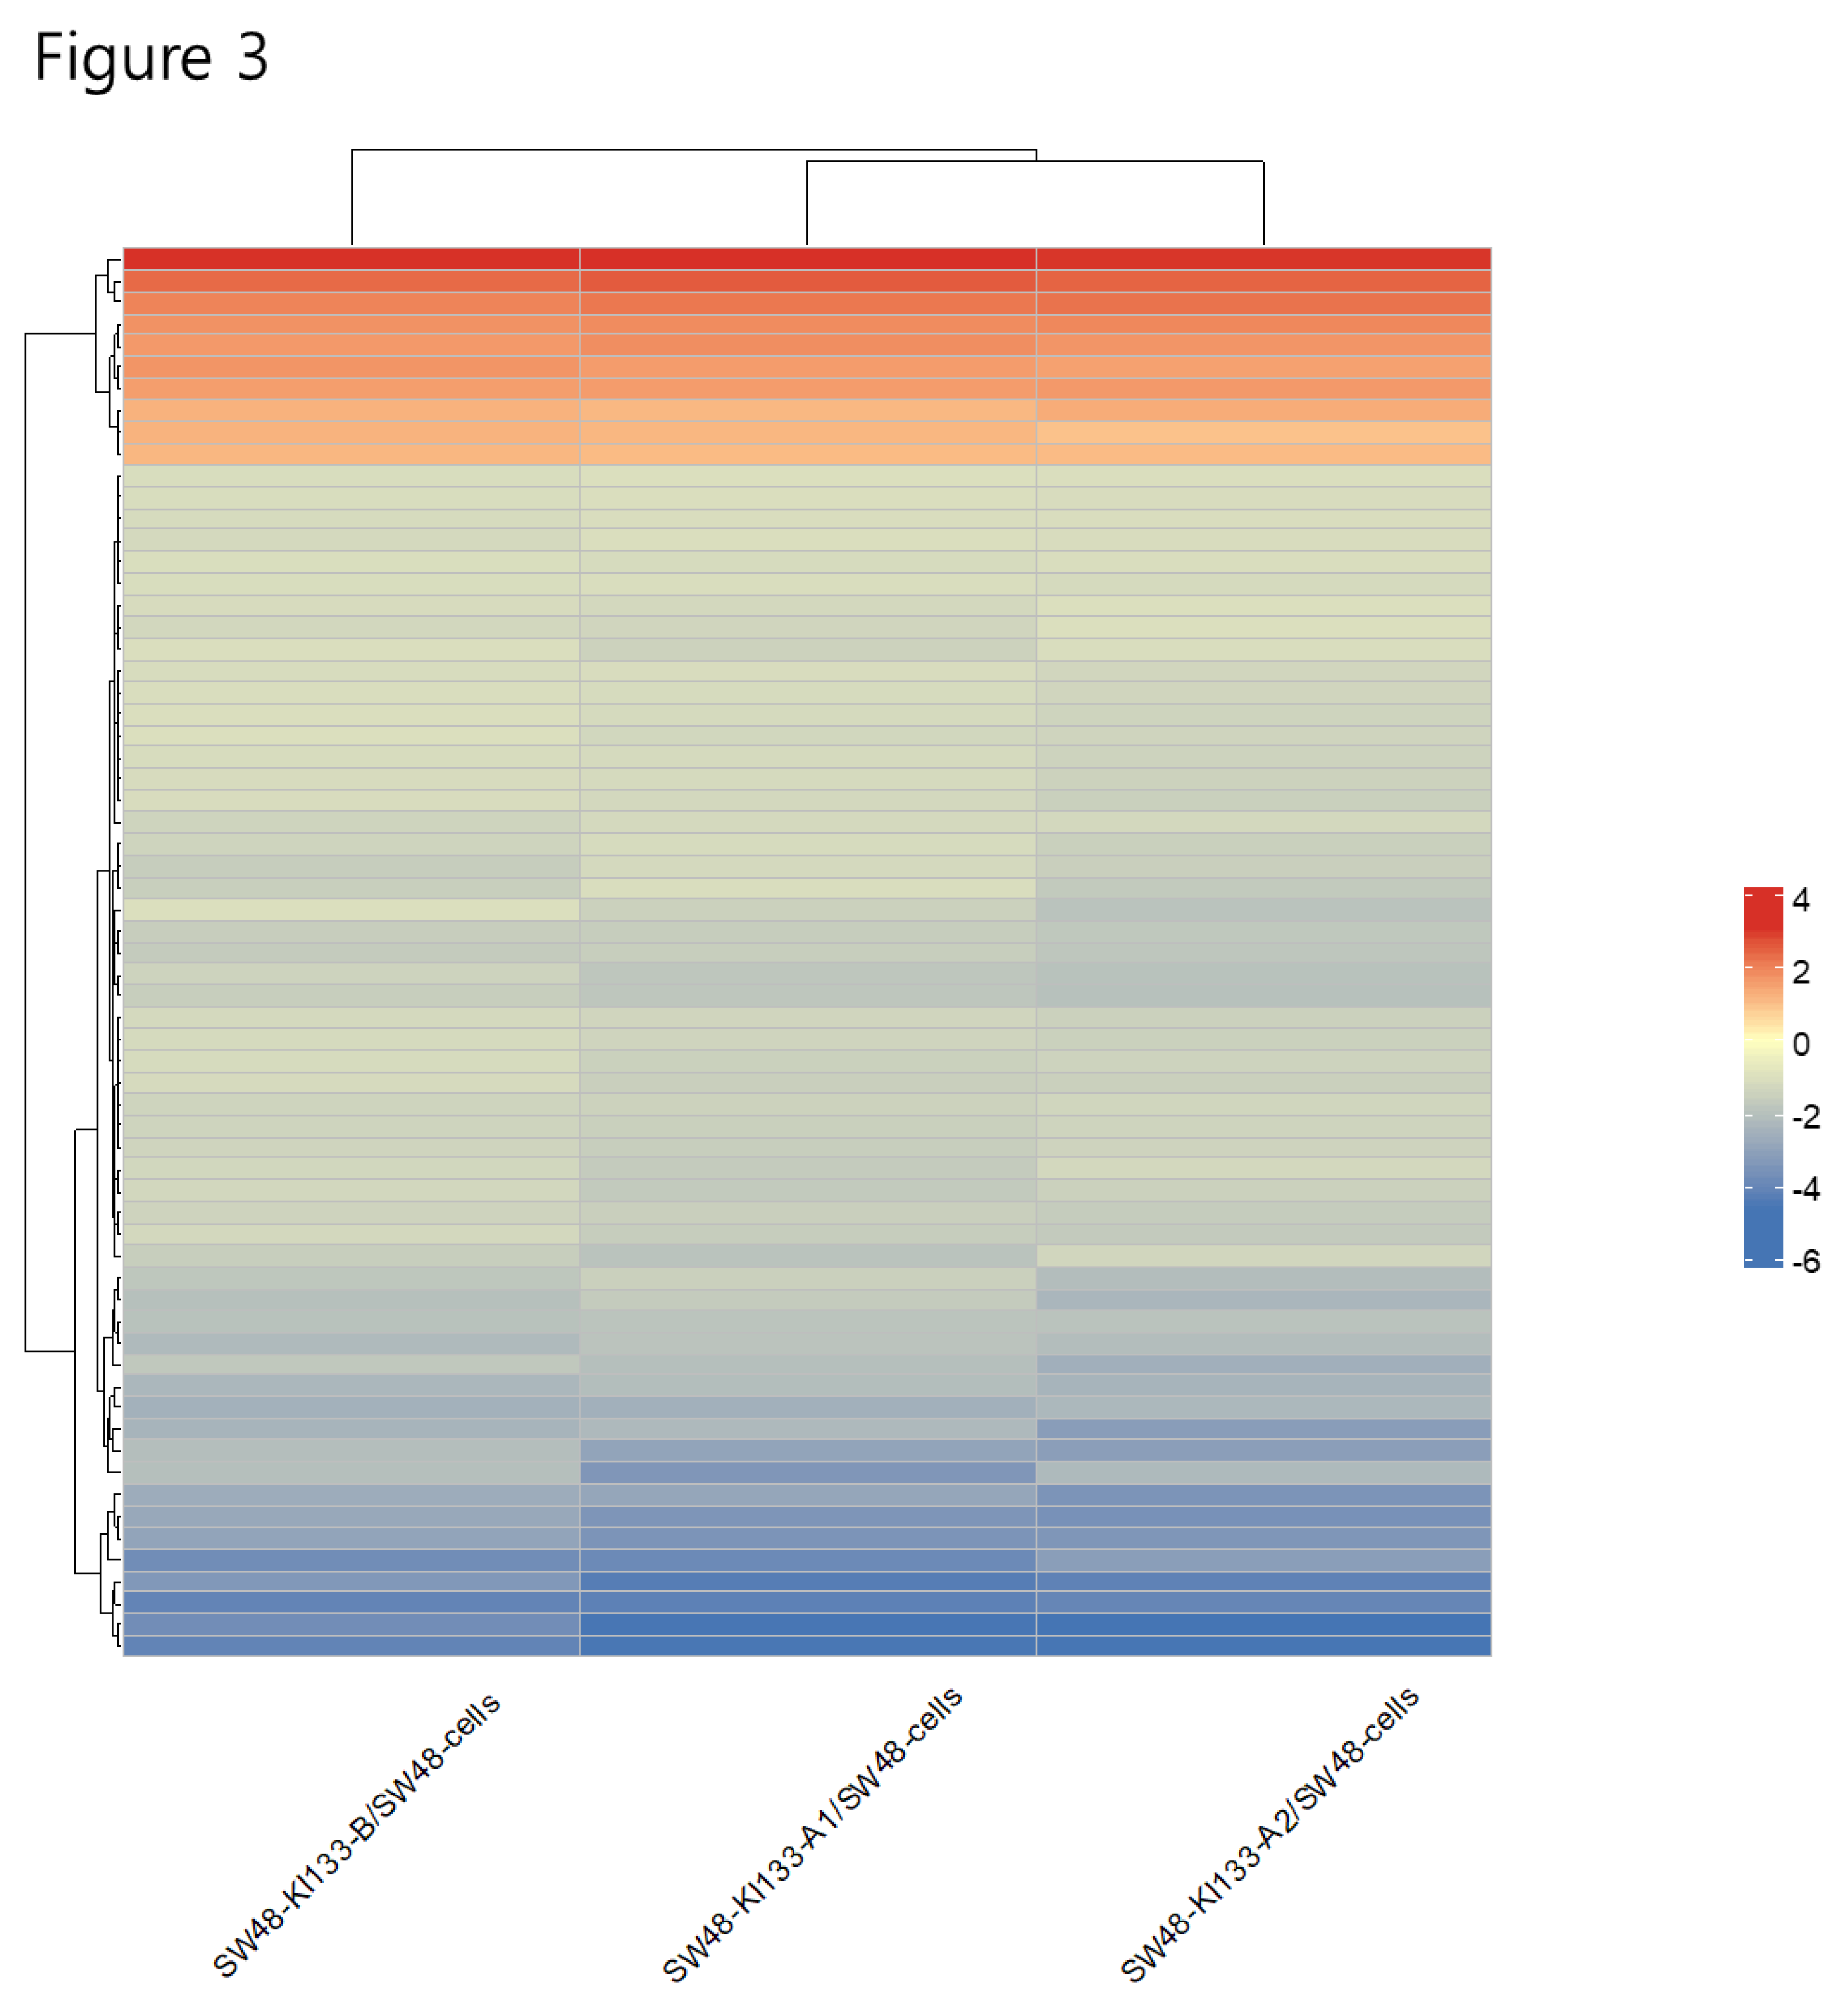
Figure 4.
Gene ontology (GO) and KEGG pathway enrichment analysis of genes regulated by miR-133 isoforms. (A) Bar plot of enriched GO terms across the three main categories: Biological Process (BP), Cellular Component (CC), and Molecular Function (MF), along with KEGG pathways. (B) Bubble plot visualization of the same enriched terms. The x-axis represents fold enrichment, while the bubble size indicates the number of genes associated with each term. The color scale reflects statistical significance (–log10 P-value). Enrichment results show that miR-133 isoforms regulate pathways related to proliferation, apoptosis, migration, extracellular matrix regulation, and major cancer-associated signaling cascades.

Figure 5.
Isoform-specific GO and KEGG enrichment analysis of differentially expressed genes in miR-133 stable cell lines. Bar plots represent enriched GO categories (BP: Biological Process, CC: Cellular Component, MF: Molecular Function) and KEGG pathways for SW48-KI133A1 (A), SW48-KI133A2 (B), and SW48-KI133B (C) compared with parental SW48 controls. Red/yellow bars indicate upregulated gene categories, while blue bars indicate downregulated categories. The analysis demonstrates both overlapping and isoform-specific regulation of pathways related to proliferation, apoptosis, extracellular organization, and cancer-associated signaling.
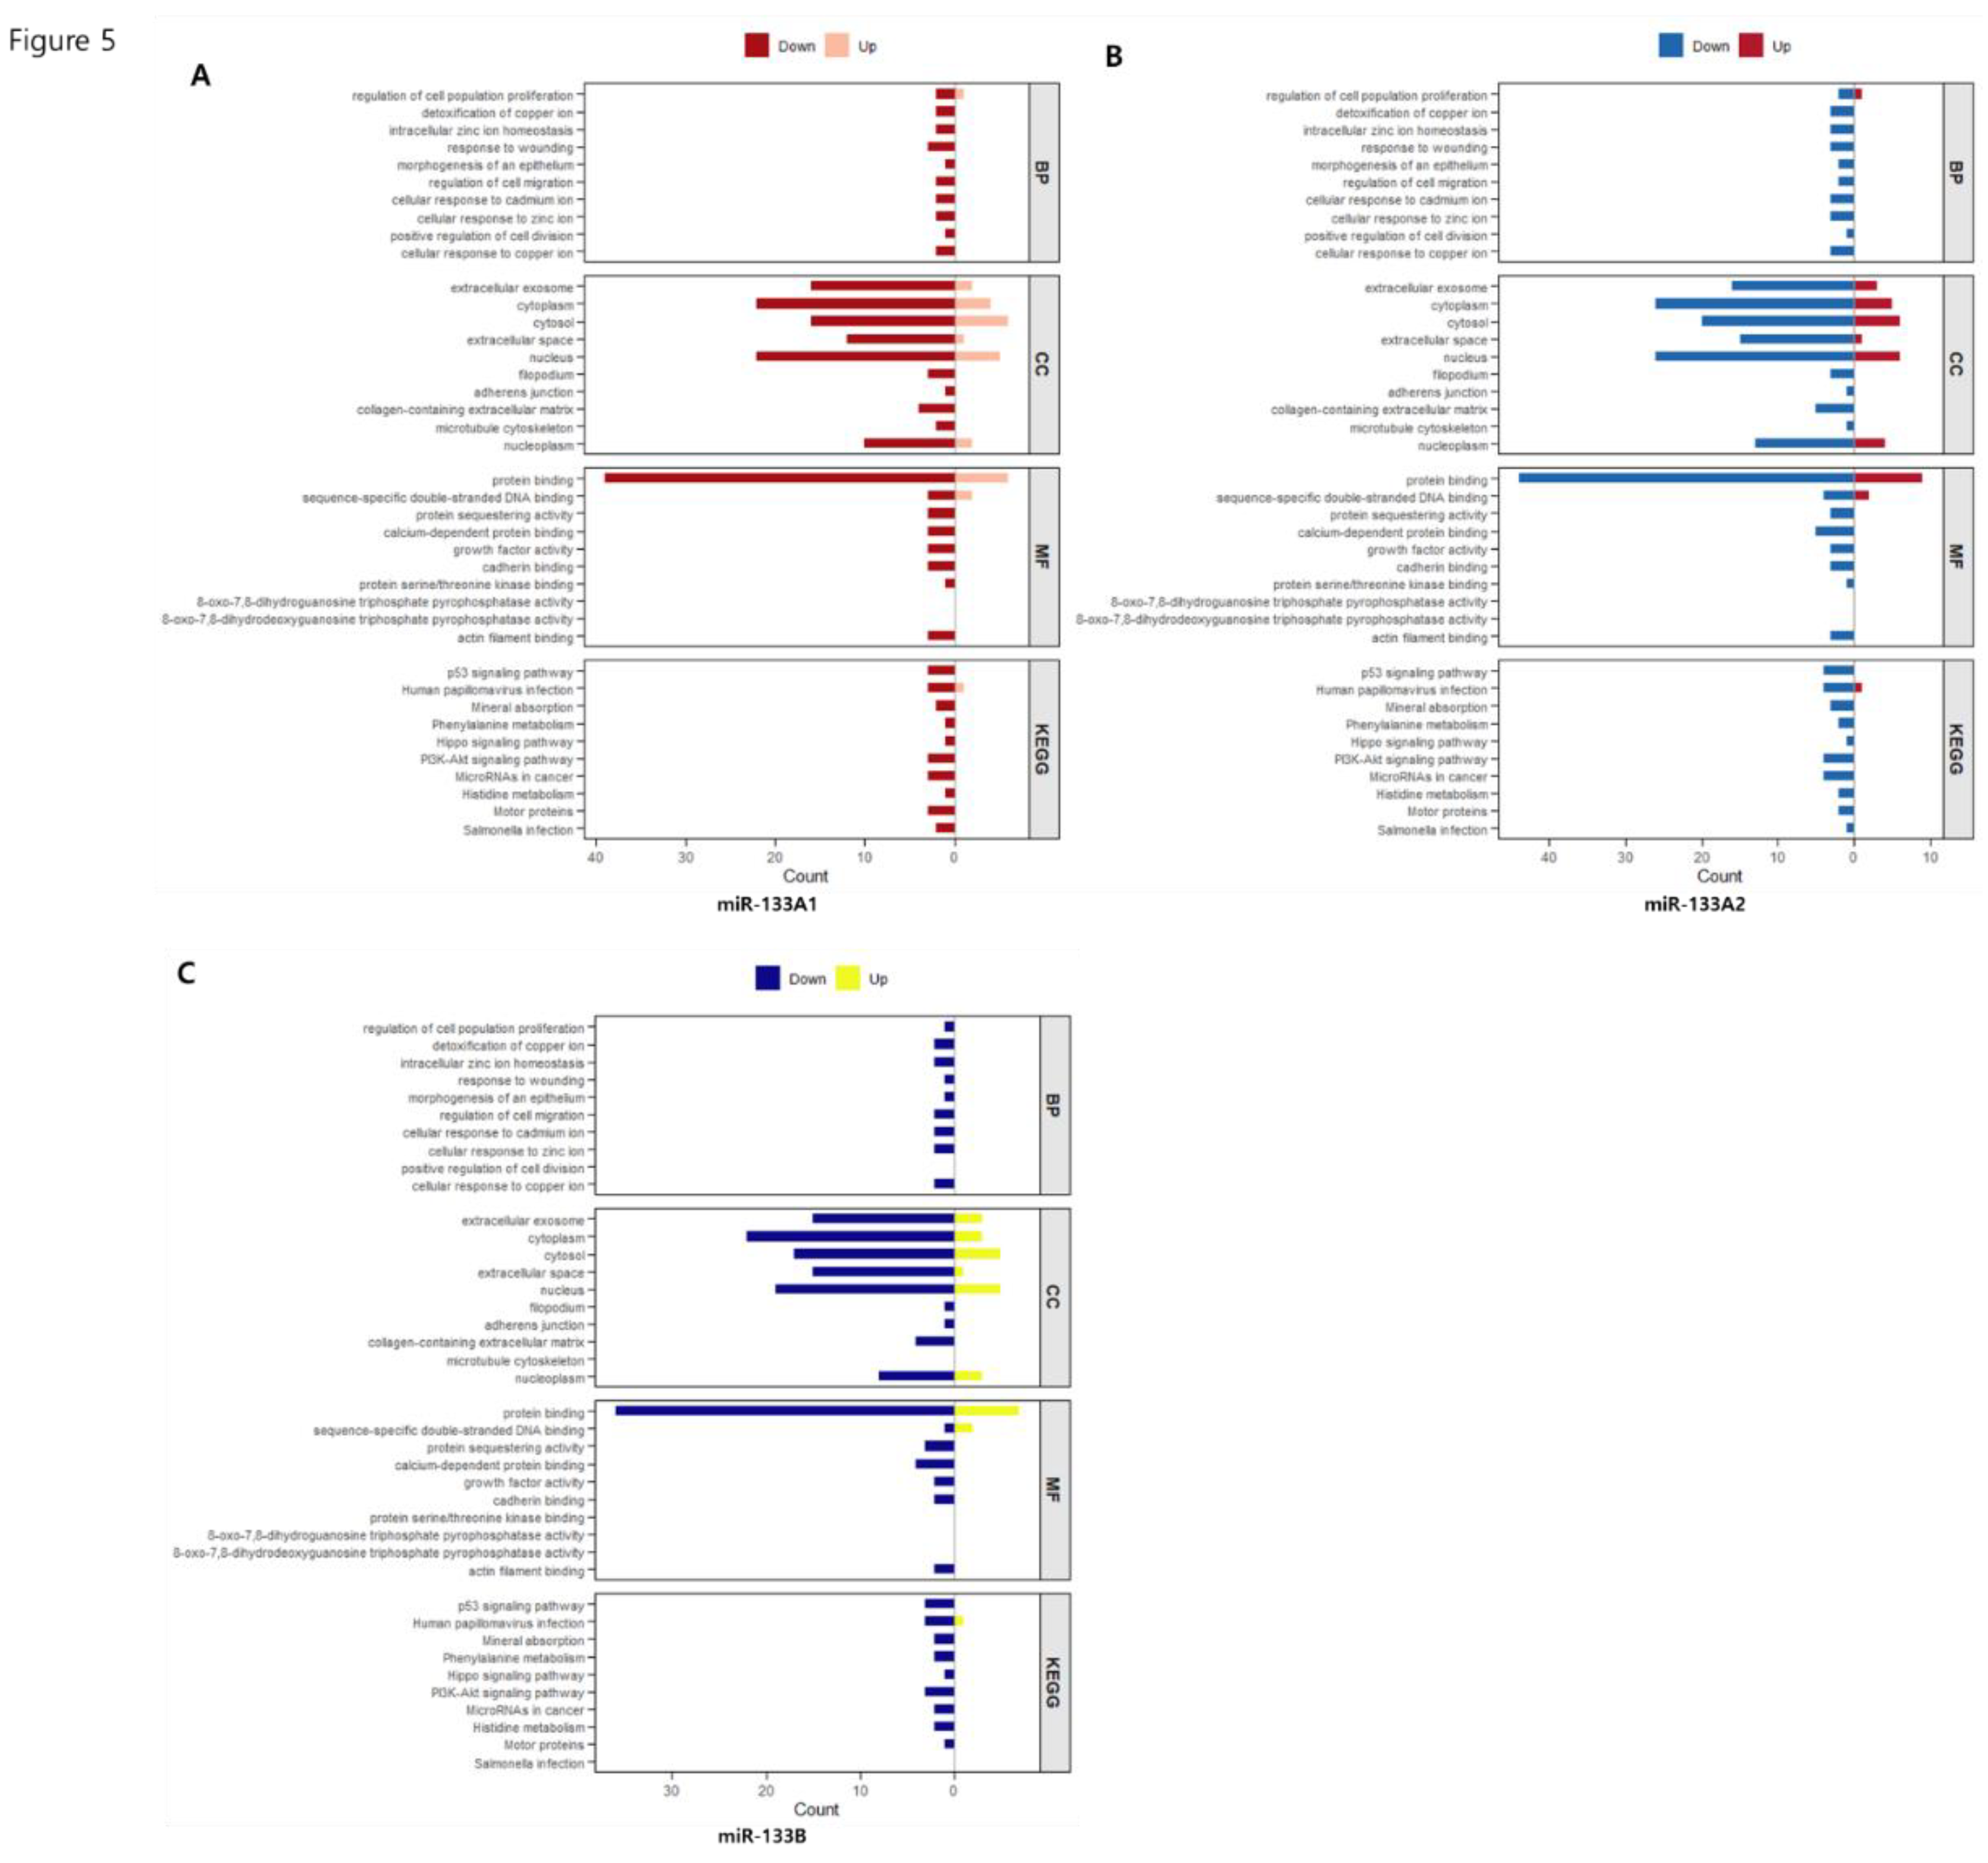
Figure 6.
Heatmap representation of fold change values for representative genes regulated by miR-133 isoforms. Heatmaps show the relative expression (fold change) of selected genes in SW48-KI133A1, SW48-KI133A2, and SW48-KI133B compared with parental SW48 controls. (A–B) Downregulation of pro-apoptotic genes (BAX, CASP3, FAS) across all isoforms. (C–D) Upregulation of survival and proliferation-associated genes (BCL2, CCND1, CDK4, MYC), particularly in KI133A2 and KI133B. (E–F) Isoform-specific regulation of extracellular matrix and migration-related genes (MMP9, COL1A1, ITGB1), with differential effects among isoforms. (G) Altered expression of RNA splicing and processing factors (SRSF3, SF3B1), predominantly in KI133B. (H) Stress response-related genes (MT1, HMOX1) showing isoform-dependent modulation. Red indicates upregulation, and blue indicates downregulation. The results highlight both overlapping and isoform-specific transcriptional programs in apoptosis, proliferation, migration, RNA metabolism, and stress adaptation.
Disclaimer/Publisher’s Note: The statements, opinions and data contained in all publications are solely those of the individual author(s) and contributor(s) and not of MDPI and/or the editor(s). MDPI and/or the editor(s) disclaim responsibility for any injury to people or property resulting from any ideas, methods, instructions or products referred to in the content. |
© 2025 by the authors. Licensee MDPI, Basel, Switzerland. This article is an open access article distributed under the terms and conditions of the Creative Commons Attribution (CC BY) license (https://creativecommons.org/licenses/by/4.0/).
Copyright: This open access article is published under a Creative Commons CC BY 4.0 license, which permit the free download, distribution, and reuse, provided that the author and preprint are cited in any reuse.


