
Submitted:
27 June 2025
Posted:
01 July 2025
You are already at the latest version
Abstract
Colorectal cancer (CRC), the third leading cause of cancer-related death globally, sporadic CRC arises through a continuum from normal tissue to adenomas, progressing from low-grade (LGD) to high-grade dysplasia (HGD), yet early epigenetic drivers of this transition remain unclear. To investigate these early events, we profiled LGD and HGD adenomas using EM-seq and identified a consensus Differential Methylation Signature (DMS) of 626 regions through two independent bioinformatics pipelines. This signature effectively distinguished LGD from HGD in both tissue and plasma-derived cell-free DNA (cfDNA), highlighting specific methylation patterns. Functional annotation indicated enrichment for regulatory elements associated with transcription factor activity and cell signaling. Applying the DMS to TCGA CRC dataset revealed three tumor subtypes with increasing hypermethylation and one normal cluster. The most hypermethylated subtype exhibited poor survival, high mutation burden, and disrupted transcriptional networks. While overlapping with classical CpG Island Methylator Phenotype (CIMP) categories, the DMS captured a broader spectrum of methylation alterations. These findings suggest that the DMS reflects early, functionally relevant epigenetic changes in CRC progression, enabling robust stratification of dysplasia severity and tumor subtypes. The DMS has the potential to improve early detection and molecular classification, warranting further validation in larger, prospective cohorts.
Keywords:
colorectal cancer
; advanced adenomas
; methylation
; high-grade dysplasia
; low-grade dysplasia
; multiomics
; regulatory network
; early detection
1. Introduction
Colorectal cancer (CRC) is a leading cause of cancer-related mortality worldwide and poses a significant public health challenge [1]. Although the current CRC classification systems rely primarily on histopathological features and clinical staging, they often fail to capture the extensive molecular and clinical heterogeneity observed among patients [2]. In recent years, high-throughput sequencing technologies have uncovered a complex landscape of genetic and epigenetic alterations that contribute to tumor progression and influence patient outcomes. Among these epigenetic factors, DNA methylation has emerged as a pivotal regulatory mechanism in CRC carcinogenesis [3]. However, the relationship between genome-wide methylation patterns, mutation burden, and clinical trajectories remains incompletely understood [4].
Beyond these gaps in understanding late-stage CRC, there is a growing recognition of a stepwise progression from normal colon epithelial tissue to dysplastic adenomas. Colorectal adenomas undergo a transition from low-grade dysplasia (LGD) to high-grade dysplasia (HGD) via incremental molecular changes [5]. While global DNA methylation alterations are well characterized in established CRCs [6], early methylation events driving the LGD–HGD continuum warrant deeper investigation, given their potential for improved risk stratification and non-invasive detection [7]. Resources such as The Cancer Genome Atlas (TCGA) provide an unprecedented opportunity to integrate DNA methylation profiles with gene expression, genetic mutations, and clinical outcomes, thereby enabling a more refined molecular classification of CRC [8,9,10]. Despite these advances, clinical outcomes remain heterogeneous, underscoring the need for more nuanced biomarkers and therapeutic strategies [11,12].
Although numerous genetic drivers in CRC (such as APC, KRAS, and TP53) are well established, epigenetic modifications, particularly DNA methylation, contribute an additional dimension of complexity that is not yet fully captured by conventional classification schemes [13,14]. Integrating methylation data with mutation burden and transcription factor (TF) networks has the potential to reveal novel CRC subtypes with distinct regulatory circuits, highlighting mechanisms that may be amenable to early intervention or targeted therapies [13,14,15,16]. Certain methylation patterns may correlate with genomic instability, offering opportunities to delineate specific pathways of tumorigenesis or to identify new points of therapeutic intervention [17]. Furthermore, by examining TF networks and stemness signatures, researchers can uncover key molecular switches orchestrating these methylation-defined subtypes, thereby identifying potential biomarkers for early detection and personalized management [18,19].
The present study leverages comprehensive multi-platform data from both advanced adenomas (AA) and CRCs to bridge critical gaps in our understanding of dysplasia progression. We aimed to identify the regulatory mechanisms and biological processes driving the progression from adenomatous lesions to distinct CRC subtypes, capturing the continuum from LGD to HGD and ultimately to malignant disease [20]. Specifically, we aimed to uncover epigenetically defined subtypes of CRC by applying a genome-wide DNA methylation signature derived from lesions with different dysplasia grades, thereby illuminating whether methylation patterns coincide with increased mutation burden and worse clinical outcomes. We also sought to elucidate regulatory networks, focusing on key TFs and stemness-related genes that could govern these subtypes, and thus serve as potential biomarkers or therapeutic targets. By correlating these molecular features with patient survival, our approach provides an integrated framework for refining CRC prognostication and personalized therapeutic decision-making. Ultimately, the insights gained here underscore the biological and clinical significance of early DNA methylation events, offering a springboard for future translational applications ranging from non-invasive screening in plasma-derived cell-free DNA (cfDNA) to novel intervention strategies.
2. Results
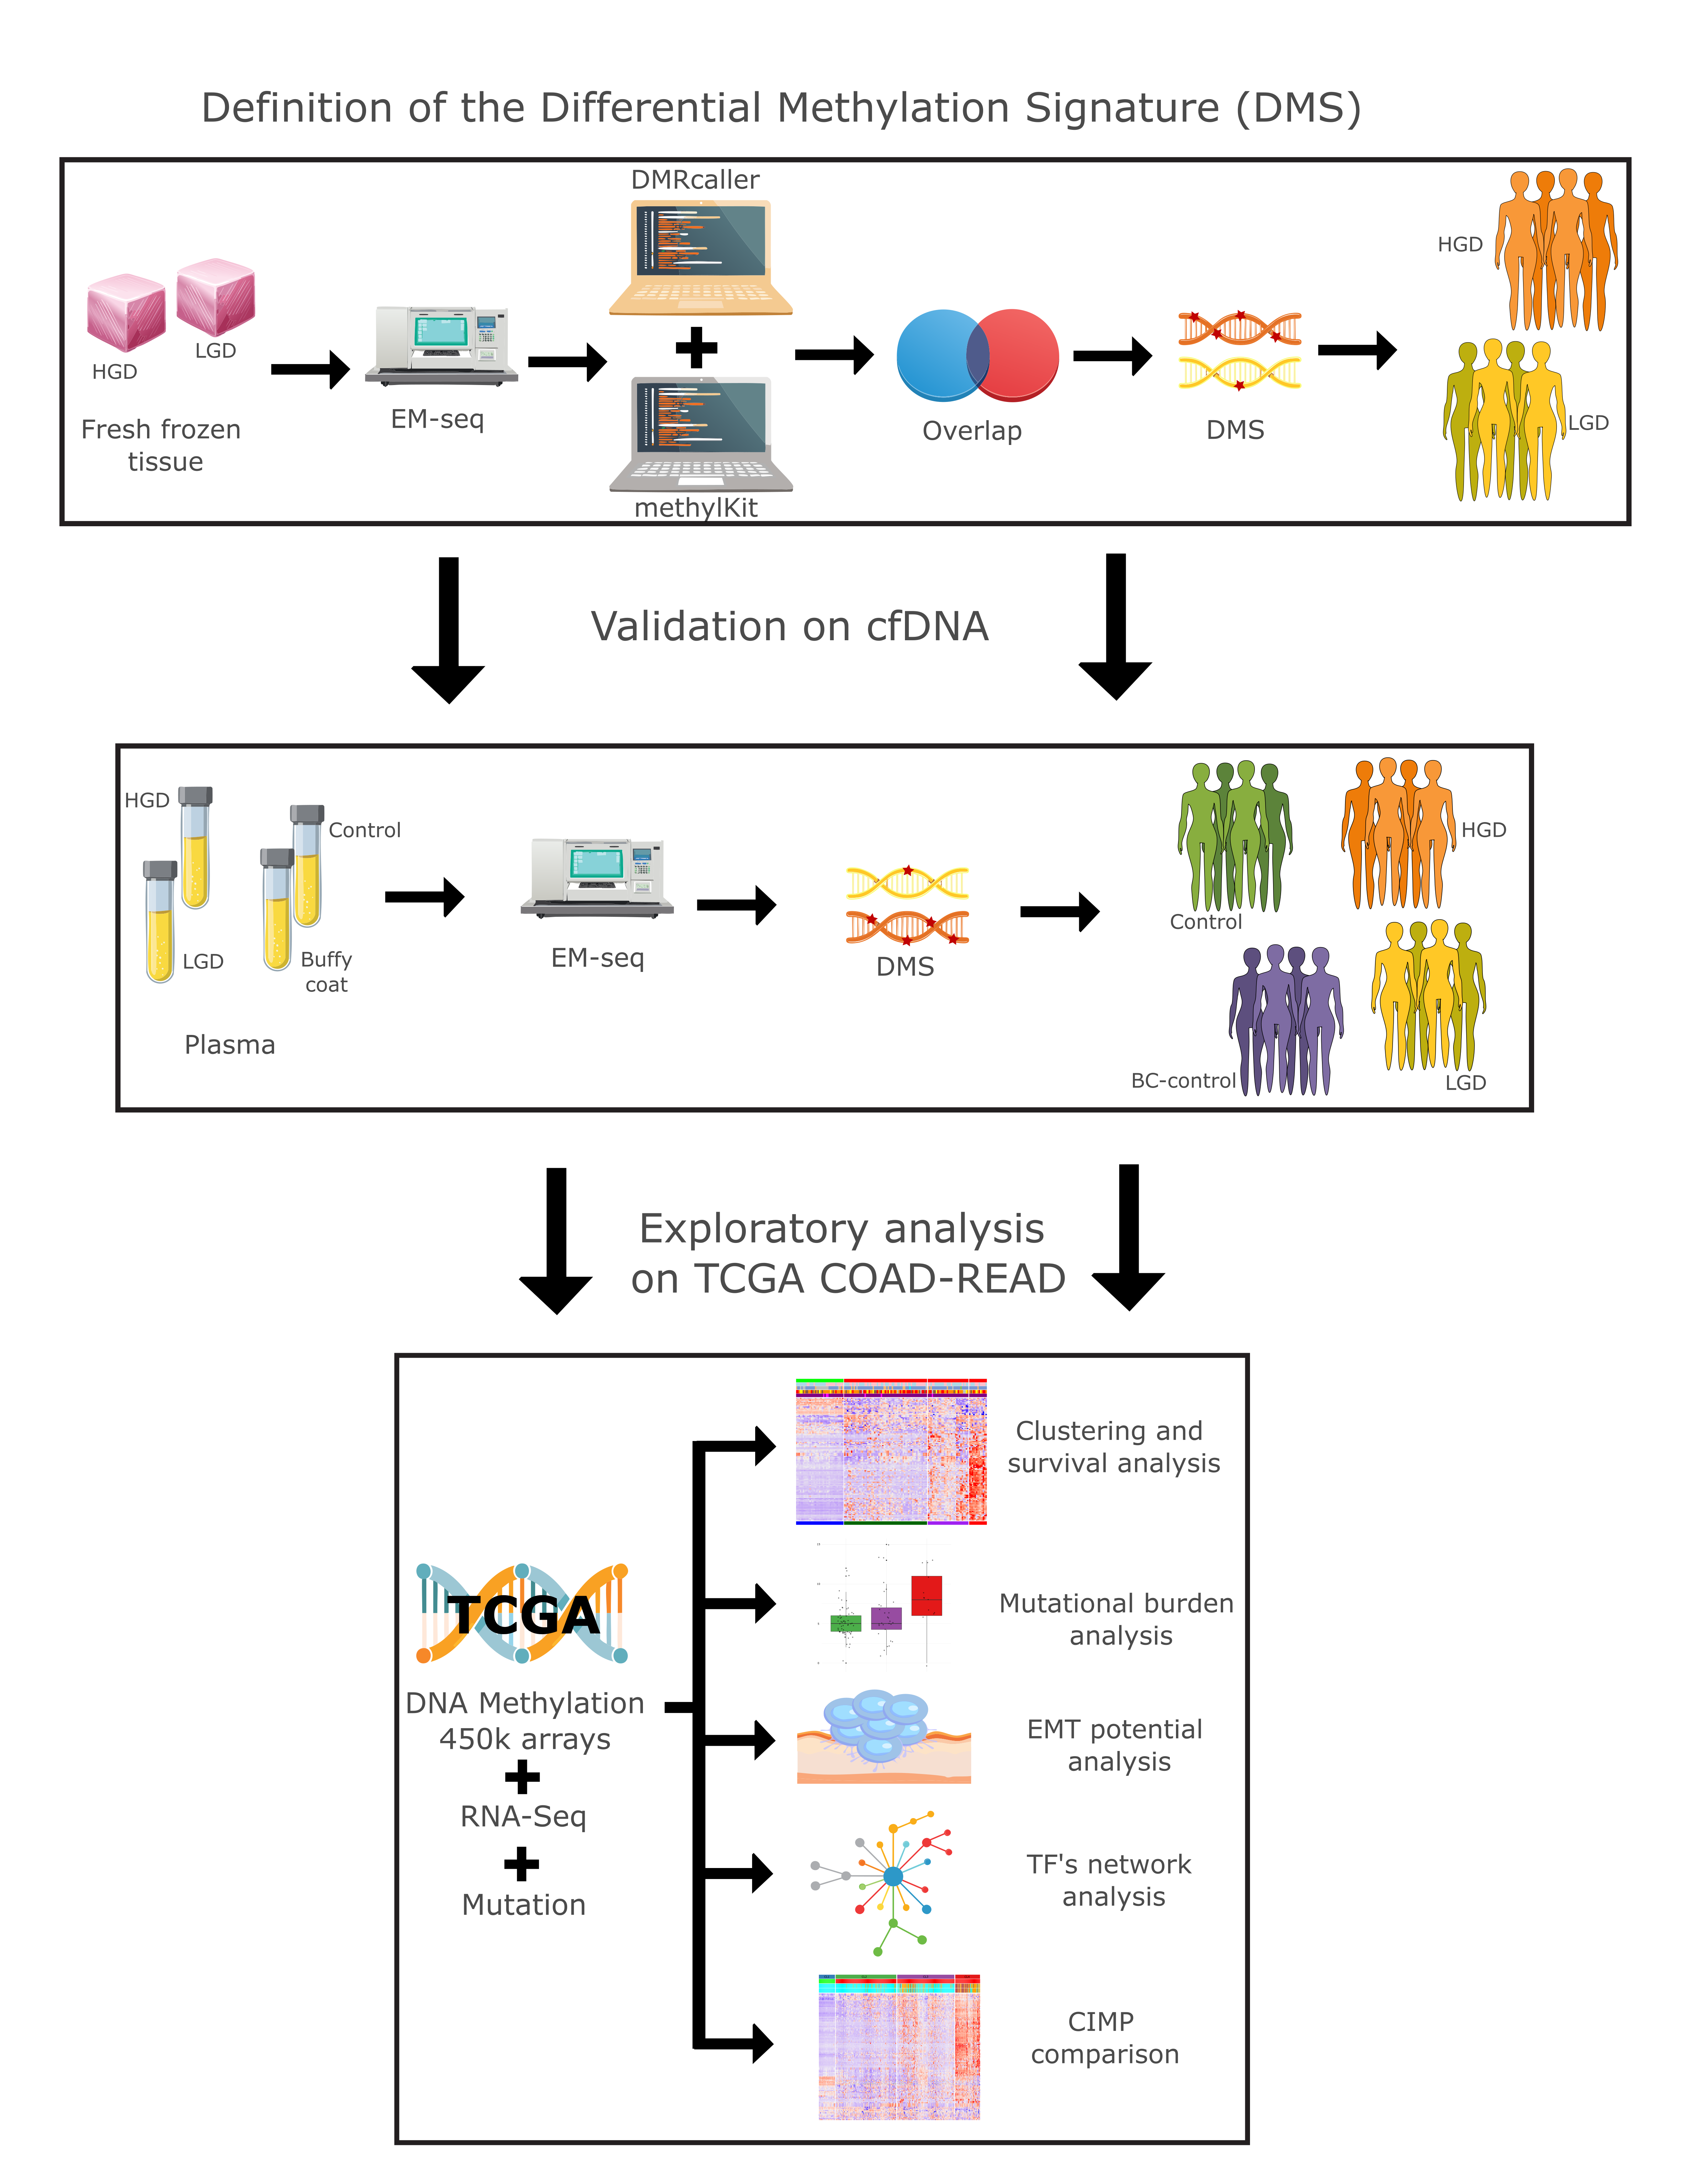
We conducted a comprehensive multiomics analysis using a three-step approach (Figure 1). In the first step, our differential methylation strategy identified 3,125 differentially methylated tiling windows using MethylKit, and 31,314 differentially methylated bins using DMRcaller. From these, 626 overlapping regions were identified, collectively constituting a differential methylation signature (DMS). DMS displayed methylation patterns that effectively distinguished high-grade dysplasia (HGD) from low-grade dysplasia (LGD) in both tissue and plasma samples.
2.1. Methylation Differences Between HGD and LGD Stratifies Dysplasia in Tissue and Plasma
Differentially methylated regions (DMRs) between HGD and LGD showed distinct epigenetic landscapes associated with lesion severity (Figure 2a). HGD hypermethylated DMRs were enriched in regulatory genomic regions, including enhancers, promoters, 5′ UTRs, exons, CpG islands, and shores. In contrast, HGD hypomethylated regions were predominantly located in the intronic, upstream (1–5 kb), and intergenic regions (Figure 2b). This distribution pattern suggests that methylation changes target gene regulatory elements as dysplasia progresses.
Principal component analysis (PCA) based on the Differential Methylation Signature (DMS) separated AA tissue samples by dysplasia grade, confirming the signature’s capacity to capture transformation-related epigenetic alterations (Figure 2c). A similar separation was observed in plasma-derived cfDNA AA samples, where the DMS-based analysis separated the LGD and HGD cases. Additionally, DMS distinguished AA plasma samples from healthy patient plasma and control buffy coat samples (Figure 2d). This indicates that cfDNA methylation profiles reflect the underlying tissue changes and hold potential as noninvasive markers for tracking dysplasia progression.
2.2. Functional Enrichment Analysis
Gene Ontology (GO) and pathway enrichment analyses revealed distinct biological processes enriched in HGD and LGD (Figure 3). Hypermethylated HGD DMRs were enriched in pathways associated with DNA-binding transcription factors, tissue morphogenesis, and the regulatory networks involved in cellular transformation (Figure 3a). On the other hand, hypomethylated DMRs revealed transcription factors associated with alternative mechanisms of early neoplastic progression (Figure 3b). These results further reinforce the notion that epigenetic alterations influence key biological processes underlying the progression of colorectal dysplasia.
2.3. Methylation-Based Tumor Stratification and Clinical Implications
Unsupervised hierarchical clustering of TCGA COAD-READ dataset using the DMS signature identified four distinct clusters (CLs): CL1 (normal samples) and three unique tumor subtypes (CL2, CL3, and CL4) (Figure 4a). PCA confirmed CL4 to be the most epigenetically divergent from normal tissue, whereas CL2 and CL3 displayed intermediate profiles (Figure 4b).
These findings illustrate a continuum of progressive hypermethylation across the clusters: CL4 exhibits the highest degree of hypermethylation, followed by CL3 and CL2 with intermediate levels, culminating in CL1 (normal), which shows the lowest methylation levels (basal methylation).
This methylation continuum is strongly correlated with clinical outcomes. Kaplan-Meier survival analysis revealed that CL4 correlated with a significantly poorer prognosis relative to CL2, indicating that extensive hypermethylation in CL4 is associated with more aggressive tumor phenotypes (Figure 4c).
Consistent with its poor survival outcomes, CL4 also exhibited the highest mutation burden, reinforcing the link between epigenetic dysregulation, genomic instability, and tumor aggressiveness (Figure 4d).
Interestingly, an inverse trend emerged in the EMTes analysis compared to the methylation pattern. Epithelial-mesenchymal transition–related genes (ITGB1, VIM, MMP2, COL1A1, TWIST1, CTNNB1, FN1, SNAI2, ITGB6, CDH1, CDH2, MMP9, ZEB1, and FOXC2) showed the highest mean Z-score expression in CL3, moderate levels in CL2, and generally lower expression in CL4 relative to the other tumor clusters (Figure 4e).
Together, these observations underscore the prognostic value of DMS-driven clustering in colorectal cancer, offering critical insights into potential subtype stratification, invasion mechanisms, and plausible targets for therapeutic strategies.
2.4. Network-Level Insights into Transcription Factors Highlight Oncogenic and Immune Divergence Across CRC Subtypes
To elucidate the regulatory mechanisms underlying these methylation-based clusters, we performed a transcription factor (TF) network analysis. Network topology revealed distinct TF hubs and bottleneck regulators for each cluster, highlighting the unique oncogenic and immune-related pathways across CRC subtypes. In CL4, which was associated with the poorest survival, USF2, TWIST1, ZNF143, and LYL1 emerged as hubs with positive regulation of downstream targets and high bottleneck/betweenness, whereas ZBTB7A acted as a hub with negative regulation of downstream targets and similarly high network centrality (Figure 5a). Functionally, CL4 was enriched in canonical cancer pathways, including hepatocellular carcinoma, gastric cancer, small cell lung, prostate, and bladder cancers, as well as in key signaling pathways such as PI3K–Akt and AMPK (Figure 5b). Gene Ontology (GO) analysis further underscored CL4’s involvement in the reactivation of developmental pathways and regulation of cell adhesion (Figure 5c).
In CL2, the TF network identified ELF5 and ZKSCAN1 (Figure 5d) as hubs with positively regulated downstream targets, whereas PAX8, CEBPB, ZNF639, and STAT6 functioned as hubs with negatively regulated downstream targets. KEGG pathway analysis identified immuno-inflammatory signaling pathways, such as JAK–STAT, TNF, IL-17, T-cell receptor, and NF-κB (Figure 5e), while GO terms revealed enrichment for leukocyte adhesion, proliferation, and migration (Figure 5f), suggesting a pronounced immunomodulatory profile.
Finally, the CL3 TF network displayed hubs with positive downstream regulation, including KLF5, TCF4, ZBED1, ZKSCAN1, and XBP1, along with the notable non-hub ZNF384 (Figure 5g), which showed a strong downstream target expression. In contrast, ZEB2, SPI1, and CREB1 have emerged as hubs that negatively regulate their downstream targets. The KEGG enrichment in CL3 reflected a heterogeneous landscape, encompassing PI3K–Akt signaling, transcriptional misregulation in cancer, cell lineage differentiation, and inflammatory pathways such as AGE–RAGE and the intestinal immune network (Figure 5h). Biological processes were similarly diverse, with enrichment in cell adhesion, leukocyte proliferation and activation, and regulation of immune effectors (Figure 5i), collectively suggesting a distinctive immuno-oncological phenotype among tumor clusters.
Taken together, these results indicate a complex interplay between epigenetic modifications and TF-driven regulatory networks that define distinct oncogenic and immune phenotypes across CRC subtypes. This multifaceted regulation underscores the potential of integrating methylation data, network analyses, and pathway insights to refine the prognostic stratification and guide more precise therapeutic interventions.
2.5. CIMP Stratification Reveals Epigenetic Convergence with DMS-Based Clusters
To assess whether our DMS-based methylation clusters aligned with established epigenetic classifications of CRC, we first evaluated the CpG Island Methylator Phenotype (CIMP) status across TCGA COAD-READ samples. The CIMP status was derived using two canonical classification panels, Weisenberger and Ogino, based on gene-level hypermethylation relative to normal reference tissues.
In the tumor-only samples, the Weisenberger panel identified 37 (9.0%) cases as CIMP-high (CIMP-H), 111 (27.1%) as CIMP-low (CIMP-L), and 262 (63.9%) as CIMP-negative (CIMP-N). The Ogino panel, which included three additional loci, classified 31 (7.6%) samples as CIMP-H, 74 (18.0%) as CIMP-L, and 305 (74.4%) as CIMP-N. When including normal samples (labeled as CIMP-N by definition), the total sample counts increased to 455, with minimal shifts in the proportional distribution (Weisenberger: 307 CIMP-N; Ogino: 350 CIMP-N).
Integration of CIMP labels into the hierarchical clustering of DMS-defined differentially methylated regions (DMRs) revealed strong enrichment of CIMP-H samples within cluster CL4, the subgroup displaying the most extensive hypermethylation (Figure 6). Both classification panels consistently mapped CIMP-H cases predominantly to CL4, whereas clusters CL2 and CL3 largely comprised CIMP-N and CIMP-L samples. The normal samples in cluster CL2 uniformly corresponded to CIMP-N, confirming the baseline methylation status.
Notably, CL4, the most epigenetically aberrant cluster, coincided with poor clinical outcomes, highest mutation burden, and transcriptional signatures enriched in oncogenic pathways. These observations support the biological coherence of CL4 with the canonical CIMP-H phenotypes. However, the limited number of samples classified as CIMP-H by either panel (≤9%) contrasts with the broader epigenetic landscape captured by DMS. This suggests that while traditional CIMP panels identify a subset of highly methylated tumors, DMS encompasses a more comprehensive continuum of methylation dysregulation that also stratifies intermediate phenotypes such as CL2 and CL3.
Collectively, these findings underscore the ability of DMS to capture clinically relevant methylation patterns. While overlapping with the established CIMP-H category, DMS-based clustering probably revealed greater resolution across the CRC epigenomic spectrum, including early stage and intermediate methylation profiles that may not be fully captured by traditional CIMP criteria.
3. Discussion
In this study, we present a comprehensive analysis of early DNA methylation alterations in advanced colorectal adenomas and their potential clinical relevance across the full spectrum of CRC, by integrating tissue-derived and plasma cfDNA methylation profiles with TCGA methylation array datasets. Our work centers on a robust Differential Methylation Signature that not only stratifies dysplastic lesions but also delineates distinct CRC subtypes with clinical relevance.
By combining our differential methylation analysis with network theory, we suggest that early changes in normal methylation patterns associated with gene-regulatory regions could potentially serve as key determinants of CRC subtype identity, progression, and prognosis, thus providing a foundation for translating early epigenetic signatures into clinically actionable tools for early detection and risk stratification.
3.1. Early Epigenetic Dysregulation in Adenomatous Lesions
Our results demonstrated that high-grade dysplasia (HGD) exhibits a differential methylation profile compared to low-grade dysplasia (LGD), with enrichment in genomic regulatory elements. These early epigenetic changes may precede the acquisition of canonical driver mutations such as APC, KRAS, BRAF, and TP53, [21,22] and initiating transcriptional rewiring that facilitates tumorigenic progression. Functional enrichment analysis further revealed that HGD-associated methylation alterations affected genes involved in transcription factor regulation, morphogenesis, cell–cell signaling, biological processes known to be disrupted early in tumorigenesis [23].
3.2. cfDNA Reflects Tumor-Specific Methylation Changes
Importantly, our DMS also accurately stratified plasma-derived cfDNA from patients with LGD and HGD, which is different from that of controls. This indicates that tumor-specific methylation signals are detectable in the blood and probably reflect underlying tissue-level changes. Unlike current screening modalities, such as fecal-based tests or endoscopy, which can be invasive and may overlook early molecular transitions [24,25,26], methylation-based liquid biopsies have the potential to detect dysplastic changes at an earlier and more treatable stage. These findings are consistent with the growing body of evidence suggesting that liquid biopsies capture the molecular heterogeneity of solid tumors and could help guide both surveillance and treatment decisions [27,28].
3.3. Continuum of Methylation Alterations from Dysplasia to Malignancy
When applied to TCGA COAD/READ datasets, DMS stratified samples into four distinct clusters (CL1–CL4), with CL1 being normal tissue and CL4 being CRC samples displaying extensive hypermethylation. This stratification revealed a continuum of methylation alterations that mirror colorectal cancer (CRC) progression from normal epithelium through dysplasia to invasive carcinoma, suggesting that early methylation changes may persist and progressively intensify during tumor evolution [50]. Interestingly, CL4 tumors not only exhibited the highest methylation burden, but were also associated with poorer survival outcomes and a higher mutational load. Moreover, despite these aggressive molecular features, CL4 tumors demonstrated reduced expression of EMT-related genes but high embryonic signals and were positive for the PI3K-AKT proliferative pathway. This observation may reflect a tumor phenotype in which aggressiveness is driven predominantly by epigenetic dysregulation and genetic instability rather than classical EMT activation. Such a pattern aligns with emerging evidence that EMT represents a dynamic and context-dependent spectrum [29,30], rather than a binary process, and that tumor progression can follow alternative evolutionary routes [31]
3.4. Functional Pathways and TF Network Dysregulation
Transcription factor network analysis revealed a unique regulatory architecture across the tumor clusters. CL4 was enriched in oncogenic TFs (as TWIST1, USF2, and ZNF143) which are known drivers of cancer progression [32,33,34]. In contrast, CL2 and CL3 are enriched in inflammatory and immune escape mechanisms, with TFs such as STAT6, CEBPB, and XBP1, which shape their regulatory landscape [35,36,37]. These findings suggest that each methylation-based subtype is governed by distinct TF activity profiles [38], further emphasizing the heterogeneity of CRC and its underlying molecular mechanisms (Figure 7).
3.5. Comparison to Classical CIMP Subtypes
Historically, CRC has been classified into molecular subtypes that include CIMP (CpG Island Methylator Phenotype (CIMP), Microsatellite Instability (MSI), and intermediate subgroups. CIMP-positive tumors are characterized by widespread hypermethylation of CpG islands, often silencing critical tumor suppressors, such as MLH1 [39]. MSI tumors, however, display deficiencies in mismatch repair pathways, leading to an accumulation of insertion or deletion mutations in repetitive DNA sequences [40].
To assess the alignment between our DMS-based clusters and classical CRC subtypes, we evaluated the CIMP status of the samples using Weisenberger and Ogino panels. While we observed a strong enrichment of CIMP-high (CIMP-H) samples within CL4, almost 50% of the CL4 cases were classified as CIMP-L in both panels. This shows that the classical CIMP criteria overlook almost half of the tumors that our DMS signature detects on CL4, capturing a fraction of the worst prognosis and higher mutational burden tumors. Moreover, DMS revealed a wider epigenetic spectrum, stratifying tumors not only by methylation burden but also by biological behavior and a broad context.
These findings support the notion that traditional CIMP classifications, while important, represent only a part of the complexity of CRC. Integrating DMS profiling with CIMP may improve the subtype resolution and patient stratification in both research and clinical settings.
3.6. Clinical Implications and Future Directions
Our findings suggest several potential clinical implications and future directions for colorectal cancer (CRC) management. First, they may support the development of early detection strategies and risk stratification tools, as our approach shows promise for sensitively detecting dysplastic progression in cfDNA. Second, DMS-based clustering appears to improve molecular subtyping, revealing novel CRC subtypes that may extend beyond the established CIMP framework and better capture the clinically relevant heterogeneity related to prognosis, mutation burden, and immune features. Third, these insights could help inform therapeutic decision-making. For instance, the identification of highly methylated tumors (CL4) raises the possibility of targeting epigenetic regulators or employing hypomethylating agents, while immune-enriched subtypes (CL2) might be more amenable to immunotherapies, and invasive subtypes (CL3) could potentially benefit from anti-EMT approaches. Finally, DMS-based classification may eventually be integrated into clinical workflows as a complementary tool alongside histopathological and genetic diagnostics, contributing to more refined patient stratification and precision oncology.
3.7. Limitations
While this study offers compelling evidence for the role of early methylation alterations occurring in AA that potentially impact CRC progression and subtype stratification, several limitations must be acknowledged. The sample size for tissue-based dysplasia analysis, particularly for HGD, remains modest. Future studies involving larger and more diverse cohorts are essential to validate these findings and enhance their generalizability.
Although DMS-based stratification showed strong concordance with CIMP-H phenotypes, classical CIMP panels failed to capture the full breadth of methylation diversity identified by our signature. This underscores the need for benchmarking and harmonizing epigenetic classification schemes. Additionally, although cfDNA methylation profiling has demonstrated translational promise, further optimization and standardization of pre-analytical workflows are essential for clinical implementation.
Finally, the mechanistic validation of TF networks and downstream targets is critical for establishing causality and therapeutic potential.
4. Materials and Methods
4.1. Samples Preparation and Whole-Genome EM-Seq
A total of 73 AA tissue samples were included in this study. Fifteen fresh-frozen (FF) specimens were obtained from the Indivumed Biobank repository (Hamburg, Germany), while 58 blood samples were collected as part of a prospective multicenter study conducted in Spain, Germany, and Ukraine.
For the initial differential methylation analysis, nine HGD and six LGD AA tissue samples were selected. Subsequently, for cfDNA analysis, a separate cohort of 30 AA cases (26 LGD and 4 HGD) and 28 control samples (10 healthy plasma and 18 buffy coat samples) were examined to verify whether the identified tissue-specific differential methylation was also detectable in cfDNA and remained tumor-specific. The detailed sample characteristics are presented in Table S1.
Genomic DNA was extracted from buffy coat and FF tissue using the Qiagen DNeasy Blood and Tissue Kit (Qiagen, Valencia, CA, USA), following the manufacturer’s protocol. Cell-free DNA (cfDNA) extraction from plasma was performed using the Mag-Bind cfDNA Kit (Omega Bio-Tek, USA) according to the manufacturer’s instructions. Subsequently, DNA from each sample was used for library preparation, with artificial spike-in controls from the Premium RRBS kit V2 (Diagenode, Belgium), which was used to monitor enzymatic conversion efficiency following the manufacturer’s instructions.
Library preparation and conversion were carried out using the NEBNext Enzymatic Methyl-seq (EM-seq) Kit (New England Biolabs). EM-seq adaptors were ligated to the processed DNA and enzymatic conversion was performed using TET2 and an oxidation enhancer, followed by APOBEC-mediated deamination. After conversion, indexing and amplification PCR were conducted using NEBNext Q5U Master Mix (New England Biolabs).
The prepared libraries were sequenced using a NovaSeq 6000 (Illumina, San Diego, CA, USA) with paired-end sequencing (2 × 150 bp) to an average depth of 24×.
4.2. Sequence QC and DNA Methylation Analysis
Quality checks and trimming were performed using FastQC [41] TrimGalore v0.4.5 (a wrapper tool around Cutadapt [42], which removed adapter sequences and poor-quality bases and reads).
The remaining high-quality reads (average Phred score > 35) (Table S2) were aligned to a bisulfite-converted human genome (Ensembl 91 assembly, hg38) using the Bismark Bisulfite Read Mapper (v0.20.0) [43].
Methylation calls for every C analyzed were performed using the Bismark methylation_extractor script. For each CpG, the beta values (β) were calculated as:
where CGmethylated is the number of methylated cytosines, and (CGmethylated + CGunmethylated) is the sum of methylated and unmethylated cytosines (total number of reads) at that position.
β = CGmethylated / (CGmethylated + CGunmethylated)
Differential methylation analysis (DMA) was conducted in two sequential steps to ensure robustness and accuracy. First, differentially methylated regions (DMRs) were identified using two independent bioinformatics pipelines: DMRcaller [44] and MethylKit [45] R packages. Bismark cytosine reports aligned to the UCSC hg38 reference genome from HGD and LGD tissue samples were used for analysis.
For DMRcaller, parameters were set as follows: context = "GC", proportion = "true", p-value threshold = 0.01, minimum cytosine count = 4, and minimum reads per cytosine = 4. Genomic bins of 100 bp with a 100 bp step size were generated, and methylation levels were summarized within these bins.
For MethylKit, the context was set to "CpG", with a minimum coverage of 4. Tiling windows of 1000 bp with a 1000 bp step size were generated, and methylation levels were summarized within these tiles. A logistic regression model was applied for differential analysis, using a q-value cutoff of 0.01 and a methylation cutoff of 25%, incorporating biological sex as a covariate.
To enhance the biological relevance and minimize algorithmic artifacts, the intersection of the results from both pipelines was selected, defining these regions as the differentially methylated signature (DMS).
Principal Component Analysis (PCA) was performed using beta values from differentially methylated regions (DMRs) to visualize methylation cluster separation in a reduced-dimensional space. Analysis was conducted using the FactoMineR package [46]. The samples were color-coded according to their cluster assignment, and confidence ellipses were added to highlight the cluster boundaries.
4.3. Integration of TCGA Multimodal Data and Analysis
To extend the analysis to The Cancer Genome Atlas (TCGA) colorectal adenocarcinoma (COAD) and rectum adenocarcinoma (READ) datasets [47], a bin-based approach was used to summarize the DNA methylation data. Methylation probes from TCGA were aggregated into genomic bins based on their genomic coordinates using the UCSC hg38 genome built using TCGAbiolinks [48]. The mean methylation levels were calculated for all CpG probes within each bin. Bins lacking valid methylation data were excluded from analysis. This preprocessing step produced a bin-level methylation matrix, enabling integration with additional data types, such as gene expression and mutation data.
Gene expression data were linked to methylation bins by identifying genes within 5 kb of each bin using the UCSC-known gene database. The gene identifiers were converted into gene symbols to ensure consistency. The somatic mutation data were processed to create a binary mutation matrix for the 20 most frequently mutated genes in the dataset. Samples were classified as mutated (1) or wild-type (0) for each gene, and sample identifiers were standardized across the methylation, gene expression, and mutation datasets.
Differential methylation between TCGA samples was performed at the bin level. Bins were classified based on their methylation differences between LGA and HGA, based on the original dysplasia signature. Specifically, bins were labeled as hypermethylated in HGA if the methylation difference was more than 20%, hypomethylated if the difference was less than 20%, or unchanged. Bins were linked to nearby genes, facilitating downstream functional analyses.
The final bin-level methylation matrix underwent hierarchical clustering using Euclidean distance and Ward’s method to identify methylation-based clusters. Missing data was excluded and the matrix scaled and centered. Clustering results were visualized using ComplexHeatmap [49], to define sample and genomic region clusters.
4.4. Clinical Analysis and Epithelial-Mesenchymal Transition Expression Signature (EMTes)
The mutation burden, calculated as the total number of mutations per sample, was analyzed across the methylation-based clusters. Statistical comparisons were performed using the Kruskal-Wallis test for overall differences and post-hoc Wilcoxon rank-sum tests with Benjamini-Hochberg corrections for pairwise comparisons (p < 0.05).
Kaplan–Meier survival analysis was performed to evaluate patient survival outcomes. Log-rank tests using the R package Survminer [50] were utilized to compare survival distributions among different methylation clusters, excluding normal samples (CL1). The analysis was restricted to primary tumor samples, and survival times were truncated at 1000 days, focusing on near-term prognosis, with right-censoring applied for patients still alive at this limit.
Pairwise survival comparisons were performed between selected clusters (CL2 vs. CL3, CL2 vs. CL4, and CL3 vs. CL4) to assess the differences in survival distributions. Kaplan–Meier plots with log-rank p-values, confidence intervals, and risk tables were generated to visualize survival trends between clusters.
Additionally, an overall survival analysis was performed across all tumor-associated clusters, with survival curves estimated using the Kaplan–Meier method. This allowed for a clear comparison of the survival probabilities among the different methylation-based groups.
The EMTes panel comprised 19 genes with well-established participation in epithelial-to-mesenchymal transition (ITGB1, VIM, MMP2, COL1A1, TWIST1, CTNNB1, SNAI1, FN1, SNAI2, TGFB1, ITGB6, SOX10, CDH1, CDH2, MMP9, TWIST2, ZEB1, ZEB2, and FOXC2). These genes have been consistently implicated in processes that underlie EMT, such as cell adhesion, extracellular matrix remodeling, and transcriptional regulation [51]. Transcriptome data from TCGA was first log-transformed (if not already in log scale). For each gene across all the samples in the dataset, we computed the mean and standard deviation of its expression. Each sample’s expression value for a given gene was then converted to a z-score as follows:
where xi is the expression value for the gene in the ith sample and μ and σ are the mean and standard deviation for that gene across the entire cohort, respectively. These z-scores were used to calculate the EMT score per sample by averaging the z-scores of the EMTes genes.
z=(xi−μ)/σ
Subsequently, EMT scores were compared across methylation-based clusters using the non-parametric Kruskal-Wallis test to assess global differences. Pairwise comparisons between clusters were performed using the Wilcoxon rank-sum test. Unless otherwise noted, p-values < 0.05 were considered statistically significant for all analyses.
4.5. Transcription Factor Network and Functional Enrichment Analysis
Transcription factor (TF) activity was inferred using DoRothEA [52] regulons and VIPER [53] R packages, based on matching regulon target genes expressed per cluster. Networks were constructed based on correlation thresholds (0.4) and centrality metrics (degree, betweenness, and closeness) were computed to identify hub TFs. The results were visualized using Cytoscape [54] to highlight cluster-specific TF activity. All transcription factors identified through this analytical pipeline are supported by biologically validated interactions, as established in experimental studies conducted in diverse biological contexts [55,56,57,58].
Nearby genes linked to differentially methylated bins were subjected to enrichment analyses. Gene Ontology (GO) terms and KEGG pathways were identified using enrichGO and enrichKEGG, with Benjamini-Hochberg adjustments for multiple comparisons (p-value < 0.05). Gene Set Enrichment Analysis (GSEA) was conducted using cluster-associated genes to explore functional relationships. All analyses were performed using the clusterProfiler package [59].
4.6. CIMP Phenotype Calculation
To assess CpG Island Methylator Phenotype (CIMP) status, we utilized the complete COAD/READ-TCGA DNA methylation dataset, incorporating β-values derived from 455 CRC and normal tissue samples. Each genomic region was characterized by CpG site coverage and magnitude of methylation differences relative to normal tissues.
The CIMP status was determined using two widely accepted panels. The Weisenberger panel included five genes (CACNA1G, IGF2, NEUROG1, RUNX3, and SOCS1) [60], while the Ogino panel expanded this set with three additional genes (CDKN2A, MLH1, and CRABP1) [61]. Gene-level hypermethylation was defined by applying a Z-score transformation to the β-values relative to the normal tissue reference methylation levels on the associated probes. A gene was considered methylated if at least one-third of its associated probes exceeded the Z-score threshold of ≥ 3.
Subsequently, samples were classified into CIMP subtypes based on the number of hypermethylated genes. For the Weisenberger method, CIMP-high (CIMP-H) was defined as of more or equal to 3 methylated genes, CIMP-low (CIMP-L) as 2 methylated genes, and non-CIMP (CIMP-N) if 2 or less. Using the Ogino criteria, CIMP-H was defined as ≥ 5 methylated genes, CIMP-L as 3–4, and CIMP-N as < 3.
Concurrently, we performed regional methylation analysis to identify differentially methylated regions (DMRs) between the tumor and normal samples. Regions exhibiting a mean β-value difference of >20% were designated as hypermethylated (gain), whereas those with <−20% were considered hypomethylated (loss). Regions with differences within ±20% were classified as unchanged. To ensure data quality, regions and samples with >50% of missing values were excluded. The remaining methylation matrix was Z-score-normalized across regions (row-wise), enabling hierarchical clustering using Euclidean distance and Ward’s linkage. This approach facilitates the delineation of distinct methylation-driven subgroups.
Finally, the CIMP status and other relevant annotations were integrated into a heatmap visualization for comparative analysis, as described previously.
5. Conclusions
This study presents a comprehensive analysis of early DNA methylation changes in advanced adenomas, identifying a differential methylation signature (DMS) in tissues that effectively stratifies dysplasia grades. The DMS demonstrated strong performance in plasma-derived cfDNA, underscoring its potential for noninvasive early detection.
When applied to the CRC-TCGA dataset, DMS defined four methylation-based clusters (CL1–CL4), capturing a continuum of epigenetic disruption and distinguishing clinically relevant tumor subtypes. CL4 is characterized by extensive hypermethylation, poor prognosis, and high mutation burden. While overlapping with classical CIMP-high classifications, DMS also identified tumors in intermediate clusters not captured by traditional panels, suggesting broader epigenetic heterogeneity than previously recognized.
These results support the integration of data-driven methylation profiling into current molecular classification frameworks such as CIMP. This approach may improve the risk stratification and inform targeted therapeutic strategies. Future efforts should focus on validating these findings in larger cohorts, optimizing cfDNA assays for clinical use, and further dissecting the regulatory networks underlying DMS-defined subtypes.
Supplementary Materials
The following supporting information can be downloaded at the website of this paper posted on Preprints.org, Table S1: Description of the samples included in the study; Table S2: Data quality metrics per sample.
Author Contributions
Conceptualization, J.C.H.-A., F.M.M., and A.B.; methodology, J.C.H.-A. and F.M.M.; software, J.C.H.-A.; validation, J.C.H.-A.; formal analysis, J.C.H.-A. and F.M.M.; resources, P.C.-N. and K.K.; data curation, J.C.H.-A. and F.M.M.; original draft preparation, J.C.H.-A.; review and editing, J.C.H.-A., F.M.M., P.C.-N., K.K., and A.B.; visualization, J.C.H.-A.; supervision, P.C.-N., K.K., and A.B.; project administration, P.C.-N. and K.K.; funding acquisition: K.K. All authors have read and agreed to the published version of the manuscript.
Funding
This research was funded by UniversalDx S.A.
Institutional Review Board Statement
The study was conducted in accordance with the Declaration of Helsinki and complied with all the relevant ethical regulations. Plasma samples were approved by the followed Institutional Review Boards (IRB): CEIC Hospital Clínico Universitario Lozano Blesa, Comité de Ética de la Investigación con Medicamentos Parc de Salut Mar, Fundacion Asistencial Mutua Terrasa Hospital Universitario Principe de Asturias, Complejo Hospitalario de Torrecardenas, Hospital Universitario Virgen del Rocío y Hospital Macarena, Complejo Hospitalario de Navarra, Germans Trias i Pujol, Hospital Universitario Virgen de Valme, The Ethics Commission of Kyiv City Clinical Oncology Centre, The Local Ethics Commission of Communal Institution Kyiv Regional Council, and Ethik-Kommission der Ärztekammer Hamburg. Frozen tissue samples were acquired from the Indivumed Biobank repository with valid IRB approval.
Informed Consent Statement
Informed consent was obtained from all subjects involved in the study.
Data Availability Statement
The data presented in this study are available upon reasonable request from the corresponding author.
Acknowledgments
Not applicable
Conflicts of Interest
F.M.M., J.C.H.-A. and P.C.-N. are employees of Universal Diagnostics S.A., K.K. and A.B. are employees of UniversalDx d.o.o. The funders had no role in the study design; collection, analyses, or interpretation of data; writing of the manuscript; or decision to publish the results.
Abbreviations
The following abbreviations are used in this manuscript:
| CRC | Colorectal cancer |
| HGD | High-grade dysplasia |
| LGD | Low-grade dysplasia |
| DMS | Differential methylation signature |
| TCGA | The Cancer Genome Atlas |
| cfDNA | Cell free DNA |
| EM-seq | Enzymatic methyl sequencing |
| TF | Transcription factor |
| EMT | epithelial-mesenchymal transition |
| CIMP | CpG island methylator phenotype |
References
- Bray, F.; Laversanne, M.; Sung, H.; Ferlay, J.; Siegel, R.L.; Soerjomataram, I.; Jemal, A. Global Cancer Statistics 2022: GLOBOCAN Estimates of Incidence and Mortality Worldwide for 36 Cancers in 185 Countries. CA. Cancer J. Clin. 2024, 74, 229–263. [CrossRef]
- Dunne, P.D.; Arends, M.J. Molecular Pathological Classification of Colorectal Cancer—an Update. Virchows Arch. 2024, 484, 273–285. [CrossRef]
- Hajebi Khaniki, S.; Shokoohi, F.; Esmaily, H.; Kerachian, M.A. Analyzing Aberrant DNA Methylation in Colorectal Cancer Uncovered Intangible Heterogeneity of Gene Effects in the Survival Time of Patients. Sci. Rep. 2023, 13, 22104–22104. [CrossRef]
- Yuan, T.; Wankhede, D.; Edelmann, D.; Kather, J.N.; Tagscherer, K.E.; Roth, W.; Bewerunge-Hudler, M.; Brobeil, A.; Kloor, M.; Bläker, H.; et al. Large-Scale External Validation and Meta-Analysis of Gene Methylation Biomarkers in Tumor Tissue for Colorectal Cancer Prognosis. eBioMedicine 2024, 105, 105223–105223. [CrossRef]
- Galuppini, F.; Fassan, M.; Mastracci, L.; Gafà, R.; Lo Mele, M.; Lazzi, S.; Remo, A.; Parente, P.; D’Amuri, A.; Mescoli, C.; et al. The Histomorphological and Molecular Landscape of Colorectal Adenomas and Serrated Lesions. Pathologica 2021, 113, 218–229. [CrossRef]
- Jung, G.; Hernández-Illán, E.; Moreira, L.; Balaguer, F.; Goel, A. Epigenetics of Colorectal Cancer: Biomarker and Therapeutic Potential. Nat. Rev. Gastroenterol. Hepatol. 2020, 17, 111–130. [CrossRef]
- Fan, J.; Li, J.; Guo, S.; Tao, C.; Zhang, H.; Wang, W.; Zhang, Y.; Zhang, D.; Ding, S.; Zeng, C. Genome-Wide DNA Methylation Profiles of Low- and High-Grade Adenoma Reveals Potential Biomarkers for Early Detection of Colorectal Carcinoma. Clin. Epigenetics 2020, 12, 56. [CrossRef]
- Zhang, W.; Xu, T.-T.; An, Z.-T.; Wei, L.-F.; Gu, C.; Li, H.; Tian, Y.-Z. CCDC68 Predicts Poor Prognosis in Patients with Colorectal Cancer: A Study Based on TCGA Data. J. Gastrointest. Oncol. 2022, 13, 657–671. [CrossRef]
- Zhang, H.; Zhuo, C.; Lin, R.; Ke, F.; Wang, M.; Yang, C. Identification and Verification of Key Genes in Colorectal Cancer Liver Metastases Through Analysis of Single-Cell Sequencing Data and TCGA Data. Ann. Surg. Oncol. 2024, 31, 8664–8679. [CrossRef]
- Shi, W.; Li, X.; Su, X.; Wen, H.; Chen, T.; Wu, H.; Liu, M. The Role of Multiple Metabolic Genes in Predicting the Overall Survival of Colorectal Cancer: A Study Based on TCGA and GEO Databases. PLOS ONE 2021, 16, e0251323. [CrossRef]
- Xie, Y.-H.; Chen, Y.-X.; Fang, J.-Y. Comprehensive Review of Targeted Therapy for Colorectal Cancer. Signal Transduct. Target. Ther. 2020, 5, 22–22. [CrossRef]
- Yang, G.; Yu, X. (Richard); Weisenberger, D.J.; Lu, T.; Liang, G. A Multi-Omics Overview of Colorectal Cancer to Address Mechanisms of Disease, Metastasis, Patient Disparities and Outcomes. Cancers 2023, 15, 2934. [CrossRef]
- Mo, S.; Dai, W.; Wang, H.; Lan, X.; Ma, C.; Su, Z.; Xiang, W.; Han, L.; Luo, W.; Zhang, L.; et al. Early Detection and Prognosis Prediction for Colorectal Cancer by Circulating Tumour DNA Methylation Haplotypes: A Multicentre Cohort Study. eClinicalMedicine 2022, 55, 101717–101717. [CrossRef]
- Shi, M.; Tsui, S.K.-W.; Wu, H.; Wei, Y. Pan-Cancer Analysis of Differential DNA Methylation Patterns. BMC Med. Genomics 2020, 13, 154–154. [CrossRef]
- Dang, T.; Guan, X.; Cui, L.; Ruan, Y.; Chen, Z.; Zou, H.; Lan, Y.; Liu, C.; Zhang, Y. Epigenetics and Immunotherapy in Colorectal Cancer: Progress and Promise. Clin. Epigenetics 2024, 16, 123–123. [CrossRef]
- N Kalimuthu, S.; Wilson, G.W.; Grant, R.C.; Seto, M.; O’Kane, G.; Vajpeyi, R.; Notta, F.; Gallinger, S.; Chetty, R. Morphological Classification of Pancreatic Ductal Adenocarcinoma That Predicts Molecular Subtypes and Correlates with Clinical Outcome. Gut 2020, 69, 317–328. [CrossRef]
- Besselink, N.; Keijer, J.; Vermeulen, C.; Boymans, S.; de Ridder, J.; van Hoeck, A.; Cuppen, E.; Kuijk, E. The Genome-Wide Mutational Consequences of DNA Hypomethylation. Sci. Rep. 2023, 13, 6874–6874. [CrossRef]
- Edrei, Y.; Levy, R.; Kaye, D.; Marom, A.; Radlwimmer, B.; Hellman, A. Methylation-Directed Regulatory Networks Determine Enhancing and Silencing of Mutation Disease Driver Genes and Explain Inter-Patient Expression Variation. Genome Biol. 2023, 24, 264–264. [CrossRef]
- Talukdar, P.D.; Chatterji, U. Transcriptional Co-Activators: Emerging Roles in Signaling Pathways and Potential Therapeutic Targets for Diseases. Signal Transduct. Target. Ther. 2023, 8, 427–427. [CrossRef]
- Becker, W.R.; Nevins, S.A.; Chen, D.C.; Chiu, R.; Horning, A.M.; Guha, T.K.; Laquindanum, R.; Mills, M.; Chaib, H.; Ladabaum, U.; et al. Single-Cell Analyses Define a Continuum of Cell State and Composition Changes in the Malignant Transformation of Polyps to Colorectal Cancer. Nat. Genet. 2022, 54, 985–995. [CrossRef]
- Dobre, M.; Salvi, A.; Pelisenco, I.A.; Vasilescu, F.; De Petro, G.; Herlea, V.; Milanesi, E. Crosstalk Between DNA Methylation and Gene Mutations in Colorectal Cancer. Front. Oncol. 2021, 11. [CrossRef]
- Bagci, B.; Sari, M.; Karadayi, K.; Turan, M.; Ozdemir, O.; Bagci, G. KRAS, BRAF Oncogene Mutations and Tissue Specific Promoter Hypermethylation of Tumor Suppressor SFRP2, DAPK1, MGMT, HIC1 and P16 Genes in Colorectal Cancer Patients. Cancer Biomark. 2016, 17, 133–143. [CrossRef]
- AlMusawi, S.; Ahmed, M.; Nateri, A.S. Understanding Cell-cell Communication and Signaling in the Colorectal Cancer Microenvironment. Clin. Transl. Med. 2021, 11, e308. [CrossRef]
- Argilés, G.; Tabernero, J.; Labianca, R.; Hochhauser, D.; Salazar, R.; Iveson, T.; Laurent-Puig, P.; Quirke, P.; Yoshino, T.; Taieb, J.; et al. Localised Colon Cancer: ESMO Clinical Practice Guidelines for Diagnosis, Treatment and Follow-Up. Ann. Oncol. 2020, 31, 1291–1305. [CrossRef]
- Zhao, S.; Wang, S.; Pan, P.; Xia, T.; Chang, X.; Yang, X.; Guo, L.; Meng, Q.; Yang, F.; Qian, W.; et al. Magnitude, Risk Factors, and Factors Associated With Adenoma Miss Rate of Tandem Colonoscopy: A Systematic Review and Meta-Analysis. Gastroenterology 2019, 156, 1661-1674.e11. [CrossRef]
- Cross, A.J.; Wooldrage, K.; Robbins, E.C.; Kralj-Hans, I.; MacRae, E.; Piggott, C.; Stenson, I.; Prendergast, A.; Patel, B.; Pack, K.; et al. Faecal Immunochemical Tests (FIT) versus Colonoscopy for Surveillance after Screening and Polypectomy: A Diagnostic Accuracy and Cost-Effectiveness Study. Gut 2019, 68, 1642–1652. [CrossRef]
- Lonardi, S.; Pietrantonio, F.; Tarazona Llavero, N.; Montagut Viladot, C.; Sartore Bianchi, A.; Zampino, M.G.; Elez Fernandez, M.E.; Santos Vivas, C.; Mandalà, M.; Tamberi, S.; et al. LBA28 The PEGASUS Trial: Post-Surgical Liquid Biopsy-Guided Treatment of Stage III and High-Risk Stage II Colon Cancer Patients. Ann. Oncol. 2023, 34, S1268–S1269. [CrossRef]
- Slater, S.; Bryant, A.; Aresu, M.; Begum, R.; Chen, H.-C.; Peckitt, C.; Lazaro-Alcausi, R.; Carter, P.; Anandappa, G.; Khakoo, S.; et al. Tissue-Free Liquid Biopsies Combining Genomic and Methylation Signals for Minimal Residual Disease Detection in Patients with Early Colorectal Cancer from the UK TRACC Part B Study. Clin. Cancer Res. 2024, 30, 3459–3469. [CrossRef]
- Craene, B.D.; Berx, G. Regulatory Networks Defining EMT during Cancer Initiation and Progression. Nat. Rev. Cancer 2013, 13, 97–110. [CrossRef]
- Pal, A.; Barrett, T.F.; Paolini, R.; Parikh, A.; Puram, S.V. Partial EMT in Head and Neck Cancer Biology: A Spectrum Instead of a Switch. Oncogene 2021, 40, 5049–5065. [CrossRef]
- Brabletz, S.; Schuhwerk, H.; Brabletz, T.; Stemmler, M.P. Dynamic EMT: A Multi-tool for Tumor Progression. EMBO J. 2021, 40. [CrossRef]
- Yu, X.; He, T.; Tong, Z.; Liao, L.; Huang, S.; Fakhouri, W.D.; Edwards, D.P.; Xu, J. Molecular Mechanisms of TWIST1-regulated Transcription in EMT and Cancer Metastasis. EMBO Rep. 2023, 24. [CrossRef]
- Li, X.; Liu, Y.; Liu, S.; Chen, N. USF2-Mediated Transcription of BZW2 Contributes to CRC Malignant Progression by Affecting LAMP3. J. Gene Med. 2025, 27. [CrossRef]
- Izumi, H.; Wakasugi, T.; Shimajiri, S.; Tanimoto, A.; Sasaguri, Y.; Kashiwagi, E.; Yasuniwa, Y.; Akiyama, M.; Han, B.; Wu, Y.; et al. Role of ZNF143 in Tumor Growth through Transcriptional Regulation of DNA Replication and Cell-cycle-associated Genes. Cancer Sci. 2010, 101, 2538–2545. [CrossRef]
- Delgado-Ramirez, Y.; Ocaña-Soriano, A.; Ledesma-Soto, Y.; Olguín, J.E.; Hernandez-Ruiz, J.; Terrazas, L.I.; Leon-Cabrera, S. STAT6 Is Critical for the Induction of Regulatory T Cells In Vivo Controlling the Initial Steps of Colitis-Associated Cancer. Int. J. Mol. Sci. 2021, 22, 4049–4049. [CrossRef]
- Ma, Y.; Chen, Y.; Zhan, L.; Dong, Q.; Wang, Y.; Li, X.; He, L.; Zhang, J. CEBPB-Mediated Upregulation of SERPINA1 Promotes Colorectal Cancer Progression by Enhancing STAT3 Signaling. Cell Death Discov. 2024, 10, 219–219. [CrossRef]
- Zhao, Y.; Zhang, W.; Huo, M.; Wang, P.; Liu, X.; Wang, Y.; Li, Y.; Zhou, Z.; Xu, N.; Zhu, H. XBP1 Regulates the Protumoral Function of Tumor-Associated Macrophages in Human Colorectal Cancer. Signal Transduct. Target. Ther. 2021, 6, 357–357. [CrossRef]
- Chan, D.K.H.; Buczacki, S.J.A. Tumour Heterogeneity and Evolutionary Dynamics in Colorectal Cancer. Oncogenesis 2021, 10, 53–53. [CrossRef]
- Nazemalhosseini Mojarad, E.; Kuppen, P.J.; Aghdaei, H.A.; Zali, M.R. The CpG Island Methylator Phenotype (CIMP) in Colorectal Cancer. Gastroenterol. Hepatol. Bed Bench 2013, 6, 120–128.
- Flecchia, C.; Zaanan, A.; Lahlou, W.; Basile, D.; Broudin, C.; Gallois, C.; Pilla, L.; Karoui, M.; Manceau, G.; Taieb, J. MSI Colorectal Cancer, All You Need to Know. Clin. Res. Hepatol. Gastroenterol. 2022, 46, 101983–101983. [CrossRef]
- Andrews, S. FastQC: A Quality Control Tool for High Throughput Sequence Data. 2023.
- Martin, M. Cutadapt Removes Adapter Sequences from High-Throughput Sequencing Reads. EMBnet.journal 2011, 17, 10–10. [CrossRef]
- Krueger, F.; Andrews, S.R. Bismark: A Flexible Aligner and Methylation Caller for Bisulfite-Seq Applications. Bioinforma. Oxf. Engl. 2011, 27, 1571–1572. [CrossRef]
- Catoni, M.; Tsang, J.M.; Greco, A.P.; Zabet, N.R. DMRcaller: A Versatile R/Bioconductor Package for Detection and Visualization of Differentially Methylated Regions in CpG and Non-CpG Contexts. Nucleic Acids Res. 2018. [CrossRef]
- Akalin, A.; Kormaksson, M.; Li, S.; Garrett-Bakelman, F.E.; Figueroa, M.E.; Melnick, A.; Mason, C.E. methylKit: A Comprehensive R Package for the Analysis of Genome-Wide DNA Methylation Profiles. Genome Biol. 2012, 13, R87–R87. [CrossRef]
- Lê, S.; Josse, J.; Husson, F. FactoMineR : An R Package for Multivariate Analysis. J. Stat. Softw. 2008, 25. [CrossRef]
- The Cancer Genome Atlas Network Comprehensive Molecular Characterization of Human Colon and Rectal Cancer. Nature 2012, 487, 330–337. [CrossRef]
- Mounir, M.; Lucchetta, M.; Silva, T.C.; Olsen, C.; Bontempi, G.; Chen, X.; Noushmehr, H.; Colaprico, A.; Papaleo, E. New Functionalities in the TCGAbiolinks Package for the Study and Integration of Cancer Data from GDC and GTEx. PLOS Comput. Biol. 2019, 15, e1006701–e1006701. [CrossRef]
- Gu, Z. Complex Heatmap Visualization. iMeta 2022, 1. [CrossRef]
- Kassambara A, K.M., Biecek P. Survminer: Drawing Survival Curves Using “Ggplot2.” 2024.
- Yang, J.; Antin, P.; Berx, G.; Blanpain, C.; Brabletz, T.; Bronner, M.; Campbell, K.; Cano, A.; Casanova, J.; Christofori, G.; et al. Guidelines and Definitions for Research on Epithelial–Mesenchymal Transition. Nat. Rev. Mol. Cell Biol. 2020, 21, 341–352. [CrossRef]
- Garcia-Alonso, L.; Holland, C.H.; Ibrahim, M.M.; Turei, D.; Saez-Rodriguez, J. Benchmark and Integration of Resources for the Estimation of Human Transcription Factor Activities. Genome Res. 2019, 29, 1363–1375. [CrossRef]
- Alvarez, M.J.; Shen, Y.; Giorgi, F.M.; Lachmann, A.; Ding, B.B.; Ye, B.H.; Califano, A. Functional Characterization of Somatic Mutations in Cancer Using Network-Based Inference of Protein Activity. Nat. Genet. 2016, 48, 838–847. [CrossRef]
- Su, G.; Morris, J.H.; Demchak, B.; Bader, G.D. Biological Network Exploration with Cytoscape 3. Curr. Protoc. Bioinforma. 2014, 47. [CrossRef]
- del Toro, N.; Shrivastava, A.; Ragueneau, E.; Meldal, B.; Combe, C.; Barrera, E.; Perfetto, L.; How, K.; Ratan, P.; Shirodkar, G.; et al. The IntAct Database: Efficient Access to Fine-Grained Molecular Interaction Data. Nucleic Acids Res. 2022, 50, D648–D653. [CrossRef]
- Licata, L.; Briganti, L.; Peluso, D.; Perfetto, L.; Iannuccelli, M.; Galeota, E.; Sacco, F.; Palma, A.; Nardozza, A.P.; Santonico, E.; et al. MINT, the Molecular Interaction Database: 2012 Update. Nucleic Acids Res. 2012, 40, D857–D861. [CrossRef]
- Lesurf, R.; Cotto, K.C.; Wang, G.; Griffith, M.; Kasaian, K.; Jones, S.J.M.; Montgomery, S.B.; Griffith, O.L. ORegAnno 3.0: A Community-Driven Resource for Curated Regulatory Annotation. Nucleic Acids Res. 2016, 44, D126–D132. [CrossRef]
- Vazquez, M.; Krallinger, M.; Leitner, F.; Kuiper, M.; Valencia, A.; Laegreid, A. ExTRI: Extraction of Transcription Regulation Interactions from Literature. Biochim. Biophys. Acta BBA - Gene Regul. Mech. 2022, 1865, 194778–194778. [CrossRef]
- Xu, S.; Hu, E.; Cai, Y.; Xie, Z.; Luo, X.; Zhan, L.; Tang, W.; Wang, Q.; Liu, B.; Wang, R.; et al. Using clusterProfiler to Characterize Multiomics Data. Nat. Protoc. 2024, 19, 3292–3320. [CrossRef]
- Weisenberger, D.J.; Siegmund, K.D.; Campan, M.; Young, J.; Long, T.I.; Faasse, M.A.; Kang, G.H.; Widschwendter, M.; Weener, D.; Buchanan, D.; et al. CpG Island Methylator Phenotype Underlies Sporadic Microsatellite Instability and Is Tightly Associated with BRAF Mutation in Colorectal Cancer. Nat. Genet. 2006, 38, 787–793. [CrossRef]
- Ogino, S.; Kawasaki, T.; Kirkner, G.J.; Kraft, P.; Loda, M.; Fuchs, C.S. Evaluation of Markers for CpG Island Methylator Phenotype (CIMP) in Colorectal Cancer by a Large Population-Based Sample. J. Mol. Diagn. 2007, 9, 305–314. [CrossRef]
Figure 1.
Study overview: Graphical representation of the methodology from this study.
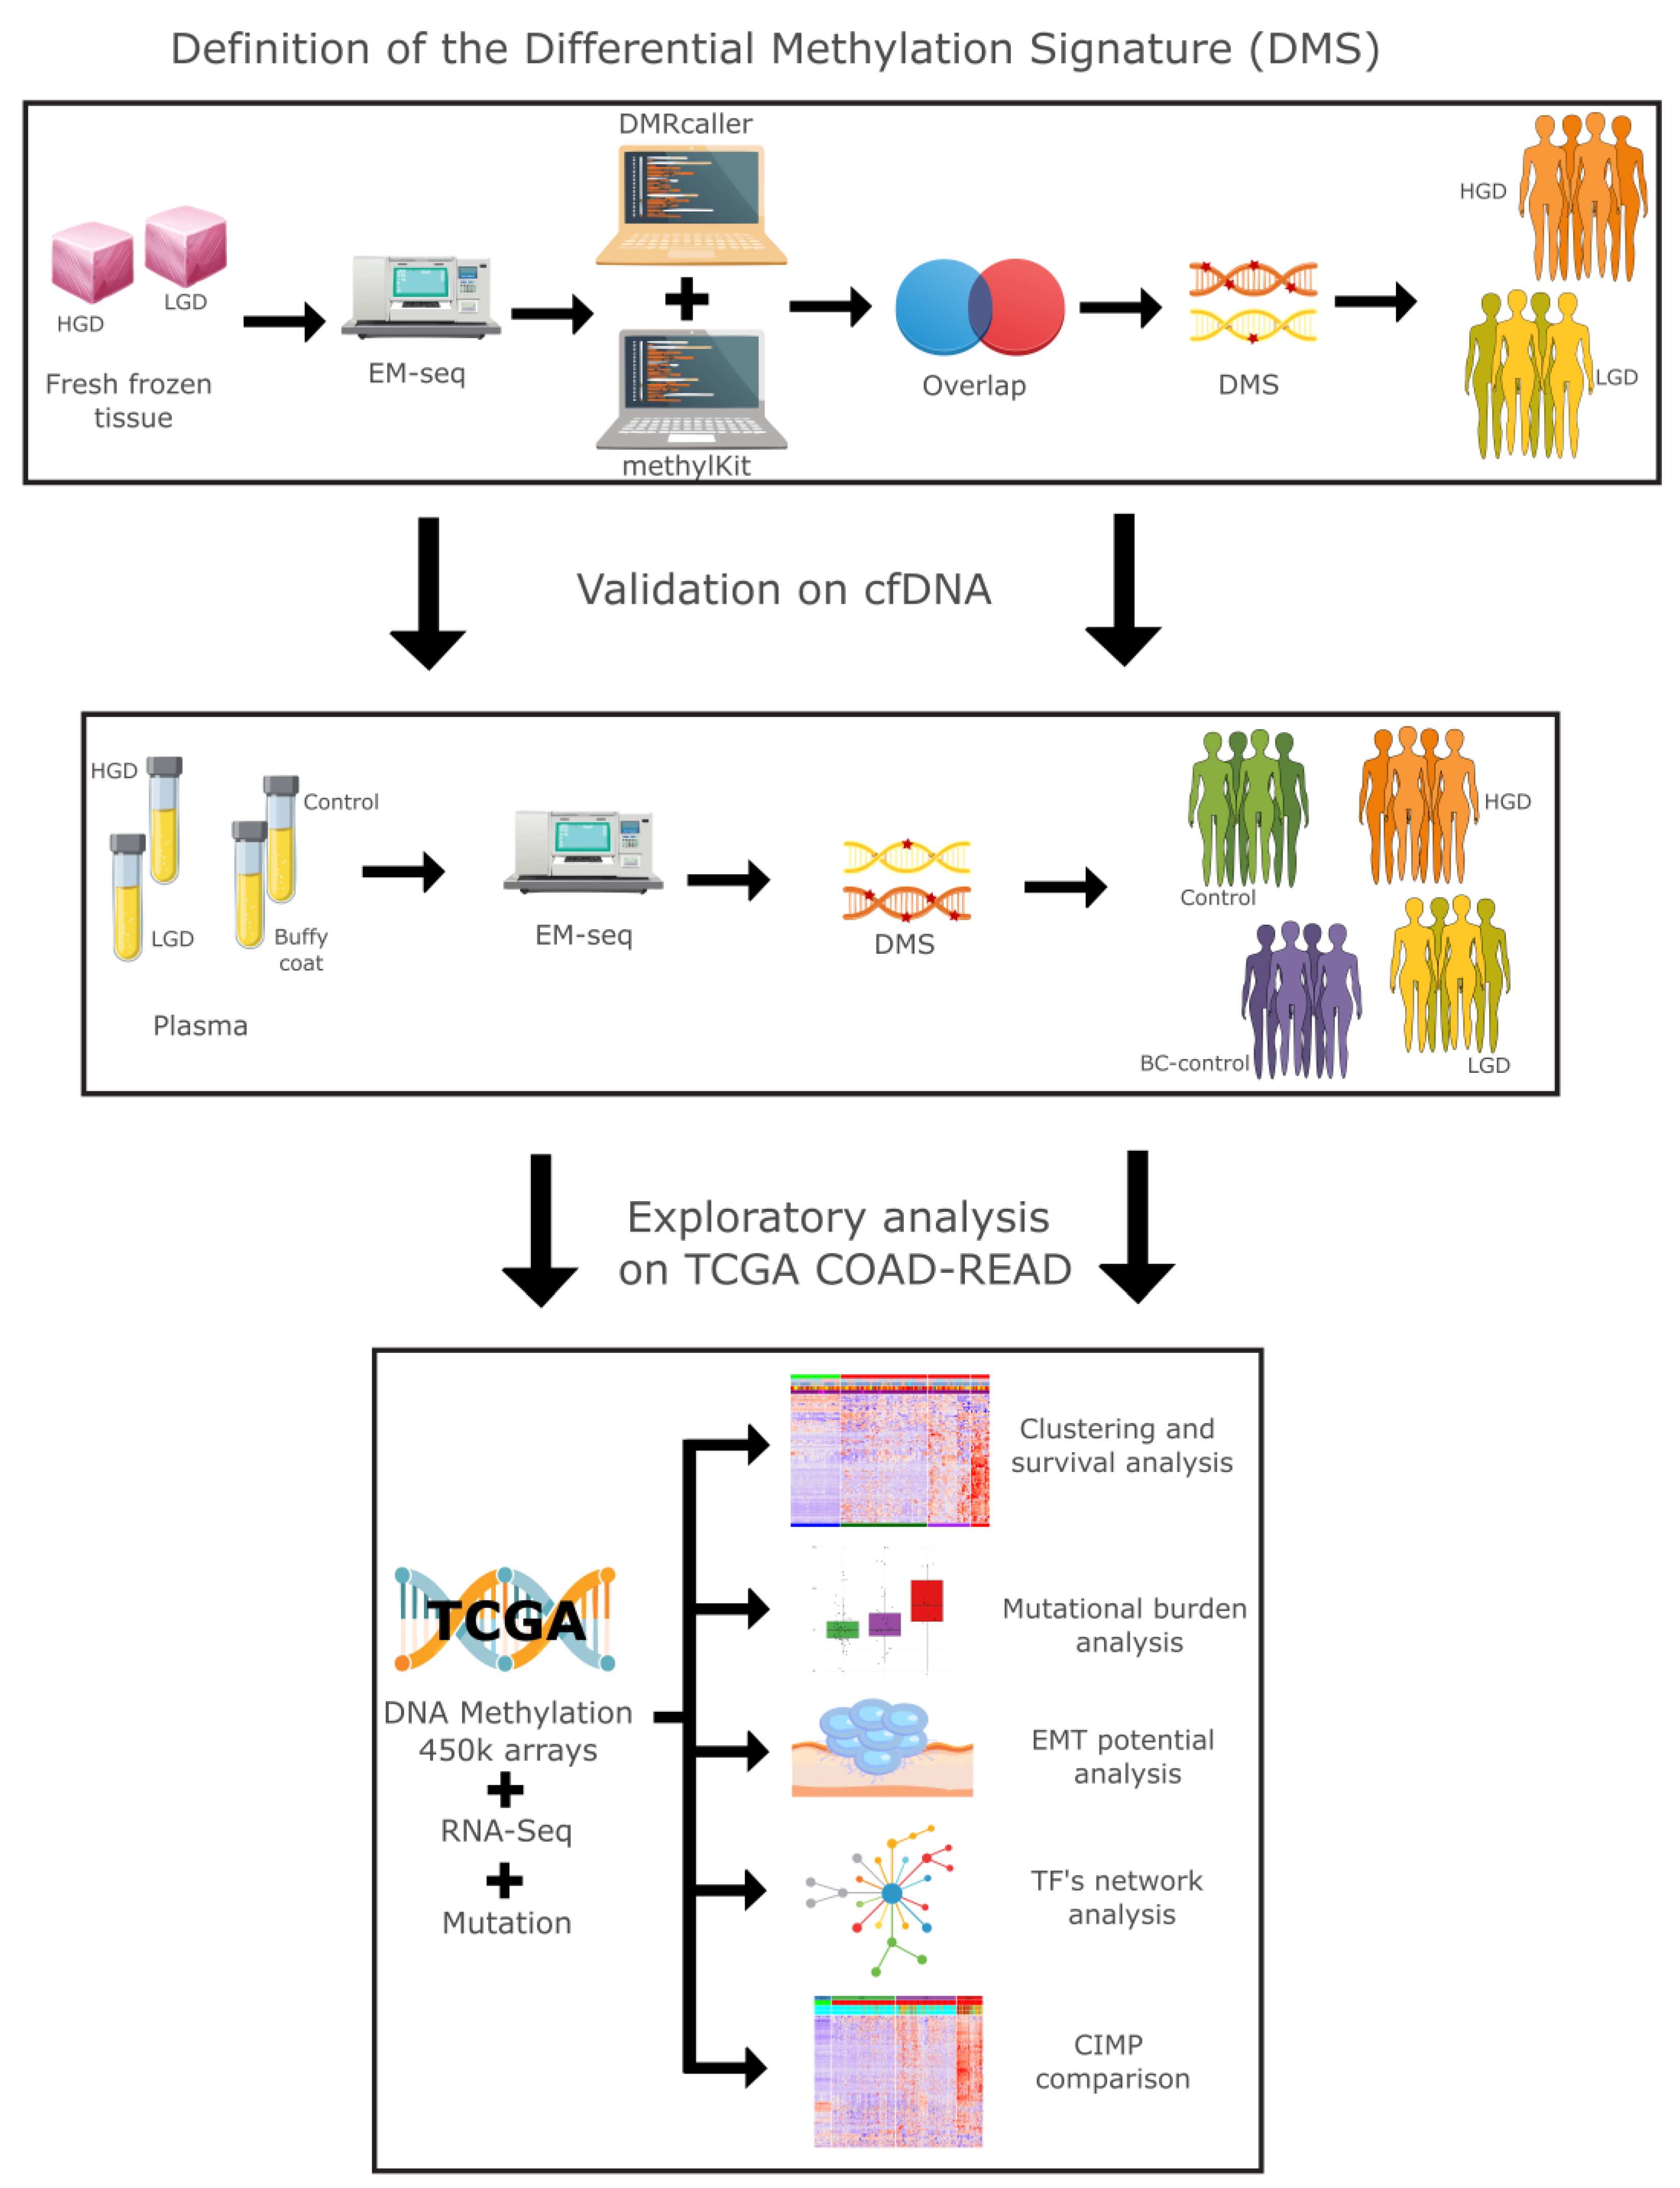
Figure 2.
Distribution of differentially methylated regions between HGD and LGD. (a) Percentage of differentially methylated regions across genomic features (promoters, exons, introns, upstream, intergenic). (b) Percentage of differentially methylated regions across CpG contexts (CpG islands, shores, and intergenic CpG regions) (c) PCA analysis of tissue samples showing clear separation between HGD (n=9) and LGD (n=6) groups. (d) PCA analysis of plasma samples demonstrating the distinction between HGD (n=4), LGD (n=26), normal plasma (n=8), and BC-control (n=18).
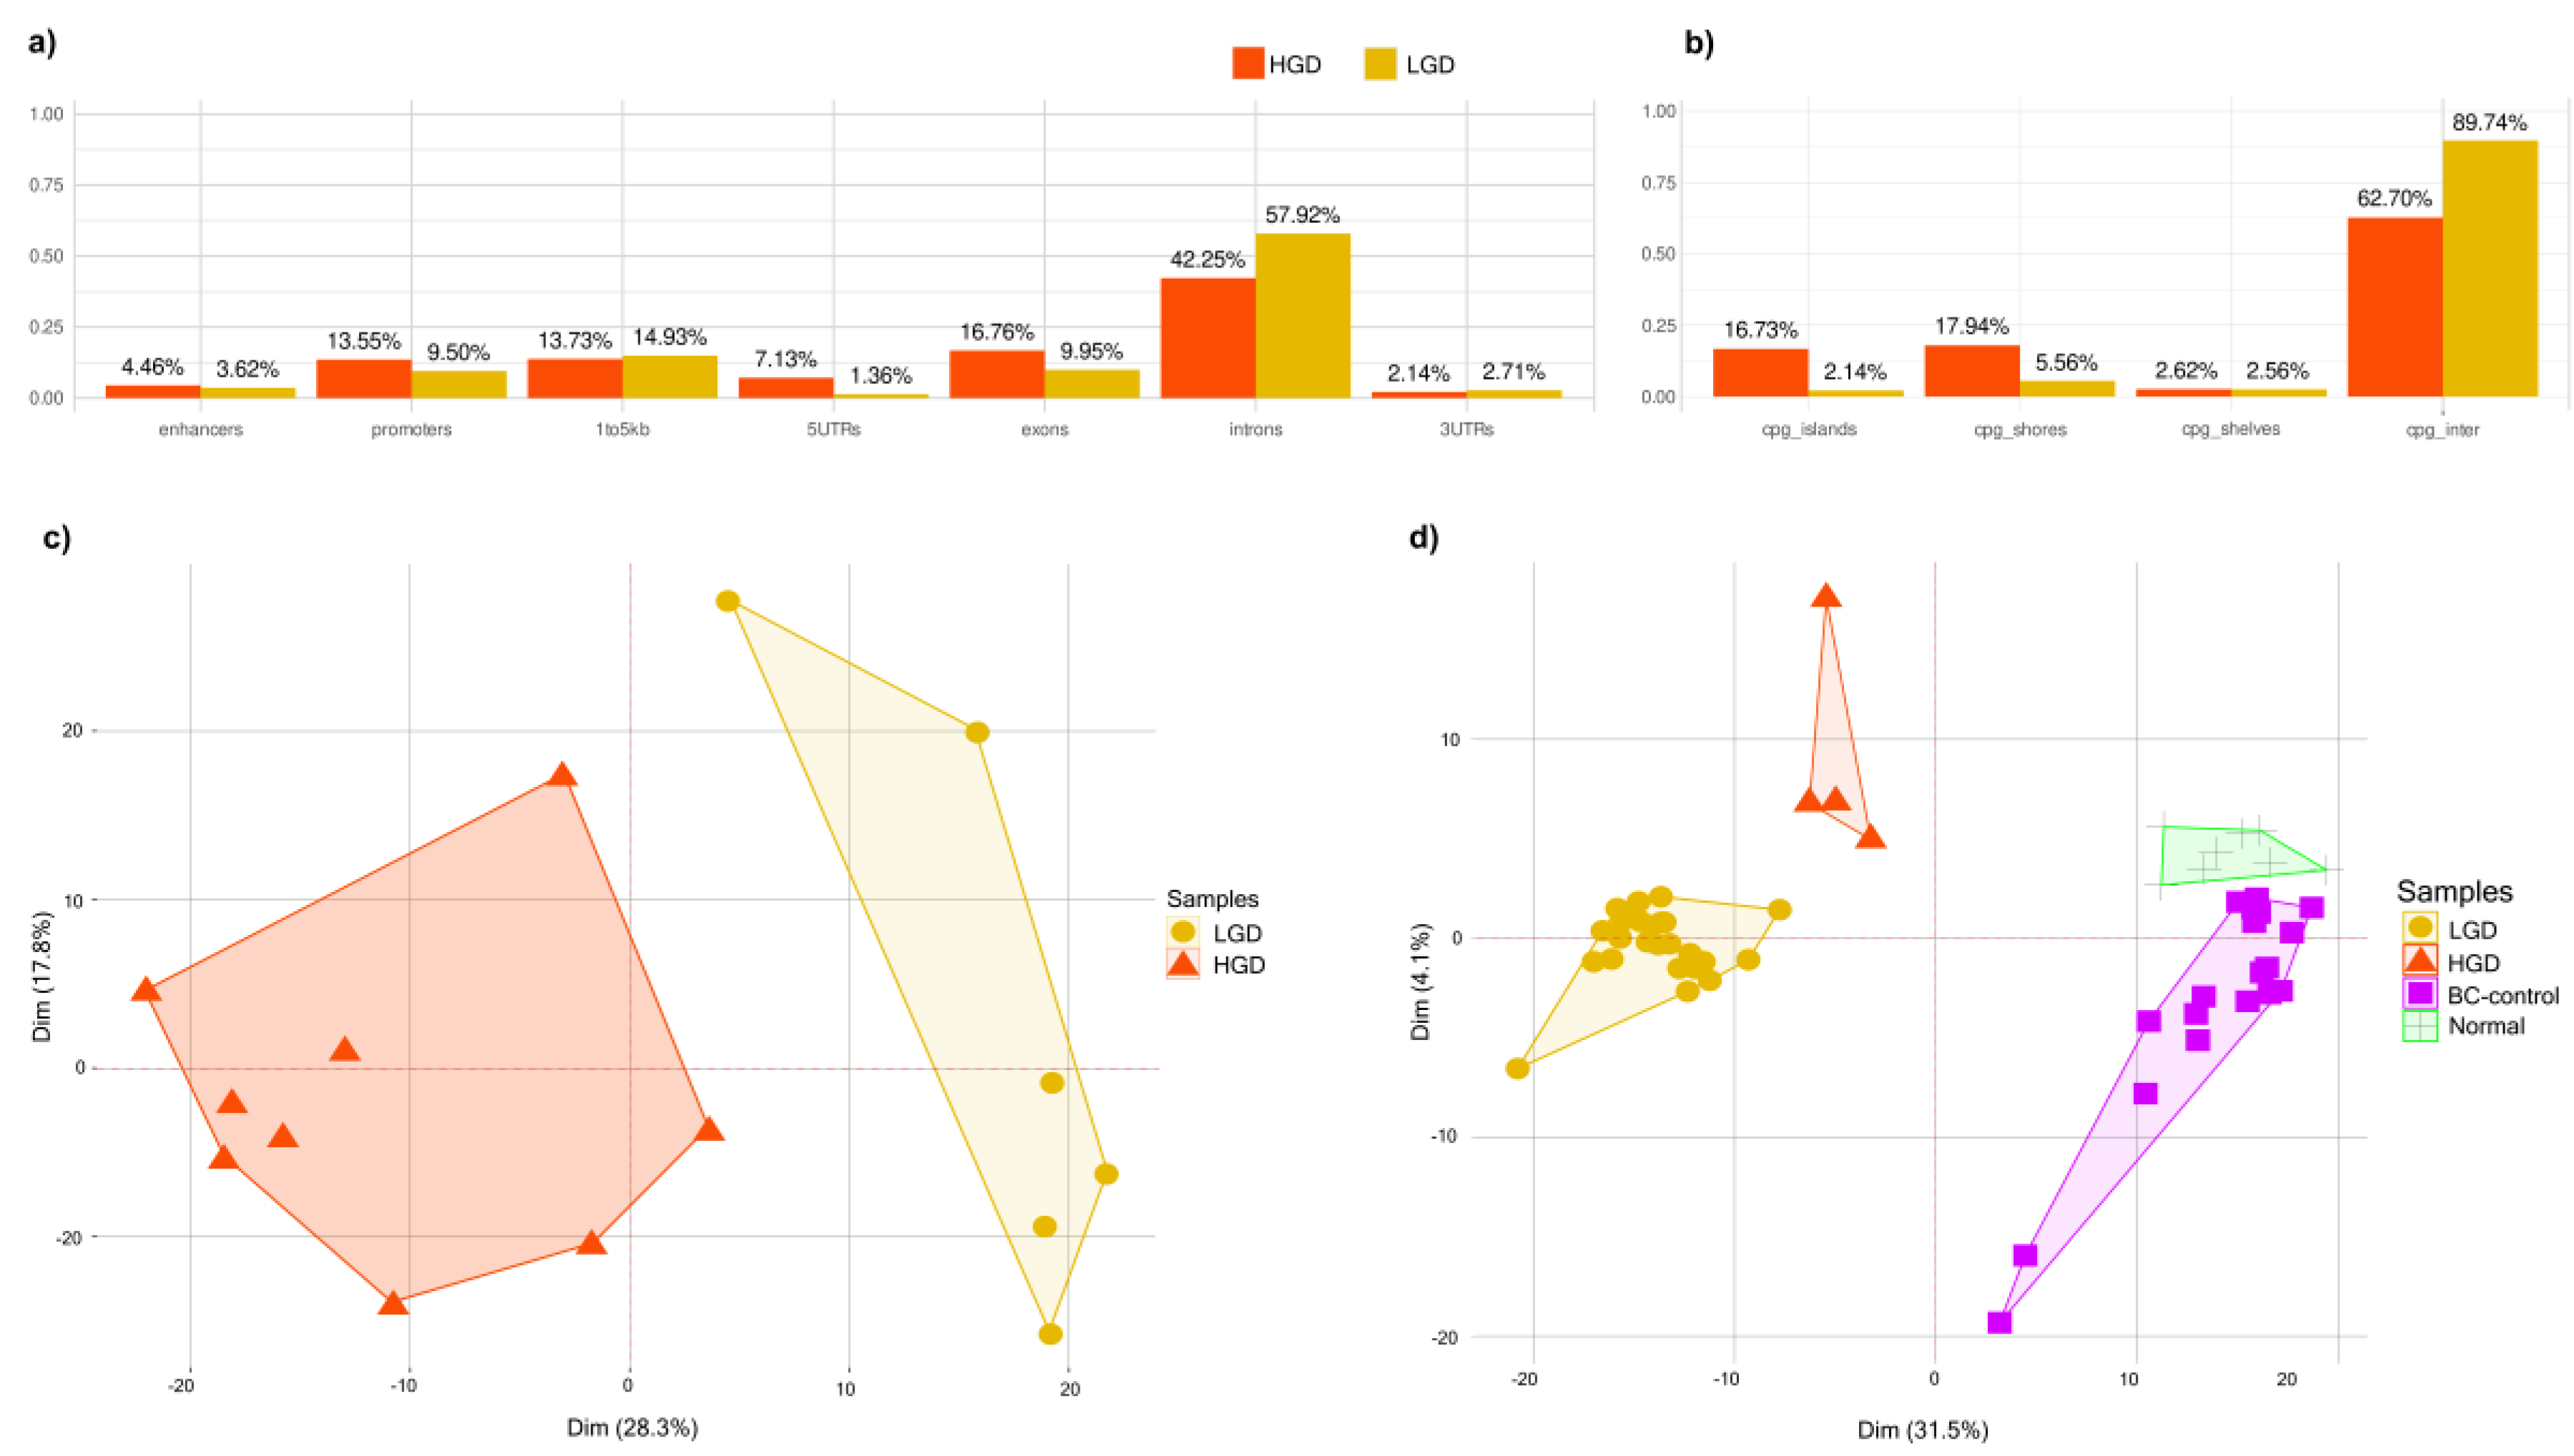
Figure 3.
Functional enrichment analysis of DMS-associated regions. (a) GO analysis in HGD-enriched genes highlights pathways involved in transcription factor regulation, tissue organization, and cell communication. (b) LGD-enriched genes are involved in different transcriptional and epigenetic regulatory mechanisms.
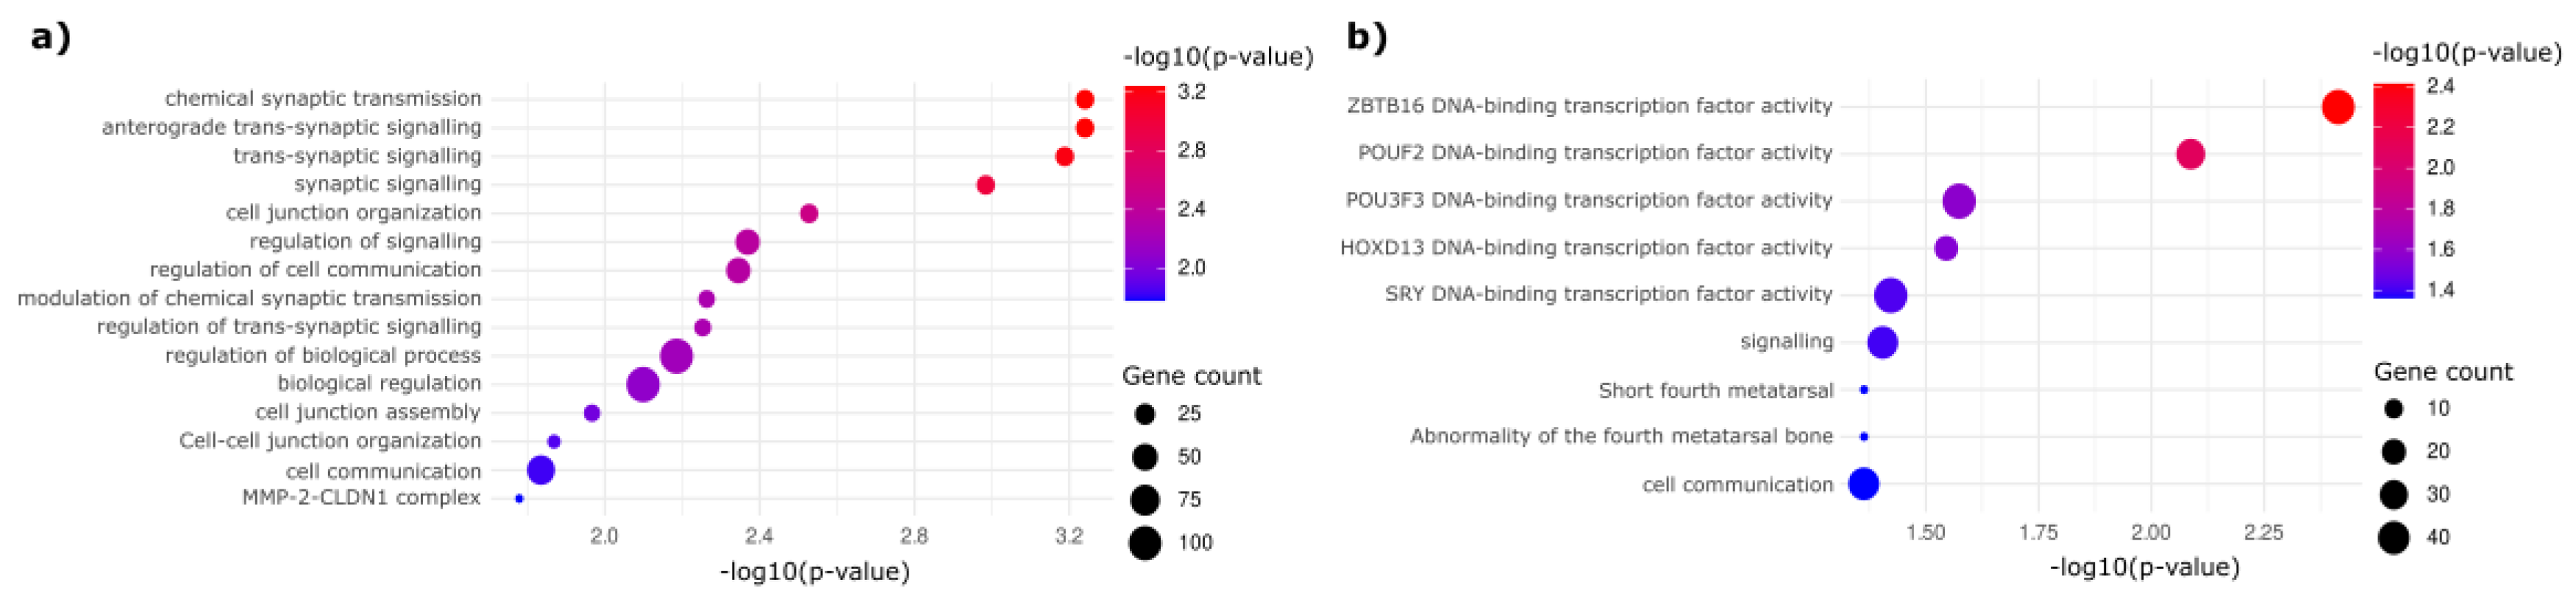
Figure 4.
Clustering analysis of TCGA COAD-READ samples based on DMS regions. (a) Hierarchical unsupervised clustering identifies four sample clusters: CL1 (normal, Blue) and three distinct tumor subtypes (CL2: green, CL3: purple, CL4: red). (b) PCA analysis confirms CL4 as the most epigenetically divergent from normal tissue, while CL2 and CL3 share intermediate profiles. Clinical outcomes associated with methylation-based clusters. (c) Kaplan-Meier survival analysis shows a significantly lower survival probability in CL4 patients compared to CL2. (d) Mutation burden analysis reveals CL4 has the highest mutation rate, supporting its aggressive nature. (e) EMT-related genes exhibit an inverse trend to methylation, with CL3 showing the highest expression, while CL4 displays significant downregulation.
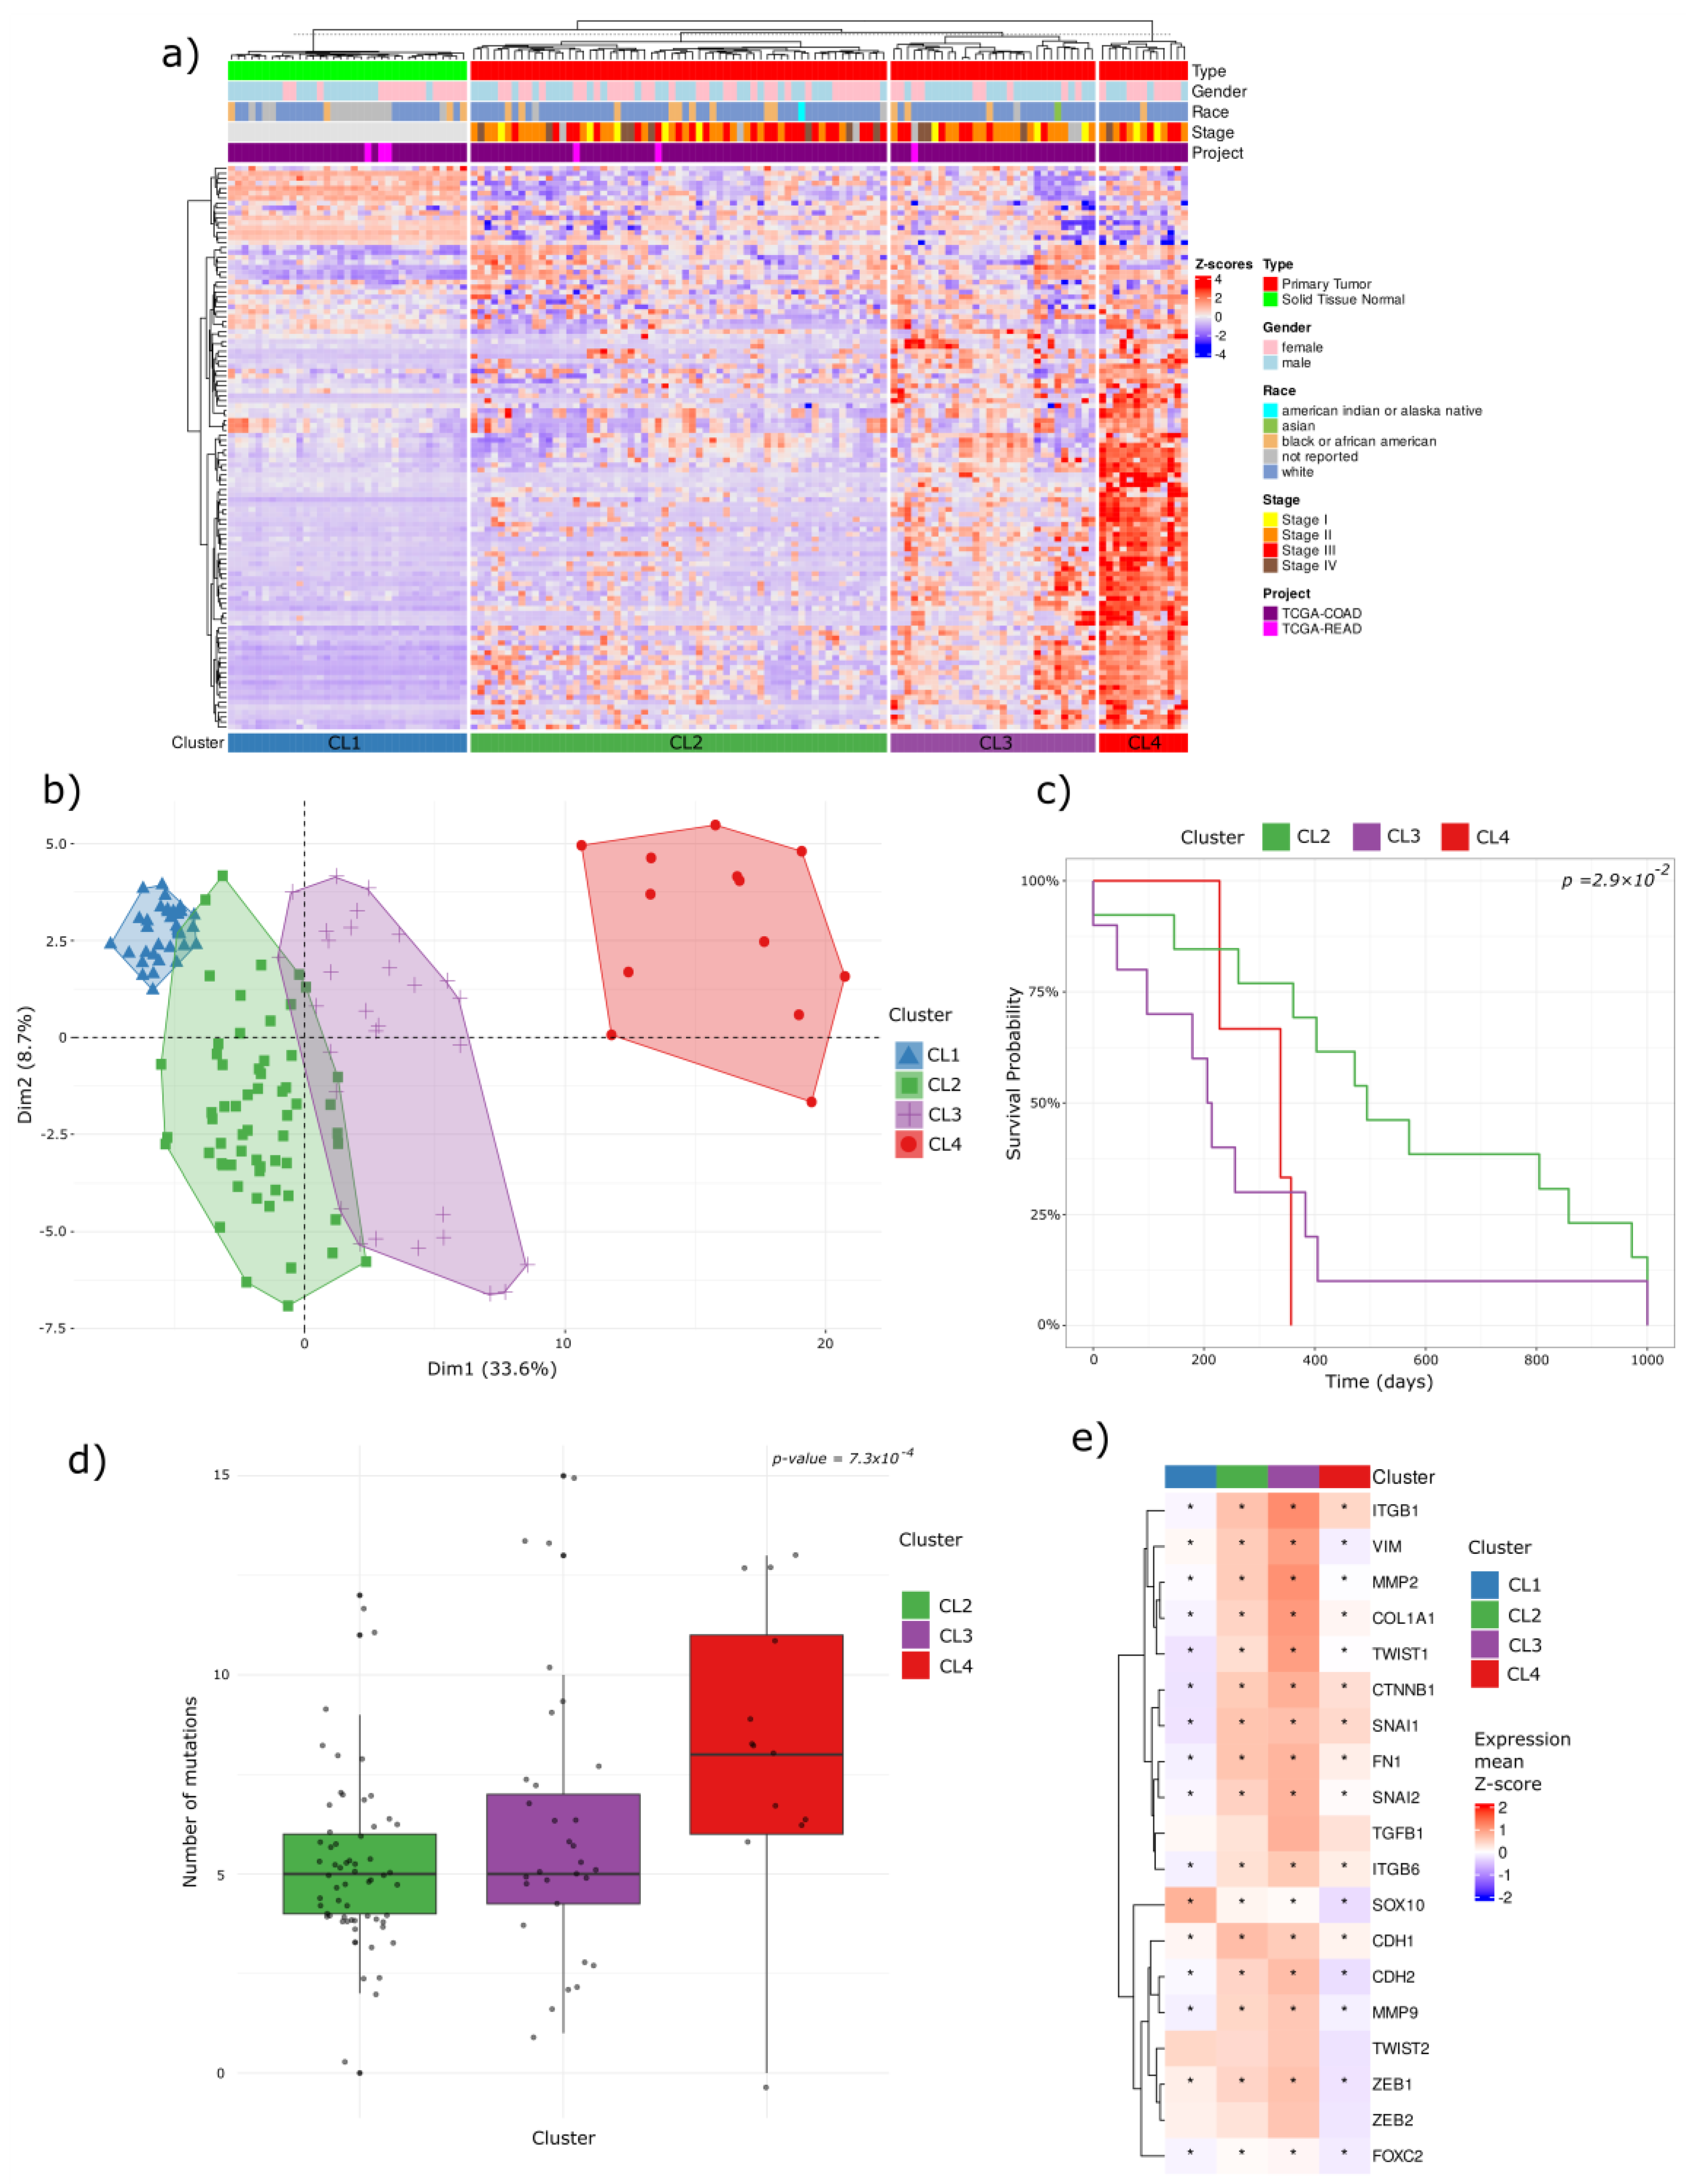
Figure 5.
Transcription Factor Network and Pathway Enrichment Analysis. (a) CL4 TF network featuring key transcriptional regulators and their centrality in driving oncogenic pathways; (b) KEGG pathway enrichment for CL4, highlighting canonical cancer pathways such as PI3K–Akt and AMPK; (c) Gene Ontology (GO) terms associated with CL4, illustrating embryonic gene programs and negative regulation of cell adhesion; (d) CL2 TF network depicting influential regulators of immune and inflammatory signaling; (e) KEGG pathway enrichment in CL2, emphasizing immuno-inflammatory pathways (JAK–STAT, TNF, IL-17, NF-κB); (f) GO terms for CL2, underscoring immune related terms as leukocyte adhesion, proliferation, and migration; (g) CL3 TF network revealing hubs shaping both oncogenic and immune-associated processes; (h) KEGG pathway enrichment in CL3, showing missregulation in cancer, PI3K–Akt, and heavily influenced on inflammatory pathways; (i) GO terms linked to CL3, reflecting regulation of cell adhesion, leukocyte proliferation, and immune effector function.
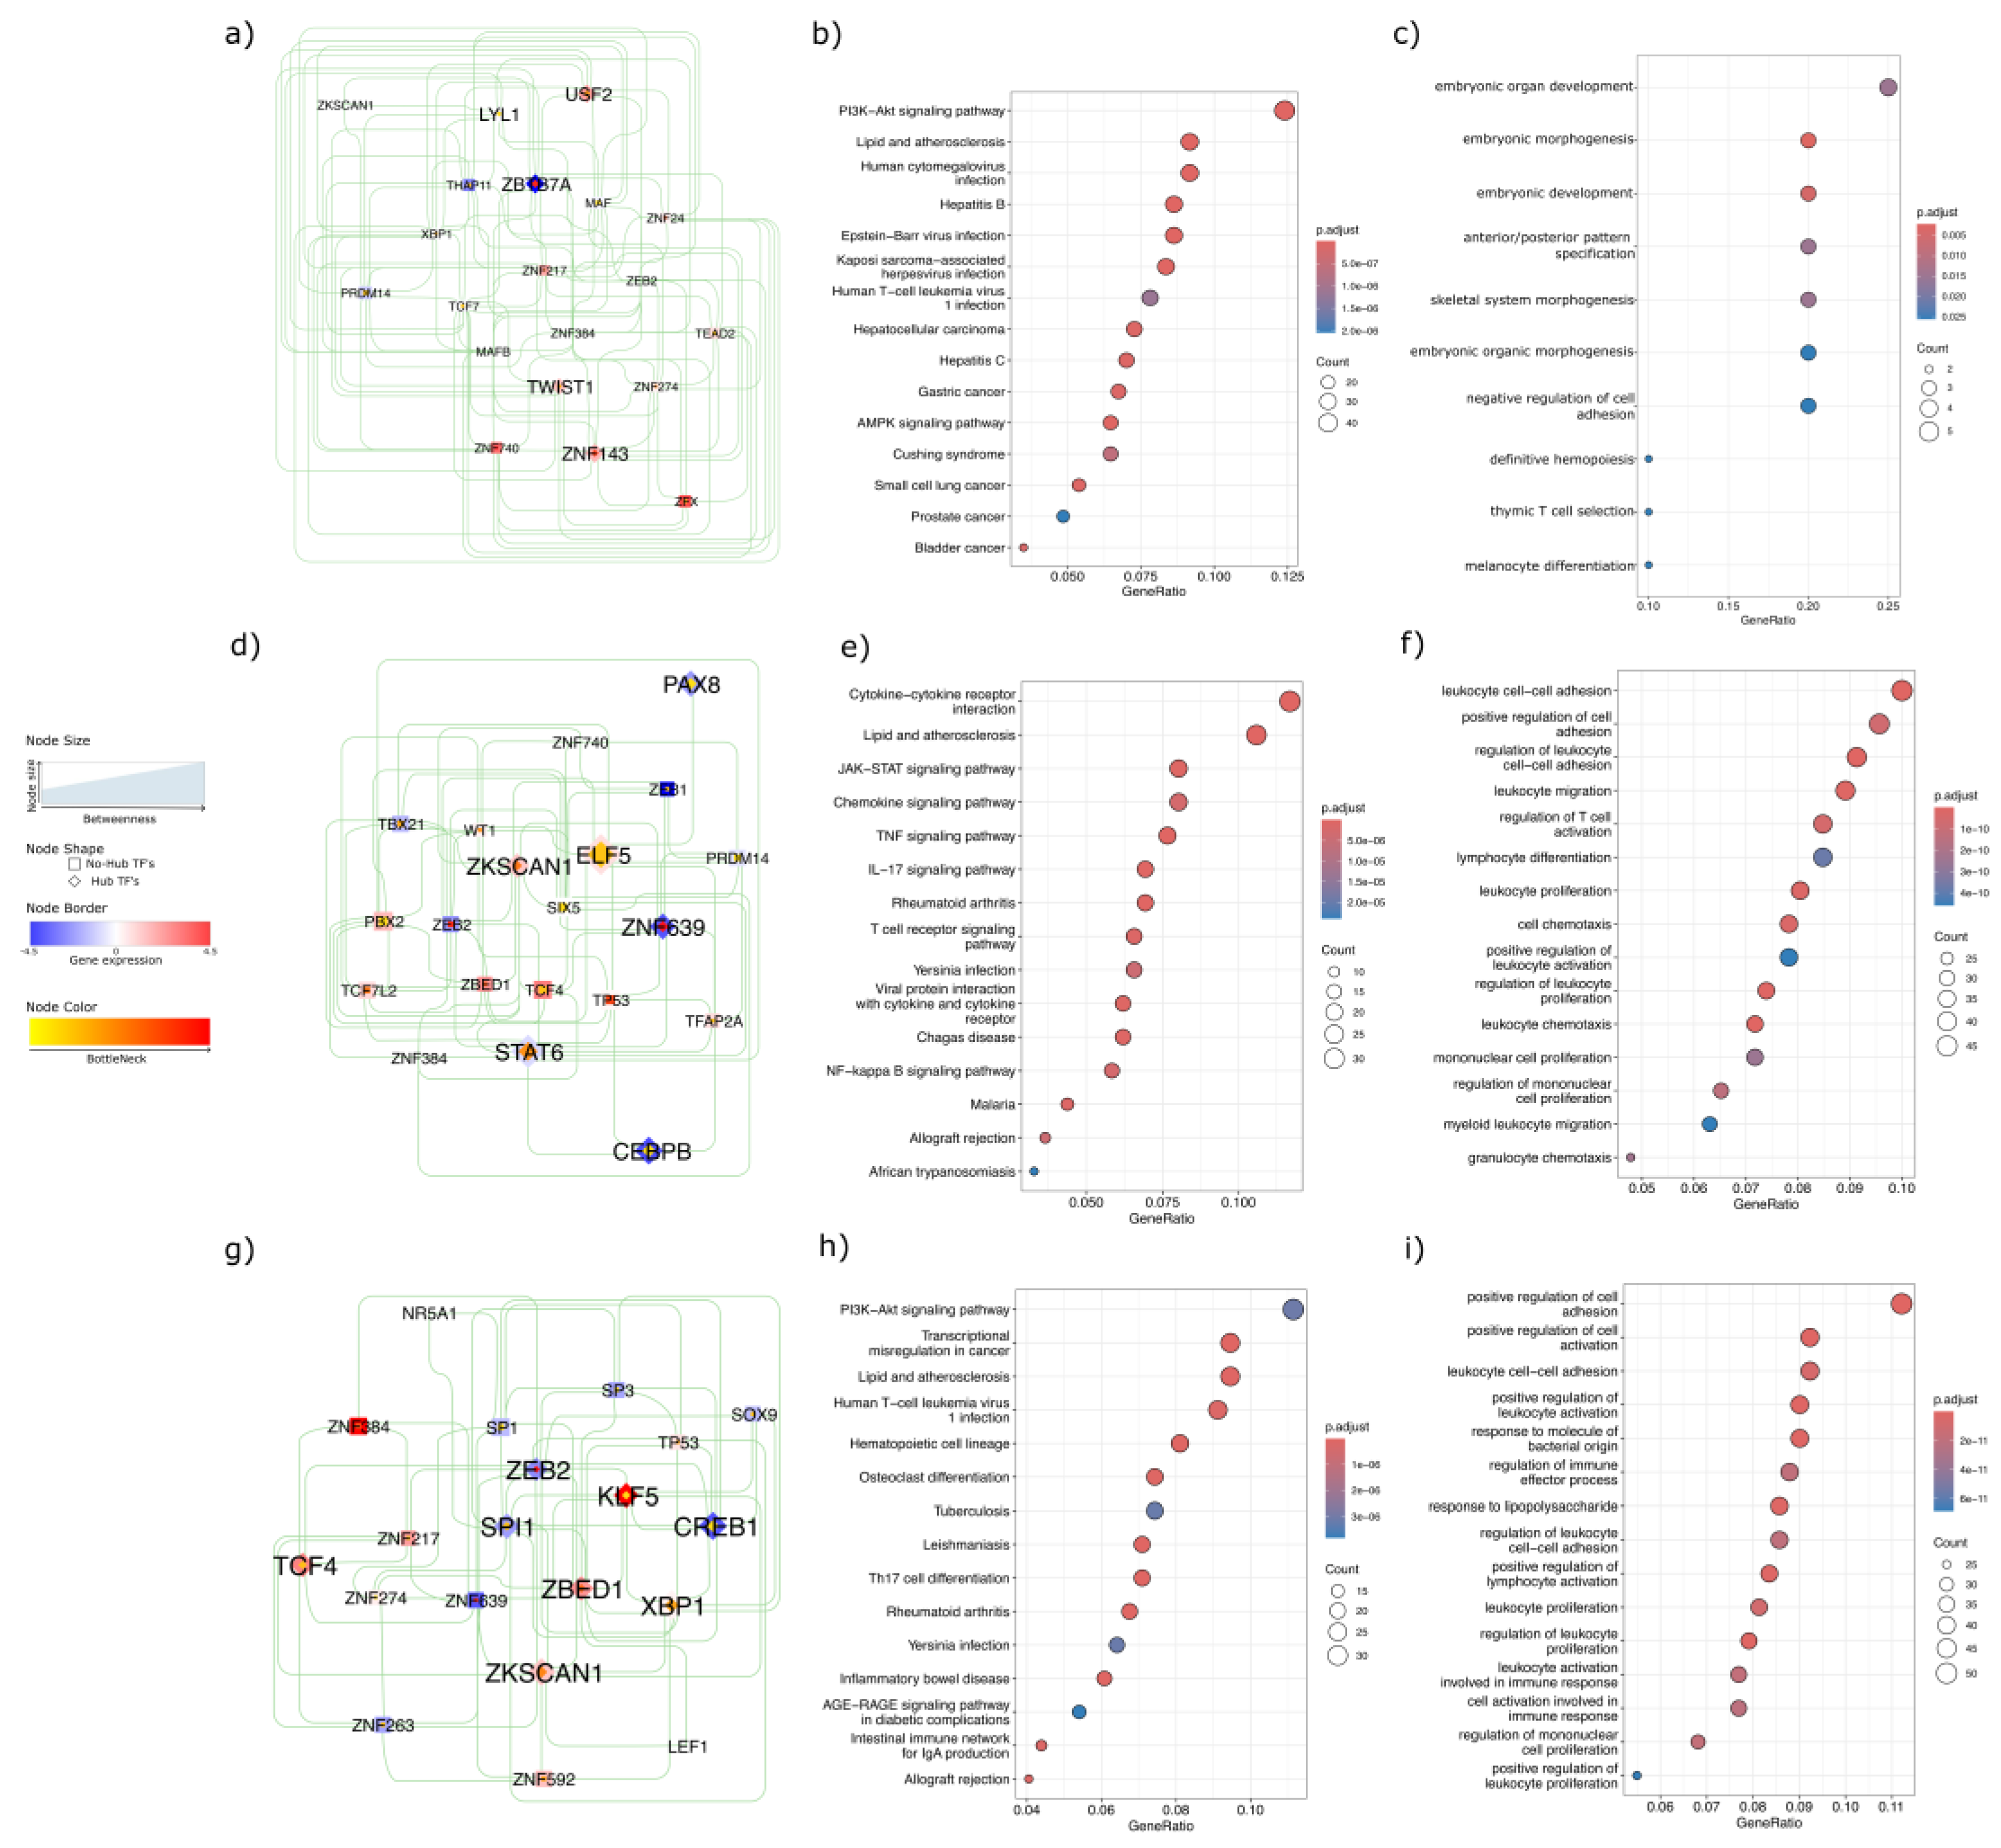
Figure 6.
Integrative heatmap of methylation-based clustering and CIMP classification in TCGA COAD-READ samples. Heatmap displaying the hierarchical clustering of TCGA COAD-READ samples based on the DMS regions. Columns represent individual samples, grouped into four methylation-based clusters (CL1, CL2, CL3, CL4) according to hierarchical clustering. Rows correspond to DMS regions, with methylation levels represented as Z-scores. Top annotations indicate sample type and CIMP status determined by Weisenberger and Ogino panels (classified as CIMP-H, CIMP-L, CIMP-N). Right-side annotations classify DMS regions according to their association with HGD or LGD.
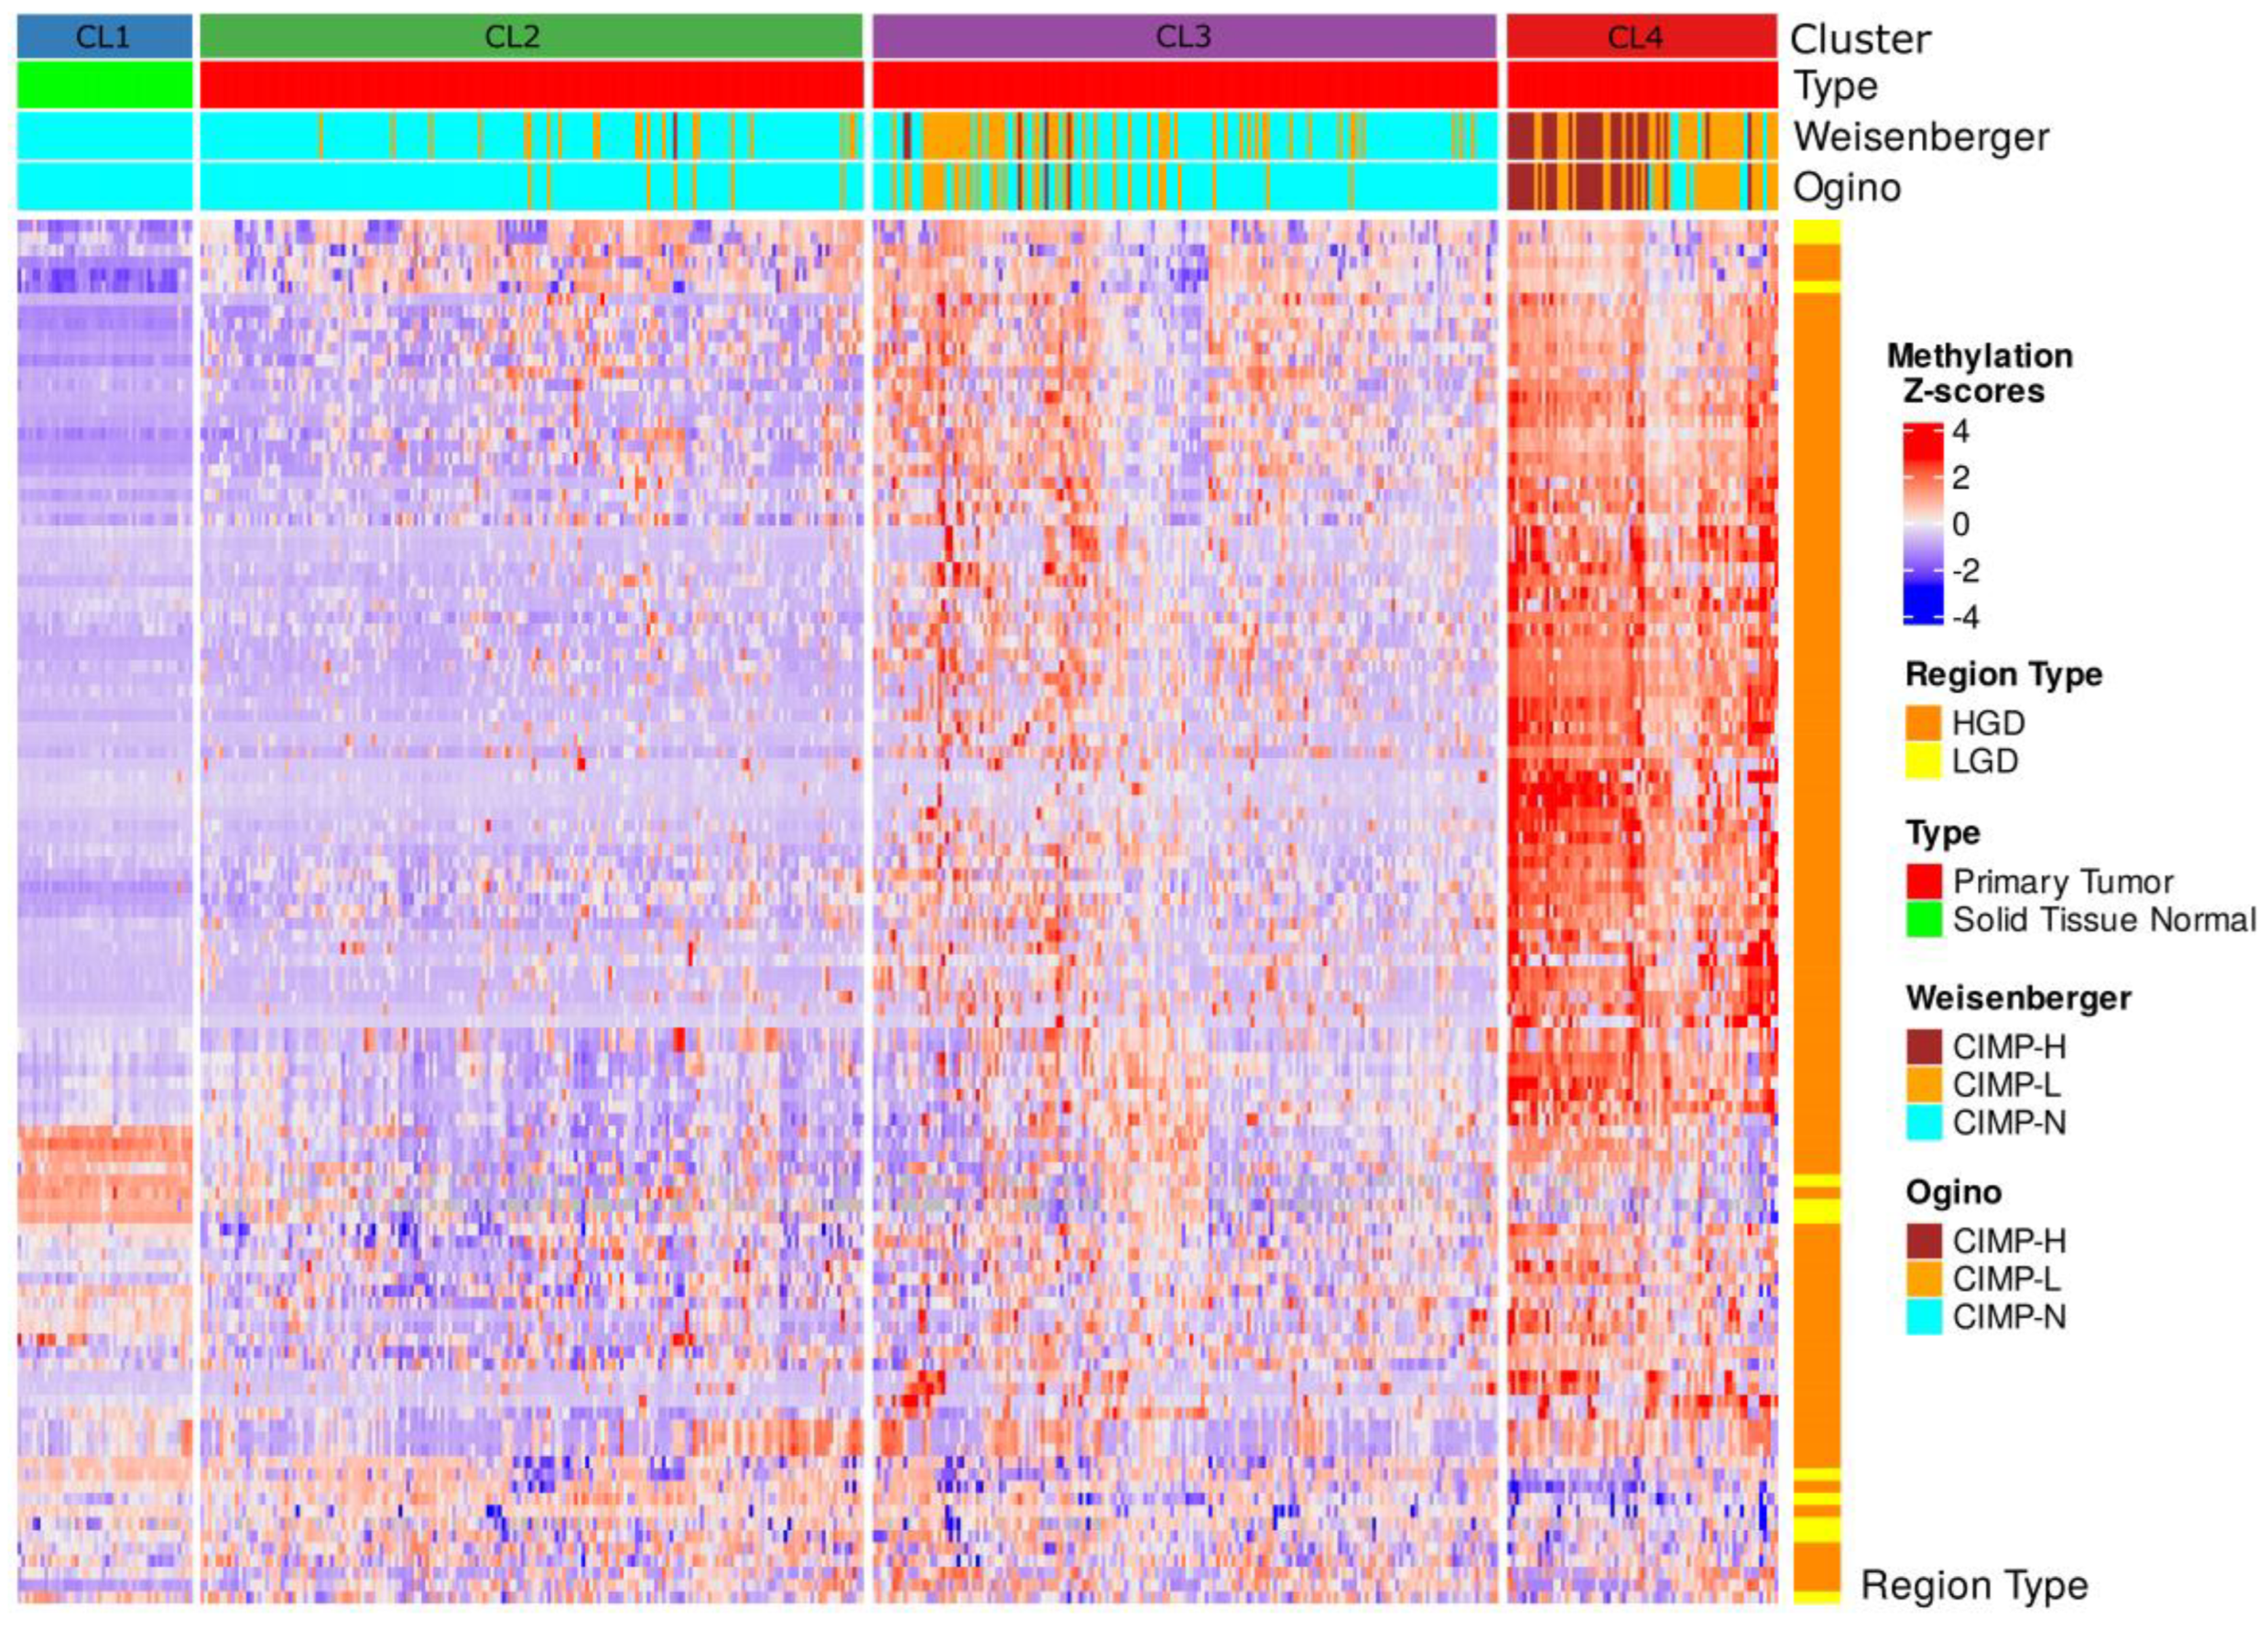
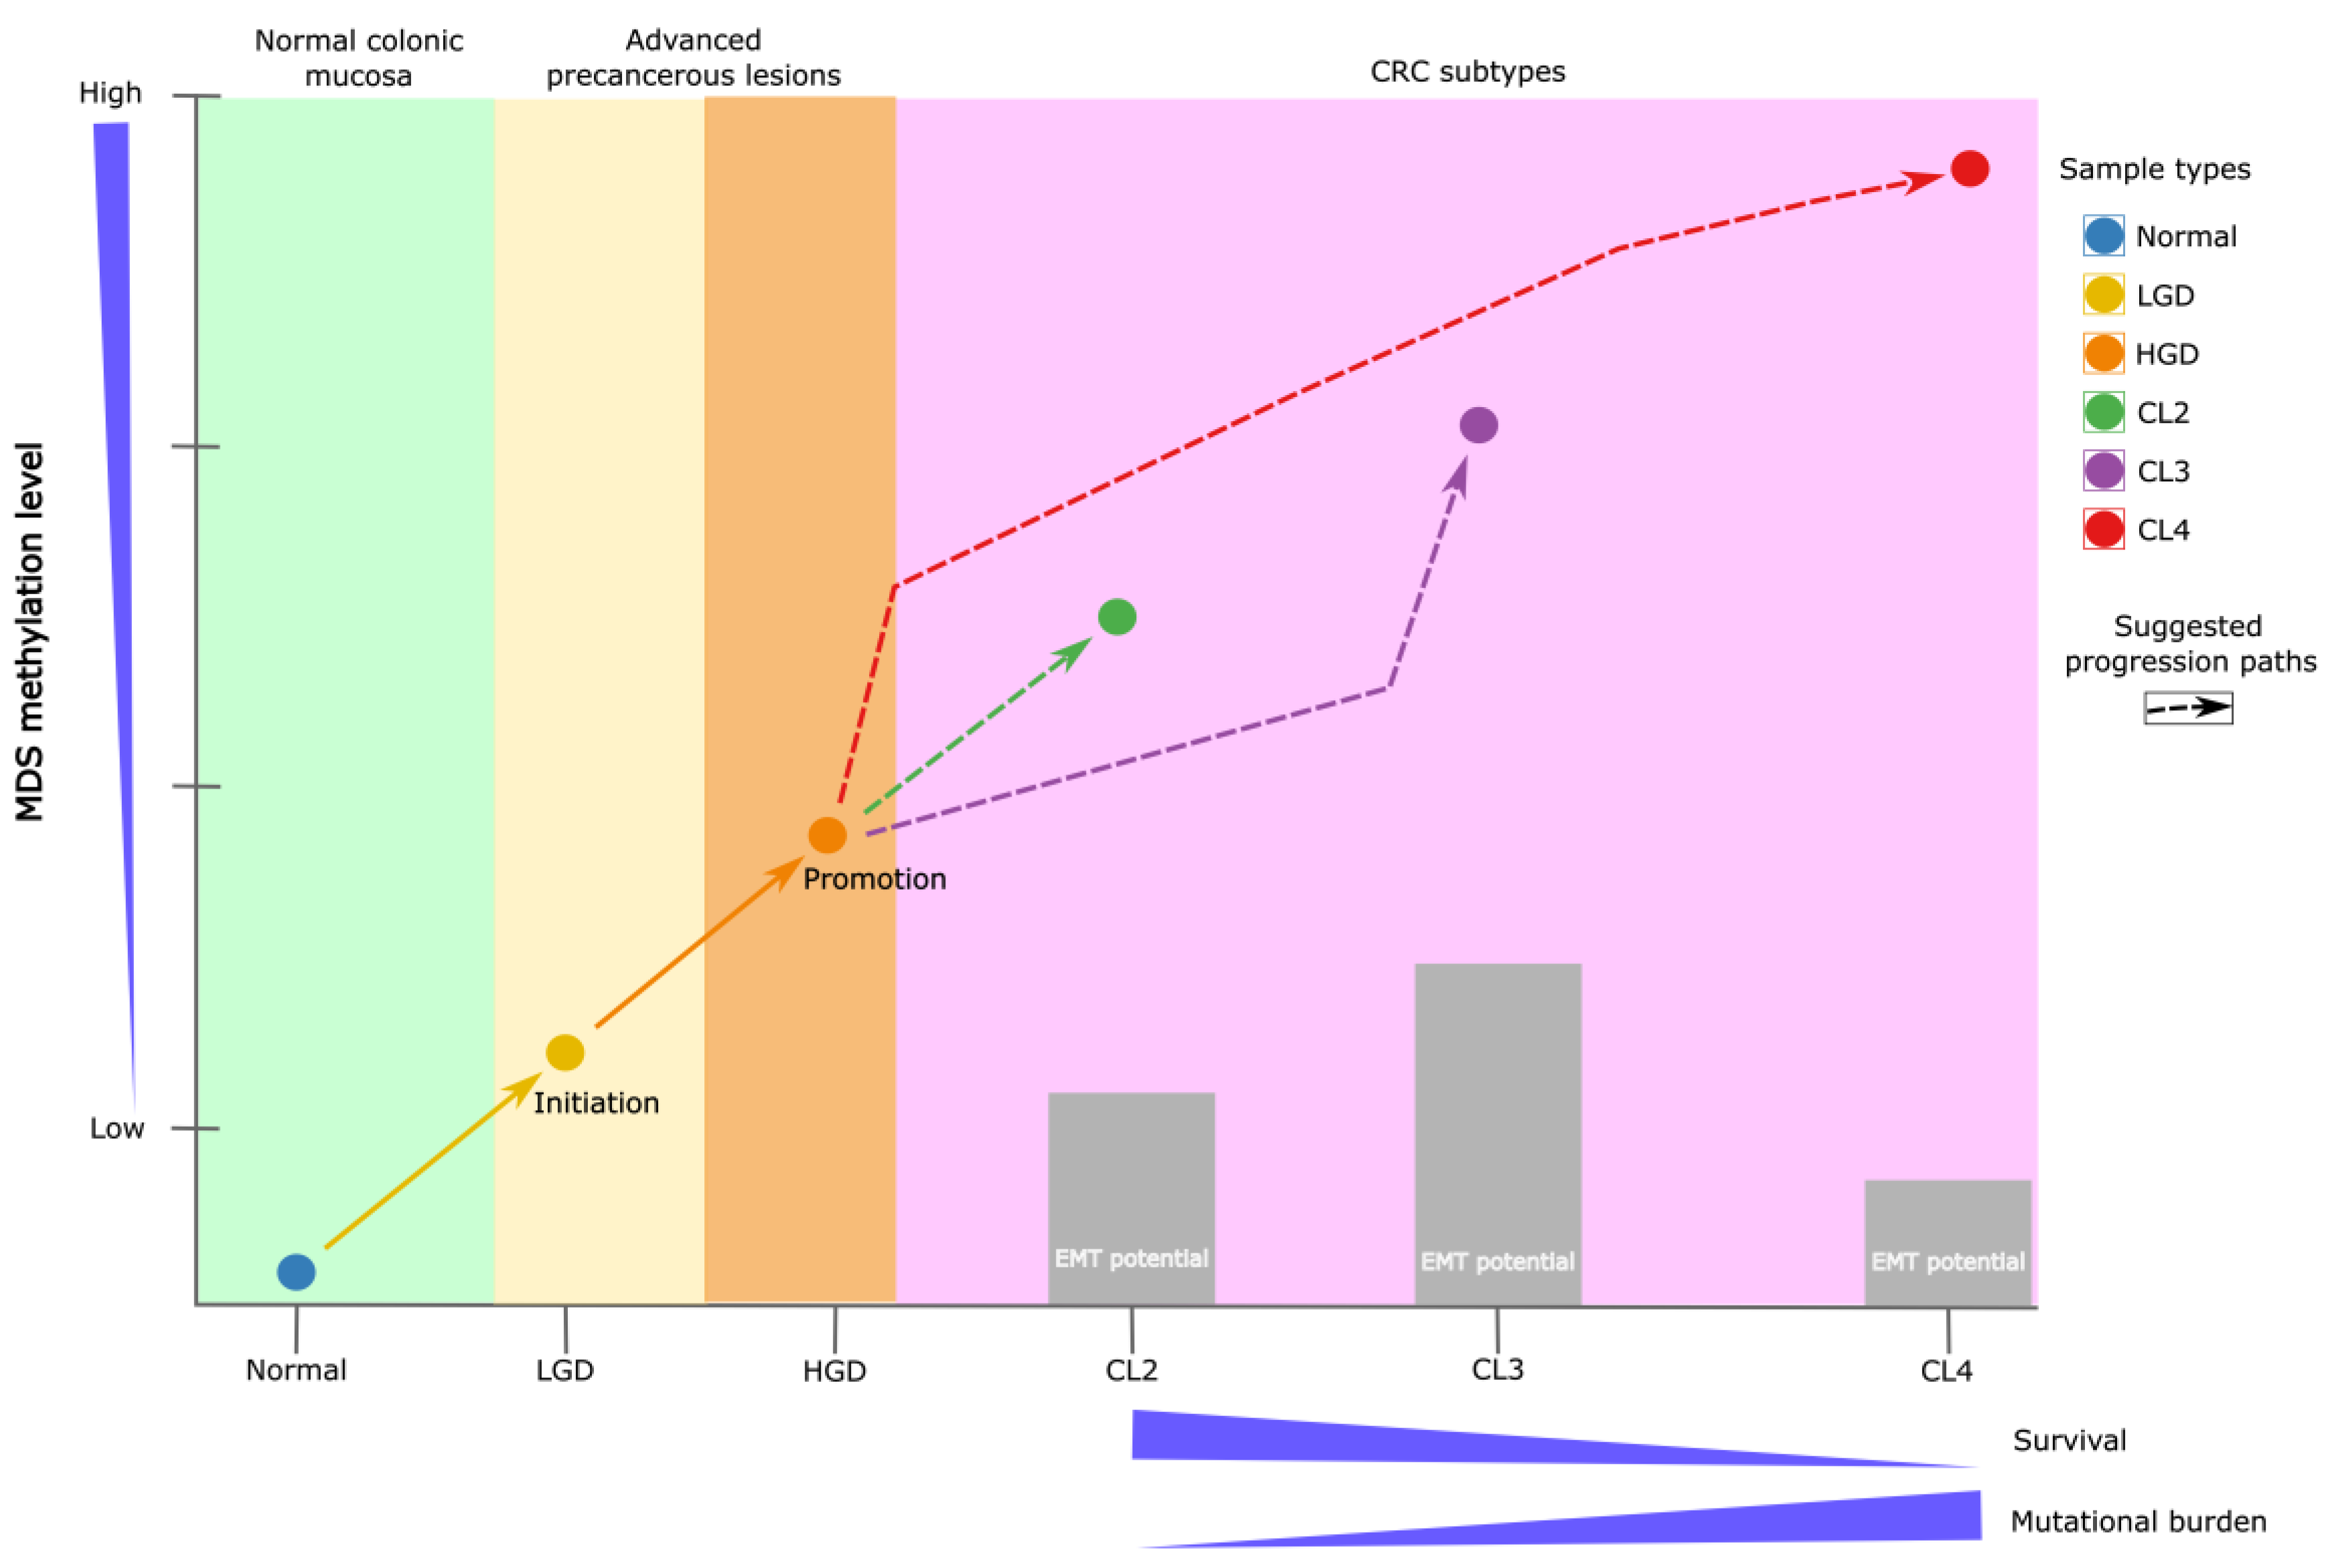
Figure 7.
Schematic representation of CRC subtype progression. The initiation phase illustrates the transition from normal colonic mucosa to adenoma, marking the onset of the adenoma–carcinoma sequence. The promotion phase corresponds to dysplasia progression, during which specific epigenetic alterations arise. These changes are captured by the Differential Methylation Signature (DMS), which effectively distinguishes low-grade dysplasia (LGD) from high-grade dysplasia (HGD). Early methylation alterations precede malignant transformation and contribute to the development of distinct CRC subtypes. For instance, tumors classified as subtype CL4 are characterized by extensive hypermethylation, a higher mutational burden, and significantly poorer survival outcomes. In contrast, intermediate subtypes such as CL2 display moderate methylation levels, a lower mutation burden, and comparatively favorable prognoses.
Disclaimer/Publisher’s Note: The statements, opinions and data contained in all publications are solely those of the individual author(s) and contributor(s) and not of MDPI and/or the editor(s). MDPI and/or the editor(s) disclaim responsibility for any injury to people or property resulting from any ideas, methods, instructions or products referred to in the content. |
© 2025 by the authors. Licensee MDPI, Basel, Switzerland. This article is an open access article distributed under the terms and conditions of the Creative Commons Attribution (CC BY) license (http://creativecommons.org/licenses/by/4.0/).
Copyright: This open access article is published under a Creative Commons CC BY 4.0 license, which permit the free download, distribution, and reuse, provided that the author and preprint are cited in any reuse.


