
Submitted:
07 July 2025
Posted:
08 July 2025
You are already at the latest version
Abstract
Background: Aberrant DNA methylation has been shown to be a fingerprint charac-teristic in human colorectal tumors. In this study, we hypothesize that investigating global DNA methylation could offer potential candidates for clinical application in CRC. The epigenome-wide association analysis was conducted using in tumor area (N=27) and the adjacent tumor-free (NAT) area (N=15). Results. We found 78,935 differentially methylated CpG sites (DMCs) (FDR< 0.05), 42,888 hypomethylated and 36,047 hyper-methylation showing overall hypomethylation. Gene Ontology and KEGG analysis of genes differentially methylated genes showed a significant enrichment of develop-mental genes, such as and metabolic process and cell cycle, such as TFGβ and cAMP signaling pathways. Through filtered analysis, we identified TNXB gene as the most epigenetically dysregulated gene, in which it found to be hypomethylated and down-regulated in CRC (both with p< 0.001) after further validation and associated with poor overall survival. In the functional analysis, TNXB was epigenetically regulated, in dose-dependent manner, suggesting a potential role in CRC. Conclusion. The epigenetic dysregulation and functional role of TNXB in CRC could have clinical implications, serving as an indicator of malignant potential and the adverse effects associated with disease origin and progression in CRC
Keywords:
DNA methylation
; TNXB
; colorectal cancer
; 450K
; epigenetic
1. Introduction
According to the data from the International Agency for Research on Cancer (IARC) Global Observatory for Cancer (GLOBOCAN), colorectal cancer (CRC) ranks as the third most commonly diagnosed cancer, constituting 10% of all cancer diagnoses globally, and stands as the second leading cause of cancer-related deaths [1]. Despite increased survival rates in metastatic cancer cases, mostly due to improved screening, the overall survival rate for advanced cases remains low [2]. In fact, epigenetic modifications constitute a prevalent occurrence in all human cancers, notably marked by aberrant DNA methylation in human colorectal tumors [3], and commonly exhibiting global genome hypomethylation [4,5]. This hypomethylation potentially plays a critical role in promoting carcinogenesis by modulating genomic instability, poorer prognoses and response to chemotherapy [6]. Alterations in DNA methylation have been shown to be useful for clinical application, since they may occur early in oncogenesis, are stable, reversible, and can be assayed in many tissues by no-invasive methods [7].
Novel studies investigating epigenome-wide DNA methylation has offered now opportunities to enhance our understanding of the dynamics within the DNA methylation landscape in CRC. Several studies have characterized DNA methylation profiling and its association with cancer outcomes [8,9], identifying potential tools for diagnosis and prognosis [10,11], disease progression and response to therapy [12]. However, additional research is necessary to introduce DNA methylation into clinical application, both for comprehending the pathogenetic mechanisms and for developing novel therapeutic approaches for CRC. In the present study, we hypothesized that investigating global DNA methylation could provide a more comprehensive insight into the DNA methylation patterns in CRC, potentially revealing new pathogenic mechanisms. Accordingly, we profile genome-wide DNA methylation in CRC by examining tumor and non-adjacent tumor tissues. Our findings highlight TNXB (Tenascin XB) as a novel tumor suppressor gene in CRC, with further functional approaches are analyzed. This study provides evidence supporting a deeper understanding of DNA methylation dysregulation in colorectal carcinogenesis.
2. Results
2.1. DNA Methylation Landscape in Colorectal Cancer
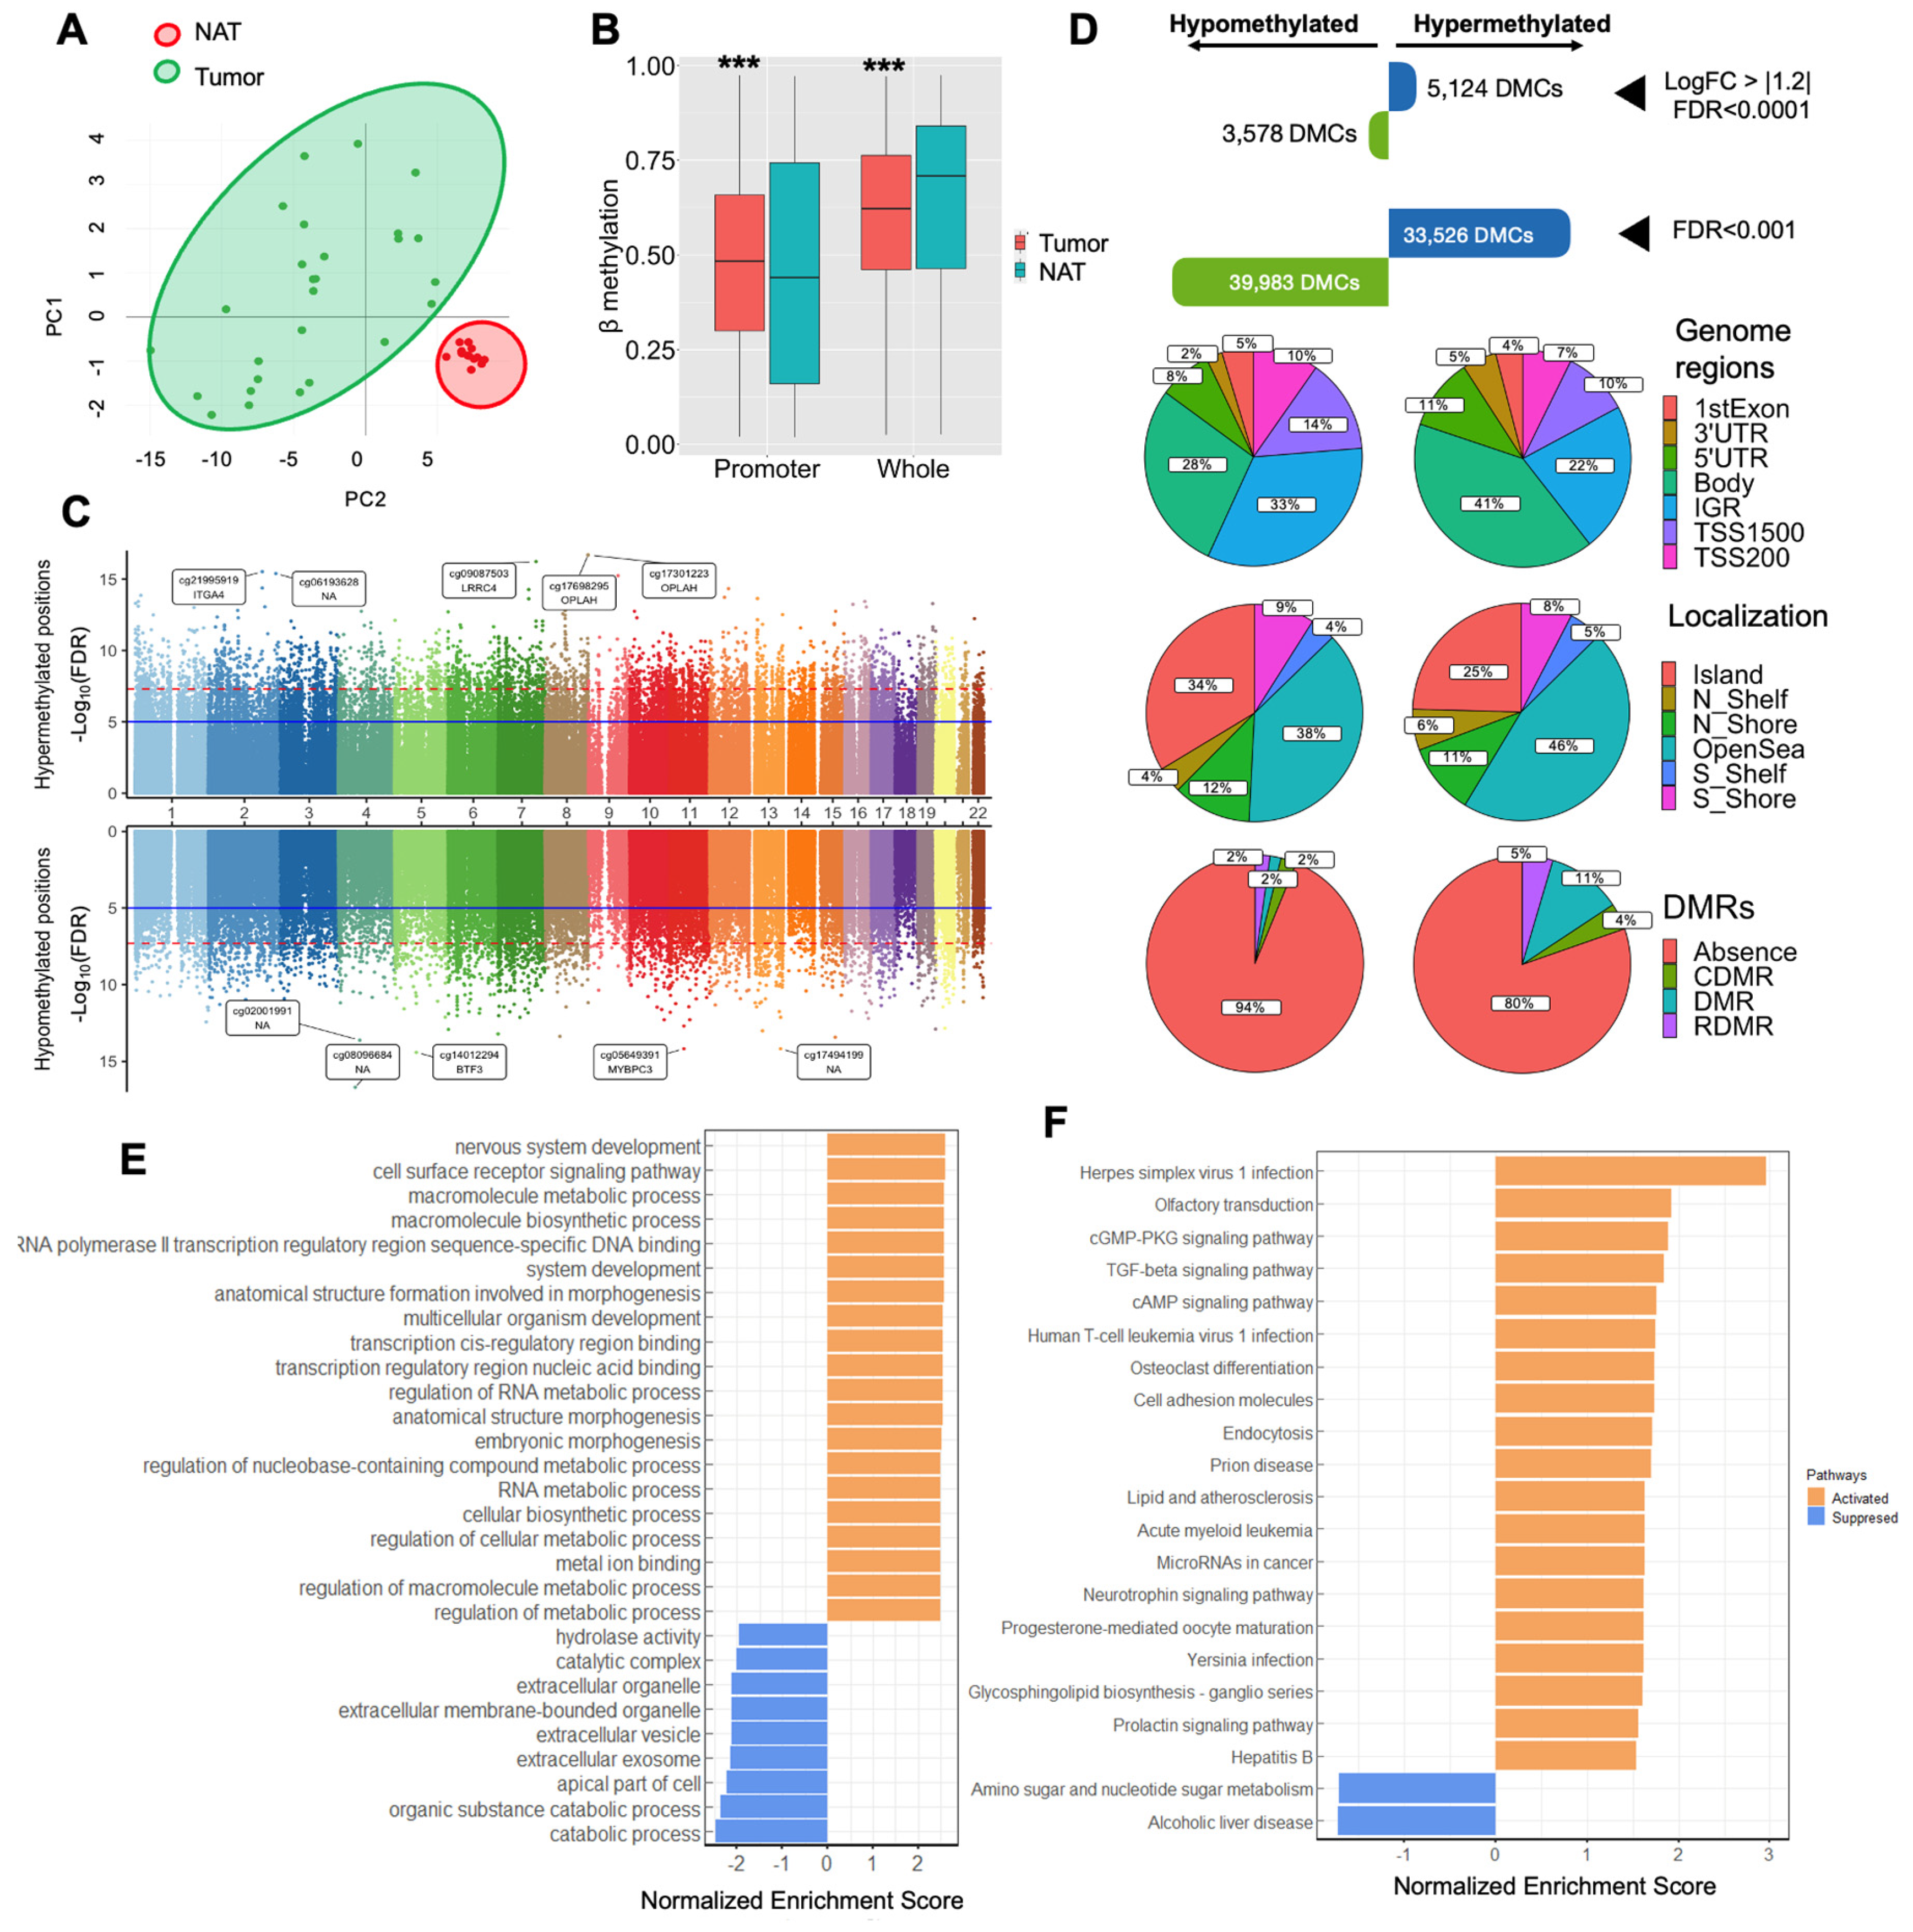
We conducted an analysis of epigenome-wide DNA methylation in CRC by comparing tumor and NAT samples. The baseline characteristics of the patients with CRC included in the epigenome-wide DNA methylation are summarized in Supplementary Table 1. Principal component analysis (PCA) and heatmap distinctly grouped the tumor and NAT samples into two well-defined clusters (Figure 1A, Supplementary Figure 1A). Overall, we observed a significant increase in global promoter methylation in the tumor area compared to the NAT area (p<0.001). In contrast, global DNA methylation exhibited an increase in the NAT area in comparison to the tumor area (p<0.001) (Figure 2B). The differential methylation analysis revealed a total of 73,509 DMCs (FDR<0.001), highlighting the most significantly hypermethylated and hypomethylated positions in genes, such as located , including cg21995919 within the ITGA4 (cg21995919), OPLAH, BTF3 (cg14012294) or MYBPC3 (cg05649391) genes (Figure 1C, Supplementary Table 2; Top of the most 20 significant differentially methylated CpGs is summarized in Supplementary Table 3). To find potential genes associated with CRC, we conducted several filtered analysis approaches. i) With an FDR lower than 1x10⁻³, we observed 33,526 hypermethylated and 39,983 hypomethylated DMCs. ii) Through a more stringent analysis identifying DMCs with a LogFC greater than |1.2| and an FDR lower than 1x10⁻⁴, we identified 5,124 hypermethylated positions and 3,578 hypomethylated positions (Figure 1D). To further evaluate the biological significance of these genes, we conducted Gene Set Enrichment Analysis (GSEA) for both gene ontology (GO) and KEGG pathway to find pathways activated and suppressed in CRC, related to DNA methylation. The GO-GSEA revealed increased in DNA methylation in several biological pathways, such as RNA and cellular metabolic processes, as well as extracellular process as decreased methylation (Figure 1E). As for KEGG-GSEA, we found an increase in DNA methylation in cGMP-dependent protein kinase (PKG) signaling pathway, TGFβ signaling pathway, cell adhesion molecules, and, cAMP signaling pathways, as well as decreased DNA methylation in amino sugar and nucleotide sugar metabolism (Figure 1F).
Figure 1.
Profile of DNA methylation in tumors from colorectal cancer. A) Principal component analysis (PCA) for DNA methylation levels of 1,000 most variable CpGs between the tumor area and NAT area, showing two well-clustered groups. B) Comparison between global DNA methylation and promoter global methylation between the tumor area and the NAT area. Asterisks indicate significant differences between the groups according to the Mann Whitney test (*p<0.05, **p<0.01, ***p<0.001). C) Miami plot showing the y axis with the—Log10(FDR) values of CpGs, and the x axis shows their chromosomal position. This plot displays -Log10(FDR) for DMCs associations for hypermethylated CpG sites in the upper part, and for hypomethylated CpG sites in the lower part. Blue line indicates genome-wide significance level (p<Log10(FDR). D) After a stringent analysis with an FDR < 0.001, we found a total of 73,509 DMCs. After selecting by a LogFC > |1.2|, we found 5,124 hypermethylated probes and 3,578 hypomethylated CpGs. Genomic distribution of the DMCs and their respective locations regarding the broader CpG context over the genome region. E) Gene Set Enrichment Analysis gene ontology (GO) and KEGG (Kyoto Encyclopedia of Genes and Genomes) pathway analyses, including the most significant DMCs. Abbreviations: DMCs: Differentially methylated CpG; FDR: False discovery rate; IGR: Intergenic region; NAT: Normal adjacent-tumor; LogFC: Log fold change; TSS: Transcription site start; UTR: Untranslated region; DMR: Differentially methylated regions, (C) cancer (R) reprogramming-specific.
Finally, to identify the best candidate gene, we implemented stringent filtering criteria following the workflow outlined in Supplementary Figure 1B, prioritizing LogFC and FDR values, as well as genes exhibiting extended methylation along their loci. This suggests a local and widespread dysregulation of DNA methylation in terms of both the number of DMCs and DMRs (differentially methylated regions.; Top of the most 20 significant DMRs is summarized in Supplementary Table 4). This analysis led to the identification of the TNXB gene as the most promising candidate. Consequently, we focused on a more comprehensive examination of the functionality of the TNXB gene in CRC.
2.2. TNXB Gene Is Largely Hypomethylated and Overexpressed in Colorectal Cancer
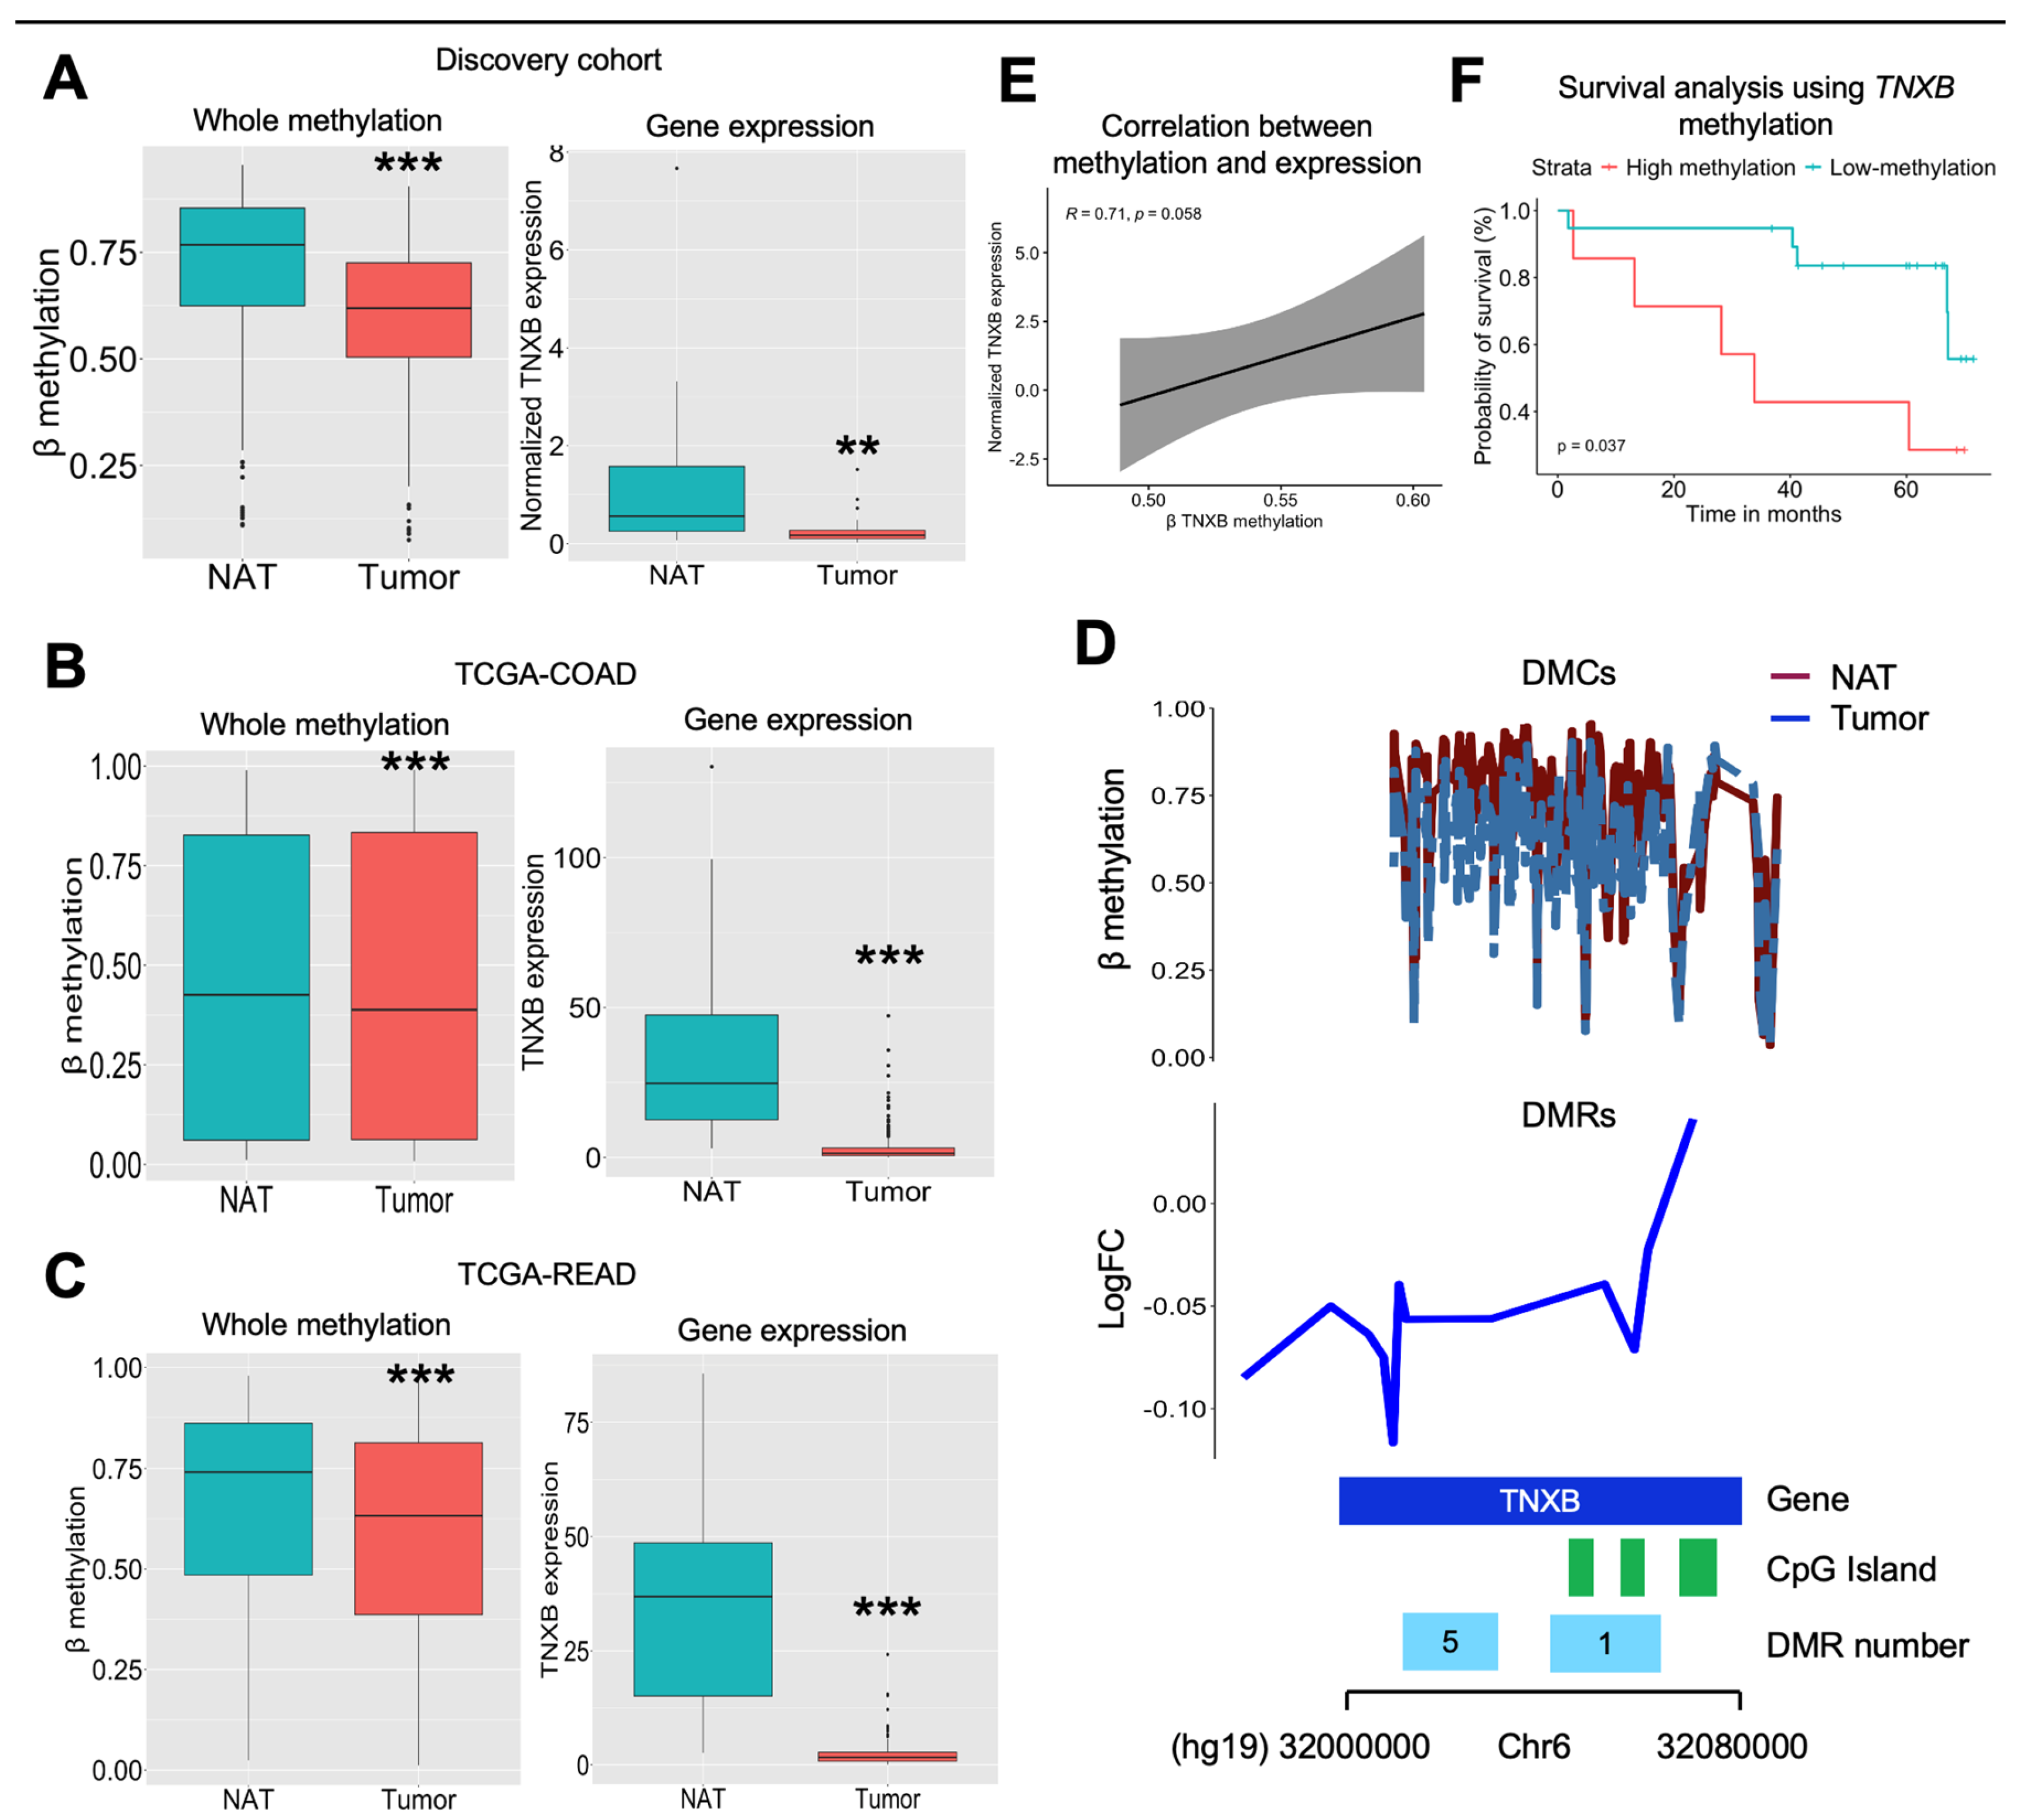
In our exploration of the TNXB gene within our cohort, we observed significant hypomethylation of the TNXB gene in the tumor area compared to the NAT area (p<0.001). Concurrently, we found a decreased mRNA expression in the tumor area in contrast to the NAT area (p<0.01), measured by qPCR and validated by public scRNASeq data (Figure 2A, Supplementary Figure 2A). To validate these findings, we analyzed the TCGA-COAD and TCGA-READ data, we found similar results, indicating consistent hypomethylation and decreased mRNA expression of the TNXB gene in the tumor area compared to the NAT area (all with p<0.001) (Figure 2B and Figure 2C). Upon specifically analyzing the total count of DMCs within the TNXB gene, we observed in our cohort, a widespread decrease in methylation levels across the gene in the tumor area compared to the NAT area (Figure 2D). Notably, this decrease in methylation was particularly evident within the CpG island, and within the DMR 1 and DMR 5 (both with p<0.001) (Supplementary Figure 2B). Intriguingly, DMR 1 encompasses three CpG islands, which demonstrated notable hypomethylation in the tumor area (all with p<0.001). Overall, there was a trend of positive correlation between TNXB methylation and expression (r=0.710; p=0.058) (Figure 2E). Finally, a Kaplan-Meier plot demonstrated that high TNXB methylation (the highest tertile) was associated with poorer overall survival compared to low methylation status (the middle and lowest tertiles) (p=0.037) (Figure 2F). There was also a trend when comparing the median value of TNXB methylation in our cohort (p=0.093) with that of TCGA-CAOD (p=0.080) (Supplementary Figure 2C).
Figure 2.
Validation analysis of TNXB gene. A) β methylation of the TNXB gene was extracted from the DNA array. We specifically selected DMCs sites located at the TNXB gene from both tumor and NAT samples. Asterisks indicate significant differences between the groups according to the Mann Whitney test (*p<0.05, **p<0.01, ***p<0.001). Normalized gene expression of TNXB gene in tumor (N=30) and NAT (N=24) area. Gene expression was normalized using PPIA gene, and using the following formula: 2-ΔCt. Asterisks indicate significant differences between the groups according to the Mann Whitney test (*p<0.05, **p<0.01, ***p<0.001). Gene expression (extracted from RNA-Seq analysis) and methylation of the TNXB gene extracted from B) TCGA-COAD and C) TCGA-READ. E) Correlation analysis using spearman correlation between TNXB methylation and expression (N=8). F) Kaplan-Meier analysis comparing high (highest and middle tertiles; N=20) and low (lowest tertile; N=7) methylation analysis. G) A representation of the total of DMCs and DMRs located at the TNXB gene. Representation of the DMR 1 and DMR 5 found in our study and belonging to the TNXB gene.
2.2. TNXB Gene Is Found to be Epigenetically Regulated
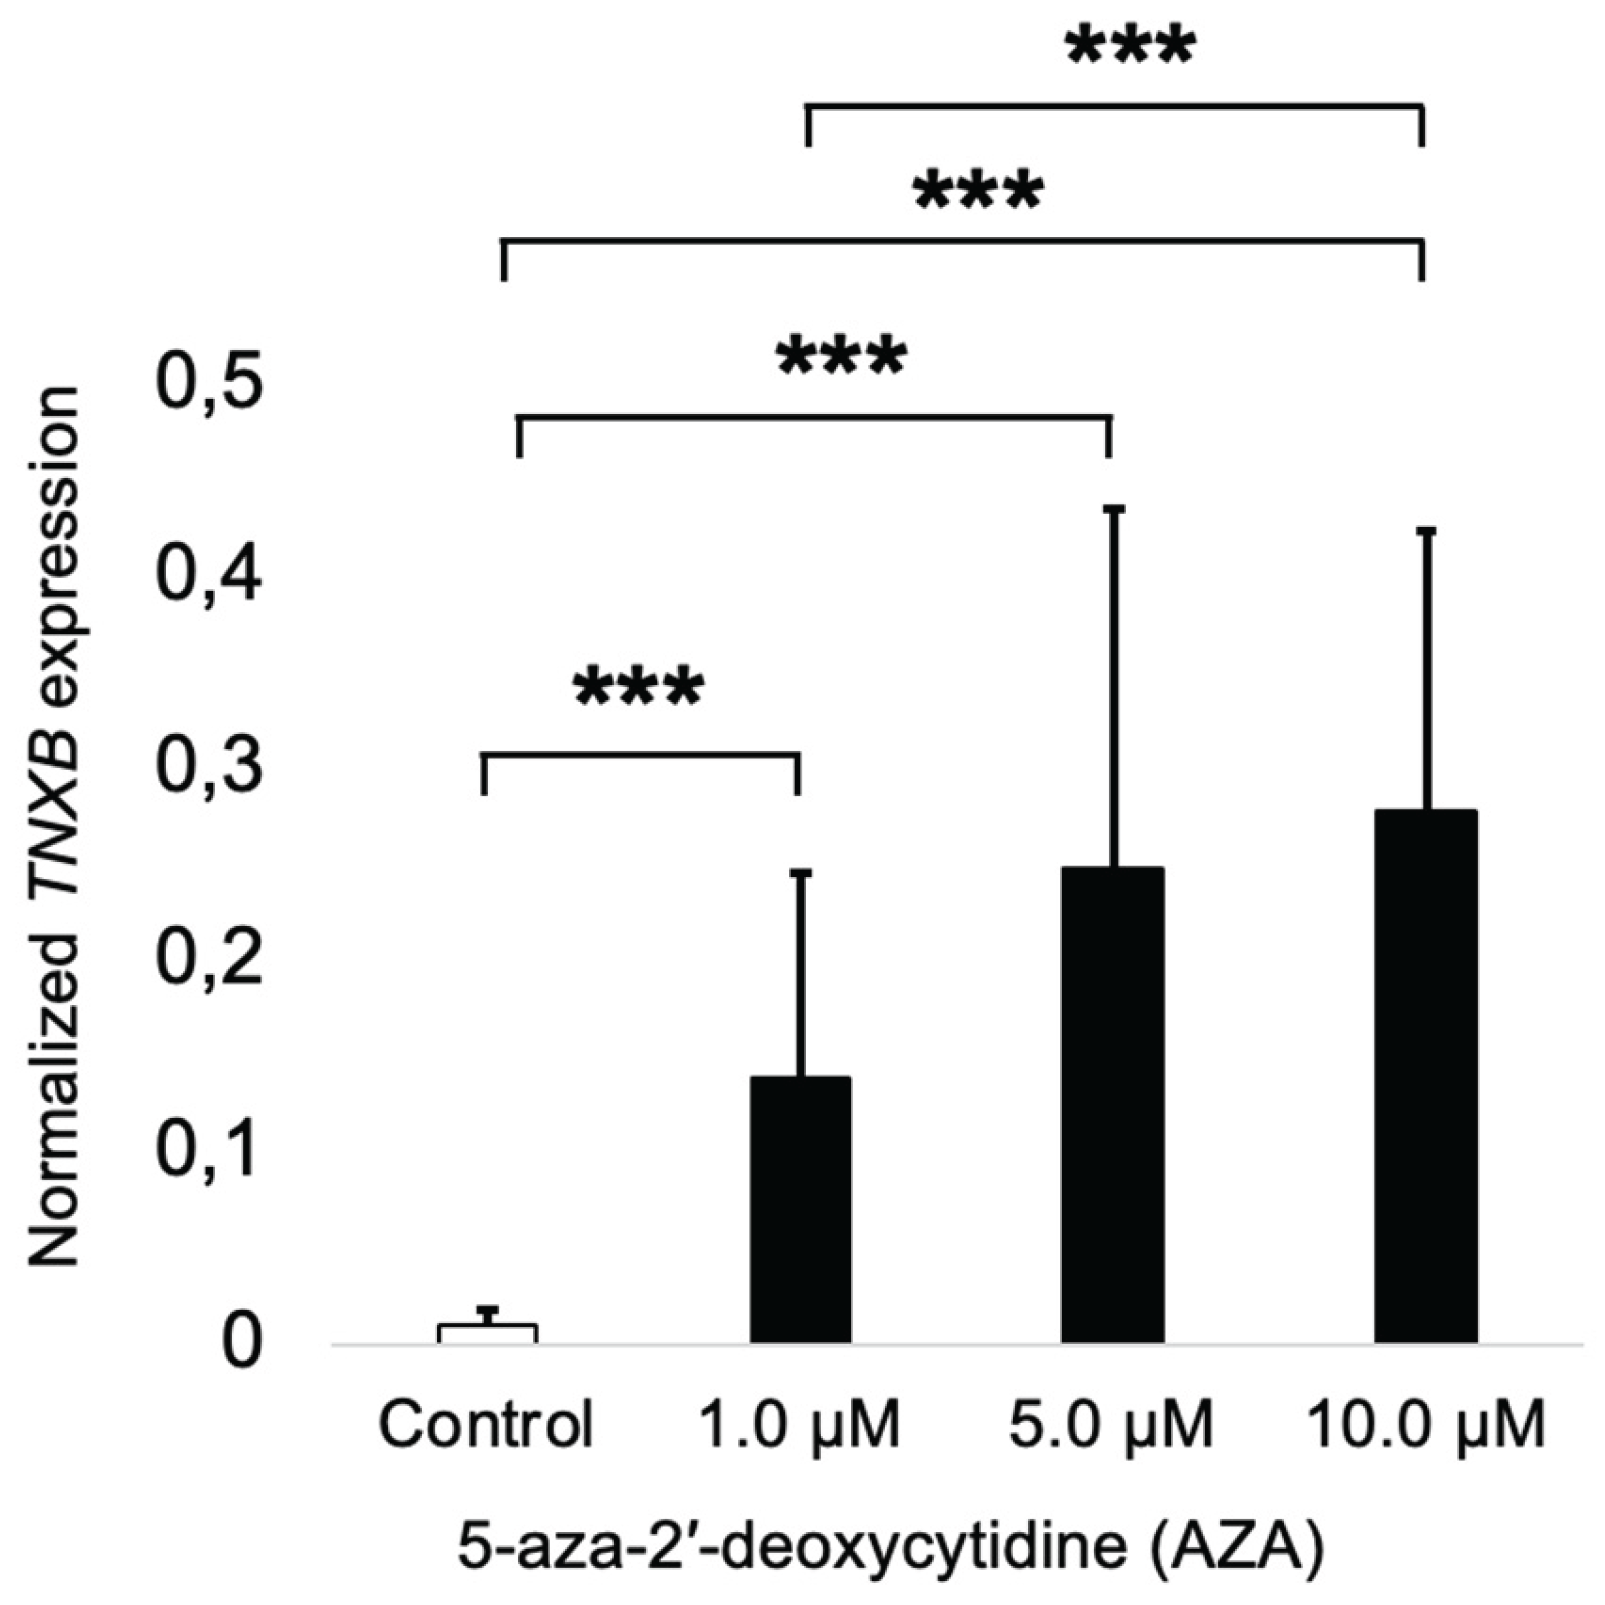
To test the effect of DNA methylation on the TNXB gene expression, we treated the HCT116 cells with AZA, a demethylating agent, for 72 hours. After that, we measured the gene expression of the TNXB gene to test the role of DNA methylation in gene expression. Accordingly, we found that AZA treatment induced overexpression of the TNXB gene at crescent concentrations (1, 5, and 10 µM) when compared to the vehicle (DMSO) (Figure 3). Interestingly, at 10 µM of AZA, the TNXB gene expression was significantly increased when compared to the treatment at 1 µM of AZA.
Figure 3.
Epigenetic dysregulation of TNXB in colorectal cancer cell line HCT116. HCT116 cells were treated with 5-Aza-2′-deoxycytidine (AZA) for 72 hours to induce DNA demethylation. TNXB gene expression was measured by quantitative RT-PCR. The results indicate that epigenetic silencing via DNA methylation regulates TNXB expression in colorectal cancer cells. Abbreviations: AZA, 5-Aza-2′-deoxycytidine; TNXB, Tenascin XB.
3. Discussion
Our study provides a comprehensive analysis of the DNA methylation profile in tumors from patients with CRC. We observed that colorectal tumors exhibit genome-wide hypomethylation but hypermethylation in the promoter regions. Epigenetically dysregulated genes predominantly influence specific metabolic processes and signaling pathways involved in the regulation of the cell cycle and cell adhesion. Through our filtered analyses, the TNXB gene emerges as a potential epimutation in CRC. Notably, TNXB is found to be hypomethylated and downregulated within the tumor area. Furthermore, functional analysis reveals that TNXB is epigenetically silenced, and downregulation of TNXB leading to increased cell migration and proliferation in CRC cell lines, suggesting its role as a tumor suppressor gene. This identified epigenetic alteration in TNXB could have clinical implications, serving as an indicator of malignant potential and the adverse effects associated with disease origin and progression in CRC.
Several studies have confirmed the useful utility of epigenome-wide DNA methylation in cancer research [13]. A recent study conducted by Janssens et al. (2023) identified 13 DMCs when compared colorectal adenoma vs colorectal carcinoma, with a high discrimination analysis, sensitivity and specificity [14]. Furthermore, a study performed by Baharudin et al. (2022) found a total of 26,093 DMCs, of which 650 were hypermethylated and 25,443 were hypomethylated, when comparing the tumor and NAT areas [15]. Both studies are in line with our findings. This observed phenomenon primarily stems from the loss of methylation in LINE1, significantly contributing to the manifestation of aberrant genetic phenotypes. These consequences include chromosomal instability, inactivation of tumor-suppressor genes, and the activation of oncogenes [16]. However, more research is needed to determine whether aberrant DNA methylation occurs early in carcinogenesis or late in the process [17]. In contrast, a study conducted by Naumov et al. (2013) discovered, by comparing differential methylation between cancerous and non-cancerous tumor tissue, more hypermethylated DMCs (10,342 CpG were hypermethylated and 5,325 were hypomethylated) [18]. Therefore, more studies are needed to validate the capability of DNA methylation to differentiate between normal and tumor tissues. This distinction represents an ongoing clinical requirement that has yet to be fulfilled.
Overall, several studies were focused on identifying specific mechanisms related to DNA methylation profile, to better understand the carcinogenesis process. Several studies have evaluated potential candidate for CRC diagnosis across diverse biological tissues [19,20]. However, their diagnostic accuracy for CRC and effectiveness in early detection in extensive independent cohorts require further enhancement and comprehensive validation [21]. This challenge persists due to the diversity and heterogeneity observed in CRC tumors, alongside additional cancer-independent factors. In some cases, abnormal DNA methylation occurring in a specific locus becomes constitutive. Various epigenetically silenced genes have been identified in CRC, such as MLH1 or APC [22,23]. In our study, we found the aberrant hypomethylation of the TNXB gene, in which constitutive silencing may lead to several cancer outcomes, some of them are evaluated in this study.
The TNXB gene, responsible for encoding tenascin-X, plays a crucial role in organizing and preserving the integrity of connective tissues and the extracellular matrix. Its function involves inhibiting cell migration, accelerating collagen fibril formation, and supporting the growth of epithelial tumors and cell plasticity [24]. In the cancer context, TNXB expression tends to decrease during cancer progression, while increased expression has been linked to a better prognosis [25]. Despite its significance, there exists a knowledge gap regarding the methylation status of TNXB in existing literature. Barrow and colleagues (2017) discovered significant hypomethylation of four loci associated with the TNXB gene in adjacent mucosa from active smokers when compared to never smokers in colorectal tumors [26]. Izquierdo et al. (2022) found a similar pattern in the adipose tissue from patients with CRC when compared to healthy participants [27]. Other studies related TNXB to colorectal carcinogenesis, suggesting a potential link [28,29]. In our study, we identified that the TNXB gene is largely hypomethylated and downregulated in CRC tumors, which was further validated with the TCGA cohorts, suggesting a potential role in CRC. This hypothesis was confirmed by treating HCT116 cells with a DNA demethylating agent. We found that TNXB expression was restored after treatment, indicating that the TNXB is epigenetically regulated in CRC.
4. Materials and Methods
4.1. Study Design and Participants
This study included participants from the University Hospital “Virgen de la Victoria,” recruited between 2012 and 2014. We included 76 patients with CRC who underwent surgery with curative intent. These patients were diagnosed by a pathology specialist, using a biopsy and a colonoscopy. All medical records and pathological examinations were reported to confirm the diagnosis. All biopsy samples were classified according to the histological features by pathologists, and to the “World Health Organization Classification of Tumors of the Digestive System” (2016) [30]. Patients with CRC had hemicolectomy and lower anterior resection with ileostomy (due to colorectal carcinoma), followed by total meso-colorectal excision. All patients had at least a 5-year follow-up. This follow-up entailed a clinical visit every three months for the first two years, then every six months beginning in the third year. At each checkup, biochemical variables were measured. Furthermore, a physical examination, biochemical test and a colonoscopy were performed. Finally, we also included 79 healthy participants (cancer free), who underwent hiatus hernia surgery or a cholecystectomy.
Patients with inflammatory acute and chronic diseases, familial polyposis, or those patients who had chemotherapy or radiotherapy treatments were excluded. Participants with infection, renal or cardiovascular diseases, or patients who received treatment that altered their lipid, glucose, calcium, or vitamin D profiles were also excluded.
4.2. Samples Included in the Study
Blood samples were obtained from all the participants. Serum samples were extracted from blood samples by centrifugation at 4,000 r.p.m. for 15 min at 4ºC. Tumor samples that contain both the tumor area and the normal adjacent tumor-free area (NAT) were obtained from biopsy samples. Formol was used to fix the samples, followed by formalin-fixed paraffin-embedded (FFPE). Pathologists determine the limits between the tumor and adjacent tumor-free area and the percentage of tumoral cells within the tumor area, which is greater than 80% of the tumor cell percentage.
4.3. DNA and RNA Extraction
The Qiamp DNA Tissue Kit (Qiagen GmbH, Hilden, Germany) was used to extract genomic. DNA from tumor samples was isolated from 5-10 sections of 14 μm of FFPE samples from the tumor area and the NAT area, using a Qiamp DNA FFPE Tissue Kit under the instructions of the manufacturer (Qiagen GmbH, Hilden, Germany), with a xylene wash to remove the paraffin. DNA integrity was determined using the NanoDrop ND-1000 (Thermo Fisher Scientific, Indianapolis, USA) at 260/280 and 260/230 ratios and confirmed by electrophoresis in a 1.5% agarose gel in TAE/TBE buffer. The Pico Green dsDNA Quantitation Reagent (Invitrogen, Carlsbad, CA) was used to analyze DNA integrity further and quantify DNA concentrations.
For RNA extraction, RNA from FFPE samples of tumor area and NAT area were isolated from 5–10 sections of 14 μm, using a RNeasy FFPE Kit under the instructions of the manufacturer (Qiagen GmbH, Hilden, Germany). The Total RNA Purification Kit (Norgen Biotek Corp., ON, Canada) was used to isolate total RNA from cells (at a density of 1x10⁴-1x10⁵ cells) according to the manufacturer’s instructions. To generate first-strand cDNA synthesis, we used 1 μg of total extracted RNA, and random primers using the PrimeScript™ RT-PCR Kit as indicated by the manufacturer.
4.4. Laboratory Measurements
We measured fasting glucose, total cholesterol, triglycerides, and high-density lipoprotein (HDL) cholesterol levels using the Dimension Autoanalyzer (Dade Behring Inc., Deerfield, IL, USA). We calculated low-density lipoprotein (LDL) cholesterol using the Friedewald equation [31]. Fasting insulin levels were measured using radioimmunoassay methods with BioSource International Inc. (Camarillo, CA, USA). The insulin resistance homeostasis model assessment (HOMA-IR) was calculated using the following equation: HOMA-IR = fasting insulin (IU/mL) fasting glucose (mmol/L)/22.5 [32]. Carcinoembryonic Antigen (CEA) and carbohydrate antigen 19.9 (CA19.9) were measured by ELISA (DRG diagnostics, Germany). An ELISA kit (Immundiagnostik, Bensheim, Germany) was used to measure serum 25-hydroxyvitamin D (25(OH)D).
4.5. Bisulfite Reaction and Genome-Wide DNA Methylation Analysis
For the study of genome-wide methylation analysis, high-quality genomic DNA samples (500 ng) from the tumor area (N = 27), the NAT area (N = 15) were subjected to bisulfite treatment using the EZ-96 DNA Methylation kit (Zymo Research, Irvine, CA) following the manufacturer’s instructions and as previously described [27]. Subsequently, DNA methylation was analyzed by microarray assays using Infinium Human Methylation 450K bead chip technology (Illumina, San Diego, CA). DNA quality checks, bisulfite modification, hybridization, data normalization, statistical filtering, and value calculation were performed. Whole-genome amplification and hybridization were then performed using BeadChip, followed by single-base extension and analysis using the HiScan SQ module (Illumina) to assess the cytosine methylation states. DNA methylation for each CpG site was represented by beta values ranging from 0 to 1, corresponding to fully unmethylated and fully methylated, respectively.
For the validation of global DNA methylation, we used the DNA methylation of LINE1 (long interspersed nuclear elements 1) as a global DNA methylation marker. Primer sequences are as previously described [4]. A PCR reaction was conducted using a primer concentration of 0.2 nmol/L. DNA pyrosequencing was performed using the PyroMark Q96 ID pyrosequencing System (Qiagen GmbH, Hilden, Germany). The methylation average was presented as the percentage of methylated cytosine over the sum of methylated and unmethylated cytosines. Unmethylated and methylated DNA were used as controls (New England Biolabs, UK).
4.6. Gene Expression Analysis
For the quantification of GAPDH (GlycerAldehyde-3-Phosphate Dehydrogenase) (Hs.PT.39a.22214836), and TNXB (Tenascin XB) (Hs.PT.58.39823090.gs) genes we used commercially available TaqMan primer/probe mix (Integrated DNA Technologies Inc., Madrid, Spain). Gene expression was conducted using Premix Ex Taq™️ (Probe qPCR) (Takara Bio USA, Inc., Mountain View, CA), according to the instructions of the manufacturer. With TaqMan technology, gene expression was carried out by real-time PCR using QuantStudio 6 Pro (Applied Biosystems, Darmstadt, Germany). Changes in gene expression were normalized by the 2-ΔCt method [33]. The expression results were represented as the target gene/PPIA ratio.
4.7. Cell Culture
HCT116 (ATCC CCL-247™) and Caco2 (ATCC HTB-37™) human colorectal carcinoma cells were cultured in Dulbecco′s Modified Eagle′s Medium—low glucose (Biowest, France), plus 10% fetal bovine serum (FBS) (Gibco, CA, USA), 1% of L-glutamine and 1% of streptomycin/penicillin at 37 °C and 5% CO2. Cells were periodically checked for mycoplasma using DAPI analysis [34] and PCR using universal primers [35]. HCT116 are maintained at passages lower than 20. All cell experiments were conducted in triplicates and three independent replicates.
4.8. DNA Demethylation In Vitro
For 5-Aza-2 -deoxycytidine (AZA) (A3656, Sigma Aldrich, Madrid, Spain) treatment as an inhibitor of DNA methyltransferases (DNMTs), cells were treated with 1 µM, 5 µM and 10 µM of AZA for 72 hours. The media were renewed every 48 hours. RNA extraction was performed after 72 hours of treatment.
4.9. Bioinformatic Analysis: DNA Methylation Analysis, TCGA Data and Single-Cell Analysis
The minfi package and the ChAMP pipeline from Bioconductor were used with default settings for DNA methylation analysis [36,37]. Probes with p-values above 0.01 were excluded. Normalization and preprocessing were conducted using the minfi package. Probes were stratified for quantile normalization preprocessing for Illumina methylation microarrays. Probes are stratified by region, and bad samples were eliminated using the median of methylated and unmethylated signal for each sample. Probes with single nucleotide polymorphisms at CpG or single-base extension sites and sex chromosomes were removed. Finally, we obtained M values for further investigation. For the ChAMP pipeline, quality checks and normalization of β values were performed using the BMIQ method. Principal component analysis (PCA) and total and promoter methylation were conducted using the ChAMP pipeline. The Miami plot was conducted using qqman package [38]. Differential analysis was adjusted for age, sex and BMI (obesity was classified with a BMI≤25 kg/m2). The gene–protein interaction network was constructed according to STRING analysis [39]. Gene ontology (GO) and Kyoto Encyclopedia of Genes and Genomes (KEGG) pathway analysis was conducted to explore the function of the genes related to CRC using the gometh function in the missMethyl package [38].
TCGA-COAD (colon adenocarcinoma) and TCGA-READ (rectal adenocarcinoma) methylation data were obtained from The Cancer Genome Atlas (TCGA) database (Cancer Genome Atlas Research) [40]. IDAT files from 308 cancer cases and 41 NAT from TCGA-COAD and 94 cancer cases and 10 NAT from TCGA-READ were included, downloaded and processed using the TCGAbiolinks R packages [41]. Data were filtered, normalized and preprocessed following similar protocols as described above. Survival analyses were extracted from the OncoDB web tool [42]. We used normalized RNA-sequencing (RNA-seq) expression data from TCGA-COAD and TCGA-READ using the TCGAbiolinks R package to identify differentially expressed genes. Results from single-cell analysis using 52,609 cells were extracted from results published by Lee HO et al. (2020) [43], using the EMBL-EBI platform: https://www.ebi.ac.uk/
4.10. Statistical Analysis
The results are presented as mean ± standard deviation (SD) for continuous variables and as numbers (percentages) for categorical variables. A Student t-test or Mann-Whitney test was applied according to the normality of the variables. Pearson correlation coefficients between methylation and anthropometric and biochemical parameters and multivariate linear regression were performed. Kaplan–Meier curves were used for overall survival analyses. Hazard ratio (HR) was performed using multivariate Cox proportional hazards regression for methylation. Analyses and graphic representation were pointed out, performed using R v.3.5.1 software (Integrated Development for R. RStudio, PBC, Boston, MA, USA), and the significance p value was set at p < 0.05 [44].
5. Conclusions
Our study, employing epigenome-wide DNA methylation analysis, underscores a dysregulation in the epigenetic landscape in CRC. We found an overall hypomethylation in tumor tissue, primarily focusing on the TNXB gene. TNXB was mainly hypomethylated and downregulated. Functional analysis revealed the TNXB is epigenetically regulated, in which downregulation of TNXB increased cell migration and proliferation, suggesting its role as a tumor suppressor gene. Further research is necessary to gain a deeper understanding of the role of TNXB in the pathophysiology of CRC.
Supplementary Materials
The following supporting information can be downloaded at the website of this paper posted on Preprints.org, Figure S1, Figure S2, Table S1, Table S2 and Table S3.
Author Contributions
HB and MMG designed research studies. FJT and MMG supervised the study. HB, JP, LAGF, ABC, AGI, MMG, conducted experiments. JA conducted follow-up of patients with CRC. HB and JP provided statistics analysis. HB and JP acquired data. HB and MMG wrote the manuscript. HB, JP, and LAGF and MMG analyzed data. All authors revised the manuscript.
Funding
This study was supported by “Centro de Investigacion Biomédica en Red Fisiopatología de la Obesidad y Nutricion”(CiberObn), which is an initiative of the “Instituto de Salud Carlos III” (ISCIII) of Spain. This work was supported by the Carlos III Health Institute (PI21/00633), co-funded by the European Union, and a grant from Consejeria Universidad, Investigacion e Innovacion Junta de Andalucia (PY20-01270). HB is supported by a predoctoral fellowship (“Plan Propio IBIMA 2020 A.1 Contratos predoctorales”, Ref.: predoc20_002) and by a “Sara Borrell” postdoctoral contract (CD22/00053) from the Instituto de Salud Carlos III—Madrid (Spain),”Financiado por la Unión Europea—NextGenerationEU” y mediante el Plan de Recuperación, Transformación y Resiliencia. LAGF was supported by a “Sara Borrell” postdoctoral contract (CD21/000131) from the Instituto de Salud Carlos III—Madrid (Spain). M.M.G. was the recipient of the Nicolas Monardes Programme from the “Servicio Andaluz de Salud, Junta de Andalucia”, Spain (RC-0001-2018 and C-0029-2014).
Institutional Review Board Statement
All participants gave written informed consent. The study was conducted in accordance with the guidelines laid down in the Declaration of Helsinki. This study was reviewed and approved by the Ethics and Research Committee of the University Hospital “Virgen de la Victoria” (Reference code: 0311/PI7).
Informed Consent Statement
Informed consent was obtained from all subjects involved in the study
Conflicts of Interest
The authors declare no conflicts of interest
References
- [1] H. Sung et al., “Global Cancer Statistics 2020: GLOBOCAN Estimates of Incidence and Mortality Worldwide for 36 Cancers in 185 Countries,” CA Cancer J Clin, vol. 71, no. 3, pp. 209–249, May 2021. [CrossRef]
- [2] F. Petrelli et al., “Prognostic survival associated with left-sided vs right-sided colon cancer a systematic review and meta-analysis,” JAMA Oncol, vol. 3, no. 2, pp. 211–219, Feb. 2017. [CrossRef]
- [3] H. Akhavan-Niaki and A. A. Samadani, “DNA methylation and cancer development: molecular mechanism,” Cell Biochem Biophys, vol. 67, no. 2, pp. 501–513, Nov. 2013. [CrossRef]
- [4] H. Boughanem et al., “Impact of Tumor LINE-1 Methylation Level and Neoadjuvant Treatment and Its Association with Colorectal Cancer Survival,” J Pers Med, vol. 10, no. 4, p. 219, Nov. 2020. [CrossRef]
- [5] A. Cabrera-Mulero et al., “Novel SFRP2 DNA Methylation Profile Following Neoadjuvant Therapy in Colorectal Cancer Patients with Different Grades of BMI.,” J Clin Med, vol. 8, no. 7, Jul. 2019. [CrossRef]
- [6] C. H. Kim, J. W. Huh, H. R. Kim, and Y. J. Kim, “CpG island methylator phenotype is an independent predictor of survival after curative resection for colorectal cancer: A prospective cohort study,” Journal of Gastroenterology and Hepatology (Australia), 2017. [CrossRef]
- [7] N. Fatemi et al., “DNA methylation biomarkers in colorectal cancer: Clinical applications for precision medicine,” Int J Cancer, vol. 151, no. 12, pp. 2068–2081, Dec. 2022. [CrossRef]
- [8] E. Dámaso et al., “Comprehensive Constitutional Genetic and Epigenetic Characterization of Lynch-Like Individuals,” Cancers (Basel), vol. 12, no. 7, pp. 1–32, Jul. 2020. [CrossRef]
- [9] R. Baharudin et al., “Epigenome-Wide DNA Methylation Profiling in Colorectal Cancer and Normal Adjacent Colon Using Infinium Human Methylation 450K,” Diagnostics (Basel), vol. 12, no. 1, Jan. 2022. [CrossRef]
- [10] Q. Yang, T. Huang, G. Ye, B. Wang, and X. Zhang, “Methylation of SFRP2 gene as a promising noninvasive biomarker using feces in colorectal cancer diagnosis: A systematic meta-analysis,” Sci Rep, 2016. [CrossRef]
- [11] X. Liu et al., “DNA methylation of SFRP1, SFRP2, and WIF1 and prognosis of postoperative colorectal cancer patients,” BMC Cancer, 2019. [CrossRef]
- [12] A. Gutierrez, H. Demond, P. Brebi, and C. G. Ili, “Novel Methylation Biomarkers for Colorectal Cancer Prognosis,” Biomolecules, vol. 11, no. 11, Nov. 2021. [CrossRef]
- [13] J. Sandoval et al., “Validation of a DNA methylation microarray for 450,000 CpG sites in the human genome,” Epigenetics, vol. 6, no. 6, pp. 692–702, 2011. [CrossRef]
- [14] K. Janssens et al., “Epigenome-wide methylation analysis of colorectal carcinoma, adenoma and normal tissue reveals novel biomarkers addressing unmet clinical needs,” Clin Epigenetics, vol. 15, no. 1, pp. 1–14, Dec. 2023. [CrossRef]
- [15] R. Baharudin et al., “Epigenome-Wide DNA Methylation Profiling in Colorectal Cancer and Normal Adjacent Colon Using Infinium Human Methylation 450K,” Diagnostics (Basel), vol. 12, no. 1, Jan. 2022. [CrossRef]
- [16] M. Esteller, “Epigenetics in Cancer. vol. 358, no. 11, pp. 1148–1159, Mar. 2008. [CrossRef]
- [17] J. W. T. Tse, L. J. Jenkins, F. Chionh, and J. M. Mariadason, “Aberrant DNA Methylation in Colorectal Cancer: What Should We Target?,” Trends Cancer, vol. 3, no. 10, pp. 698–712, 2017. [CrossRef]
- [18] V. A. Naumov et al., “Genome-scale analysis of DNA methylation in colorectal cancer using Infinium HumanMethylation450 BeadChips,” Epigenetics, vol. 8, no. 9, p. 921, Sep. 2013. [CrossRef]
- [19] A. B. Crujeiras et al., “Identification of an episignature of human colorectal cancer associated with obesity by genome-wide DNA methylation analysis,” Int J Obes (Lond), vol. 43, no. 1, pp. 176–188, Jan. 2019. [CrossRef]
- [20] J. Ruiz-Bañobre et al., “Noninvasive early detection of colorectal cancer by hypermethylation of the LINC00473 promoter in plasma cell-free DNA,” Clin Epigenetics, vol. 14, no. 1, Dec. 2022. [CrossRef]
- [21] G. Jung, E. Hernández-Illán, L. Moreira, F. Balaguer, and A. Goel, “Epigenetics of colorectal cancer: biomarker and therapeutic potential,” Nature Reviews Gastroenterology & Hepatology 2020 17:2, vol. 17, no. 2, pp. 111–130, Jan. 2020. [CrossRef]
- [22] M. P. Hitchins and R. L. Ward, “Constitutional (germline) MLH1 epimutation as an aetiological mechanism for hereditary non-polyposis colorectal cancer,” J Med Genet, vol. 46, no. 12, pp. 793–802, Dec. 2009. [CrossRef]
- [23] K. Banno et al., “Epimutation and cancer: a new carcinogenic mechanism of Lynch syndrome (Review).,” Int J Oncol, vol. 41, no. 3, pp. 793–7, Sep. 2012. [CrossRef]
- [24] U. Valcourt, L. B. Alcaraz, J. Y. Exposito, C. Lethias, and L. Bartholin, “Tenascin-X: beyond the architectural function,” Cell Adh Migr, vol. 9, no. 1–2, p. 154, 2015. [CrossRef]
- [25] S. Liot et al., “Loss of Tenascin-X expression during tumor progression: A new pan-cancer marker,” Matrix Biol Plus, vol. 6–7, May 2020. [CrossRef]
- [26] T. M. Barrow et al., “Smoking is associated with hypermethylation of the APC 1A promoter in colorectal cancer: the ColoCare Study,” J Pathol, vol. 243, no. 3, p. 366, Nov. 2017. [CrossRef]
- [27] A. G. Izquierdo et al., “DNA methylome in visceral adipose tissue can discriminate patients with and without colorectal cancer,” Epigenetics, pp. 1–12, Jul. 2021. [CrossRef]
- [28] M. Sen Huang et al., “Proteomics and liquid biopsy characterization of human EMT-related metastasis in colorectal cancer,” Front Oncol, vol. 12, Sep. 2022. [CrossRef]
- [29] K. Urh, N. Zidar, and E. Boštjančič, “Bioinformatics Analysis of RNA-seq Data Reveals Genes Related to Cancer Stem Cells in Colorectal Cancerogenesis,” Int J Mol Sci, vol. 23, no. 21, Nov. 2022. [CrossRef]
- [30] Carr N.J and Robin L.H., WHO Classification of Tumors of the Digestive System, Fourth Edition. 2010.
- [31] W. T. Friedewald, R. I. Levy, and D. S. Fredrickson, “Estimation of the concentration of low-density lipoprotein cholesterol in plasma, without use of the preparative ultracentrifuge.,” Clin Chem, 1972. [CrossRef]
- [32] H. Boughanem et al., “Transcriptional analysis of FOXO1, C/EBP-α and PPAR-γ2 genes and their association with obesityrelated insulin resistance,” Genes (Basel), vol. 10, no. 9, 2019. [CrossRef]
- [33] K. J. Livak and T. D. Schmittgen, “Analysis of relative gene expression data using real-time quantitative PCR and the 2-ΔΔCT method,” Methods, vol. 25, no. 4, pp. 402–408, 2001. [CrossRef]
- [34] ”Protocol Mycoplasma Detection Test.” Accessed: Nov. 23, 2022. [Online]. Available: https://projects.iq.harvard.edu/files/hlalab/files/mycoplasm-test_hla.pdf.
- [35] V. Molla Kazemiha et al., “PCR-based detection and eradication of mycoplasmal infections from various mammalian cell lines: a local experience,” Cytotechnology, vol. 61, no. 3, p. 117, Dec. 2009. [CrossRef]
- [36] M. J. Aryee et al., “Minfi: A flexible and comprehensive Bioconductor package for the analysis of Infinium DNA methylation microarrays,” Bioinformatics, 2014. [CrossRef]
- [37] Y. Tian et al., “ChAMP: Updated methylation analysis pipeline for Illumina BeadChips,” Bioinformatics, 2017. [CrossRef]
- [38] B. Phipson, J. Maksimovic, and A. Oshlack, “MissMethyl: An R package for analyzing data from Illumina’s HumanMethylation450 platform,” Bioinformatics, 2016. [CrossRef]
- [39] S. D. Turner, “qqman: an R package for visualizing GWAS results using Q-Q and manhattan plots,” J Open Source Softw, vol. 3, no. 25, p. 731, May 2018. [CrossRef]
- [40] ”The Cancer Genome Atlas—Citing TCGA—NCI.” Accessed: Nov. 28, 2022. [Online]. Available: https://www.cancer.gov/about-nci/organization/ccg/research/structural-genomics/tcga/using-tcga/citing-tcga.
- [41] A. Colaprico et al., “TCGAbiolinks: an R/Bioconductor package for integrative analysis of TCGA data,” Nucleic Acids Res, vol. 44, no. 8, pp. e71–e71, May 2016. [CrossRef]
- [42] G. Tang, M. Cho, and X. Wang, “OncoDB: an interactive online database for analysis of gene expression and viral infection in cancer,” Nucleic Acids Res, vol. 50, no. D1, pp. D1334–D1339, Jan. 2022. [CrossRef]
- [43] H. O. Lee et al., “Lineage-dependent gene expression programs influence the immune landscape of colorectal cancer,” Nature Genetics 2020 52:6, vol. 52, no. 6, pp. 594–603, May 2020. [CrossRef]
- [44] RStudio Team, “RStudio: Integrated Development for R. RStudio,” RStudio, Inc., Boston, MA.
Disclaimer/Publisher’s Note: The statements, opinions and data contained in all publications are solely those of the individual author(s) and contributor(s) and not of MDPI and/or the editor(s). MDPI and/or the editor(s) disclaim responsibility for any injury to people or property resulting from any ideas, methods, instructions or products referred to in the content. |
© 2025 by the authors. Licensee MDPI, Basel, Switzerland. This article is an open access article distributed under the terms and conditions of the Creative Commons Attribution (CC BY) license (http://creativecommons.org/licenses/by/4.0/).
Copyright: This open access article is published under a Creative Commons CC BY 4.0 license, which permit the free download, distribution, and reuse, provided that the author and preprint are cited in any reuse.


