
Submitted:
06 January 2025
Posted:
07 January 2025
You are already at the latest version
Abstract
DNA methylation of tumor suppressor genes in cancer is known to be a mechanism for silencing gene expression, but much remains unknown about its extent, degree, and rela-tionship to somatic variants at the DNA sequence level. In this study, we comprehensively analyzed DNA methylation and somatic variants of all gene regions across the genome of the major tumor suppressor genes, APC, TP53, SMAD4, and mismatch repair genes in colorectal cancer using a novel next-generation sequencing-based analysis method. The Targeted Methyl Landscape (TML) shows that DNA hypermethylation patterns of these tumor suppressor genes in colorectal cancer are more complex and widespread than pre-viously thought. Extremely high levels of DNA methylation were observed in relatively long regions around exon 1A of APC and exon 1 and surrounding region of MLH1. DNA hypermethylation occurred either alone in tumors without somatic variants or in tumors with somatic variants indicating loss of heterozygosity that were additionally methylated at the same genes. Our data demonstrate that somatic variants and hypermethylation of these tumor suppressor genes were considered independent, parallel events, not exclusive of each other or one event affecting the other.
Keywords:
colorectal cancer
; tumor suppressor gene
; DNA methylation
; somatic variant
; loss of heterozygosity (LOH)
; next-generation sequencing (NGS)
1. Introduction
DNA methylation as a somatic variant is one of the best known mechanisms for tumor suppressor gene inactivation in cancer [1,2,3]. Research on DNA methylation has typically focused on the gene promoter located in the CpG island upstream of exon 1[4,5,6,7], but it is unclear which regions of DNA are actually altered in methylation status in cancer. There are no reports on the simultaneous analysis of somatic variants in DNA sequences and DNA methylation in the entire genomic region where a specific tumor suppressor gene is located and the relationship between them. In colorectal cancer, a multi-step genetic variant-based mechanism of carcinogenesis has been demonstrated and the major tumor suppressor genes involved have been identified[8,9,10]. All colorectal cancers begin as benign adenomas and are accelerated by successive somatic gene variants that promote malignant progression. Activation of the WNT signaling pathway is essential for the initiation of colorectal cancer, and the APC (APC regulator of WNT signaling pathway) gene on chromosome 5q22.2 acts as a gatekeeper for this pathway. Biallelic inactivation of the APC gene, loss of heterozygosity (LOH), is required for the development of colorectal cancer, and germline mutations in APC cause familial adenomatous polyposis. DNA methylation may be a second hit mutation in APC in sporadic colorectal cancer, but details are unknown. Gain-of-function variants of KRAS and inactivation of TP53 are frequently involved in chromosomal instability, CIN (84%). On the other hand, inactivation of mismatch repair (MMR) genes (MSH2, MSH6, MLH1, and PMS2) is associated with microsatellite instability and hypermutation (13%), and germline variants in MMR genes cause Lynch syndrome (hereditary nonpolyposis colon cancer)[11]. Hypermethylation of tumor suppressor genes has also been reported in colorectal cancer[12,13,14]. Since the molecular mechanisms leading to carcinogenesis are relatively clear, colorectal cancer is a suitable subject for DNA methylation analysis as a second hit.
In this study, we develop a novel approach using next-generation sequencing (NGS) to simultaneously analyze somatic variants and DNA methylation in these key tumor suppressor genes in sporadic colorectal cancer across the entire genomic region where the genes reside. Tumor DNA and normal tissue DNA were extracted from surgically resected tissue of a colorectal cancer patient, and three different libraries were generated and simultaneously analyzed by NGS. vLAS (very long amplicon sequencing) is a targeted DNA-Seq based on long range PCR-based NGS, and by determining the DNA sequence of the entire gene region, including the intron, it is possible to detect not only point mutations in exons and their surrounding areas, but also structural variants such as large deletions and splicing abnormalities due to deep intron variants. TgCap (targeted genome capture) is a capture sequencing method that uses biotin-labeled probes generated from fragments of long PCR products. It can be used even when the sample DNA is degraded and cannot be amplified by long PCR, and like vLAS, it can also cover the entire genomic region of the target gene. TML (targeted methyl landscape) is a method to perform targeted methyl-Seq on the entire region covered by TgCap, in which the DNA captured by TgCap is first bisulfite treated and then amplified to obtain the final library.
The objectives of this study are to verify the utility of these new NGS techniques and to clarify the nature of somatic variants that inactivate key tumor suppressor genes in colorectal cancer, the extent and degree of cancer-specific DNA methylation, and the relationships between them. To achieve this, we performed a comparative analysis of DNA extracted from colorectal cancer tissue and normal colon tissue obtained from surgical specimens from 32 patients for APC, TP53, SMAD4, MSH2, MSH6, MLH1, and PMS2 genes using these integrated methods.
2. Results
2.1. Clinical Profile of the Patients
The clinical profile of the 32 patients with colorectal cancer in this study is shown in Table 1. The mean age at the time of colectomy was 72.7 years, and the male to female ratio was 1:1. Postoperative pathologic examination revealed KRAS variants in 12 patients, BRAF variants in 4 patients, and MSI-H (microsatellite instability high) in 5 patients. The location of the tumors was variable, and no consistent trends could be observed.
2.2. Overview of Analysis Results for Each Library
vLAS, TgCAp and TML all achieved continuous coverage of the target area. Continuity of coverage was better with vLAS than with TgCap and TML. In vLAS, equimolar mixtures of each long PCR product were used for library preparation on the Nextera system (illumina, San Diego, CA, USA), but differences in depth were observed on an amplicon-by-amplicon basis. This phenomenon suggested the possibility that DNA sequencing and the higher order structure of long PCR products could lead to differences in fragmentation efficiency by the Nextera system. In TgCap, repetitive sequences are blocked by Cot1 DNA during probe capture, and this effect was thought to be particularly related to reduced coverage of intron sequences within the target region. Of the 32 samples, 5 samples (ST-15, ST-20, ST-29, ST-56, and ST76) had degraded DNA that could not be subjected to the long PCR, making it impossible to analyze them by vLAS. On the other hand, TgCap could be performed on all samples. There was no difference in variant detection in samples where both vLAS and TgCap were performed.
TML allowed the entire genomic region of each gene of interest to be serially assessed for CpG methylation status. It showed that the CpG sequences of the target genes were mostly methylated, but there was a gap indicating hypomethylation on the 5' side of the gene (Figure 1, yellow arrows), which is supposed to corelate with the promoter region. However, the size of the gap varied from gene to gene. It extended not only upstream of exon 1 but also into part of intron 1. The size of the gap is largest in TP53, which is a region of about 5 kb continuous with the 5' upstream of the adjacent WRAP53 in the inverse direction. APC has two gaps at Ex1A and Ex1B. MSH2 also has two gaps at the boundary region of EPCAM and in the repeat region from intron 1 to intron 2 of MSH2. Thus, the distribution of hypomethylated regions thought to be associated with promoters varies from gene to gene and may be more widespread than previously thought. As described below, differences in methylation were observed in these regions between normal and tumor tissues, but no other regions were found that showed clear differences. Although vLAS and TgCap are able to detect structural variants such as large deletions, insertions or inversions within genes, all variants detected in tumor DNA were point mutations and no structural variants were observed. Deep intron splice variants were also searched for with SpliceAI, but no variants meeting the criteria were detected.
2.3. Variants Detected in Tumor Suppressor Genes
Table 2 and Table 3 summarize the somatic gene variants detected in this study. A more detailed description of the variants is provided in Supplementary Table S1. Consistent with the theory that most colorectal cancers begin with biallelic loss-of-function variants of APC, APC variants were detected in 24 of 32 (75%) tumor DNAs. Most of the variants were frameshift or nonsense (null) variants. TP53 variants were also detected in 24 of 32 samples, but most were missense variants. In addition, SMAD4 variants were detected in 7 samples, mostly missense variants. MMR gene variants were found in 10 of 32 samples, and variants in multiple MMR genes were detected simultaneously in two samples (ST-29, ST-76). Of the five samples that were MSI-H by microsatellite analysis, three had MMR gene variants, and the seven with MMR variants were microsatellite stable (MSS). It is unclear why variants in the MMR genes do not necessarily cause MSI-H, but it is possible that mono-allelic variants do not result in LOH or that microsatellite analysis is missed because it is based on only five markers.
Tumor DNA was obtained from samples taken from areas that a surgeon could visually determine to be cancerous, but there is a possibility that normal stromal cells were mixed into the sample, so it cannot be said that 100% of the DNA is of tumor origin. The allele frequency for a heterozygous variant would be 0.5 if 100% of the DNA was of tumor origin. Therefore, if the variant allele frequency (VAF) is greater than 0.5, or if the sum of the VAFs of two different variants found in the same gene (presumed to be in the trans position) is greater than 0.5, loss of heterozygosity (LOH) is considered to have occurred in at least a portion of the tumor samples. Based on these criteria, APC had LOH in 15 of 24 samples in which variants were detected. For TP53, including variants of uncertain significance (VUS), LOH was detected in 10 of 24 samples where variants were detected. However, missense variants of TP53 can be dominant negative and do not necessarily require LOH [10]. LOH was also observed in 4 of 7 samples with variant detection for SMAD4, 1 of 3 for MSH2, 2 of 2 for MSH6, 1 of 6 for MLH1, and 0 of 1 for PMS2.
2.4. CpG Methylation Alterations in Tumor and Normal Colon Tissue
For each tumor suppressor gene, the TML results were visualized by IGV, and regions with different CpG methylation between normal colon tissue and cancer tissue were extracted (Figure 1 and Figure 2). In APC, regions around promoter exons 1A and 1B were hypermethylated in some tumors. The methylation Z-score (MZS) of tumor DNA was more pronounced in exon 1A (Table 2, Figure 2a, b). For TP53 and SMAD4, some tumors showed hypermethylation from exon 1 upstream to intron 1. However, the degree of hypermethylation was not strong (Table 2, Figure 2c, d). Regarding the MMR genes, hypermethylated regions were found in some tumors in the region between MSH2 and EPCAM and in the region from intron 1 to 2 of MSH2, but the degree of hypermethylation was not high when evaluated by MZS (Table 3, Figure 2e, f). MSH6 showed a hypermethylated region in the region from exon 1 to upstream of intron 1, but the degree of hypermethylation was also not intense (Table 3, Figure 2g). On the other hand, methylation of exon 1 surroundings and upstream region of MLH1 was found to be very high in degree and frequency (Table 3, Figure 2h). Overall, methylation of key tumor suppressor genes in colorectal cancer was most clearly observed in exon 1A of APC and in exon 1 surroundings and upstream region of MLH1.
2.5. Association of Somatic DNA Variants with CpG Methylation in Tumor Suppressor Genes
APC hypermethylation was observed in 8 of 32 tumors. APC hypermethylation occurred alone in some tumors without DNA variants, such as ST-03 and ST-39, while hypermethylation also occurred in tumors with loss-of-function DNA variants and a high possibility of LOH according to VAF values, such as ST-14, ST-56, and ST-66. Hypermethylation of TP53 and SMAD4 was less frequent than that of APC and was detected in tumors with no detectable DNA variants or in tumors with low VAF of variants. Regarding the MMR genes, MLH1 hypermethylation was observed in 10 of 32 tumors, but only 4 of these tumors had MSI-H. Conversely, among the five tumors that showed MSI-H, ST-17 had both MLH1 variants and hypermethylation, whereas ST-23 and ST-49 had MLH1 hypermethylation alone, with no variants detected in the MMR genes. ST-29, MSI-H tumor, has variants in MSH2 and MSH6, and hypermethylation of MLH1 has also been detected. ST-57, MSI-H tumor, has only a single LOH positive splicing variant of MLH1 and no hypermethylation of MLH1 was detected. These results indicate that in colorectal cancer, somatic DNA variants and CpG hypermethylation of the APC and MMR genes are not mutually exclusive, but can occur independently and in parallel. It was also shown that hypermethylation of MLH1 is relatively common (31%) in colorectal cancer, but is not always associated with MSI-H.
3. Discussion
3.1. DNA Variants in APC, TP53, SMAD4 and MMR Genes
Consistent with the theory that APC is a gatekeeper in colorectal cancer, APC somatic DNA variants were detected in 24 of 32 (75%) samples, 15 of which showed LOH. In addition, eight tumors showed hypermethylation of APC, three of which had no APC variants. Including these, 27 of 32 tumors (84.4%) showed some somatic alteration of APC. Of the 42 APC variants detected, 34 (70.8%) were frameshift or nonsense (null) variants. TP53 variants were also detected in 24 of 32 (75%) samples, but in contrast to APC, 19 of the 28 variants (67.8%) were missense variants. The three TP53 variants detected in the seven samples in this study are commonly reported in other cancers and are known to function as dominant negative variants (Table 2, Supplementary Table S1)[15]. Other TP53 missense variants may also function as dominant negative variants. Three samples showed TP53 hypermethylation, two of which had no TP53 variants. Consequently, APC and TP53 show different suppression mechanisms in cancer. In addition to null mutations and loss of function due to LOH, DNA methylation plays an important role in APC, whereas TP53 seems to be more likely to select missense variants with dominant-negative effects, which can be expected to have a gene-suppressing effect even with a single hit.A total of eight variants were detected in SMAD4 in seven samples, seven of which were missense variants. Most of these would be considered VUS according to the guidelines (Table 2). However, 4 samples were considered LOH according to the VAF value and are therefore high possibility of pathogenicity. Dominant negative variants of SMAD4 are not known to be associated with cancer, but have been reported in Myhre syndrome (a congenital connective tissue disorder)[16].
MMR gene variants were found in 10 of 32 samples, and variants in multiple MMR genes were detected simultaneously in two samples (ST-29, ST-76). Of the five samples that were MSI-H by microsatellite analysis, three had MMR gene variants, and the seven with MMR variants were microsatellite stable (MSS). It is unclear why variants in the MMR genes do not necessarily cause MSI-H, but it is possible that mono-allelic variants do not result in LOH or that microsatellite analysis is missed because it is based on only five markers. In this study, structural abnormalities and intron variants were also screened for using vLAS and TgCap, so it is unlikely that MMR variants exist outside of the exons.
3.2. DNA Methylation in Tumor Suppression Genes
TML allowed the entire genomic region of each gene of interest to be serially assessed for CpG methylation status. As expected, in the regions surrounding exon 1 of each gene, gaps were observed indicating hypomethylation of CpG islands. However, the size of the gap varied from gene to gene, and it extended not only upstream of exon 1 but also into part of intron 1 or further. When the methylation status of these gap regions was compared between tumor DNA and normal tissue DNA, it was found that the methylation status of CpG sequences varied in both location and degree from sample to sample and could not be mapped to a specific base sequence. In fact, the DNA methylation status was not consistent even in normal DNA samples. The range and patterns of DNA methylation alterations in cancer are broader and more complex than previously thought. Since both the location of the methylated CpG sequence and the degree of methylation may be related to gene inactivation, in this study, the difference in the degree of methylation between tumor and normal tissues was conveniently expressed using MZS as an index. The gated range for measuring the MZS was set to maximize between tumor and normal DNA.
In several tumor samples, extremely increased methylation was observed around exon 1A of APC and exon 1 of MLH1. However, methylation patterns were not consistent between tumors, and the extent of methylation tended to be widespread. Other genes showed more modest increased methylation in some tumors. Hypermethylation was observed simultaneously in multiple genes in some samples and in a single gene in others, and it was assumed that methylation of each gene was an essentially independent event. In this study, vLAS and TgCap were used to detect somatic variants. Therefore, splicing abnormalities due to deep intron variants or structural variants were excluded. Therefore, it is highly likely that some tumor samples have only hypermethylation of the target gene as a somatic alternation.
3.3. Association of DNA Variants with CpG Methylation in Tumor Suppressor Genes
It is assumed that hypermethylation of exon 1A of APC occurs independently and in parallel with somatic variants of APC. In some cases (ST-03 and ST-39), methylation occurs alone without APC variants; in other cases (ST-14 and ST-56), methylation occurs together with APC variants showing LOH; and in other cases (ST-16 and ST-31), methylation does not occur with APC variants showing LOH. Therefore, it was shown that the occurrence of somatic variants and hypermethylation of APC can occur in any combination. This suggests that somatic variants and hypermethylation of APC are not exclusive events (i.e., if one occurs, the other is suppressed). Furthermore, even if the LOH is achieved due to one event, it is not expected that this will prevent the progress of the other event. Similar phenomena of independence have been observed for TP53 and SMAD4, but to a modest extent. With regard to MMR genes, hypermethylation of MLH1 occurs at a high frequency independent of somatic variants in MMR genes, including MLH1, and does not necessarily coincide with MSI-H. Since microsatellite instability and hypermutation types are a minority in colorectal cancer overall, it is not surprising that the detection rate of somatic variants in the MMR genes was low in this study. However, hypermethylation of MLH1 was observed in 10 of 32 samples (31.3%), the significance of which is currently unknown.
In any case, the fact that hypermethylation and somatic variants showed independent behavior in all genes examined in this study suggests that DNA methylation is an event that continues to proceed independently of somatic variants in tumor suppressor genes in general.
3.4. Limitation of This Study
First, unfortunately, we were unable to obtain RNA from colon tissue in this study, so we could not verify the extent to which high MZS correlates with mRNA expression. In addition, the degree and range of CpG methylation is not constant even in normal colon tissue, making it extremely difficult to derive an appropriate region for the calculation of MZS. Therefore, further studies with larger numbers of samples are needed to determine which patterns and levels of CpG methylation affect mRNA expression and to quantitatively demonstrate the effects. Second, there is no guarantee that normal colon tissue is completely normal. In this study, the surgeons visually separated the normal colon tissue from the cancerous tissue, but the samples collected were not pathologically examined, so it cannot be completely ruled out that the seemingly normal tissue may contain cancer cells. In addition, the tissue is exposed to inflammatory conditions associated with cancer, which can affect DNA methylation status. In fact, TP53 methylation is known to occur in various pathological conditions other than cancer, such as ischemic stroke[17] and asthma[18]. In this study, samples were obtained from resected tissue after surgery, but to obtain high quality RNA, the method of sample collection itself required ingenuity. In addition, if the target gene has a somatic null variant, the amount of mRNA may be reduced due to nonsense-mediated mRNA decay. Also, methylation of APC exons 1A and 1B may affect different classes of mRNA variants. To distinguish these factors from the effect of CpG hypermethylation, it is necessary to choose an analysis method such as targeted RNA-seq[19] or allele-separated RNA-seq with long-read sequencing[20]. This study demonstrated that DNA methylation of tumor suppressor genes in colorectal cancer is more extensive and irregular than previously thought and occurs in parallel with somatic variants. However, to evaluate its effect on mRNA expression and gene silencing, it will be necessary to overcome the above discussion.
4. Materials and Methods
4.1. Patient and Sample Collection
The patients in this study are clinically diagnosed with colorectal cancer at Kanazawa Medical University Hospital. Patients with suspected familial adenomatous polyposis, Lynch syndrome or Li-Fraumeni syndrome based on family history, medical history or preoperative examination findings were excluded. Clinical data collected included age at surgery, sex, site of colorectal cancer and results of postoperative pathological testing for KRAS, BRAF variants and microsatellite instability (MSI). KRAS variants at codons 12, 13, 59, 61, 117, and 146 and BRAF variants at codon 600 were analyzed, and MSI was performed using the BAT-26, NR-21, BAT-25, MONO-27, and NR-24 markers. These analyses were performed in a clinically certified laboratory (SRL Co., Ltd. Tokyo, Japan). Other analyses in this study used surgically resected, unfixed bowel tissue. After surgery, cancerous and normal bowel tissue were collected separately as paired samples under macroscopic examination by a gastroenterologist. Written informed consent was obtained from all patients by their primary physician for the mutational and clinical data analysis. The study design was approved by the institutional review board of Kanazawa Medical University (I544, G186).
4.2. Library Preparations and Sequencing
Standard phenol/chloroform extraction and ethanol precipitation was used to extract DNA from colon tissue samples. In this study, three different libraries were generated from each sample to comprehensively investigate seven major tumour suppressor genes (APC, TP53, SMAD4, MSH2, MSH6, MLH1, PMS2) in colorectal cancer using next-generation sequencing (Figure 3). The first library is our previously developed method called the very long amplicon sequencing (vLAS)[21,22,23]. In this method, the extracted DNA is amplified by 20-30 kb long range PCR, the target region, including intron sequences, is covered with multiple amplicons and a library is then prepared using Nextera system (illumina, San Diego, CA, USA). A list of the long PCR primers used in this study is provided in Supplementary Table 2. This method has the advantage of being able to detect structural abnormalities such as intragenic deletions and deep intron mutations in addition to point mutations, but it has the disadvantage that it cannot be used with low molecular weight DNA because long PCR cannot be performed.
Targeted genome capture sequencing (TgCap) has therefore been developed to enable analysis of the entire target genomic region, similar to vLAS, even with low molecular weight DNA. In TgCap, the long PCR products amplified from control DNA using vLAS primers are fragmented by ultrasound and biotin end-labelling to create a capture probe. First, each long PCR product was quantified using Qubit (Thermo Fisher Scientific, Waltham, MA, USA) and mixed in equimolar amounts. The mixed products were then fragmented to 300 bp using Covaris M220 (Covaris. Wouburn, MA, USA). One microgram of fragmented DNA was treated with the Fast DNA End Repair Kit (Thermo Fisher Scientific), followed by terminal transferase (New England Biolabs, Ipswich, MA, USA) labelling with a final 0.1 mM biotin 16-ddUTP (New England Biolabs) at 37°C for 2 hours. The final probe concentration was adjusted to 10 ng/μl. Sample genomic DNA was fragmented to 300 bp using Covaris M220 and treated with NEBNext® Ultra™ II End Repair/dA-Tailing Module (New England Biolabs). Then 500 ng of DNA and 75 pmol xGen UDI-UMI Adapter (Integrated DNA Technology, Coralville, IA, USA) were ligated with Blunt TA ligase (New England Biolabs) at 20°C for 1 hour. This genomic DNA library was captured with 1 μl of the prepared biotin probe using a KAPA Hyper Capture Reagent Kit (Roche Diagnostics, Basel, Switzerland) according to the manufacturer's protocol. Finally, the captured DNA was amplified using KAPA HiFi HotStart ReadyMix (Roche Diagnostics) to obtain a library. In this study, we excluded PMS2 from TgCap because the presence of pseudogenes poses a capture problem. In vLAS, the use of PMS2 specific PCR primers allowed analysis without pseudogene contamination.
Targeted methyl landscape (TML) is an application of TgCap in which methylated adapters are used for capture in the same way as TgCap and the captured DNA is then bisulfite treated and amplified to produce a methylation library of the entire target region. The xGen Methyl UDI-UMI Adapter (Integrated DNA Technology) was used as the methylation adapter and the EZ DNA Methylation Lightining Kit (Zymo Research, Irvine, CA, USA) was used for the bisulphite treatment. Multiplexed capture of up to four samples using different indices was possible with both TgCap and TML.
Libraries were quantified using an HS Qubit dsDNA assay (Thermo Fisher Scientific) and a TapeStation 4200 (Agilent Technologies, Santa Clara, CA). Qualified size distributions were checked on a TapeStation 4200 using High Sensitivity D1000 ScreenTape (Agilent Technologies). A 12.5 pM library was sequenced on an illumina MiSeq system (2 × 150 cycles or 2 × 250 cycles), according to the standard Illumina protocol (illumina). For a more detailed protocol, please contact the corresponding author (Y.N.).
4.3. DATA Analysis Pipeline
The FASTQ files were generated using the bcl2fastq software (Illumina). The FASTQ files were aligned to the reference human genome (hg38) using the BurrowsWheeler Aligner MEM algorithm (BWA-MEM version 0.7.17-r1188)[24]. Somatic variants were identified using GATK’s Mutect2 (Version 4.0.6.0)[25,26,27]. The SNVs and INDELs were functionally annotated by SnpEff (Version 4.3t), to classify each variant into a functional class (HIGH, MODERATE, LOW, and MODIFIER)[28]. For variant annotation, the Database of Short Genetic Variations dbSNP (Version 151) and ClinVar were used[29,30]. To detect large INDELs, Pindel (Version 0.2.5b9) was used[31]. Bismark (version v0.22.1) was used as the methylation caller for bisulfite sequencing[32]. Splice variants, including deep intronic variants, were searched for using SpliceAI[33] and were considered significant if either donor gain/loss or acceptor gain/loss values were >0.5 and the allele frequency in the general population is less than 0.0001. For visualization, the Integrative Genomic Viewer (IGV Version 2.4.13) was used[34] (Figure 1).
4.4. Annotation of Variants
The oncogenicity of detected variants was determined according to the Joint recommendations of Clinical Genome Resource (ClinGen), Cancer Genomics Consortium (CGC), and Variant Interpretation for Cancer Consortium (VICC)[35]. This guideline classifies oncogenicity into five categories, benign (-7 points or less), likely benign (-1 to -6 points), variant of uncertin significance (VUS) (0 to 5 points), likely oncogenic (6 to 9 points), and oncogenic (10 points or more). Since a null variant in a tumor suppressor gene alone would score 8 points, in this study nonsense variants, frameshift variants, and splicing variants were automatically considered likely oncogenic or oncogenic and pathogenicity is obvious. Therefore, missense and in-frame variants were classified according to this guideline (Table 2 and 3).
4.5. Evaluation of CpG Methylation
When the results of the Bismark analysis were visualised using IGV, it was found that CpG methylation was not concentrated at specific bases, but was randomly distributed over a certain area in both normal colon tissue and colon cancer tissue. In this study, we developed the Methylation Z-Score (MZS) to quantify the degree of CpG methylation in the target region. The ratio of CpG methylation at each base was calculated by Bismark and visualized by loading the bedgraph into IGV. Extract regions on IGV that have different methylation levels between normal and cancer tissues. The grand sum of the CpG methylation ratios (0-1) for each base within the gated region was calculated for 32 normal colon tissue samples, and the average (av.ND_Σ) and standard deviation (SD) were calculated. The grand sum was calculated similarly for each colon cancer samples (TD_Σ) and the methylation level was expressed as [(TD_Σ)−(av.ND_Σ)]/SD = MZS. The gating region has been adjusted for maximum MZS. In addition, MZS was classified as follows: 2 to 5 SD as high (H), 5 to 10 SD as very high (VH), and greater than 10 SD as extremely high (EH). The degree of DNA methylation of each tumor suppressor gene in each cancer sample is shown by this classification in Table 2 and Table 3, and by the actual MZS value in Figure 1.
5. Conclusions
Using vLAS, TgCap and TML, we were able to perform an integrated analysis of somatic variants and CpG methylation status of major tumor suppressor genes in colorectal cancer. vLAS was found to have the advantage of more uniform coverage, while TgCap was found to have the advantage of being applicable to degraded DNA. TML enabled analysis of the CpG methylation status of tumor suppressor genes in colorectal cancer across all gene regions, demonstrating that DNA hypermethylation in cancer is more complex and widespread than previously thought. Somatic variants and hypermethylation of tumor suppressor genes were considered independent, parallel events. Further detailed studies are needed to determine the effect of these complex hypermethylation on mRNA expression of tumor suppressor genes.
Supplementary Materials
The following supporting information can be downloaded at: www.mdpi.com/xxx/s1, Table S1: Detailed description of variants detected in this study; Table S2: Long-range PCR Primers used in this study.
Author Contributions
Conceptualization, H.T. and Y.N.; methodology, Y.N.; software, H.U.; validation, H.N. and H.T.; formal analysis, H.U.; investigation, H.N. H.H. and S.T.; resources, H.F.; data curation, H.N. and H.F..; writing—original draft preparation, H.N.; writing—review and editing, Y.N.; visualization, H.H. and S.T.; supervision, H.T.; project administration, Y.N.; funding acquisition, Y.N. All authors have read and agreed to the published version of the manuscript.
Funding
This study was funded by Kanazawa Medical University (No. 11181, 26699).
Institutional Review Board Statement
The study was conducted by the Declaration of Helsinki and approved by the Institutional Review Board of Kanazawa Medical University (I544 approved on 11/26/2020 and G186 approved on 6/27/2023).
Informed Consent Statement
Written informed consent was obtained from all subjects involved in the study.
Data Availability Statement
The NGS sequencing data presented in this study are available upon request from the corresponding author (Y.N.), as they are subject to disclosure restrictions under the Japanese government's Personal Information Protection Act and consent of the subjects was not obtained.
Acknowledgments
We sincerely thank all the patients with colorectal cancer who participated in this study and their primary physicians who cooperated.
Conflicts of Interest
The authors of this paper declare no conflict of interest.
Abbreviations
The following abbreviations are used in this manuscript:
| LOH | loss of heterozygosity |
| vLAS | very long amplicon sequencing |
| NGS | next-generation sequencing |
| TgCap | targeted genome capture |
| TML | targeted methyl landscape |
| MSI-H | microsatellite instability high |
| MSS | Microsatellite stable |
| VAF | variant allele frequency |
| MMR | mismatch repair |
References
- Carnevali, I.W.; Cini, G.; Libera, L.; Sahnane, N.; Facchi, S.; Viel, A.; Sessa, F.; Tibiletti, M.G. , Promoter Methylation Could Be the Second Hit in Lynch Syndrome Carcinogenesis. Genes (Basel) 2023, 14. [Google Scholar] [CrossRef] [PubMed]
- Di Ruscio, A.; Welner, R.S.; Tenen, D.G.; Amabile, G. , The second hit of DNA methylation. Mol Cell Oncol 2016, 3, e1093690. [Google Scholar] [CrossRef] [PubMed]
- Yamamoto, E.; Suzuki, H.; Takamaru, H.; Yamamoto, H.; Toyota, M.; Shinomura, Y. , Role of DNA methylation in the development of diffuse-type gastric cancer. Digestion 2011, 83, 241–249. [Google Scholar] [CrossRef] [PubMed]
- Segditsas, S.; Sieber, O.M.; Rowan, A.; Setien, F.; Neale, K.; Phillips, R.K.; Ward, R.; Esteller, M.; Tomlinson, I.P. , Promoter hypermethylation leads to decreased APC mRNA expression in familial polyposis and sporadic colorectal tumours, but does not substitute for truncating mutations. Exp Mol Pathol 2008, 85, 201–206. [Google Scholar] [CrossRef]
- Ding, Z.; Jiang, T.; Piao, Y.; Han, T.; Han, Y.; Xie, X. , Meta-analysis of the association between APC promoter methylation and colorectal cancer. Onco Targets Ther 2015, 8, 211–222. [Google Scholar]
- Poosari, A.; Nutravong, T.; Namwat, W.; Wasenang, W.; Sa-Ngiamwibool, P.; Ungareewittaya, P. , The relationship between P16. Scientific reports 2022, 12, 10337. [Google Scholar]
- Herrero, A.B.; Rojas, E.A.; Misiewicz-Krzeminska, I.; Krzeminski, P.; Gutiérrez, N.C. , Molecular Mechanisms of p53 Deregulation in Cancer: An Overview in Multiple Myeloma. Int J Mol Sci 2016, 17. [Google Scholar] [CrossRef]
- Li, J.; Ma, X.; Chakravarti, D.; Shalapour, S.; DePinho, R.A. , Genetic and biological hallmarks of colorectal cancer. Genes Dev 2021, 35, (11–12), 787. [Google Scholar] [CrossRef]
- Fodde, R. , The APC gene in colorectal cancer. Eur J Cancer 2002, 38, 867–871. [Google Scholar] [CrossRef]
- Zhu, G.; Pei, L.; Xia, H.; Tang, Q.; Bi, F. , Role of oncogenic KRAS in the prognosis, diagnosis and treatment of colorectal cancer. Mol Cancer 2021, 20, 143. [Google Scholar] [CrossRef]
- Müller, M.F.; Ibrahim, A.E.; Arends, M.J. , Molecular pathological classification of colorectal cancer. Virchows Arch 2016, 469, 125–134. [Google Scholar] [CrossRef] [PubMed]
- Molnár, B.; Galamb, O.; Péterfia, B.; Wichmann, B.; Csabai, I.; Bodor, A.; Kalmár, A.; Szigeti, K.A.; Barták, B.K.; Nagy, Z.B.; Valcz, G.; Patai, Á.; Igaz, P.; Tulassay, Z. , Gene promoter and exon DNA methylation changes in colon cancer development - mRNA expression and tumor mutation alterations. BMC Cancer 2018, 18, 695. [Google Scholar] [CrossRef] [PubMed]
- Tomicic, M.T.; Dawood, M.; Efferth, T. , Epigenetic Alterations Upstream and Downstream of p53 Signaling in Colorectal Carcinoma. Cancers (Basel) 2021, 13. [Google Scholar] [CrossRef] [PubMed]
- Dobre, M.; Salvi, A.; Pelisenco, I.A.; Vasilescu, F.; De Petro, G.; Herlea, V.; Milanesi, E. , Crosstalk Between DNA Methylation and Gene Mutations in Colorectal Cancer. Front Oncol 2021, 11, 697409. [Google Scholar] [CrossRef] [PubMed]
- Monti, P.; Perfumo, C.; Bisio, A.; Ciribilli, Y.; Menichini, P.; Russo, D.; Umbach, D.M.; Resnick, M.A.; Inga, A.; Fronza, G. , Dominant-negative features of mutant TP53 in germline carriers have limited impact on cancer outcomes. Mol Cancer Res 2011, 9, 271–279. [Google Scholar] [CrossRef]
- Alankarage, D.; Enriquez, A.; Steiner, R.D.; Raggio, C.; Higgins, M.; Milnes, D.; Humphreys, D.T.; Duncan, E.L.; Sparrow, D.B.; Giampietro, P.F.; Chapman, G.; Dunwoodie, S.L. , Myhre syndrome is caused by dominant-negative dysregulation of SMAD4 and other co-factors. Differentiation 2022, 128, 1–12. [Google Scholar] [CrossRef]
- Wei, Y.; Sun, Z.; Wang, Y.; Xie, Z.; Xu, S.; Xu, Y.; Zhou, X.; Bi, J.; Zhu, Z. , Methylation in the TP53 promoter is associated with ischemic stroke. Mol Med Rep 2019, 20, 1404–1410. [Google Scholar] [CrossRef]
- Yuan, L.; Wang, L.; Du, X.; Qin, L.; Yang, M.; Zhou, K.; Wu, M.; Yang, Y.; Zheng, Z.; Xiang, Y.; Qu, X.; Liu, H.; Qin, X.; Liu, C. , The DNA methylation of FOXO3 and TP53 as a blood biomarker of late-onset asthma. J Transl Med 2020, 18, 467. [Google Scholar] [CrossRef]
- Ura, H.; Togi, S.; Niida, Y. , Targeted Double-Stranded cDNA Sequencing-Based Phase Analysis to Identify Compound Heterozygous Mutations and Differential Allelic Expression. Biology (Basel) 2021, 10. [Google Scholar] [CrossRef]
- Ura, H.; Togi, S.; Niida, Y. , Target-capture full-length double-strand cDNA sequencing for alternative splicing analysis. RNA Biol 2021, 1–8. [Google Scholar] [CrossRef]
- Togi, S.; Ura, H.; Niida, Y. , Optimization and Validation of Multimodular, Long-Range PCR-Based Next-Generation Sequencing Assays for Comprehensive Detection of Mutation in Tuberous Sclerosis Complex. J Mol Diagn 2021, 23, 424–446. [Google Scholar] [CrossRef] [PubMed]
- Niida, Y.; Togi, S.; Ura, H. , Streamlining Genetic Diagnosis With Long-Range Polymerase Chain Reaction (PCR)-Based Next-Generation Sequencing for Type I and Type II Collagenopathies. Cureus 2023, 15, e50482. [Google Scholar] [CrossRef] [PubMed]
- Nomura, F.; Shimizu, A.; Togi, S.; Ura, H.; Niida, Y. , SNP Array Screening and Long Range PCR-Based Targeted Next Generation Sequencing for Autosomal Recessive Disease with Consanguinity: Insight from a Case of Xeroderma Pigmentosum Group C. Genes (Basel) 2023, 14. [Google Scholar] [CrossRef] [PubMed]
- Li, H.; Durbin, R. , Fast and accurate long-read alignment with Burrows-Wheeler transform. Bioinformatics 2010, 26, 589–595. [Google Scholar] [CrossRef]
- Cibulskis, K.; Lawrence, M.S.; Carter, S.L.; Sivachenko, A.; Jaffe, D.; Sougnez, C.; Gabriel, S.; Meyerson, M.; Lander, E.S.; Getz, G. , Sensitive detection of somatic point mutations in impure and heterogeneous cancer samples. Nat Biotechnol 2013, 31, 213–219. [Google Scholar] [CrossRef]
- Wilm, A.; Aw, P.P.; Bertrand, D.; Yeo, G.H.; Ong, S.H.; Wong, C.H.; Khor, C.C.; Petric, R.; Hibberd, M.L.; Nagarajan, N. , LoFreq: a sequence-quality aware, ultra-sensitive variant caller for uncovering cell-population heterogeneity from high-throughput sequencing datasets. Nucleic Acids Res 2012, 40, 11189–11201. [Google Scholar] [CrossRef]
- Van der Auwera, G.A.; Carneiro, M.O.; Hartl, C.; Poplin, R.; Del Angel, G.; Levy-Moonshine, A.; Jordan, T.; Shakir, K.; Roazen, D.; Thibault, J.; Banks, E.; Garimella, K.V.; Altshuler, D.; Gabriel, S.; DePristo, M.A. , From FastQ data to high confidence variant calls: the Genome Analysis Toolkit best practices pipeline. Curr Protoc Bioinformatics 2013, 43, 11.10.1–111033. [Google Scholar] [CrossRef]
- Cingolani, P.; Platts, A.; Wang le, L.; Coon, M.; Nguyen, T.; Wang, L.; Land, S.J.; Lu, X.; Ruden, D.M. , A program for annotating and predicting the effects of single nucleotide polymorphisms, SnpEff: SNPs in the genome of Drosophila melanogaster strain w1118; iso-2; iso-3. Fly 2012, 6, 80–92. [Google Scholar] [CrossRef]
- Sherry, S.T.; Ward, M.H.; Kholodov, M.; Baker, J.; Phan, L.; Smigielski, E.M.; Sirotkin, K. , dbSNP: the NCBI database of genetic variation. Nucleic Acids Res 2001, 29, 308–311. [Google Scholar] [CrossRef]
- Landrum, M.J.; Lee, J.M.; Riley, G.R.; Jang, W.; Rubinstein, W.S.; Church, D.M.; Maglott, D.R. , ClinVar: public archive of relationships among sequence variation and human phenotype. Nucleic Acids Res 2014, 42, (Database issue), D980–5. [Google Scholar] [CrossRef]
- Ye, K.; Schulz, M.H.; Long, Q.; Apweiler, R.; Ning, Z. , Pindel: a pattern growth approach to detect break points of large deletions and medium sized insertions from paired-end short reads. Bioinformatics 2009, 25, 2865–2871. [Google Scholar] [CrossRef] [PubMed]
- Krueger, F.; Andrews, S.R. , Bismark: a flexible aligner and methylation caller for Bisulfite-Seq applications. Bioinformatics 2011, 27, 1571–1572. [Google Scholar] [CrossRef] [PubMed]
- de Sainte Agathe, J.M.; Filser, M.; Isidor, B.; Besnard, T.; Gueguen, P.; Perrin, A.; Van Goethem, C.; Verebi, C.; Masingue, M.; Rendu, J.; Cossée, M.; Bergougnoux, A.; Frobert, L.; Buratti, J.; Lejeune, É.; Le Guern, É.; Pasquier, F.; Clot, F.; Kalatzis, V.; Roux, A.F.; Cogné, B.; Baux, D. , SpliceAI-visual: a free online tool to improve SpliceAI splicing variant interpretation. Human genomics 2023, 17, 7. [Google Scholar] [CrossRef]
- Thorvaldsdottir, H.; Robinson, J.T.; Mesirov, J.P. , Integrative Genomics Viewer (IGV): high-performance genomics data visualization and exploration. Briefings in bioinformatics 2013, 14, 178–192. [Google Scholar] [CrossRef] [PubMed]
- Horak, P.; Griffith, M.; Danos, A.M.; Pitel, B.A.; Madhavan, S.; Liu, X.; Chow, C.; Williams, H.; Carmody, L.; Barrow-Laing, L.; Rieke, D.; Kreutzfeldt, S.; Stenzinger, A.; Tamborero, D.; Benary, M.; Rajagopal, P.S.; Ida, C.M.; Lesmana, H.; Satgunaseelan, L.; Merker, J.D.; Tolstorukov, M.Y.; Campregher, P.V.; Warner, J.L.; Rao, S.; Natesan, M.; Shen, H.; Venstrom, J.; Roy, S.; Tao, K.; Kanagal-Shamanna, R.; Xu, X.; Ritter, D.I.; Pagel, K.; Krysiak, K.; Dubuc, A.; Akkari, Y.M.; Li, X.S.; Lee, J.; King, I.; Raca, G.; Wagner, A.H.; Li, M.M.; Plon, S.E.; Kulkarni, S.; Griffith, O.L.; Chakravarty, D.; Sonkin, D. , Standards for the classification of pathogenicity of somatic variants in cancer (oncogenicity): Joint recommendations of Clinical Genome Resource (ClinGen), Cancer Genomics Consortium (CGC), and Variant Interpretation for Cancer Consortium (VICC). Genet Med 2022, 24, 986–998. [Google Scholar] [CrossRef]
Figure 1.
An example of an IGV image of vLAS, TgCap and TML (ST-57 tumor DNA). The CpG methylations shown in the TML graph have gaps corresponding to the promoter regions of each gene (yellow arrows), indicating hypomethylation of CpG islands.
Figure 1.
An example of an IGV image of vLAS, TgCap and TML (ST-57 tumor DNA). The CpG methylations shown in the TML graph have gaps corresponding to the promoter regions of each gene (yellow arrows), indicating hypomethylation of CpG islands.
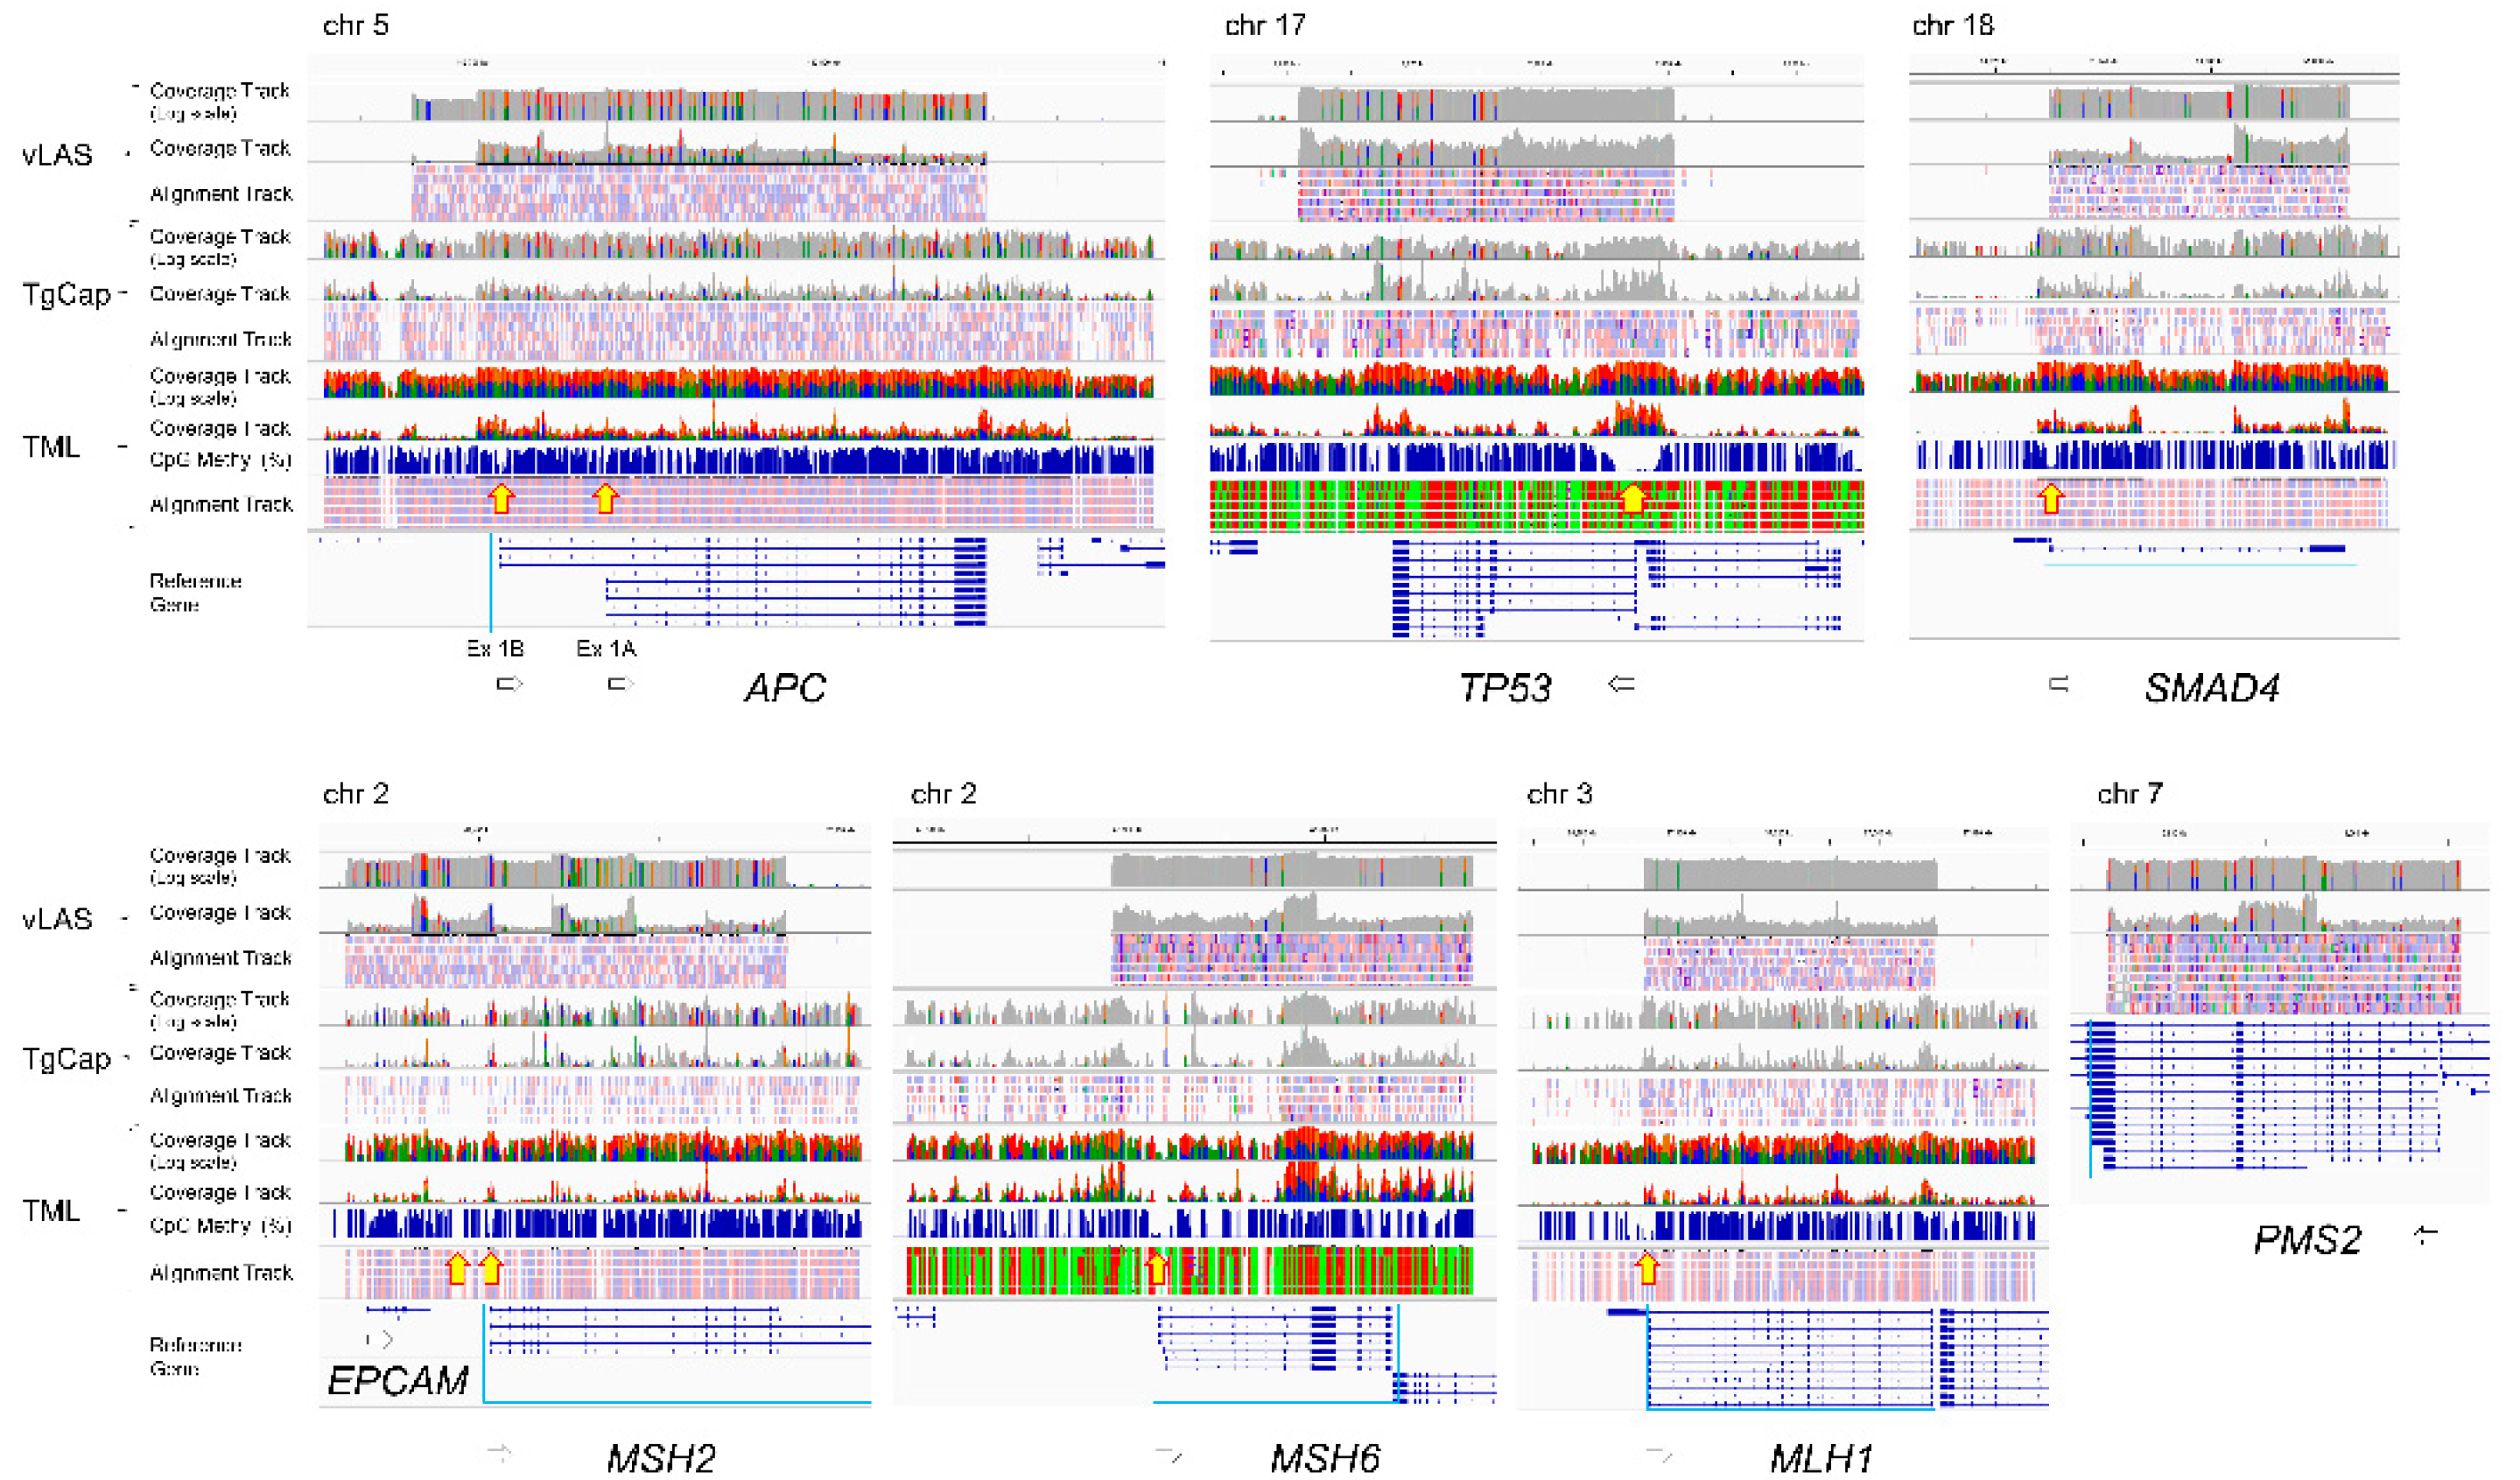
Figure 2.
IGV image of TML CpG methylation ratio indicated by Bismark bedgraph. (a) APC promotor exon 1A. (b) APC promotor exon 1B. ND; normal colon tissue DNA, ND_Σ; Sum of the CpG methylation ratios of ND in the target region, TD; colon tumor DNA, TD_Σ; Sum of the CpG methylation ratios of TD in the target region, TD_Z; Methylation Z score of TD. IGV image of TML CpG methylation ratio. (e) EPCAM MSH2 intervening region. (f) MSH2 intron 1 ~ 2. IGV image of TML CpG methylation ratio. (g) MSH6 exon 1 ~ intron 1. (h) MLH1 5’UTR ~ exon 1.
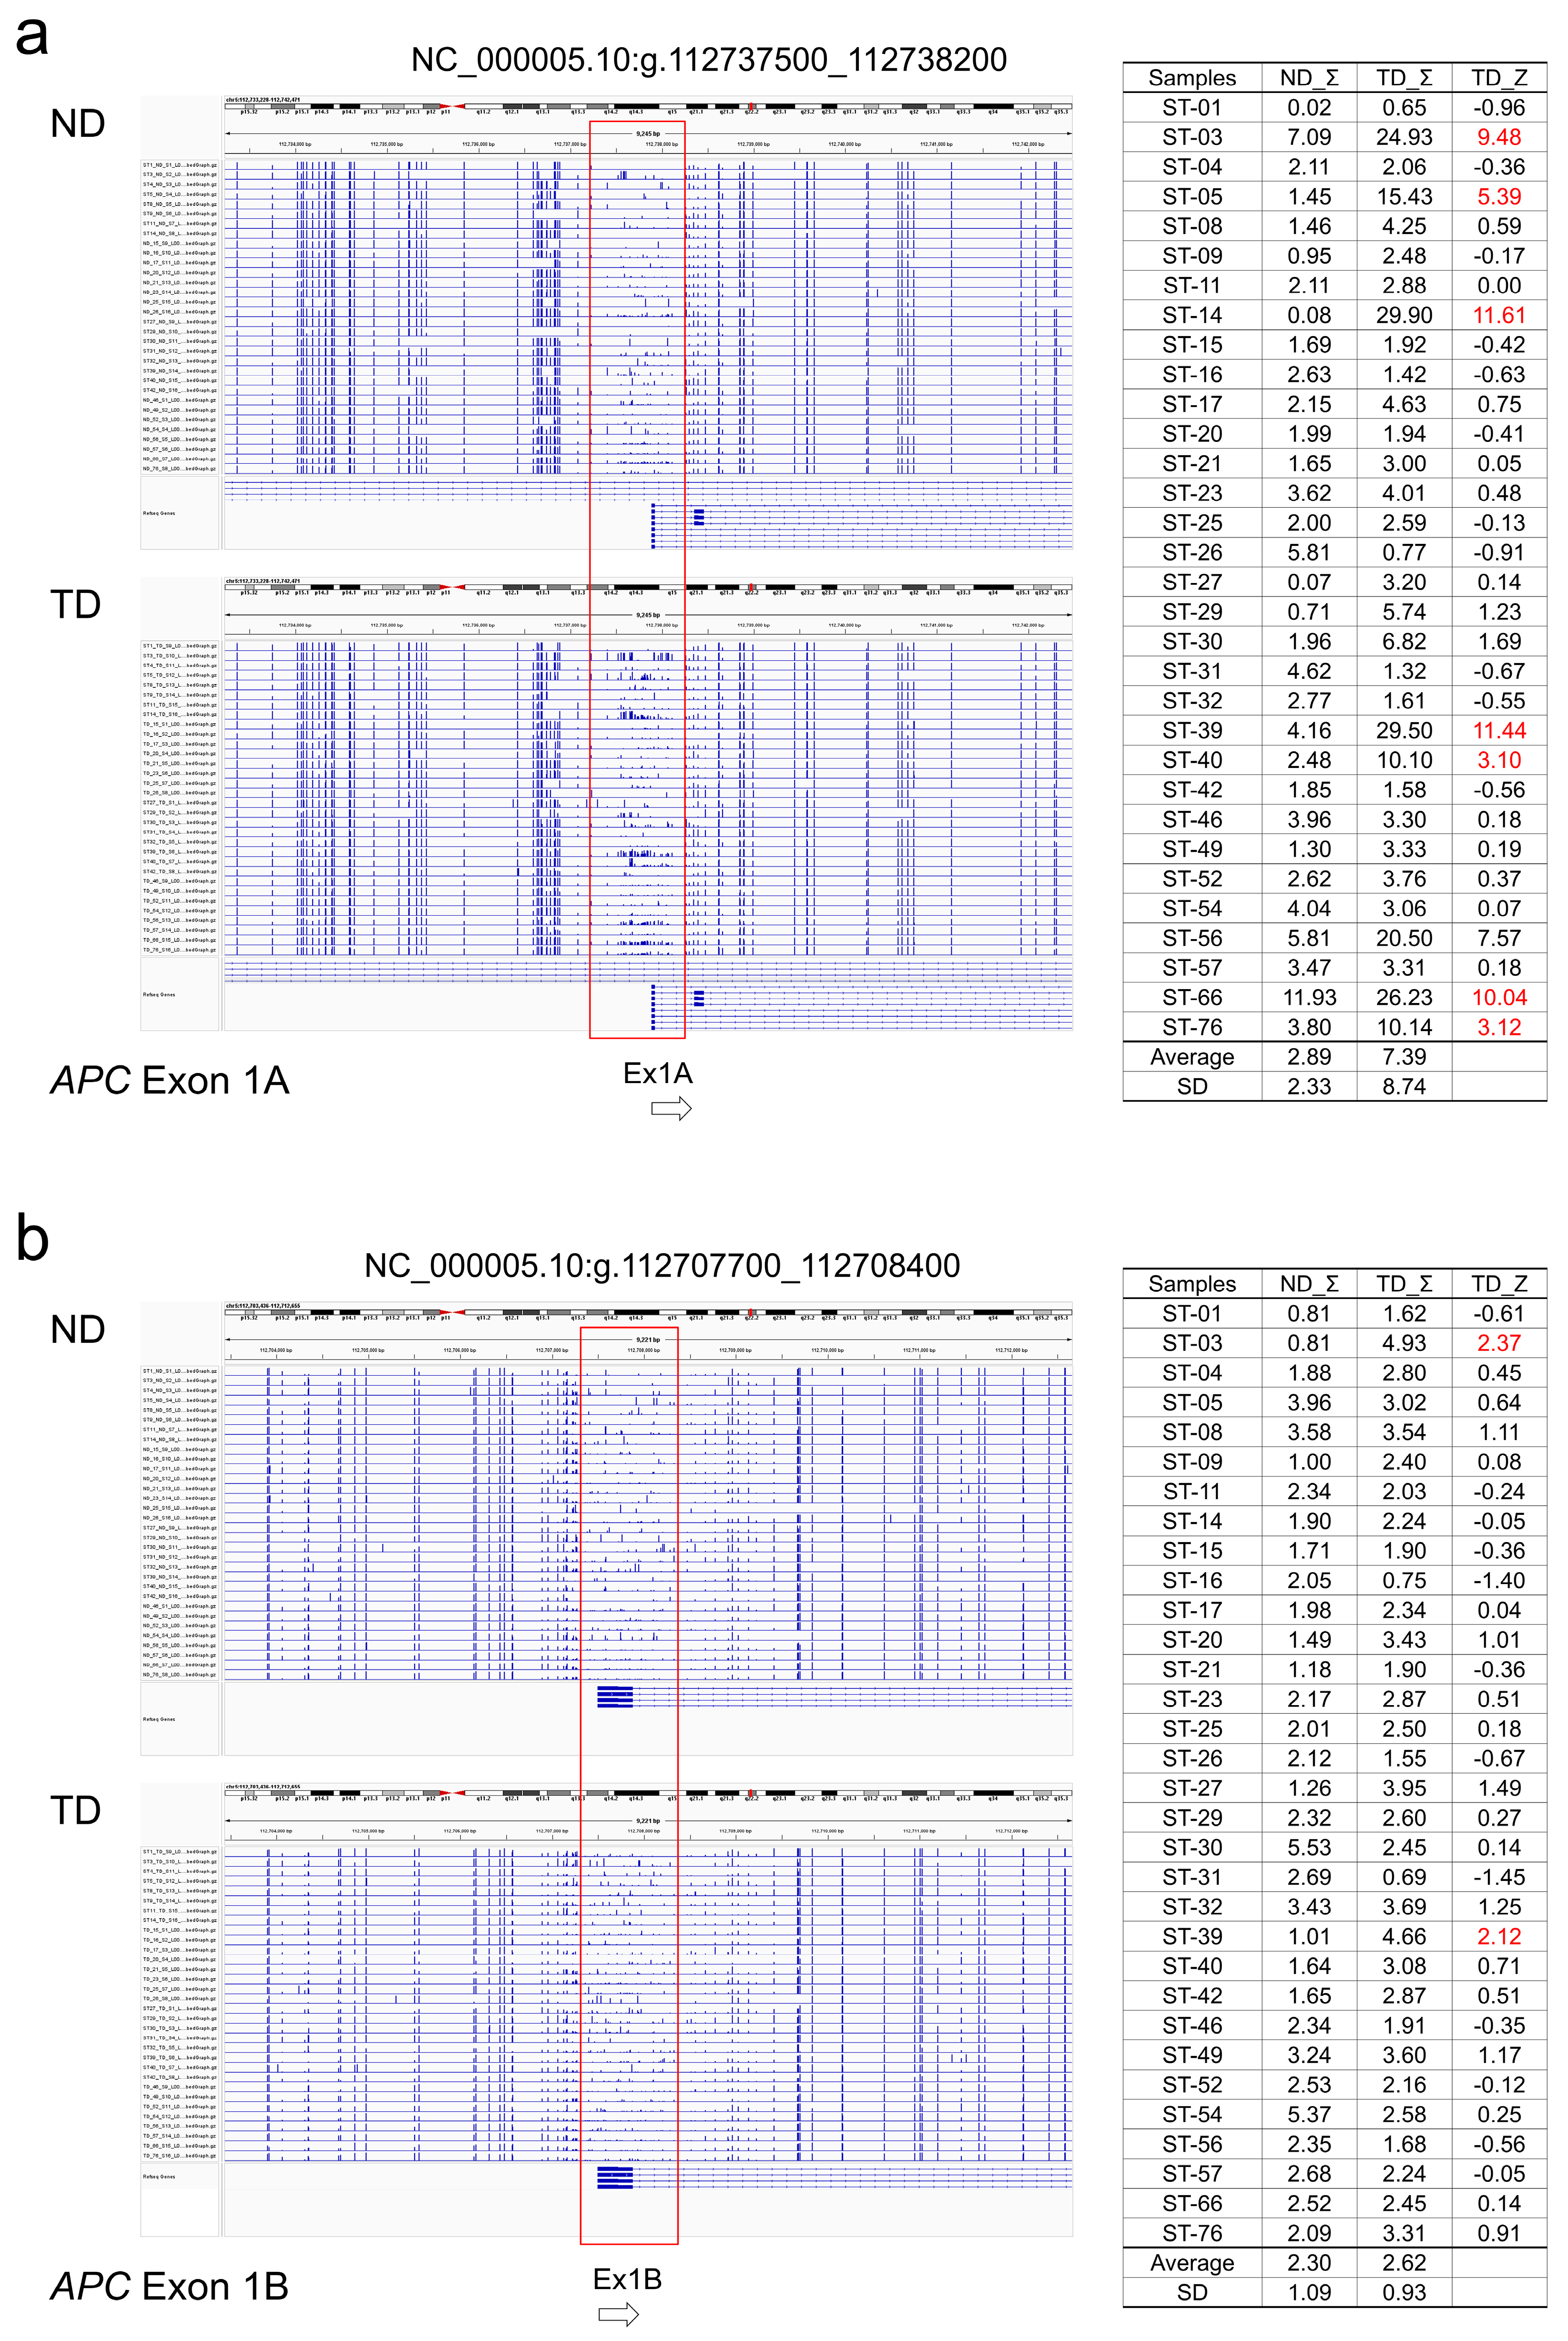
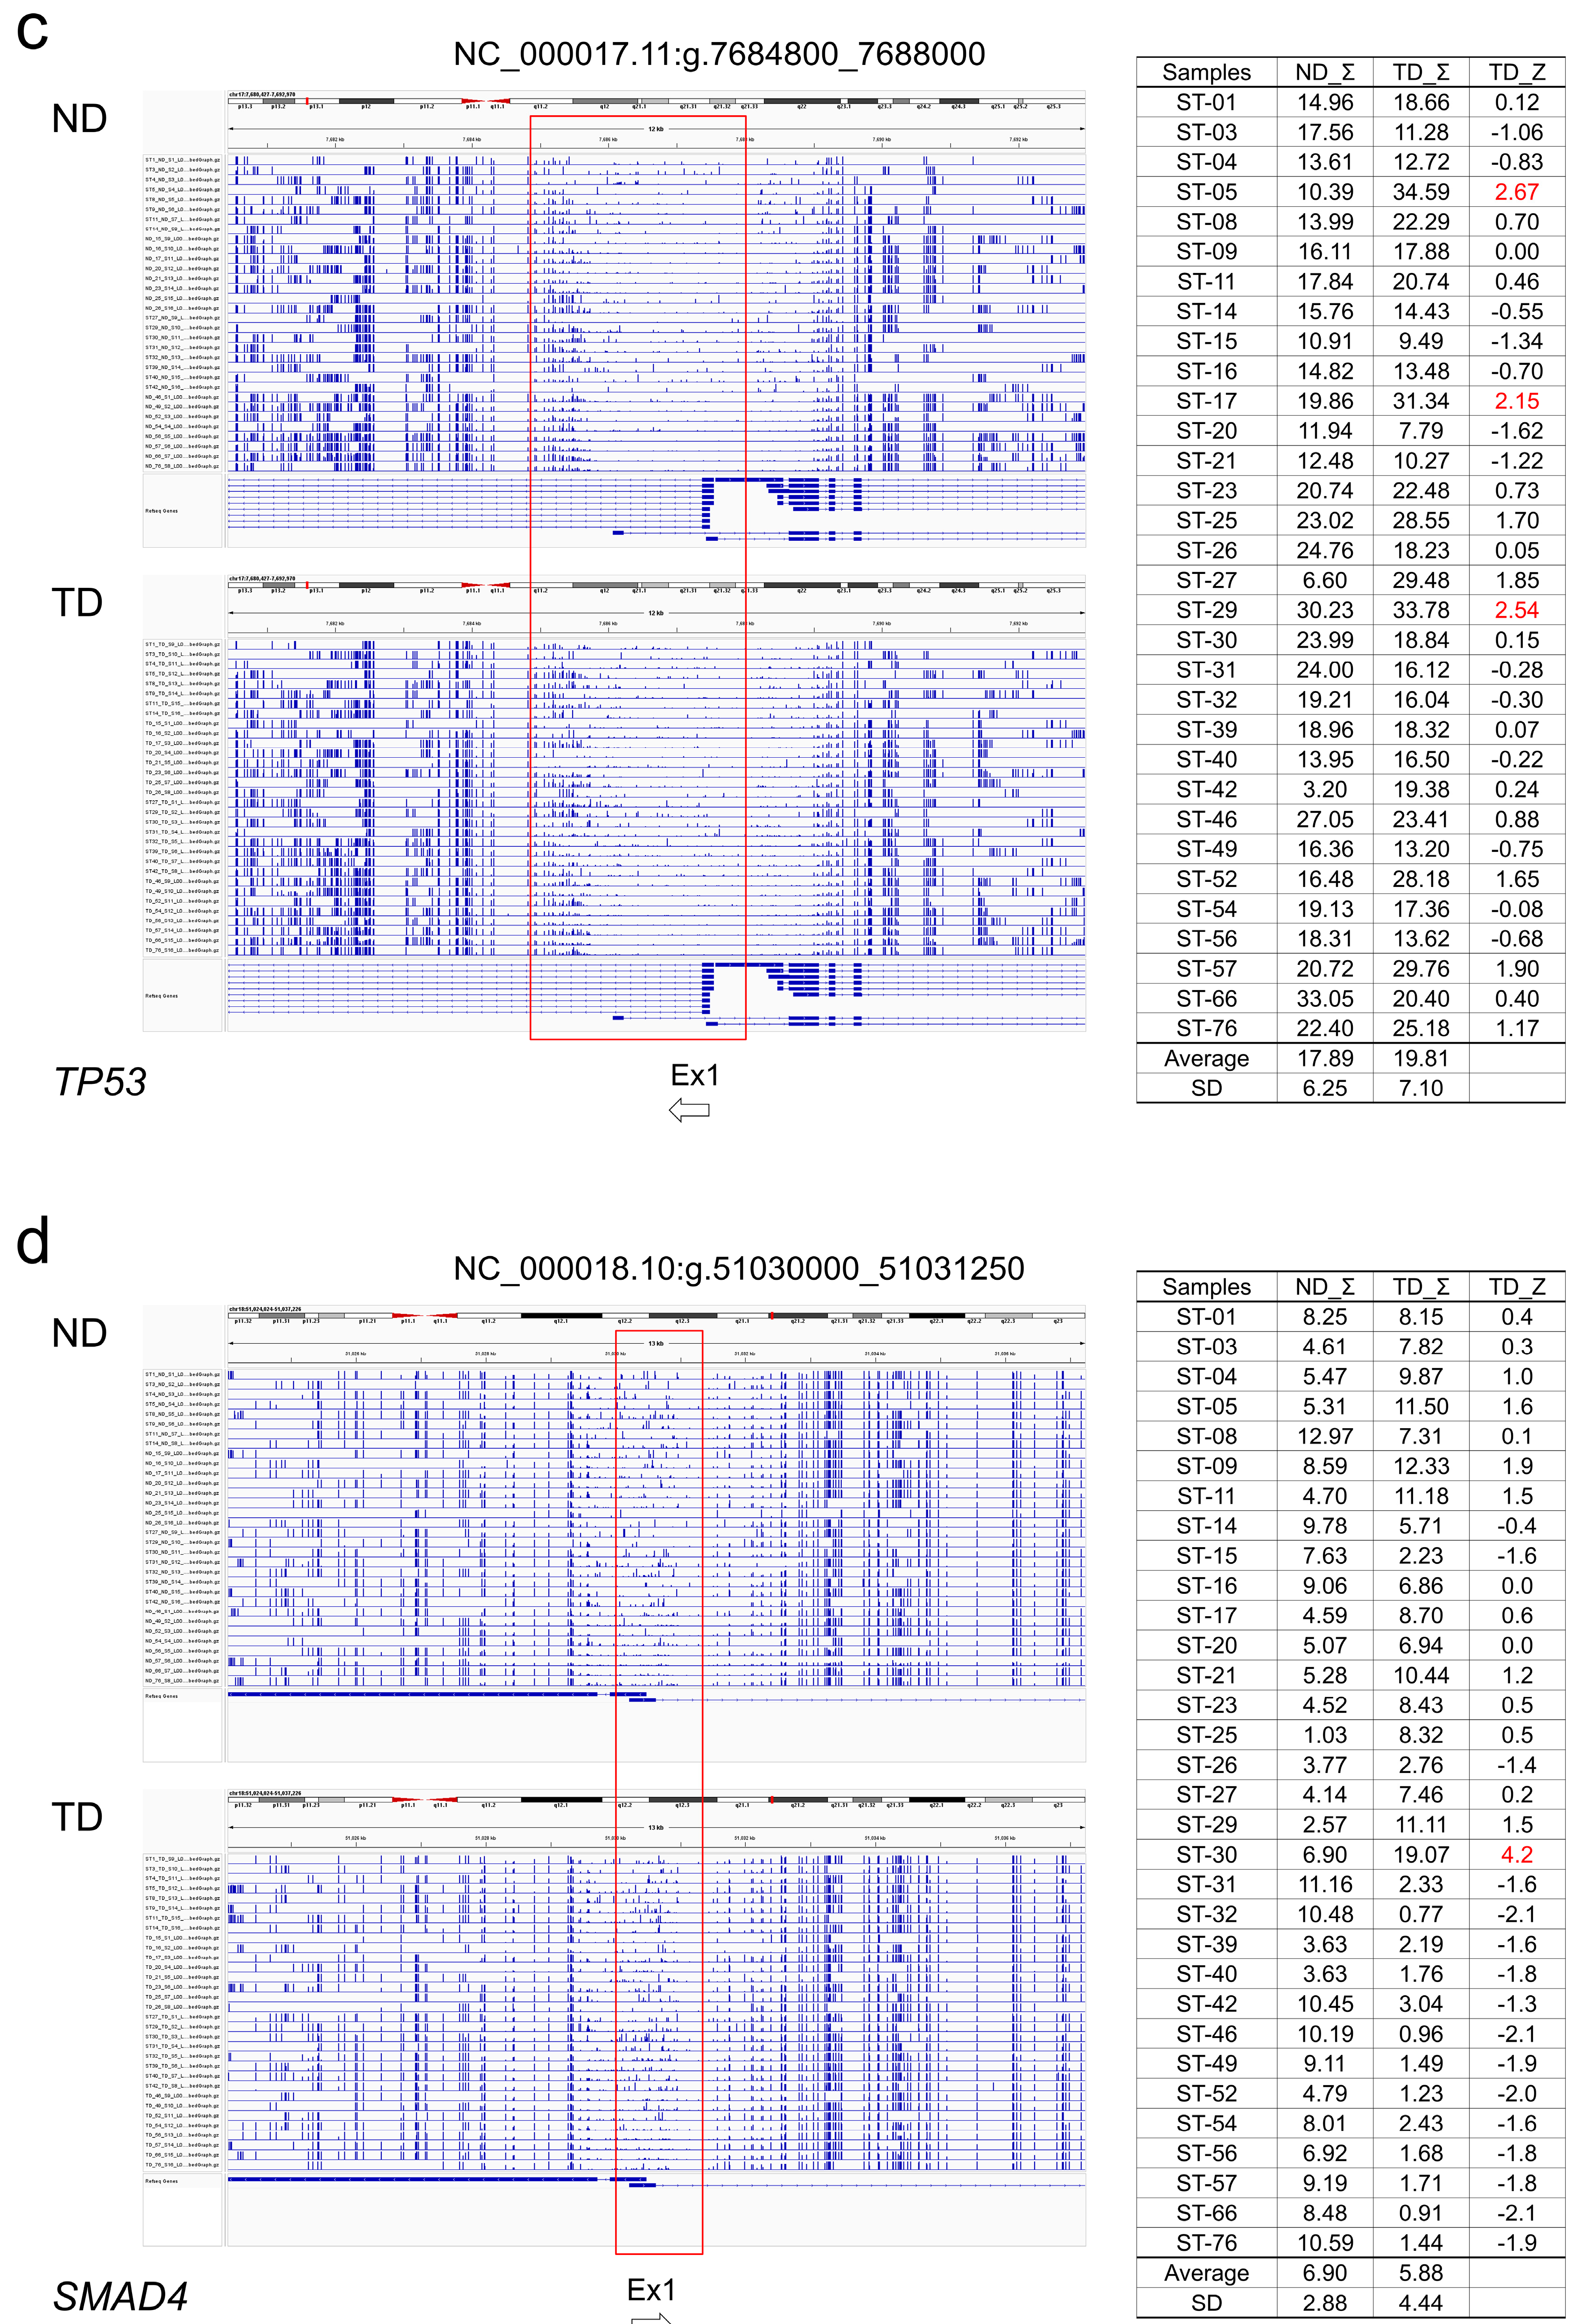
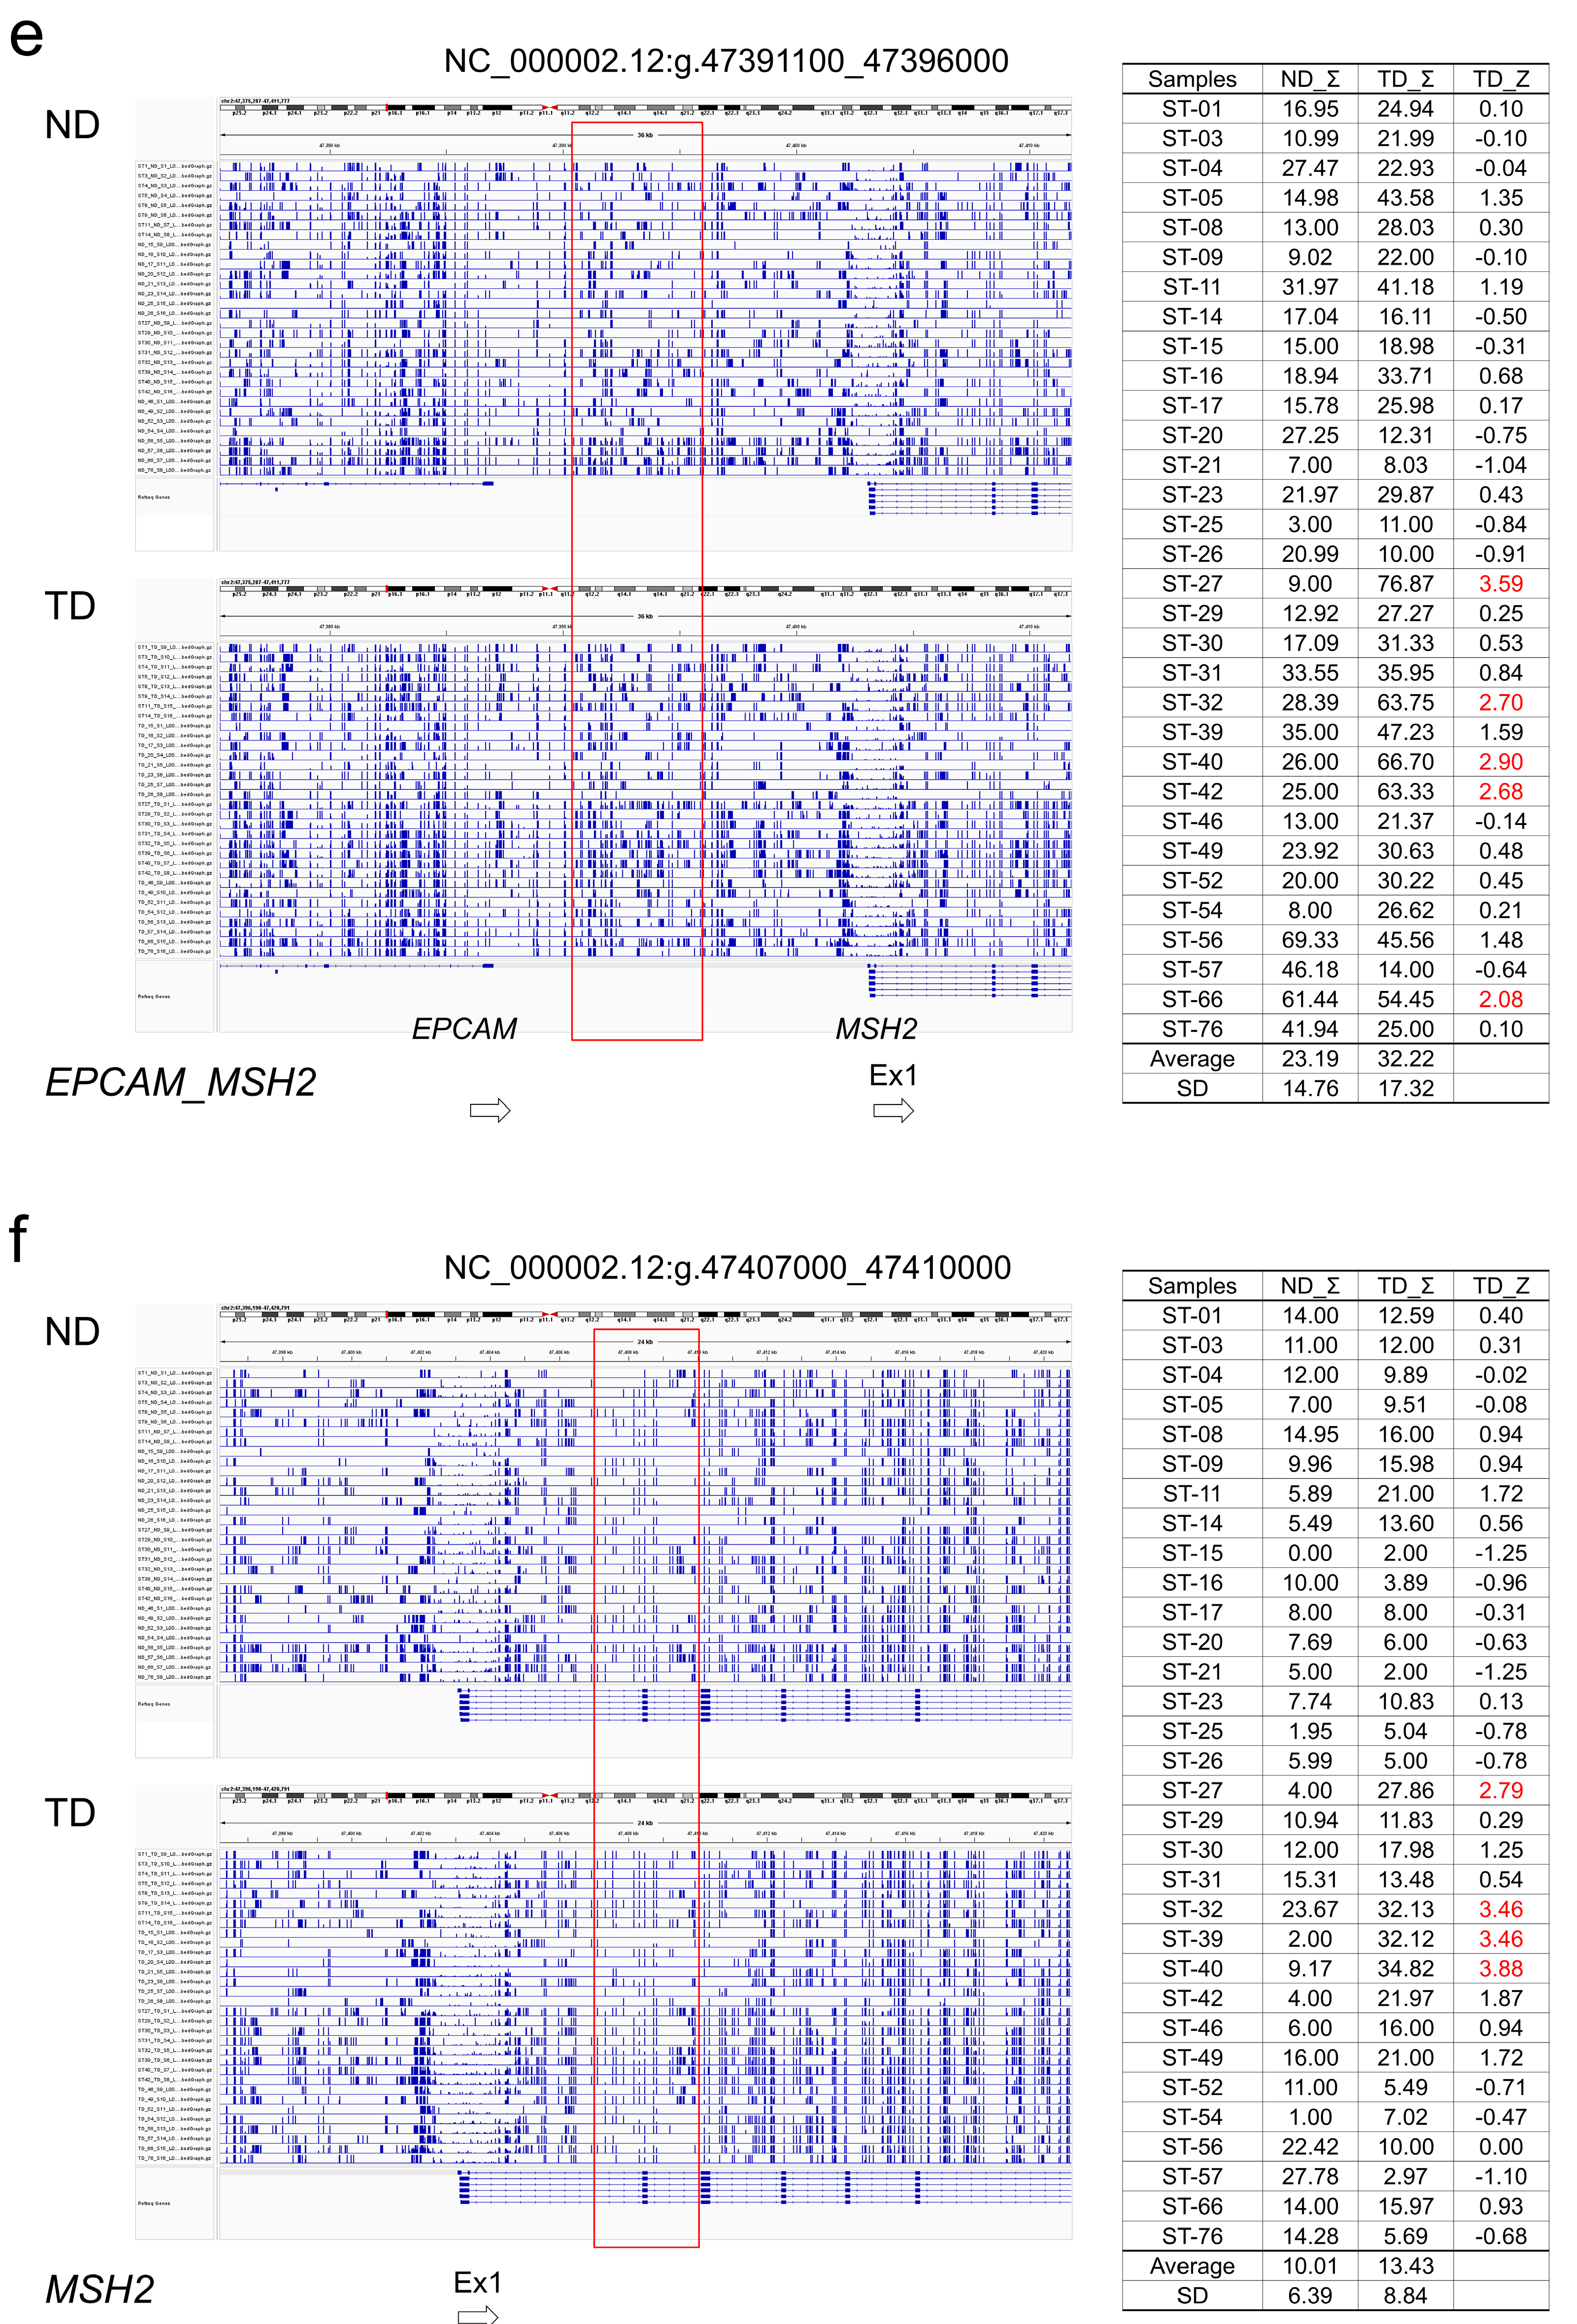
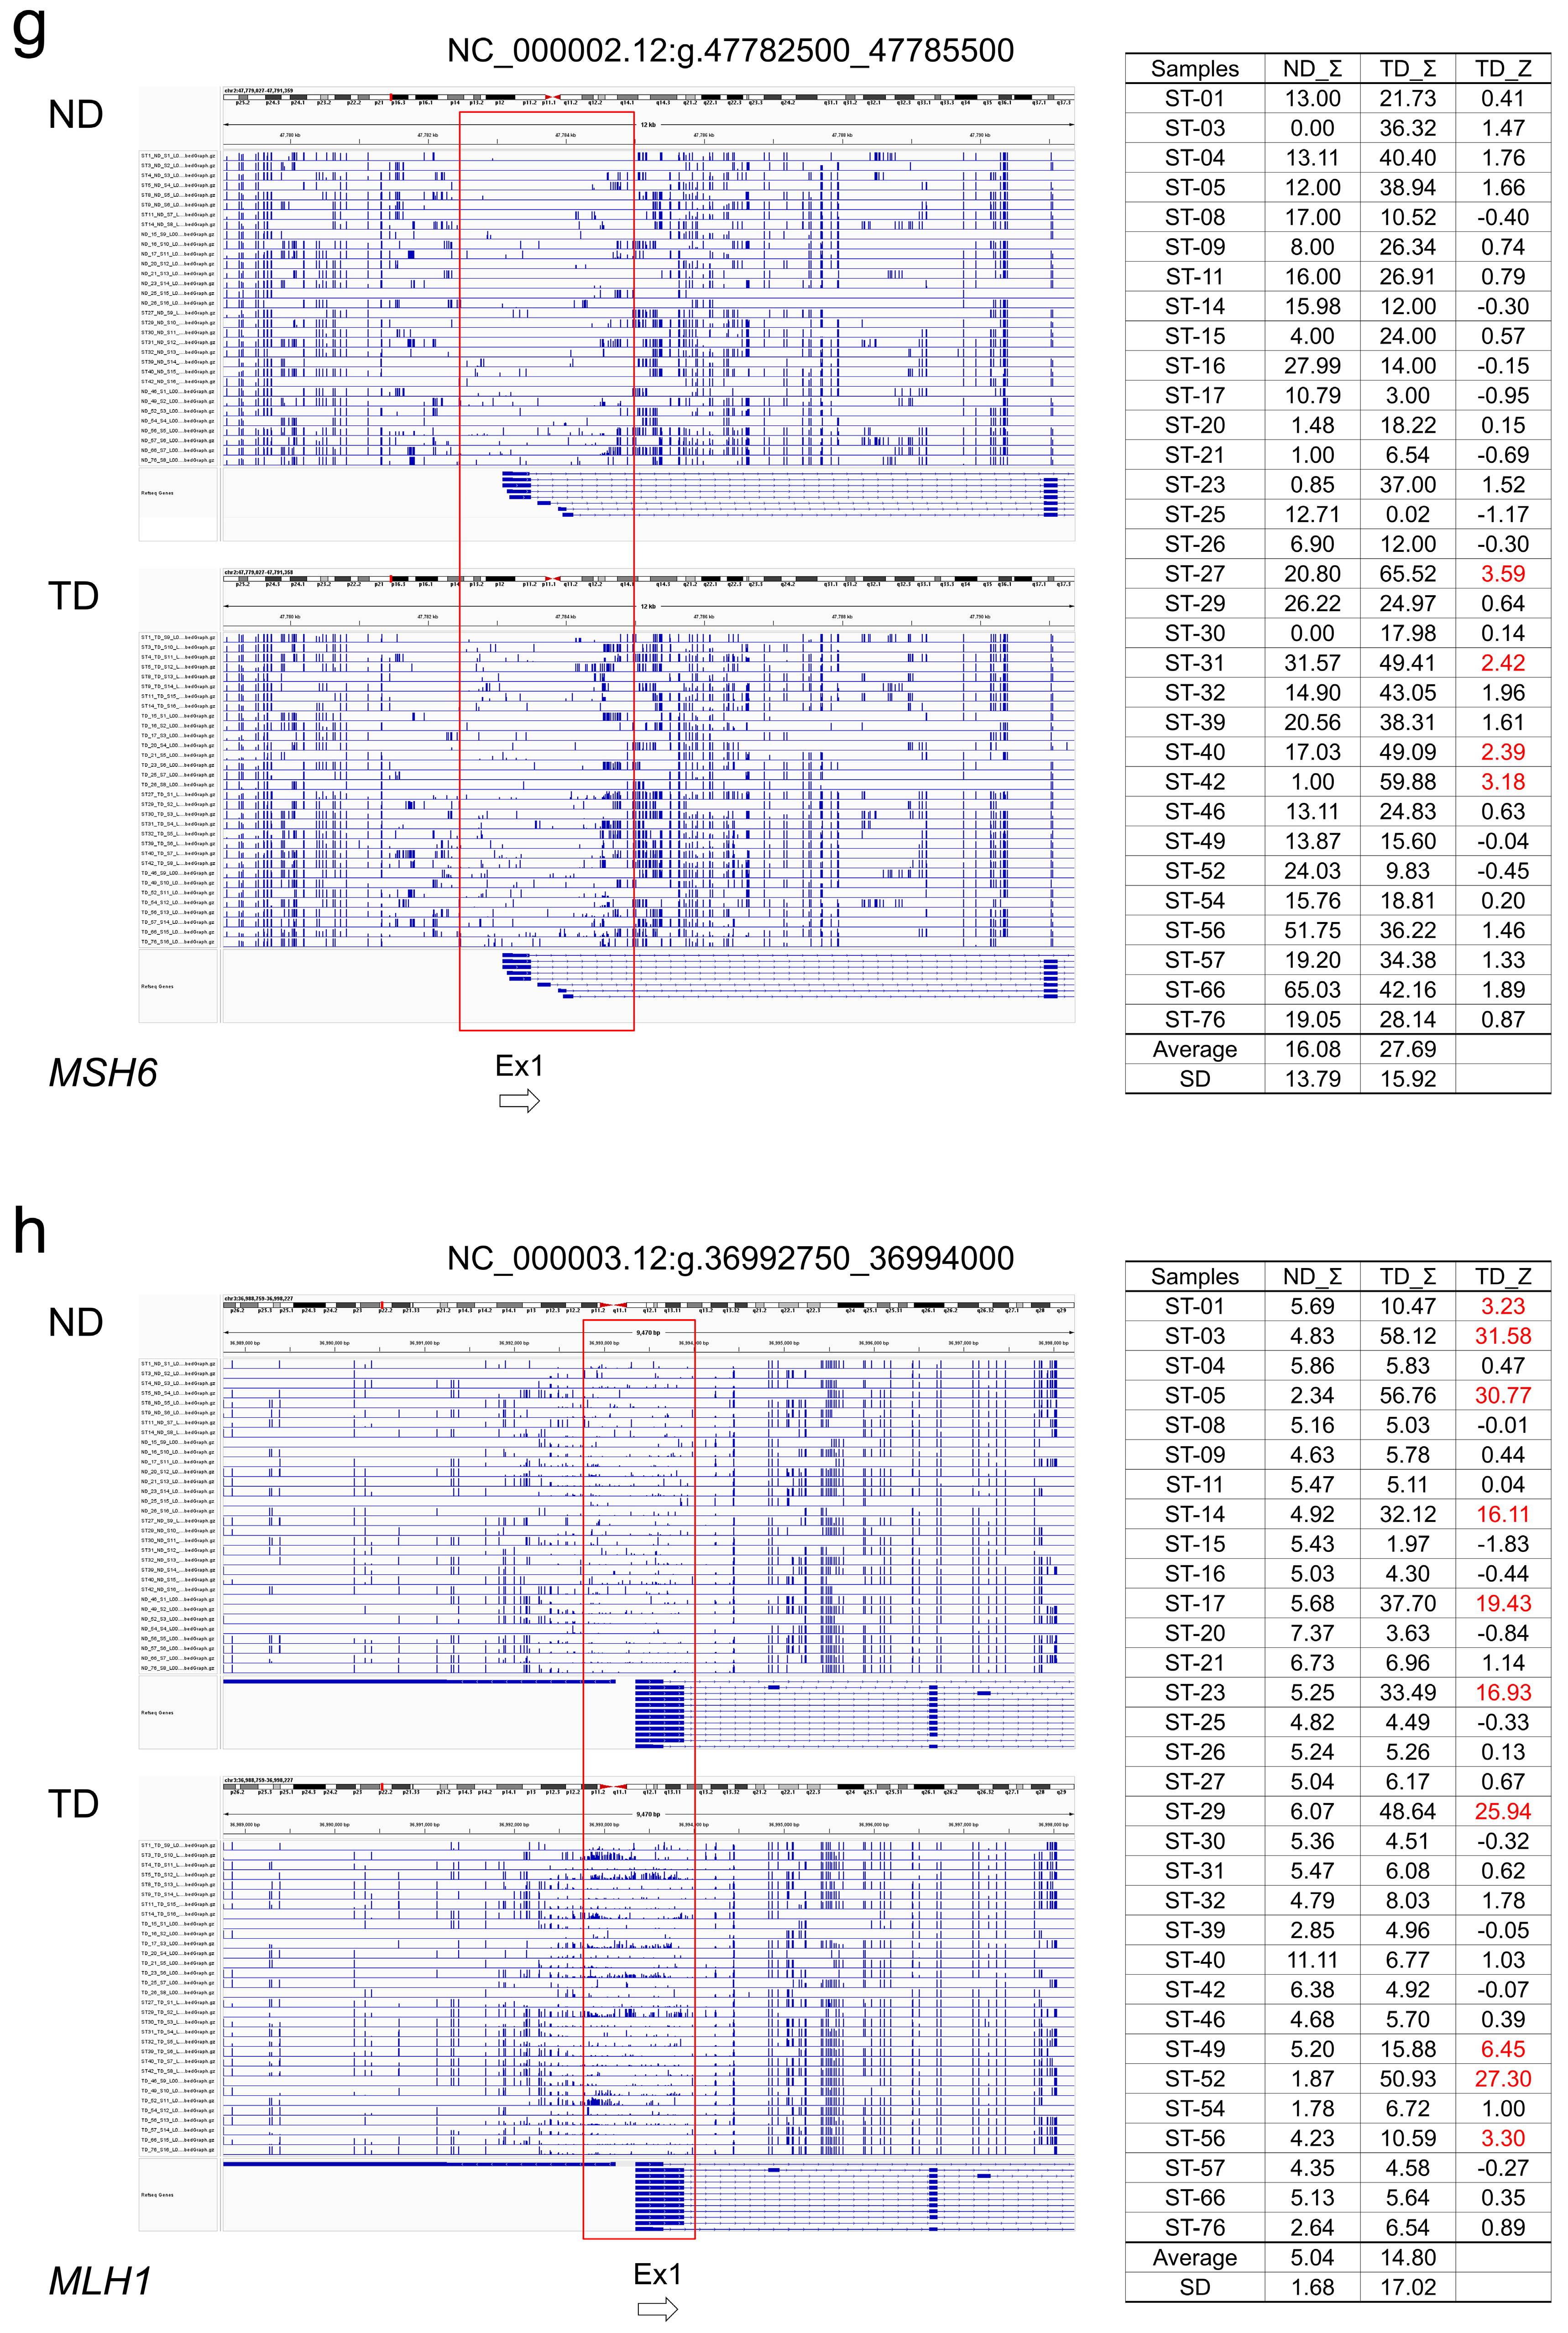
Figure 3.
Library preparation methods of vLAS, TgCap and TML.
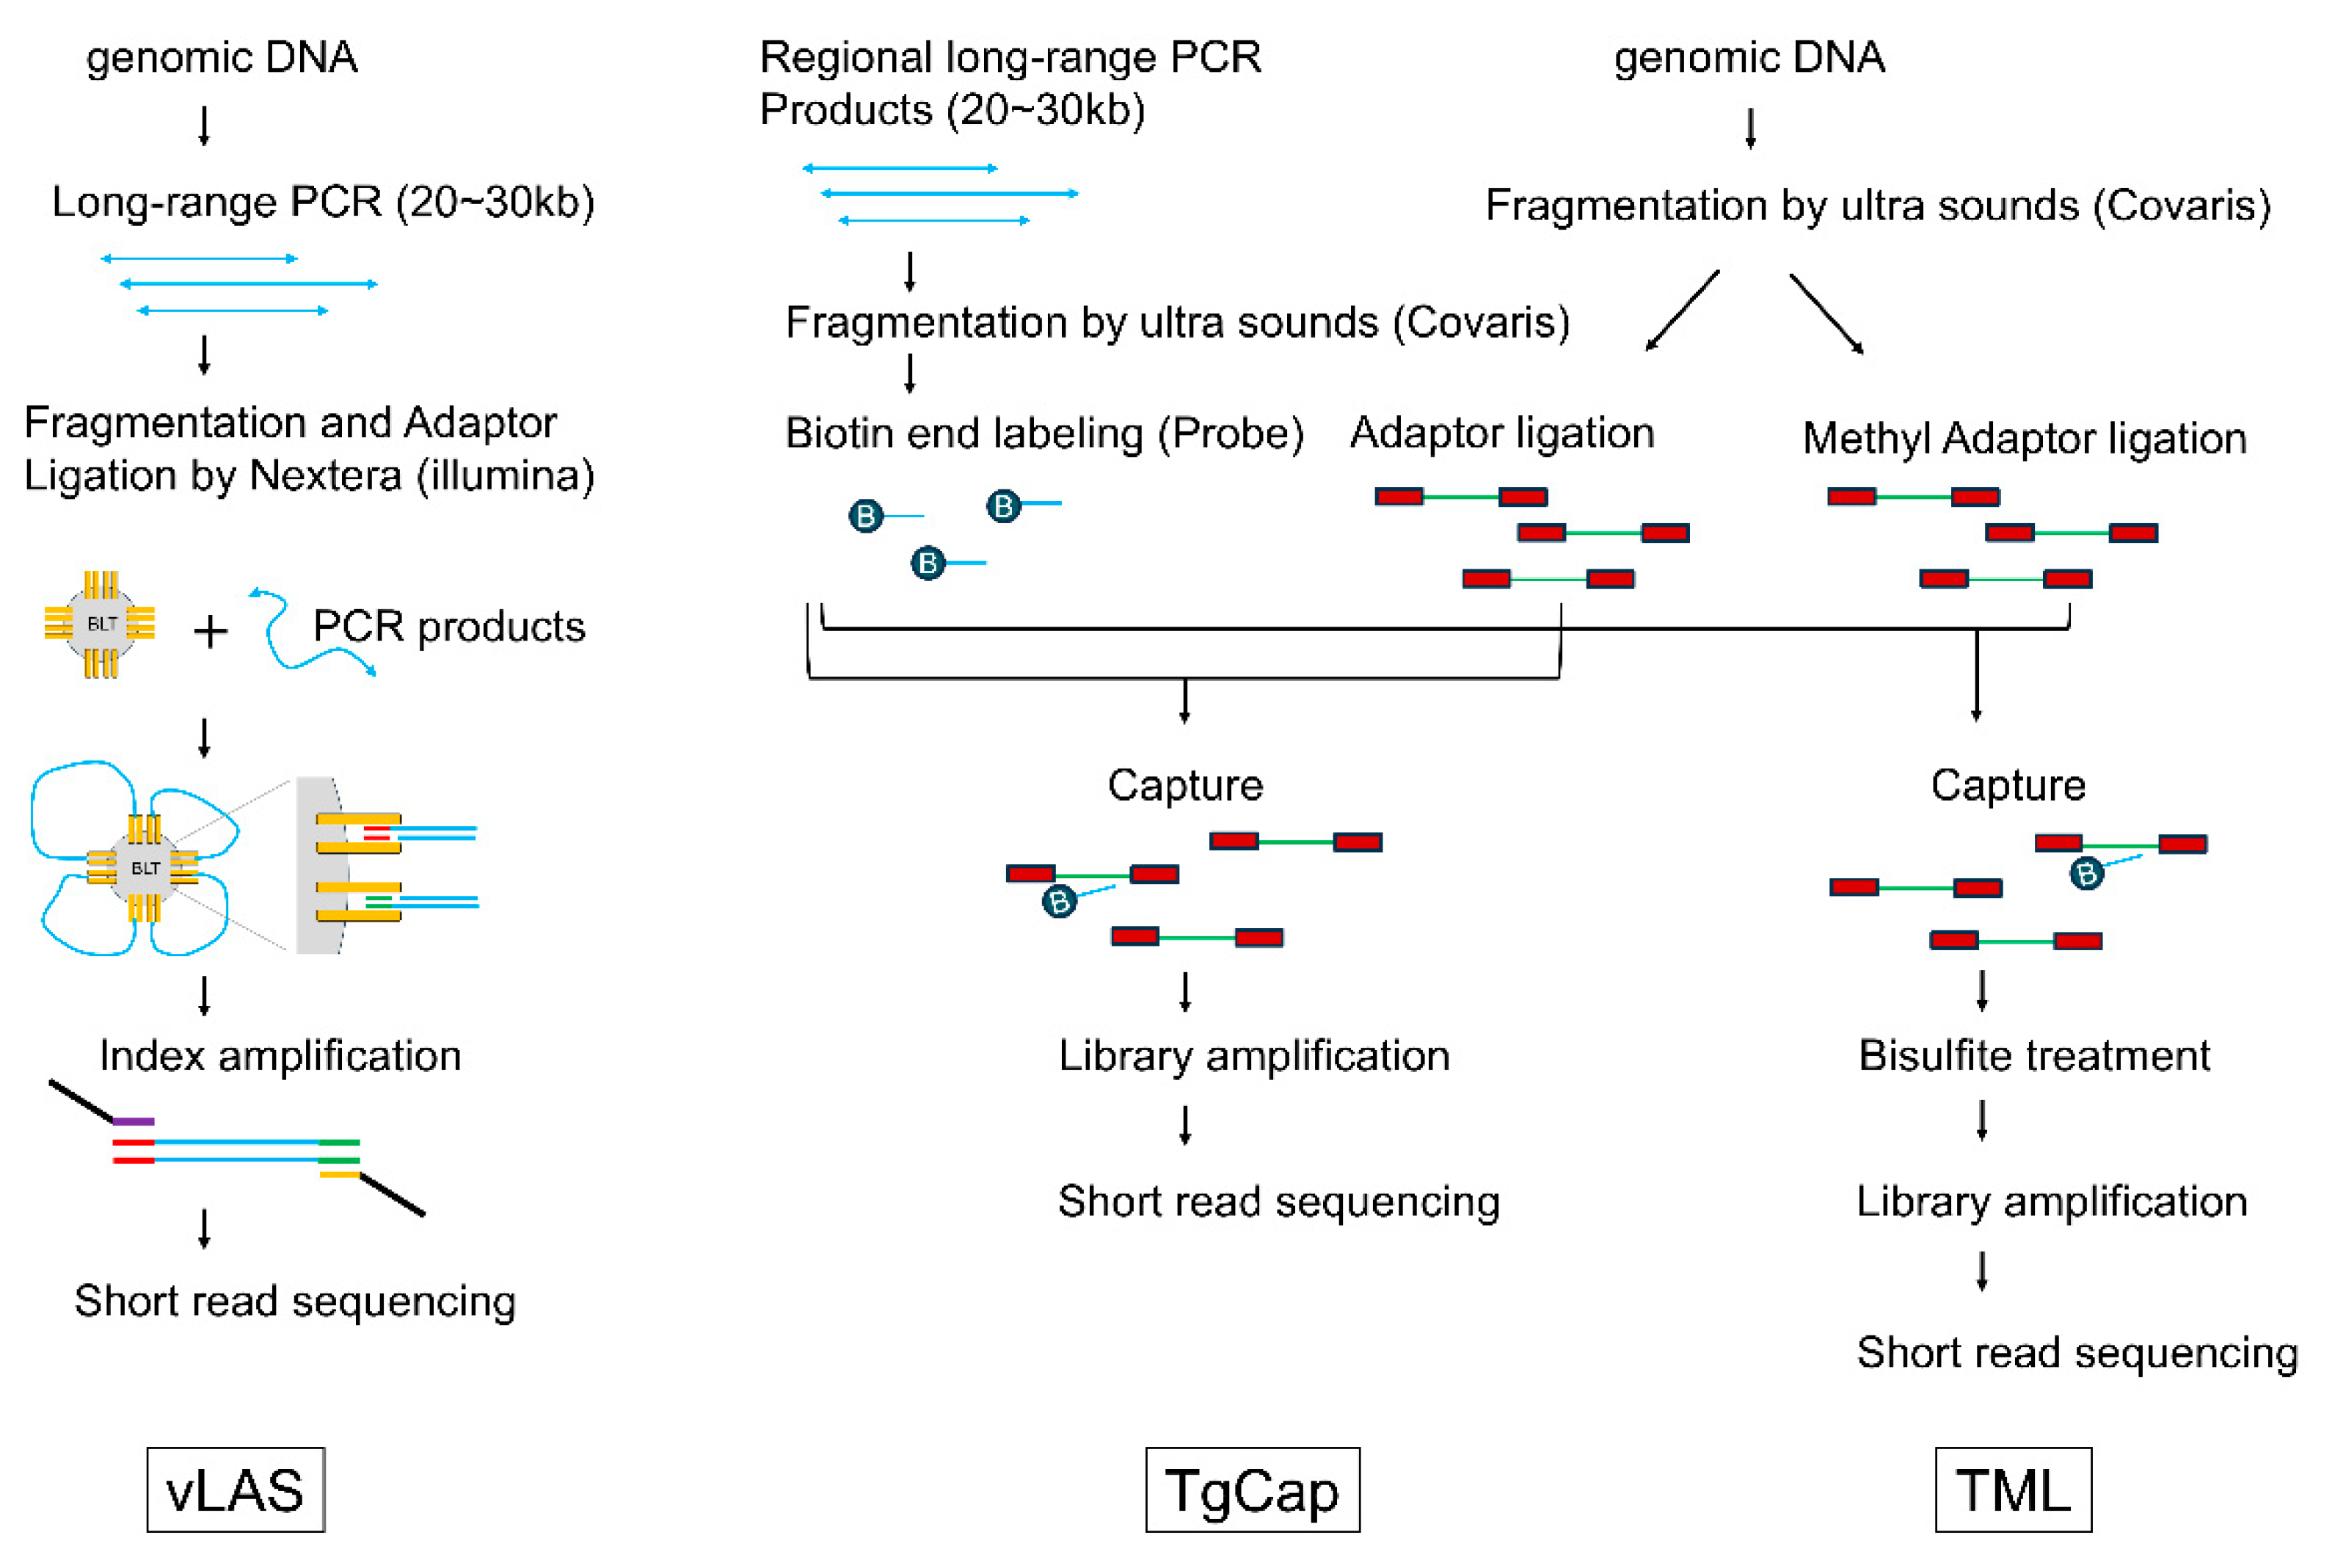

Table 1.
Clinical profile of the patients with colorectal cancer.
| Patient | Age | Sex | Locus | KRAS | BRAF | MSI |
|---|---|---|---|---|---|---|
| ST-01 | 62 | F | T | - | - | MSS |
| ST-03 | 79 | M | R | G12D | - | MSS |
| ST-04 | 55 | F | S | G13D | - | MSS |
| ST-05 | 90 | F | T | - | - | MSS |
| ST-08 | 86 | F | C | - | - | MSS |
| ST-09 | 73 | M | A | G12D | - | MSS |
| ST-11 | 67 | M | R | - | - | MSS |
| ST-14 | 67 | F | S | G12D | - | MSS |
| ST-15 | 80 | M | C | G13D | - | MSS |
| ST-16 | 70 | M | D | - | - | MSS |
| ST-17 | 84 | M | A | - | V600E | MSI-H |
| ST-20 | 81 | F | C | G13D | - | MSS |
| ST-21 | 64 | F | S | - | - | MSS |
| ST-23 | 85 | F | A | - | V600E | MSI-H |
| ST-25 | 64 | M | R | - | - | MSS |
| ST-26 | 74 | F | A | - | - | MSS |
| ST-27 | 77 | M | D | G12D | - | MSS |
| ST-29 | 74 | M | AR | - | - | MSI-H |
| ST-30 | 61 | F | A | G13C | - | MSS |
| ST-31 | 84 | M | A | G12V | - | MSS |
| ST-32 | 55 | F | A | G12D | - | MSS |
| ST-39 | 73 | F | T | - | - | MSS |
| ST-40 | 85 | M | R | - | V600E | MSS |
| ST-42 | 83 | F | C | G13C | - | MSS |
| ST-46 | 68 | M | D | G12D | - | MSS |
| ST-49 | 82 | F | A | - | V600E | MSI-H |
| ST-52 | 88 | M | S | - | - | MSS |
| ST-54 | 75 | M | S+T(LST) | - | - | MSS |
| ST-56 | 70 | M | S+ML | - | - | MSS |
| ST-57 | 48 | F | R | - | - | MSI-H |
| ST-66 | 64 | F | R+LM | - | - | MSS |
| ST-76 | 59 | M | S | - | - | MSS |
A; ascending colon, C; cecal, D; descending colon, LM; liver metastasis, LST; laterally spreading tumor, ML; malignant lymphoma, R; rectal, S; sigmoid, T; transverse colon, MSI; microsatellite instability, MSI-H; MSI High, MSS; microsatellite stable.
Table 2.
Somatic variants and methylation profile 1 (APC, TP53, SMAD4).
| Tumor | APC | TP53 | SMAD4 | ||||
| DNA | Variants | MZS | MZS | Variants | MZS | Variants | MZS |
| Sample | (VAF) | Ex1A | Ex1B | (VAF) | (VAF) | ||
| ST-01 | R252* (0.33) N1818fs (0.40) |
- | - | R209Q (0.13) LO, DN | - | - | - |
| ST-03 | - | VH | H | Y181N (0.25) V | - | - | - |
| ST-04 | E763* (0.34) | - | - | R234H (0.51) LO, DN | - | - | - |
| ST-05 | R71C (0.10) V S457* (0.09) T1556fs (0.04) |
H | - | - | H | - | - |
| ST-08 | S943* (0.59) P1497fs (0.22)C T1556fs (0.20)C |
- | - | R209Q (0.67) LO, DN | - | N64fs (0.66) | - |
| ST-09 | T1368fs (0.24) S1415fs (0.42) |
- | - | - | - | - | - |
| ST-11 | Y935fs (0.44) | - | - | S176C (0.09) V | - | R361C (0.12) LO | - |
| ST-14 | V452fs (0.24) E1237* (0.34) |
EH | - | E246G (0.31) V | - | - | - |
| ST-15 | E1397* (0.52) | - | - | Y387fs (0.17) Q97E (0.23) V |
- | - | - |
| ST-16 | Q1367* (0.95) | - | - | E255fs (0.91) | - | - | - |
| ST-17 | L1449N (0.40) V | - | - | - | H | - | - |
| ST-20 | Ser1539* (0.92) | - | - | - | - | - | - |
| ST-21 | - | - | - | c.-32delA (0.44) | - | - | - |
| ST-23 | - | - | - | V118D (0.82) V | - | C363R (0.77) V | - |
| ST-25 | G635fs (0.15) | - | - | Ile123fs (0.06) | - | - | - |
| ST-26 | S245* (0.62) S2146L (0.15) V |
- | - | G206S (0.88) LO | - | - | - |
| ST-27 | 1357* (0.33) | - | - | E255G (0.33) V | - | - | - |
| ST-29 | S1163_Y1166del (0.13) E1265fs (0.23) S2295_R2301del (0.10) R2347fs (0.11) S2512fs (0.11) |
- | - | L383fs(0.54) R243W (0.14) LO, DN |
H | - | - |
| ST-30 | S874* (0.35) R1435* (0.31) |
- | - | R234H (0.49) T, DN R228W (0.12) T |
- | - | H |
| ST-31 | R876* (0.63) R1450* (0.17) |
- | - | R209Q (0.86) LO, DN | - | - | - |
| ST-32 | R1314fs (0.91) | - | - | - | - | - | - |
| ST-39 | - | EH | H | V118D (0.73) V | - | C363R (0.81) V | - |
| ST-40 | - | H | - | V134L (0.43) LO | - | A118V (0.35) V | - |
| ST-42 | E901* (0.30) T1556fs (0.18) |
- | - | Q126* (0.22) | - | - | - |
| ST-46 | D1394fs (0.43) | - | - | c.258G>A T86= (0.27) Sp | - | - | - |
| ST-49 | - | - | - | - | - | - | - |
| ST-52 | V1405fs (0.63) | - | - | - | - | - | - |
| ST-54 | - | - | - | E17* (0.31) | - | - | - |
| ST-56 | S1421fs (0.59) S2607F (0.29) V |
VH | - | G227E (0.50) V | - | L495H (0.33) V | - |
| ST-57 | - | - | - | - | - | - | - |
| ST-66 | S1315fs (0.67) | EH | - | C102Y (0.45) V | - | - | - |
| ST-76 | c.835-8A>G (0.60) Sp Q2742* (0.25) |
H | - | Y387fs (0.645) R209Q (0.50) LO, DN |
- | C401Y (0.25) V A456V (0.40) V |
- |
H; high (2~5SD), EH; extream high (≦10SD), MZS; methylation Z-score, VAF; variant allele frequency, VH; very high (5~10SD), C; cis, DN; Dominant negative variant, LO; Likely oncogenic, T; trans, Sp; known splicing variant, V; variant of of uncertin significance (VUS).
Table 3.
Somatic variants and methylation profile 2 (MMR genes).
| Tumor | MSH2 | MSH6 | MLH1 | PMS2 | ||||
| DNA | Variants | MZS | MZS | Variants | MZS | Variants | MZS | Variants |
| Sample | (VAF) | 5’UTR | In1_2 | (VAF) | (VAF) | (VAF) | ||
| ST-01 | - | - | - | - | - | - | H | - |
| ST-03 | - | - | - | - | - | - | EH | M676V (0.42) V |
| ST-04 | - | - | - | - | - | - | - | - |
| ST-05 | - | - | - | - | - | - | EH | - |
| ST-08 | - | - | - | - | - | - | - | - |
| ST-09 | Q893* (0.18) | - | - | - | - | - | - | - |
| ST-11 | - | - | - | - | - | - | - | - |
| ST-14 | - | - | - | - | - | - | EH | - |
| ST-15 | - | - | - | - | - | - | - | - |
| ST-16 | - | - | - | - | - | - | - | - |
| ST-17 MH | - | - | - | - | - | N444fs (0.34) | EH | - |
| ST-20 | - | - | - | - | - | 1731+2T>C (0.25) | - | - |
| ST-21 | - | - | - | - | - | - | - | - |
| ST-23 MH | - | - | - | - | - | - | EH | - |
| ST-25 | - | - | - | - | - | Q197H (0.10) V | - | - |
| ST-26 | - | - | - | - | - | F656C (0.09) V | - | - |
| ST-27 | - | H | H | - | H | - | - | - |
| ST-29 MH | Q4* (0.25) | - | - | S625C (0.27) VI1170fs (0.25) | - | - | EH | - |
| ST-30 | - | - | - | - | - | - | - | - |
| ST-31 | - | - | - | - | H | - | - | - |
| ST-32 | - | H | H | - | H | - | - | - |
| ST-39 | - | - | H | - | - | - | - | - |
| ST-40 | - | H | H | - | H | - | - | - |
| ST-42 | - | H | - | - | H | - | - | - |
| ST-46 | - | - | - | - | - | - | - | - |
| ST-49 MH | - | - | - | - | - | - | VH | - |
| ST-52 | - | - | - | - | - | - | EH | - |
| ST-54 | - | - | - | - | - | - | - | - |
| ST-56 | - | - | - | - | - | M587I (0.25) V | H | - |
| ST-57 MH | - | - | - | - | - | c.306+1G>A (0.60) | - | - |
| ST-66 | - | H | - | - | - | - | - | - |
| ST-76 | N919D (0.50) V | - | - | E807* (0.40)K1315R (0.50) V | - | - | - | - |
H; high, EH; extream high, MMR; mismatch repair, MZS; methylation Z-score, VAF; variant allele frequency, VH; very high, V; variant of of uncertin significance (VUS.
Disclaimer/Publisher’s Note: The statements, opinions and data contained in all publications are solely those of the individual author(s) and contributor(s) and not of MDPI and/or the editor(s). MDPI and/or the editor(s) disclaim responsibility for any injury to people or property resulting from any ideas, methods, instructions or products referred to in the content. |
© 2025 by the authors. Licensee MDPI, Basel, Switzerland. This article is an open access article distributed under the terms and conditions of the Creative Commons Attribution (CC BY) license (http://creativecommons.org/licenses/by/4.0/).
Copyright: This open access article is published under a Creative Commons CC BY 4.0 license, which permit the free download, distribution, and reuse, provided that the author and preprint are cited in any reuse.


