
Submitted:
18 December 2024
Posted:
19 December 2024
You are already at the latest version
Abstract
Background: Colorectal cancer (CRC) is characterized by uncontrolled growth of malignant colonic or rectal crypt epithelium. About 85% of CRCs evolve through a stepwise progression from dysplastic colorectal adenomas. Better understanding of the evolution from adenoma to carcinoma can provide a window of opportunity not only for early detection and therapeutic intervention but potentially also for cancer prevention strategies. Methods: This study investigates the heterogeneous methylation, copy number alteration (CNA), and mutation signals of histological adenoma subtypes in the context of progression from normal colon to Advanced Precancerous Lesions (APLs) and early-stage CRC. Results: Differential methylation analysis revealed 2,321 significantly altered regions among APLs: 137 hypermethylated regions between serrated vs. tubular, 2,093 between serrated vs. tubulovillous, and 91 between tubular vs. tubulovillous adenoma subtypes, respectively. The most differentiating pathways for serrated adenomas belonged to cAMP signaling and regulation of pluripotency of stem cells, while regions separating tubular and tubulovillous subtypes were enriched for WNT signaling. CNA events were mostly present in tubular or tubulovillous adenomas, with the most frequent signals seen in chromosomes 7, 12, 19 and 20. In contrast, early-stage CRC exhibited signals in chromosomes 7, 8 and 20, indicating different processes between APL and early-stage CRC. Mutations reinforce subtype level differences, showing specific alterations in each subtype. Conclusions: These findings are especially important for developing early detection or cancer prevention tests trying to capture adenoma signatures.
Keywords:
Colorectal cancer
; adenoma
; Advanced Precancerous Lesion
; methylation
; copy number alterations
; pathway enrichment
1. Introduction
Colorectal cancer (CRC) encompasses a heterogeneous group of malignancies arising from the epithelial cells lining the colon and rectum, representing a substantial burden on public health, with over 1.9 million new cases and 935,000 deaths in 2020 (1). CRC is the third most diagnosed cancer and the second leading cause of cancer-related mortality globally. Understanding the intricate molecular mechanisms driving the initiation, progression, and metastasis of CRC is crucial for early detection and the development of targeted therapeutic interventions to improve clinical outcomes (2).
The etiology of CRC is multifactorial, with both genetic and environmental factors playing pivotal roles. Whilst hereditary syndromes, such as familial adenomatous polyposis (FAP) and Lynch syndrome account for a subset of cases (3), most of CRC cases occur sporadically and are strongly influenced by lifestyle factors including diet, physical inactivity, and smoking (4). Alarmingly, recent years have shown a dramatic increase in patients with early-onset CRC (5).
The adenoma-carcinoma sequence, proposed by Vogelstein (6), delineates a stepwise progression of CRC from small dysplastic lesions via Advanced Precancerous Lesions (APLs) to the development of invasive carcinomas. Genetic alterations play pivotal roles in driving this progression, particularly frame shift single nucleotide mutations as in Kirsten rat sarcoma viral oncogene homolog (KRAS) (7) and tumor protein p53 (TP53) (8) genes or both copy number variations (CNVs) and single nucleotide mutations as in adenomatous polyposis coli (APC) (9), among others (10). Dysregulation of key signaling pathways, such as the Wnt/β-catenin, Ras-MAPK, and PI3K-Akt, further contributes to uncontrolled cellular proliferation characteristic of CRC (11). Notably, CRC and adenomas also exhibit significant levels of apoptosis, indicating a complex balance between cellular proliferation and cell death. This interplay, particularly in tumors with high-turnover phenotypes, may influence both prognosis and susceptibility to chemotherapeutic interventions, as suggested by emerging evidence (12) (13).
APLs can be broadly classified into several subtypes based on their histological features: tubular (TA), Villous/Tubulovillous (VA/TVA), and serrated adenomas (SA). Each subtype varies in its histopathological characteristics, genetic mutations, and risk of progression to colorectal cancer (14). TAs, the most common type, are characterized by a predominantly tubular glandular structure. Histologically, they exhibit elongated, tube-like glands lined by dysplastic epithelial cells. Tubular adenomas are generally smaller and have a lower risk of progressing to colorectal cancer than other subtypes; however, the risk increases with the size and degree of dysplasia of the adenoma (15).
Villous adenomas are less common but are associated with a higher risk of malignant transformation. These adenomas have a frond-like or villous architecture, with finger-like projections extending into the lumen of the colon. VAs tend to be larger and more often display high-grade dysplasia and display a greater propensity for transformation to invasive cancer (16).
Tubulovillous adenomas exhibit a combination of both tubular and villous features, comprising 25-75% villous structures. This hybrid nature places them at an intermediate risk of malignant transformation between that of tubular and villous adenomas respectively. The proportion of the villous component within these adenomas is correlated with risk of cancerous transformation (17).
SAs, encompassing traditional serrated adenomas (TSAs) and sessile serrated polyps/lesions (SSPs/SSLs), represent a distinct category characterized by a serrated or saw-toothed epithelial architecture. These adenomas are associated with the serrated pathway of colorectal carcinogenesis, which involves distinct genetic mutations such as BRAF or KRAS (18)(19). Serrated adenomas, particularly of the sessile type, are recognized for their potential to progress to colorectal cancer through the serrated neoplasia pathway, a process that is often marked by CpG island methylator phenotype (CIMP) and microsatellite instability (MSI) (20).
The CIMP phenotype is characterized by widespread hypermethylation of CpG islands in the promoter regions of genes, leading to their silencing. This epigenetic alteration is particularly associated with specific genetic mutations, such as those in BRAF, and is more prevalent in right-sided colon cancers (21). Microsatellite instability, on the other hand, arises from defects in the DNA mismatch repair (MMR) system, resulting in insertion and deletion mutations within the genome's microsatellite regions (22). Remarkably, MSI-high status is a hallmark of Lynch syndrome-associated cancers and a subset of sporadic CRCs (23). Both CIMP and MSI phenotypes contribute to the heterogeneity of tumor behavior, prognosis, and response to therapy in colorectal cancer (24).
Beyond the genetic landscape, emerging evidence implicates the tumor microenvironment, immune system, and epigenetic modifications in CRC pathogenesis (25). Altogether, the heterogeneity observed in CRC tumors underscores the need for multiple approaches that consider the diverse molecular profiles exhibited by individual patients (26).
The primary objective of this study was to delineate a molecular signature that encompasses differentially methylated regions (DMRs), CNVs, and genomic mutations within subtypes of APLs to identify a molecular signature that distinctly separates APL subtypes. This paper reports the results of extensive molecular testing of a large cohort of well-characterized clinical samples from patients with diagnosed APLs.
2. Materials and Methods
2.1. Samples
In this multi-center retrospective study, a total of 166 fresh frozen (FF) tissue samples were obtained from different international biobank repositories, including TCBN (Caen, France), VCB (Melbourne, Victoria, Australia), Indivumed (Hamburg, Germany), IDIBAPS (Barcelona, Spain), LBIH Biobank (Liverpool, United Kingdome) and Dx Biosamples (San Diego, CA, United States).
96 and 46 paired tumor tissues and normal adjacent tissues from 48 APL and 23 stage I CRC were designedly selected for -omics detection. An independent set of APL samples were used for validation purposes.
Tissue samples with different histological background (sessile serrated lesions (SSLs), tubular adenomas (TAs) or villous/tubulovillous adenomas (VAs/TVAs)) were used to obtain DNA for whole genome bisulfite sequencing.
For our analysis, we define two samples as paired when extracted from the same patient though of differing tissue or sample type.
Demographic sample donor features are listed in Table 1:
2.2. Sample Preparation and Whole-Genome Bisulfite Sequencing (WGBS)
Genomic DNA (gDNA) from FF tissue was extracted using a DNeasy Blood & Tissue kit (Qiagen, Valencia, CA) according to a protocol from the manufacturer. Extracted gDNA was then fragmented into segments of about 400 bp with a Covaris S220 ultrasonicator. The extracted and shredded gDNA was bisulfite-converted with EZ DNA Methylation-Lightning kit (Zymo Research, Inc., Irvine, CA, USA). Sequencing libraries were prepared from the bisulfite converted DNA by using Accel-NGS Methyl-seq DNA library kit (Swift Biosciences [Ann Arbor, MI, USA]) and consequently sequenced to an average depth of 37.5x with NovaSeq6000 (Illumina, San Diego, CA, USA) equipment, using paired-end sequencing (2×150 bp). On average each sample had 335.58 M sequences.
2.3. Genomic Data and Methylation Processing
Quality checks and trimming were performed using FastQC (27) TrimGalore v0.4.5 (a wrapper tool around Cutadapt (28), which removed adapter sequences and poor-quality bases and reads).
The remaining high-quality reads were aligned to a bisulfite-converted human genome (Ensembl 91 assembly, hg38) using the Bismark Bisulfite Read Mapper (v0.20.0) (29), which makes use of Bowtie 1.2.1.1 alignment software (30). On average 89% of the sequences were aligned.
Methylation calls for every single C analyzed was performed by Bismark bismark_methylation_extractor script. For each CpG, Beta values (β) were calculated as:
β = CGmethylated / (CGmethylated + CGunmethylated),
where CGmethylated is the number of methylated cytosine and (CGmethylated + CGunmethylated) is the sum of methylated and unmethylated cytosine (total number of reads) at that position. The bisulfite conversion rate was estimated from Cytosine (C) in non-CpG context and was above 99%.
CpGs were first selected based on their coverage: CpGs not covered by at least 5 uniquely mapped reads in all samples were discarded for subsequent analyses such as those CpG with high beta difference variance, ending with 14848915 CpGs sites.
2.4. Analyses of Differentially Methylated Position/Region
To find differentially methylated regions, a pairwise analysis was performed using R in-house scripts, beta values were the input for all the analysis.
For each of the remaining CpGs, a paired Wilcox test was applied; p-values were corrected by Benjamin Hochberg (BH) algorithm and only those with a corrected p-value less than 0.05 and a methylation difference between the two groups of 0.2 were selected. Significant CpGs that fall in a SNP position and that have a population global minor allele frequency (MAF) more than 1% (dbSNP Build 155) were discarded.
Regions were formed summing CpGs that have a maximum distance of 50 bases. Only regions with 3 or more CpGs and more than 60% of significant CpGs respect to total number of CpGs of the region were selected for further analysis.
2.5. Pathway Enrichment Analysis
To analyze the biological meaning of our DMRs and add an extra layer of validation, we performed a pathway enrichment with KEGG (31) pathways. As a first step, an extensive mapping of the DMRs was performed to find putative cis-regulatory regions related to specific genes using the rGREAT function (32). Afterwards, with the associated genes information, we proceeded to perform a pathway enrichment using ClusterProfiler (33), with a pvalue of 0.05, and limiting the search to Homo sapiens. Resulting pathways were visualized using R package enrichplot (34).
2.6. Copy Number Alteration Detection
To evaluate large-scale copy number alterations (CNAs) the tool ichorCNA (35) was used. Read counts for each APL, CRC and respective normal samples were calculated with the HMMcopy Suite (36): each genome was divided into 10-kb non-overlapping bins and aligned reads were counted based on overlap within each bin; then, read counts were normalized to correct for GC-content and mappability biases. Centromeres were filtered based on chromosome gap coordinates obtained from UCSC (University of California at Santa Cruz) for hg38.
Normal samples were used to create a reference data set. This data was further used to correct systematic biases arising from library construction, sequencing platform, and DNA-specific artifacts.
Copy number analysis was performed on autosomal chromosomes only, using ichorCNA default parameters.
2.7. Somatic Mutation Detection
To overcome the bisulfite conversion problem, which can cause cytosine to appear as thymine during sequencing and complicate the detection of true mutations, a pipeline based on EpiDiverse/snp (https://github.com/EpiDiverse/snp) (37) was created. In summary, bam files were first preprocessed using samtools (sort, calmd, and index), and then a double-masking procedure, which manipulates specific nucleotides and base quality (BQ) scores on alignments, was applied.
For each sample pair, pileup files were created with samtools. The somatic function of VarScan2 (38)(39) was used to call somatic single nucleotide variants (SNVs) and small insertions/deletions (INDELs) from the comparison between AA or CRC and NATs. Only positions that were present in both files and met the minimum coverage in both files were compared. Only mutations identified by the tool as somatic were annotated by SnpEff (40). To summarize, analyze, and visualize the mutations, the VCF output from VarScan2 and SnpEff was converted into Mutation Annotation Format (MAF) files and analyzed using the R Bioconductor package Maftools (41).
2.8. CpG Island Methylator Phenotype (CIMP)
To predict the CIMP status of each sample, we utilized CpGs derived from promoter regions that exhibited a high standard deviation (SD >0.2) of methylation levels in tumor tissues and a low methylation level (mean β <0.05) in normal tissues. Consensus clustering analysis based on the K-means algorithm was performed using the R package ConsensusClusterPlus (42). Given the limited number of available samples for DNA methylation profiling in this study, we classified samples with hypermethylation patterns as CIMP-H, while all other samples were categorized as CIMP-L.
2.9. Microsatellite Instability (MSI) Status Prediction
Due to the converted data, standard short tandem repeat DNA sequence search methods are unable to detect microsatellite instability (MSI). Therefore, in this study, the MSI status was determined by examining potential frameshift mutations in genes involved in the mismatch repair (MMR) pathway and employing a prediction method called microarray DNA methylation tumor tissue profiling based MSI estimation (MSIMEP) (43).
2.10. Principal Component Analysis (PCA)
Principal component analysis (PCA) reduces the dimensionality of multivariate data, to two or three that can be visualized graphically with minimal loss of information. PCA was performed on epigenomics data to illustrate the differences between APL histologies using the prcomp function in R package stats. The R package factoextra was used to visualize the PCA output.
3. Results
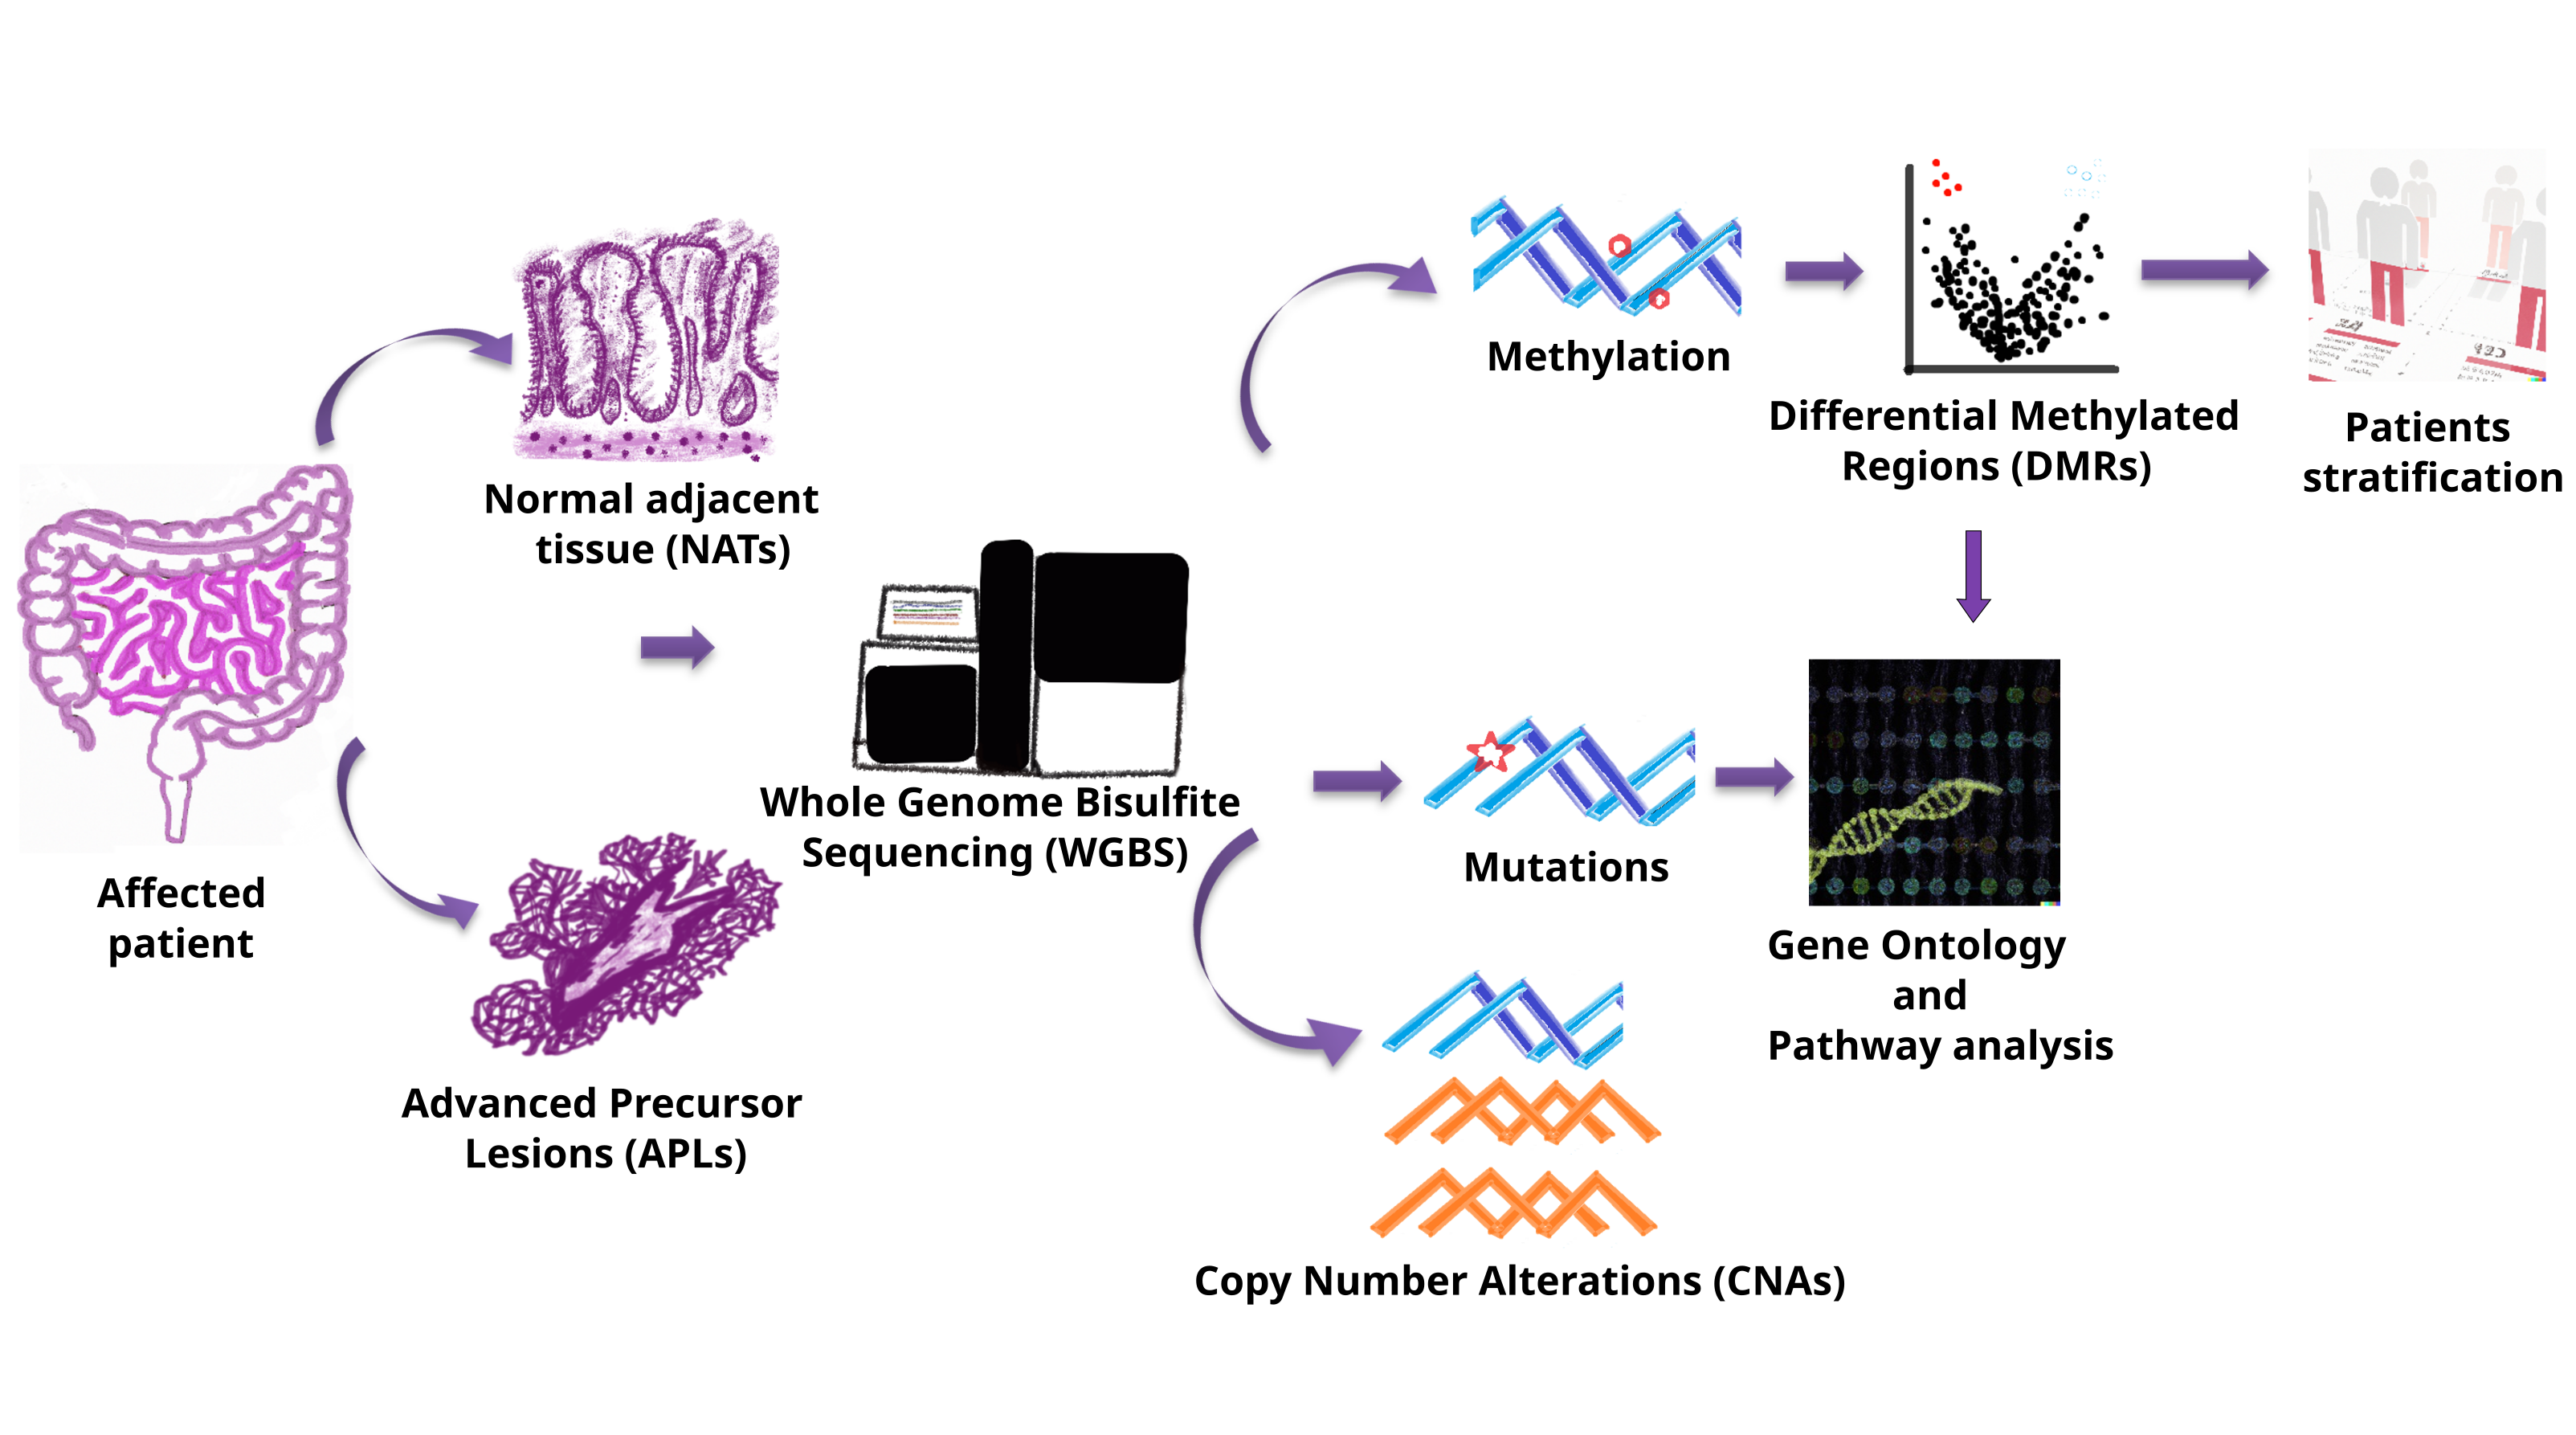
We obtained 166 fresh frozen samples, fully characterized clinically and histologically using standardized criteria (described in the Methods section and Supplementary Table 1). To ensure robustness and generalizability, samples were divided into a discovery dataset of 48 APL samples paired with normal adjacent tissue (NAT), a validation dataset of 26 non-paired APL samples and a third dataset comprised of 23 paired CRC samples (Table 1). The discovery dataset was used to explore and identify the APL signature, performing differential methylation analysis and CNV/mutation analysis, while the validation dataset was used exclusively for assessing our signature performance in the agnostic identification of APLs using the signature method. Finally, the CRC dataset was used to compare and understand the differences between the precancerous state versus the invasive cancer state. Research pipeline is resumed in Figure 1.
3.1. DMR Analysis Shows Unique Methylation Patterns Between APL’s Subtypes and CRC
We conducted a thorough discovery process for DMR between APL subtypes, aiming to identify specific changes in methylation patterns across the genome to discern differences between subtypes. The analysis began with a pairwise profiling of different APL subtypes and their corresponding Non-Adjacent Normal Tissue (NAT) as controls, followed by comparison among the three histology types for both APL and NAT. The findings from these analyses are summarized in Table 2.
Starting from 122,348 DMRs, divided into 6,263 hypermethylated and 116,050 hypomethylated, we focused on the hypermethylated unique regions from each APL to extract relevant biological information.
As illustrated in Figure 2a, marked as red circles, we pinpointed the unique hypermethylated regions arising downstream for the identification of representative signatures for each stage in the pre-malignant evolution as can be seen in the Venn diagram (Figure 2b). We found 2,003 hypermethylated regions across APL subtypes, which were absent in the normal adjacent tissues. It should be noted that DMRs are found not to be correlated with age (average Spearman correlation of 0.06) or sample origin (average Spearman correlation of 0.09).
After analyzing the genomic distribution of the DMRs, we found a global presence of methylated regions in all chromosomes. In Figure 2b, a Circos representation of the human genome, external rings represent the chromosomes from 1 to 22, the next two rings are the density in a dot or density plot of DMRs in each part of the chromosomes sequence. Of particular note, there is significant enrichment of DMRs on Chromosome 7.
As expected, CRC samples were found to display unique methylation patterns different from those found in APL subtypes and NATs (Figure S1).
In totality, these results suggest that, during the evolution of malignant transformation, there exist specific methylation patterns that characteristically define each stage of APLs and, ultimately, CRC.
3.2. DMR Signature Enables Sample Stratification According to APL Subtype
Next, to reveal features intrinsic to each APL subtype and to reduce the number of variables that do not participate in the phenotype, we performed a Principal Component Analysis (PCA). DMRs were effectively able to separate APL samples into three groups of high-similarity components characterized by histological subtype in both discovery and validation sets (Figure 3a). These results suggest that DMRs can differentiate between APL subtypes.
To confirm that the signature differentiates between pre-cancerous lesions and of statistical significance, we performed a Kruskal-Wallis test for feature contributions of the first dimension between the three subtypes (Figure 3b). The analysis demonstrates significant differences between each histological APL (p=4.4e-05).
These results demonstrate that our signature can separate control samples from APLs and CRC and furthermore, consistently stratifies samples by APL subtype.
3.3. CNAs and Mutation Analysis Suggests Synergistic Mechanisms Complementary to Epigenetic Control in APLs
As CRC typically develops through a multistep process involving the accumulation of genetic and epigenetic alterations (44), we chose to support the DMR analysis with an analysis of Copy Number Alterations (CNA). The CNA signals were mostly present in TA or VA/TVA samples (Figure 3a). The most frequent signals could be seen in chromosomes 7, 12, 19 and 20, while the majority of CRC samples exhibited CNA in chromosomes 7, 8, and 20, suggesting that different processes exist between the emergence of APLs and progression to CRC. As in DMRs, chromosome 7 is also highly enriched with CNVs (Figure 4a, barplot).
Since APC and KRAS are the most frequently mutated driver genes in the adenoma-to-carcinoma sequence (6), they could be expected to demonstrate alterations more frequently, and MUC6 and MUC3A mutations were more frequent that KRAS mutations, principally in TA and VA/TVA (Figure 4b). However, SSL exhibits alterations in neither KRAS nor APC.
The integration of CNA and mutation analysis with differential methylation analysis provides a comprehensive view of the molecular landscape of APLs. Our analysis suggests that there is a clear distinction between driver events and passenger events in the different histological subtypes of APL: TA and VA/TVA present the strongest signal in copy number variation. Conversely, SSL presents the weakest signal in CNA, as well as no hits in KRAS or APC, suggesting a different driver event which may maintain the phenotype with epigenetic alterations. Early-stage colorectal cancer (CRC) exhibits a restructured mutation profile compared to advanced premalignant lesions (APLs), with notable alterations in MUC12 and FSIP2, observed in 43% and 39% of cases, respectively. Additionally, significant copy number aberrations (CNAs) were detected, particularly involving chromosomes 7 and 20. These findings suggest that both CNAs and mutations in specific genomic regions contribute to the differences observed among the different histological sub-types and CRC
3.4. Pathway Enrichment Analysis Reveal Redundancy in the Circuitry of Transcriptional Regulation Cellular Fate and Proliferation Signaling in APL Progression
To investigate the biology underlying the differential methylation signal identified, we performed a Gene Ontology (GOs) and pathway enrichment analysis based on DMRs obtained from the APLs that revealed distinctive subtype dysregulation in multiple biological pathways (Figure 5).
In the SSL vs. TA comparison (Figure 5a), we found several morphogenic and cell fate processes such as cell-cell adhesion, cell fate commitment and specification, and dorsal/ventral pattern formation. Moreover, when comparing SSL vs. VA/TVA (Figure 5b), we found slightly different processes but still related to cell fate, such as pattern specification process, regionalization cell fate commitment, gland development, plasma membrane adhesion molecules, anterior/posterior pattern specification and cell fate specification.
Finally, a TA vs. VA/TVA comparison (Figure 5c), showed enrichment in processes such as cell fate commitment, regulation of epithelial cell proliferation, miRNA transcription and regulation of stem cell proliferation, among other terms related to tissue reorganization.
These results suggested that genes affected by the DMRs in each subtype showed unique traits but also a redundancy at pathway level that support cellular proliferation, morphogenesis, and tissue reorganization. These molecular events suggest that cellular reorganization and the potential to re-organize tissue structures are critical to the development of APLs, which is consistent with the known clinical evolution of APLs and CRC.
Oncological pathway enrichment analysis using the somatic mutations found in APLs and early-stage CRC (Figure 5d) elucidate interconnected signaling pathways that help to alter the normal colonic structure and, in the case of CRC, contribute to an invasive phenotype. Crosstalk between dysregulated pathways, such as NOTCH, WNT, Hippo, and RTK-KRAS underscore the complexity of molecular events driving lesion progression. Interestingly, PI3K, MYC, TGF-Beta, cell cycle, and TP53 pathways are more affected in CRC than in the APLs. It is important to note that there are substantial differences among subtypes: SSL exhibits a lower a lower proportion of their pathway-associated genes altered; TA and VA/TVA show a higher enrichment in TGF-beta signaling but similar to normal tissue in other pathways; and VA/TVA is the only subtype that shows enrichment in the cell cycle pathway.
Collectively, these results provide a comprehensive molecular portrait of advanced precancerous lesions (APLs), highlighting the convergence of transcriptional misregulation and oncogenic signaling in their progression from normal tissue to APL and then to CRC.
3.5. DMR Phenotype in APLs Is Not CIMP and MSI Related
To address the question of whether the phenotype related to DMRs is related to CIMP status, we performed an analysis of specific methylation in promoter regions, classifying those regions with hypermethylation patterns as CIMP-H, while the samples without clear hypermethylation or hypomethylated were classified as CIMP-L (Supp. Figure 2a). Contrary to expectations, the DMR phenotype demonstrated independence from classical CpG island methylator phenotype. The absence of a strong correlation suggests the existence of alternative mechanisms driving differential methylation in advanced precancerous lesions.
To assess microsatellite instability status (MSI), we used the MSIMEP method (Supp. Figure 2b). Our results revealed no significant association with the identified DMR phenotype. The epigenetic alterations observed in APLs appear to be distinct from the genomic instability associated with MSI.
These results suggest that the phenotype of APLs is driven by molecular events unrelated to MSI or CIMP events.
4. Discussion
We present evidence of signatures related to aberrant methylated regions, chromosomal aberrations, and somatic mutations in advanced precancerous lesions.
The identification and analysis of methylated pattern differences between APL subtypes provides valuable insights into the epigenetic alterations that precede CRC. This study highlights significant DMRs across various subtypes of APLs, emphasizing their potential role in the progression from normal colonic mucosa to malignancy. Our analysis suggests that epigenetic changes are subtype-specific and may contribute to the heterogeneity observed in CRC.
The hypermethylation of genes involved in cell cycle regulation, DNA repair, and apoptosis observed in our study suggests that these pathways are crucially disrupted in the early stages of colorectal pre-neoplasia. For example, the methylation of the CDKN2A gene, a well-documented event in colorectal adenomas (45), was confirmed in our SSL vs. VA/TVA results, reinforcing its role in early tumorigenesis. Other genes as IRX4 are known to be silenced epigenetically and down expressed on pancreatic cancer (44) or AMER2 (also called FAM123A), known to be a negative regulator of WNT signaling and hypermethylated in precancerous stages in gastric carcinomas (46).
Our study identified distinct DMR signatures that enable the stratification of samples according to their APL subtype. Subsequent unsupervised clustering of these DMRs demonstrated a clear separation of samples into their respective subtypes, indicating the robustness of these methylation markers. Our findings were validated using an independent cohort. These DMR signatures not only facilitate the precise stratification of APL samples but also hold potential as biomarkers for early detection and personalized treatment strategies in clinical settings.
The analysis of CNVs revealed notable differences among the premalignant lesion subtypes. CNVs are known to contribute to genomic instability, a hallmark of cancer (47), and their presence in premalignant lesions underscores their role in early carcinogenesis (48).
SSLs present with lower gains compared to VAs/TVAs, focused on chromosomes 7, 12, 13 and 20, and the lowest losses compared with other APLs.
Here, it is important to highlight that chromosome 7 is enriched in CNVs for TA and VA/TVA as well as for DMRs (Figure 2b) as a possible transformation pathway has been reported before in CRC and adenomas (49). Interestingly, all the Mucin genes included in our mutation analysis are encoded on chromosome 7. This family of glycoproteins has been implicated in chronic inflammatory states and the promotion of oncogenesis in numerous malignancies, especially CRC (50).
These findings can inform the development of subtype-specific diagnostic and therapeutic strategies. Further research is needed to understand the functional impact of these CNVs and their potential as biomarkers for early detection.
Somatic mutations are pivotal for the initiation and progression of CRC and are known to be linked to epigenetic modifications (51). Our study identified several recurrent mutations across different premalignant lesion subtypes, providing insight into the molecular events that may drive their progression to invasive malignancy.
KRAS, TP53, and APC mutations were predominantly found in VA/TVA, while SSL showed mutations on APC and TP53. This aligns with known molecular pathways involved in the adenoma-to-carcinoma sequence in VAs/TVAs but represents a finding previously unreported in the serrated pathway.
SSLs exhibited a higher mutational burden compared to VA/TVA samples, suggesting a more heterogeneous clonal evolution. This could imply that SSLs have a higher potential for malignant transformation due to their diverse mutational landscape. Of note, our results showed that the SSL phenotype is not associated with CIMP or MSI. The independence of this epigenetic signature suggests alternative pathways driving methylation changes and emphasizes the importance of exploring distinct molecular mechanisms in the context of precancerous lesion progression.
The identification of these somatic mutations provides crucial insights into the molecular heterogeneity of premalignant lesions.
The analysis of biological pathways has uncovered notable redundancy in the transcriptional regulation circuitry that governs cellular fate and proliferation signaling in the APLs. This redundancy, manifested through multiple overlapping pathways, ensures robust control of critical cellular processes despite genetic and epigenetic alterations. Such redundancy may facilitate malignant transformation by providing alternative routes for sustaining proliferative and survival signals. These findings underscore the complexity of transcriptional networks in CRC progression and highlight potential challenges and opportunities for therapeutic interventions targeting these redundant pathways to effectively disrupt the progression from premalignant lesions to invasive carcinoma. Further, understanding these differences could aid in developing targeted prevention strategies and improve the precision of early detection methods.
5. Conclusions
Our integrated analysis of differentially methylated regions (DMRs), copy number variations (CNVs), and somatic mutations across various subtypes of advanced premalignant lesions of the colon provides a comprehensive understanding of the molecular alterations involved in early colorectal carcinogenesis. These results emphasize the potential of these molecular markers as valuable biomarkers for early detection and as targets for preventive strategies.
We are aware that our study has several limitations that should be addressed in future research. First, the validation of these biomarkers requires larger, independent cohorts, ideally analyzed in a double-blinded manner to reduce potential bias. Second, functional analyses are needed to investigate the biological interplay between methylation changes and chromosomal aberrations, which may help clarify their roles in the progression of colorectal cancer.
Supplementary Materials
The following supporting information can be downloaded at the website of this paper posted on Preprints.org. Supplementary Fig 1: a) Heatmap of methylation profiles in all the groups. Supplementary Fig 2: a) Heatmap of CIMP status. b) Heatmap of MSI status. Supplementary Table 1: Samples description.
Author Contributions
Conceptualization, F.M.M.; A.B.; methodology, F.F.M.; software, F.M.M.; validation, F.M.M.; formal analysis F.M.M.; resources, P.C.-N. and K.K.; data curation, F.M.M.; writing—original draft preparation, J.C.H-A; writing—review and editing, J.C.H-A., F.M.M., P.C.-N., A.P.-L.; M.R.; and K.K.; visualization, F.M.M.; supervision, P.C.-N., K.K.; M.R.; and A.P.-L.; project administration, P.C.-N. and K.K.; funding acquisition, P.C.-N. and K.K. All authors have read and agreed to the published version of the manuscript.
Funding
This work was supported by the Grant PID2021-122952OB-I00 funded by AEI 10.13039/501100011033 and by ERDF A way of making Europe; the Networking Biomedical Research Centre in the subject area of Bioengineering, Biomaterials and Nanomedicine (CIBER-BBN), and the CERCA Programme / Generalitat de Catalunya. B2SLab is certified as 2021 SGR 01052; and private funding by UniversalDx S.A.
Institutional Review Board Statement
N/A.
Informed Consent Statement
N/A.
Data Availability Statement
The data presented in this study are available on a reasonable request from the corresponding author.
Acknowledgments
We would like to express our sincere gratitude to Dr. Kathryn Lang for her valuable assistance with reviewing and refining the manuscript and for providing insightful feedback that significantly enhanced the quality of this work.
Conflicts of Interest
F.M.M., J.C.H-A and P.C-N are employees of Universal Diagnostics S.A., K.K. and A.B. are employees of UniversalDx d.o.o. The remaining authors declare that the research was conducted in the absence of any commercial or financial relationships that could be construed as a potential conflict of interest. The funders had no role in the design of the study; in the collection, analyses, or interpretation of data; in the writing of the manuscript; or in the decision to publish the results.
References
- Siegel RL, Miller KD, Wagle NS, Jemal A. Cancer statistics, 2023. CA Cancer J Clin. 2023 Jan 12;73(1):17–48.
- Bray F, Laversanne M, Sung H, Ferlay J, Siegel RL, Soerjomataram I, et al. Global cancer statistics 2022: GLOBOCAN estimates of incidence and mortality worldwide for 36 cancers in 185 countries. CA Cancer J Clin. 2024 May 4;74(3):229–63.
- Fornasarig M, Magris R, De Re V, Bidoli E, Canzonieri V, Maiero S, et al. Molecular and Pathological Features of Gastric Cancer in Lynch Syndrome and Familial Adenomatous Polyposis. Int J Mol Sci. 2018 Jun 6;19(6):1682. [CrossRef]
- Sawicki T, Ruszkowska M, Danielewicz A, Niedźwiedzka E, Arłukowicz T, Przybyłowicz KE. A Review of Colorectal Cancer in Terms of Epidemiology, Risk Factors, Development, Symptoms and Diagnosis. Cancers (Basel). 2021 Apr 22;13(9):2025. [CrossRef]
- Sinicrope FA. Increasing Incidence of Early-Onset Colorectal Cancer. New England Journal of Medicine. 2022 Apr 21;386(16):1547–58. [CrossRef]
- Cho KR, Vogelstein B. Genetic alterations in the adenoma--carcinoma sequence. Cancer. 1992 Sep 15;70(6 Suppl):1727–31.
- Tan C, Du X. KRAS mutation testing in metastatic colorectal cancer. World J Gastroenterol. 2012 Oct 7;18(37):5171–80.
- Song Y, Huang J, Wang K, Li Y. To Identify Adenomatous Polyposis Coli Gene Mutation as a Predictive Marker of Endometrial Cancer Immunotherapy. Front Cell Dev Biol. 2022 Jul 22;10. [CrossRef]
- Leslie A, Carey FA, Pratt NR, Steele RJC. The colorectal adenoma-carcinoma sequence. Br J Surg. 2002 Jul;89(7):845–60. [CrossRef]
- Ternet C, Kiel C. Signaling pathways in intestinal homeostasis and colorectal cancer: KRAS at centre stage. Cell Commun Signal. 2021 Mar 10;19(1):31. [CrossRef]
- Naini B V, Odze RD. Advanced precancerous lesions (APL) in the colonic mucosa. Best Pract Res Clin Gastroenterol. 2013 Apr;27(2):235–56.
- Rupa JD, de Bruïne AP, Gerbers AJ, Leers MPG, Nap M, Kessels AGH, et al. Simultaneous detection of apoptosis and proliferation in colorectal carcinoma by multiparameter flow cytometry allows separation of high and low-turnover tumors with distinct clinical outcome. Cancer. 2003 May 15;97(10):2404–11. [CrossRef]
- Schimek V, Strasser K, Beer A, Göber S, Walterskirchen N, Brostjan C, et al. Tumour cell apoptosis modulates the colorectal cancer immune microenvironment via interleukin-8-dependent neutrophil recruitment. Cell Death Dis. 2022 Feb 4;13(2):113. [CrossRef]
- Taherian M, Lotfollahzadeh S, Daneshpajouhnejad P, Arora K. Tubular Adenoma. 2024.
- Dornblaser D, Young S, Shaukat A. Colon polyps: updates in classification and management. Curr Opin Gastroenterol. 2024 Jan;40(1):14–20. [CrossRef]
- Tornillo L, Lehmann FS, Garofoli A, Paradiso V, Ng CKY, Piscuoglio S. The Genomic Landscape of Serrated Lesion of the Colorectum: Similarities and Differences With Tubular and Tubulovillous Adenomas. Front Oncol. 2021 Oct 12;11. [CrossRef]
- Boregowda U, Umapathy C, Echavarria J, Saligram S. Risk of Metachronous Neoplasia with High-Risk Adenoma and Synchronous Sessile Serrated Adenoma: A Systematic Review and Meta-Analysis. Diagnostics. 2023 Apr 27;13(9):1569. [CrossRef]
- Kambara T, Simms LA, Whitehall VLJ, Spring KJ, Wynter CVA, Walsh MD, et al. BRAF mutation is associated with DNA methylation in serrated polyps and cancers of the colorectum. Gut. 2004 Aug;53(8):1137–44. [CrossRef]
- Nazemalhosseini Mojarad E, Kuppen PJ, Aghdaei HA, Zali MR. The CpG island methylator phenotype (CIMP) in colorectal cancer. Gastroenterol Hepatol Bed Bench. 2013;6(3):120–8.
- Boland CR, Goel A. Microsatellite Instability in Colorectal Cancer. Gastroenterology. 2010 May;138(6):2073-2087.e3.
- Tamura K, Kaneda M, Futagawa M, Takeshita M, Kim S, Nakama M, et al. Genetic and genomic basis of the mismatch repair system involved in Lynch syndrome. Int J Clin Oncol. 2019 Sep;24(9):999–1011.
- Kakar S, Deng G, Cun L, Sahai V, Kim YS. CpG island methylation is frequently present in tubulovillous and villous adenomas and correlates with size, site, and villous component. Hum Pathol. 2008 Jan;39(1):30–6. [CrossRef]
- Hong SN. Genetic and epigenetic alterations of colorectal cancer. Intest Res. 2018;16(3):327. [CrossRef]
- Molinari C, Marisi G, Passardi A, Matteucci L, De Maio G, Ulivi P. Heterogeneity in Colorectal Cancer: A Challenge for Personalized Medicine? Int J Mol Sci. 2018 Nov 23;19(12).
- Estécio MRH, Issa JPJ. Dissecting DNA hypermethylation in cancer. FEBS Lett. 2011 Jul 7;585(13):2078–86. [CrossRef]
- Baylin SB, Jones PA. A decade of exploring the cancer epigenome — biological and translational implications. Nat Rev Cancer. 2011 Oct 23;11(10):726–34. [CrossRef]
- Andrews S. FastQC: A Quality Control Tool for High Throughput Sequence Data. Babraham, UK: Babraham Institute; 2023.
- Martin M. Cutadapt removes adapter sequences from high-throughput sequencing reads. EMBnet J. 2011 May 2;17(1):10. [CrossRef]
- Krueger F, Andrews SR. Bismark: a flexible aligner and methylation caller for Bisulfite-Seq applications. Bioinformatics. 2011 Jun 1;27(11):1571–2. [CrossRef]
- Langmead B, Trapnell C, Pop M, Salzberg SL. Ultrafast and memory-efficient alignment of short DNA sequences to the human genome. Genome Biol. 2009;10(3):R25. [CrossRef]
- Du J, Yuan Z, Ma Z, Song J, Xie X, Chen Y. KEGG-PATH: Kyoto encyclopedia of genes and genomes-based pathway analysis using a path analysis model. Mol Biosyst. 2014 Jul 29;10(9):2441–7. [CrossRef]
- Gu Z, Hübschmann D. rGREAT : an R/bioconductor package for functional enrichment on genomic regions. Bioinformatics. 2023 Jan 1;39(1).
- Xu S, Hu E, Cai Y, Xie Z, Luo X, Zhan L, et al. Using clusterProfiler to characterize multiomics data. Nat Protoc. 2024 Nov 17;19(11):3292–320. [CrossRef]
- Yu G. Gene Ontology Semantic Similarity Analysis Using GOSemSim. In: Stem Cell Transcriptional Networks. 2020. p. 207–15.
- Adalsteinsson VA, Ha G, Freeman SS, Choudhury AD, Stover DG, Parsons HA, et al. Scalable whole-exome sequencing of cell-free DNA reveals high concordance with metastatic tumors. Nat Commun. 2017 Nov 6;8(1):1324. [CrossRef]
- Lai D, Shah S. HMMcopy: Copy number prediction with correction for GC and mappability bias for HTS data. 2024.
- Nunn A, Can SN, Otto C, Fasold M, Díez Rodríguez B, Fernández-Pozo N, et al. EpiDiverse Toolkit: a pipeline suite for the analysis of bisulfite sequencing data in ecological plant epigenetics. NAR Genom Bioinform. 2021 Oct 4;3(4). [CrossRef]
- Koboldt DC, Chen K, Wylie T, Larson DE, McLellan MD, Mardis ER, et al. VarScan: variant detection in massively parallel sequencing of individual and pooled samples. Bioinformatics. 2009 Sep 1;25(17):2283–5. [CrossRef]
- Koboldt DC, Zhang Q, Larson DE, Shen D, McLellan MD, Lin L, et al. VarScan 2: somatic mutation and copy number alteration discovery in cancer by exome sequencing. Genome Res. 2012 Mar;22(3):568–76. [CrossRef]
- Cingolani P, Platts A, Wang LL, Coon M, Nguyen T, Wang L, et al. A program for annotating and predicting the effects of single nucleotide polymorphisms, SnpEff. Fly (Austin). 2012 Apr 27;6(2):80–92. [CrossRef]
- Mayakonda A, Lin DC, Assenov Y, Plass C, Koeffler HP. Maftools: efficient and comprehensive analysis of somatic variants in cancer. Genome Res. 2018 Nov;28(11):1747–56. [CrossRef]
- Wilkerson MD, Hayes DN. ConsensusClusterPlus: a class discovery tool with confidence assessments and item tracking. Bioinformatics. 2010 Jun 15;26(12):1572–3. [CrossRef]
- Santamarina-García M, Brea-Iglesias J, Bramsen JB, Fuentes-Losada M, Caneiro-Gómez FJ, Vázquez-Bueno JÁ, et al. MSIMEP: Predicting microsatellite instability from microarray DNA methylation tumor profiles. iScience. 2023 Mar 17;26(3):106127. [CrossRef]
- Yamanoi K, Arai E, Tian Y, Takahashi Y, Miyata S, Sasaki H, et al. Epigenetic clustering of gastric carcinomas based on DNA methylation profiles at the precancerous stage: its correlation with tumor aggressiveness and patient outcome. Carcinogenesis. 2015 May;36(5):509–20. [CrossRef]
- Vincent A, Omura N, Hong SM, Jaffe A, Eshleman J, Goggins M. Genome-Wide Analysis of Promoter Methylation Associated with Gene Expression Profile in Pancreatic Adenocarcinoma. Clinical Cancer Research. 2011 Jul 1;17(13):4341–54.
- Negrini S, Gorgoulis VG, Halazonetis TD. Genomic instability — an evolving hallmark of cancer. Nat Rev Mol Cell Biol. 2010 Mar;11(3):220–8. [CrossRef]
- Druliner BR, Wang P, Bae T, Baheti S, Slettedahl S, Mahoney D, et al. Molecular characterization of colorectal adenomas with and without malignancy reveals distinguishing genome, transcriptome and methylome alterations. Sci Rep. 2018 Feb 16;8(1):3161. [CrossRef]
- Bomme L, Bardi G, Pandis N, Fenger C, Kronborg O, Heim S. Clonal karyotypic abnormalities in colorectal adenomas: Clues to the early genetic events in the adenoma-carcinoma sequence. Genes Chromosomes Cancer. 1994 Jul 14;10(3):190–6.
- Bollen Y, Stelloo E, van Leenen P, van den Bos M, Ponsioen B, Lu B, et al. Reconstructing single-cell karyotype alterations in colorectal cancer identifies punctuated and gradual diversification patterns. Nat Genet. 2021 Aug;53(8):1187–95. [CrossRef]
- Cox KE, Liu S, Lwin TM, Hoffman RM, Batra SK, Bouvet M. The Mucin Family of Proteins: Candidates as Potential Biomarkers for Colon Cancer. Cancers (Basel). 2023 Feb 27;15(5). [CrossRef]
- Lei H, Tao K. Somatic mutations in colorectal cancer are associated with the epigenetic modifications. J Cell Mol Med. 2020 Oct;24(20):11828–36. [CrossRef]
Figure 1.
Research pipeline. Graphical representation of the pipeline followed in the present work.
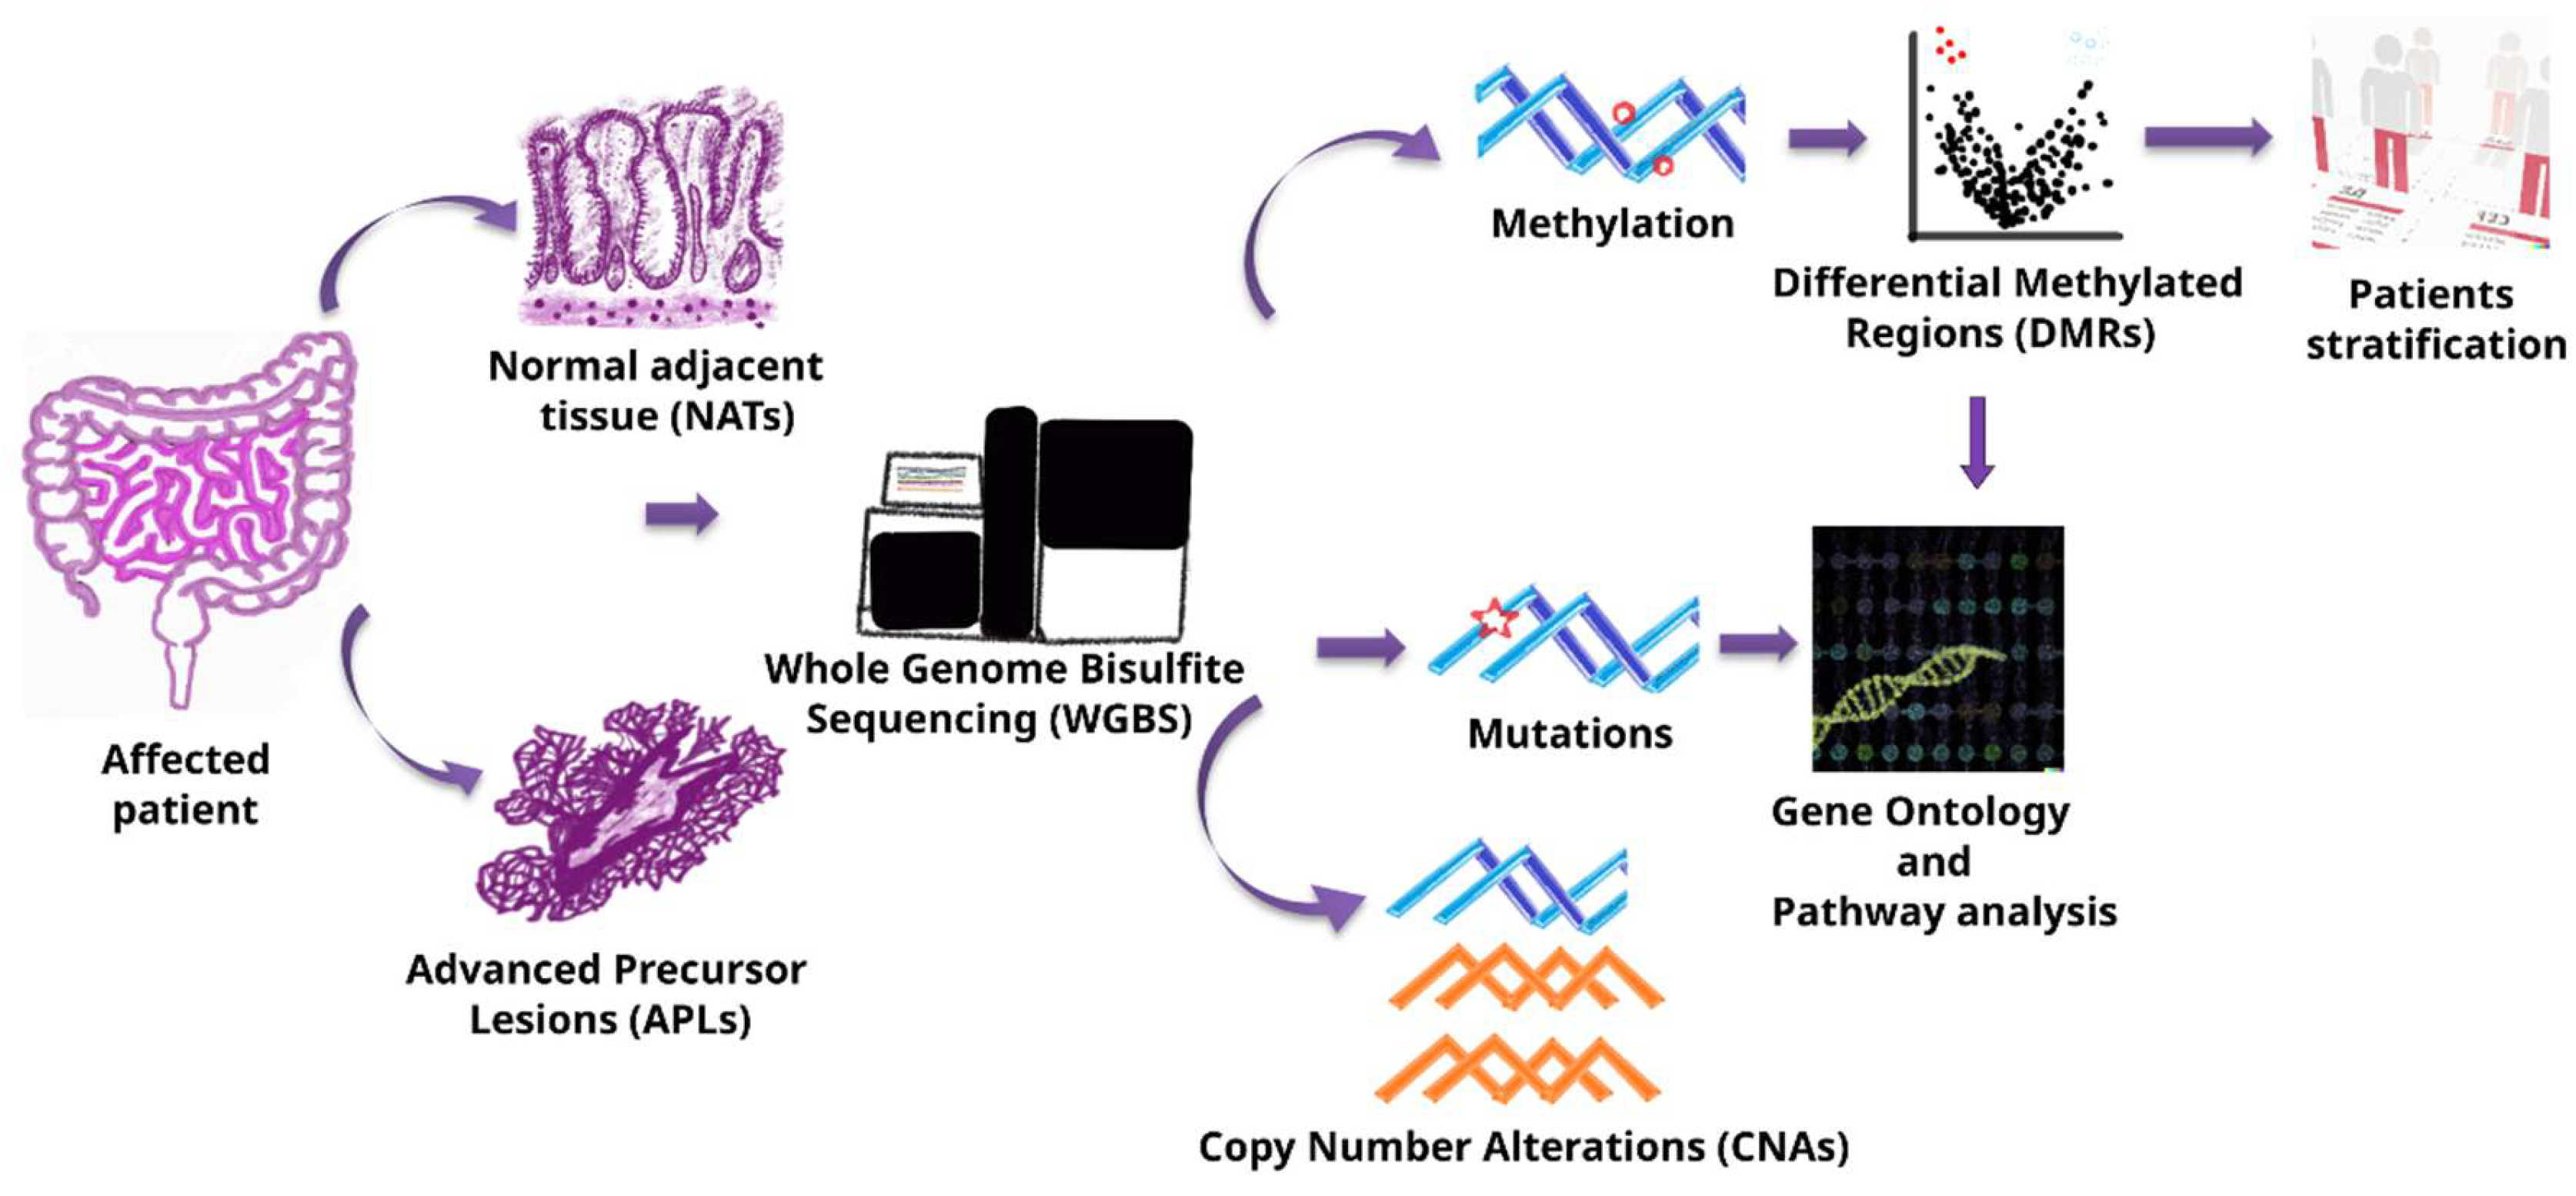
Figure 2.
a) DMR selection. UpSet plot visualizes the intersection among the different sets of significant hypermethylated regions. To enrich the histological subtype signals, only those regions that do not overlap with APL vs NAT results are considered (red circles). All identified regions and their possible intersections are represented by a black dot. b) Genomic Circular Visualization of regions distribution along the genome. The density layer of the plot emphasizes an enrichment of DMRs on chromosome 7. The outermost layers reveal the top 30 genes that significantly contribute to the PCA shown in Figure 3a.
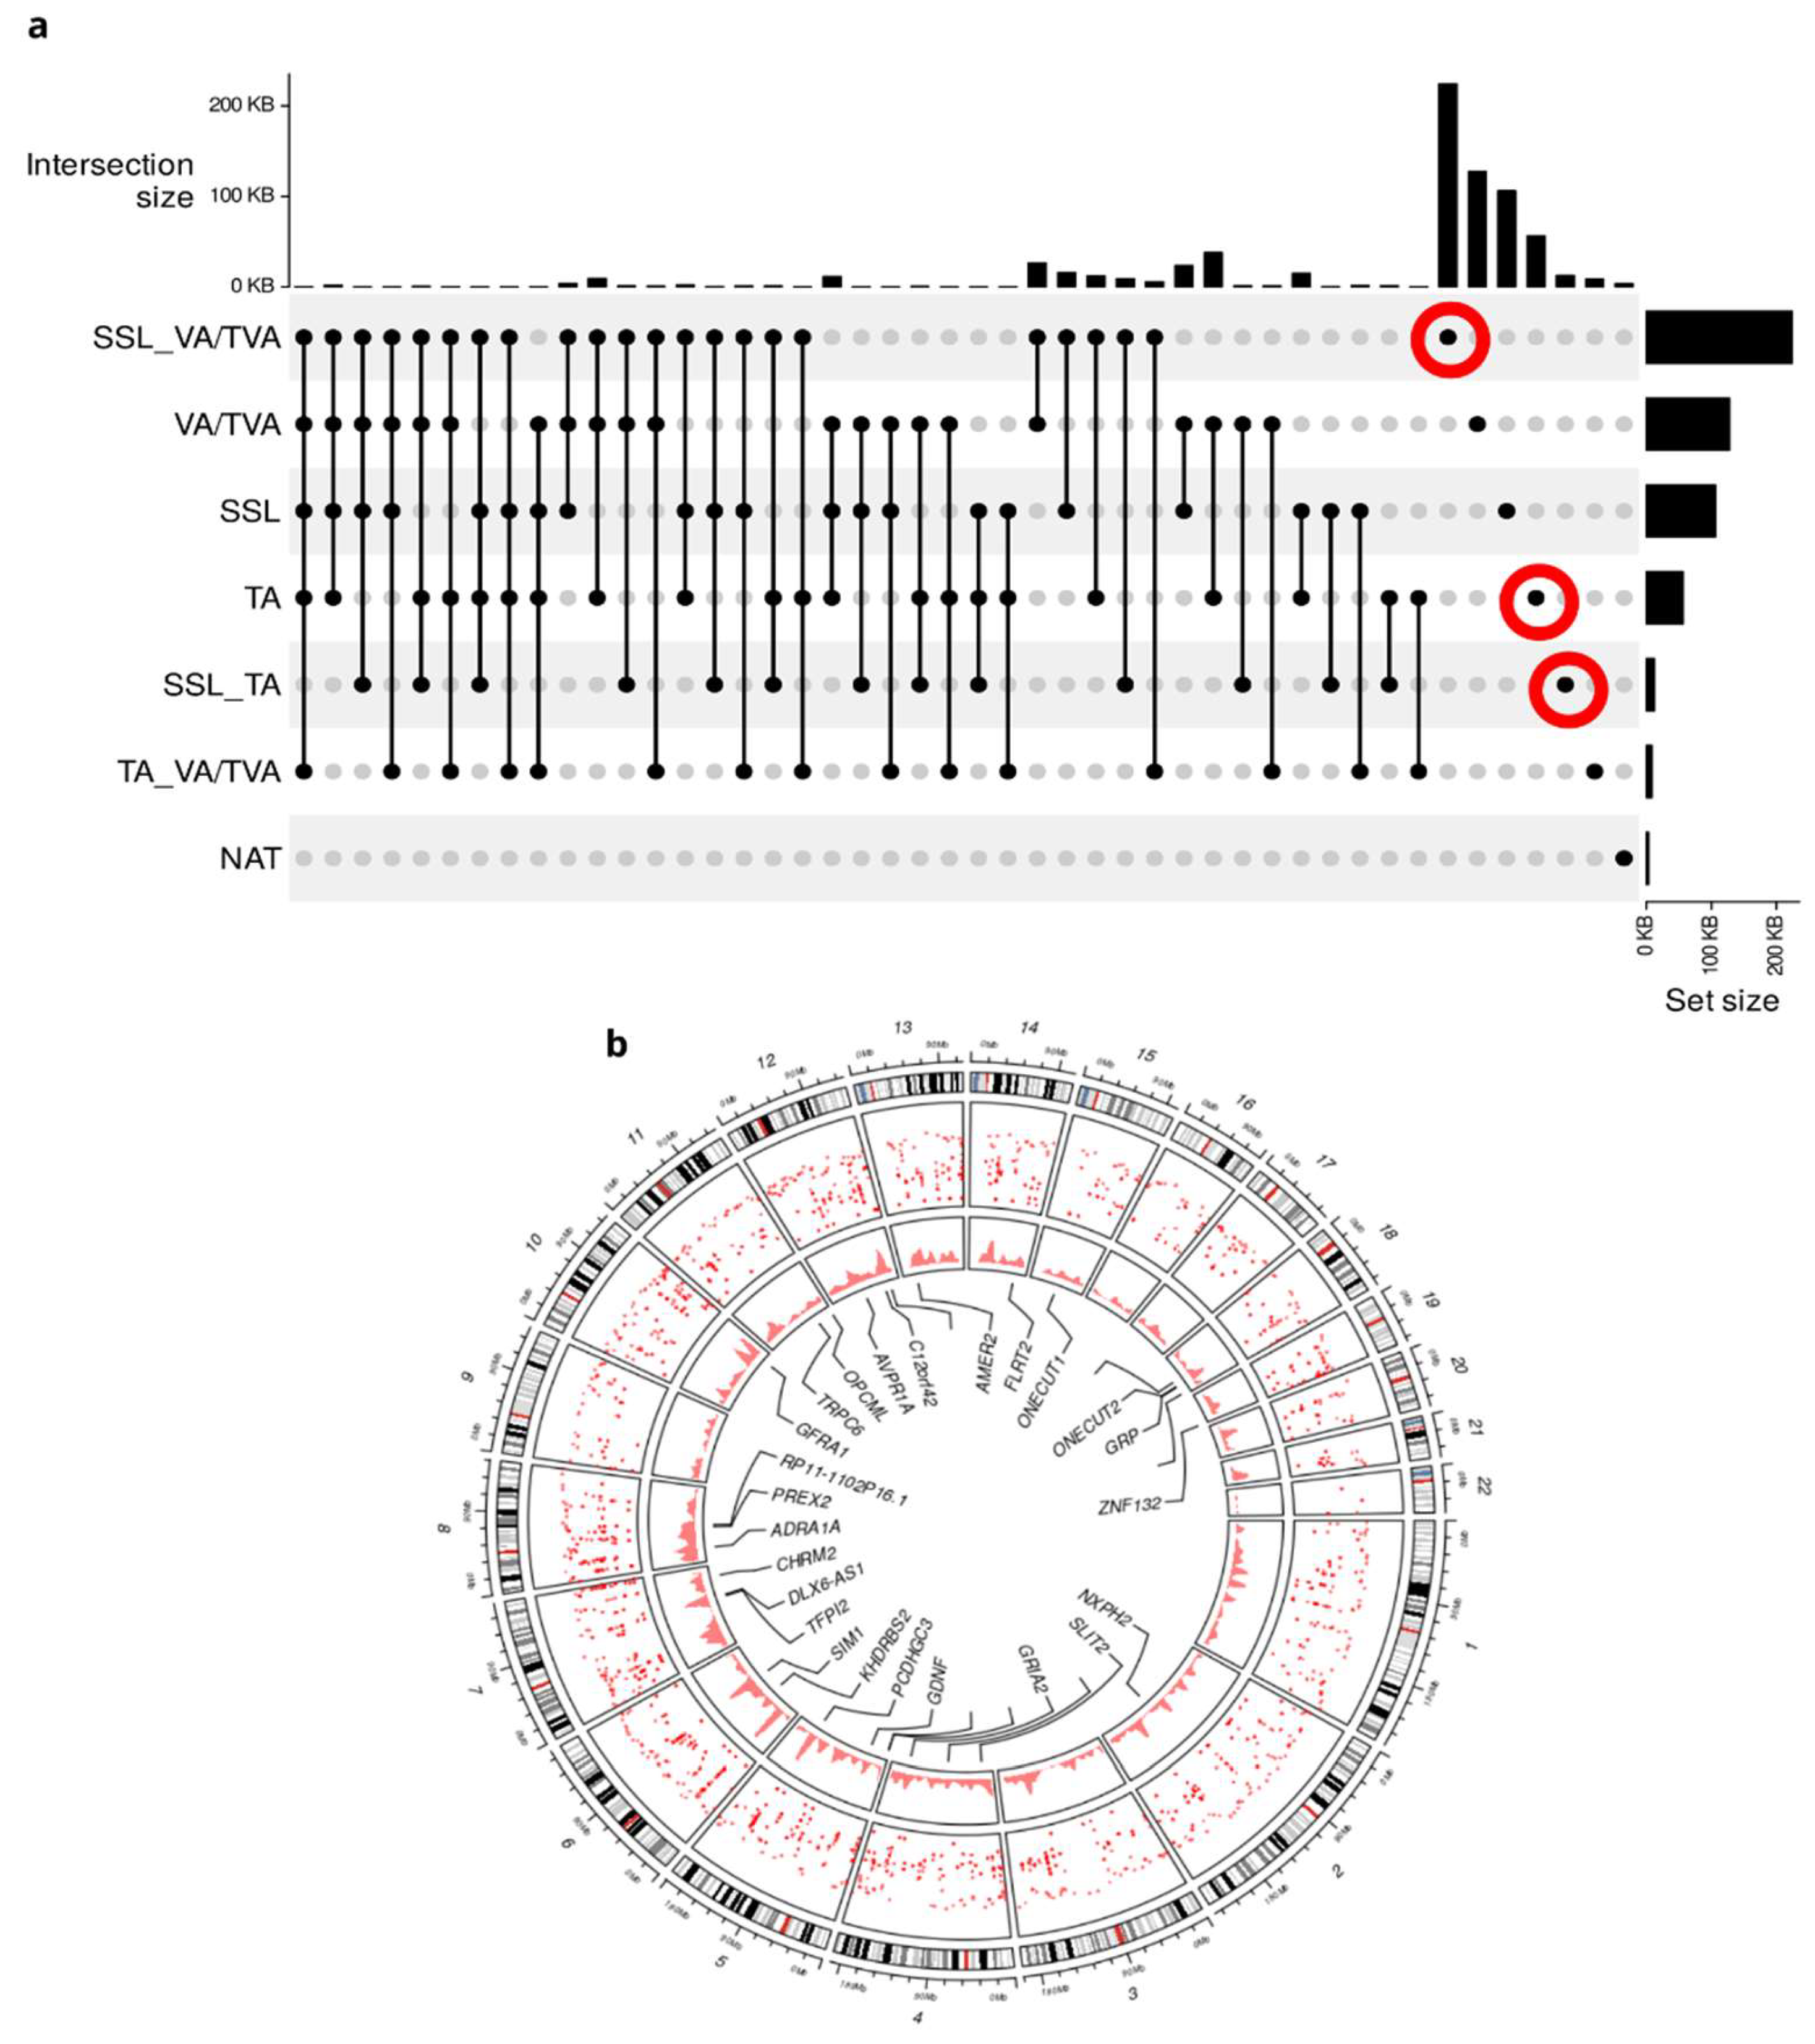
Figure 3.
a) PCA analysis of methylation data. PCA analysis depicting three largest components of variance in beta values in SSL (n=14), TA (n=26) and VA/TVA (n=34). b) Boxplot and Kruskal-Wallis test stating the differences of contributions on PCA’s first dimension between the APL sub-types.
Figure 3.
a) PCA analysis of methylation data. PCA analysis depicting three largest components of variance in beta values in SSL (n=14), TA (n=26) and VA/TVA (n=34). b) Boxplot and Kruskal-Wallis test stating the differences of contributions on PCA’s first dimension between the APL sub-types.
Figure 4.
a) CNA analysis. Heatmap representing the number of CNA events divided per chromosome for each APL sub-type and CRC stage I. Bar-plot on the right indicates the DMR regions enrichment per chromosome. Chr7 has a significant correlation between CNA events and hypermethylated regions. b) Mafplots of frequent mutations in APLs and CRC.
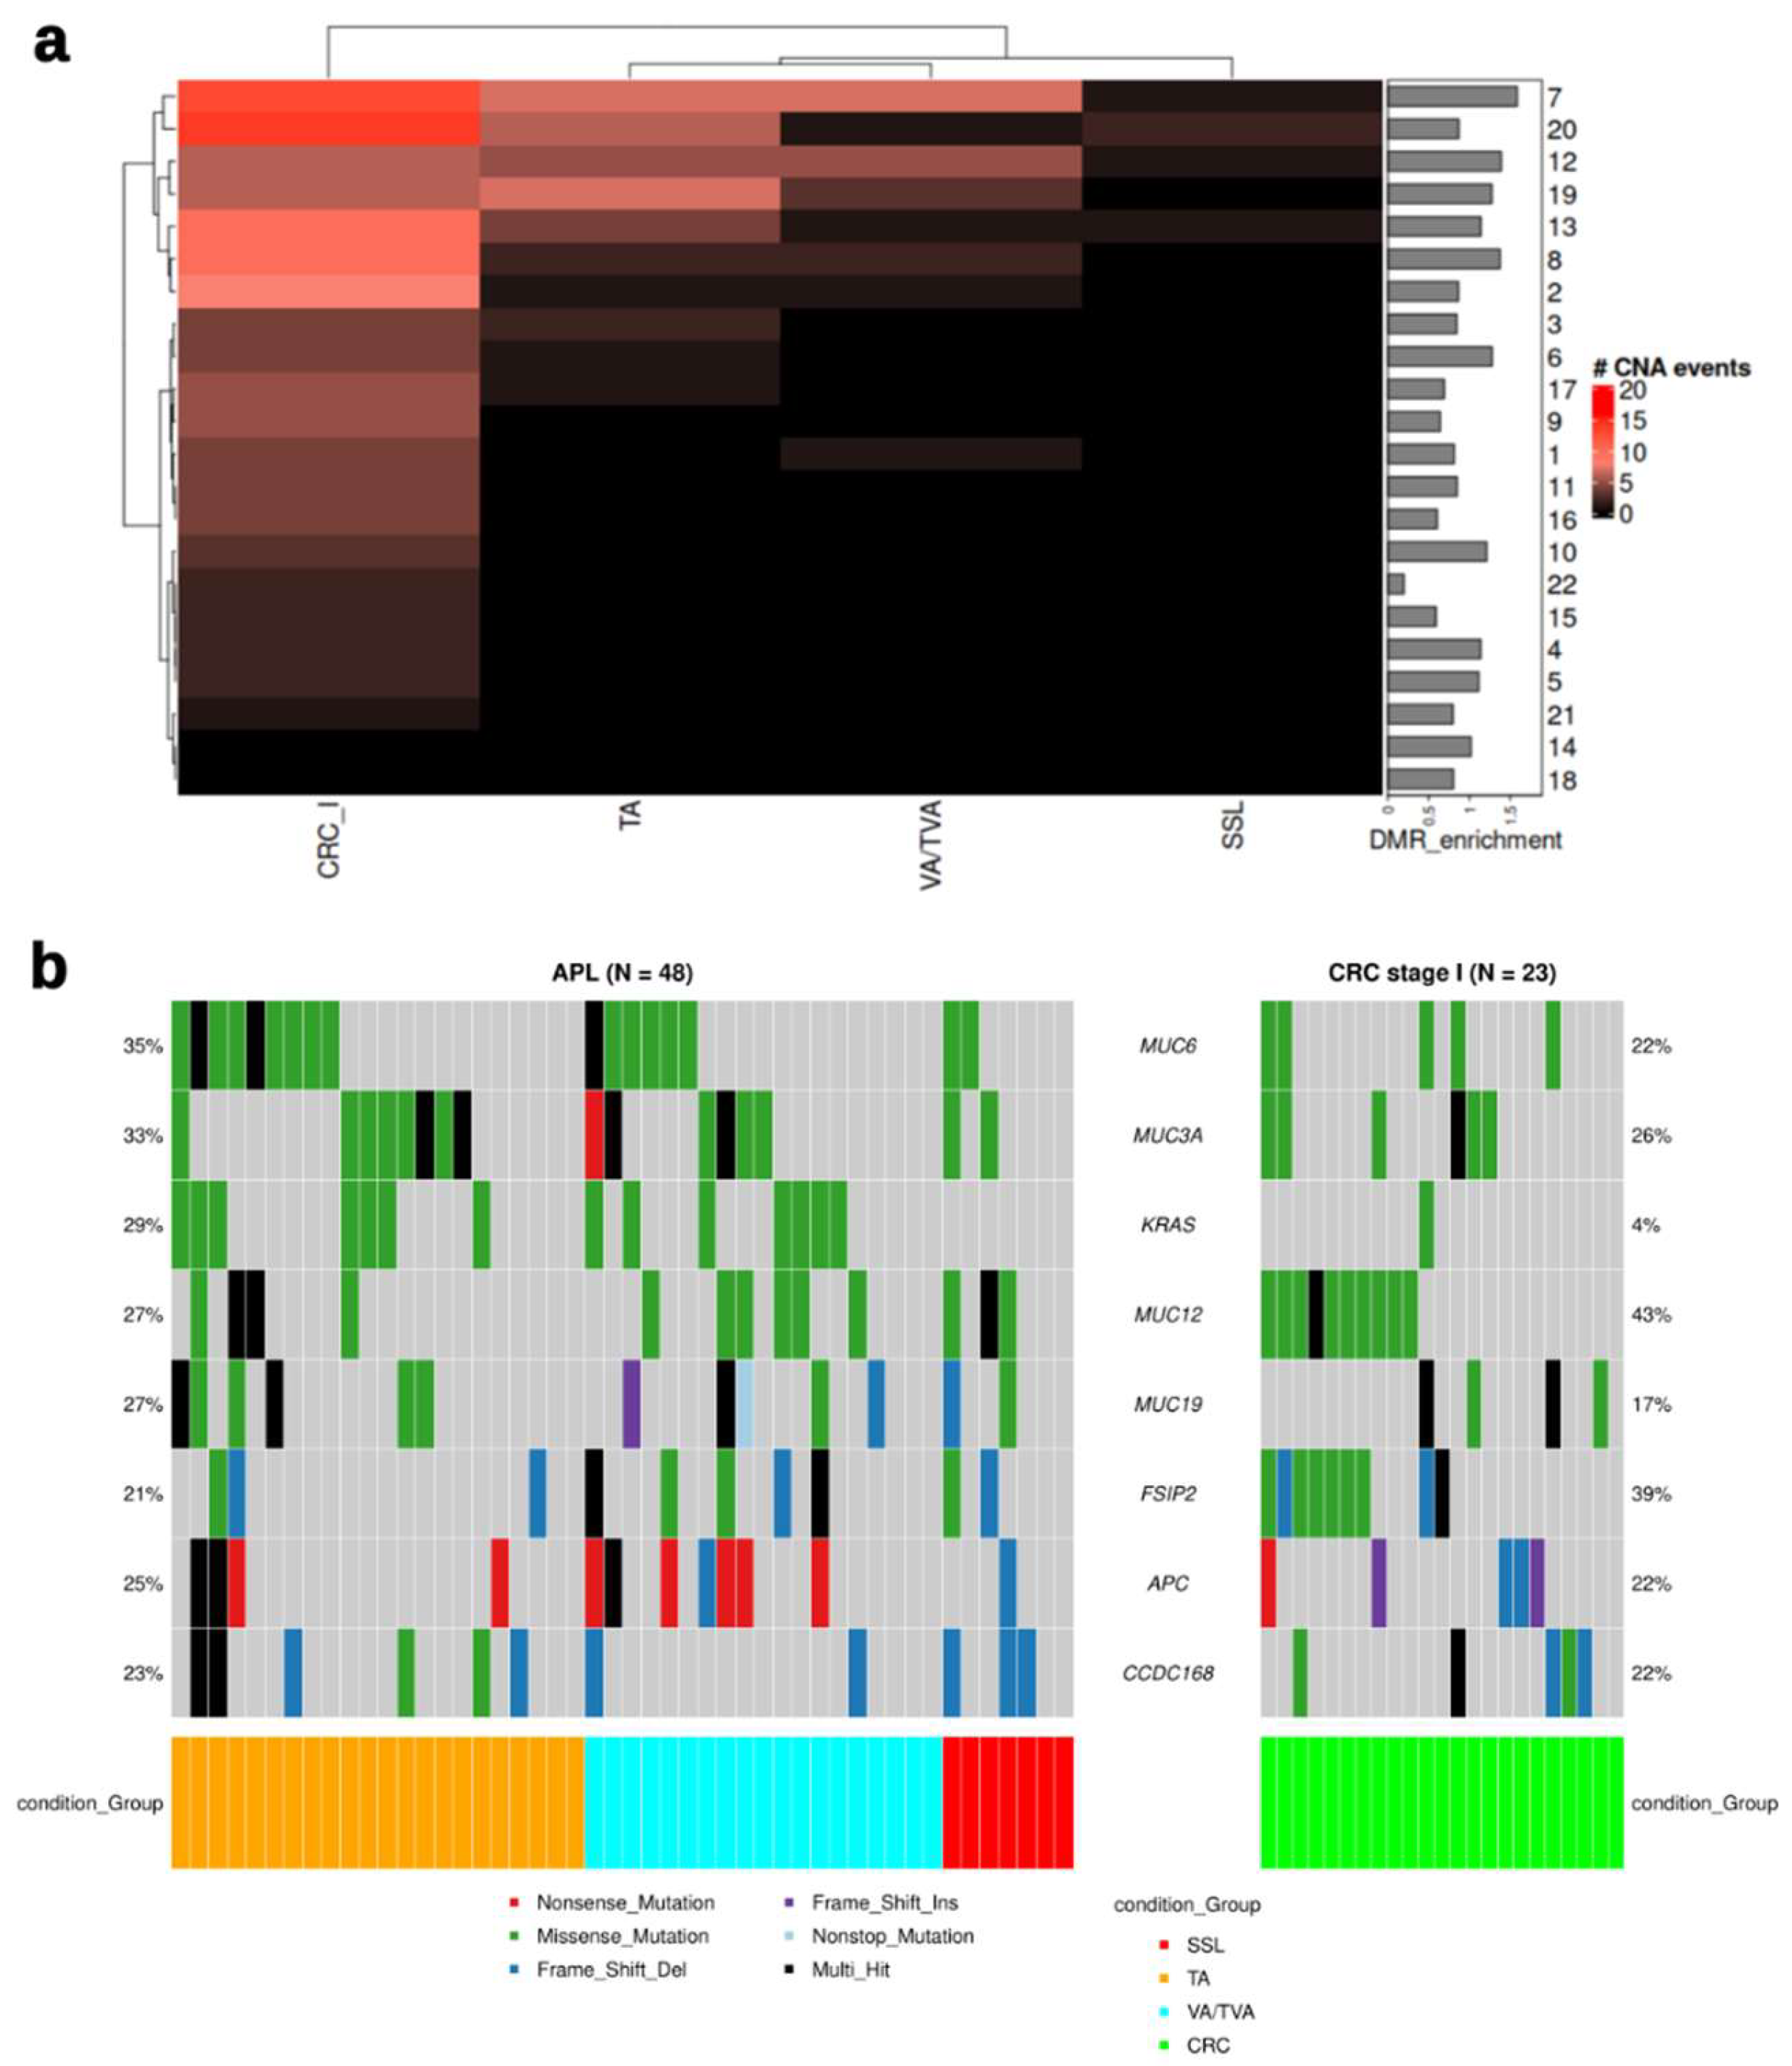
Figure 5.
a) Gene Ontology enrichment analysis from the identified DMRs. Dot plot showing the GO terms for the identified differentially methylated genes. Dots are color-coded from blue to red based on the adjusted p-value. The size of the dots is proportional to the gene count. b) Oncological pathway enrichment. Enrichment of mutated genes in known oncogenic pathways indicates differences among subtypes but also between APL and CRC stage I.
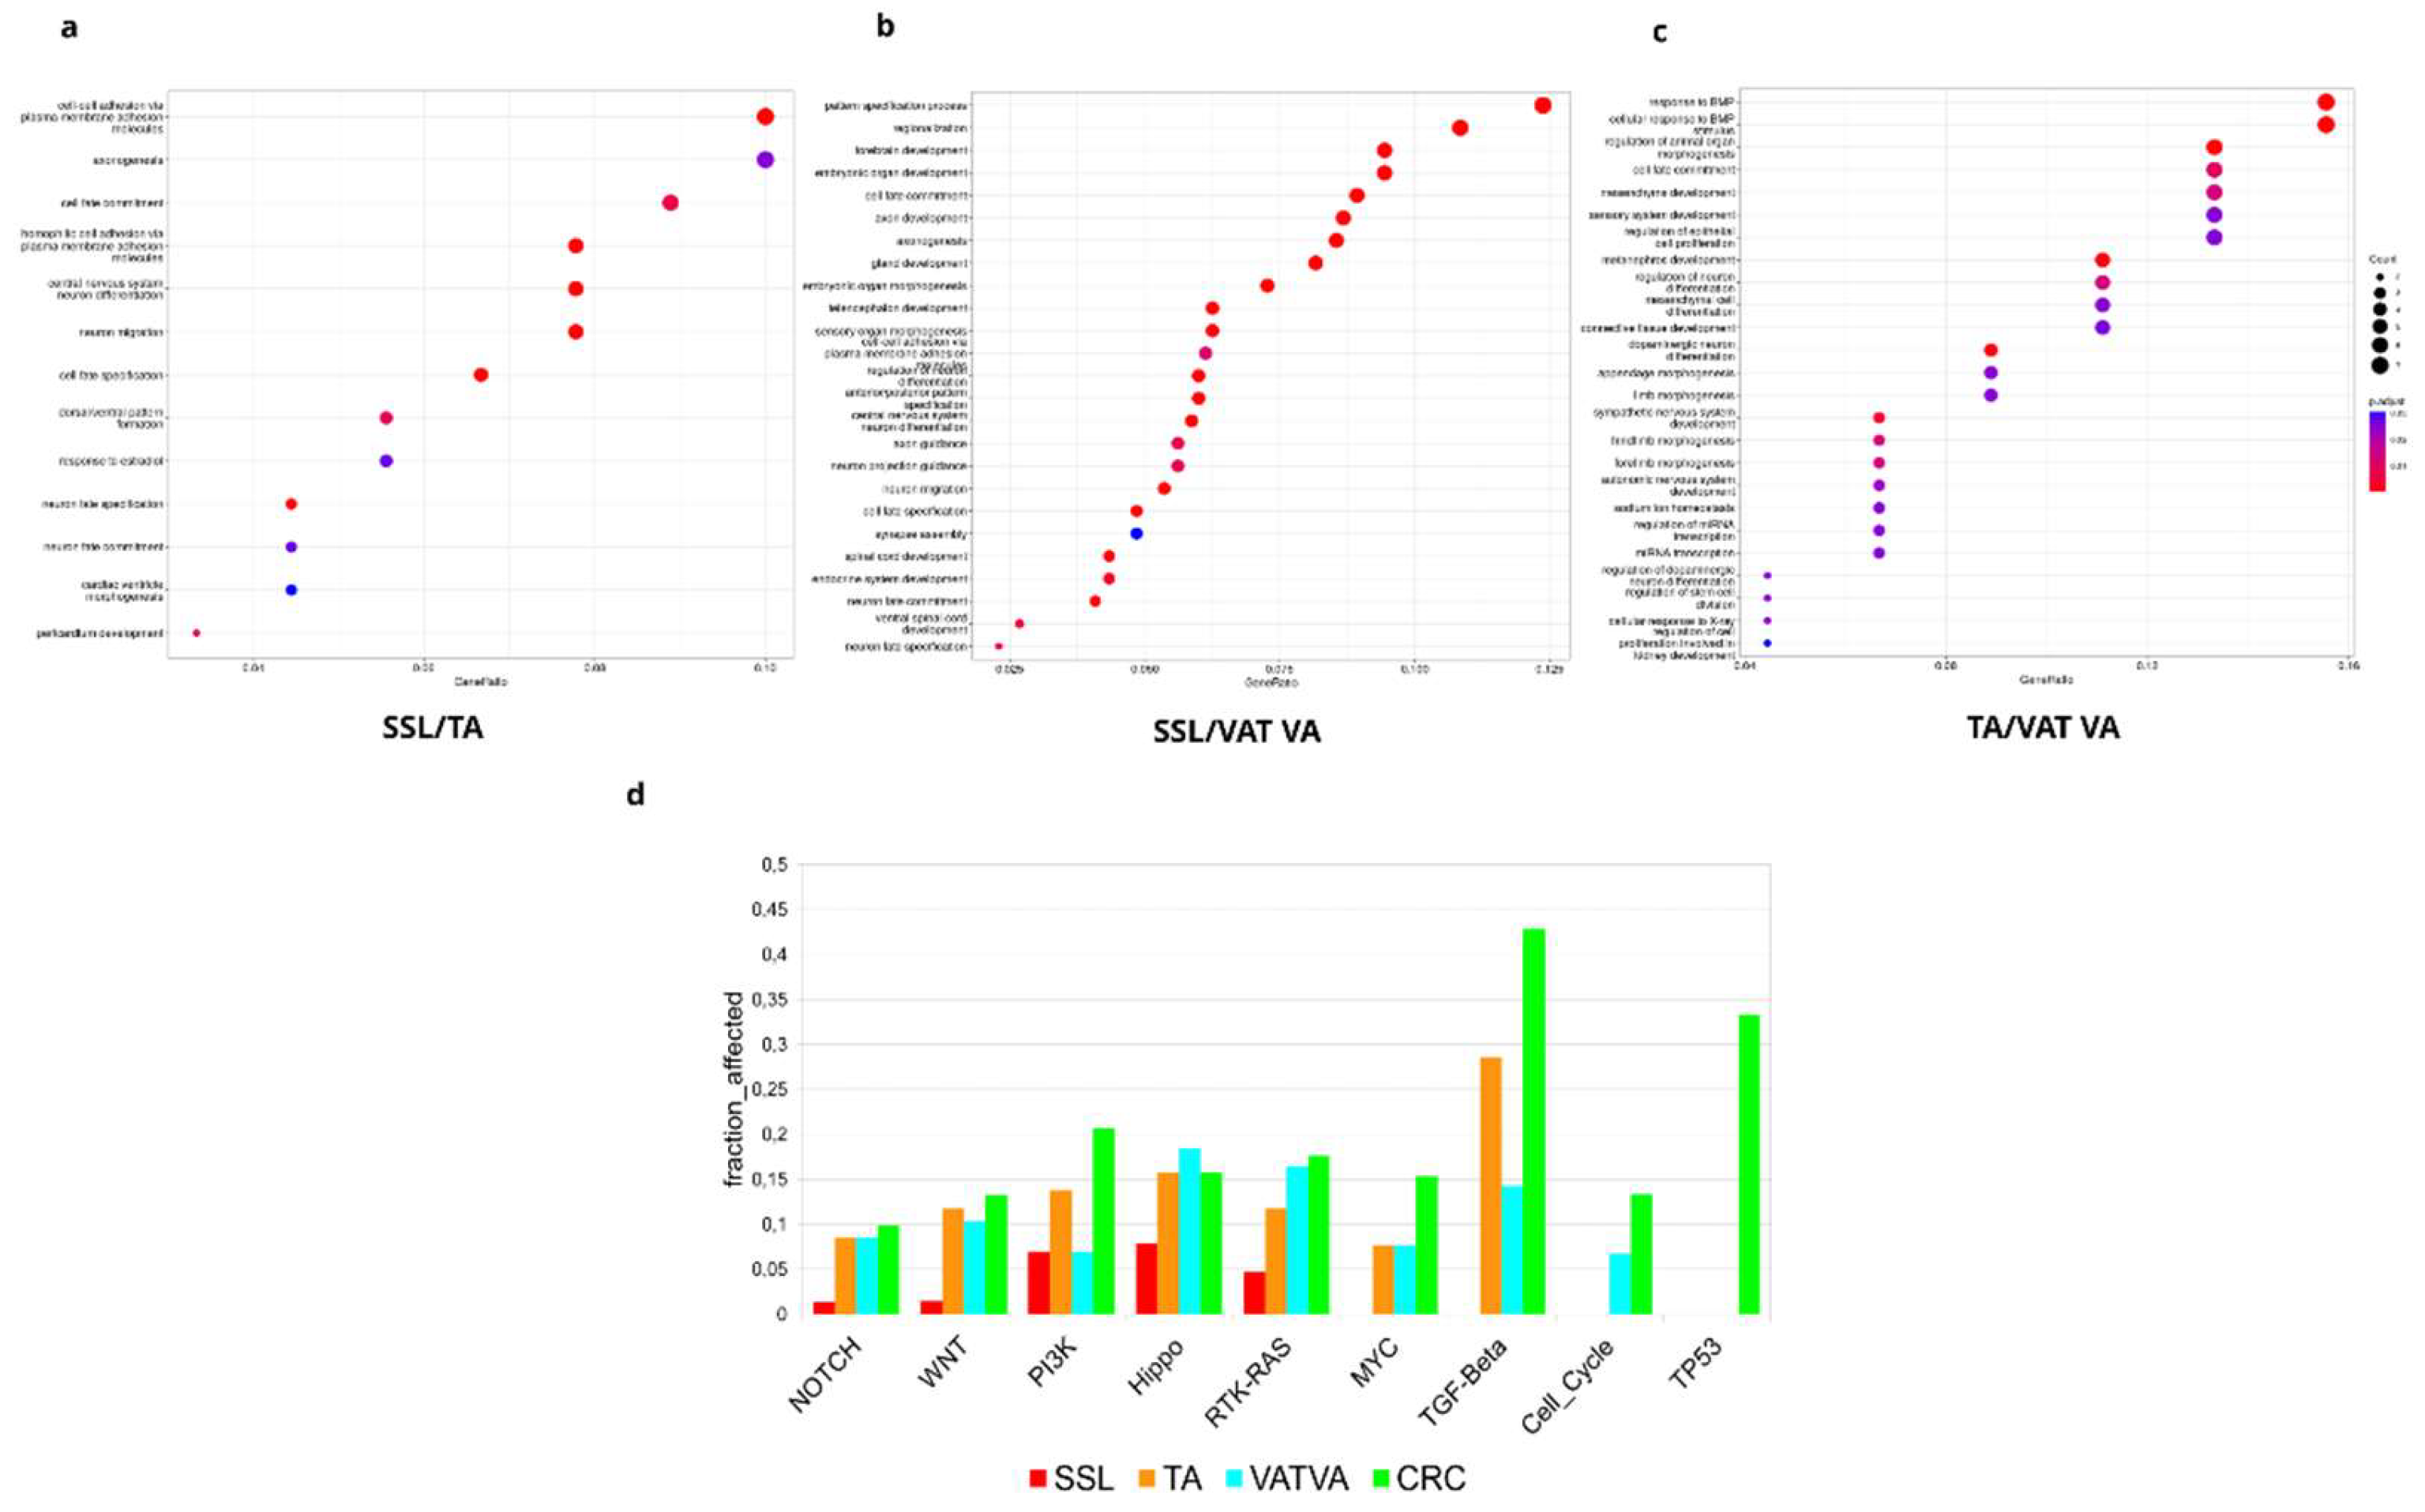

Table 1.
Relevant characteristics of patients in this study.
| APL | APL (validation) | CRC stage I | |
|---|---|---|---|
| n | 48 | 26 | 23 |
|
Age median (IQR), years (range) |
68.5 (14.75) (39-86) |
68.5 (19.75) (23-84) |
68 (13) (37-81) |
| Gender Female/Male, n | 17/31 | 16/10 | 14/9 |
|
Histology SSL, n TA, n VA/TVA, n |
7 22 19 |
7 4 15 |
Table 2.
Summary of DMRs in all analyses.
| Comparison | DMRs | Hyper DMRs | Hypo DMRs |
|---|---|---|---|
| SSL vs SSL NAT | 6317 | 1271 | 5046 |
| TA vs TA NAT | 36297 | 861 | 35436 |
| VA/TVA vs VA/TVA NAT | 65794 | 1807 | 63987 |
| SSL vs TA | 1299 | 137 | 1162 |
| SSL vs VA/TVA | 11955 | 2096 | 9859 |
| TA vs VA/TVA | 651 | 91 | 560 |
| SSL NAT vs TA NAT | 4 | ||
| SSL NAT vs VA/TVA NAT | 30 | ||
| TA NAT vs VA/TVA NAT | 1 |
Disclaimer/Publisher’s Note: The statements, opinions and data contained in all publications are solely those of the individual author(s) and contributor(s) and not of MDPI and/or the editor(s). MDPI and/or the editor(s) disclaim responsibility for any injury to people or property resulting from any ideas, methods, instructions or products referred to in the content. |
© 2024 by the authors. Licensee MDPI, Basel, Switzerland. This article is an open access article distributed under the terms and conditions of the Creative Commons Attribution (CC BY) license (http://creativecommons.org/licenses/by/4.0/).
Copyright: This open access article is published under a Creative Commons CC BY 4.0 license, which permit the free download, distribution, and reuse, provided that the author and preprint are cited in any reuse.


