
Submitted:
14 September 2025
Posted:
16 September 2025
You are already at the latest version
Abstract
The aim of this study is to investigate the improvement in 50 and 100m freestyle time in 13 year old cadet swimmers by a different back leg training methods. As a conclusion of the research, it can be said that daily back leg training has a positive effect on the performance of swimmers who compete in freestyle in speed distances, 50 and 100m. And the effects of this study were reflected in the qualification of 11 swimmers (9 boys and 2 girls) from the experimental group of 16 (2 girls did not show up for medical reasons and 3 did not meet the qualification scale) at the regional stage of the National Championships from 25.03.2023 in the speed trials in the backstroke (50 and 100 meters freestyle). From the control group, only 5 swimmers qualified in the freestyle events.
Keywords:
backstroke
; freestyle
; speed
; swimming
1. Introduction
Swimming is a sport in which, in order to achieve high performance, first of all, in addition to a lot of work, talent is required (Hogan, C. et all, 2021). Swimming is a highly technical sport that requires proper form and technique to achieve optimal performance (Paniccia, D., et all, 2021; Post A.K. et all, 2022, Barbosa, T. M. et all, 2010). Swimming is the sports performed with continuous movement of arms and legs to cover a certain distance in water (Eskiyecek, C.G.; et all, 2020). One aspect of technique that is often overlooked in freestyle swimming is the role of the legs. Recent research has shown that incorporating backstroke leg exercises into a swimmer's training regimen can improve freestyle technique and overall performance.
Sportive swimming is defined as the ability of the athlete to cover certain distances in a liquid through free, backstroke, breaststroke, butterfly stroke and mixed techniques in the shortest time possible (Hanula, D., et all, 2001). Balancing body position, increasing efficiency by controlling and maintaining with minimum resistance is critical for swimming (Eskiyecek, C.G. et all, 2020, Tan, M. et all, 2023, Gonzales, L.R. et all, 2023).
Freestyle swimming is a highly technical sport that requires a great deal of skill and coordination. One of the key components of efficient freestyle swimming is the use of proper leg technique. While the primary focus of freestyle swimming is on the arm stroke and breathing technique, the legs also play a critical role in generating forward momentum and maintaining balance and stability in the water. The muscle recruitment patterns in both swimming technique, freestyle and backstroke kick are practically identical.
Recent research (Table 3) has shown that incorporating backstroke leg exercises into a swimmer's training regimen can have a significant impact on improving freestyle technique.
In principle, the backstroke kick is similar to the freestyle kick – with a few differences. Just like freestyle, backstroke is a long-axis stroke. This means a swimmer rotates around their longitudinal axis. A swimmer’s best body position is with the body about 2/3 under the surface of the water and 1/3 above (Gonzales, L.R. et all, 2023). Backstroke leg exercises involve working the legs in a similar way to how they are used in backstroke swimming. This includes kicking with a straight leg, pointing the toes, and engaging the hips and core muscles. These exercises target the leg muscles that are essential for freestyle swimming, including the quadriceps, hamstrings, and glutes. The kick is an important component of freestyle swimming that generates additional propulsion and helps maintain balance in the water. The kick should be performed with a straight leg, pointed toes, and a slight flexion of the knee. A powerful and efficient kick can significantly enhance swimming speed and reduce overall energy expenditure. In the training process the similarities between freestyle and backstroke kick present several advantages:
- -
- Up kick versus down kick It is the downkick portion that is the setup in backstroke, while the upkick portion is the propulsive phase. This is the opposite of the Freestyle Kick, but the reality is the same – there is nedeed a great downkick, in order to followthrough with an amazing upkick (Gonzales, L.R. et all, 2023);
- -
- Plantar flexion Just like in the Freestyle Kick, a swimmer should plantarflex their foot while kicking. [....] plantarflexion increases the propulsion a swimmer can create by reducing their drag, increasing the surface area of their foot, and improves their ankle flexibility (Gonzales, L.R. et all, 2023);
- -
- Kick from hips Just like in the Freestyle kick, a swimmer should initiate the Backstroke kick from their hips. The ideal amount of knee bend is the same between these two kicks and that’s about 120degrees of knee bend. You don’t need anymore knee bend than that, and any less—won’t generate much propulsion in your kick at all (Gonzales, L.R. et all, 2023).
Based on the description of the exercises used in the program, it shows that through a varied training methods (Nugent, F.J., et all, 2017, The jamovi project, 2023) to increase speed in freestyle it is possible through backstroke kicking.
2. Material and Methods
In this study were participated swimmers from Emil Racoviță National College, from class VI a A, class with a sports vocational profile (28 volunteer swimmers, 16 experimental and 12 control group). In this study 28 cadet swimmers participated, 16 of whom the experiment was applied, of which 6 girls and 16 boys, and 12 swimmers who represented the control group, of which 4 girls and 8 boys. The tests (Table 3) in the 50 and 100 m Freestyle events as well as the training took place in the 50 m pool, at the swimming pool within the "Lia Manoliu" National Sports Complex in Bucharest between January 11 and February 23, 2023, over a period of 6 weeks with a frequency of 5 trainings per week, 2 hours of water training per day, with the practice of back leg exercises with the raft at each training, with the start of training at 07.30 in the morning. In weeks 1 and 2, the departure for the 8x50m backstroke exercise was carried out at 1:20.00, in weeks 3 and 4 the departure was made at 1:15.00 and in weeks 5 and 6 at 1:10.00 for both girls and boys. The experimental group used special swimming training and the control group received only the classic training, specific to the training period. The data are collected from swimming speed test on 50 meters freestyle. In this research, the one-group pre-test was used for the initial measurements and post-test design for the final measurements of the swimmers. At the end of the program, a statistically significant difference was found in the experimental group.
The test tools used to interpret the results were descriptive statistics and correlation between variables (Guo, W., 2023).
3. Result and Discussion
Based on the results of the comparative study between the two groups of 16 and 12 swimmers respectively, the averages obtained by the cadets when performing the exercise at the 8 repetitions, for each week can be found in the tables below. In order to record the effectiveness of this training method, we used two graphical interpretation methods, respectively, descriptive statistics and correlation between variables.
A. Descriptive statistics
The analysis of data series contains descriptive statistics as a first step (Table 1). All our variables are continuous and measured on a ratio scale, so we will analyze the mean. There is one exception, the gender variable which is measured on the nominal scale and for which we calculate the modulus.
The module takes the value 1, which highlights that we have more men than women.
- Average – displays the central tendency of each individual series. (Table 1)
- The standard deviation denotes the degree of dispersion of the data. In general, it is compared to values of the central tendency, to the average. In the case of our variables it is reasonable. (Table 1)
- Standard errors exceed 1 for many variables, so they are too large and calculations are not very accurate. (Table 1)
- Skewness values evaluate the sharpness of the graph. Values in the range [-1.96; 1.96] denotes a graph that closely approximates the Gaussian curve of the normal. Kurtosis values evaluate the shift of the graph to the left or right from the normal values. Values in the range [-1.96; 1.96] denotes a graph that closely approximates the Gaussian curve of the normal. All of our variable values fall within this range, with the exception of S6pl.1.10. (Table 1). At the last test, low and high values were recorded, but not average.
- Min and Max – represent the minimum and maximum values respectively contained in our data series.
- Range – represents the difference between the maximum values and the minimum values.
- The Saphiro-Wilk test can be used to decide whether or not a sample fits a normal distribution and is commonly used for small samples. According to the Shapiro-Wilk test, a p-value greater than 0.05 (p > 0.05) represents the hypothesis that the data were approximately normally distributed (Pearson, 2010). The p-values for perceptions of benefits and effectiveness are all less than 0.05. The Shapiro-Wilk test statistic (Calc W) is basically a measure of how well the ordered and standardized sample quantiles match the standard normal quantiles. The statistic will take a value between 0 and 1, with 1 being a perfect match.
At the initial test/ 50 m free, an average of 37.7 sec is obtained. with a small standard deviation of 3.6 and values in the range [34.1; 43.2]. The graph occupies a larger area at the bottom, the interval [34.1; 39], which also contains the average=horizontal line (Figure 1a). The Skewness and Kurtosis values are in the standard, and the Saphiro-Wilk test (p=0.082> 0.05 and W=0.9) shows that the values obtained by the athletes are in the normal curve, so we can apply parametric tests (Table 1). If we also analyze from the point of view of gender, we notice that girls (0) get a higher value, an average of about 39 sec. while boys (1) get an average of 35 sec. (Figure 1b).
An average of 36 sec is obtained at the Final Test/50 m freestyle. with a small standard deviation 2.69 and values in the range [32.2; 40.3]. The graph occupies a larger area in the lower part, the interval [32.2; 37], which also contains the mean=horizontal line (Figure 2a). The Skewness and Kurtosis values are in the standard, and the Saphiro-Wilk test (p=0.92> 0.05 and W=0.167) shows that the values obtained by the athletes are in the normal curve, so we can apply parametric tests (Table 1). If we also analyze from the point of view of gender, we notice that girls (0) get a higher value, an average of about 37 sec., while boys (1) get an average of 34 sec. (Figure 2b).
In Initial testing/100m freestyle, an average of 1762 sec is obtained with a standard deviation of 418 and values in the range [1215; 2359]. (Figure 3a). The Skewness and Kurtosis values are in the standard, and the Saphiro-Wilk test (p=0.068> 0.05 and W=0.895) shows that the values obtained by the athletes are in the normal curve, so we can apply parametric tests (Table 1). If we also analyze from the point of view of gender, we notice that girls (0) obtain a higher value, an average of about 1900 sec, while boys (1) obtain an average of 1500 sec (Figure 3b).
At the Final Test/100 m freestyle, an average of 1671 sec is obtained with a standard deviation of 419 and values in the range [1157; 2317]. (Figure 4a). The Skewness and Kurtosis values are in the standard, and the Saphiro-Wilk test (p=0.068> 0.05 and W=0.897) shows that the values obtained by the athletes are in the normal curve, so we can apply parametric tests (Table 1). If we also analyze from the point of view of gender, we notice that girls (0) obtain a higher value, an average of about 1700 sec, while boys (1) obtain an average of 1400 sec (Figure 4b).
In Testing Week 1 8x50 pic S/ pl.1.20 an average of 1.16 is obtained with a small standard deviation of 0.01 and values in the range [1.15; 1.2]. The graph occupies a larger area in the lower part, the interval [1.15; 1.17], which also contains the mean=horizontal line (Figure 5a). The Skewness and Kurtosis values fall within the standard, but the Saphiro-Wilk test (p=0.000< 0.05 and W=0.747) shows that the values obtained by the athletes do not fall within the normal curve, so we will have to apply non-parametric tests, such as Wilcoxon (Table 1), but for uniformity we will apply Wilcoxon. If we also analyze from the point of view of gender, we notice that girls (0) obtain a lower average value of approximately 1.15, while boys (1) obtain an average of 1.17 (Figure 5b).
In Testing Week 2 8x50 pic S/ pl.1.20 an average of 1.13 is obtained with a small standard deviation of 0.01 and values in the range [1.12; 1.17]. The graph occupies a larger area in the lower part, the interval [1.15; 1.17], which also contains the mean=horizontal line (Figure 6a). The Skewness and Kurtosis values fall within the standard, but the Saphiro-Wilk test (p=0.00< 0.05 and W=0.747) indicates that the values obtained by the athletes do not fall within the normal curve, so we will have to apply non-parametric tests, such as Wilcoxon (Table 1), but for uniformity we will apply Wilcoxon. If we also analyze from the point of view of gender, we notice that girls (0) obtain a lower average value of approximately 1.12, while boys (1) obtain an average of 1.14 (Figure 6b)
In Testing Week 3 8x50 pic S/ pl.1.15 an average of 1.11 is obtained with a small standard deviation of 0.02 and values in the range [1.12; 1.17]. The graph occupies a larger area at the bottom, the interval [1.09; 1.15], which also contains the mean=horizontal line (Figure 7a). Skewness and Kurtosis values fall within the standard, but the Saphiro-Wilk test (p=0.00< 0.05 and W=0.768) indicates that the values obtained by the athletes do not fall within the normal curve, so we will have to apply non-parametric tests, such as Wilcoxon (Table 1), but for uniformity we will apply Wilcoxon. If we also analyze from the point of view of gender, we notice that girls (0) obtain a lower value, an average of approximately 1.09, while boys (1) obtain an average of 1.12 (Figure 7b)
In Testing Week 4 8x50 pic S/ pl.1.15 a mean of 1.08 is obtained with a small standard deviation of 0.03 and values in the range [1.05; 1.13]. The graph occupies a larger area at the bottom, the interval [1.05; 1.110], which also contains the mean=horizontal line (Figure 8a). The Skewness and Kurtosis values are within the standard, but the Saphiro-Wilk test (p=0.00< 0.05 and W=0.761) indicates that the values obtained by the athletes do not fit into the normal curve, so we will have to apply non-parametric tests, such as Wilcoxon (Table 1), but for uniformity we will apply Wilcoxon. If we also analyze from the point of view of gender, we notice that girls (0) get a lower average value of about 1.05, while boys (1) get an average of 1.10 (Figure 8b).
In Testing Week 5 8x50 pic S/ pl.1.10 a mean of 1.04 is obtained with a small standard deviation of 0.02 and values in the range [1.05; 1.13]. The graph occupies a larger area at the bottom, the interval [1.02; 1.1], which also contains the mean=horizontal line (Figure 9a). The Skewness and Kurtosis values are within the standard, but the Saphiro-Wilk test (p=0.00< 0.05 and W=0.736) indicates that the values obtained by the athletes do not fit into the normal curve, so we will have to apply non-parametric tests, such as Wilcoxon (Table 1 ), but for uniformity we will apply Wilcoxon. If we also analyze from the point of view of gender, we notice that girls (0) get a lower average value of about 1.025, while boys (1) get an average of 1.05 (Figure 9b)
In Testing Week 6 8x50 pic S/ pl.1.10 a mean of 0.813 is obtained with a large standard deviation of 0.2 and values in the range [1.05; 1.13]. The graph occupies a larger area at the bottom and top, so we have many small values and many large values (Figure 10a). The Skewness value follows the normal curve, so the graph is not skewed to the left or right. Kurtosis (-2.27, exceeds the threshold of -1.96) does not enter the standard. The Saphiro-Wilk test (p=0.00< 0.05 and W=0.684) (Table 1) shows that the values obtained by the athletes do not fit into the normal curve, so we will have to apply non-parametric tests, such as Wilcoxon. If we also analyze from the point of view of gender, we notice that girls (0) obtain a lower average value of approximately 0.6, while boys (1) obtain an average of 1.05 (Figure 10b).
B. Correlation
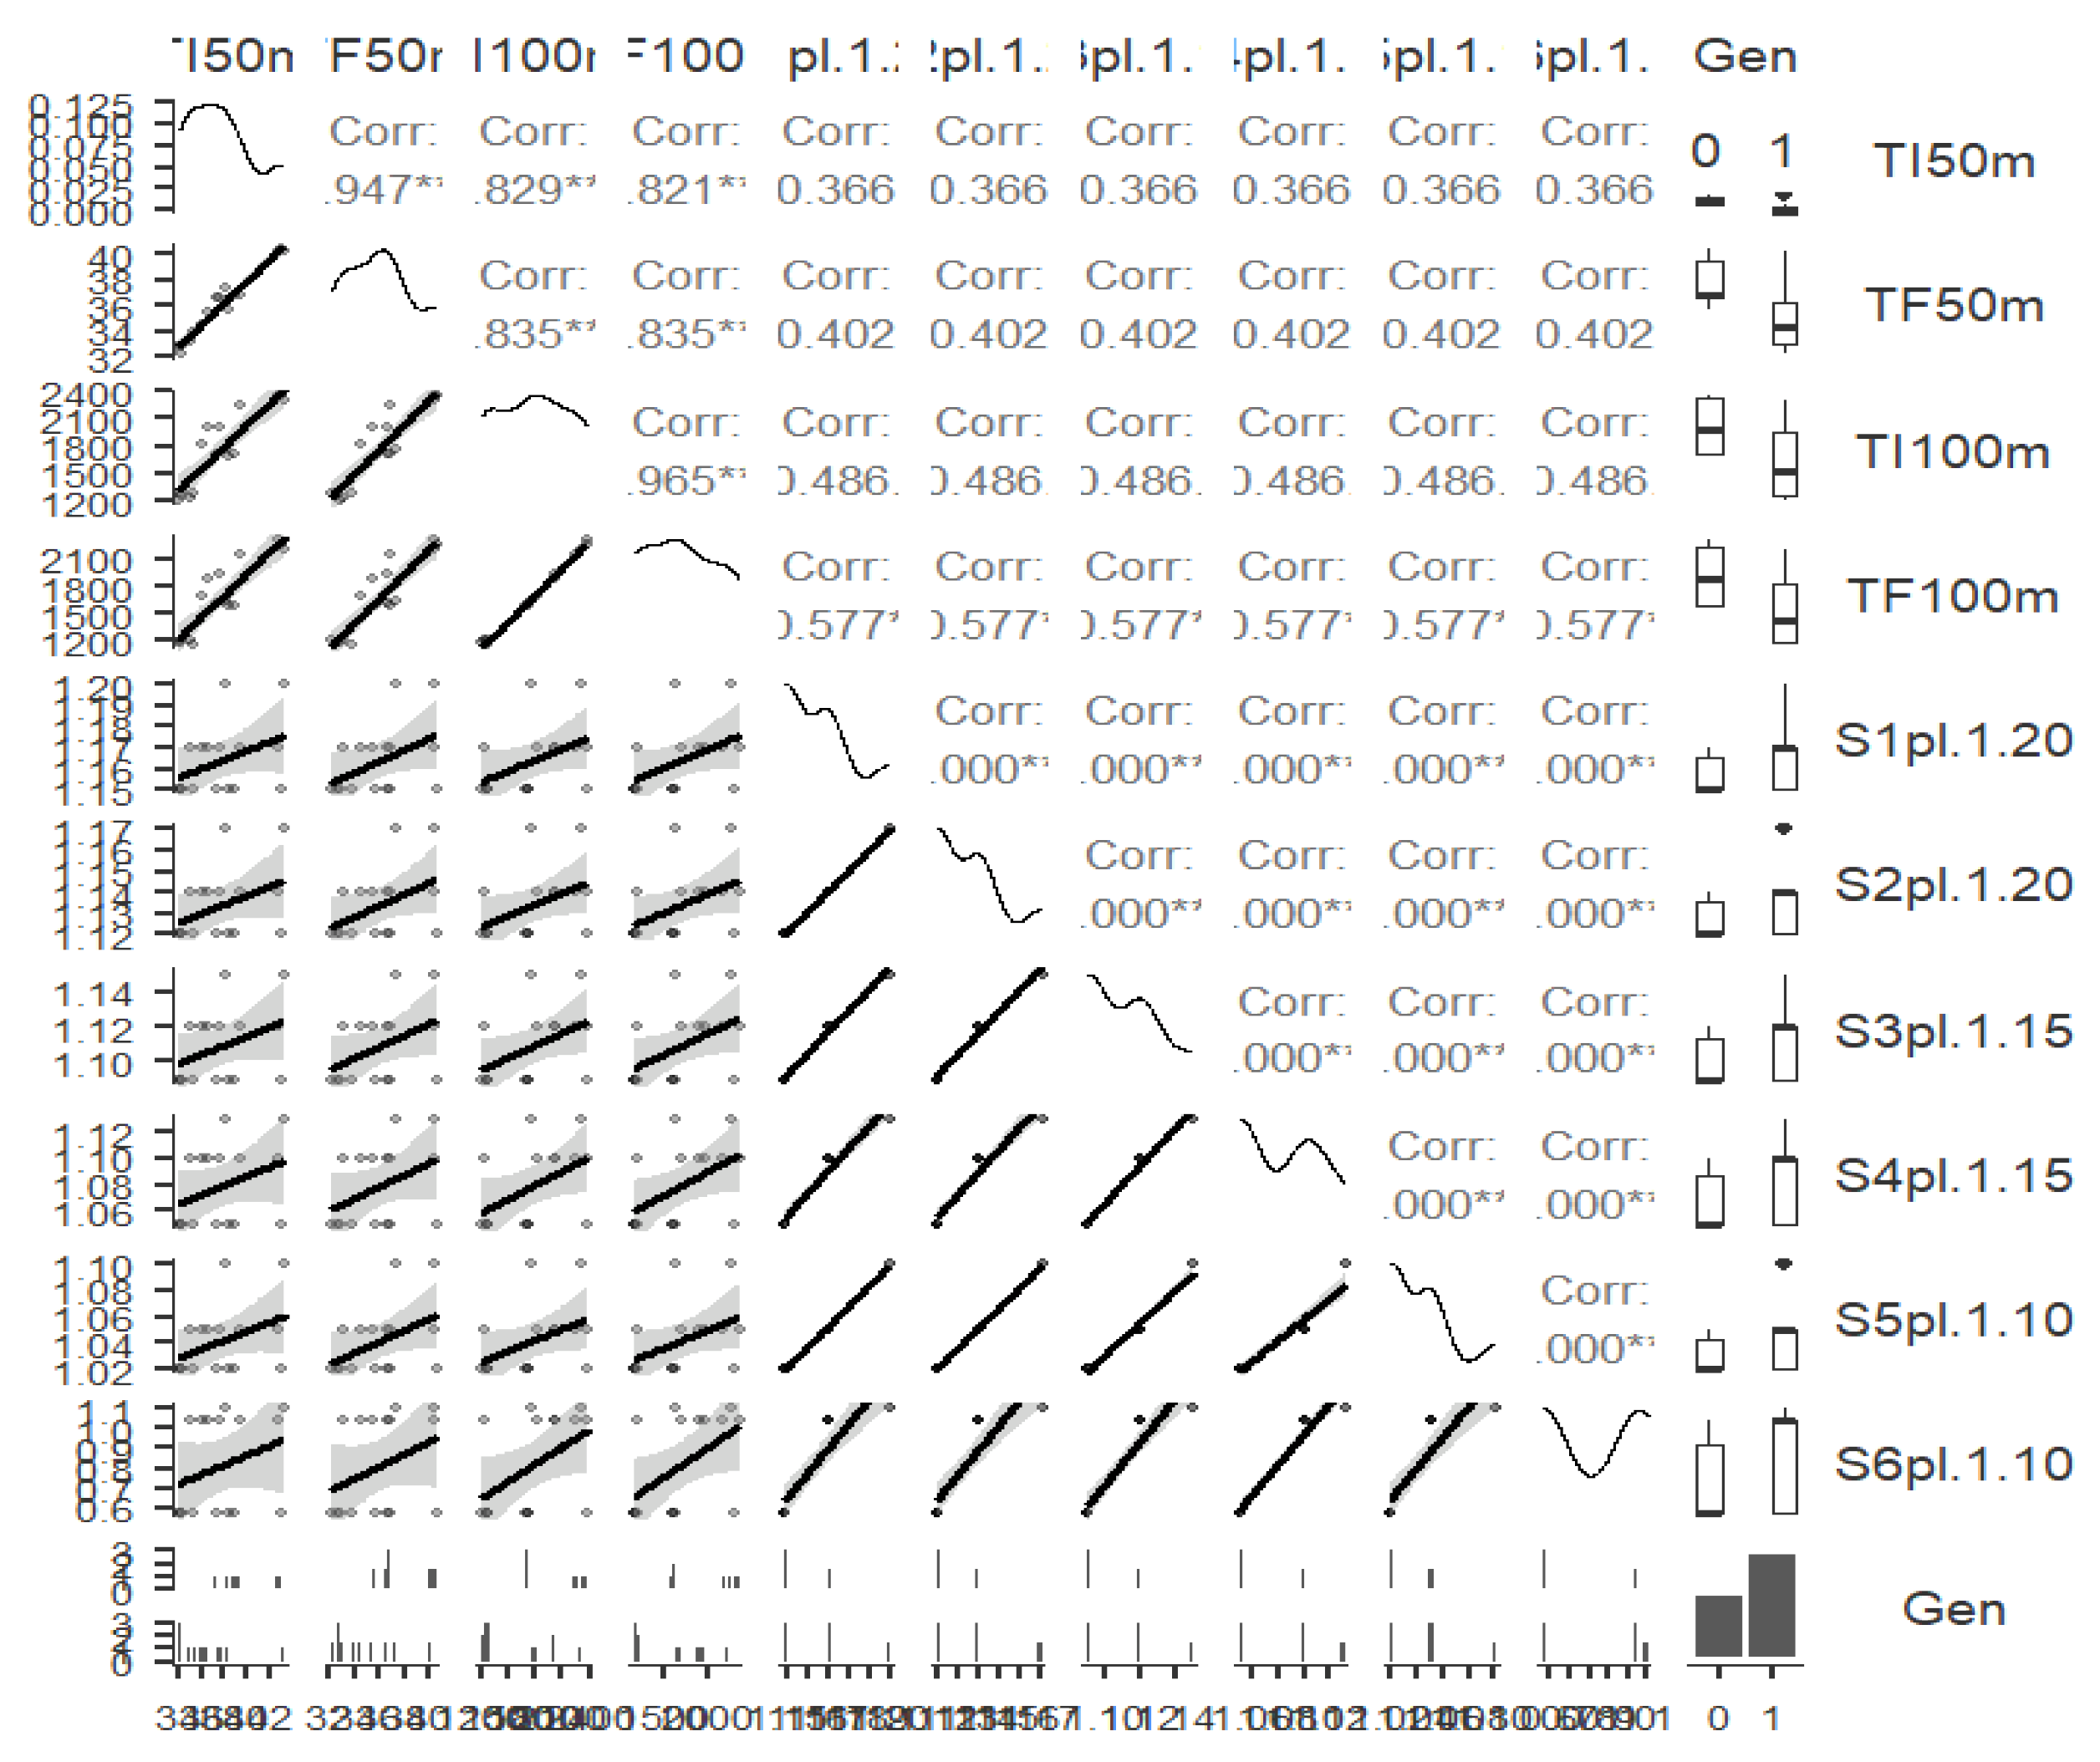
TI50m correlates strongly positively with TF50m (0.947), with TI100m (0.829) and TF100m (0.821), so athletes who score high on TI50m also score high on TF50m, TI100m, TF100m. TF50m correlates strongly positively with TI100m (0.835) and TF100m (0.835), so athletes who score high on TF50m also score high on TI100m, TF100m (Table 2, Figure 18).
Figure 17.
Correlation between the results obtained in samples TF100m and S1…S6 (grouping by gender).
Figure 17.
Correlation between the results obtained in samples TF100m and S1…S6 (grouping by gender).
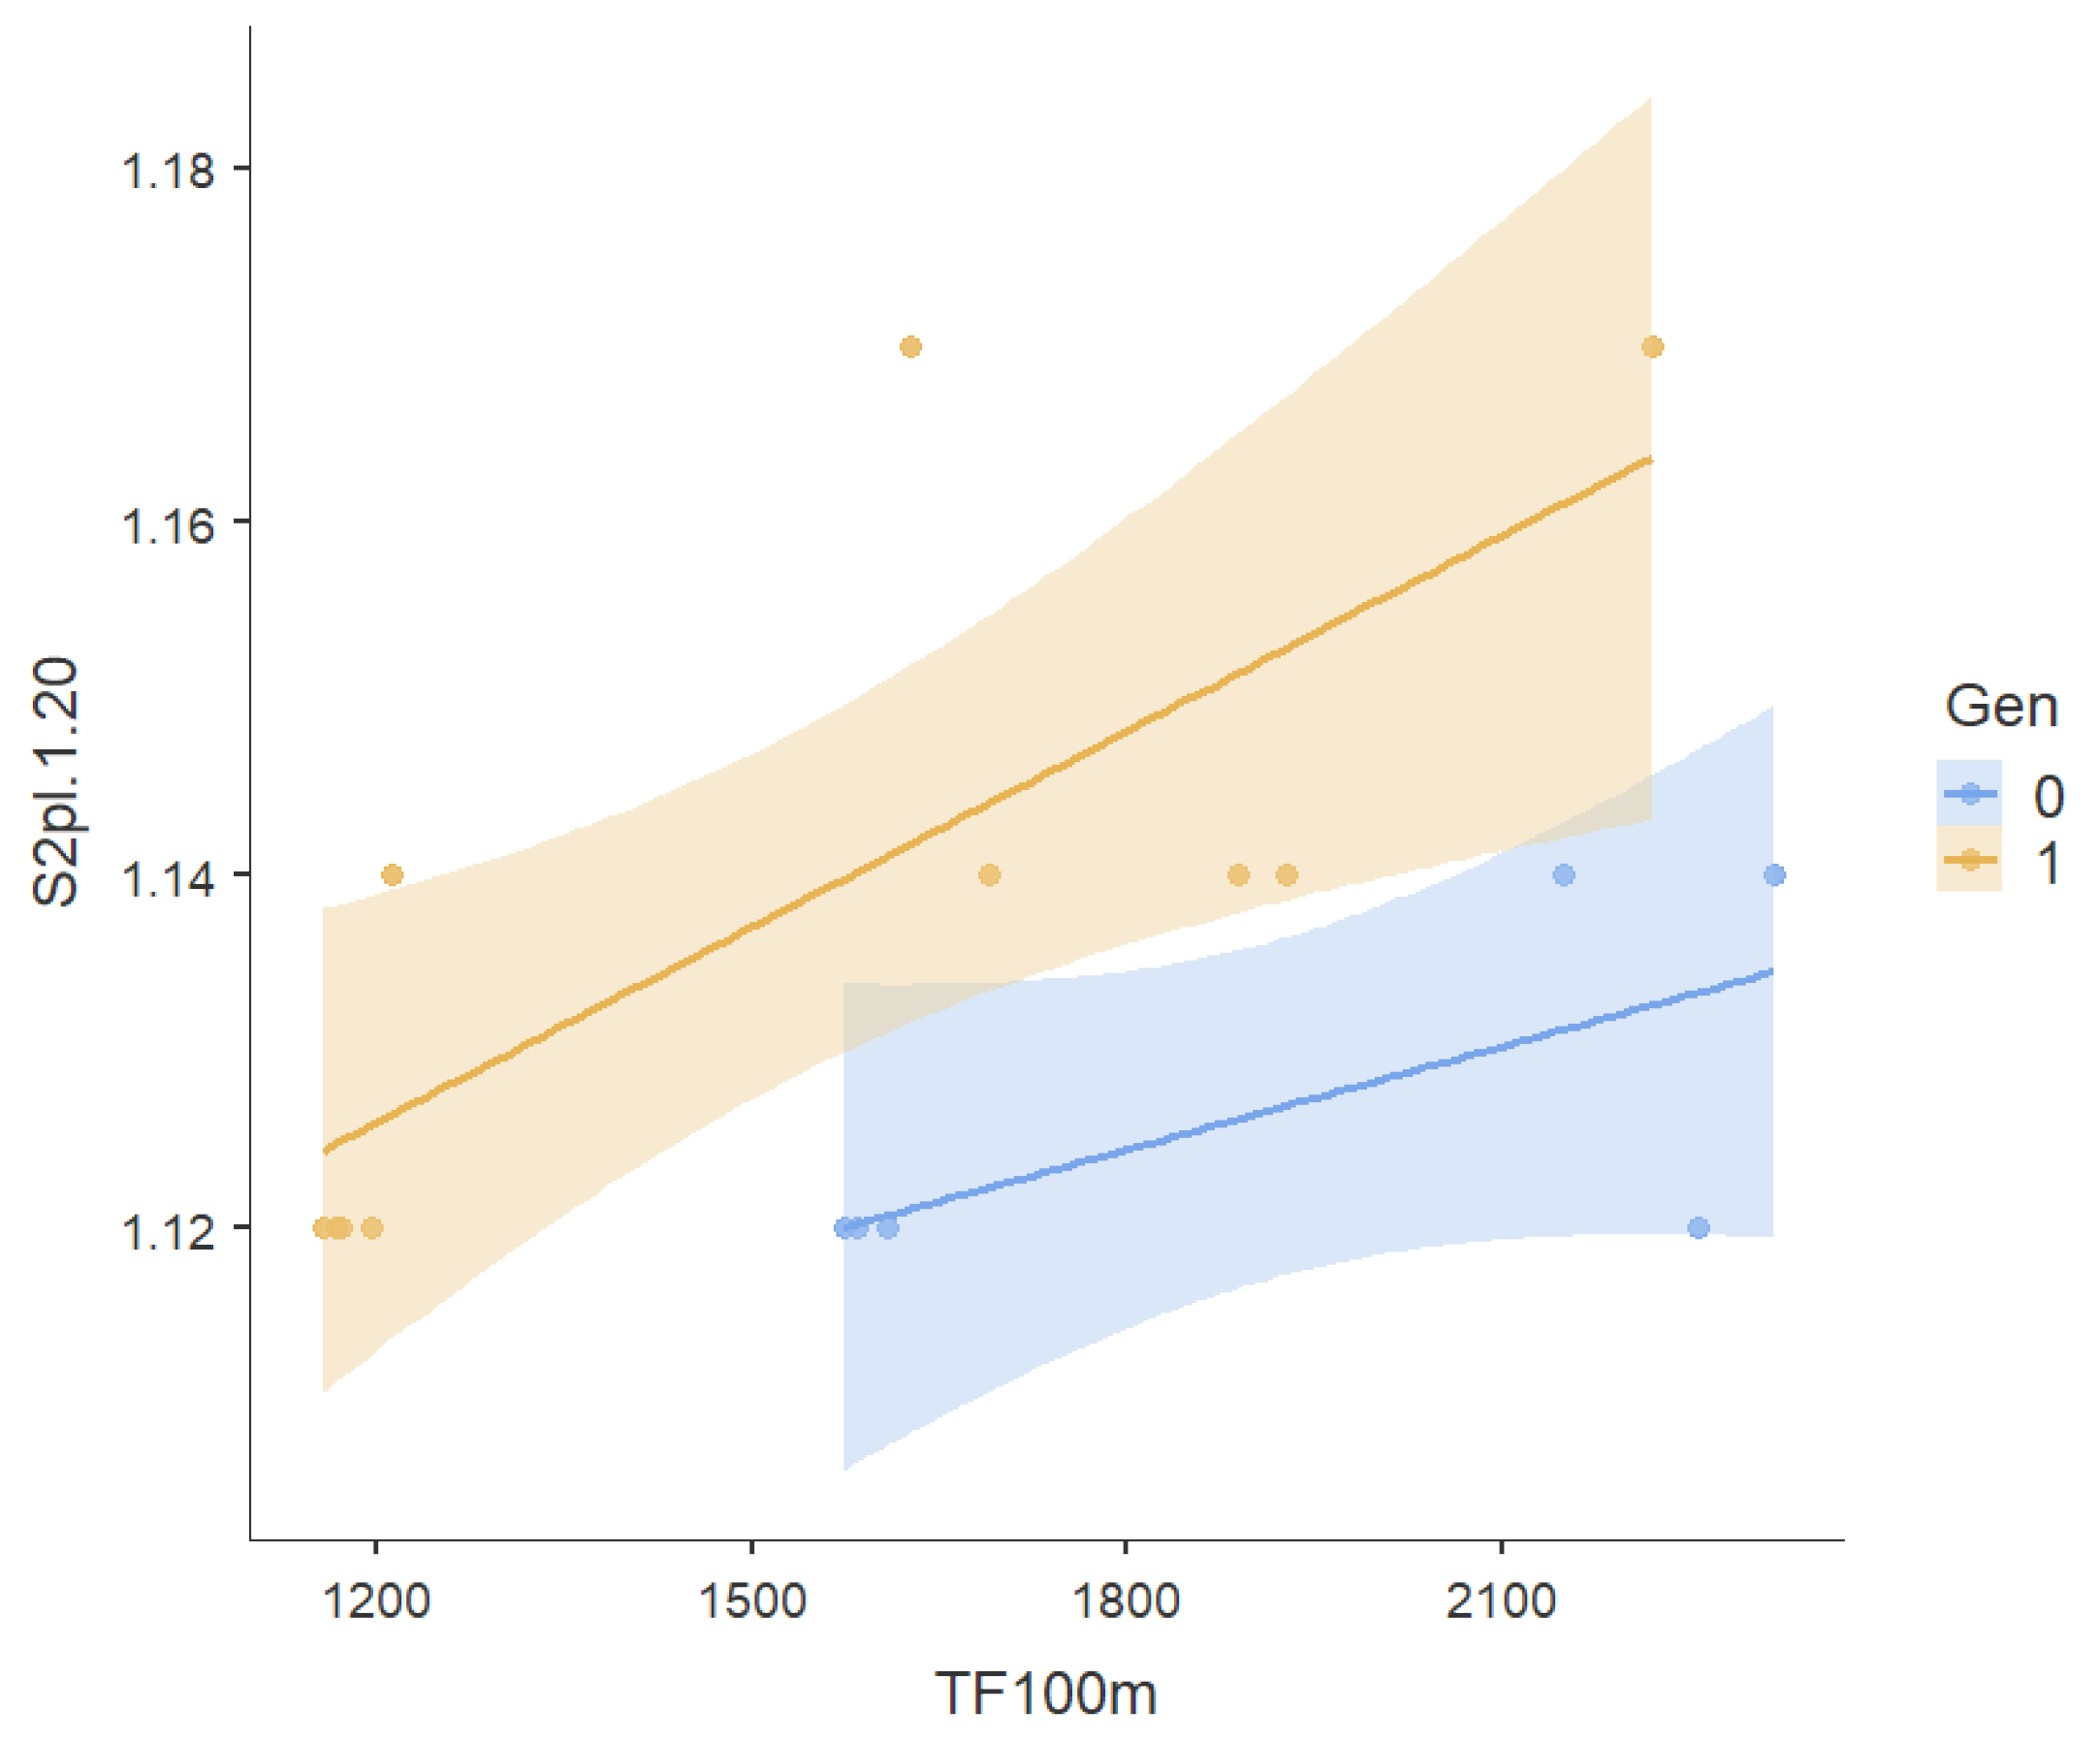
TI100m correlates strongly positively with TF100m (0.965), so athletes who score high on TI100m also score high on TF100m (Table 3, Figure 18). TI100m correlates moderately positively with S1…S6 (0.577), so athletes who score high on TI100m also score average on S1…S6. This trend can be seen very well in Figure 17. Here it is also observed that girls obtain higher values in the 2 different types of tests (orange graph) compared to boys (blue graph).
Gender correlates negatively on average with TI50m (-0.616) and TF50m (-0.588), so boys achieve lower values, better times on these tests, than girls.
The graph line (correlation trend) and standard error can be seen in the graph below.
For clarity in this section of the discussion, the results of research data on the effect of back leg training on speed improvement in freestyle competition events are based on the number of samples from the initial test and the final test, totaling 28 swimmers.
The results of measuring the swimming speed data at the time of the pretest and posttest, attest that the data meet the requirements for parametric statistical analysis. The adaptation of the swimmers to the decrease in departure time in this exercise confirms the effectiveness of the exercise and its utility in obtaining a higher speed of movement in the backstroke procedure over short distances.
Figure 18.
The trend of correlation between variables.
Daily back leg training had a positive effect on the performance of swimmers competing in backstroke in speed events, 50 and 100m. Since we did not have as a term of comparison for this study the results obtained with this training plan on a national or international level, we took as a criterion for improving sports performance the effects reflected in the fulfillment of the qualification scales of 11 swimmers (9 boys and 2 girls ) from the experimental group of 16 (2 girls did not show up for medical reasons and 3 did not complete their scale) at the regional stage of the National Championships on 25.03.2023 in the speed tests in the backstroke (50 and 100 meters free). From the control group, only 5 swimmers qualified in the freestyle events.
4. Conclusions
By incorporating these exercises into their training routine, swimmers can develop better balance and stability in the water, as well as increase the strength and endurance of their leg muscles. This can lead to improved propulsion and a more efficient freestyle stroke.
Overall, incorporating backstroke leg exercises into a swimmer's training regimen can have numerous benefits for improving freestyle technique and overall performance. By developing better leg strength and coordination, swimmers can achieve greater efficiency and speed in the water.
By incorporating backstroke leg exercises into a training regimen, swimmers can improve their leg strength and coordination. This, in turn, can lead to improved propulsion and a more efficient freestyle stroke. The improved leg strength can also help swimmers maintain better balance and stability in the water, reducing the risk of injury.
Furthermore, the incorporation of backstroke leg exercises can also enhance the swimmer's cardiovascular fitness, as these exercises require a significant amount of energy expenditure. The use of large muscle groups during backstroke leg exercises also increases the swimmer's metabolism, leading to increased calorie burn and weight loss.
It is important to note that the incorporation of backstroke leg exercises into a training regimen should be done gradually and with proper guidance from a qualified coach or trainer. Overtraining or performing exercises with improper form can lead to muscle strain and injury.
In conclusion, incorporating backstroke leg exercises into a swimmer's training regimen can improve freestyle technique, enhance cardiovascular fitness, and reduce the risk of injury. However, it is important to approach these exercises with proper guidance and gradually increase intensity to avoid injury (Guo, W. et all, 2022, Wirth, K., 2022).
Author Contributions
All authors have equally contributed to this study and should be considered as main authors.
Funding
This research received no external funding.
Conflicts of Interest
The authors declare no conflict of interest.
References
- Hogan, C., Castiglioni, M.T., Abbott, S., Cobley, S., (2021). Talent identification in swimming: A systematic review., Journal of Science and Medicine in Sport 24:S75, November, DOI:10.1016/j.jsams.2021.09.185 Conference: Sports Medicine Australia 2021 https://www.researchgate.net/publication/355788437_Talent_identification_in_swimming_A_systematic_review.
- Paniccia, D., Graziani, G., Lugni, C., Piva, R. (2021). The relevance of recoil and free swimming in aquatic locomotion. Journal of Fluids and Structures, Volume 103, May, 103290. [CrossRef]
- POST, A.K., KONING, R.H., VISSCHER, C., ELFERINK-GENSER, M.T. (2022). The importance of reflection and evaluation processes in daily training sessions for progression toward elite level swimming performance. Phychology of Sport and Exercise, Volume 61, July, 102219. [CrossRef]
- BARBOSA, T. M., BRAGADA, J.A., REIS, V.M., MARINHO, D.A., CARVALHO, C., SILVA, A.J. (2010). Energetics and biomechanics as determining factors of swimming performance: Updating the state of the art. 2010. Journal of Science and Medicine in Sport, Volume 13, Issue 2, March, Pages 262-269. [CrossRef]
- ESKIYECEK, C.G.; GUL,, G.K., GUL M., ULUDAG, B. (2020). The Effect of 8-Week Core Exercises Applied to 10-12 Age Male Swimmers on Swimming Performance. 9(3). [CrossRef]
- HANULA, D. , NARTH, T.; THE SWIM COACHING BIBLE, 1.ST EDITION. (2001). America, Human Kinetics, P.21.
- TAN, M. , LIANG, Y., LV, W., REN, H., CAI, Q. (2023). The effects of inspiratory muscle training on swimming performance: A study on the cohort of swimming specialization students. Physiology and Behavior, Volume 271, 1 November, 114347. [CrossRef]
- GONZALES, L.R., IBANEZ, E.M., MOYA, R.M., GONZALEZ-VALERO, G. (2023). Study of strength training on swimming performance. A systematic review. Science and Sport, Volume 38, Issue 3, May, Pages 217-231. [CrossRef]
- CROWLEY, E. , HARRISON, A.J., LYONS, M. (2017). The Impact of Resistance Training on Swimming Performance: A Systematic Review. Sports Med, Nov;47(11):2285-2307. [CrossRef]
- NUGENT, F.J., COMYNS, T.M., BURROWS, E., WARRINGTON, G.D. (2017). Effects of Low-Volume, High-Intensity Training on Performance in Competitive Swimmers: A Systematic Review. Strength Cond Res. Mar;31(3):837-847. [CrossRef]
- The jamovi project. 2023. jamovi. (Version 2.4) [Computer Software]. Retrieved from https://www.jamovi.org.
- GUO, W., SOH, K.G., ZAKARIA, N.S., BAHARULDIN, M.T.H., GAO, Y. (2022) Effect of Resistance Training Methods and Intensity on the Adolescent Swimmer's Performance: A Systematic Review. http://www.ncbi.nlm.nih.gov/pmc/articles/pmc9013834/.
- WIRTH, K. , KEINER, M., FUHRMANN, S., NIMMERICHTER, A., HAFF, G.G. (2022). Strength Training in Swimming. Environ Res Public Health, Apr 28; 19(9):5369. [CrossRef]
Figure 1.
Initial testing/ 50 m freestyle.
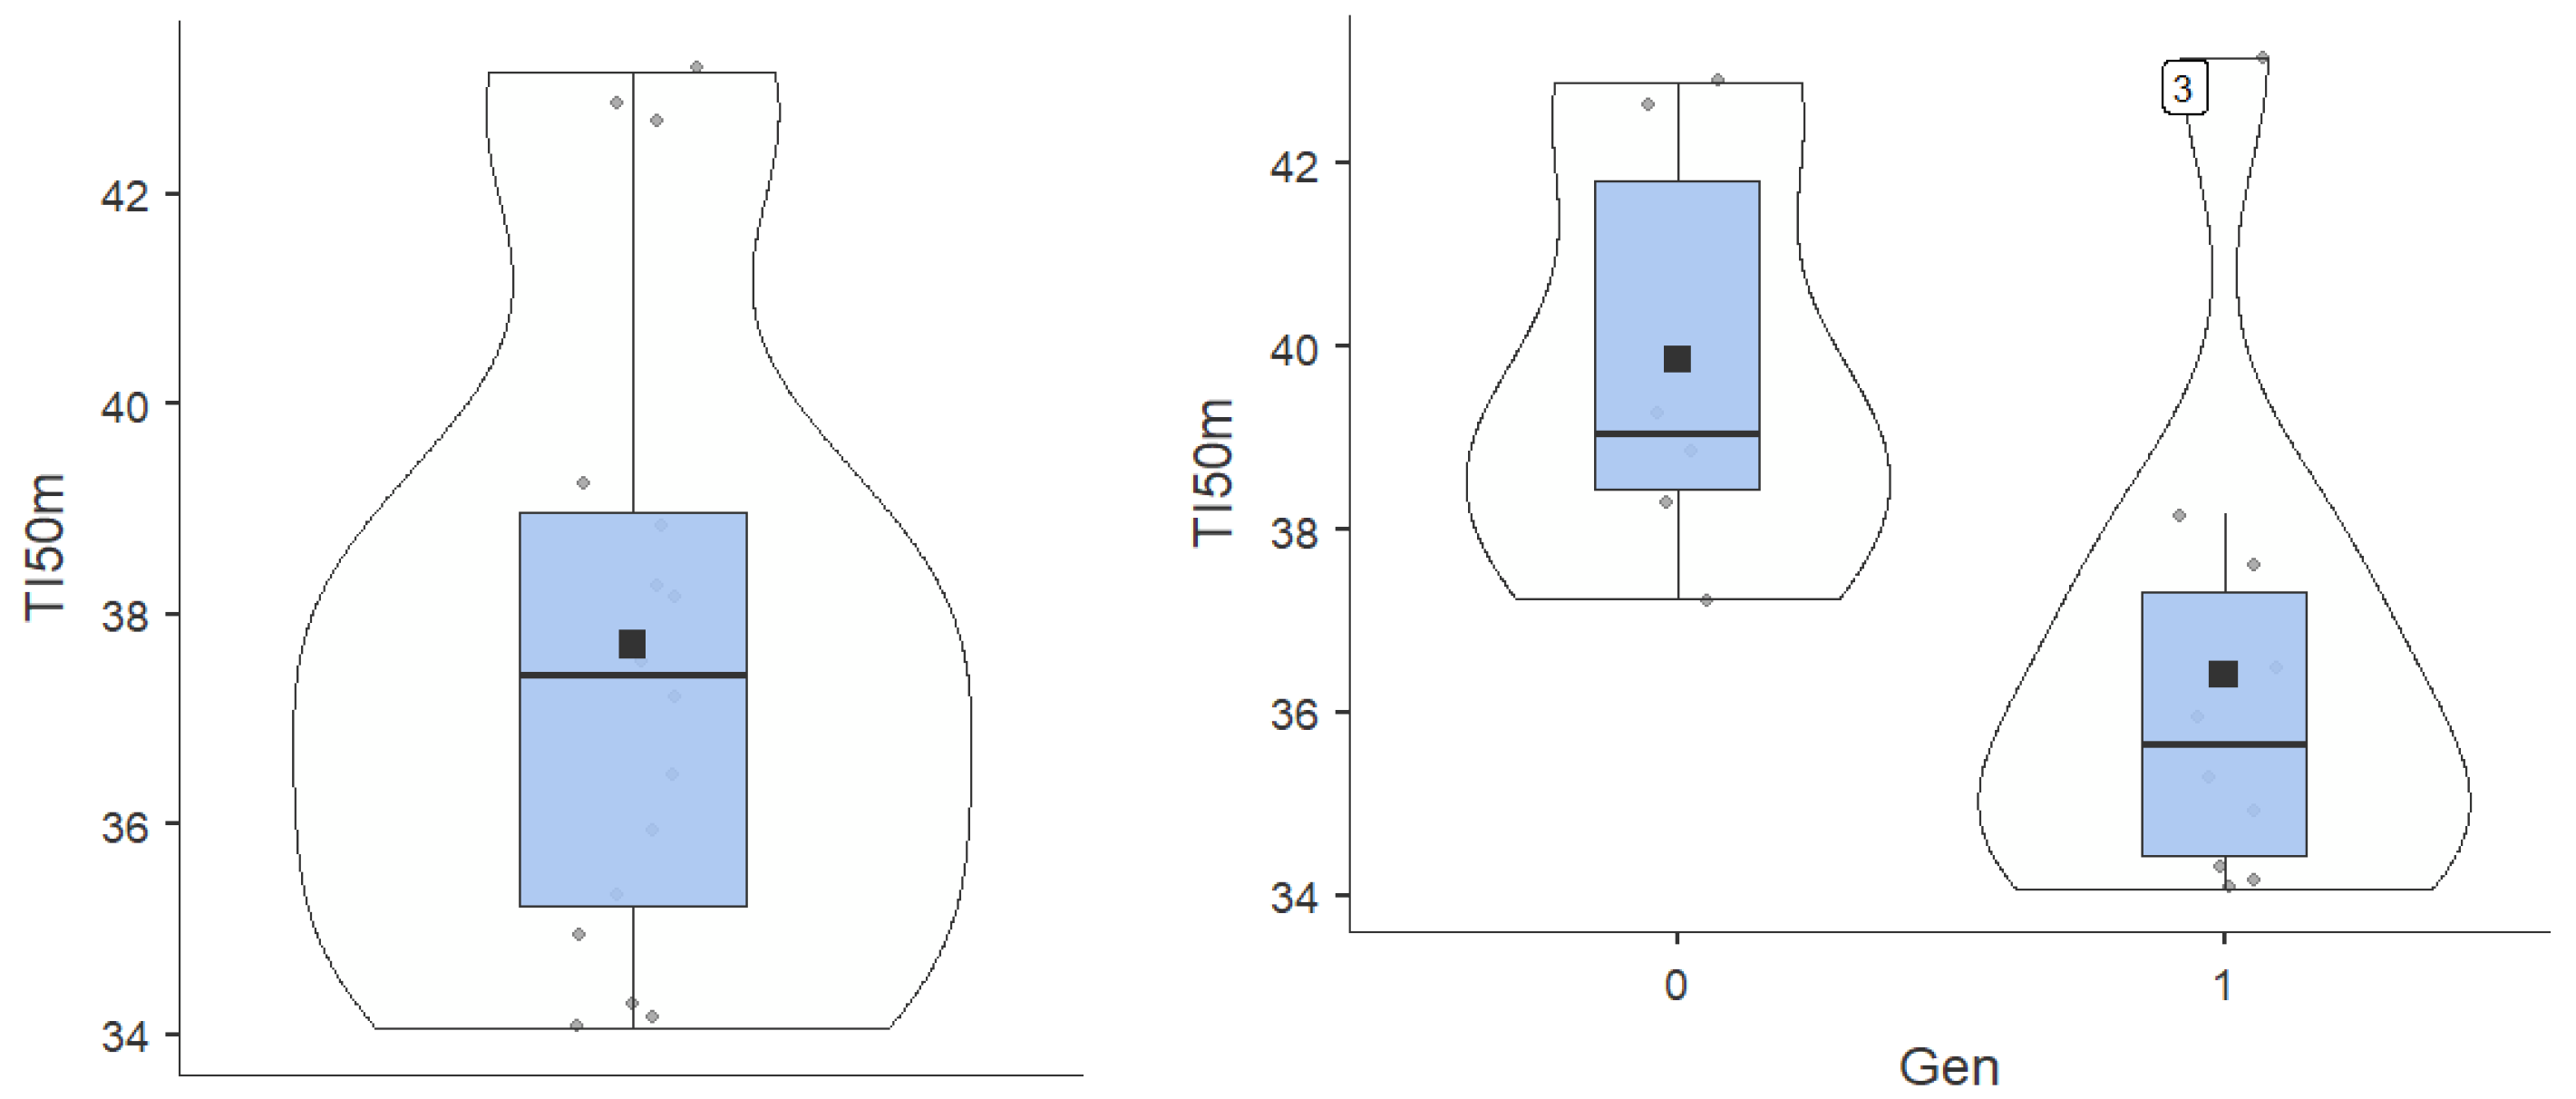
Figure 2.
Final testing/ 50 m freestyle.
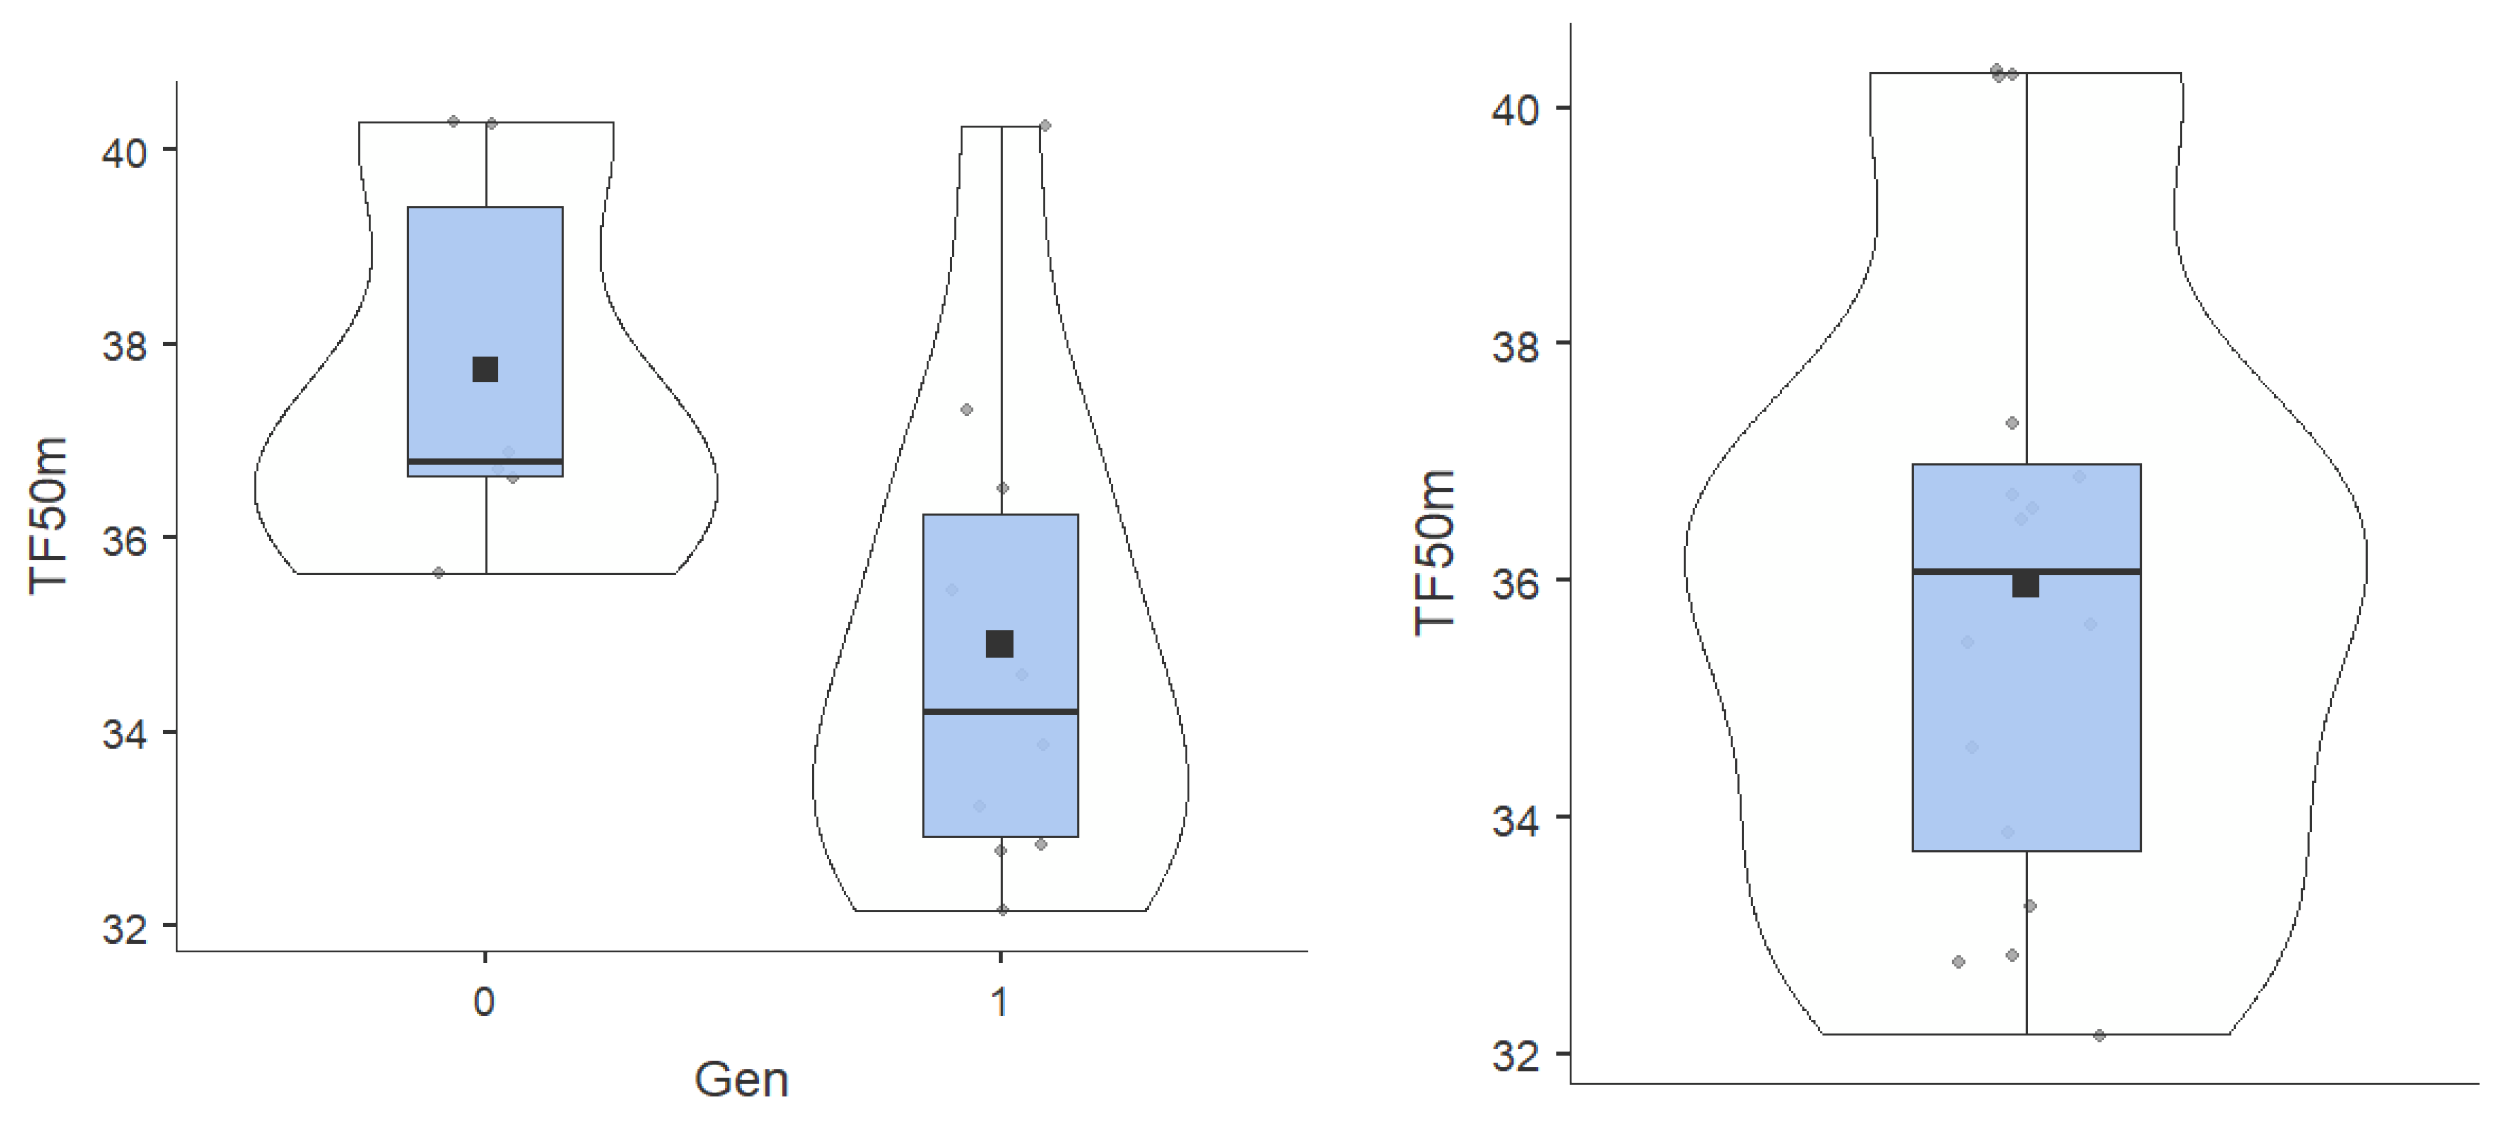
Figure 3.
Initial testing/ 100m freestyle.

Figure 4.
Final testing/ 100m freestyle.
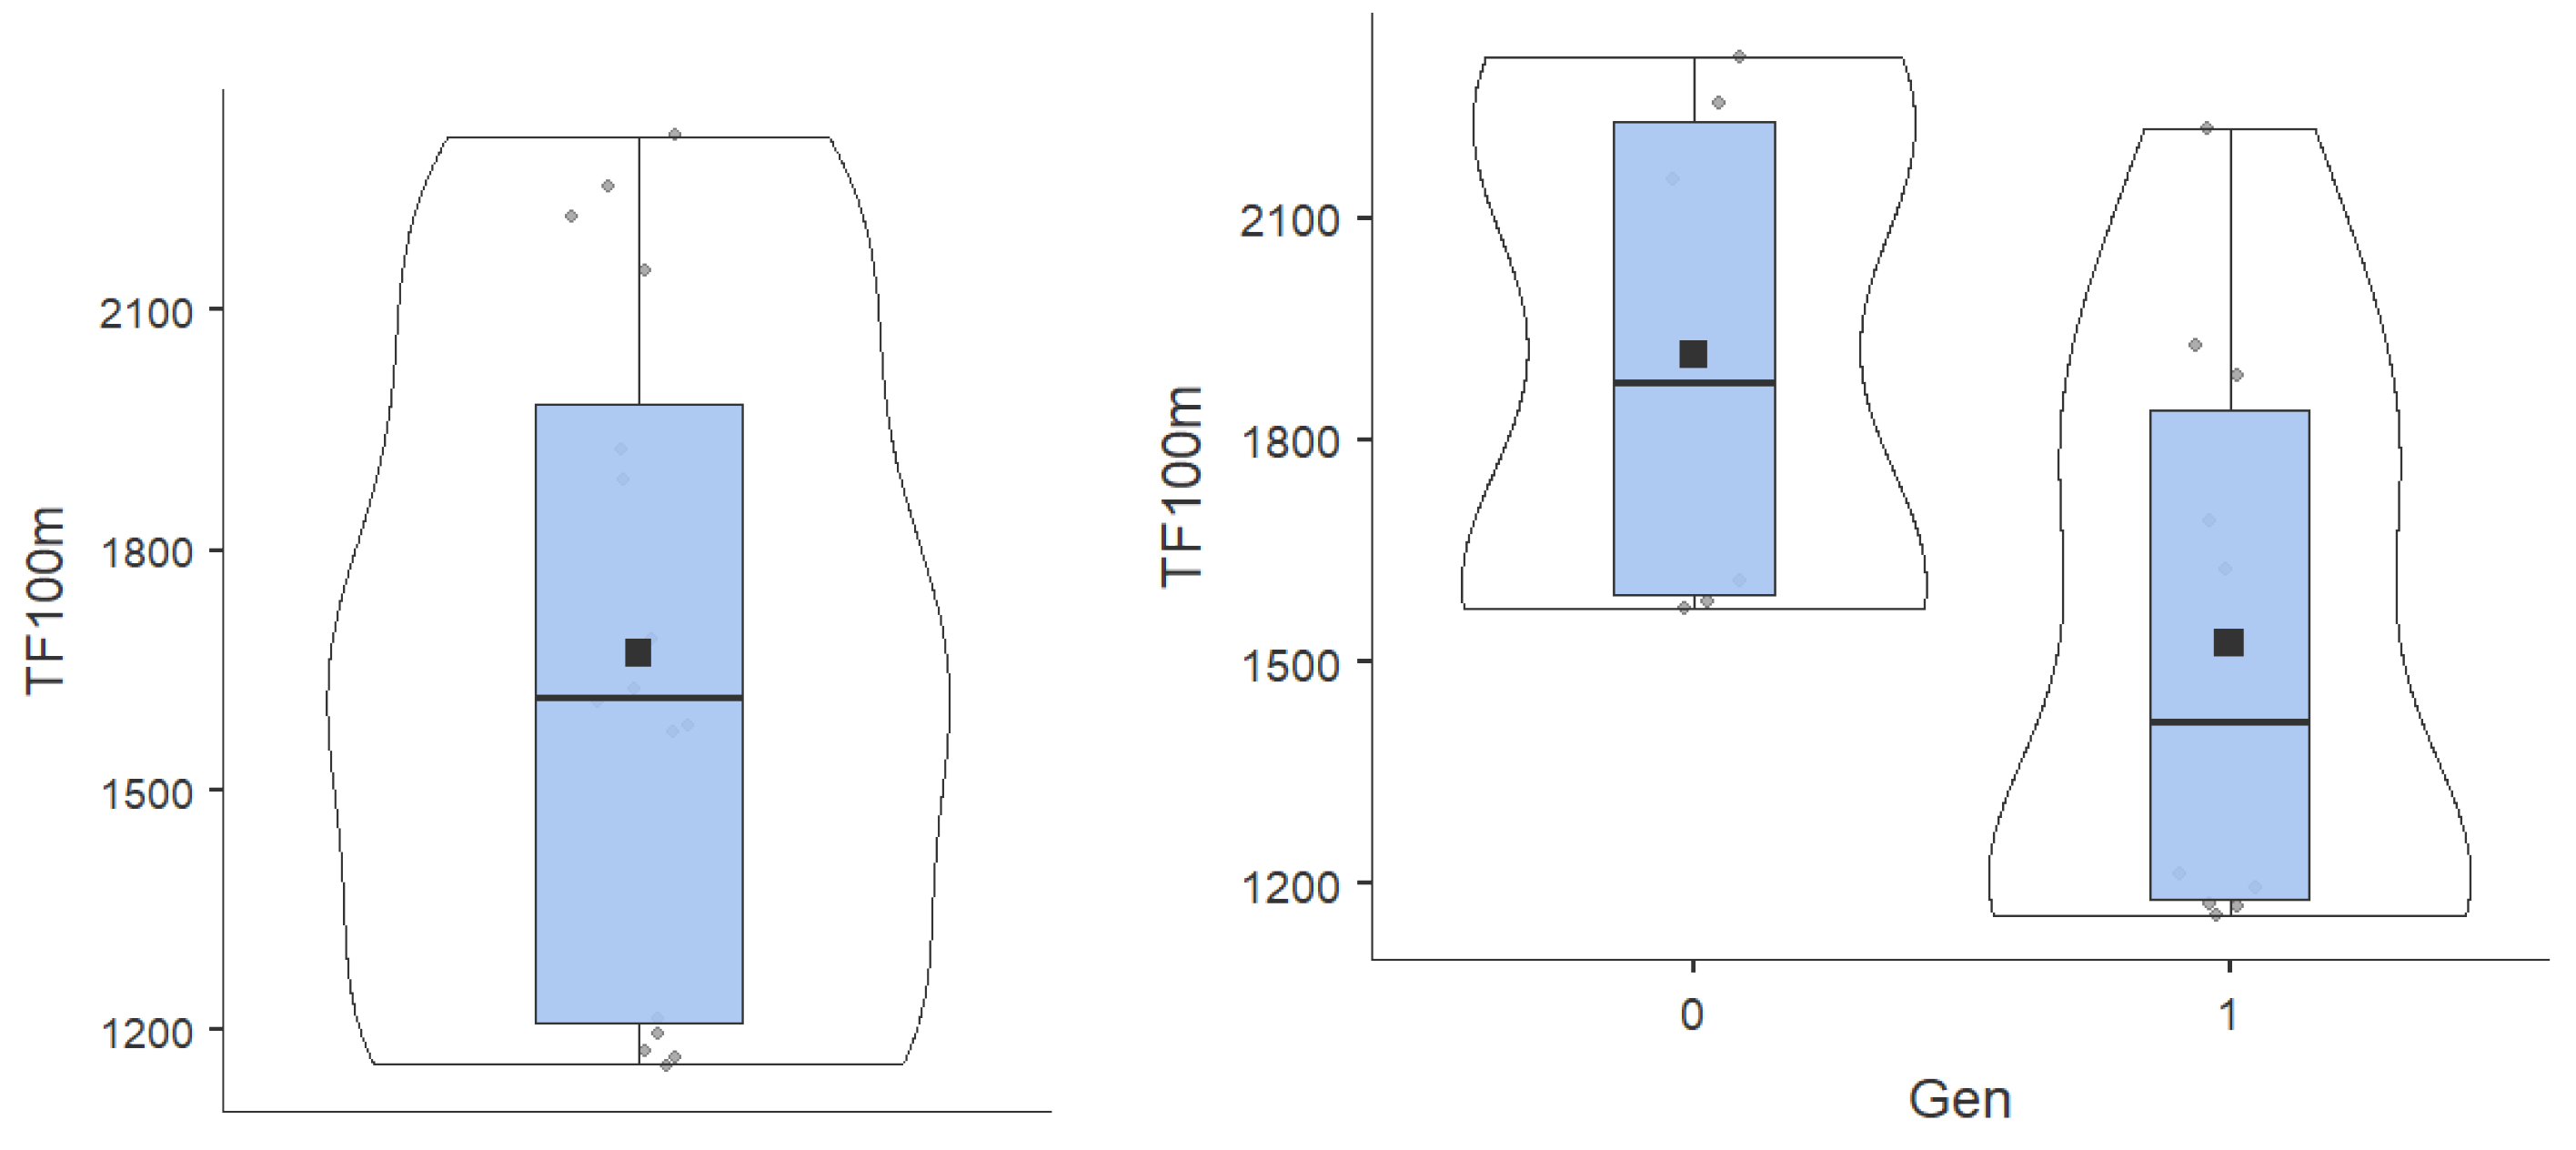
Figure 5.
Week 1 8x50 pic S/ pl.1.20.
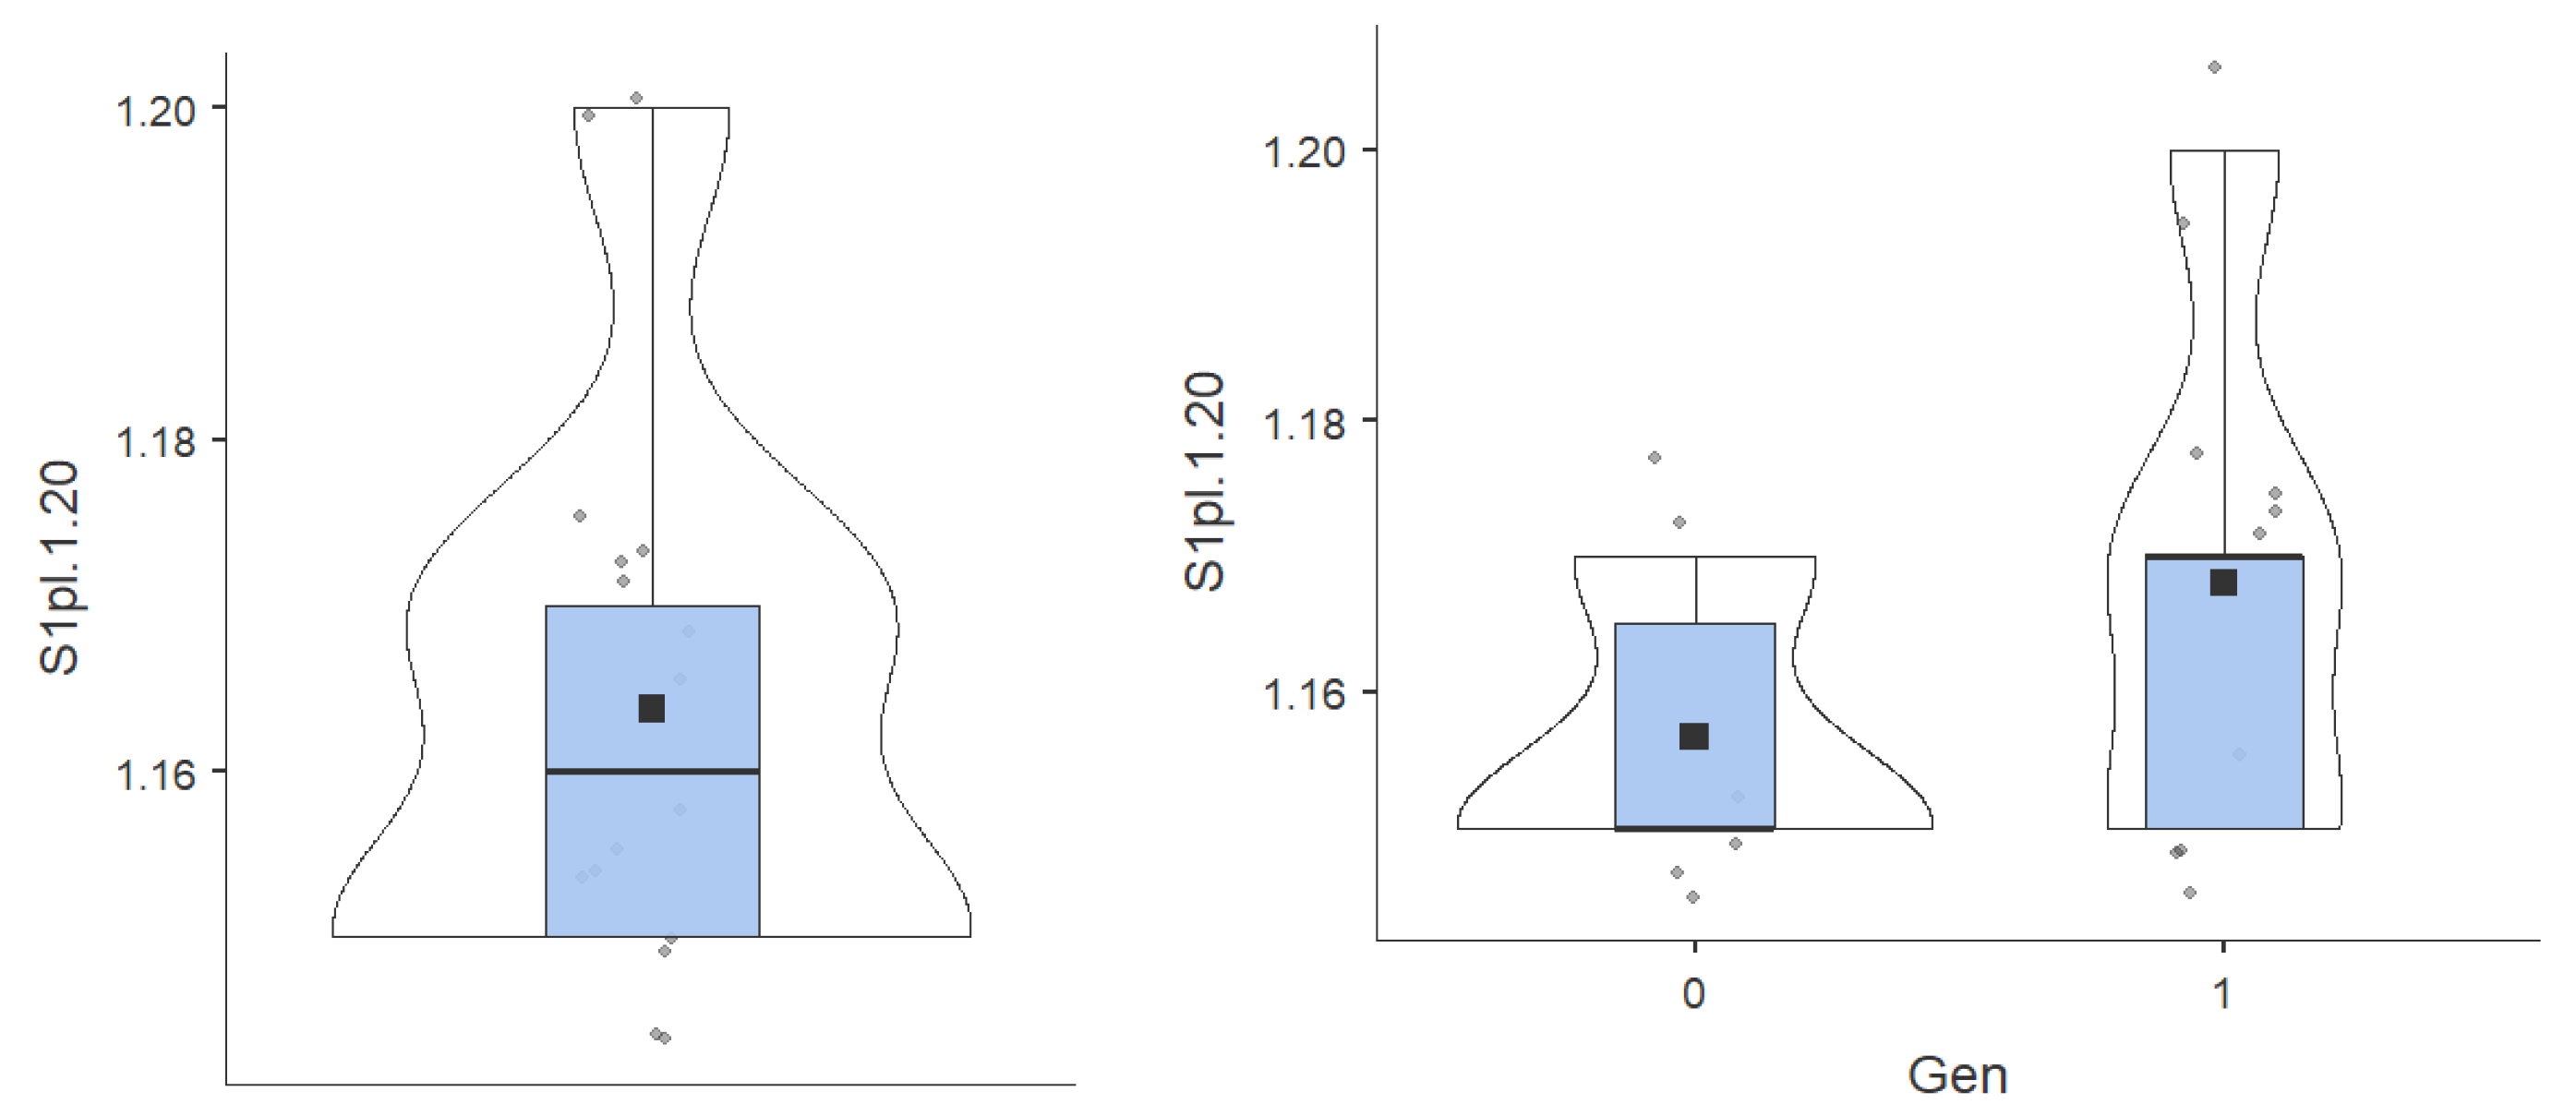
Figure 6.
Week 2 8x50 pic S/ pl.1.20.
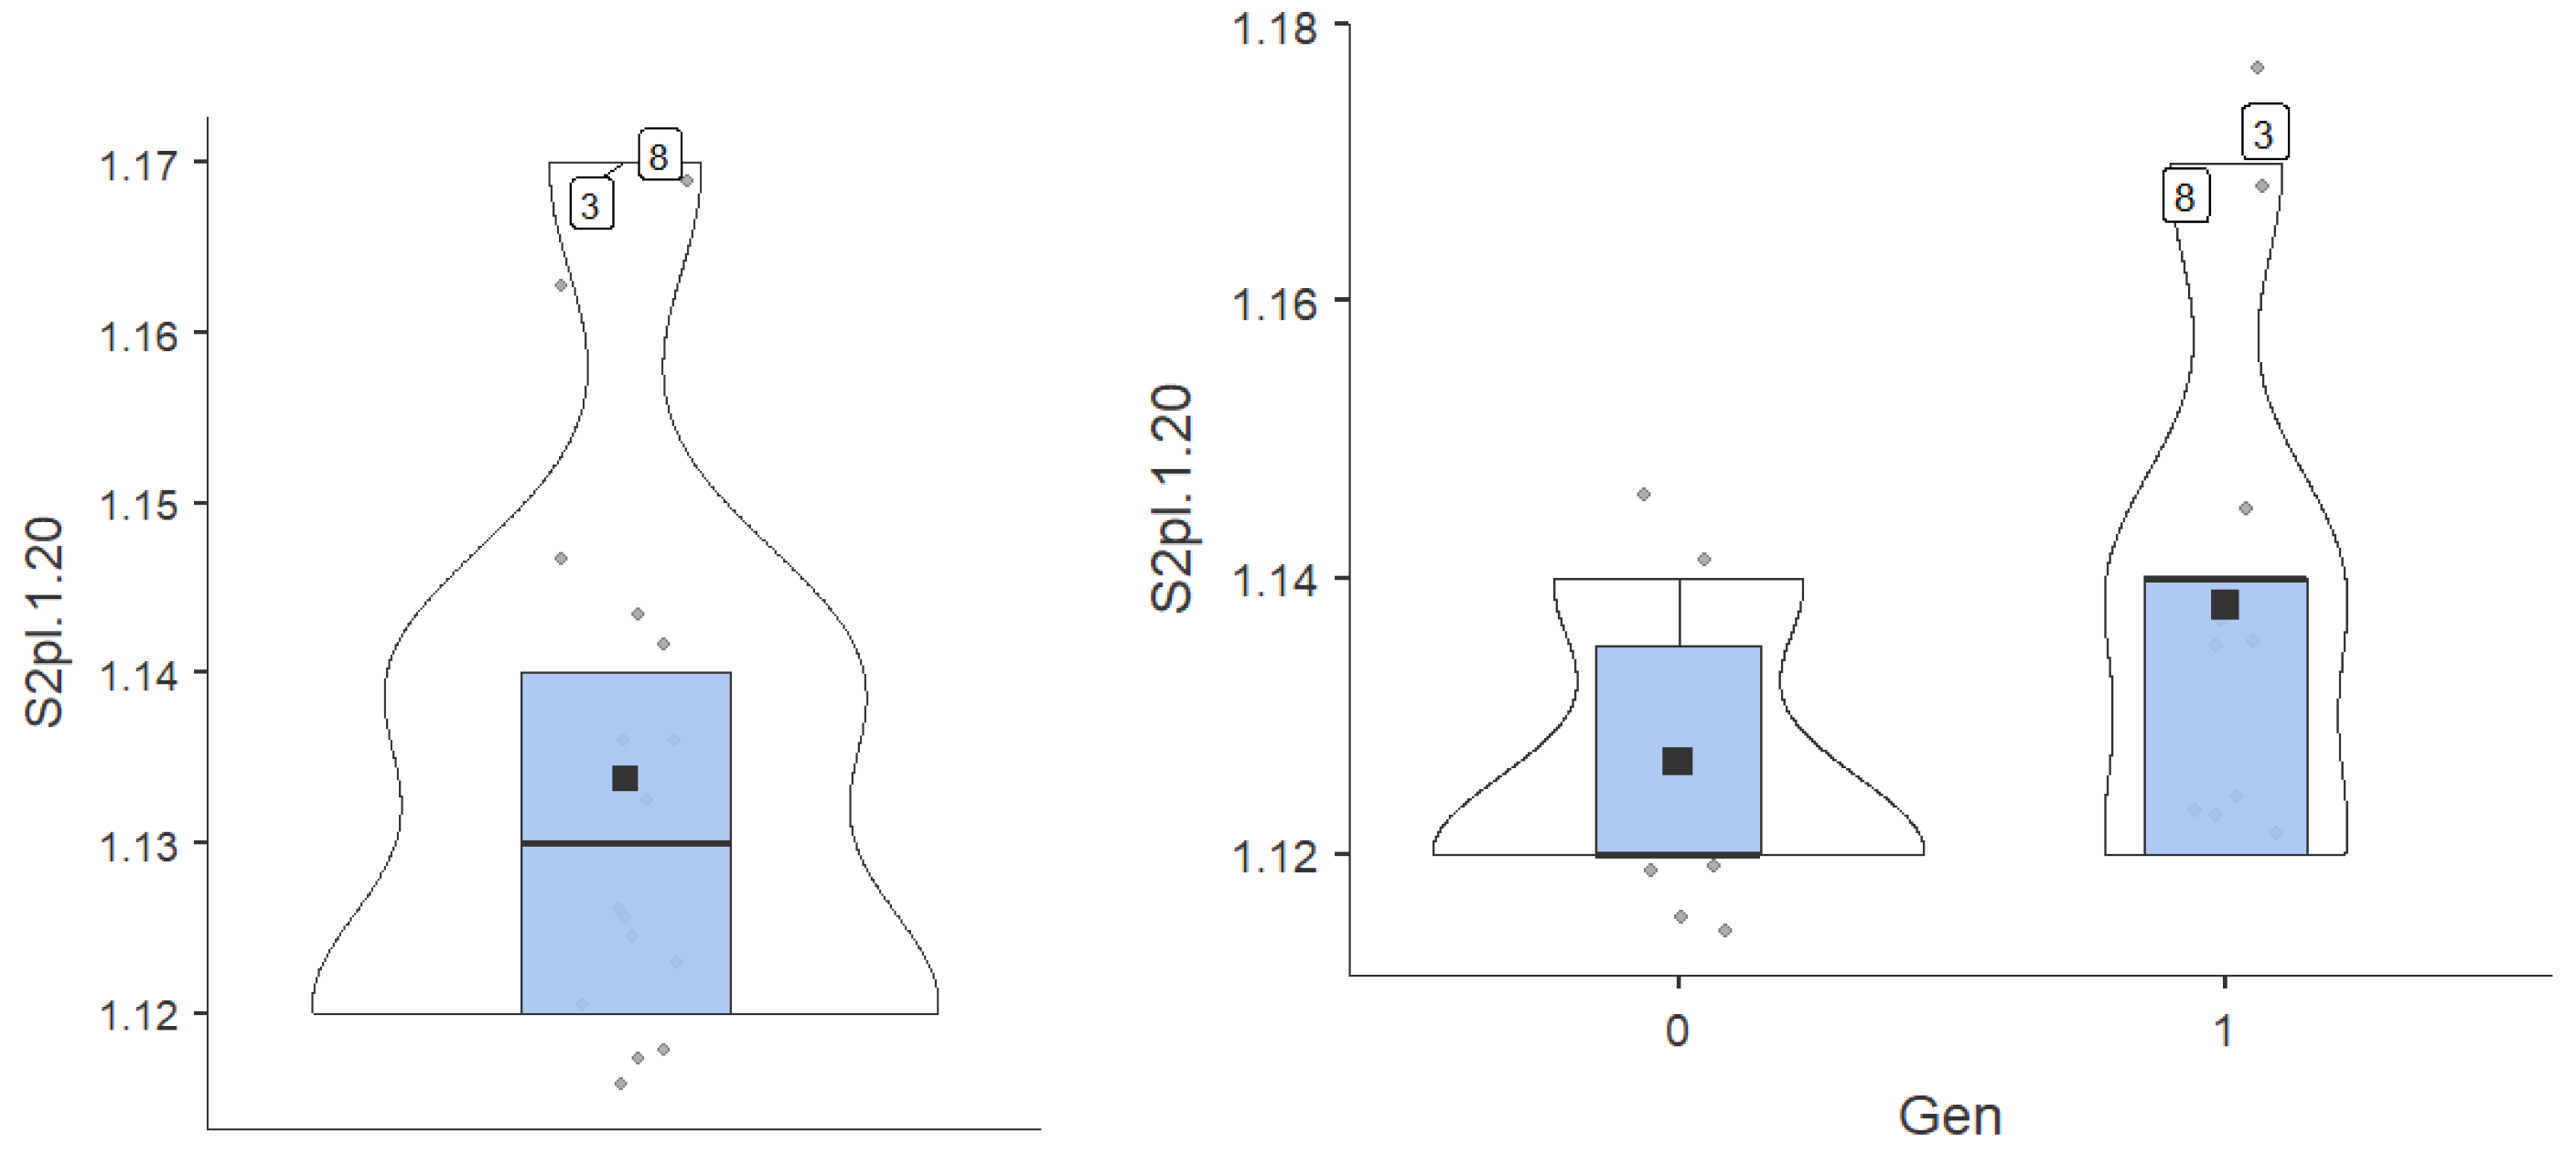
Figure 7.
Week 3 8x50 pic S/ pl.1.15.
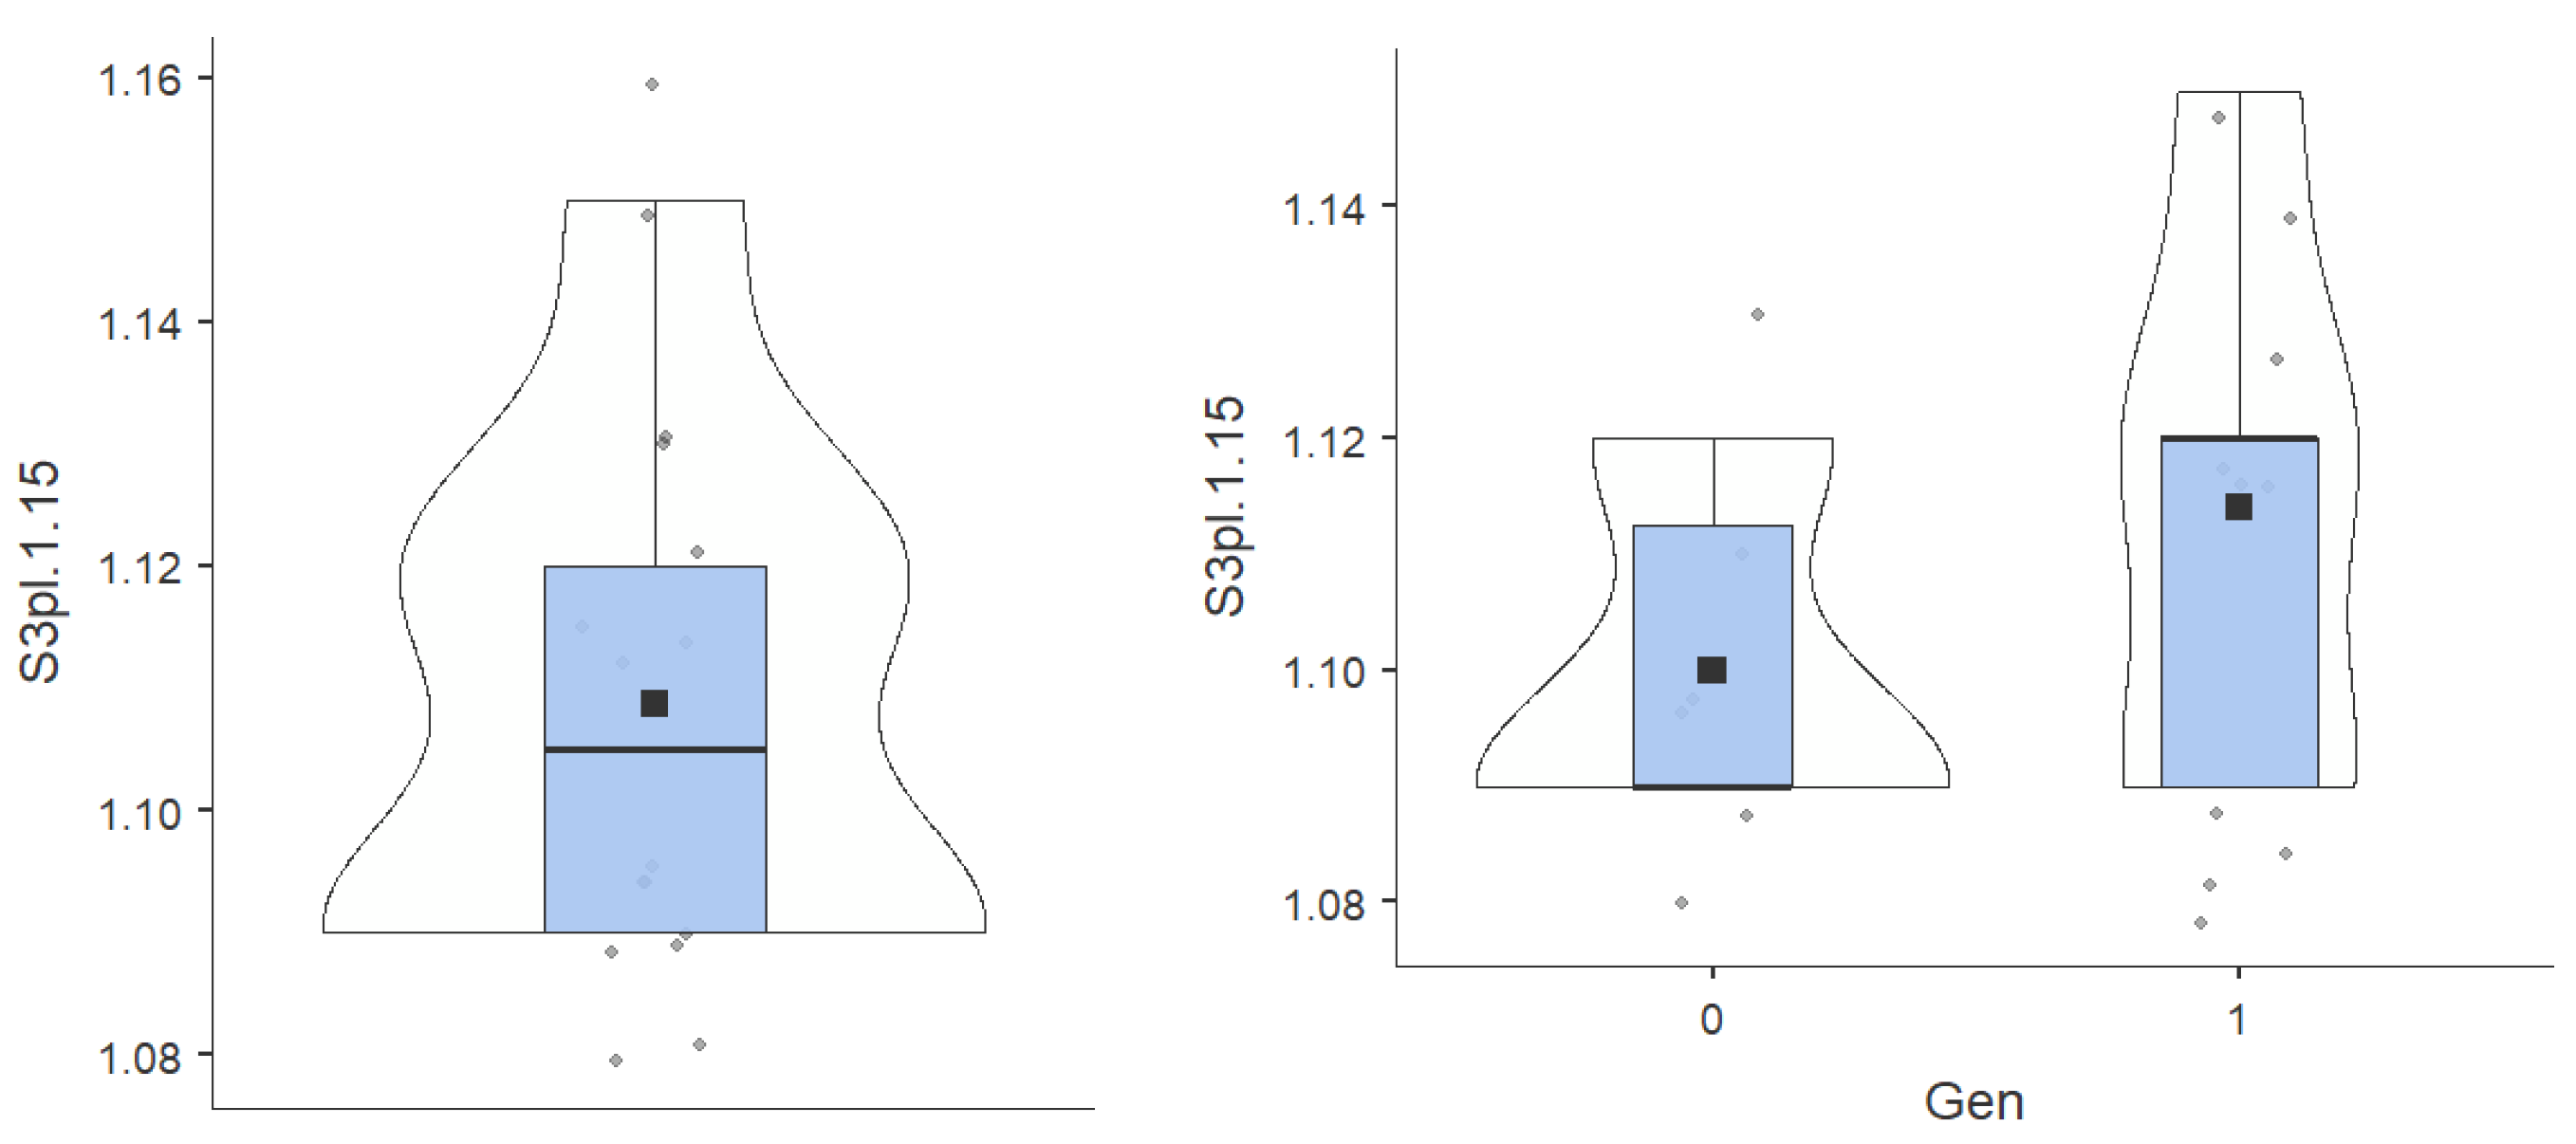
Figure 8.
Week 4 8x50 pic S/ pl.1.15.
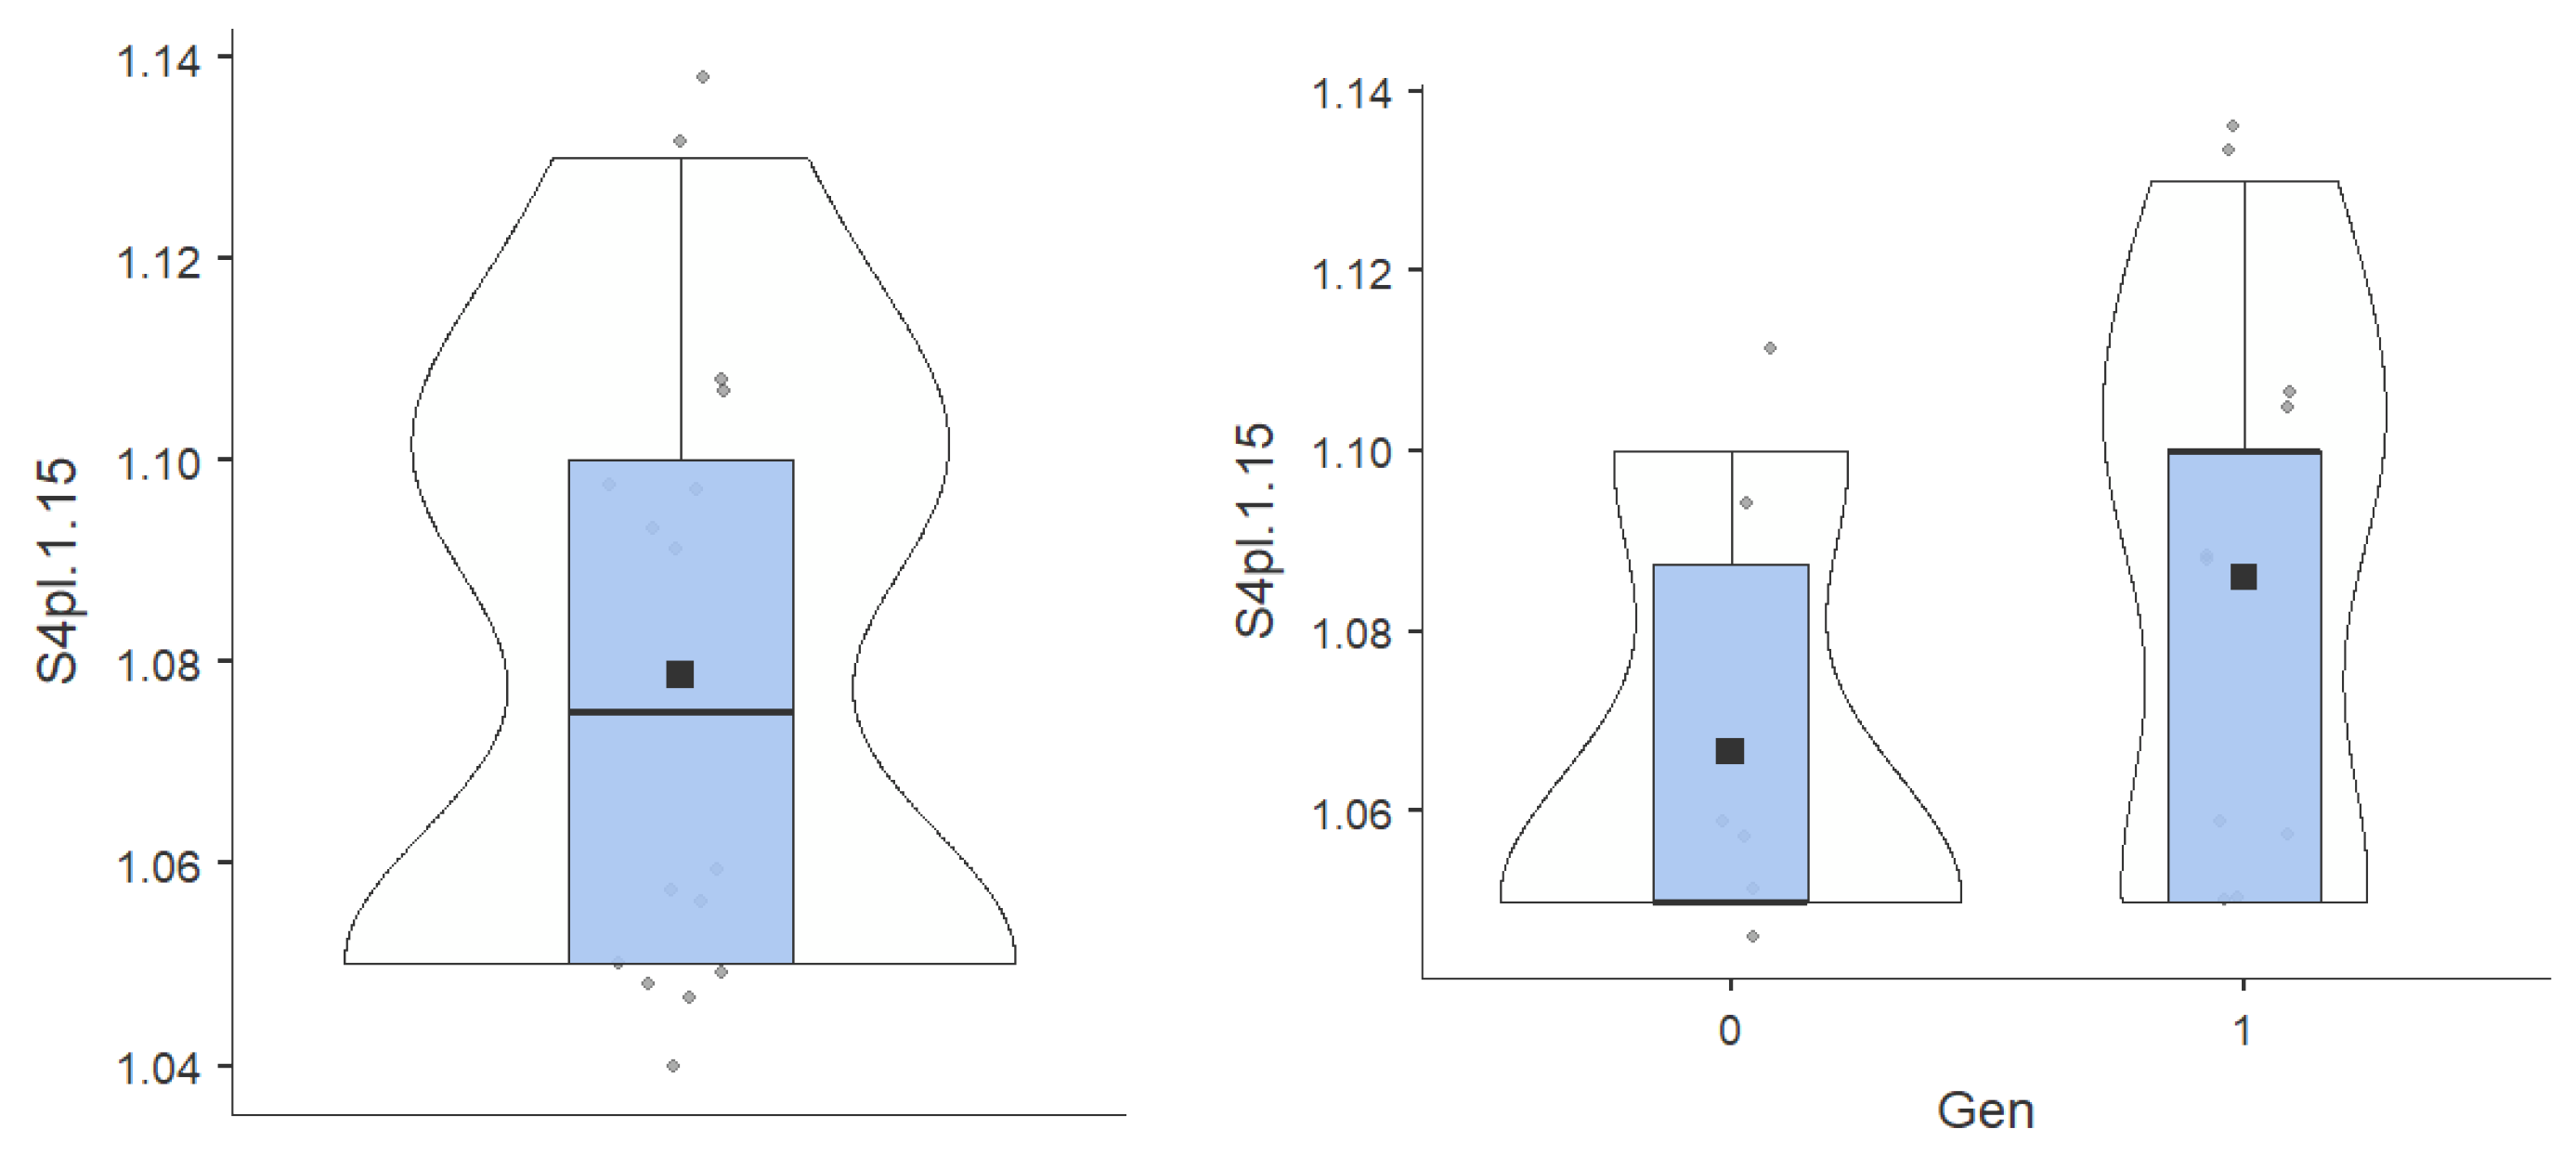
Figure 9.
Week 5 8x50 pic S/ pl.1.10.
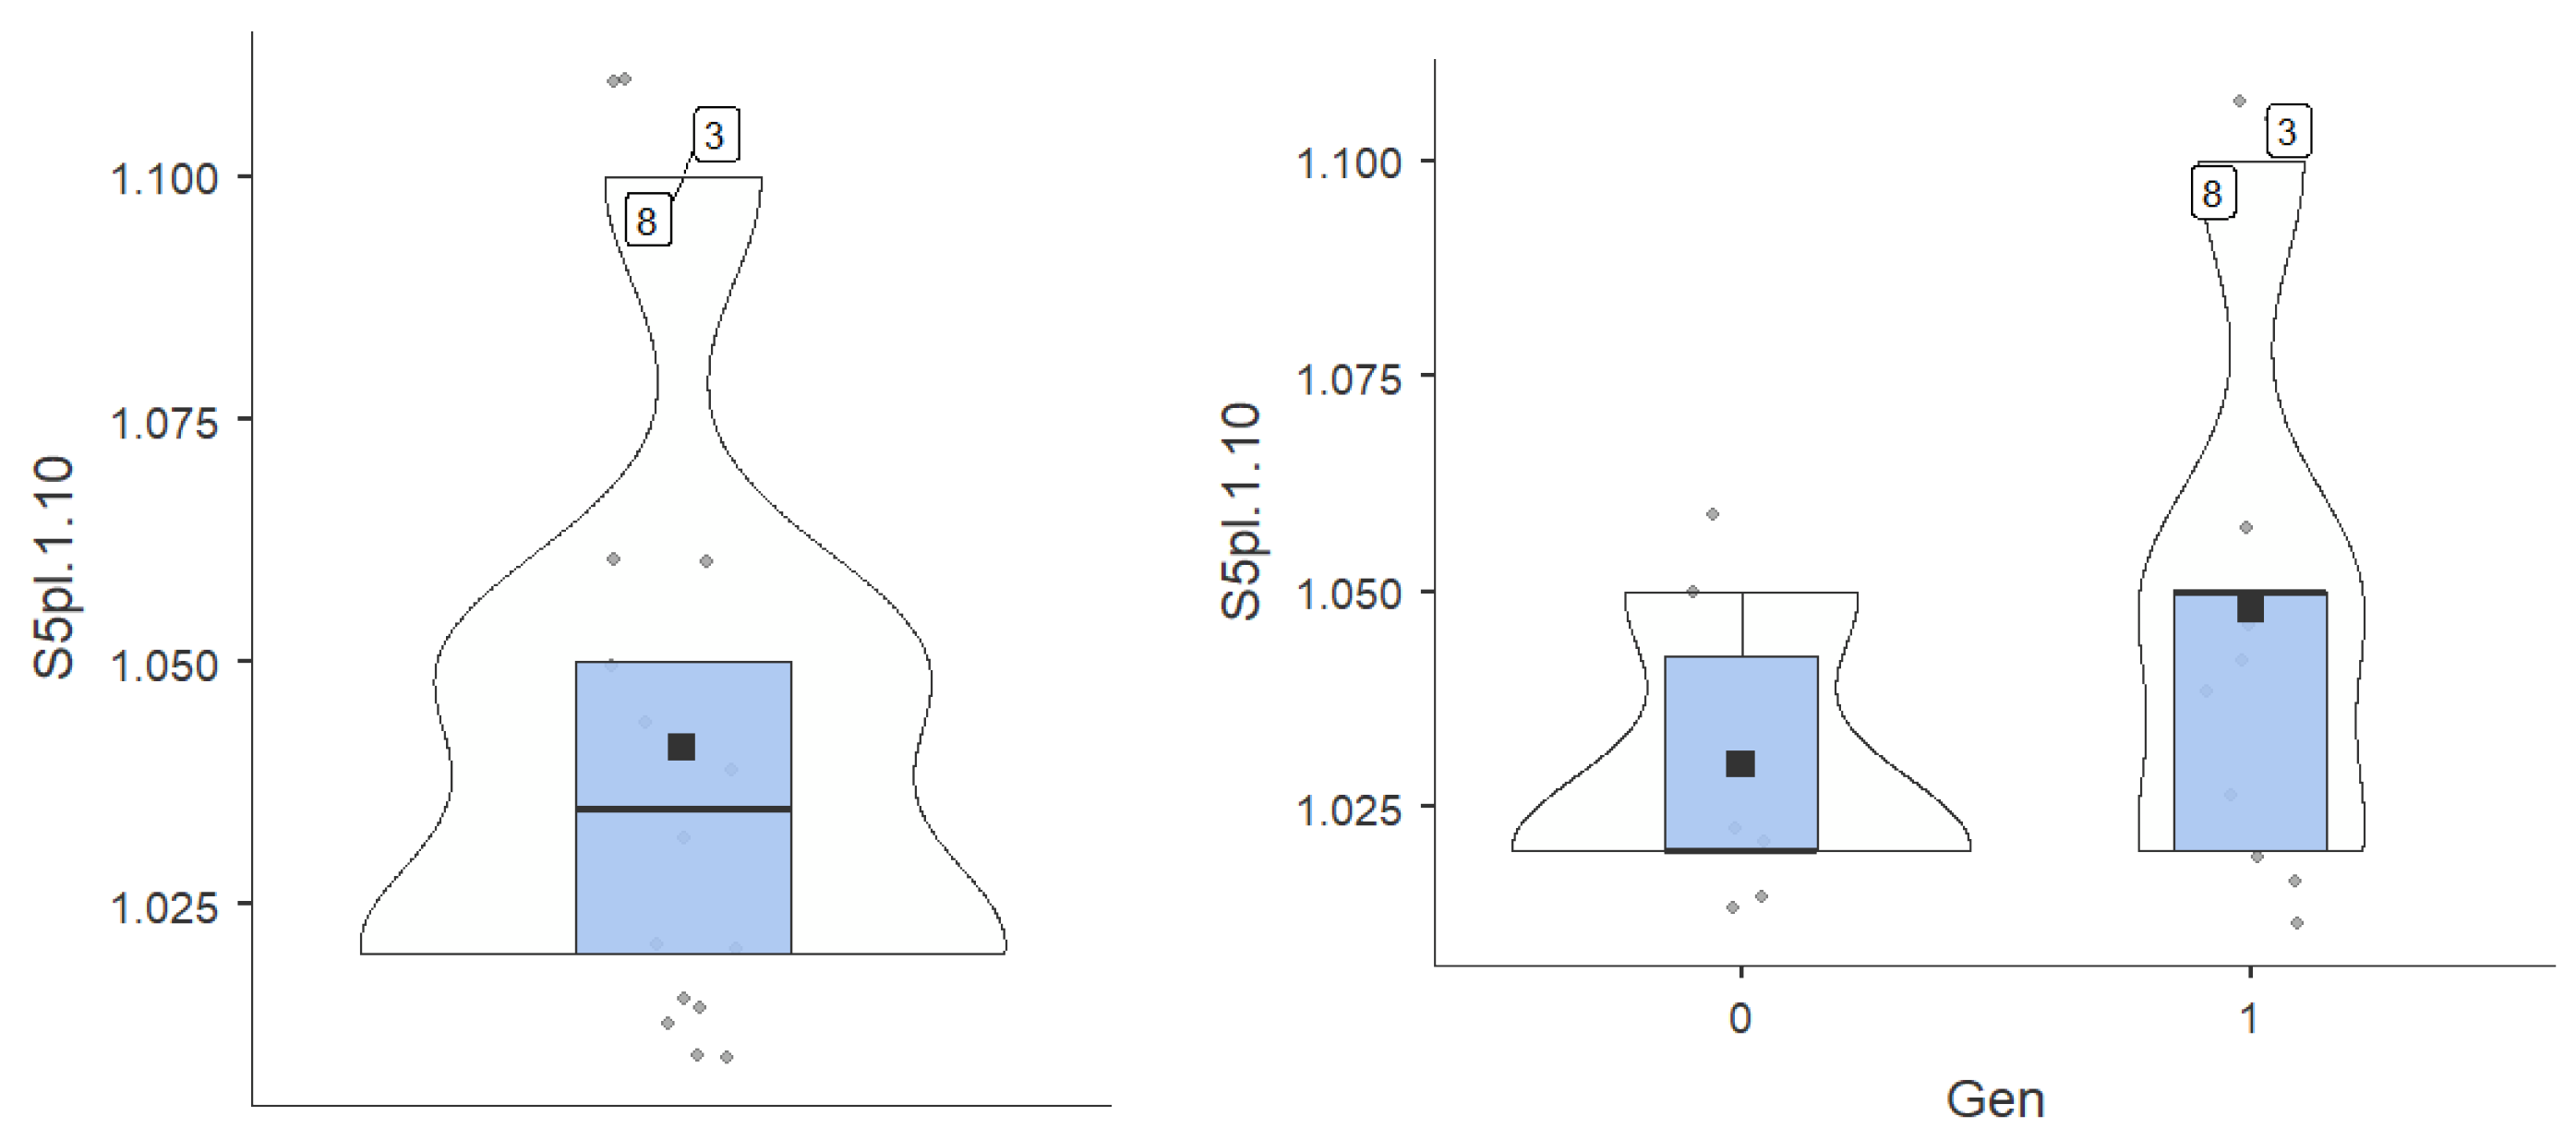
Figure 10.
Week 6 8x50 pic S/ pl.1.10.
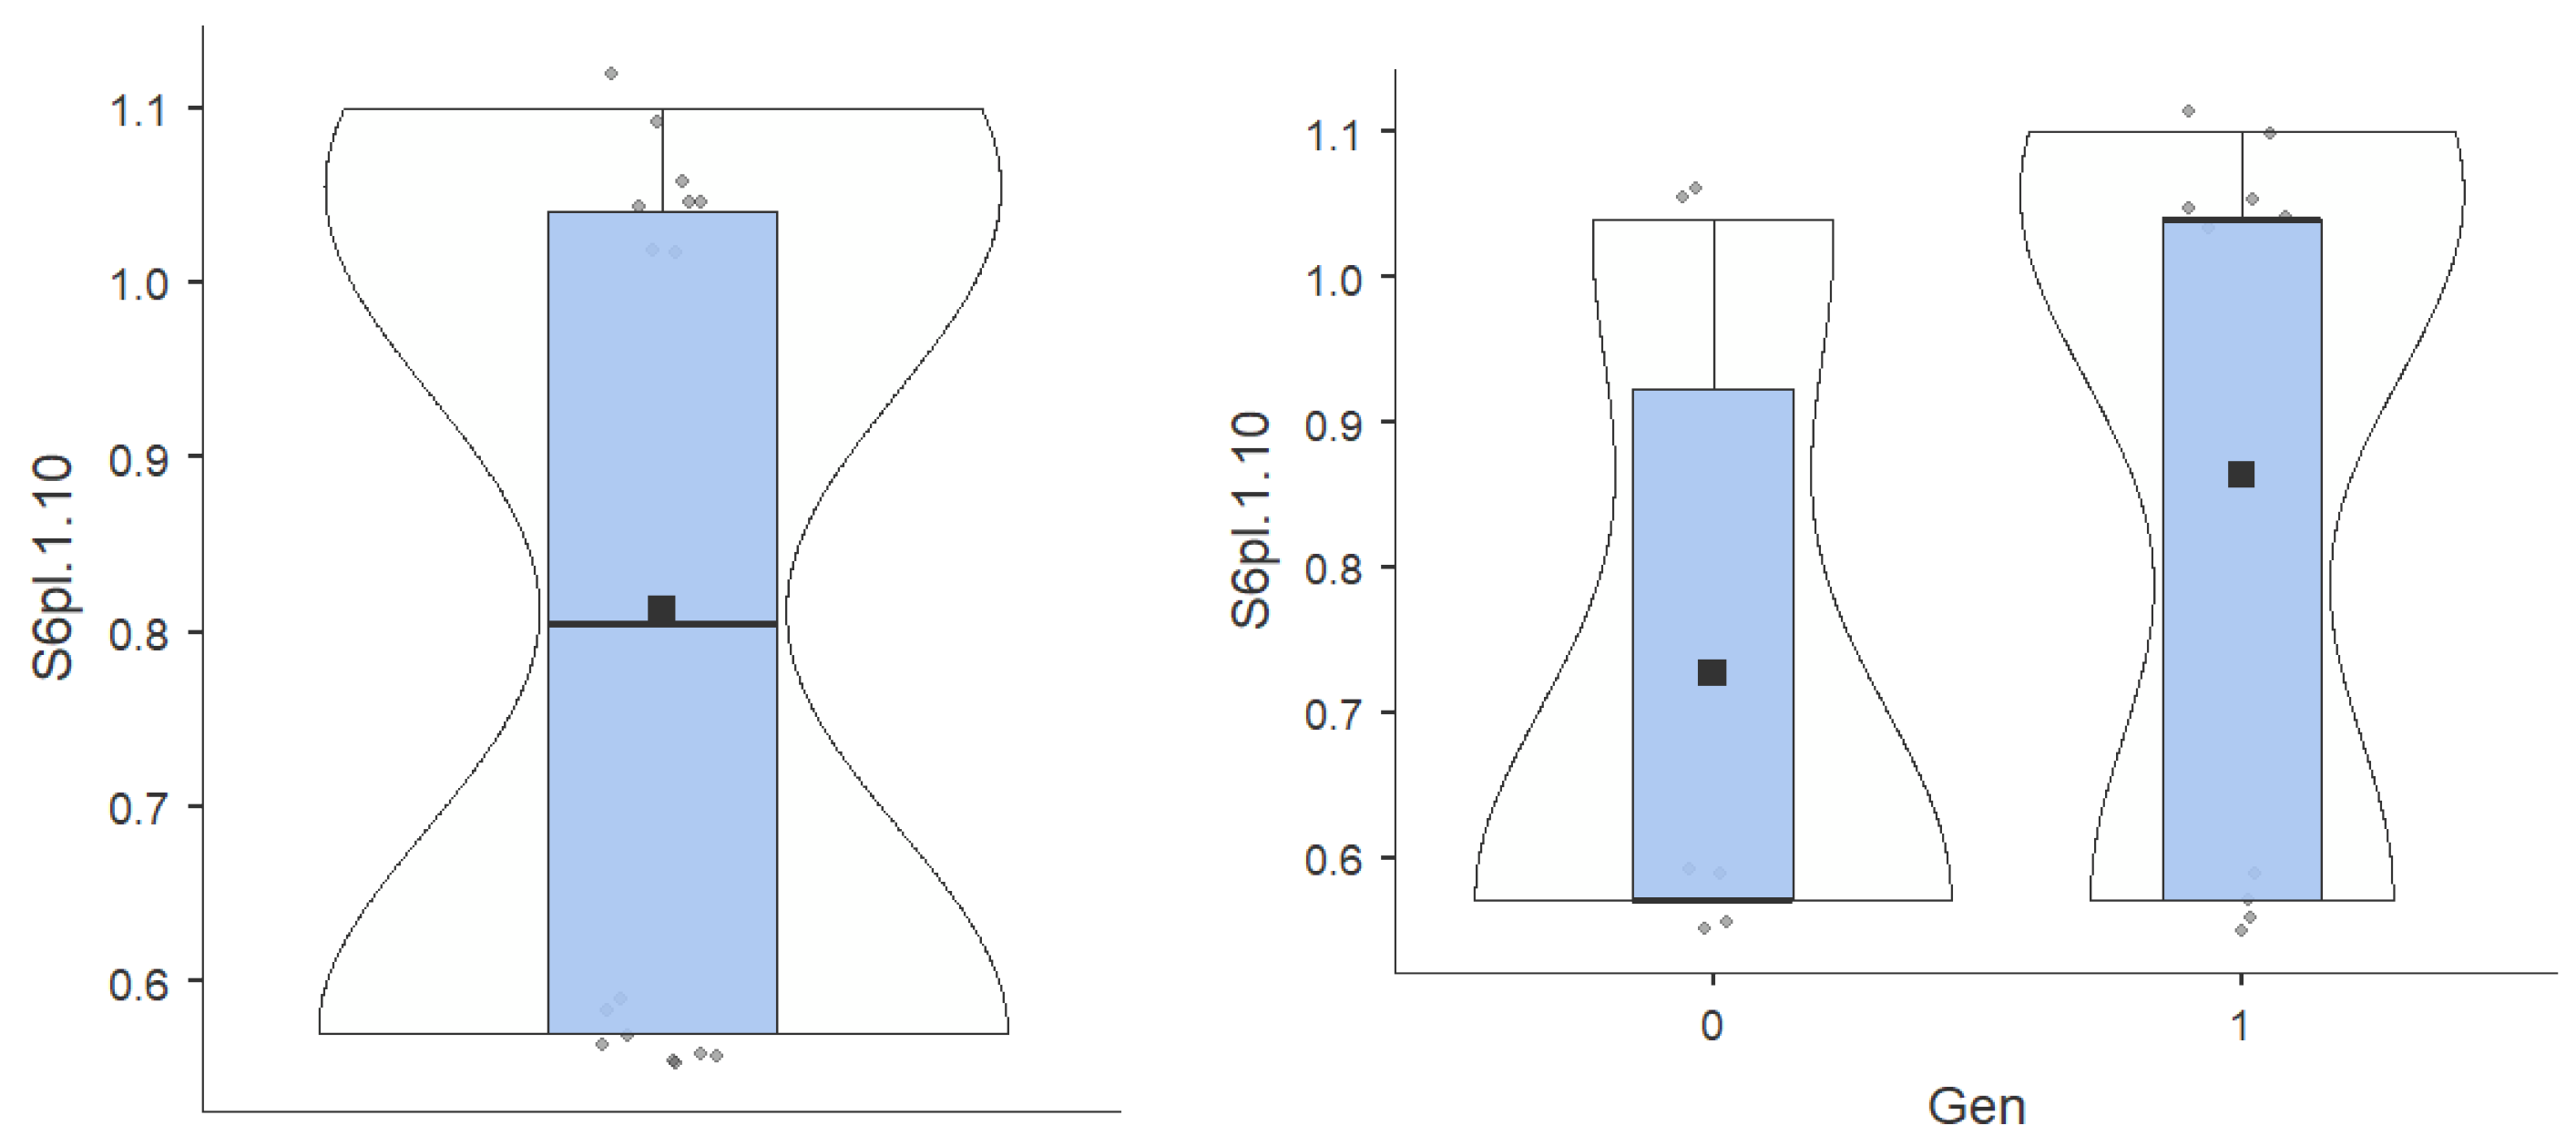

Table 1.
Descriptive statistics.
| Descriptives | Gen | TI50m | TF50m | TI100m | TF100m | S1pl.1.20 | S2pl.1.20 | S3pl.1.15 | S4pl.1.15 | S5pl.1.10 | S6pl.1.10 |
| N | 16 | 16 | 16 | 16 | 16 | 16 | 16 | 16 | 16 | 16 | 16 |
| Missing | 0 | 0 | 0 | 0 | 0 | 0 | 0 | 0 | 0 | 0 | 0 |
| Mean | 37.7 | 36 | 1762 | 1671 | 1.16 | 1.13 | 1.11 | 1.08 | 1.04 | 0.813 | |
| Median | 37.4 | 36.1 | 1738 | 1617 | 1.16 | 1.13 | 1.1 | 1.08 | 1.04 | 0.805 | |
| Standard deviation | 3.06 | 2.69 | 418 | 419 | 0.0171 | 0.0171 | 0.0216 | 0.0312 | 0.027 | 0.251 | |
| Range | 9.09 | 8.14 | 1144 | 1160 | 0.05 | 0.05 | 0.06 | 0.08 | 0.08 | 0.53 | |
| Minimum | 34.1 | 32.2 | 1215 | 1157 | 1.15 | 1.12 | 1.09 | 1.05 | 1.02 | 0.57 | |
| Maximum | 43.2 | 40.3 | 2359 | 2317 | 1.2 | 1.17 | 1.15 | 1.13 | 1.1 | 1.1 | |
| Skewness | 0.667 | 0.371 | 0.019 | 0.181 | 1.16 | 1.16 | 0.731 | 0.344 | 1.28 | 0.0197 | |
| Std. error skewness | 0.564 | 0.564 | 0.564 | 0.564 | 0.564 | 0.564 | 0.564 | 0.564 | 0.564 | 0.564 | |
| Kurtosis | -0.57 | -0.784 | -1.39 | -1.33 | 0.682 | 0.682 | -0.541 | -1.55 | 1.04 | -2.27 | |
| Std. error kurtosis | 1.09 | 1.09 | 1.09 | 1.09 | 1.09 | 1.09 | 1.09 | 1.09 | 1.09 | 1.09 | |
| Shapiro-Wilk W | 0.9 | 0.92 | 0.895 | 0.897 | 0.747 | 0.747 | 0.768 | 0.761 | 0.736 | 0.684 | |
| Shapiro-Wilk p | 0.082 | 0.167 | 0.068 | 0.072 | < .001 | < .001 | 0.001 | < .001 | < .001 | < .001 |
Table 2.
Correlation between variables.
| Spearman's rho | TI50m | TF50m | TI100m | TF100m | S1pl.1.20 | S2pl.1.20 | S3pl.1.15 | S4pl.1.15 | S5pl.1.10 | S6pl.1.10 | Gen | |
| TI50m | Rho | — | ||||||||||
| p-value | — | |||||||||||
| TF50m | Rho | 0.947 | — | |||||||||
| p-value | <.001*** | — | ||||||||||
| TI100m | Rho | 0.829 | 0.835 | — | ||||||||
| p-value | <.001*** | <.001*** | — | |||||||||
| TF100m | Rho | 0.821 | 0.835 | 0.965 | — | |||||||
| p-value | <.001*** | <.001*** | <.001*** | — | ||||||||
| S1pl.1.20 | Rho | 0.366 | 0.402 | 0.486 | 0.577 | — | ||||||
| p-value | 0.163 | 0.123 | 0.056 | 0.019 | — | |||||||
| S2pl.1.20 | Rho | 0.366 | 0.402 | 0.486 | 0.577 | 1*** | — | |||||
| p-value | 0.163 | 0.123 | 0.056 | 0.019 | <.001 | — | ||||||
| S3pl.1.15 | Rho | 0.366 | 0.402 | 0.486 | 0.577 | 1*** | 1*** | — | ||||
| p-value | 0.163 | 0.123 | 0.056 | 0.019 | <.001 | <.001 | — | |||||
| S4pl.1.15 | Rho | 0.366 | 0.402 | 0.486 | 0.577 | 1*** | 1*** | 1*** | — | |||
| p-value | 0.163 | 0.123 | 0.056 | 0.019 | <.001 | <.001 | <.001 | — | ||||
| S5pl.1.10 | Rho | 0.366 | 0.402 | 0.486 | 0.577 | 1*** | 1*** | 1*** | 1*** | — | ||
| p-value | 0.163 | 0.123 | 0.056 | 0.019 | <.001 | <.001 | <.001 | <.001 | — | |||
| S6pl.1.10 | Rho | 0.366 | 0.402 | 0.486 | 0.577 | 1*** | 1*** | 1*** | 1*** | 1*** | — | |
| p-value | 0.163 | 0.123 | 0.056 | 0.019 | <.001 | <.001 | <.001 | <.001 | <.001 | — | ||
| Gen | Rho | -0.616 | -0.588 | -0.392 | -0.392 | 0.31 | 0.31 | 0.31 | 0.31 | 0.31 | 0.31 | — |
| p-value | 0.011 | 0.017 | 0.133 | 0.133 | 0.25 | 0.25 | 0.25 | 0.25 | 0.25 | 0.25 | — | |
Green = strong positive correlation (R >0.7); Yellow = average positive or negative correlation (0.5<R<0.7 or - 0.7<R<-0.5); Red = small positive or negative correlation (0.3<R<0.5 or - 0.5<R<-0.3).
Table 3.
Results of leg tests.
| No | Subject | Sex | Class | Age | Initial testing/ 50 m freestyle 11.01.2023 | Final testing/ 50 m freestyle 22.02.2023 | Initial testing/ 100 m freestyle 12.01.2023 | Final testing/ 100 m freestyle 23.02.2023 | Week 1 8x50 pic S/ pl.1.20 | Week 2 8x50 pic S/ pl.1.20 | Week 3 8x50 pic S/ pl.1.15 | Week 4 8x50 pic S/ pl.1.15 | Week 5 8x50 pic S/ pl.1.10 | Week 6 8x50 pic S/ pl.1.10 |
| 1 | A.G. | F | 6 | 13 | 38,86 | 36,72 | 1'21''83 | 1'20''23 | 1.14-1.15 | 1.10-1.12 | 1.07-1.09 | 1.03-1.05 | 1.00-1.02 | 0.55-0.57 |
| A.A. | M | 6 | 13 | 34,92 | 33,24 | 1'14''27 | 1'13''73 | 1.15-1.17 | 1.13-1.14 | 1.11-1.12 | 1.09-1.10 | 1.04-1.05 | 1,04 | |
| A.N. | M | 6 | 13 | 43,16 | 40,26 | 1'32''06 | 1'30''59 | 1.18-1.20 | 1.16-1.17 | 1.14-1.15 | 1.11-1.13 | 1,10 | 1,10 | |
| B.S. | F | 6 | 13 | 38,29 | 35,63 | 1'22''13 | 1'20''13 | 1.14-1.15 | 1.10-1.12 | 1.07-1.09 | 1.03-1.05 | 1.00-1.02 | 0.55-0.57 | |
| B.B. | F | 6 | 13 | 42,65 | 40,27 | 1'33''00 | 1'31''97 | 1.15-1.17 | 1.13-1.14 | 1.11-1.12 | 1.09-1.10 | 1.04-1.05 | 1,04 | |
| C.S | F | 6 | 13 | 42,88 | 40,30 | 1'33''19 | 1'31''36 | 1.14-1.15 | 1.10-1.12 | 1.07-1.09 | 1.03-1.05 | 1.00-1.02 | 0.55-0.57 | |
| C.T. | M | 6 | 13 | 34,07 | 32,83 | 1'14''15 | 1'12''87 | 1.14-1.15 | 1.10-1.12 | 1.07-1.09 | 1.03-1.05 | 1.00-1.02 | 0.55-0.57 | |
| C.I. | M | 6 | 13 | 38,17 | 37,32 | 1'23''26 | 1'21''06 | 1.18-1.20 | 1.16-1.17 | 1.14-1.15 | 1.11-1.13 | 1,10 | 1,10 | |
| I.M. | F | 6 | 13 | 39,25 | 36,87 | 1'31''12 | 1'29''49 | 1.15-1.17 | 1.13-1.14 | 1.11-1.12 | 1.09-1.10 | 1.04-1.05 | 1,04 | |
| M.M. | M | 6 | 13 | 34,28 | 32,77 | 1'15''10 | 1'12''92 | 1.14-1.15 | 1.10-1.12 | 1.07-1.09 | 1.03-1.05 | 1.00-1.02 | 0.55-0.57 | |
| M.D. | M | 6 | 13 | 37,59 | 36,51 | 1'26''88 | 1'25''68 | 1.15-1.17 | 1.13-1.14 | 1.11-1.12 | 1.09-1.10 | 1.04-1.05 | 1,04 | |
| N.A. | M | 6 | 13 | 35,32 | 33,87 | 1'15''16 | 1'12''77 | 1.14-1.15 | 1.10-1.12 | 1.07-1.09 | 1.03-1.05 | 1.00-1.02 | 0.55-0.57 | |
| P.S. | M | 6 | 13 | 34,18 | 32,16 | 1'15''18 | 1'13''55 | 1.14-1.15 | 1.10-1.12 | 1.07-1.09 | 1.03-1.05 | 1.00-1.02 | 0.55-0.57 | |
| S.A. | M | 6 | 13 | 35,98 | 34,58 | 1'24''20 | 1'22'10 | 1.15-1.17 | 1.13-1.14 | 1.11-1.12 | 1.09-1.10 | 1.04-1.05 | 1,04 | |
| S.D. | M | 6 | 13 | 36,49 | 35,47 | 1'26''93 | 1'25''28 | 1.15-1.17 | 1.13-1.14 | 1.11-1.12 | 1.09-1.10 | 1.04-1.05 | 1,04 | |
| B.D. | F | 6 | 13 | 37,24 | 36,61 | 1'22''29 | 1'20''48 | 1.14-1.15 | 1.10-1.12 | 1.07-1.09 | 1.03-1.05 | 1.00-1.02 | 0.55-0.57 |
Disclaimer/Publisher’s Note: The statements, opinions and data contained in all publications are solely those of the individual author(s) and contributor(s) and not of MDPI and/or the editor(s). MDPI and/or the editor(s) disclaim responsibility for any injury to people or property resulting from any ideas, methods, instructions or products referred to in the content. |
© 2025 by the authors. Licensee MDPI, Basel, Switzerland. This article is an open access article distributed under the terms and conditions of the Creative Commons Attribution (CC BY) license (http://creativecommons.org/licenses/by/4.0/).
Copyright: This open access article is published under a Creative Commons CC BY 4.0 license, which permit the free download, distribution, and reuse, provided that the author and preprint are cited in any reuse.


