
Submitted:
15 September 2025
Posted:
15 September 2025
You are already at the latest version
Abstract
Kunzea ericoides (kanuka), a native plant of New Zealand has a significant role in traditional medicine due to the presence of essential oils. Apart from these oils, this plant also is a source of many bioactive compounds, majority of which are polyphenols. However, there is lack of sufficient data supporting the extraction of polyphenols from kanuka plant leaves and investigating its bioactivity and phytochemical proper-ties. The study aims to extract polyphenols from kanuka plant leaves with convention-al solvent-based method and determining the phytochemical analysis as well as bioactive potential. Extraction was done with methanol and acetone as solvents. Polyphenolic prolife was analyzed with LC-MS. Bioactive analysis of kanuka leaf extract was carried out to determine total phenolic content and antioxidant activity. Investigated the cytotoxic effect of kanuka leaf extract on two triple negative breast cancer cells; MDA-MB-231 and BT-549. LC-MS analysis confirmed kanuka leaf extract is a source of many polyphenols, some giving very prominent signals on TIC scan. Ten polyphenolic compounds were confirmed to be present in kanuka leaf extract based on MRM analysis. FRAP-CUPRAC analysis indicated significant antioxidant activity in the kanuka leaf extract. Antiproliferative analysis has confirmed cytotoxicity of the kanuka leaf extract on the triple negative breast cancer cell lines. This study indicates that Kunzea ericoides leaf extract, rich in polyphenols, shows promising antioxidant and antiproliferative potential, warranting further investigation for therapeutic applications.
Keywords:
Kanuka
; Total Phenolic Content
; Antiproliferative activity
; Antioxidant activity
; Triple negative breast cancer
; LC-MS
1. Introduction
Kunzea ericoides, commonly called kanuka, is a native New Zealand plant that belongs Myrtaceae family. It plays a vital role in traditional Māori medicine because known phytochemical and therapeutic properties. Studies confirmed that the essential oil of kanuka contains alpha-pinene and 1,8-cineole, which have strong anti-inflammatory properties[1]. The terpenes present in kanuka have antibacterial and antifungal activity, making it useful in skin conditions like acne, eczema, fungal infection and wound healing[2]. Kanuka oil has also been traditionally used in aromatherapy as the volatile terpenes promotes mind relaxation and steam inhalation of kanuka leaves ease respiratory discomfort[3]. Although kanuka is traditionally known for a range of benefits due to its essential oils, modern research has grown interest in the polyphenolic content present in this plant. Polyphenols are the secondary metabolites present mainly in the leaves and bark of plants and exhibit antioxidant, anti-inflammatory and anti-cancerous properties[4]. Most common polyphenols present in kanuka are flavonoids, phenolic acids and tannins[5].
Amongst various plant parts (stem, flowers, roots, bark and fruits), leaves are identified as rich and accessible source of polyphenolic compounds[6]. Due to the role of leaves in photosynthesis and defense, numerous studies have confirmed that leaves have higher accumulation of polyphenolics like flavonoids and hydroxycinnamic acids in comparison to stems or roots[7,8] found highest antioxidant activity in leaf extracts, correlating with high flavonoid content in multiple New Zealand medicinal plants. Among various extraction techniques, conventional methods have remained fundamental in both scientific research and industrial settings due to their ease of use, affordability, and effectiveness, particularly when working with polyphenol-rich plant parts like leaves[9]. Maceration, which involves immersing finely ground or powdered plant material in an appropriate solvent is one of the oldest extraction practices, is extensively utilized for isolating heat-sensitive phytochemicals. This technique allows polyphenols to diffuse into the solvent without applying high temperatures, thus preserving their integrity[6]. For polyphenol extraction, aqueous methanol in concentrations between 50–80% is particularly favored for its ability to extract both water-soluble and slightly lipophilic constituents[10]. Given the thermal sensitivity and oxidative susceptibility of many polyphenols, maceration is especially beneficial, offering a gentle extraction environment that maintains the structural integrity and bioactivity of these compounds.
Although, plethora of studies have suggested potential role of oils present in kanuka plant[11], but no major research is done to explore the functional role of phytochemicals present in kanuka plant. No data is available investigating specifically the extraction of polyphenolics from kanuka leaves using conventional methods and analyzing polyphenolic profile with LC-MS and further investigating the total phenolic content, antioxidant activity as well as antiproliferative property of the kanuka leaf extract on triple negative breast cancer (TNBC) cells.
This study aims to extract the polyphenolics from kanuka leaves obtained in spring season (around September month) from the plant grown in Gisborne region of North Island, New Zealand. Two maceration-based extraction methods were compared; method 1 with Acetone containing 1 mg/L tetrabromophenyl porphyrin (TBP) and method 2 with 50% Methanol (diluted with Milli-Q water). The total phenolic content (TPC) in the extract was analysed by treating the powdered, lyophilized kanuka leaves sample with 50% Methanol (Me-OH) and 70% Acetone were determined. Same extracts were further analysed for antioxidant activity by FRAP-CUPRAC method. The LC-MS analysis was carried out to determine the polyphenolic profile of the kanuka leaf extract. The cytotoxic property of different concentrations of kanuka leaf extract on triple-negative breast cancer cell lines was analysed with tetrazolium dye.
2. Materials and Methods
2.1. Equipment
Lyophilization of the kanuka plant leaves was acquired by freeze dryer (CHRIST LOC 1m, Martin Christ, Germany). Concentrate of leaf extract was prepared by vacuum concentrator (Concentrator plus, Eppendorf, Auckland New, Zealand). UV- spectrophotometer (Genesys 150-thermo scientific, Auckland, New Zealand) was used to record absorbance of the samples after biochemical analysis. LC-MS analysis was conducted using an Agilent 1260 Infinity Quaternary LC System (Santa Clara, CA 95051 USA). Tecan Spark® Multimode Microplate Reader (Switzerland) was used to measure absorbance of samples from 96-well plate.
2.2. Chemicals and Reagents
The chemicals and reagents used for the analysis were AnalaR grade or better. Dimethyl sulfoxide (DMSO), gallic acid, Folin–Ciocalteu reagent, neocuporine, copper (II) chloride, 2,4,6-tris(2-pyridyl)-s-triazine (TPTZ), Trolox (6-hydroxy-2,5,7,8-tetramethylchromane-2-carboxylic acid), and sodium carbonate were purchased from Sigma-Aldrich (New Zealand). Methanol and acetone were obtained from Thermo Fisher Scientific (New Zealand). MTT [3-(4,5-dimethylthiazol-2-yl)-2,5-diphenyltetrazolium bromide] was supplied by Sigma-Aldrich (St. Louis, MO, USA).
Analytical-grade standards of polyphenols—namely gallic acid, p-coumaric acid, epicatechin, caffeic acid, catechin, quinic acid, and quercetin—were also procured from Sigma-Aldrich (New Zealand). Additional reference standards including kaempferol rutinoside, chlorogenic acid, and pinocembrin were obtained from Phyproff® Reference Substance.
Stock solutions of all pure phenolic compounds were prepared in DMSO at a concentration of 1 mg/ml and stored at –20 °C. Working solutions were freshly prepared in methanol by serial dilution, starting from 50 µg/ml of each stock solution to generate eight serial concentrations.
2.3. Plant Material
Kanuka plant leaves and stalks were collected in early spring (September month) from the plants grown in Gisborne, New Zealand. The plant material was thankfully gifted by Mr Alex Radley.
2.4. Cell Culture and Maintenance
The human breast cancer cell lines, MDA-MB-231 and BT-549 were procured from the American Type Culture Collection (ATCC, Manassas, VA, USA). Cell lines were cultured in DMEM medium supplemented with 10% (v/v) FBS and 2 mmol/L L-glutamine in a humidified atmosphere of 5% CO2 at 37⁰C. These cell lines were maintained for further research by splitting them 24-48 hours periodically.
2.5. Lyophilization/Freeze-Drying
Leaves were ground into powder form using a pestle & mortar lowering particle size to increase surface area of contact between the sample and the solvent used for extraction. Collected powder was stored at -20⁰. For lyophilization, freeze dryer (CHRIST LOC 1m, Martin Christ) was pre-cooled to -80°C and the samples of frozen kanuka leaf powder were freeze-dried for 48 hours. Care was taken to begin freeze drying as soon as possible with the frozen samples to avoid thawing. As the freeze-drying ended, the samples were immediately stored at -20°C to prevent rehydration.
2.6. Maceration-Based Extraction of Polyphenols from Kanuka Leaf Powder
Maceration is an extraction procedure in which plant part is soaked in the solvent for a specific period. To extract polyphenols from the kanuka leaves, two maceration-based solvent extraction methods were employed following the method described by Tung Diep[12] with some modifications.
2.6.1. Method 1: Using Acetone with 1% Tetrabromophenyl Porphyrin (TBP) as Solvent
To a mass of 50 mg of freeze-dried and powdered kanuka leaves, 1 ml of 70% acetone containing 1 mg/L tetrabromophenyl porphyrin (TBP) was added. After brief vortex, the mixture was incubated in dark at 4°C for 5 minutes and centrifuged at 4,000 RCF for 5 minutes at 4°C. The pellet was discarded, and supernatant was placed in an amber 1.8ml glass vial and stored at -20°C until further analysis.
2.6.2. Method 2: Using Methanol as Solvent
The extraction of polyphenols from Kanuka plant leaf powder was carried out using 50% methanol. A 50 mg of freeze-dried powdered kanuka leaf sample was mixed with 1 ml of 50% methanol. The mixture was homogenized and incubated in the dark at 4 °C for 30 min, with vortexing for 30 seconds every 5–10 min. Following incubation, the samples were centrifuged at 10,000 RCF for 10 min at 4 °C to induce phase separation. The resulting supernatant was collected into a fresh tube and concentrated using a vacuum concentrator (Concentrator Plus, Eppendorf) set to concentrator mode with solvent type alcohol (V-AL). The concentrated extracts were then transferred into 1.8 ml amber glass vials and stored at –20 °C until analysis.
2.7. Total Phenolic Content (TPC) Analysis
To compare the phenolic content in samples obtained by using methanol and acetone as solvents, Total Phenolic Content identification assay was carried following the method of Dorman[13] with some modifications.
2.7.1. Standard Preparation
Gallic acid, a phenolic compound was used to prepare a reference standard curve. A gallic acid stock solution (1 mg/ml) was prepared by dissolving 10 mg of gallic acid crystals in 10 ml of distilled water. From this stock, five working concentrations (800–50 mg/L) were obtained by serial dilution using Milli-Q water.
2.7.2. Sample Preparation and Analysis
0.1 g of freeze-dried kanuka leaf powder was placed in a 15 ml centrifuge tube and mixed with 4 ml of 50% methanol. The sample mixture was vortexed, homogenized, and left to stand at room temperature for 1 h. It was then centrifuged at 1500 rpm for 15 min, and the supernatant was transferred into a 10 ml volumetric flask. In a separate 15 ml centrifuge tube, 0.1 g of powdered kanuka leaf sample was extracted with 4 ml of 70% acetone, followed by homogenization, incubation (1 h at room temperature), and centrifugation under the same conditions. The resulting supernatant was collected in another 10 ml volumetric flask. Both flasks were then made up to volume with deionized water. From each extract, 1 ml was transferred into microcentrifuge tubes for further analysis.
For calibration, 1 ml aliquots from each of the five gallic acid dilutions (50–800 mg/L) and 1 ml of sample extracts were placed in separate microcentrifuge tubes. To each tube, 500 µL of Folin–Ciocalteu reagent was added, vortexed for 30 seconds, and incubated in the dark at room temperature for 5 min. Subsequently, 750 µL of 10% sodium carbonate (Na₂CO₃) was added, and the tubes were kept covered in the dark for 30 min.
Absorbance was measured at 765 nm using a UV–Vis spectrophotometer (Genesys 150, Thermo Fisher Scientific) against a blank prepared with distilled water following the same procedure. Results were quantified using a gallic acid calibration curve and expressed as milligrams of gallic acid equivalents per gram of dry weight (mg GAE/g DW).
2.8. Antioxidant Activity of Kanuka Leaf Extract
2.8.1. Ferric Reducing Ability of Plasma (FRAP) Assay
The FRAP assay was performed based on the method described by Benzie and Strain[14], with minor modifications. Kanuka leaf extracts were prepared using 50% methanol and 70% acetone. The FRAP reagent was freshly prepared in a 1:1:10 (v/v/v) ratio by mixing 20 mM ferric chloride, 10 mM TPTZ (prepared in 40 mM hydrochloric acid), and 300 mM acetate buffer (pH 3.6). For the assay, 1 ml of kanuka leaf extract was diluted with 9 ml of Milli-Q water to serve as the sample solution. A total of 2 ml of FRAP reagent was then added to 1 ml of the diluted sample. The blank was prepared by replacing the extract with Milli-Q water.
Both sample and blank solutions were vortexed for 30 seconds and incubated at room temperature for 5 min. Absorbance was measured at 593 nm using a UV–visible spectrophotometer (Genesys 150, Thermo Fisher Scientific). Antioxidant capacity was determined using a Trolox calibration curve (5–160 mg/L) and expressed as micromoles of Trolox equivalent antioxidant capacity per gram of dry weight (µmol TEAC/g DW).
2.8.2. CUPric Reducing Antioxidant Capacity (CUPRAC) Assay
The CUPRAC assay was carried out following the method of Özyürek[15] with slight modifications. The prepared extracts were diluted 100-fold with Milli-Q water prior to analysis. For each assay, 1 ml of the diluted extract was combined with 1 ml of 0.01 M cupric chloride, 1 ml of 1.0 M ammonium acetate buffer (pH 7.0), and 1 ml of 0.0075 M neocuproine in 96% ethanol, resulting in a final reaction volume of 4 ml. The mixtures were incubated at room temperature for 5 min, after which absorbance was measured at 450 nm against a Milli-Q water blank using a UV–visible spectrophotometer (Genesys 150, Thermo Fisher Scientific). Antioxidant activity was quantified using a Trolox calibration curve (10–160 mg/L) and expressed as micromoles of Trolox equivalents per gram of dry weight (µmol TEAC/g DW).
2.9. Cytotoxicity Analysis of Crude Kanuka Plant Extract Obtained Using 50% Methanol Extraction
The effect of kanuka leaf extracts on the viability of TNBC cells; MDA-MB-231 and BT-549 was evaluated using MTT-based assay in 96-well plates. Cells were seeded in microwell plates at a density of 20,000 cells per well and cultured at 37 °C in a humidified atmosphere. After 24 h of incubation, eight concentrations of kanuka leaf extract (0.5–0.004 mg/ml) were prepared by serial dilution from a 50 mg/ml filtered crude extract and applied to the wells. Following an additional 24 h incubation, 12 mM MTT solution was added to each well and incubated for 3–4 h. Formazan crystals were dissolved by adding DMSO to all wells (blank, control, and treatment). Absorbance was recorded at 540 nm with 680 nm as the reference wavelength using a Tecan Spark® Multimode Microplate Reader (Switzerland). Cytotoxicity was determined relative to the untreated control and expressed as percentage cell viability.
2.10. LC-MS Analysis of Kanuka Leaf Extract
LC–MS analysis was performed using an Agilent 1260 Infinity Quaternary LC System (Agilent Technologies, Santa Clara, CA, USA) consisting of a 1260 quaternary pump (model G1311B), 1260 Infinity ALS sampler (model G1329B), 1260 Infinity TCC column compartment (model G1316A), and a 1260 Infinity diode array detector (DAD, model G4212B), coupled to a 6420 triple quadrupole LC-MS system equipped with an electrospray ionization (ESI) source (model G1948B).
Chromatographic separation was carried out on a Phenomenex Kinetex Evo C18 column (2.1 × 150 mm, 1.7 µm). The mobile phases consisted of water with 0.1% (v/v) formic acid (solvent A) and acetonitrile with 0.1% (v/v) formic acid (solvent B). The flow rate was maintained at 0.30 ml/min. The gradient program was as follows: 95:5 (A:B) held for 0.5 min, increased to 15% B from 0.5–2 min, to 20% B from 2–9 min, and to 50% B from 9–11 min (held for 2 min). From 13–14 min, B was further increased to 80% (held for 2 min), then decreased to 5% from 16–17 min. The total run time was 27 min.
Compounds were identified and quantified based on their retention times and mass spectra compared with authentic reference standards. Preliminary results indicated that the retention time of the observed peaks was consistent with the presence of various phenolic compounds. Multiple Reaction Monitoring (MRM) was employed for the detection and quantification of these analytes. The MS ionization source conditions were as follows: capillary voltage of 4 kV, cell accelerator voltage of 7, drying gas temperature of 300 °C, drying gas flow of 10 L/min, nebulizer pressure of 40 psi. Positive and negative scan with scan range from 100-1000 Da were performed for phenolic compound identification in kanuka leaf extract.
2.11. Statistical Analysis
All the experiments were done in triplicates to obtain independent measurements, based on which mean and standard deviation were calculated. P value of <0.05 was considered as statistically significant. Pearson’s correlation coefficient was carried out to determine correlation among total phenolic content and antioxidant assay using FRAP and CUPRAC assays. Data analysis was performed using GraphPad PRISM8 (GraphPad; Dotmatics) software.
3. Results
3.1. Total Phenolic Content (TPC) in Kanuka Leaf Extract
The data for TPC analysis was presented as mg Gallic Acid Equivalent per gram of dry weight. Using the linear equation y= mx + b, concentration of phenolics was calculated in different samples obtained by treating kanuka leaf powder with 50% methanol and 70% acetone. This concentration was equivalent to the mg Gallic Acid Equivalent/L. Calculated Total Phenolic Content in the samples in GAE/mg of dry weight using equation TPC = (c x v)/m, where c is the concentration obtained from the standard curve using linear equation, v is the volume of the extract, and m is the mass of powdered leaf sample in grams.
The TPC of the sample extracted from dried and powdered kanuka leaves using 50% methanol was found to be 1035.34 mg gallic acid equivalents (GAE) per g of dry weight, with a standard deviation of 10.53. In comparison, the TPC of the extract obtained using 70% acetone was 886.91 mg GAE/g dry weight, with a standard deviation of 16.70. These results indicate that the methanolic extract contains higher total phenolic content than the acetone-based kanuka leaf extract.
3.2. Antioxidant Activity of Kanuka Leaf Extract by FRAP and CUPRAC Method
3.2.1. FRAP Assay
Using the linear equation y= mx + b from the Trolox standard curve, calculated µmol Trolox equivalent concentration per liter for each sample. Trolox equivalent antioxidant activity of each sample was calculated as µmol TEAC per gram of dry weight of the sample using equation (x × v × dilution factor)/ dry weight, where x is the concentration obtained from the standard curve using linear equation, v is the total volume of reaction mixture (3ml), dilution factor was 10 and dry weight of sample was 0.1g.
The antioxidant activity of kanuka leaf extracts prepared using 50% methanol and 70% acetone was evaluated and expressed in µmol TEAC per gram of dry weight. The extract obtained with 70% acetone exhibited an antioxidant activity of 202 µmol TEAC/g DW, with a standard deviation of 8.915. In contrast, the extract prepared with 50% methanol showed a significantly higher antioxidant activity of 1054 µmol TEAC/g DW, with a standard deviation of 19.22. This indicates that the methanolic extract possessed approximately five times higher antioxidant capacity than the acetone-based extract.
3.2.2. CUPRAC Assay
Using the linear equation y= mx + b from the Trolox standard curve, calculated µmol Trolox equivalent concentration per liter for each sample and using equation (x × v × dilution factor)/ dry weight, the antioxidant activity was calculated as µmol TEAC/g DW. For CUPRAC assay, volume of the reaction mixture was 4 ml, dilution factor was 100 times and the dry weight of kanuka leaf powder was 0.1 g.
The antioxidant activity of kanuka leaf extracts prepared using 50% methanol and 70% acetone was evaluated and expressed in µmol TEAC per gram of dry weight. The extract obtained with 70% acetone exhibited an antioxidant activity of 573.74 µmol TEAC/g with standard deviation of 34.47 and the extract prepared with 50% methanol showed antioxidant activity of 446 µmol TEAC/g DW with standard deviation of 22.32.
Table 1 shows the summary of FRAP and CUPRAC assay results obtained for both 70% acetone and 50% methanol-based extracts and data is expressed in histograms presented in Figure 1.
3.3.Correlation Between Total Phenolic Content (TPC) and AntioxidantActivity (CUPRAC and FRAP)
Results from Pearson Correlation Coefficient revealed a strong correlation between total phenolic content and antioxidant activity of the kanuka leaf extract (Table 2) showing a linear relationship between both parameters. With a correlation coefficient of 0.845, 50% methanol-based kanuka leaf extract showed a statistically significant positive correlation (TPC-CUPRAC), whereas, with r-value of –0.959, 70% acetone-based kanuka leaf extract showed a negative linear correlation between TPC and antioxidant activity (FRAP assay).
3.4. Cytotoxicity Analysis of Crude Kanuka Leaf Extract on MDA-MB-231 and BT-549 Cell Lines
As per results from TPC analysis of kanuka leaf powder, the 50% methanol-based extraction has higher level of total polyphenolic content. To determine the cytotoxic activity of kanuka leaf extract obtained by using 50% methanol, eight different dilutions of the plant extract were prepared to incubate MDA-MB-231 and BT-549 cell lines. Figure 2 shows the cytotoxic effect of kanuka leaf extract on MDA-MB-231 and BT-549 cells after 24-hour incubation with different serial dilutions of kanuka leaf extract.
The viability of MDA-MB-231 cell line increased with decrease in the concentration of kanuka leaf extract. 50% and higher viability of the TNBC cells were observed above 1:1600 dilution of kanuka extract. The standard deviation values across all samples ranged from 0.599 to 2.368, with an average SD of 1.521. This indicates moderate variability across different replicates. Similar effect of kanuka leaf extract was seen with the BT-549 cell viability. The standard deviation values ranged from 0.831 to 1.849, with a mean of 1.353. The lowest cell viability was observed at 1:100 dilution of kanuka leaf extract, which was 30.12% (SD= 1.024) for MDA-MB-231 cell line and 10.50% (SD= 1.42) for BT-549 cell line respectively.
3.5. LC-MS Analysis of Kanuka Leaf Extract
The kanuka leaf extract obtained by 50% methanol-based method was further tested to determine the polyphenolic profile using LC-MS.
3.5.1. Total Ion Chromatogram Scan
Total Ion Chromatogram (TIC) scan of kanuka leaf extract was carried out in both negative and positive ionization modes. With this scan, individual phenolic compounds present in kanuka extract obtained by 50% methanolic extraction were identified. Figure 3 shows the positive TIC scan of kanuka leaf extract with peaks and retention time for different polyphenols present in the extract.
The individual polyphenol compounds present in the extract were identified using the database of Phenol Explorer. The potential phenolic compounds based on the signal strength present in the kanuka leaf extract are listed in Table 3 and using this data, a heat map was generated (Figure 4) separating tentative compounds based on the signal intensity generated in TIC scan.
3.5.2. Multiple Reaction Monitoring (MRM) Validation for Major Phenolic Compounds
Multiple Reaction Monitoring (MRM) was employed to detect and quantify polyphenols in the kanuka leaf extract. The optimized MRM transitions for the target compounds—including retention time, precursor ion (m/z), product ion (m/z), and collision energy (V)—are summarized in methodology section. Representative chromatograms of standard injections are shown in Figure 5.
4. Discussion
The polyphenols present in leaves of kanuka plant were extracted from the freeze-dried leaf powder using solvent-based technique for extraction. Solvents used for extraction were 50% Me-OH and 70% Acetone with 1% TBP. The present findings revealed that the methanolic extract of the leaf sample exhibited a higher total phenolic content compared to the extract obtained with acetone. This disparity can be attributed to the inherent differences in solvent polarity and solubilization capacity. Methanol, owing to its high polarity, establishes strong hydrogen-bonding interactions with the hydroxyl groups of phenolic compounds, thereby enhancing its capacity to solubilize a wide spectrum of phenolics, including phenolic acids and flavonoid glycosides, which are predominantly polar in nature. Conversely, acetone possesses comparatively lower polarity and is therefore less effective in extracting these highly polar constituents, resulting in reduced TPC values. Moreover, methanol demonstrates superior ability to permeate plant cell matrices, facilitating the release of both free and bound phenolics into the extraction medium. Acetone, while moderately polar, tends to favor the extraction of relatively less polar phytochemicals and thus recovers a smaller fraction of the total phenolics. Collectively, these observations indicate that methanol is a more efficient solvent for the extraction of phenolic compounds from this plant material, primarily due to its favorable polarity and stronger solvent–solute interactions.
The antioxidant potential of both methanol based and acetone based kanuka leaf extracts was determined with FRAP-CUPRAC assays. CUPRAC assay indicated almost 25% higher antioxidant activity in 70% acetone-based kanuka leaf extract, suggesting this solvent extracts more compounds with reducing power. A significantly high antioxidant activity in 50% methanol-based kanuka extract with FRAP assay indicated the polyphenols present in kanuka leaf are fast-reacting, water-soluble and low-pH sensitive antioxidants with higher reducing power. Statistical analysis of the correlation of TPC with antioxidant activity gave a linear relationship between the antioxidant activity of kanuka leaf extract with the total phenolic content. The TIC scan with LC-MS showed prominent signal strength corresponding to (-)-Epigallocatechin, Epicatechin 3’-O-glucuronide, and Quercetin 3’-O-glucuronide. MRM transitions showed presence of 10 polyphenols in kanuka leaf extract.
Since the TPC was higher in the 50% methanol-based extract, this solvent was further employed to determine the cytotoxic activity of kanuka leaf extract on triple negative breast cancer cell lines. The cytotoxicity assay revealed that kanuka leaf extract reduced the viability of triple-negative breast cancer (TNBC) cell lines in a concentration-dependent manner. Below 1:1600 dilution of kanuka leaf extract, the cell viability remained below 50%. This suggests that the extract exhibits measurable cytotoxic effects and a substantial fraction of the TNBC cell population is sensitive to the phytochemicals present in the extract. The observation that cytotoxicity does not increase proportionally beyond certain concentrations because plant extract contains a mixture of bioactive compounds that can have both cytotoxic and protective (antioxidant) properties, leading to non-linear dose–response curves. From a therapeutic perspective, the cytotoxicity of kanuka leaf extract against TNBC is promising and the data provide a rationale for further investigation into its active constituents, potential synergistic interactions with conventional chemotherapy, or its use as an adjuvant to enhance treatment efficacy while possibly reducing drug-associated toxicity.
Author Contributions
Conceptualization, M.Y., Y.L.; methodology, H.D.; investigation, M.Y. and Y.L.; formal analysis, H.D.; investigation, H.D., M.Y., and Y.L.; data curation, M.Y. and Y.L.; supervision, M.Y and Y.L. writing—original draft preparation, H.D.; writing—review and editing, M.Y., Y.L. and H.D. All authors have read and agreed to the published version of the manuscript.
Funding
This research received no external funding.
Institutional Review Board Statement
Not applicable as the study does not involve humans or animals.
Informed Consent Statement
Not applicable.
Data Availability Statement
Data is contained within the article.
Acknowledgments
We are grateful for Mr. Alex Redley for providing plant sample used in this study. We sincerely acknowledge the technical support of Mr. Tony Chen provided for LC-MS analysis of the kanuka leaf extract.
Conflicts of Interest
The authors declare no conflicts of interest.
References
- Porter, N. G.; Wilkins, A. L. Chemical, Physical and Antimicrobial Properties of Essential Oils of Leptospermum Scoparium and Kunzea Ericoides.
- Semprini, A.; Singer, J.; Braithwaite, I.; Shortt, N.; Thayabaran, D.; McConnell, M.; et al. Kanuka honey versus aciclovir for the topical treatment of herpes simplex labialis: A randomised controlled trial. BMJ Open 2019, 9(5). [CrossRef]
- Maddocks-Jennings, W.; Wilkinson, J. M.; Shillington, D.; Cavanagh, H. A fresh look at manuka and kanuka essential oils from New Zealand. International Journal of Aromatherapy 2005, 15(3), 141–146. [CrossRef]
- Ghasemzadeh, A.; Jaafar, H. Z. E.; Rahmat, A. Antioxidant activities, total phenolics and flavonoids content in two varieties of Malaysia young ginger (Zingiber officinale Roscoe). Molecules 2010, 15(6), 4324–4333. [CrossRef]
- He, X.; Li, P.; Zhao, S.; Liu, H.; Tang, W.; Xie, J.; et al. Kunzea Ericoides (Kanuka) Leaf Extracts Show Moisturisation, Antioxidant, and UV Protection Effects in HaCaT Cells and Anti-melanogenesis Effects in B16F10 Cells. Applied Biochemistry and Biotechnology 2024, 196(12), 8892–8906. [CrossRef]
- Dai, J.; Mumper, R. J. Plant phenolics: Extraction, analysis and their antioxidant and anticancer properties. Molecules. October 2010, pp 7313–7352. [CrossRef]
- Tattini, M.; Galardi, C.; Pinelli, P.; Massai, R.; Remorini, D.; Agati, G. Differential accumulation of flavonoids and hydroxycinnamates in leaves of Ligustrum vulgare under excess light and drought stress. New Phytologist 2004, 163(3), 547–561. [CrossRef]
- Chaves, N.; Santiago, A.; Alías, J. C. Quantification of the antioxidant activity of plant extracts: Analysis of sensitivity and hierarchization based on the method used. Antioxidants 2020, 9(1). [CrossRef]
- Pogorzelska-Nowicka, E.; Hanula, M.; Pogorzelski, G. Extraction of polyphenols and essential oils from herbs with green extraction methods – An insightful review. Food Chemistry. Elsevier Ltd December 1, 2024. [CrossRef]
- Ignat, I.; Volf, I.; Popa, V. I. A critical review of methods for characterisation of polyphenolic compounds in fruits and vegetables. Food Chemistry. June 15, 2011, pp 1821–1835. [CrossRef]
- Maddocks, W. A. Diversity in the essential oil of New Zealand grown Kānuka, Kunzea ericoides (A. Rich) Joy Thomps. 2021.
- Diep, T.; Pook, C.; Yoo, M. Phenolic and anthocyanin compounds and antioxidant activity of Tamarillo (Solanum betaceum Cav.). Antioxidants 2020, 9(2). [CrossRef]
- Dorman, H. J. D. K. M. K. K. H. Y. H. R. Antioxidant Properties and Composition of Aqueous Extracts from Mentha Species, Hybrids, Varieties, and Cultivars. American Chemical Society 2003, 51(16), 4563–4569. [CrossRef]
- Benzie, I. F. F.; Strain, J. J. The Ferric Reducing Ability of Plasma (FRAP) as a Measure of “‘Antioxidant Power’”: The FRAP Assay; 1996; Vol. 239.
- Özyürek, M.; Güçlü, K.; Apak, R. The main and modified CUPRAC methods of antioxidant measurement. TrAC - Trends in Analytical Chemistry. April 2011, pp 652–664. [CrossRef]
Figure 1.
Histograms comparing Total Phenolic Content (A) and antioxidant activity; FRAP (B) and CUPRAC (C) assay of methanol and acetone-based kanuka leaf extracts.
Figure 1.
Histograms comparing Total Phenolic Content (A) and antioxidant activity; FRAP (B) and CUPRAC (C) assay of methanol and acetone-based kanuka leaf extracts.
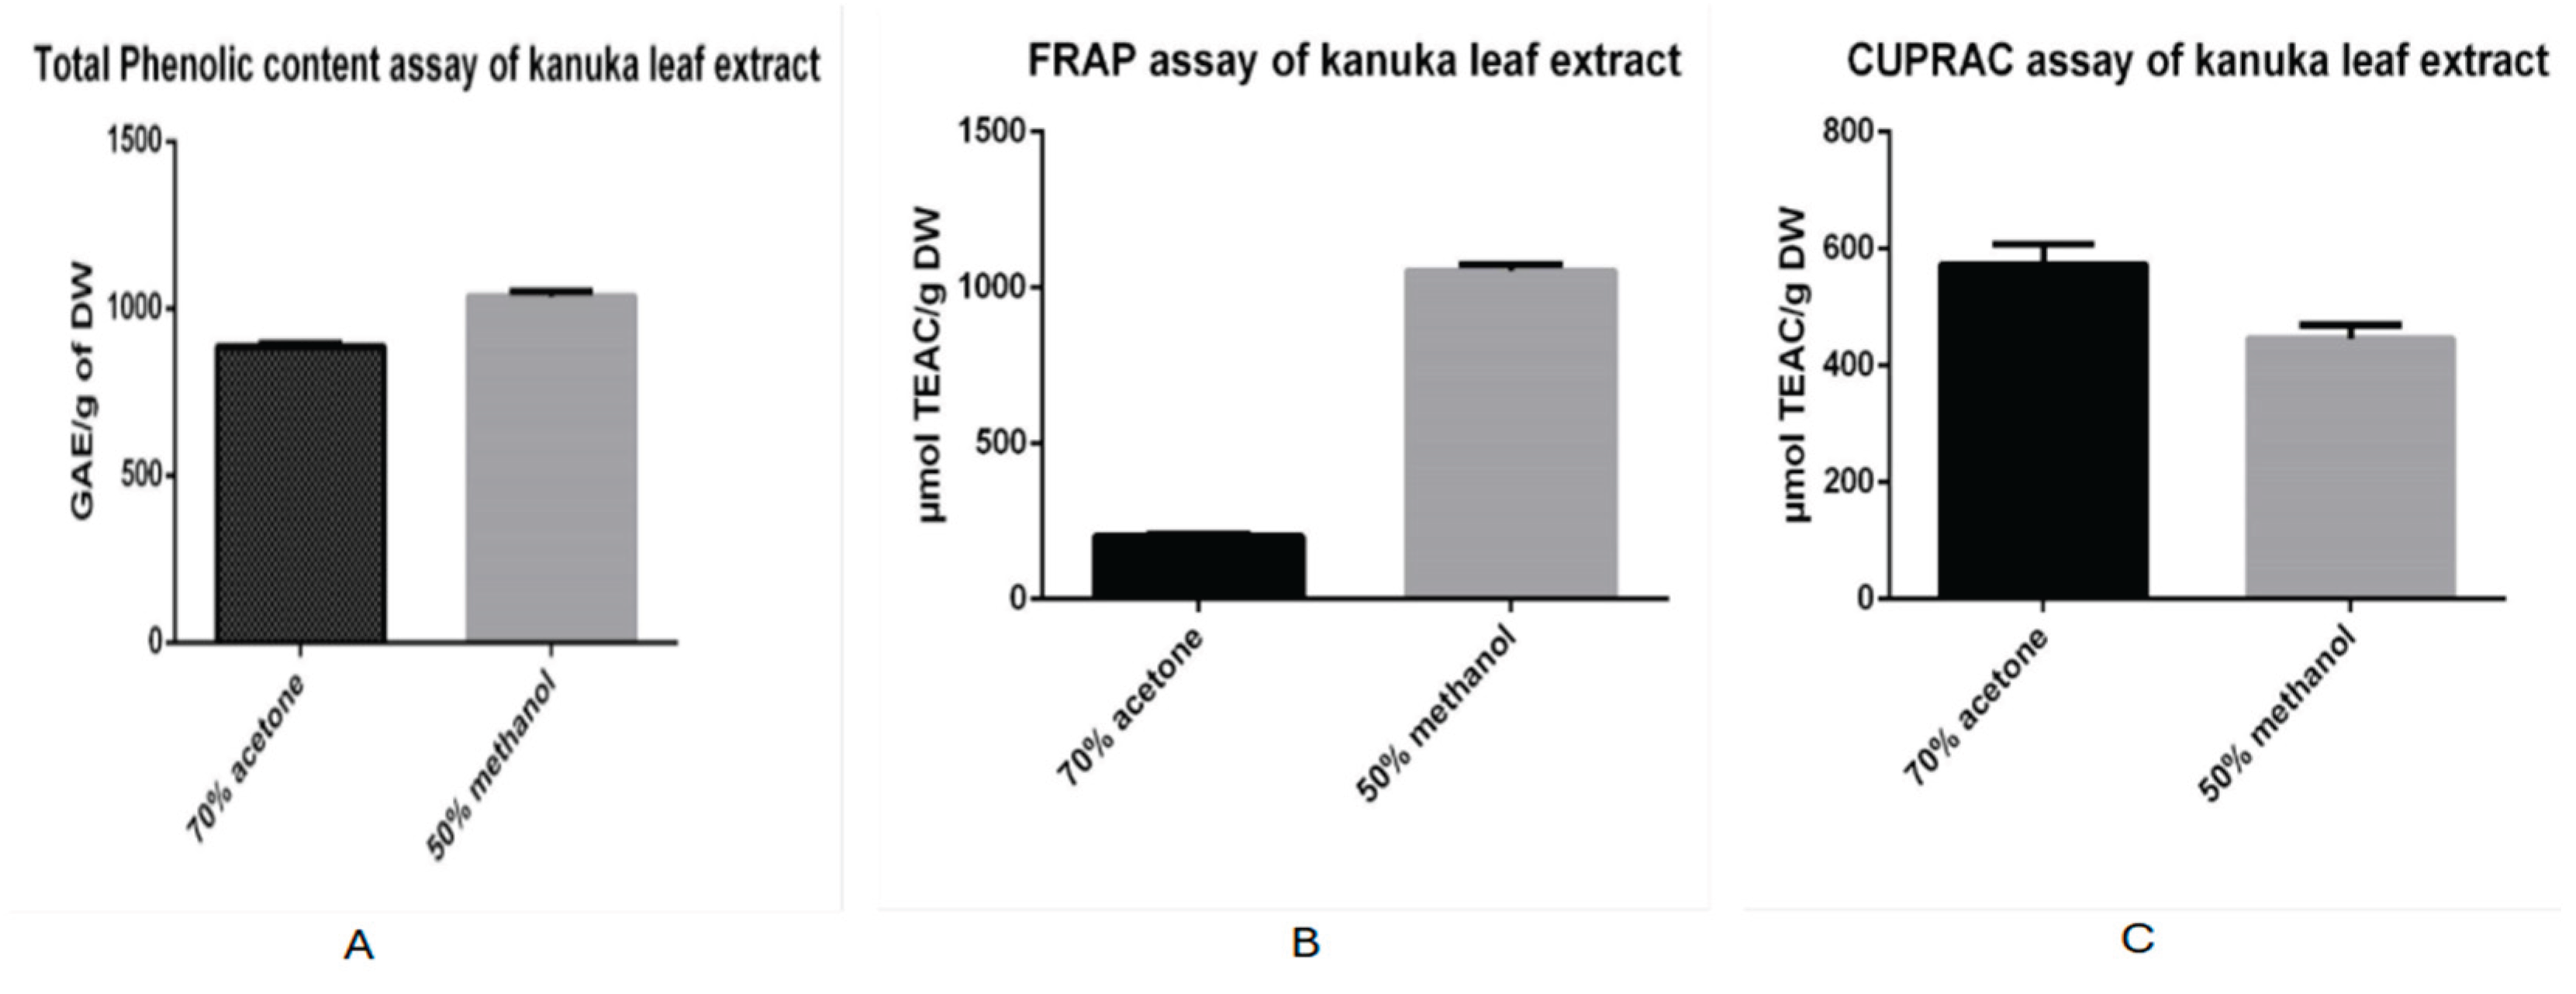
Figure 2.
Cytotoxic effect of different dilutions of kanuka leaf extract (extracted by 50% methanolic extraction method) on MDA-MB-231 cells (A) and BT-549 cells (B) with seeding density of 20,000 cells incubated for 24 hrs. .
Figure 2.
Cytotoxic effect of different dilutions of kanuka leaf extract (extracted by 50% methanolic extraction method) on MDA-MB-231 cells (A) and BT-549 cells (B) with seeding density of 20,000 cells incubated for 24 hrs. .
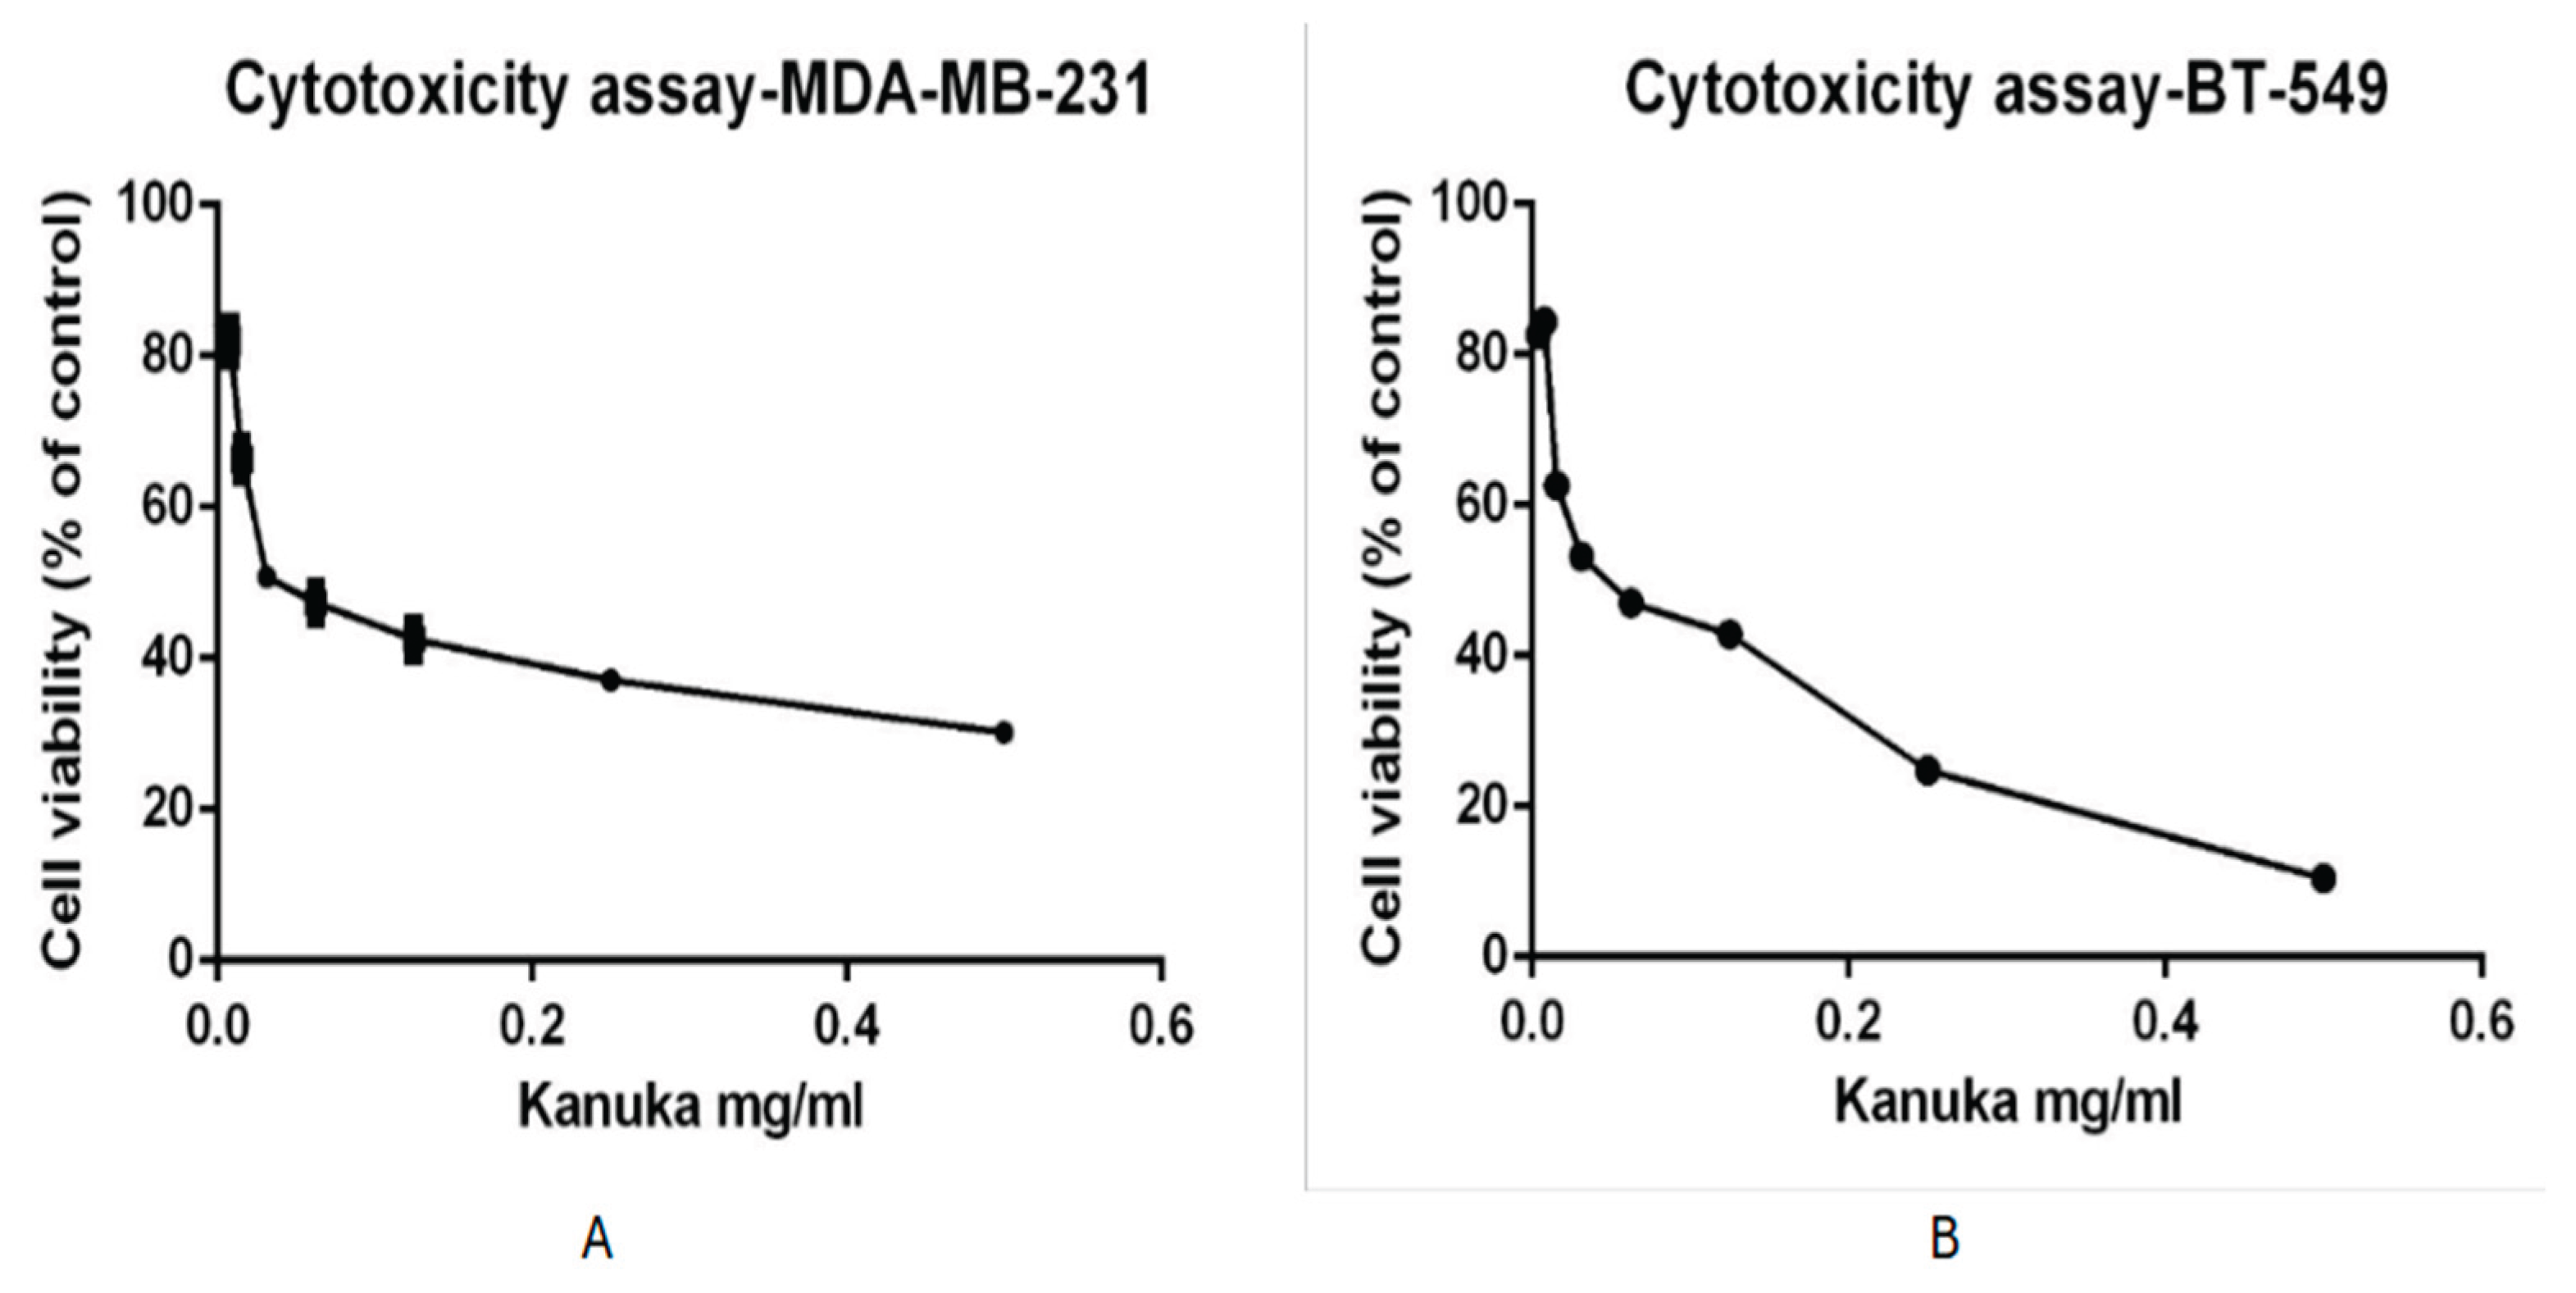
Figure 3.
Positive TIC scan of phenolics in Kanuka leaf extract with three prominent polyphenolics and corresponding peaks.
Figure 3.
Positive TIC scan of phenolics in Kanuka leaf extract with three prominent polyphenolics and corresponding peaks.
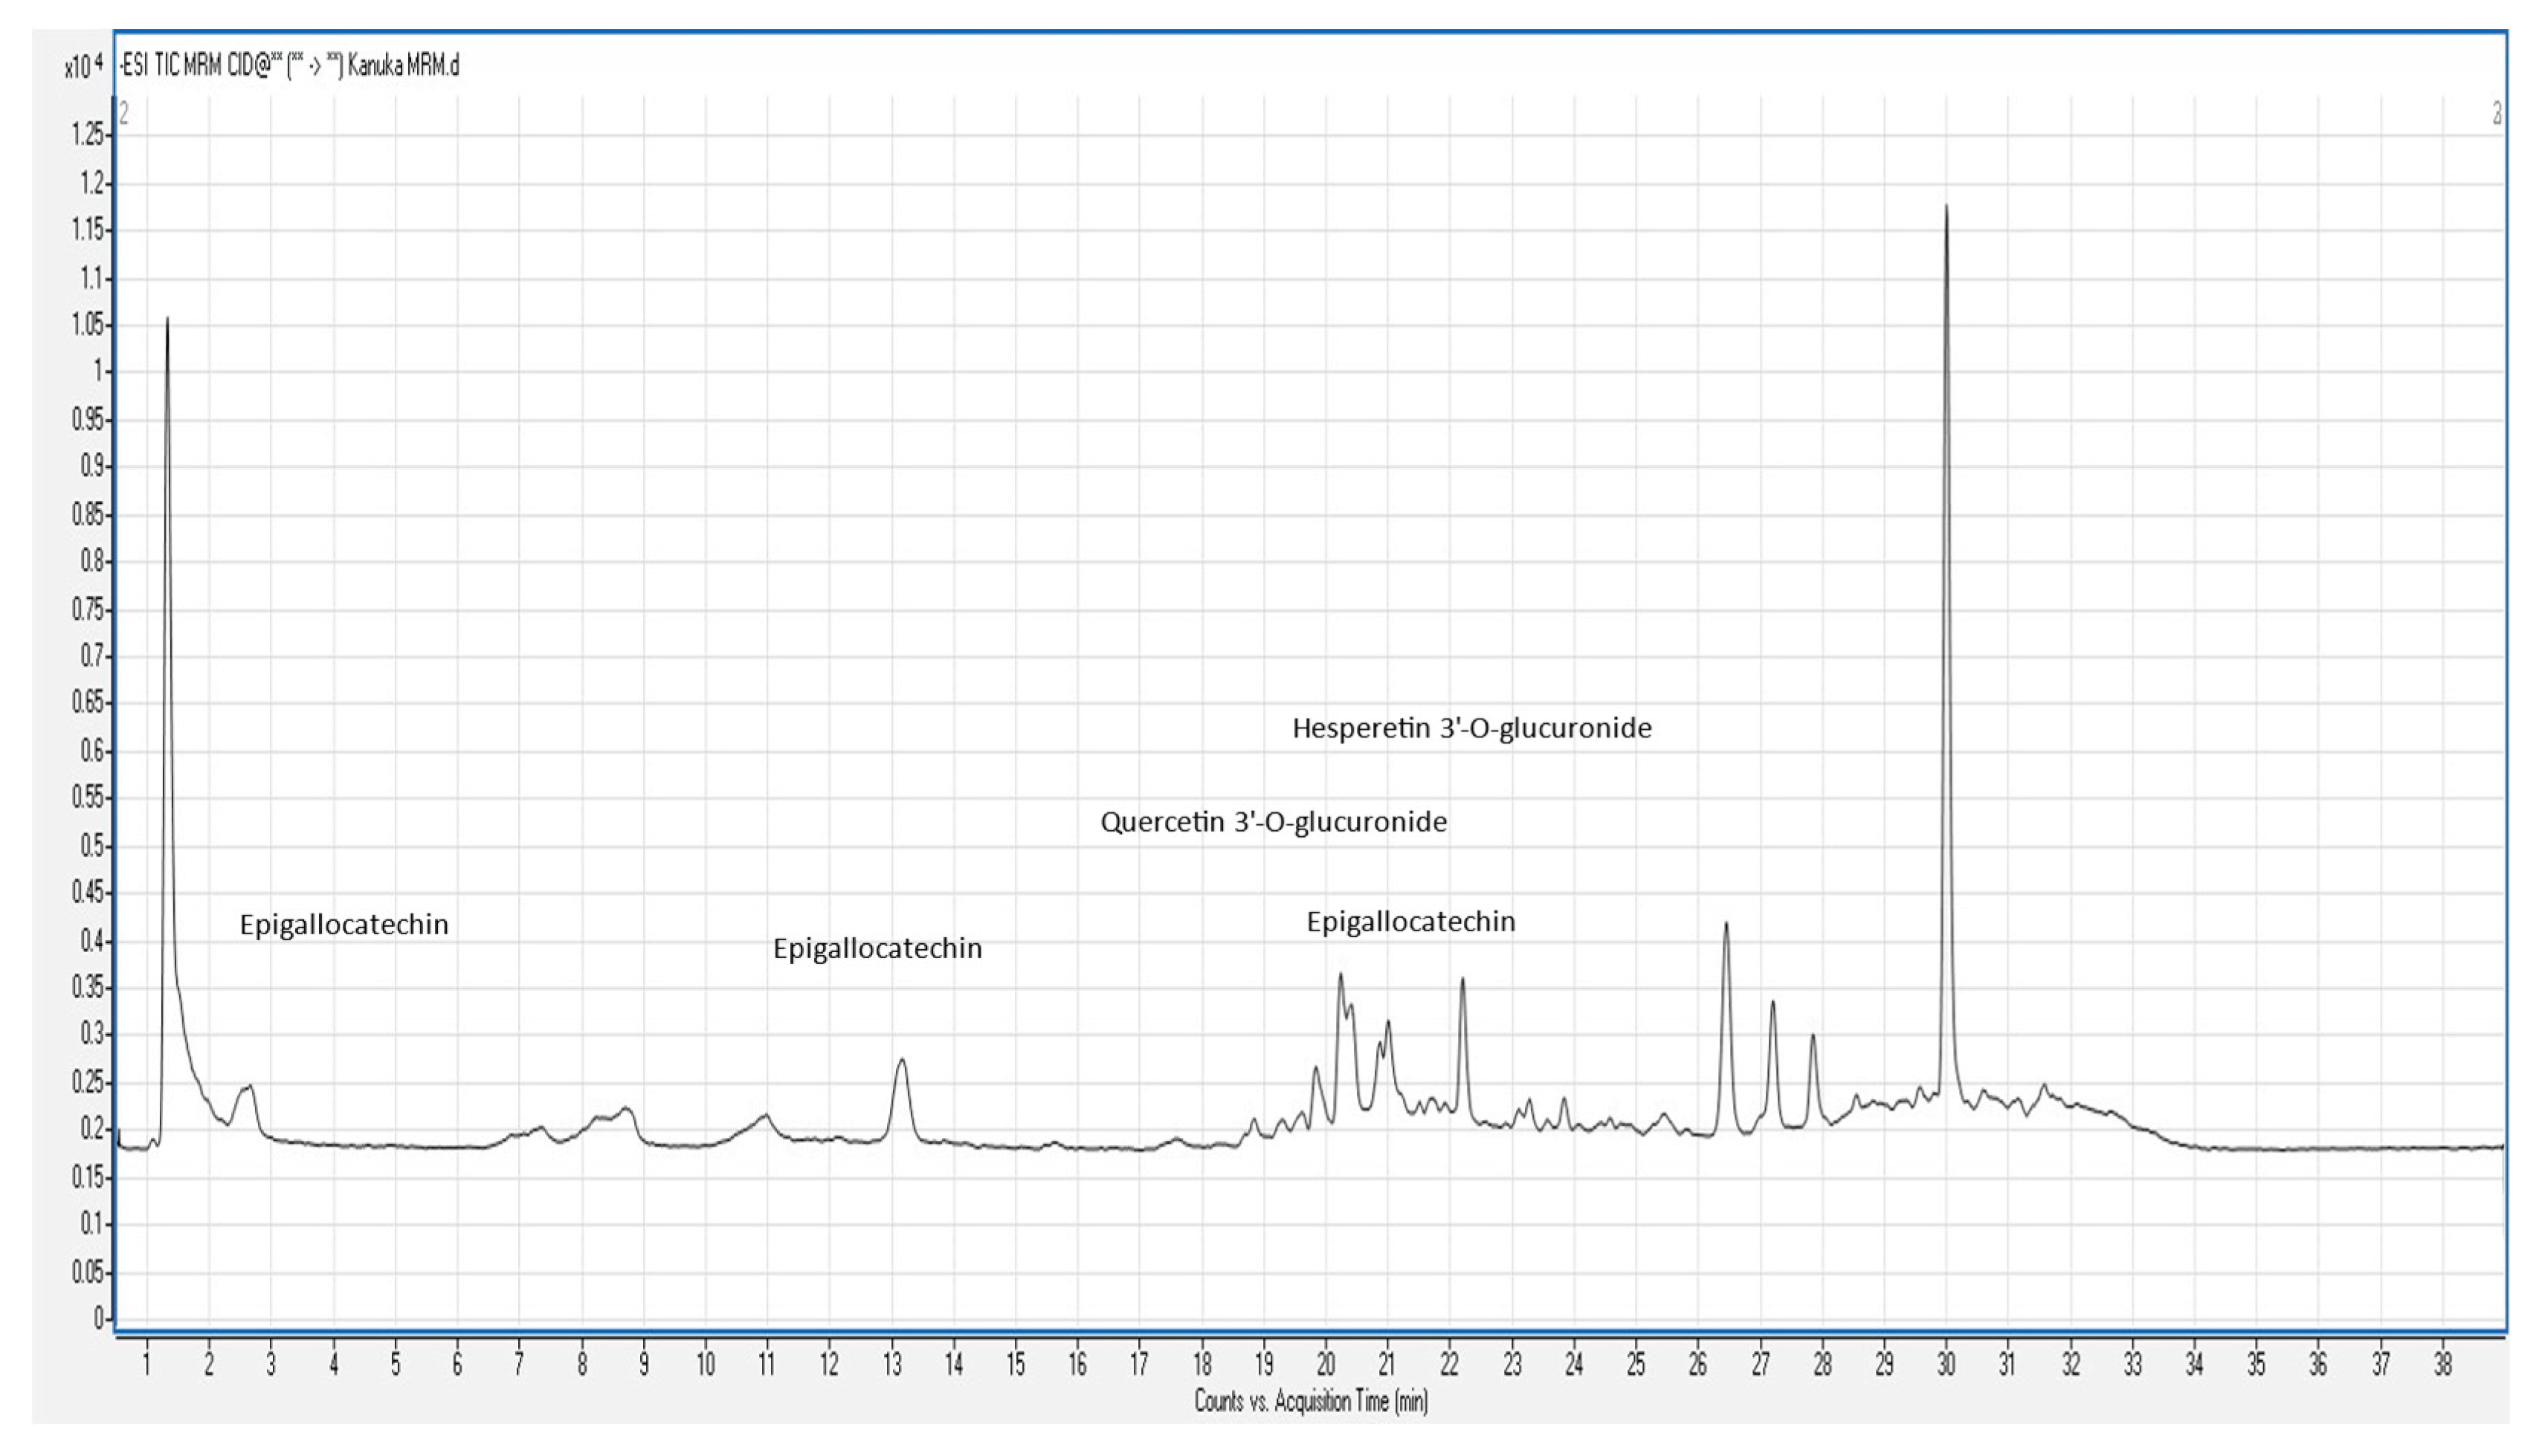
Figure 4.
Heat map for polyphenolic compounds identified in 50% Me-OH based kanuka leaf extract based on the peaks and retention time in TIC scan. 0 represents very weak signal and 3 represents a prominent signal strength corresponding to each compound. Epigallocatechin, Quercetin 3-O-glucoside, Epicatechin 3’-O-glucuronide, Quercetin 4’-O-glucuronide, and Hesperetin 3’-O-glucuronide showed a prominent signal on TIC scan corresponding to value 3 on heatmap. .
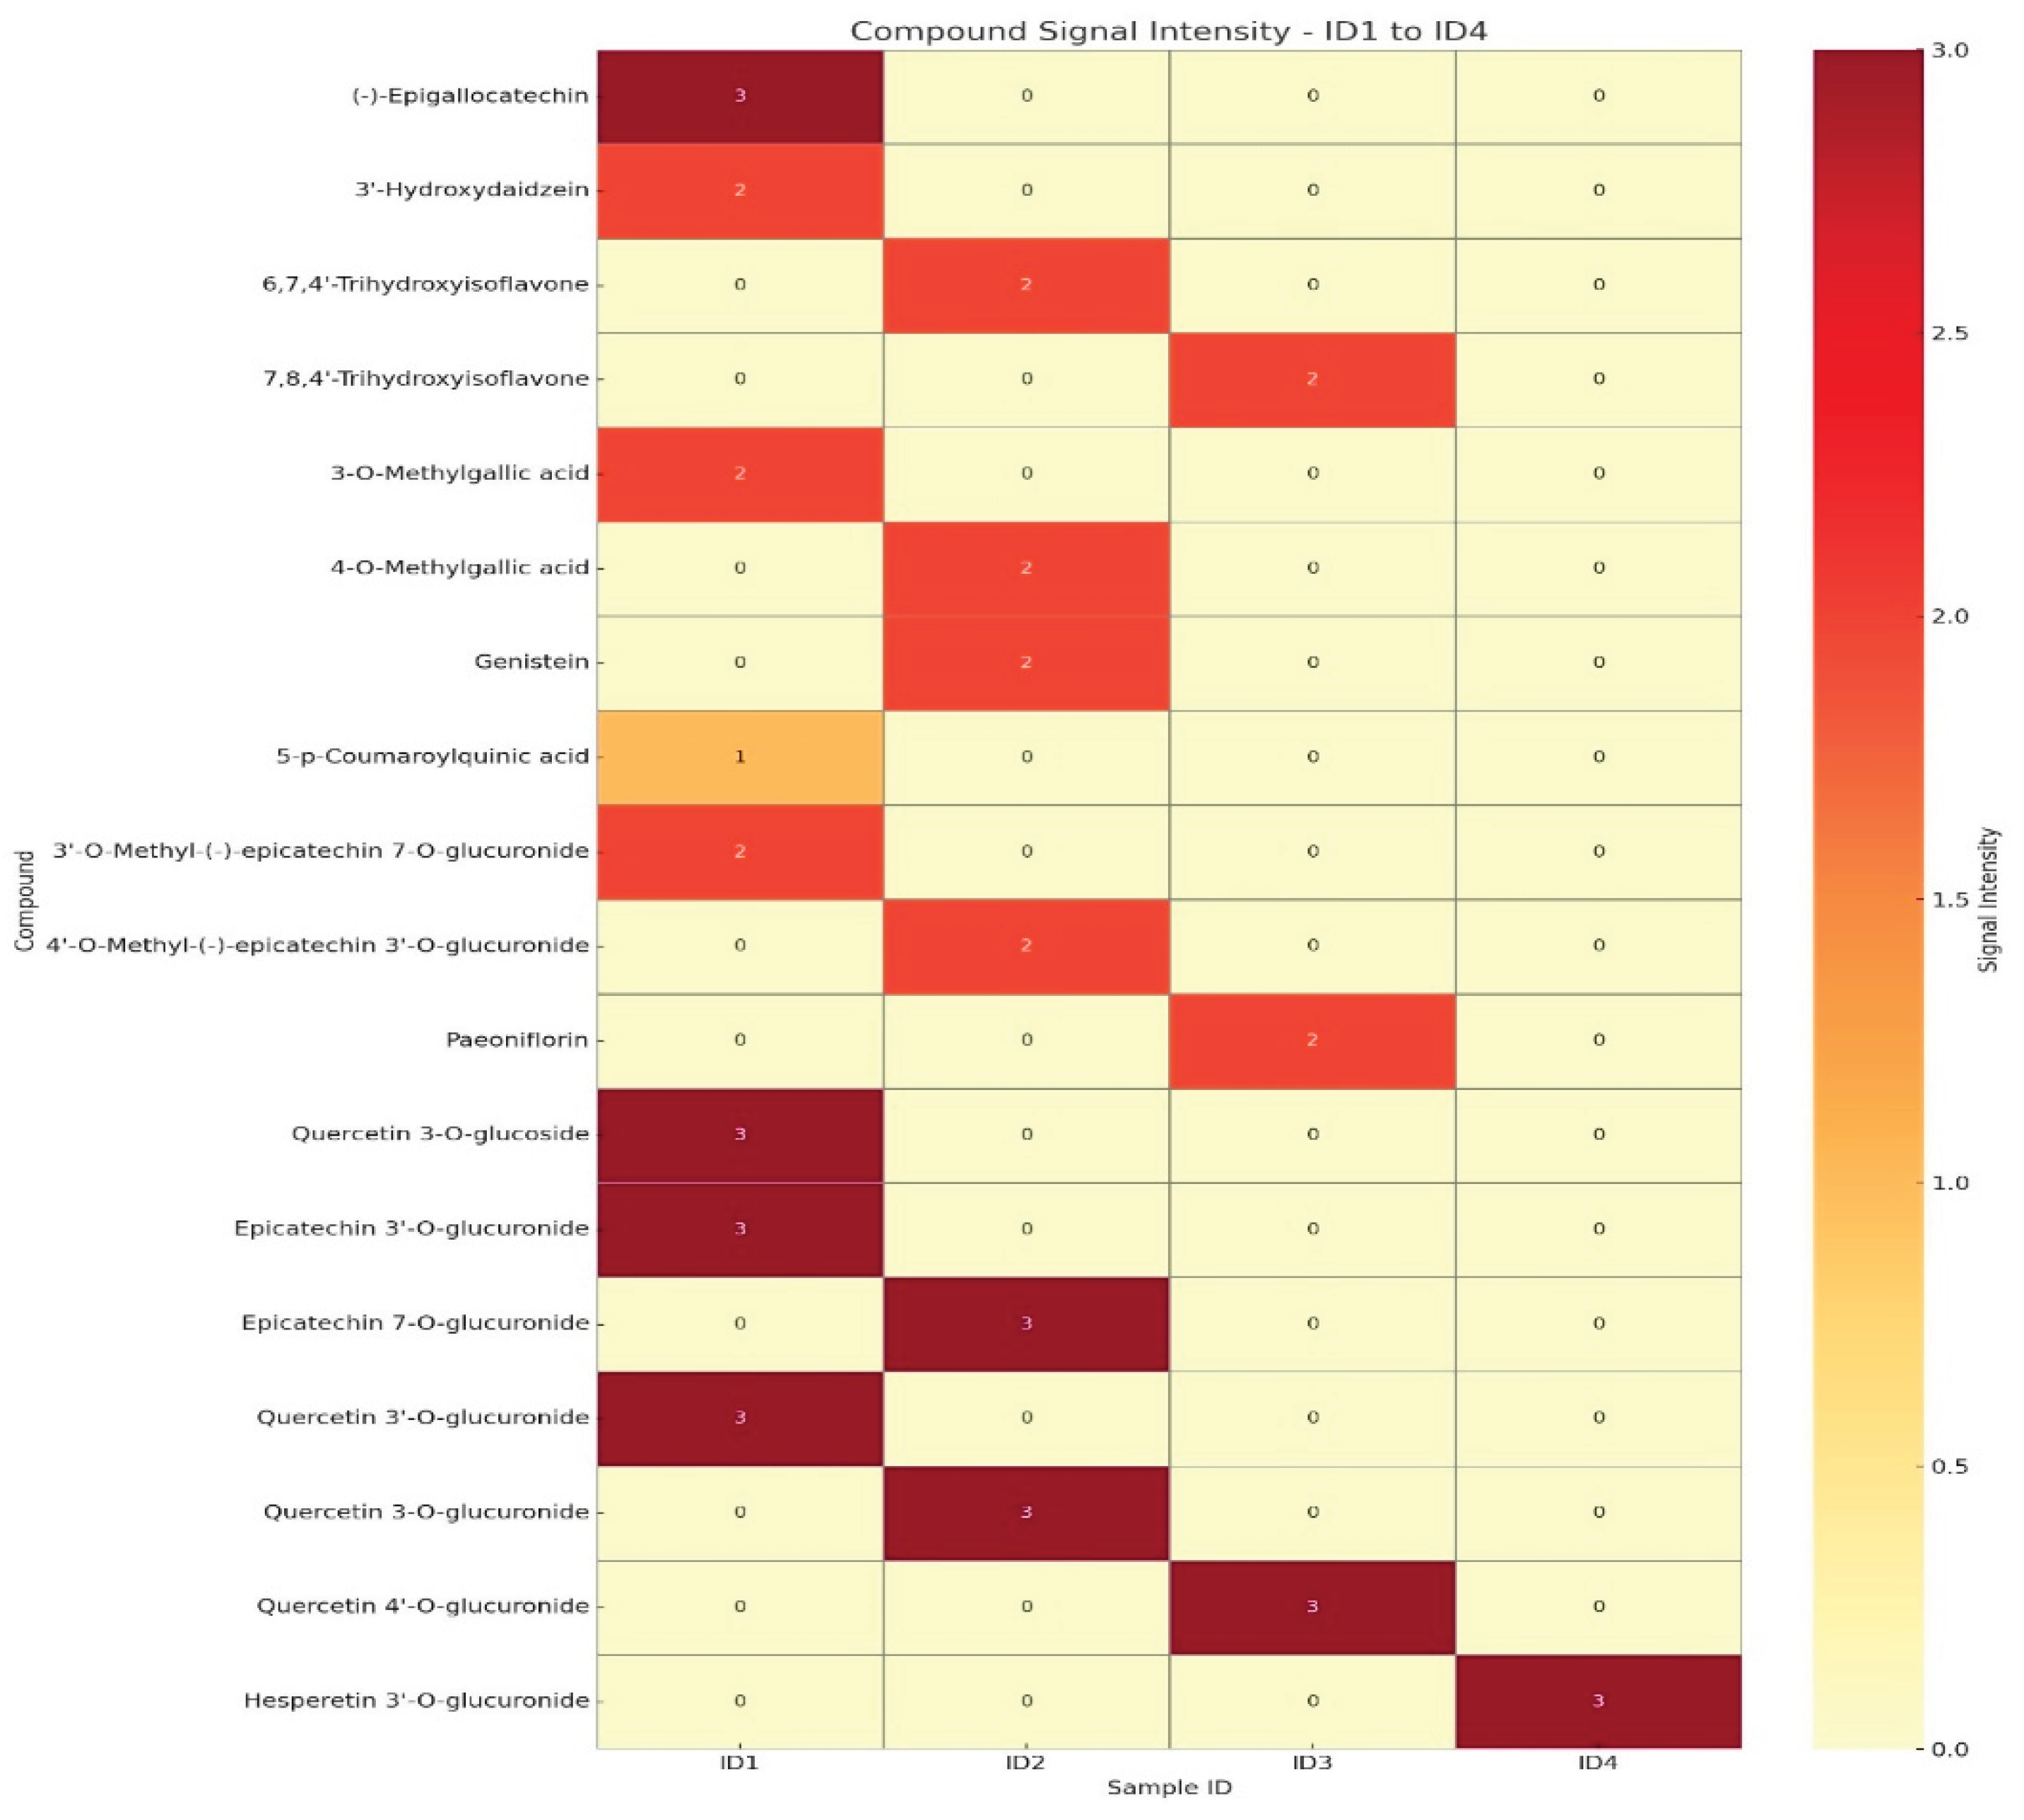
Figure 5.
Multiple reaction monitoring (MRM) chromatograms of 10 polyphenols in 50% Me-OH based kanuka leaf extract with the acquisition times. 1. Quinic acid (1.316 min), 2. Gallic acid (2.535 min), 3. Catechin (12.368 min), 4. Chlorogenic acid (12.806 min), 5. Caffeic acid (13.172 min), 6. Epicatechin (17.141 min), 7. p-Coumaric acid (18.122 min), 8. Kaempferol rutinoside (19.789 min), 9. Quercetin (21.933min), 10. Pinocembrin (26.806).
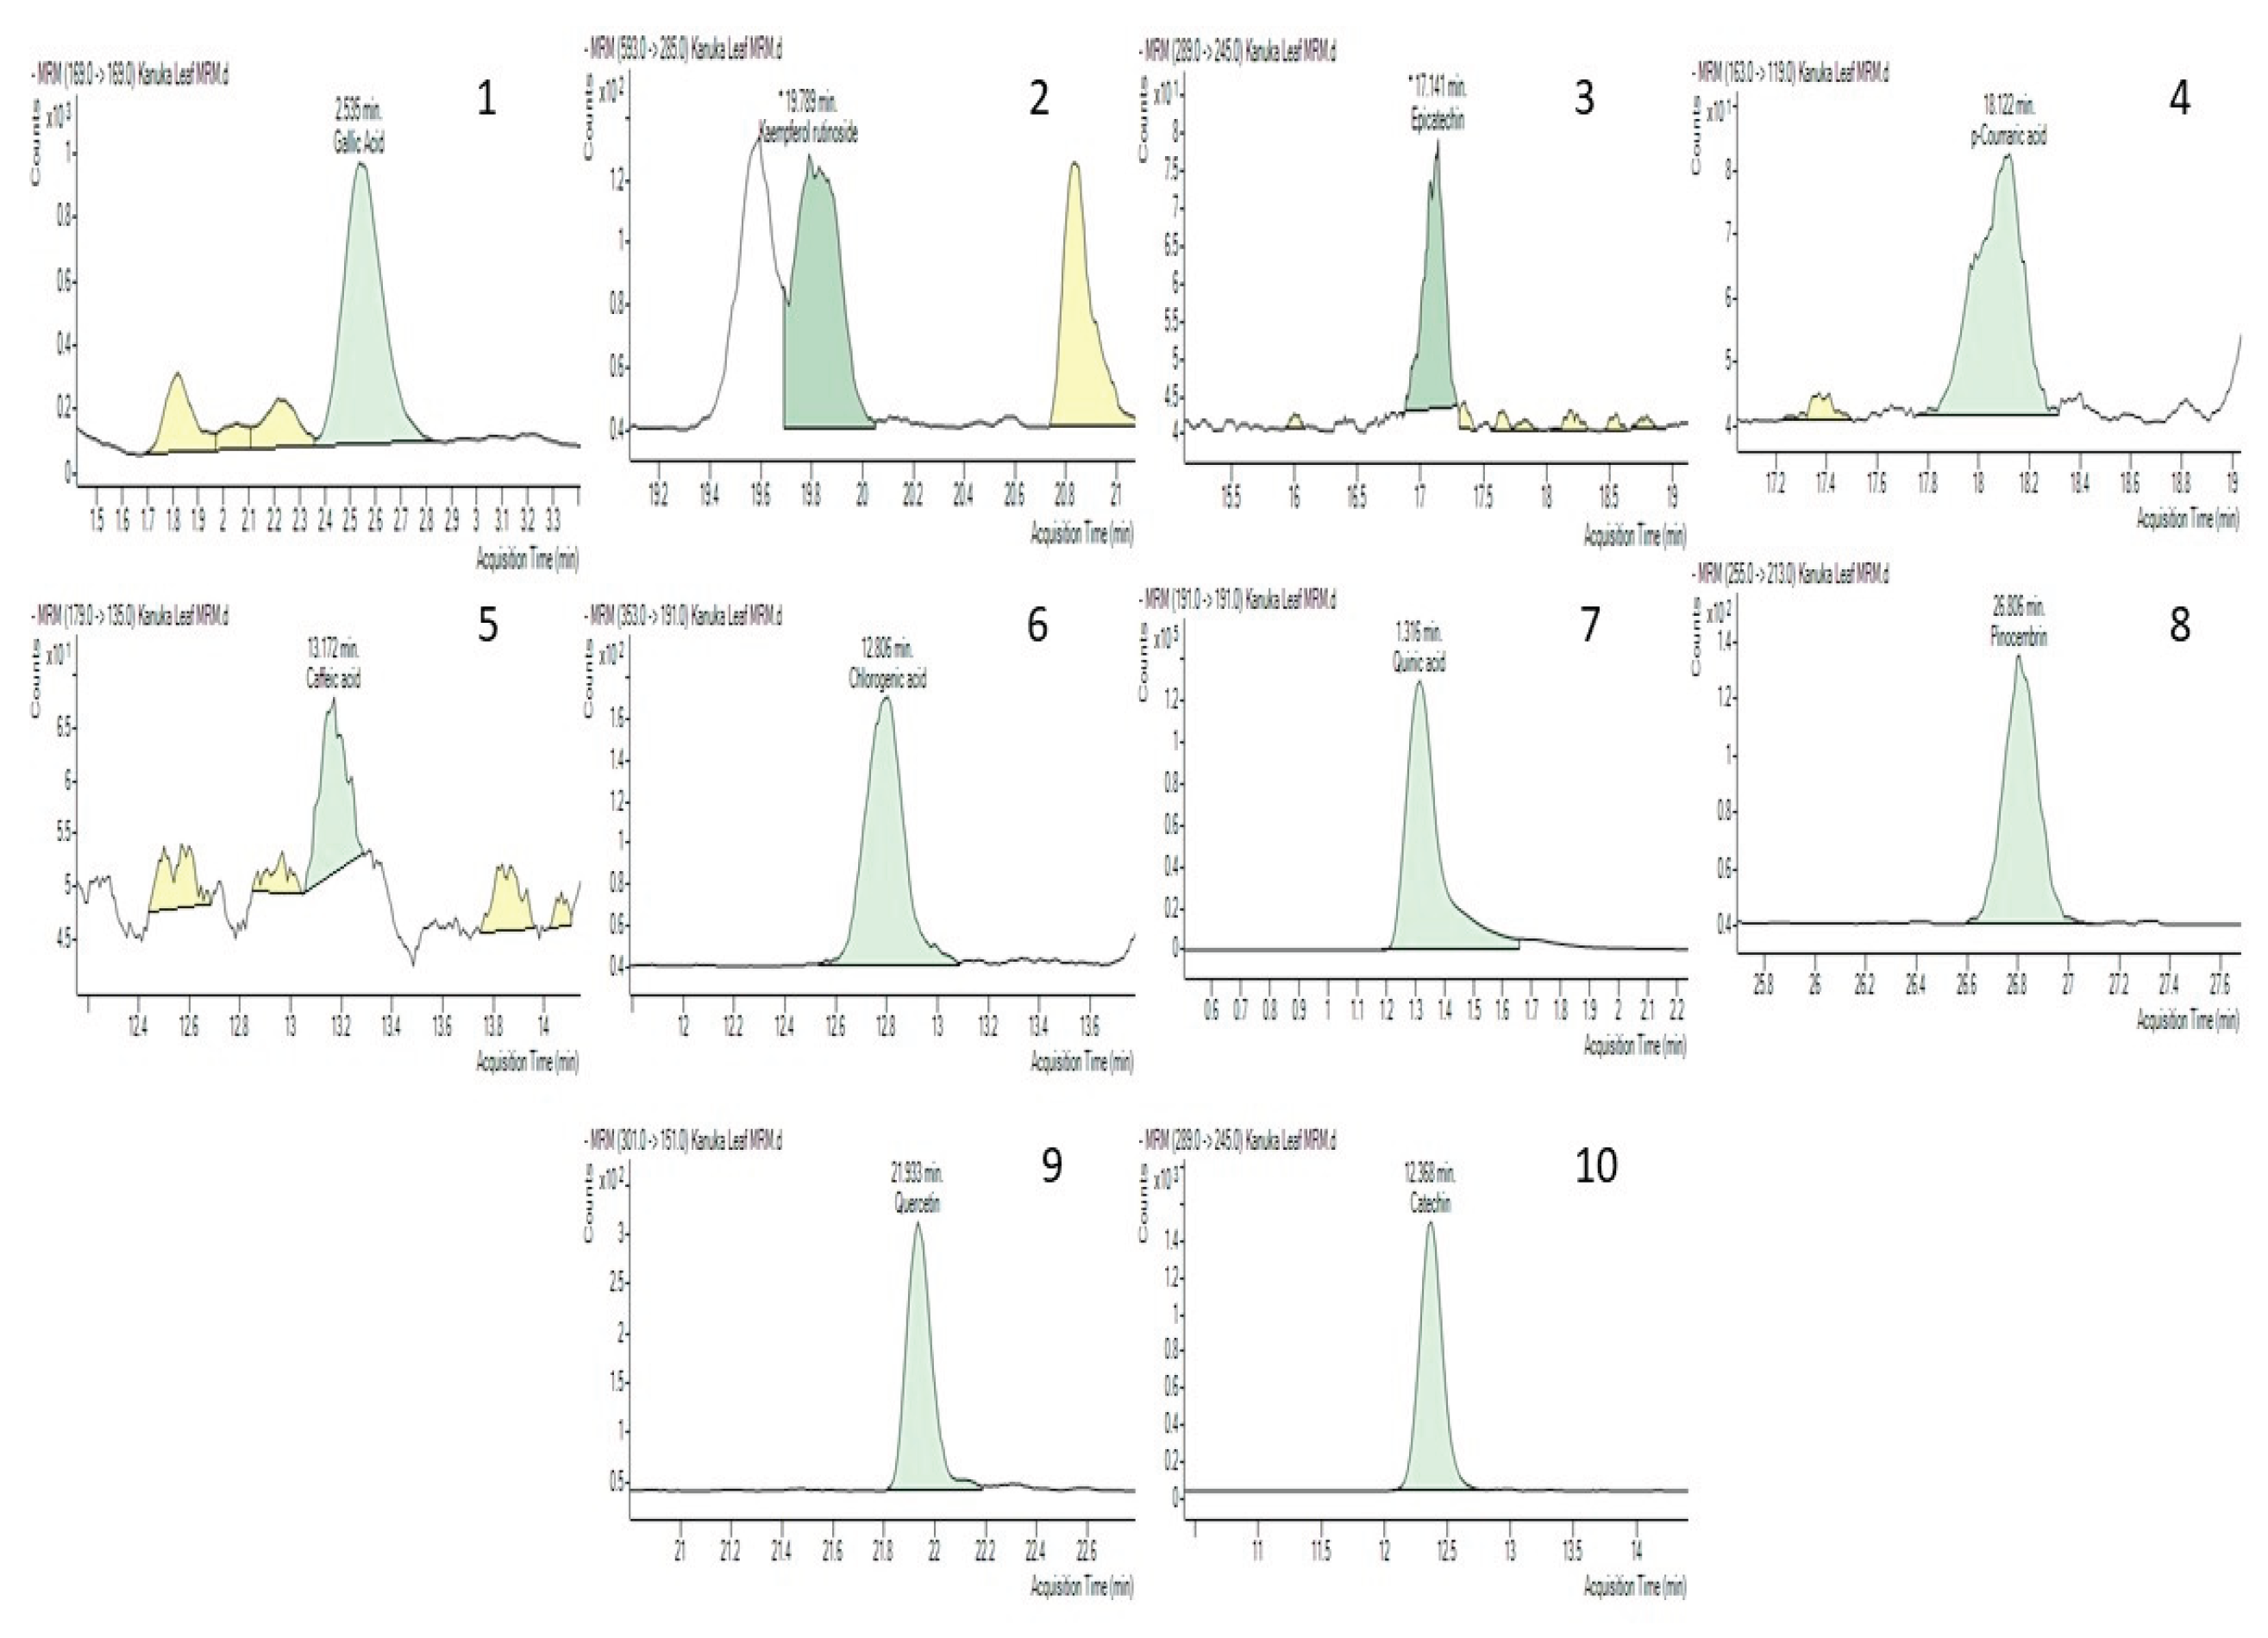

Table 1.
Total phenolic content and antioxidant activity of kanuka plant extract prepared by different solvents-based extractions. Values are expressed as Mean ± SD (n=3)..
Table 1.
Total phenolic content and antioxidant activity of kanuka plant extract prepared by different solvents-based extractions. Values are expressed as Mean ± SD (n=3)..
| Sample | TPC (mg GAE/g DW |
CUPRAC (µmol TEAC/g DW) |
FRAP (µmol TEAC/g DW) |
|---|---|---|---|
| 50% Methanol | 1035.34 ± 10.53 | 446 ± 34.47 | 1054 ± 19.22 |
| 70% Acetone | 886.91± 16.70 | 573.74 ± 22.32 | 207± 8.9 |
Significant differences (p < 0.05) were observed in the mean Total Phenolic Content (TPC) and antioxidant activities (FRAP and CUPRAC assays) between kanuka leaf extracts prepared with methanol and acetone.
Table 2.
Correlation between total phenolic content (TPC) and antioxidant activity measured by FRAP and CUPRAC assay in kanuka leaf extract prepared by 50% methanol and 70% acetone as solvents.
Table 2.
Correlation between total phenolic content (TPC) and antioxidant activity measured by FRAP and CUPRAC assay in kanuka leaf extract prepared by 50% methanol and 70% acetone as solvents.
| Content | TPC | CUPRAC | FRAP | |
|---|---|---|---|---|
| TPC | 50% Me-OH | 1 | 0.845 | -0.727 |
| 70% Acetone | 1 | -0.574 | 0.320 | |
| CUPRAC | 50% Me-OH | 0.845 | 1 | -0.247 |
| 70% Acetone | -0.574 | 1 | -0.959 | |
| FRAP | 50% Me-OH | -0.727 | -0.247 | 1 |
| 70% Acetone | 0.320 | -0.959 | 1 |
Table 3.
List of potential polyphenols present in kanuka leaf extract based on TIC scan.
| RT | M/Z | ID1 | ID2 | ID3 | ID4 | Signal |
|---|---|---|---|---|---|---|
| 4.67 | 305 | (-)-Epigallocatechin | Prominent | |||
| 7.34 | 269 | 3’-Hydroxydaidzein | 6,7,4’-Trihydroxyisoflavone | 7,8,4’-Trihydroxyisoflavone | Weak | |
| 10.372 | 183 | 3-O-Methylgallic acid | 4-O-Methylgallic acid | Weak | ||
| 10.872 | 269 | 3’-Hydroxydaidzein | 6,7,4’-Trihydroxyisoflavone | 7,8,4’-Trihydroxyisoflavone | Genistein | Weak |
| 11.357 | 337 | 5-p-Coumaroylquinic acid | Very weak | |||
| 14.976 | 305 | (-)-Epigallocatechin | Prominent | |||
| 16.692 | 337 | 5-p-Coumaroylquinic acid | Very weak | |||
| 19.304 | 479 | 3’-O-Methyl-(-)-epicatechin 7-O-glucuronide | 4’-O-Methyl-(-)-epicatechin 3’-O-glucuronide | Paeoniflorin | Weak peak | |
| 19.863 | 463 | Quercetin 3-O-glucoside | Prominent | |||
| 20.408 | 466 | Epicatechin 3’-O-glucuronide | Epicatechin 7-O-glucuronide | Prominent | ||
| 20.945 | 477 | Quercetin 3’-O-glucuronide | Quercetin 3-O-glucuronide | Quercetin 4’-O-glucuronide | Hesperetin 3’-O-glucuronide | Prominent |
| 21.191 | 479 | 3’-O-Methyl-(-)-epicatechin 7-O-glucuronide | 4’-O-Methyl-(-)-epicatechin 3’-O-glucuronide | Paeoniflorin | Weak peak | |
| 21.438 | 479 | 3’-O-Methyl-(-)-epicatechin 7-O-glucuronide | 4’-O-Methyl-(-)-epicatechin 3’-O-glucuronide | Paeoniflorin | Weak peak | |
| 28.414 | 269 | 3’-Hydroxydaidzein | 6,7,4’-Trihydroxyisoflavone | 7,8,4’-Trihydroxyisoflavone | Genistein | Weak peak |
*RT-Retention time, M/Z-Mass to charge ratio, ID 1, 2 and 3-Identify compounds using database.
Disclaimer/Publisher’s Note: The statements, opinions and data contained in all publications are solely those of the individual author(s) and contributor(s) and not of MDPI and/or the editor(s). MDPI and/or the editor(s) disclaim responsibility for any injury to people or property resulting from any ideas, methods, instructions or products referred to in the content. |
© 2025 by the authors. Licensee MDPI, Basel, Switzerland. This article is an open access article distributed under the terms and conditions of the Creative Commons Attribution (CC BY) license (http://creativecommons.org/licenses/by/4.0/).
Copyright: This open access article is published under a Creative Commons CC BY 4.0 license, which permit the free download, distribution, and reuse, provided that the author and preprint are cited in any reuse.


