
Submitted:
12 September 2025
Posted:
15 September 2025
You are already at the latest version
Abstract
Melanoma is the deadliest form of skin cancer, with resistance to alkylating agents such as Temozolomide (TMZ) and Dacarbazine (DTIC) further limiting the efficacy of these drugs, which remain palliative options when modern immunotherapies and targeted therapies fail. Here, we identify the Cockayne Syndrome group A (CSA) protein—a key component of Transcription-Coupled Nucleotide Excision Repair (TC-NER)—as a novel driver of melanoma chemo-resistance. CSA is markedly over-expressed in both primary and metastatic melanoma cells. Silencing CSA using Antisense Oligonucleotides (ASOs) robustly reduces melanoma cell proliferation, induces apoptosis, and—critically—sensitizes cells to low doses of TMZ and DTIC, while sparing normal cells. Notably, although CSA loss-of-function underlies Cockayne Syndrome (CS), a disorder characterized by defective repair of UV-induced DNA damage, these patients do not exhibit an increased incidence of skin cancer. This paradox highlights a unique biological context in which impaired CSA function promotes cellular apoptosis rather than carcinogenesis, suggesting that CSA inhibition could selectively cripple melanoma cells. These findings establish CSA as a promising therapeutic target to overcome chemo-resistance in melanoma. Combining CSA inhibition with alkylating agents offers a potential salvage strategy in patients with refractory disease and warrants further preclinical and clinical investigation.
Keywords:
CSA-driven drug resistance
; Melanoma vulnerability
; Synthetic lethality with alkylators
; Precision apoptosis induction
; Overcoming therapeutic dead-ends
1. Introduction
Skin cancer is among the most prevalent malignancies worldwide, affecting individuals of all genders [1]. It is primarily categorized into three types: Basal Cell Carcinoma (BCC), Squamous Cell Carcinoma (SCC), and melanoma [2]. Of these, melanoma is the most aggressive, accounting for roughly 75% of skin cancer-related deaths despite being less common than BCC and SCC [3]. Melanoma progression is influenced by a complex interplay of genetic, epigenetic, environmental, and behavioral factors [4].
For early-stage melanoma, wide local excision remains the standard of care and may also be used in combination with other therapies in advanced cases. In metastatic melanoma, first-line treatments typically involve targeted therapy and/or immunotherapy, both of which have dramatically improved patient outcomes over the past decade. Notably, these approaches have increased median overall survival from approximately six months to over five years. Targeted therapies focus on inhibiting components of the MAPK signaling pathway, particularly in patients with the BRAFV600E mutation, which occurs in about 50% of metastatic melanomas [5,6,7].
These include BRAF inhibitors (vemurafenib, dabrafenib) and MEK inhibitors (trametinib, cobimetinib) [8]. Immunotherapy, effective regardless of BRAF mutation status, employs immune checkpoint inhibitors to reactivate anti-tumor immunity. These include agents targeting CTLA-4 (e.g., ipilimumab), PD-1 (e.g., nivolumab), and PD-L1 (e.g., atezolizumab) [9,10,11].
When patients are refractory to immunotherapy, conventional chemotherapy—most commonly Dacarbazine (DTIC) and Temozolomide (TMZ)—remains a treatment option, particularly for those with central nervous system metastases [12]. However, both drugs are limited by low objective response rates, modest survival benefits, and substantial toxicity that can significantly impair the quality of life. These drawbacks underscore the urgent need for more effective and better-tolerated therapeutic strategies [13,14]. DTIC and TMZ are alkylating agents that exert cytotoxic effects primarily by methylating DNA, leading to lesions such as O6-methylguanine and N7-methylguanine. These lesions are typically repaired through mechanisms including MGMT, Base Excision Repair (BER), and MisMatch Repair (MMR) [15]. Although TranscriptionCoupled Nucleotide Excision Repair (TCR-NER) is not the primary pathway for resolving such damage, it may be recruited when RNA polymerase II stalls at methylated sites within actively transcribed genes [16] In such cases, TCR-NER can contribute to lesion resolution, particularly when other repair pathways are overwhelmed or the damage is structurally atypical.
Supporting this, studies have shown that transcription-blocking lesions can be processed by NER components under certain conditions. In our previous work, we demonstrated that down-regulation of the Cockayne Syndrome Group A (CSA) protein using Antisense Oligonucleotides (ASOs) sensitizes triple-negative breast cancer cells to chemotherapeutic agents, like oxaliplatin and paclitaxel [17]. This chemo-sensitization is attributed to CSA’s dual role in DNA repair and inhibition of apoptosis [18].
CSA, a WD40 repeat protein, functions as part of an E3 ubiquitin ligase complex that includes CSB, Cullin 4, RBX1, and DDB1 [19]. Within this complex, CSA plays a key role in TCR-NER, a sub-pathway of NER that specifically targets DNA damage in transcriptionally active regions [20]. Beyond DNA repair, CSA also regulates cell death pathways by promoting the ubiquitination and degradation of pro-apoptotic proteins such as p53 and ATF3 [21,22,23].
In this study, we demonstrate that CSA knockdown (KD) in melanoma cells impairs tumorigenic properties, including survival, proliferation, and migration, in both primary and metastatic cell lines. Importantly, CSA suppression significantly enhances the sensitivity of metastatic melanoma cells to DTIC and TMZ treatment, highlighting its potential as a therapeutic target to improve chemotherapy efficacy in advanced melanoma.
2. Results
2.1. CSA Gene Expression Is Upregulated in Primary and Metastatic Melanoma Cells
To determine whether CSA protein is overexpressed in melanoma cells, the expression levels of CSA were analyzed in primary (WM115) and metastatic (WM266-4) melanoma cell lines and normal human fibroblasts (FB789), at both protein and mRNA levels. Western blot analysis (Figure 1A) revealed an upregulation of CSA protein in the melanoma cell lines WM115 and WM266-4 compared to the non-tumorigenic FB789 cells. Densitometric quantification normalized to α-tubulin (Figure 1B) confirmed a significant increase in CSA protein expression in both WM115 and WM266-4 cells (p < 0.001), with levels elevated by 1.87 ± 0.3 in WM115 and 2.0 ± 0.4 in WM266-4, relative to FB789. Consistently, CSA mRNA levels assessed by qRT-PCR and normalized to β-actin (Figure 1C) were significantly elevated in WM115 (2.4 ± 0.12) and WM266-4 (1.49 ± 0.25) compared to FB789 cells (***p < 0.001). These results indicate that CSA is upregulated at both transcriptional and translational levels in melanoma cells, suggesting a potential role for CSA in melanoma pathophysiology.
2.2. Targeting CSA Reduces Tumorigenicity and Proliferative Capacity in Melanoma
Given the established role of the CSA protein in enhancing cellular robustness and suppressing pro-apoptotic signaling, we hypothesized that silencing CSA expression would reduce the tumorigenic potential of melanoma cells by shifting the balance toward cell cycle arrest and apoptosis, and away from proliferation and survival. To investigate the functional consequences of CSA silencing, we transfected melanoma cell lines (WM115 and WM266-4) and non-tumorigenic FB789 cells with Antisense Oligonucleotides (ASO) specifically targeting CSA mRNA. A sense oligonucleotide (SO) was used as a negative control alongside untreated (Medium) conditions. As shown in Figure 2A, ASO transfection resulted in a significant reduction of CSA mRNA levels across all cell lines compared to both Medium and SO controls (***p < 0.001). CSA transcript levels were reduced by approximately 70% in FB789 and WM115 cells, and by around 45% in WM266-4 cells, indicating effective target knockdown.
The impact of CSA silencing on cell viability was assessed 48h hours post-transfection (Figure 2B). While CSA depletion had minimal effects on FB789 cells, melanoma cell lines exhibited a significant reduction in viability, with both WM115 and WM266-4 showing over 50% decrease compared to controls (p < 0.001). This suggests that CSA plays a critical role in sustaining melanoma cell survival.
Consistent with the viability data, apoptosis analysis, performed as specified in Material and Methods, revealed a substantial increase of apoptotic cells upon ASO treatment in melanoma cell lines (Figure 2C). Specifically, CSA ablation resulted in a slight increase in apoptosis at 24 hours post-transfection with ASO in both WM115 and WM266-4 melanoma cells, with apoptotic cell percentages of 4.3 ± 2.4% and 5.6 ± 2.3%, respectively. At 48 hours post-transfection, the percentage of apoptotic cells significantly increased to 9.8 ± 1.7% in WM115 cells and 11.5 ± 1.5% in WM266-4 cells. In contrast, no significant induction of apoptosis was observed in the normal FB789 cell line after CSA downregulation, and no effects were seen in any cell lines treated with the control SO at either 24- or 48-hours post-transfection.
Furthermore, proliferation assays monitored over a 48-hour recovery period demonstrated that CSA silencing markedly impaired melanoma cell growth (Figures 2E and 2F). While control-treated WM115 and WM266-4 cells showed robust expansion, ASO-treated cells exhibited a significant reduction in cell number at 48 hours (**p < 0.01 for WM115; ***p < 0.001 for WM266-4). In contrast, FB789 cell proliferation was not significantly affected by ASO treatment (Figure 2D), further emphasizing the selective dependence of melanoma cells — but not normal cells — on CSA for proliferation and survival
Finally, we assessed the cell migration capability using a wound healing assay (Figure 5G,H). The results revealed a significant reduction in the migratory capacity of both WM115 and WM266-4 melanoma cells following CSA ablation. Specifically, in ASO-treated WM115 and WM266-4 cells, the percentage of wound closure was reduced to 35.7 ± 10.9% and 47.9 ± 4.6%, respectively, compared to the mock-treated cells. Notably, SO treatment did not affect wound healing in any of the cell lines. In contrast, normal FB789 cells exhibited proper wound healing, regardless of CSA expression. These findings further support the notion that CSA plays a crucial and selective role in sustaining the migratory properties of melanoma cells, while its depletion does not impact the physiological migration of normal fibroblasts.
2.3. CSA Gene Silencing Enhances Chemosensitivity and Selectivity of DTIC and TMZ in Melanoma Cells
To evaluate the impact of CSA gene silencing on chemosensitivity, we determined the half-maximal inhibitory concentration (IC₅₀) values for DTIC and TMZ, both alone and in combination with ASO-mediated CSA knockdown, in normal fibroblasts and melanoma cells. Cell viability was measured 24 hours after treatment. For DTIC, the drug was administered at concentrations ranging from 10 to 0.3 µM, while for TMZ, the dose ranged from 500 to 7.34 µM. The IC50 for each treatment was calculated (Table 1A). In normal fibroblasts, IC₅₀ values remained high across all treatments (DTIC: 68.6 ± 3.2 µM; ASO+DTIC: 72.42 ± 5.2 µM; TMZ: 3603 ± 39 µM; ASO+TMZ: 2276 ± 10.2 µM), indicating low sensitivity. In contrast, both melanoma cell lines showed markedly increased sensitivity to chemotherapy upon CSA silencing. In primary WM115 melanoma cells, the IC₅₀ for DTIC decreased from 45.25 ± 0.5 µM to 7.95 ± 2.9 µM with ASO+DTIC, and for TMZ from 1753.8 ± 7.2 µM to 369 ± 4.2 µM with ASO+TMZ. The effect was even more pronounced in metastatic WM266-4 melanoma cells, where the IC₅₀ for DTIC dropped from 23.21 ± 1.83 µM to 0.58 ± 0.07 µM and for TMZ from 369 ± 4.2 µM to 3.85 ± 0.02 µM following CSA knockdown.

Table 1.
(A) IC50 values (half maximal inhibitory concentration) ± SD for all the compounds (DTIC and TMZ) are expressed in μM. (B) The Selectivity Index (SI) was calculated as the ratio of IC50 values (normal cell line) to IC50 values (melanoma cancer cell line). An SI > 3 suggests that the drug is selective for cancer cells.
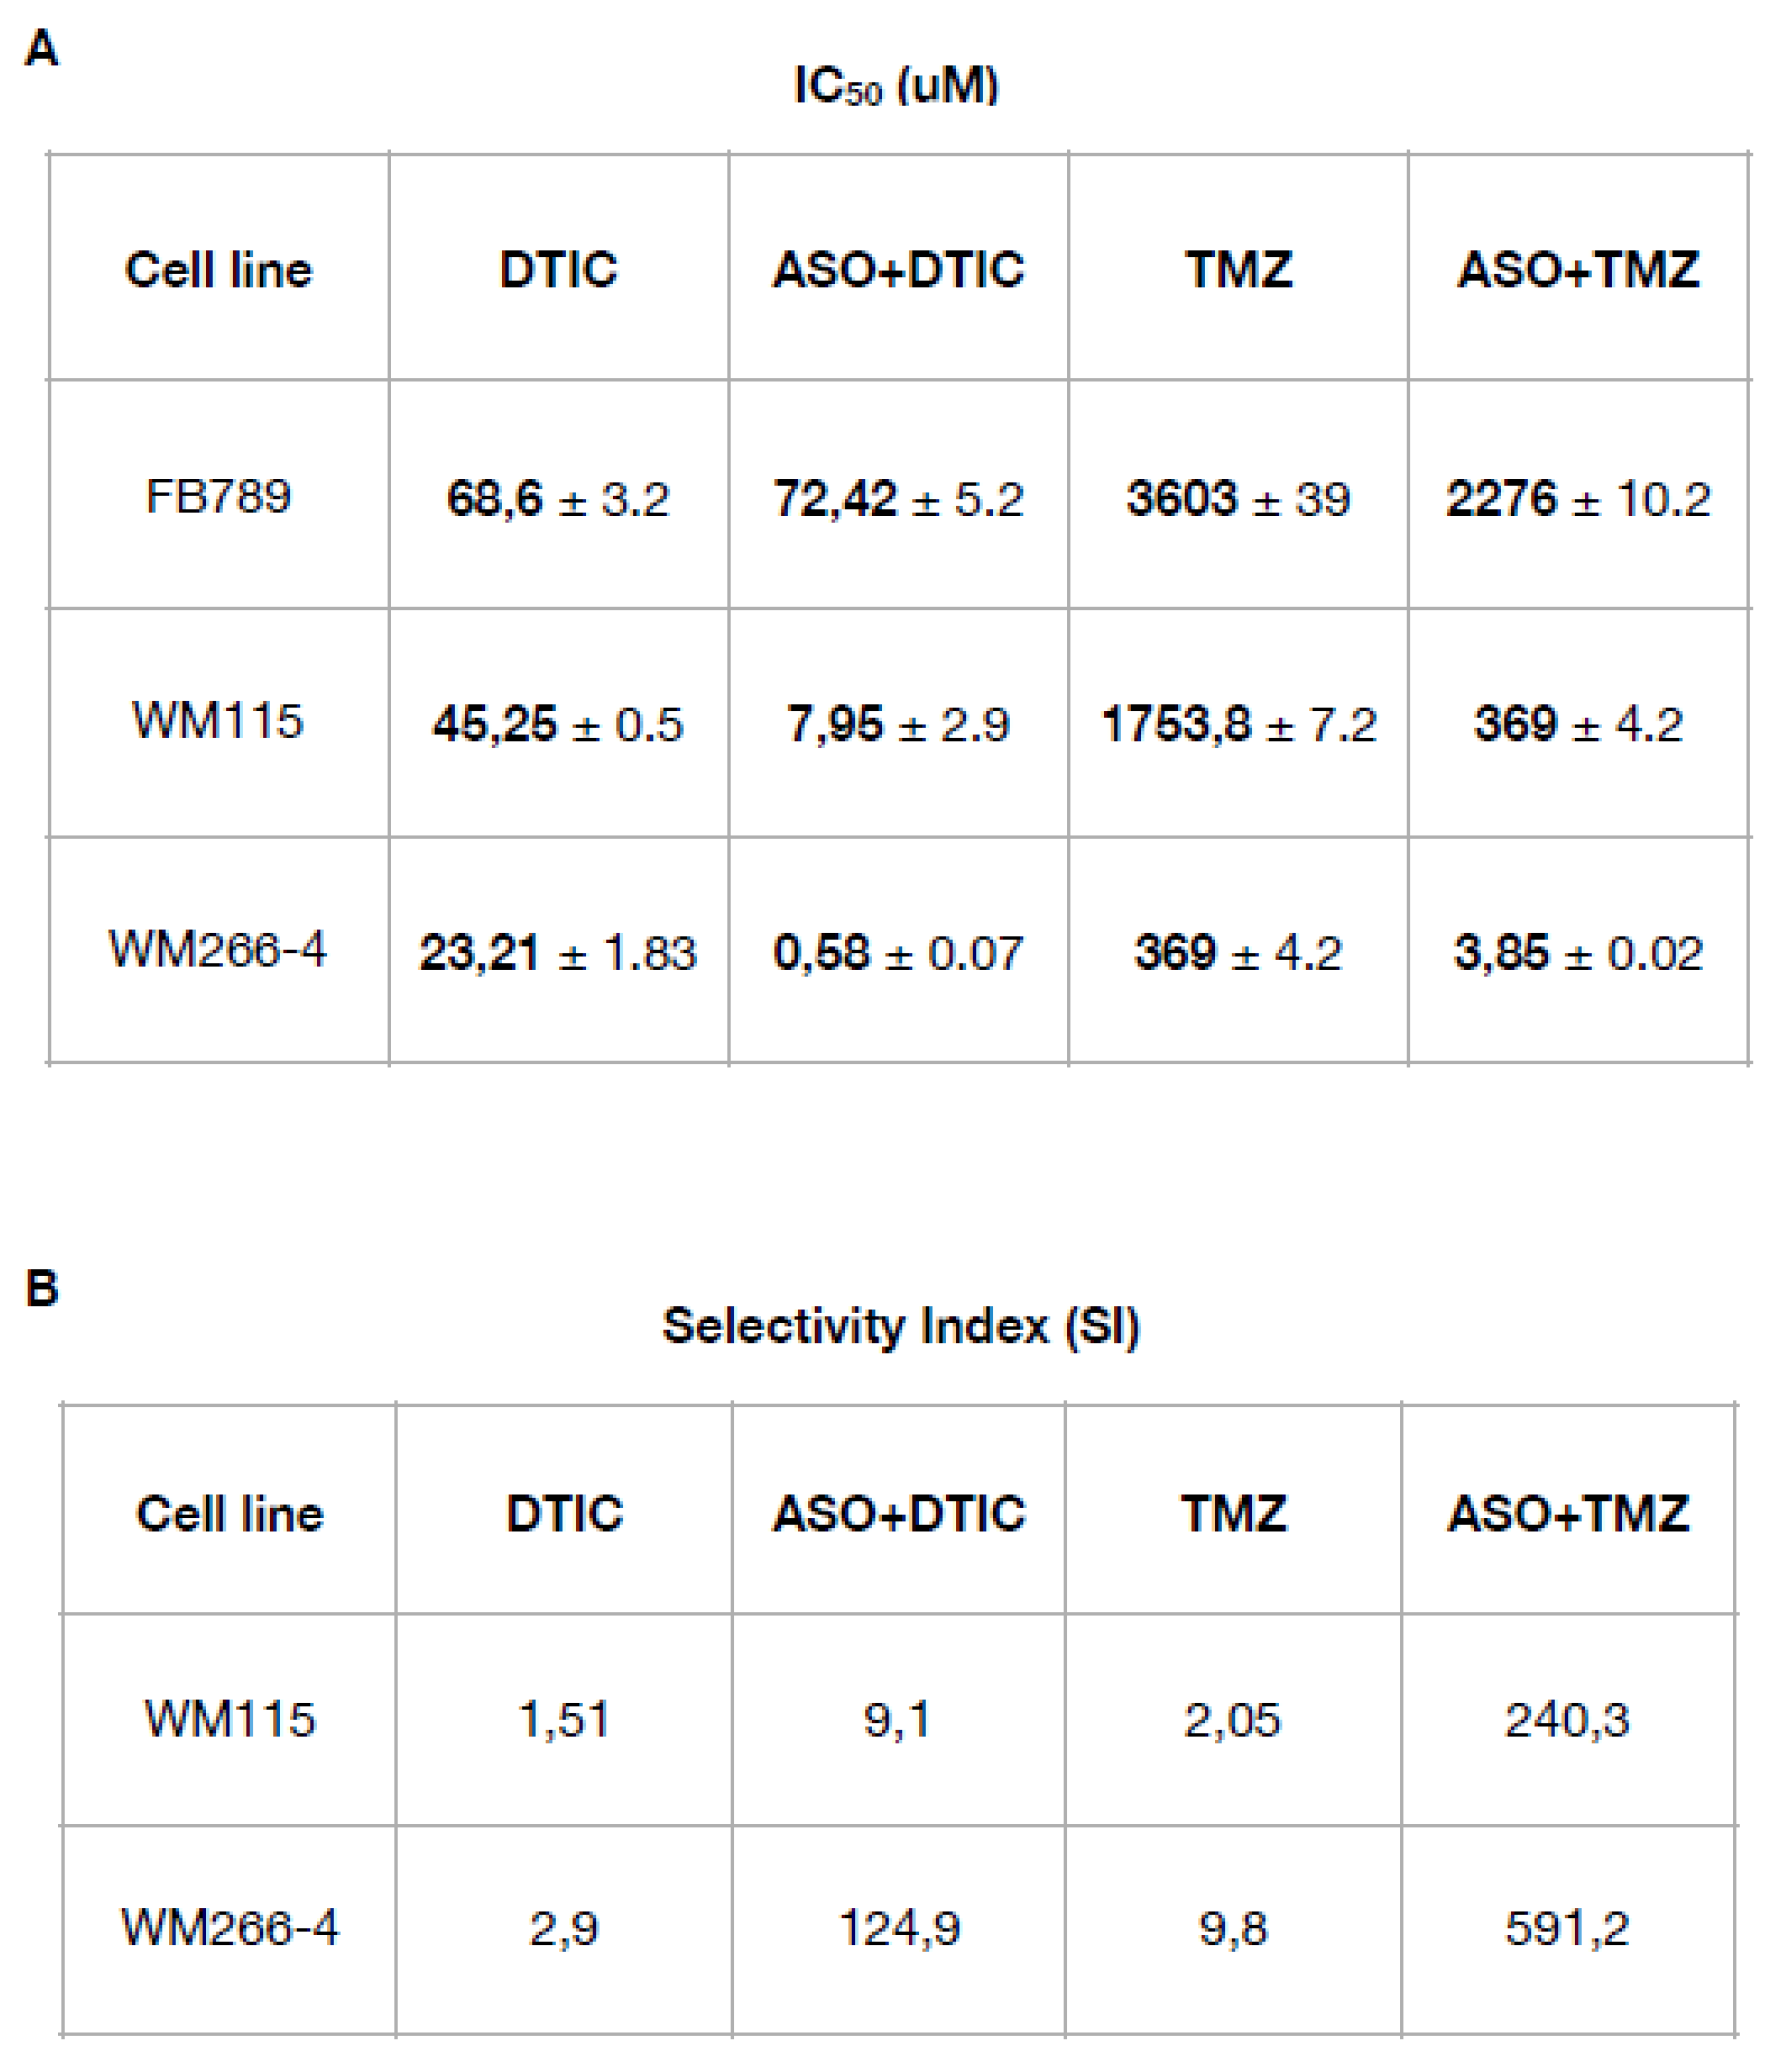
The next step was to calculate the selectivity index (SI) (Table 1B). SI calculated as the ratio of the drug's toxicity to normal cells (CC₅₀) to its effectiveness against target cells (IC₅₀), reflects how selectively a compound targets cancer cells over healthy cells [24]. A higher SI indicates greater selectivity, meaning the compound is more toxic to cancer cells than to normal cells, thereby highlighting its therapeutic potential. For WM115 cells, the SI increased from 1.51 with DTIC and 2.05 with TMZ to 9.1 (ASO+DTIC) and 240.3 (ASO+TMZ), respectively. For WM266-4 cells, the SI increased from 2.9 (DTIC) and 9.8 (TMZ) to 124.9 (ASO+DTIC) and 591.2 (ASO+TMZ), respectively. These results demonstrate that CSA silencing significantly enhances the chemosensitivity and selectivity of DTIC and TMZ toward melanoma cells, particularly in the metastatic setting, while minimizing toxicity to normal cells.
2.4. CSA Silencing Sensitizes Metastatic Melanoma Cells to Alkylating Agents via Enhanced DNA Damage and Apoptosis
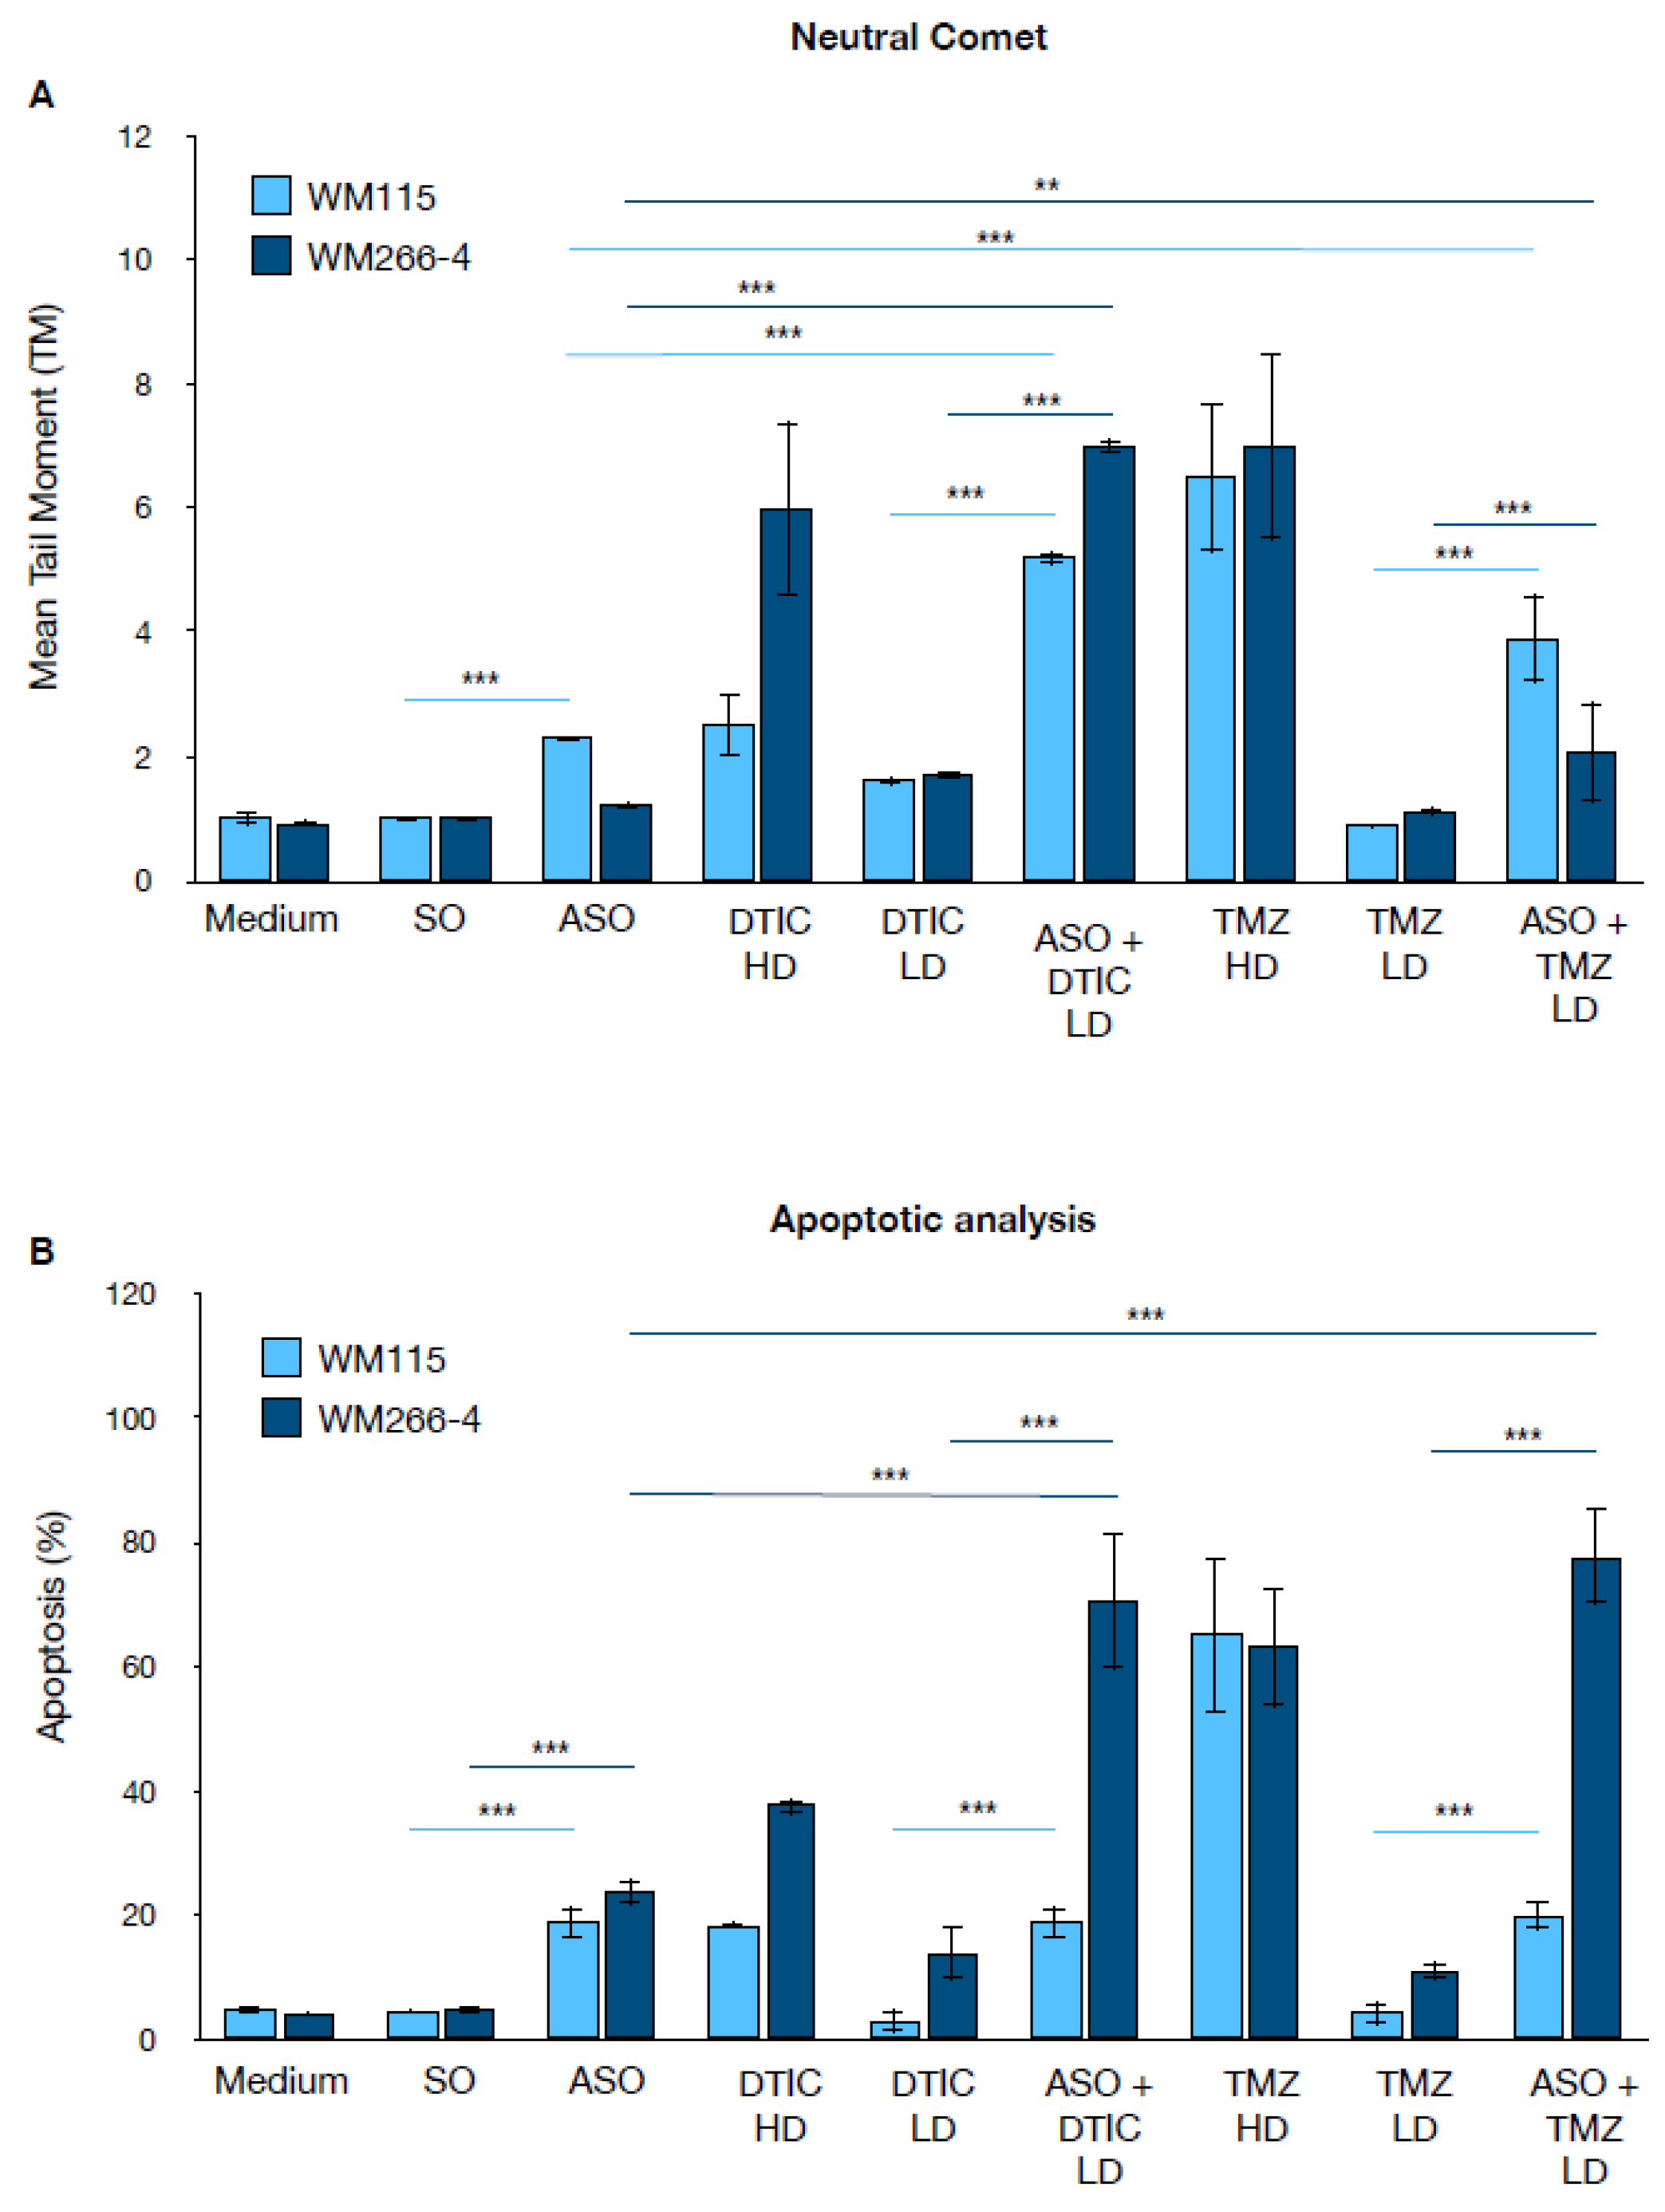
To elucidate the mechanism underlying CSA silencing-mediated chemo-sensitization, we measured DNA damage and apoptosis in melanoma cells treated with DTIC and TMZ. Figure 3A shows the results of the neutral comet assay, which quantifies DNA damage as the Mean Tail Moment (TM), in the melanoma cell lines WM115 and WM266-4. For both DTIC and TMZ, two different doses were used: a low dose (LD), corresponding to the IC50 in the presence of the ASO, and a high dose (HD), corresponding to the IC50 in the absence of the ASO (Table 1A). Under control conditions (Medium, SO), both cell lines exhibited low TM values, indicating minimal baseline DNA damage.
Silencing of the CSA protein (ASO) alone led to a slight increase in DNA damage, which was more pronounced in WM115 cells. Treatment with high doses of DTIC or TMZ resulted in a marked increase in TM, particularly in WM266-4 cells. Notably, the combination of CSA silencing with low doses of DTIC or TMZ (ASO + DTIC LD or ASO + TMZ LD) produced a significant increase in TM compared to single treatments, suggesting a synergistic effect on DNA damage—especially evident in WM266-4 cells. Figure 3B shows the percentage of apoptotic cells under the same experimental conditions. Control cells displayed low levels of apoptosis, while CSA silencing alone moderately increased apoptosis in both melanoma cell lines. High-dose DTIC and TMZ induced a strong apoptotic response, again more pronounced in WM266-4 cells. Strikingly, the combination of ASO with low-dose DTIC or TMZ led to a dramatic increase in apoptosis, reaching 70% in WM266-4 cells treated with ASO plus either DTIC LD or TMZ LD. Interestingly, in WM115 cells, the combination of ASO with low-dose DTIC or TMZ did not further increase apoptosis beyond the level observed with ASO treatment alone.
Based on the results from the comet assay and apoptosis analysis, WM266-4 metastatic melanoma cells showed a markedly higher sensitivity to CSA (ERCC8) silencing and to alkylating agents compared to the primary melanoma cell line WM115. Specifically, WM266-4 cells displayed a greater accumulation of DNA damage and a higher rate of apoptosis upon CSA depletion, particularly when combined with chemotherapeutic treatments. For this reason, the cell cycle analysis was focused on the WM266-4 line, as it represents the more responsive and biologically informative model to study the consequences of CSA knockdown in the context of genotoxic stress.
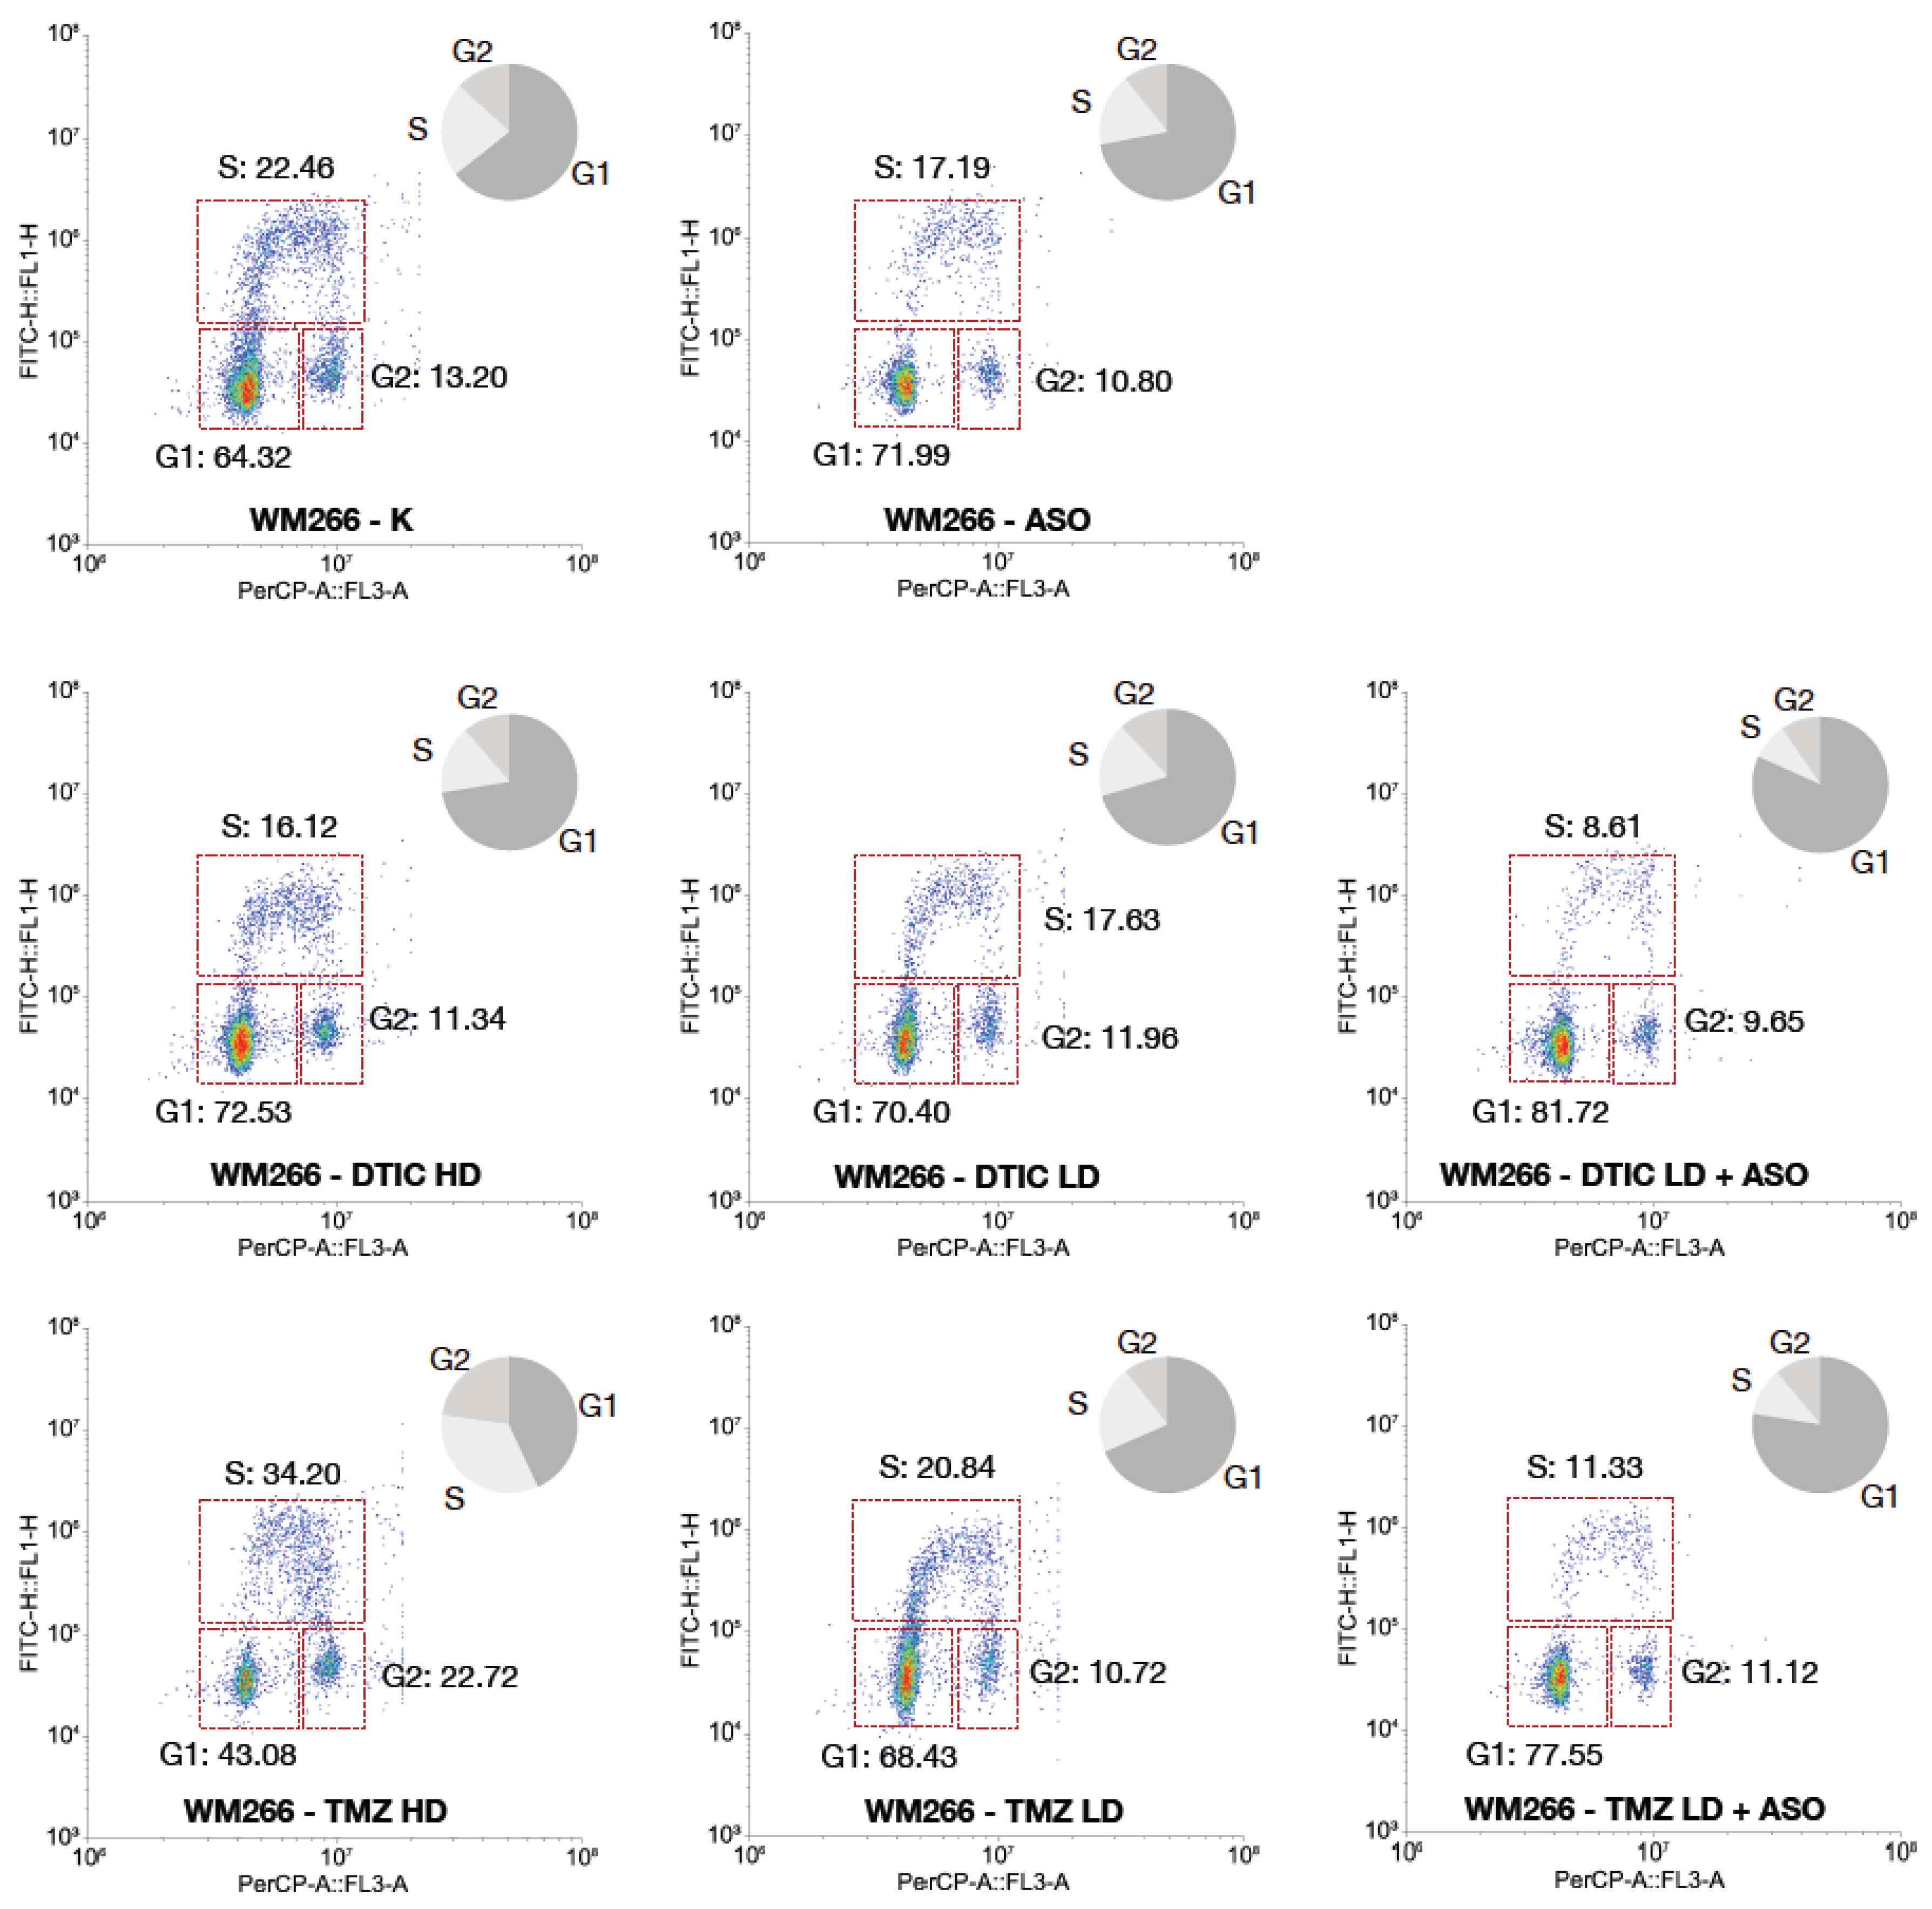
Flow cytometry analysis revealed that CSA knockdown profoundly affects cell cycle progression in WM266-4 cells, especially in combination with DNA-damaging agents. In control cells (K), the distribution was typical of a proliferating population, with 64.32% of cells in G1 phase, 22.46% in S phase, and 13.20% in G2/M. Silencing CSA alone induced a marked accumulation of cells in G1 phase (71.99%), accompanied by a reduction in S phase (17.19%) and a slight decrease in G2/M (10.80%), suggesting the activation of a G1 checkpoint even in the absence of exogenous DNA damage.
Treatment with DTIC, both at high and low doses, induced detectable alterations in cell cycle distribution compared to control (K). DTIC HD increased the G1 population (72.53% vs. 64.32% in control) and reduced the proportion of cells in S phase (16.12% vs. 22.46% in control), suggesting that DTIC can activate a G1 checkpoint or impair G1/S transition. A similar trend was observed with DTIC LD (G1: 70.40%, S: 17.63%). These data indicate that DTIC, even at low doses, affects cell cycle progression by reducing DNA synthesis activity, although the magnitude of this effect is less pronounced than that observed with TMZ or with the combination treatments involving CSA knockdown. Remarkably, the combination of DTIC LD with CSA silencing led to a profound G1 arrest, with 81.72% of cells accumulated in this phase, coupled with a dramatic reduction of the S-phase population to 8.61%. This suggests that in the absence of CSA, even low-dose DTIC triggers a robust checkpoint response that prevents entry into DNA synthesis, likely due to the accumulation of unrepaired DNA lesions.
A different pattern was observed upon TMZ treatment. TMZ at high dose induced a significant accumulation of cells in S phase (34.20%) and G2/M (22.72%), with a concomitant decrease in the G1 population (43.08%). This is indicative of replication stress and impaired progression through S phase, characteristic of alkylating agents inducing replication-blocking lesions. TMZ at low dose had a milder effect, with a cell cycle distribution comparable to control (G1: 68.43%, S: 20.84%, G2/M: 10.72%).
Strikingly, the combination of TMZ LD with CSA knockdown recapitulated the phenotype observed with DTIC LD plus ASO, leading to a strong G1 arrest (77.55%) and a marked decrease in S-phase cells (11.33%). This finding indicates that CSA depletion prevents cells from initiating DNA replication in the presence of TMZ-induced DNA damage.
Overall, these results suggest that CSA knockdown exacerbates the impact of alkylating agents by activating a robust G1 checkpoint, thereby blocking cell cycle progression prior to DNA synthesis. This cell cycle arrest correlates with the increased DNA damage and apoptosis previously observed, supporting the idea that CSA plays a critical role in protecting melanoma cells from genotoxic stress and in sustaining their proliferative capacity under DNA-damaging conditions. The restriction of this analysis to WM266-4 cells is justified by their higher dependency on CSA-mediated genome maintenance pathways, as evidenced by their greater vulnerability in the previous experiments.
Figure 4.
Bivariate flow cytometry analysis of cell cycle distribution in WM266-4 cells upon CSA silencing and alkylating agent treatment. WM266-4 cells were treated with antisense oligonucleotides targeting CSA (ASO), DTIC (high dose, HD; low dose, LD), TMZ (HD; LD), or corresponding combinations. Control cells (K) and ASO-alone treated cells were included. Cells were stained with PI (PerCP channel, x-axis) for DNA content and anti-BrdU-FITC (y-axis) for DNA synthesis detection. Representative bivariate plots display the distribution of cells in G1, S, and G2/M phases. Pie charts summarize the relative percentage of cells in each phase. Data are presented as the mean ± standard deviation (SD) from three independent biological replicates. Statistical significance is indicated by *** p < 0.001, as determined by t-Student Test.
2.5. Extension of CSA Silencing Effects on DTIC and TMZ Sensitivity Across Additional Melanoma Cell Lines
To validate our findings and gain deeper mechanistic insight, we assessed the impact of CSA (ERCC8) silencing on the drug sensitivity of four additional melanoma cell lines, including one derived from a primary tumor (WM1366) and three from metastatic lesions (UACC-62, UACC-257, and RPMI-7951), each exhibiting distinct responses to DTIC and TMZ.
Firstly, we verified that CSA-targeting ASO resulted in a significant reduction of CSA mRNA levels across all melanoma cell lines tested, as compared to both untreated controls (CTRL) and cells treated with SO (Suppl. Fig. 1). The effect was highly significant in UACC-62, UACC-257, RPMI7951, and WM1366 cells (***p < 0.001), and significant in FB789 (**p < 0.01), confirming the specificity and efficacy of ASO-mediated silencing. Notably, the basal expression of CSA (CTRL and SO groups) varied considerably among the different melanoma cell lines: WM1366 exhibited the highest CSA mRNA levels, followed by UACC-62, while FB789, UACC-257, and RPMI7951 showed lower basal expression. This heterogeneity in basal CSA expression highlights intrinsic differences among melanoma cell lines, which may reflect distinct regulatory mechanisms or cellular states. Importantly, in all cases, ASO treatment consistently reduced CSA mRNA to comparable low levels, regardless of the initial expression.
Next, we determined the IC50 values for DTIC and TMZ in each cell line before and after CSA silencing (Table 2).
Table 2.
(A) IC50 values (half maximal inhibitory concentration) ± SD for all the compounds (DTIC and TMZ) are expressed in μM. (B) The Selectivity Index (SI) was calculated as the ratio of IC50 values (normal cell line) to IC50 values (melanoma cancer cell line). An SI > 3 suggests that the drug is selective for cancer cells.
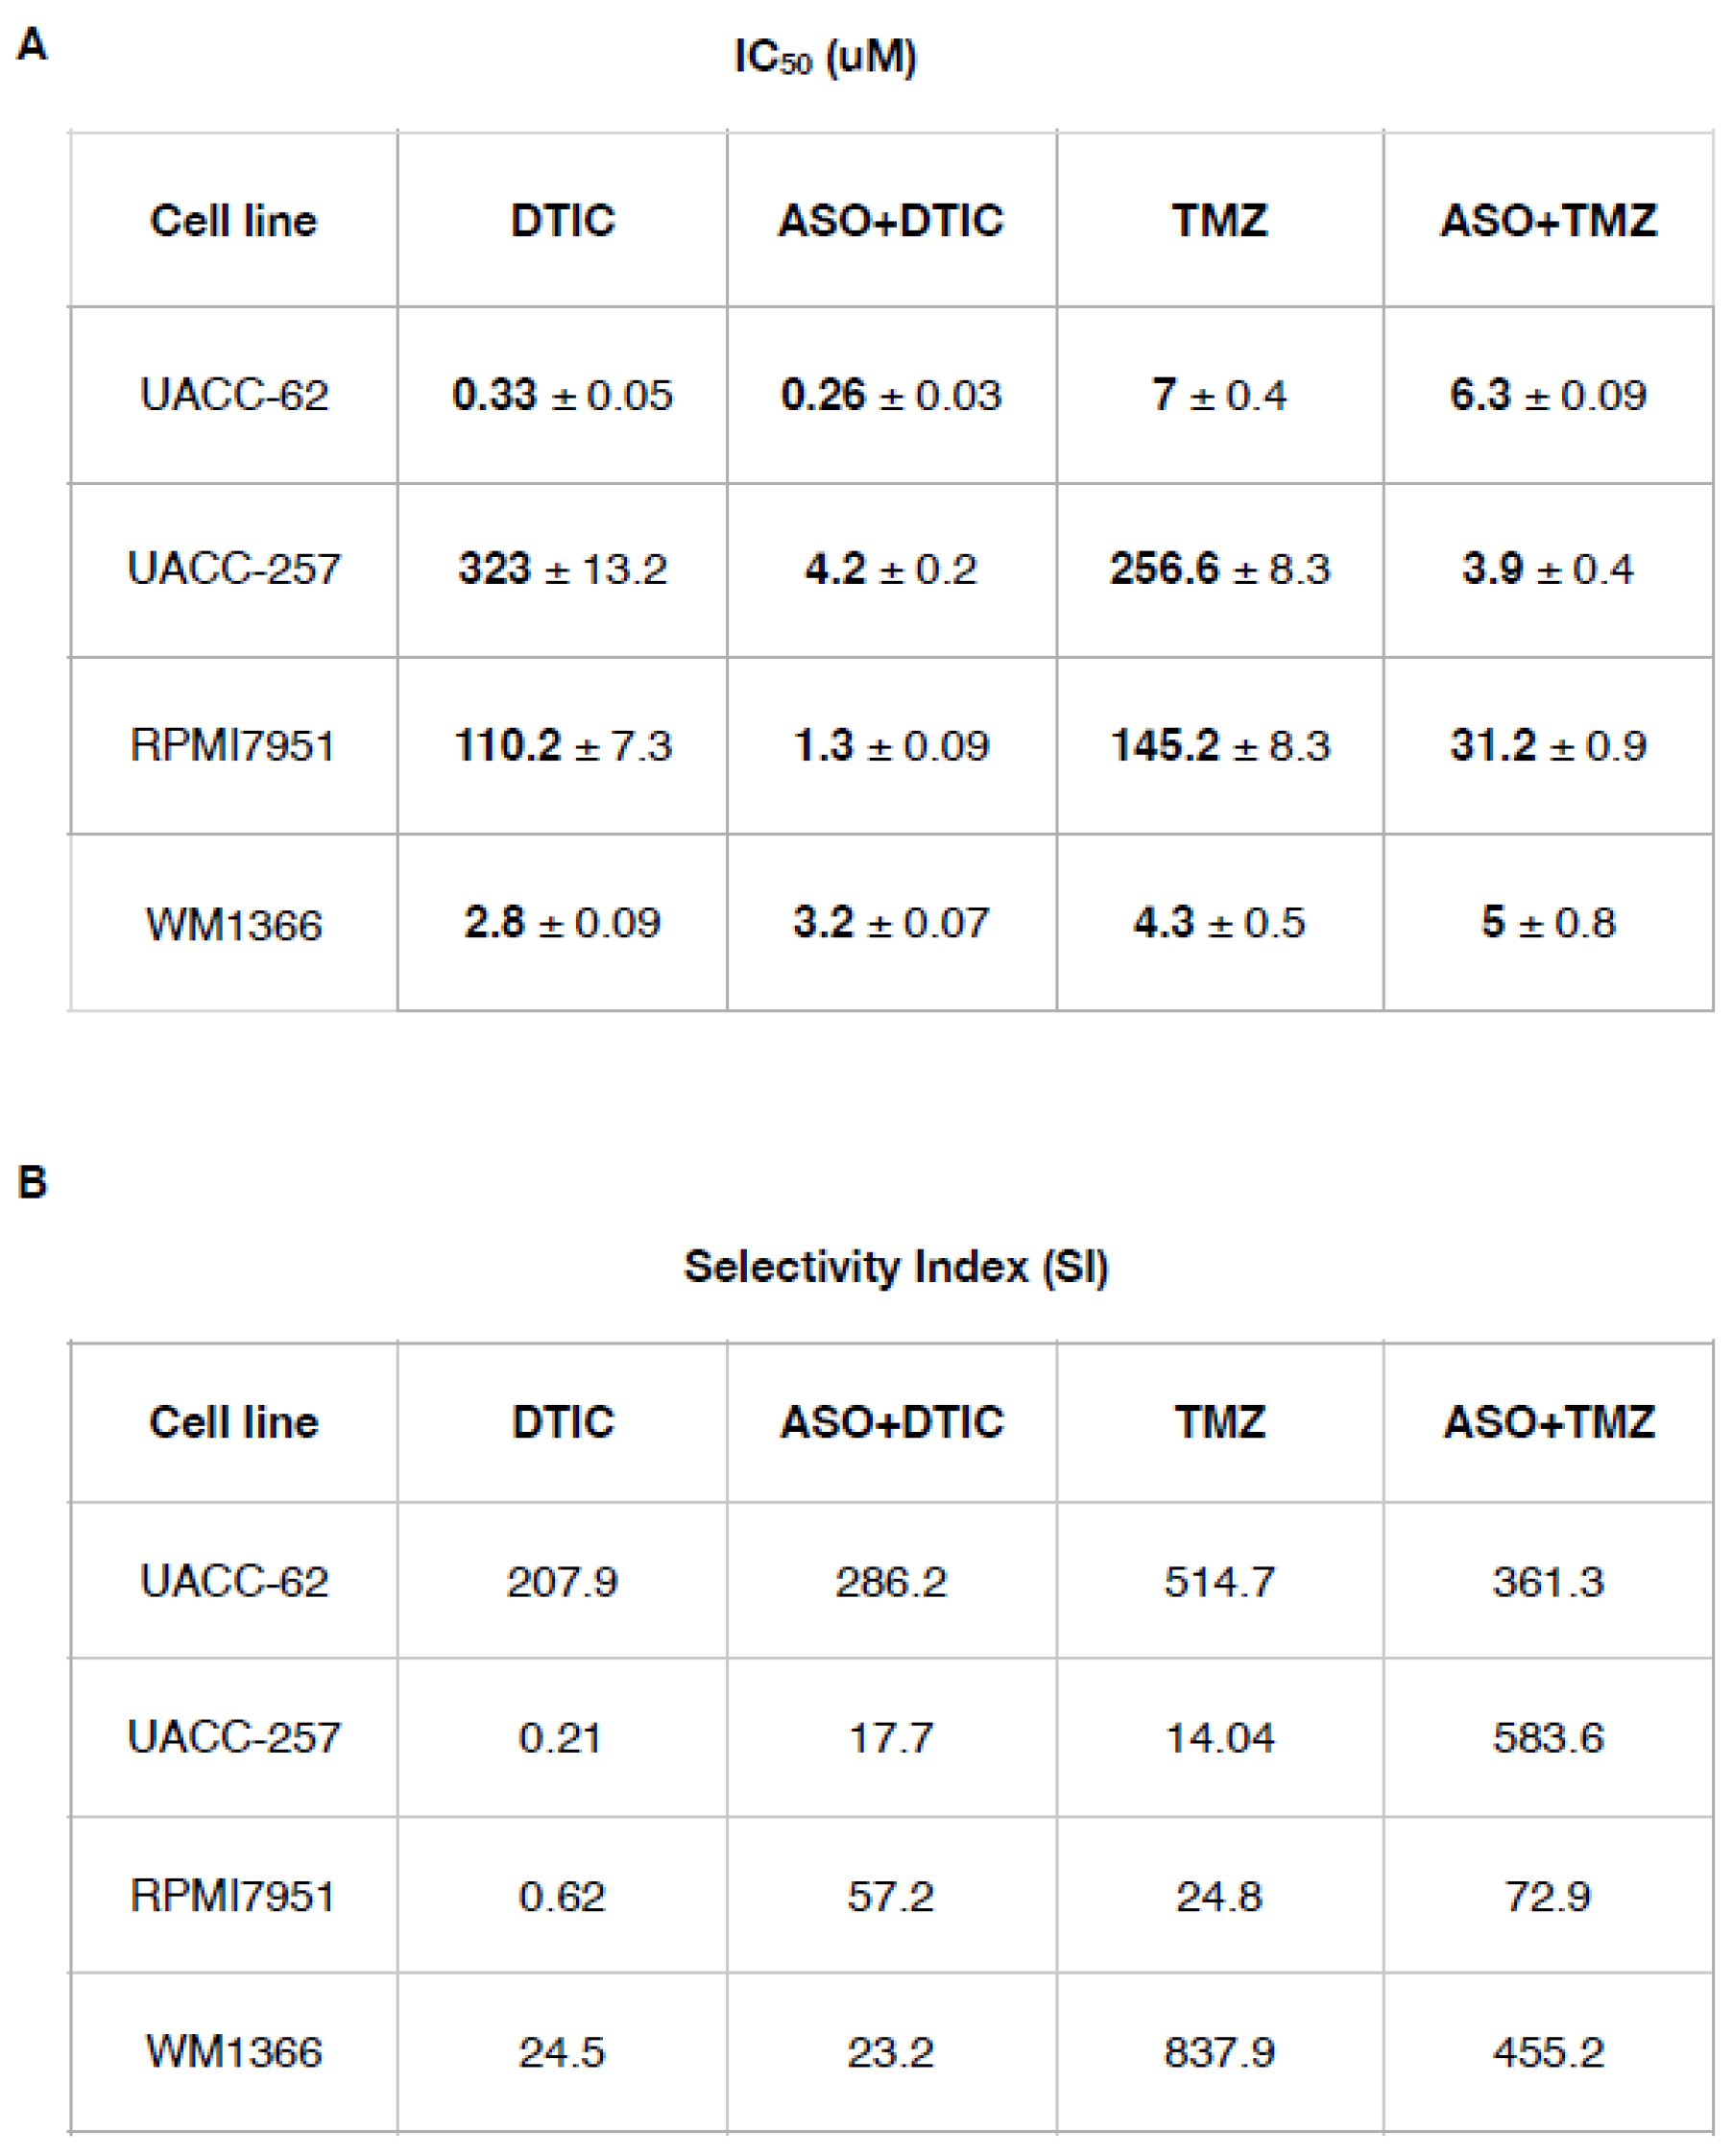
For example, in UACC-257 cells, a highly resistant line, treatment with DTIC alone results in an IC₅₀ of 323 ± 13.12 µM, whereas the combination with ASO reduces the IC₅₀ dramatically to 4.2 ± 0.2 µM. Similarly, TMZ monotherapy in UACC-257 shows a high IC₅₀ of 256.6 ± 8.3 µM, while the ASO+TMZ combination lowers it to 3.9 ± 0.4µM, highlighting a substantial increase in drug efficacy. Comparable trends are observed in RPMI7951 cells, where ASO co-treatment significantly reduces IC₅₀ values for both DTIC and TMZ.
Regarding the two sensitive lines (UACC-62 and WM1366), these exhibited relatively low baseline IC50 values for both drugs, consistent with their inherent sensitivity. Upon CSA silencing, a significant, albeit modest, further reduction in IC50 was observed.
Regarding the SI, used to quantify the degree of sensitization achieved by ASO co-treatment, our study showed that the sensitive cell lines (UACC-62, WM1366) did not gain a significant advantage from CSA silencing, as reflected by their SI values, indicating no meaningful increase in sensitivity to DTIC and TMZ. Conversely, the resistant cell lines (UACC-257, RPMI7951) displayed a marked increase in SI values, demonstrating a pronounced sensitization effect despite their higher baseline IC50s. This approach allows precise assessment of how CSA silencing enhances drug efficacy by significantly lowering IC50 in resistant melanoma cell lines.
3. Discussion
Although immunotherapies and BRAF/MEK inhibitors are the main treatments for melanoma, some patients still benefit from conventional chemotherapy — especially those with brain metastases who do not respond to, cannot tolerate, or progress after first-line therapies. In these cases, DNA-methylating agents like Dacarbazine (DTIC) and Temozolomide (TMZ) remain among the few available options, despite their low response rates and limited survival benefits. Moreover, their toxicity often impacts patients’ quality of life. This highlights the need for new strategies to improve both the efficacy and safety of DTIC- and TMZ-based treatments.
In this study, we demonstrate that Antisense Oligonucleotide (ASO)-mediated suppression of CSA dramatically sensitizes melanoma cells—particularly metastatic ones—to DTIC and TMZ. Specifically, in primary melanoma cells (WM115), CSA silencing reduces the IC₅₀ by approximately fivefold for both drugs. In metastatic melanoma cells, the effect is even more pronounced, with IC₅₀ reductions of about 40-fold for DTIC and 95-fold for TMZ. As a result, we observed a striking increase in the selective index (SI) for both drugs. These findings suggest that co-treatment with DTIC or TMZ and selective CSA inhibitors could enable significant dose reductions while enhancing both the efficacy and tolerability of the chemotherapeutic regimen.
The integrated analysis of DNA damage and apoptosis further substantiate the role of CSA gene silencing in enhancing the genotoxic and pro-apoptotic effects of chemotherapy in melanoma cells. In the comet assay, both WM115 and WM266-4 melanoma cells exhibited markedly increased DNA damage, as indicated by higher mean tail moments, when treated with the combination of ASO-mediated CSA knockdown and low-dose (LD) DTIC or TMZ compared to either treatment alone. Notably, the level of DNA damage induced by the ASO+DTIC LD or ASO+TMZ LD combinations approached or exceeded that observed with high-dose (HD) chemotherapy, especially in the more aggressive WM266-4 cell line. This synergistic increase in DNA damage correlates with the apoptotic data, where the combination treatments dramatically increased apoptosis rates compared to single treatments. Particularly, the ASO+TMZ LD combination led to apoptosis levels nearing 80% in WM266-4 cells, significantly higher than with TMZ HD alone, highlighting the heightened vulnerability of metastatic melanoma to CSA silencing. In contrast, the pro-apoptotic effect in WM115 cells, although significant, was less pronounced, suggesting a greater dependency of metastatic cells on CSA-mediated DNA repair pathways. These findings align with the IC₅₀ and selectivity index data, confirming that CSA knockdown sensitizes melanoma cells, in particular the metastatic ones, to chemotherapy by exacerbating DNA damage and promoting apoptosis while potentially allowing for dose reduction, thereby minimizing toxicity to normal cells.
In addition, we found that CSA ablation alone markedly reduces the tumorigenic potential and overall fitness of both primary and metastatic melanoma cell lines, which characteristically show elevated CSA expression. Importantly, this effect appears highly selective, as CSA depletion does not affect the viability or fitness of normal fibroblasts. Combined with the observation that CSA ablation strongly enhances melanoma cell sensitivity to DTIC and TMZ, these findings raise a compelling question: why are melanoma cells so critically dependent on CSA to sustain their proliferation, invasive capacity, and resistance to apoptosis?
In this context, we and others have previously shown that CSA plays multiple roles in enhancing cancer cell survival by promoting adaptive responses. These roles include regulating DNA repair mechanisms, modulating the hypoxia response, activating the unfolded protein response (UPR), and suppressing pro-apoptotic pathways—particularly those mediated by p53 and ATF3 [17,25]. Collectively, these functions likely contribute to the cancer cells’ dependence on CSA for maintaining their malignant phenotype.
Noteworthy, our study finds that CSA ablation sensitizes the metastatic WM266-4 melanoma cells significantly more than the primary WM115 cells to DTIC and TMZ treatment. We hypothesize that this differential sensitivity arises from an increased dependency on CSA in metastatic cells, driven by the selective pressures associated with melanoma progression. Supporting this notion, a recent proteomic analysis comparing WM115 and WM266-4 cells revealed that the metastatic WM266-4 line exhibits enhanced activity of the ATM and DNA-PK kinases—key sensors of DNA damage that activate p53-mediated apoptotic responses [25]. It is plausible that, in response to this heightened p53 activity, WM266-4 cells become increasingly dependent on anti-apoptotic factors such as CSA to counterbalance elevated pro-apoptotic signaling and sustain survival.
Our cell cycle analysis revealed that CSA silencing significantly reduced the S-phase population, consistent with delayed S-phase entry. This likely reflects activation of the G1/S checkpoint in response to unresolved DNA damage due to impaired Transcription-Coupled Nucleotide Excision Repair (TC-NER). In CSA-deficient cells, alkylation-induced lesions (e.g., O6-methylguanine from TMZ or DTIC) accumulate in G1, and cells may enter S-phase under-repaired, exacerbating replication stress and leading to increased double-strand breaks (DSBs), as shown by the neutral comet assay [26]. A key factor in this response is the distinct timing of DNA damage induction by DTIC and TMZ. DTIC, as a prodrug requiring hepatic activation via cytochrome P450 enzymes, leads to delayed intracellular generation of methylating species. This allows DNA damage to be detected before replication starts, activating p53-dependent G1 checkpoints and resulting in G1 arrest. In contrast, TMZ undergoes rapid, spontaneous conversion to its active form under physiological conditions, inducing DNA lesions during replication. This causes replication fork stalling and triggers intra-S phase checkpoints, leading to S-phase accumulation. Notably, CSA knockdown shifts the TMZ-induced arrest from S to G1, suggesting that CSA facilitates S-phase entry under genotoxic stress, possibly by modulating checkpoint responses or resolving transcription-replication conflicts. The resulting G1 retention represents a vulnerable window, where damaged cells are sensitized to alkylating agents. This supports the rationale for targeting CSA in combination therapies, particularly in melanoma, where synthetic lethality with TMZ/DTIC could be therapeutically exploited.
The data presented in Table 2 confirms the significant impact of CSA/ERCC8 silencing via antisense oligonucleotides (ASO) on the sensitivity and selectivity of melanoma cell lines to alkylating agents DTIC and TMZ. In particular, the IC₅₀ values reveal a marked decrease in drug resistance in resistant melanoma cell lines (UACC-257 and RPMI7951) upon co-treatment with ASO, indicating that CSA silencing sensitizes these cells to chemotherapeutic agents.
For example, in UACC-257 cells, a highly resistant line, treatment with DTIC alone results in an IC₅₀ of 252.7 µM, whereas the combination with ASO reduces the IC₅₀ dramatically to 0.21 µM. Similarly, TMZ monotherapy in UACC-257 shows a high IC₅₀ of 391.3 µM, while the ASO+TMZ combination lowers it to 3.3 µM, highlighting a substantial increase in drug efficacy. Comparable trends are observed in RPMI7951 cells, where ASO co-treatment significantly reduces IC₅₀ values for both DTIC and TMZ.
The Selectivity Index values further support the therapeutic advantage of CSA silencing. SI, defined as the ratio of cytotoxicity in normal versus cancer cells, is a key indicator of therapeutic window and safety. Notably, in resistant lines such as UACC-257 and RPMI7951, SI values for both DTIC and TMZ are extremely low when used alone (0.27 and 0.75 for DTIC, respectively), indicating poor selectivity and potential off-target toxicity. However, upon ASO co-treatment, the SI values increase dramatically (e.g., to 344.8 and 73.9 for ASO+DTIC, respectively), suggesting that CSA knockdown not only enhances drug sensitivity but also improves therapeutic selectivity.
Interestingly, the effects of ASO co-treatment are less pronounced in sensitive lines such as UACC-62 and WM1366, where baseline IC₅₀ and SI values are already favorable. This observation suggests that CSA-mediated resistance mechanisms may be more relevant in intrinsically resistant melanoma subtypes.
One possible explanation for the observed sensitization of resistant melanoma cell lines (such as UACC-257 and RPMI7951) to DTIC and TMZ following CSA/ERCC8 silencing lies in the established role of CSA in DNA damage repair, particularly in TC-NER. CSA is known to facilitate the repair of bulky DNA lesions, including those induced by alkylating agents like DTIC and TMZ, which generate methyl adducts and other DNA modifications that can stall transcription and replication [27].
Resistant melanoma lines such as UACC-257 and RPMI7951 have been shown in previous studies to exhibit an upregulation of DNA repair pathways, including components of TC-NER and base excision repair (BER), contributing to their intrinsic chemo-resistance [28,29]. The high basal expression or activity of CSA in these cells may therefore enable efficient removal of drug-induced DNA lesions, allowing them to survive treatment with otherwise cytotoxic alkylating agents.
By silencing CSA, the cells lose a critical component of TC-NER, which likely leads to the accumulation of unrepaired DNA damage upon exposure to DTIC or TMZ. This persistent damage would then activate apoptotic pathways or trigger mitotic catastrophe, thereby increasing cell death [30]. Importantly, the pronounced effect of CSA knockdown in resistant cell lines, but not in already sensitive lines like UACC-62 and WM1366, supports the idea that CSA function is particularly relevant in the context of acquired or intrinsic resistance mechanisms.
Moreover, CSA has also been implicated in modulating oxidative stress responses and proteostasis [31,32], which may further contribute to cellular resilience in drug-resistant melanoma. Its silencing might thus compromise additional survival pathways beyond DNA repair, amplifying the cytotoxic impact of alkylating agents in resistant cells. Taken together, these mechanistic insights align with the phenotypic data and support a model in which CSA acts as a key resistance factor, whose inhibition can restore chemo-sensitivity in aggressive melanoma subtypes.
In summary, these findings indicate that CSA/ERCC8 plays a critical role in mediating resistance to alkylating agents in melanoma. Silencing CSA via ASOs significantly enhances both the cytotoxic efficacy and selectivity of DTIC and TMZ, particularly in resistant cell lines. These results support further investigation of CSA as a promising therapeutic target to overcome chemo-resistance in melanoma.
4. Materials & Methods
4.1. Cell Lines
One normal (FB789) and two melanoma cancer WM115 (primary) and WM266-4 (metastatic) cell lines were used. FB789 is a primary epithelial fibroblast and it was grown in DMEM/F10 (Thermo Fisher, Waltham, MA, USA) medium. WM115 human melanoma cells have originated from a primary cutaneous tumor, whereas the WM266-4 melanoma cell line was derived from a lymph node metastasis of the same patients [33]. Both cell lines feature the oncogenic mutation at codon 600 in BRAF gene where a residual Valine was replaced with an Aspartatic acid (V600D). WM115 and WM266-4 were grown in Mimimal Essential Medium (MEM) (Thermo Fisher, Waltham, MA, USA) supplemented with 1% Na-Piruvate and 1% of Non-Essential Amminoacids (NEA) (Thermo Fisher, Waltham, MA, USA). All culture mediums were supplemented with 10% Foetal Bovine Serum (FBS, Invitrogen), 2 mM Glutamine (Lonza), and 40 µg/mL of Gentamicin (Sigma-Aldrich: ST.Louis, MO,USA). FB789, WM115 and WM266-4 were kindly provided by Dr. Elena Dell’Ambra.
4.2. Oligonucleotides Transfection
The Oligonucleotide Transfection was performed as previously described [17] with minor modification. The final concentration of oligonucleotides used for transfection was 100 nM. The cells were incubated at 37°C and 5% CO2 until the analysis was carried out at 48 h after transfection without the need to change the transfection medium. Oligonucleotide sequences are available on request.
4.3. DTIC and TMZ Treatment in Presence or Not of CSA Oligonucleotide Antisense
Cell lines were seeded the day before drug treatment in an appropriate concentration. DTIC was used in a range of 0.3 to 10 µM in all cell lines. TMZ treatments are between 7.34 and 500 µM. At the end of 24 h treatment, the IC50 value was calculated using GraphPad V.8 program (San Diego, CA, USA). In combined ASO treatment, DTIC and TMZ were added after the medium change at 48 h for an additional 24 h.
4.4. Protein Expression Analysis by Western Blot
Protein extracts from FB789, WM115 and WM266-4 were extracted in RIPA Buffer. They were fractionated by SDS-PAGE and transferred to Nitrocellulose membrane (Biorad Laboratories, Hercules, CA, USA). Primary antibodies used were CSA (Cell signalling Techology, Danvers, MA, USA) and β-ACTIN (Santa Cruz Biotecnology, Santa Cruz, CA, USA), while secondary antibodies were HRP conjugated.
4.5. RNA Extraction and qRT-PCR
1.5x10⁵ cells were seeded in 60 mm-dishes. After twenty-four hours, total RNA was extracted and purified according to the manufacturer’s instructions (Total RNA Purification Kit, Geneaid). RNA was quantified using a fluorimetric assay (Qubit, Thermofisher). cDNA synthesis was performed using the PrimeScript cDNA Synthesis kit (Taqara, BioEurope). Comparative qRT-PCR was carried out with GoTaq qPCR SYBR green master mix (Promega, Madison, WI, USA),and amplified with Mx3005P Real-Time PCR system (Agilent, Santa Clara, CA, USA). Results were normalized to β-Actin. Primer sequences are available on request.
4.6. Cell Viability MTT Assay
FB789, WM115 and WM266-4 cells were seeded in 96 well microplates (2000 cells/well in 100 μl medium) and incubated overnight to allow cell adherence. At the end of the treatments with the ASO and chemotherapeutic agents the cells were treated with MTT (10 μl of the 12 mM stock solution) and incubated at 37 °C for 4 h. DMSO lysis solution (100 μl) was added to dissolve the formed formazan crystals. The absorbance was then measured with a microplate reader at 570 nm and 630 nm. The IC50 value was calculated by Graph-Pad software Version 8 [34].
4.7. Proliferation Tripan Blue Exclusion (TBE) Assay
Briefly, 1x10⁵ cell lines were seeded in 6-well dishes. The cell proliferation assay was performed using 0.05% Trypan Blue solution to distinguish live and dead cells within a Burker chamber. Around 500 cells for three replicate counts were determined at each time point (24 h and 48 h after transfection.
4.8. Apoptosis Assay
A combination of fluorescent dyes was mixed. Fluorescein Diacetate (FDA; 15 µg/mL), Propidium Iodide (PI, 5 µg/mL), and Hoechst (HO, 2 µg/mL) was used to differentiate apoptotic cells from viable cells. FDA and HO are vital dyes that stain the cytoplasm and nucleus of the viable cells, respectively, while the necrotic and the late stage of apoptotic cells are readily identified by PI staining. Approximately 500 randomly chosen cells, from three independent experiment, were microscopically analyzed to determine apoptosis levels.
4.9. Wound Healing Assay
Cells were seeded in 60mm- Petri dishes to reach the confluence. One day after seeding, an artificial wound was created with the end of a yellow tip.
Images were collected 48h after ASO or SO transfection using Axio Camera 208 color and the width of the wound was analyzed by ImageJ software.
4.10. Cell Cycle Analysis
For cell cycle analysis, aliquots of 1x10⁶ cells were seeded in a complete medium in 10 cm Petri dishes. 1hr before fixation in 70% ethanol, 10 μ M Bromodeoxyuridine (BrdUrd) was added to medium culturing. Each sample were exposed to acid denaturation (3N HCl) and then were incubated for 1 h in a blocking solution (10% normal goat serum/PBS). After that, samples were serially incubated with a primary antibody to BrdUrd (1:100 in blocking solution) and then a secondary FITC-conjugated antibody (1:50 in blocking solution). Samples were re-suspended in 20 μg/ml propidium iodide (PI) prior to analysis.
4.11. Neutral Comet Assay
The Neutral Comet Assay was performed as described earlier under visible fluorescent light with minor modification [35].
After ASO and drug treatments, cells were collected and processed for the assay. Briefly, 20 μl of the cell suspension (5 × 10⁵ cells) were mixed with 80 μl of 0.7% Low Melting-Point Agarose (LMPA) in PBS at 37 °C and immediately pipetted onto a frosted glass microscope slide pre-coated with a layer of 1% Normal Melting-Point Agarose (NMPA), similarly prepared in PBS. Two slides for each sample were then incubated in lysis solution (2.5 M NaCl, 10 mM Tris–HCl, 100 mM EDTA, pH:10, with 1% Triton and 10% DMSO freshly added) for 1 day at 4 °C. After lysis, slides were washed three times with electrophoresis buffer (300 mM Sodium Acetate, 100 mM Tris-HCl pH:8.3) and then placed on a horizontal electrophoresis unit containing fresh electrophoresis buffer Electrophoresis was conducted for 60 min at 18 V and variable mA at 4 °C. Subsequently, the slides were gently washed three times in PBS for 5 min and fixed in fresh 100% methanol for 3 min. Slides were stained with 50 μl DAPI (20 μg/ml) and covered with a coverslip. Stained nucleoids were examined at confocal microscopy and analyzed with IMAGE J software. To evaluate the amount of DNA damage, program-generated Tail-Moment (TM) values and percentages of DNA damage were used. For each experimental point, 100 cells were scored from two slides for a total of 200 cells.
4.12. Statistical Analysis
Statistical analysis was performed by using the Graphpad software version 8.To test the statistically significant difference between FB789 and the melanoma cell lines (WM115 and WM266-4) following CSA silencing with ASO in the presence or absence of the chemotherapeutic agents, the t-Student tests were performed. All the statistical tests were conducted by setting the significance level at three different value *p<0.05, **p< 0.01 and ***p<0.001.
5. Conclusions
This section is mandatory, with one or two paragraphs to end the main text.
Supplementary Materials
The following supporting information can be downloaded at the website of this paper posted on Preprints.org. Supplementary Figure 1. qRT-PCR analysis of CSA mRNA expression 48 hours after transfection with antisense oligonucleotide (ASO) or control treatments. Data are normalized to β-actin and presented as the mean ± SD of three independent experiments. ***p < 0.001, determined by t-Student Test.
Author Contributions
For research articles with several authors, the following statements should be used “Conceptualization, X.X. and Y.Y.; methodology, X.X.; software, X.X.; validation, X.X., Y.Y. and Z.Z.; formal analysis, X.X.; investigation, X.X.; resources, X.X.; data curation, X.X.; writing—original draft preparation, X.X.; writing—review and editing, X.X.; visualization, X.X.; supervision, X.X.; project administration, X.X.; funding acquisition, Y.Y. All authors have read and agreed to the published version of the manuscript.”.
Funding
This research received no external funding or This research was funded by [name of funder] grant number [xxx] And The APC was funded by [XXX]. Information regarding the funder and the funding number should be provided. Please check the accuracy of funding data and any other information carefully.
Acknowledgments
We acknowledge financial support under the National Recovery and Resilience Plan (NRRP), Mission 4, Component 2, Investment 1.1, Call for tender No. 104 published on 2.2.2022 by the Italian Ministry of University and Research (MUR), funded by the European Union – NextGenerationEU– Project Title REBALANCE – CUP J53D23003180006 - Grant Assignment Decree No. 970 adopted on 30 June 2023 by the Italian Ministry of Ministry of University and Research (MUR). We thank Prof. María S. Soengas (Melanoma Laboratory, Molecular Oncology Programme, Spanish National Cancer Research Centre (CNIO), Madrid, Spain) for kindly providing us with several melanoma cell lines.
Declaration of Generative AI and AI-Assisted Technologies in the Writing Process
During the preparation of this work, the author(s) used ChatGPT to check spelling and grammar, and occasionally to paraphrase portions of the text. After using this tool, the author(s) reviewed and edited the content as needed and take full responsibility for the final version of the manuscript.
Conflicts of Interest
Declare conflicts of interest or state “The authors declare no conflict of interest.”.
References
- Wang X, et al. Recent global patterns in skin cancer incidence, mortality, and prevalence: a review of GLOBOCAN 2022 data. Chin Med J (Engl). 2024. [PubMed]
- Feller L, Khammissa RAG, Kramer B, Altini M, Lemmer J. Basal cell carcinoma, squamous cell carcinoma and melanoma of the head and face. Head Face Med. 2016;12:11. [CrossRef] [PubMed] [PubMed Central]
- European consensus-based interdisciplinary guideline for melanoma. Part 1: Diagnostics - Update 2024. Eur J Cancer. 2025;215:115152.
- Karami Fath M, Azargoonjahromi A, Soofi A, et al. Current understanding of epigenetics role in melanoma treatment and resistance. Cancer Cell Int. 2022;22(1):313. [CrossRef] [PubMed] [PubMed Central]
- Luke JJ, Flaherty KT, Ribas A, Long GV. Targeted agents and immunotherapies: optimizing outcomes in melanoma. Nat Rev Clin Oncol. 2017;14(8):463–482.
- Subbiah V, Puzanov I, Blay JY, et al. Pan-Cancer efficacy of vemurafenib in BRAFV600-mutant non-melanoma cancers. Cancer Discov. 2020;10(5):657–663. https://doi.org/10.1158/2159-8290.CD-19-1265. [CrossRef] [PubMed] [PubMed Central]
- Abdulkarim LS, Motley RJ. First-line advanced cutaneous melanoma treatments: where do we stand? JMIR Cancer. 2021;7(4):e29912. https://doi.org/10.2196/29912. [CrossRef] [PubMed] [PubMed Central]
- Sullivan RJ, Flaherty KT. Resistance to BRAF-targeted therapy in melanoma. Eur J Cancer. 2013;49(6):1297–1304.
- Larkin J, Chiarion-Sileni V, Gonzalez R, et al. Five-year survival with combined nivolumab and ipilimumab in advanced melanoma. N Engl J Med. 2019;381(16):1535–1546. [CrossRef] [PubMed]
- Hodi FS, Chiarion-Sileni V, Gonzalez R, et al. Nivolumab plus ipilimumab or nivolumab alone vs ipilimumab alone in advanced melanoma (CheckMate 067): 4-year outcomes. Lancet Oncol. 2018;19(11):1480–1492.
- Weber JS, D’Angelo SP, Minor D, et al. Nivolumab vs chemotherapy in advanced melanoma progressed after anti–CTLA-4 (CheckMate 037): a phase 3 trial. Lancet Oncol. 2015;16(4):375–384.
- Gupta A, Gomes F, Lorigan P. The role for chemotherapy in the modern management of melanoma. Melanoma Manag. 2017;4(2):125–136.
- Middleton MR, Grob JJ, Aaronson N, et al. Phase III study of temozolomide vs dacarbazine in advanced melanoma. J Clin Oncol. 2000;18(1):158–166. [CrossRef] [PubMed]
- Grob JJ, Amonkar MM, Martin-Algarra S, et al. Patient perception of BRAF inhibitor benefit: quality-of-life in BREAK-3 study. Ann Oncol. 2014;25(7):1428–1436. [CrossRef] [PubMed]
- Zhang J, Stevens MFG, Bradshaw TD. Temozolomide: mechanisms of action, repair and resistance. Curr Mol Pharmacol. 2012;5(1):102–114.
- Povirk LF, Shukla MS. DNA repair mechanisms and response to alkylating agents. Front Mol Biosci. 2016;3:54.
- Filippi S, Paccosi E, Balzerano A, et al. CSA antisense targeting enhances drug sensitivity in breast cancer. Cancers (Basel). 2022;14(7):1687. [CrossRef] [PubMed] [PubMed Central]
- Pascucci B, Fragale A, Marabitti V, et al. CSA and CSB play a role in response to DNA breaks. Oncotarget. 2018;9(14):11581–11591. [CrossRef] [PubMed] [PubMed Central]
- Groisman R, Polanowska J, Kuraoka I, et al. Ubiquitin ligase activity in DDB2 and CSA complexes regulated by COP9 after DNA damage. Cell. 2003;113(3):357–367.
- Hanawalt PC, Spivak G. Transcription-coupled DNA repair: two decades of progress. Nat Rev Mol Cell Biol. 2008;9(12):958–970.
- Latini P, Frontini M, Caputo M, et al. CSA and CSB regulate p53 Mdm2-dependent ubiquitination. Cell Cycle. 2011;10(21):3719–3730. [CrossRef] [PubMed] [PubMed Central]
- Epanchintsev A, Costanzo F, Rauschendorf MA, et al. CS proteins regulate transcription arrest via ATF3 degradation. Mol Cell. 2017;68(6):1054–1066.e6. [CrossRef] [PubMed]
- Costanzo F, Paccosi E, Proietti-De-Santis L, Egly JM. CS proteins and ubiquitination: orchestrating DNA repair, transcription and division. Trends Cell Biol. 2024;34(10):882–895.
- Gul S, Abbasi MA, Khan KM, et al. Biological evaluation of new anticancer agents: selectivity and safety. Saudi Pharm J. 2020;28(6):638–644. [CrossRef]
- Giannopoulou AF, Velentzas AD, Anagnostopoulos AK, et al. Systemic biomarkering and drugging of BRAF-mutant melanoma. Cancers (Basel). 2021;13(9):2024. [CrossRef] [PubMed] [PubMed Central]
- Pegg AE. Multifaceted roles of alkyltransferase and related proteins in DNA repair, DNA damage, resistance to chemotherapy, and research tools. Chem Res Toxicol. 2011;24(5):618–639. [CrossRef] [PubMed]
- Marteijn JA, Lans H, Vermeulen W, Hoeijmakers JHJ. Understanding nucleotide excision repair in cancer and ageing. Nat Rev Mol Cell Biol. 2014;15(7):465–481. [CrossRef]
- Fassina G, Santinami M, Cattarossi I, et al. p53-dependent upregulation of NER genes linked to fotemustine resistance. Int J Cancer. 2013;133(5):1114–1123.
- Lord CJ, Ashworth A. DNA repair and cancer therapy: targeting for personalized medicine. Genome Med. 2025;17(1):25.
- Roos WP, Kaina B. DNA damage-induced cell death and apoptosis. Cancer Lett. 2013;332(2):237–248. [CrossRef]
- Pascucci B, D’Errico M, Parlanti E, et al. Role of CSA and CSB proteins in oxidative stress response. DNA Repair (Amst). 2012;11(1):48–52. [CrossRef]
- Koch S, García CU, Webb T. Multifunctional roles of CSA and CSB in DNA repair and beyond. Mech Ageing Dev. 2020;189:111253. [CrossRef]
- Herlyn M, Thurin J, Balaban G, Bennicelli JL, Herlyn D, Elder DE, Bondi E, Guerry D, Nowell P, Clark WH, et al. Characteristics of cultured human melanocytes isolated from different stages of tumor progression. Cancer Res.1985;45(11):5670–5676.
- Botta L, Cesarini S, Zippilli C, Filippi S, Bizzarri BM, Baratto MC, Pogni R, Saladino R. ChemMedChem. 2021;16(15):2270–2278. [CrossRef]
- Boutet-Robinet E, Trouche D, Canitrot Y. Neutral Comet Assay. Bio-protocol. 2013;3(18):e915. [CrossRef]
Figure 1.
(A) Western blot analysis showing CSA protein levels, with α-tubulin used as a loading control. (B) Quantification of CSA protein levels in FB789, WM115, and WM266 cells, normalized to α-tubulin. (C) qRT-PCR analysis of CSA mRNA expression. Data are presented as mean ± standard deviation (SD) from three independent experiments. **p < 0.01, calculated by t-Student Test.
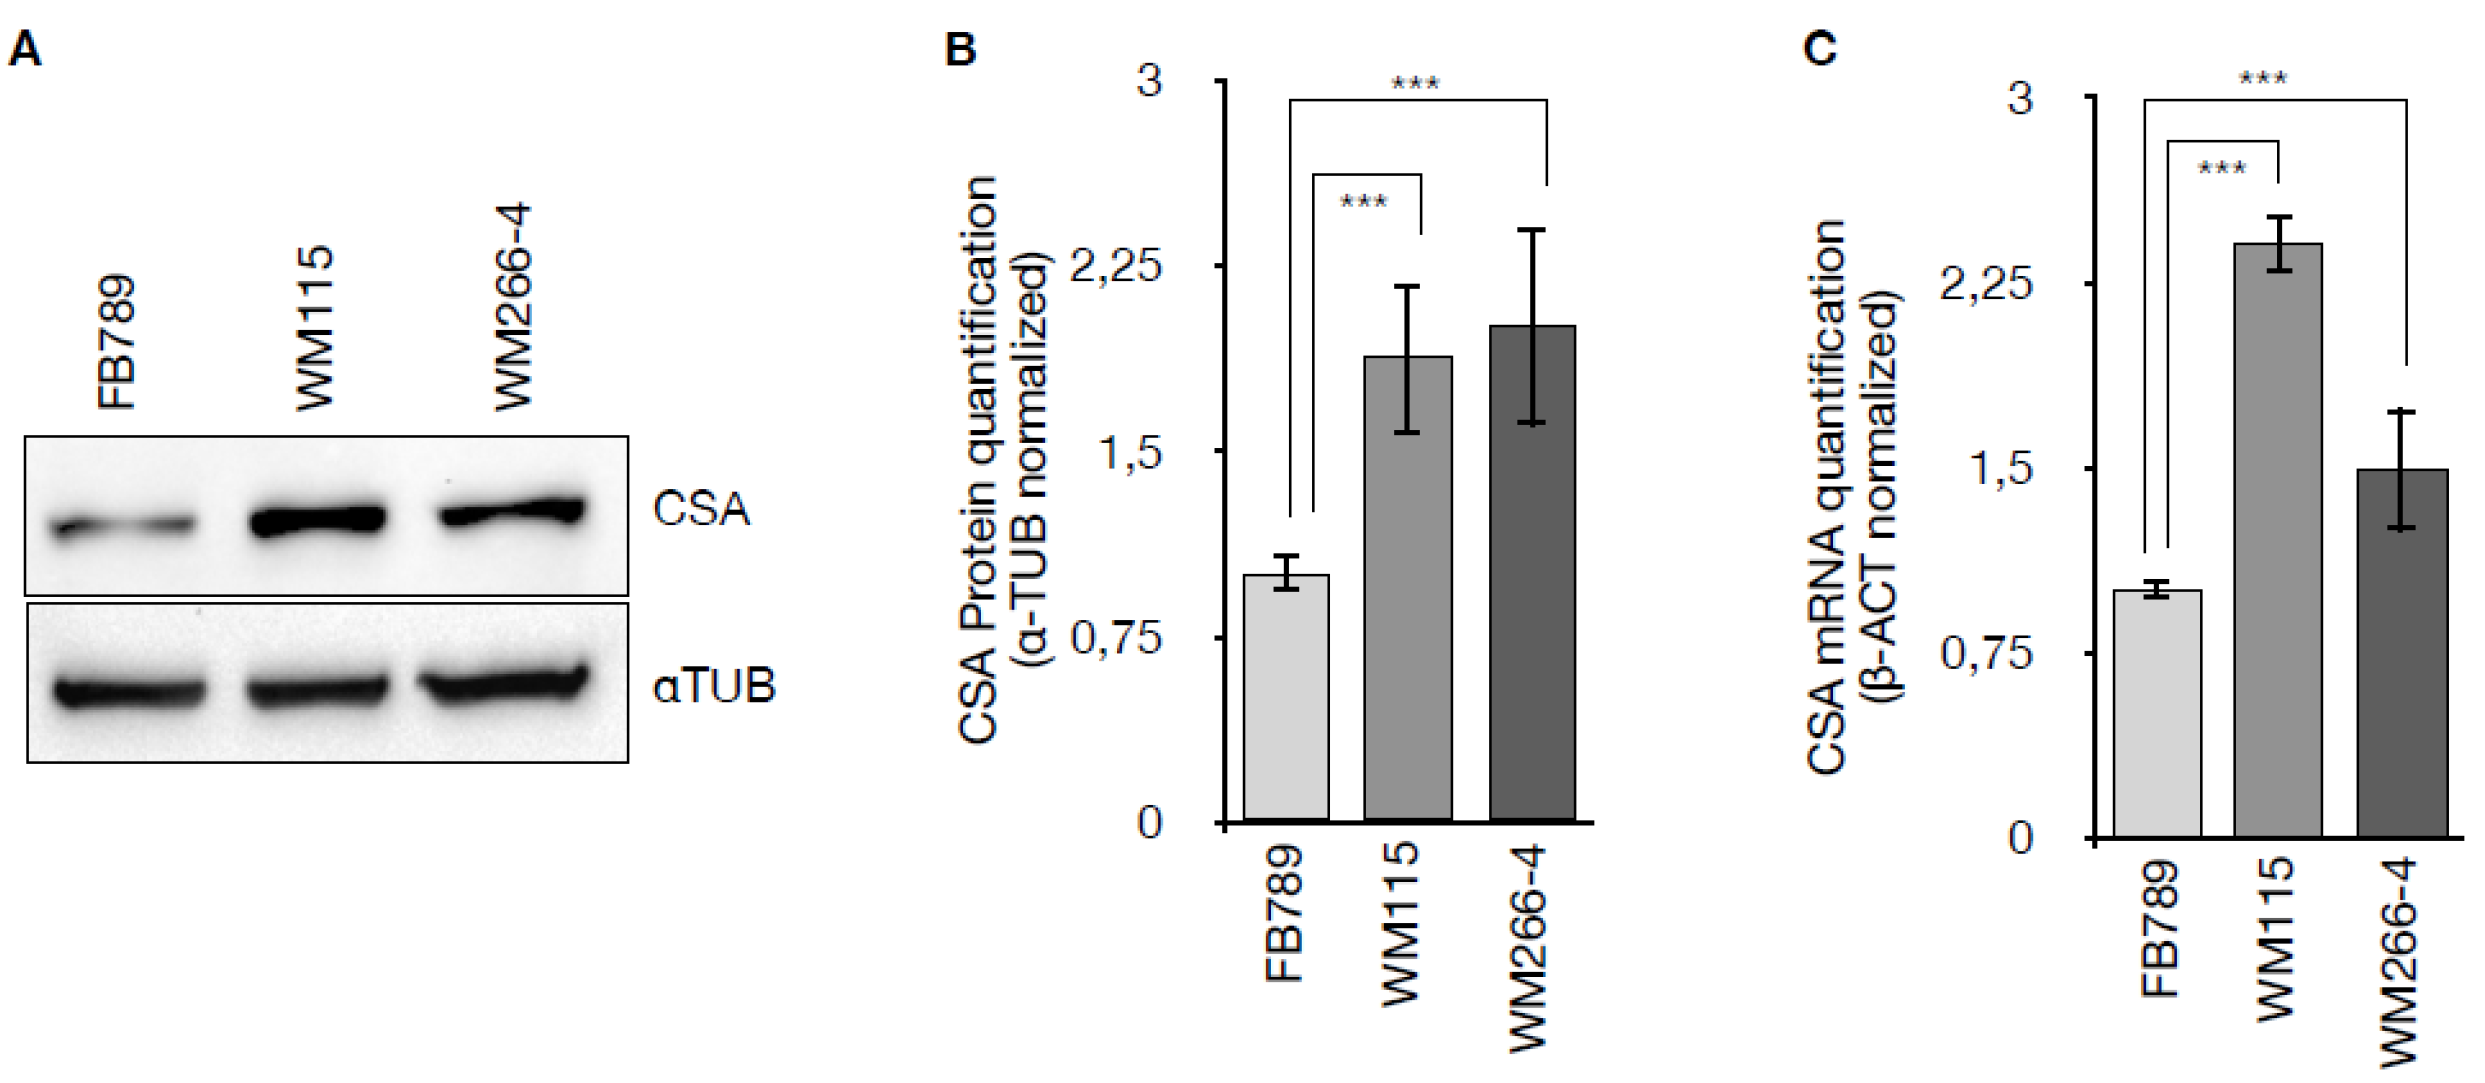
Figure 2.
(A) qRT-PCR analysis of CSA mRNA expression 48 hours after transfection with antisense oligonucleotide (ASO) or control treatments. Data are normalized to β-actin and presented as the mean ± SD of three independent experiments. ***p < 0.001, determined by t-Student Test. (B) Relative cell viability measured by MTT assay 48 hours after transfection. Data are shown as the mean ± SD of three independent experiments. ***p < 0.001, determined by t-Student Test. (C) Graphs showing the percentage of apoptotic cells in FB789, WM115, and WM266-4 cell lines after treatment with SO or CSA ASO for 24 hours and 48 hours. Data are based on counts of 500 cells per condition from three independent experiments. ***p < 0.001, as determined by t-Student Test. Cell proliferation assay results for (D) normal fibroblasts (FB789), (E) primary melanoma cell line (WM115) and (F) metastatic melanoma cell line (WM266-4). Cells were counted at the time of seeding, and at 24 and 48 hours post-transfection. Data are presented as the mean ± SD of three independent experiments. **p < 0.01 and ***p < 0.001, as determined by t-Student Test. (G) Micrographs showing the results of a scratch cell migration assay conducted at different time points following mock, SO, or ASO treatment in FB789, WM115, and WM266-4 cells. The relative graph (H) illustrate the percentage of wound closure from 0 to 48 hours. Data are presented as the mean ± standard deviation (SD) from three independent biological replicates. Statistical significance is indicated by *** p < 0.001, as determined by t-Student Test.
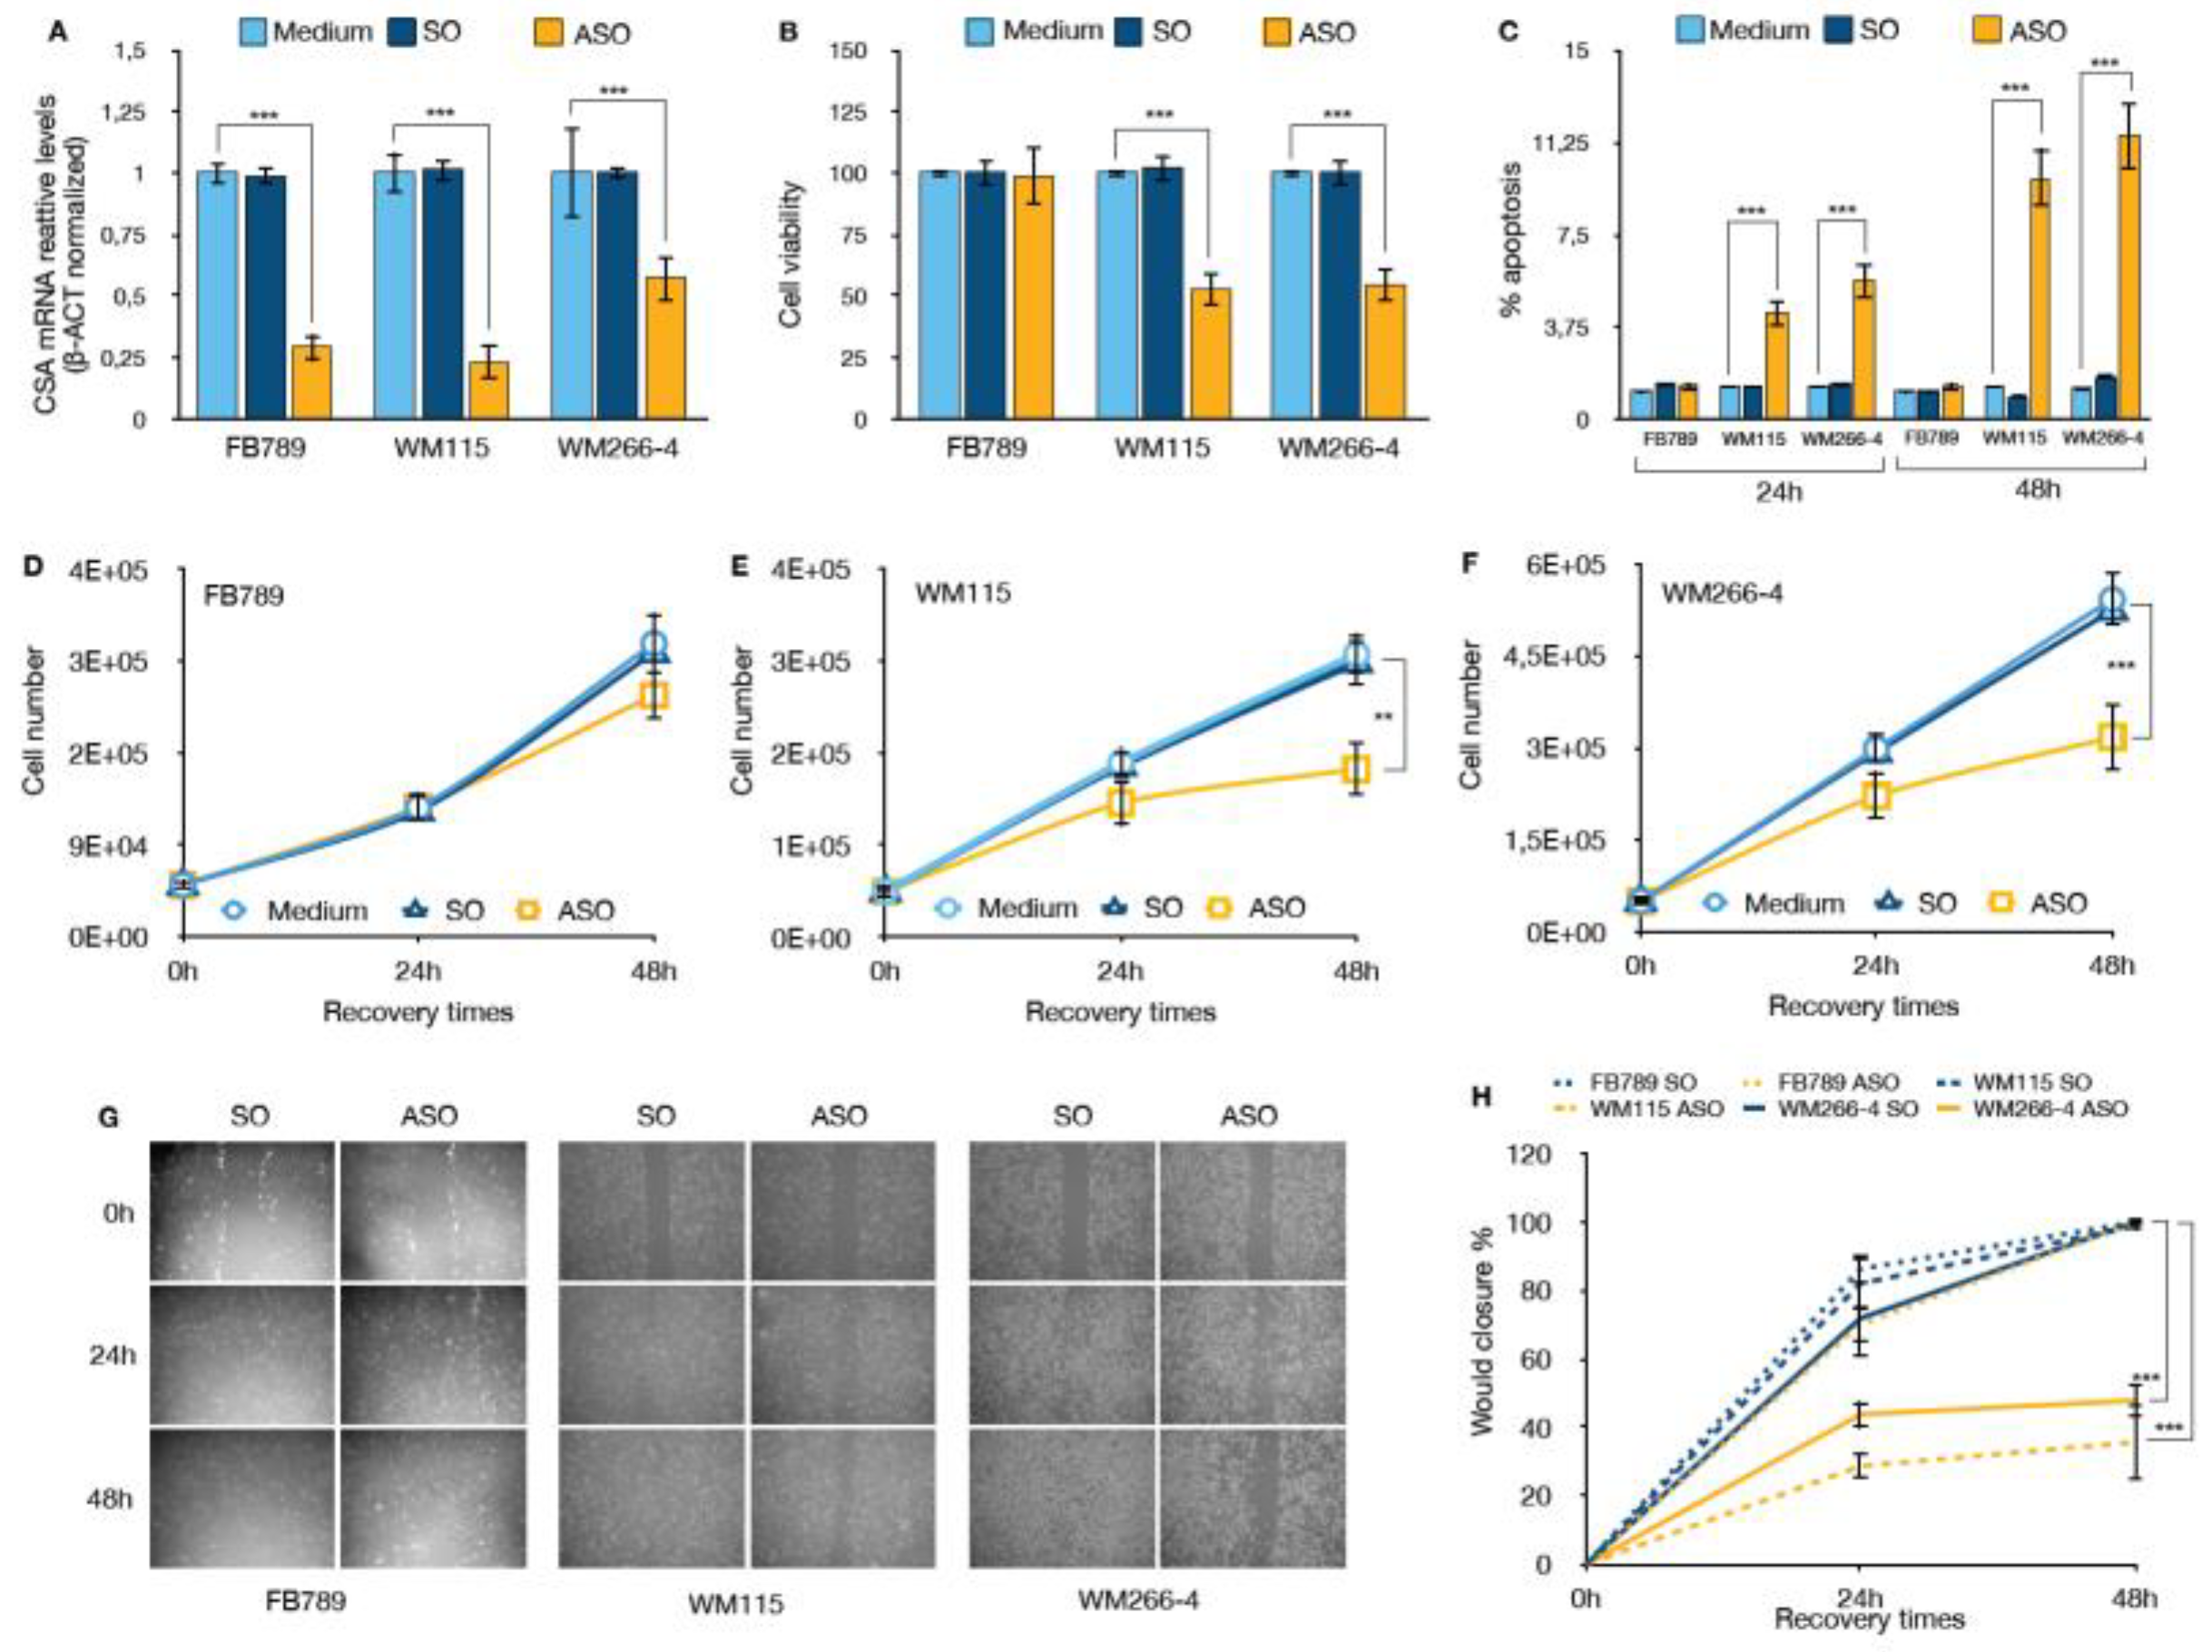
Figure 3.
DNA Damage and apoptosis analysis upon CSA silencing and treatment with DTIC or TMZ agents in WM115 and WM266-4 melanoma cells. DNA damage analysis by neutral comet assay. WM115 (light blue) and WM266-4 (dark blue) cells were treated with ASO CSA , DTIC (high dose, HD; low dose, LD), TMZ (HD; LD), or their combinations with ASO CSA. Mean Tail Moment (TM) was measured as an indicator of DNA double-strand breaks. Data are presented as the mean ± standard deviation (SD) from three independent biological replicates. Statistical significance is indicated by *** p < 0.001, as determined by t-Student Test.(B) Apoptosis analysis by a combination of three vital dyes. Cells were stained with HOECHST, FDA and PI to quantify live, apoptotic and/or necrotic cells. Data are presented as the mean ± standard deviation (SD) from three independent biological replicates. Statistical significance is indicated by *** p < 0.001, as determined by t-Student Test.
Disclaimer/Publisher’s Note: The statements, opinions and data contained in all publications are solely those of the individual author(s) and contributor(s) and not of MDPI and/or the editor(s). MDPI and/or the editor(s) disclaim responsibility for any injury to people or property resulting from any ideas, methods, instructions or products referred to in the content. |
© 2025 by the authors. Licensee MDPI, Basel, Switzerland. This article is an open access article distributed under the terms and conditions of the Creative Commons Attribution (CC BY) license (http://creativecommons.org/licenses/by/4.0/).
Copyright: This open access article is published under a Creative Commons CC BY 4.0 license, which permit the free download, distribution, and reuse, provided that the author and preprint are cited in any reuse.


