
Submitted:
08 September 2025
Posted:
09 September 2025
You are already at the latest version
Abstract
Background: Life satisfaction is widely used as a social indicator to direct governmental interventions that target individuals’ quality of life. Issues of dimensionality and equivalent functioning of common measures such as the Satisfaction with Life Scale (SWLS) may negatively implicate inferences and decisions derived from those measures. Methods: Using a cross-sectional design and a convenience sample of 255 Polish managers (mean age = 48.9 ± 8.2 years, 22.6% females), this study evaluated the SWLS through confirmatory factor analysis (CFA) and multigroup CFA for construct validity and measurement invariance. Its convergent, discriminant, predictive, and criterion validities were assessed through average variance extracted (AVE), heterotrait-monotrait (HTMT) ratio of correlations, SWLS correlations with its subscales and with measures of personality traits, COVID distress, and general organizational trait. Results: Data did not support the one-factor and two-factor (past and present life satisfaction) SWLS or the SWLS3. A novel two-factor SWLS of congruence between ideal and real self (items 1, 2, and 5) and achievement (items 3 and 4) displayed the best fit (χ2 = 7.38, DF = 4, CMIN/DF = 1.85, p = 0.117, CFI = 0.996, TLI = 0.991, RMSEA = 0.058, SRMR = 0.0136), invariance across gender and marital status, high convergent validity (AVE = 0.667 and 0.842), high internal consistency (α = 0. 851 and 0.914), acceptable discriminant validity (HTMT = 0.911), good predictive validity as noted by correlations with its subscales (r = 0.758 and 0.885, p <0.01), and adequate criterion validity—the SWLS and congruence were negatively associated with COVID-19 distress (r = -0.158 and -0.149, p <0.05), congruence positively correlated with age (r = 0.126, p <0.05), achievement correlated with openness to experience (r = 0.191, p <0.01), and all SWLS measures positively correlated with general organizational trait (r range = 0.263 to 0.356, p <0.01). Conclusion: The findings expand our understanding of how managers conceptualize life satisfaction: congruence (between ideal and real self) and achievement. A revised phrasing of item 5 is necessary as contributed to scalar variance across younger and older managers. More investigations are needed to confirm the findings.
Keywords:
subjective wellbeing
; Satisfaction With Life Scale (SWLS)
; shortened three-item version of Satisfaction With Life Scale (SWLS 3)
; factor structure/measurement invariance/validation/convergent/discriminant predictive/criterion validity/psychometric
; age/gender/marital status
; managers
Introduction
Subjective wellbeing (SWB) is a complex multidimensional phenomenon that refers to unity of affective and cognitive dimensions concerning the evaluation of one’s life [1]. Although the literature is not straightforward concerning the exact concept of SWB [2], various conceptualizations intersect around certain main concepts, primarily happiness (seeking pleasure), life satisfaction, quality of life, and lack of negative and depressive emotions (avoiding pain) [1,2,3]. Additionally, extended definitions include emphasized aspects of basic functioning and socio-community wellbeing “e.g., health, financial security, respect, and safety on individual life”, as well as positive and full functioning, achieved individual characteristics, and associated economic determinants such as social equality, employment status, and acquired level of education in addition to social and cultural inclusion [4,5,6,7]. As such, SWB has gained a global interest in reflecting communities’ welfare and sustainable policies, especially with societies shifting to human-centered measures of progress [8,9,10]. The cognitive component of SWB, life satisfaction, in particular has been frequently used as a social indicator to reflect quality of life, political trust, economic sustainability, and perceived autonomy “i.e., more opportunity and choice for good life” [2,6,10].
The Satisfaction with Life Scale (SWLS) has been introduced in American samples of college students and older adults by Diener et al. 35 years ago as a five-item, seven-point Likert, single-factor measure of individuals’ overall objective cognitive judgments of their life quality [11]. The scale has been extensively studied and widely translated from English into more than 40 languages [12,13]. It has been applied to populations from different age groups (adolescents, adults, older adults) and cultural contexts [12,13,14,15,16]. Psychometric investigations have revealed satisfactory performance of the SWLS in terms of internal consistency, test-retest reliability, discriminant validity, convergent validity, moderate stable, and sensitivity to detect over time variations in life satisfaction that develop in response to major life events and psychotherapy [11,14,15]. Nonetheless, the dimensionality of the SWLS has been a subject of debate.
Despite substantial item loadings on the single factor, suboptimal fit indices indicate that data in many studies do not support the unidimensional structure of the SWLS, [17,18,19,20]. A modified one-factor structure with residual correlations (items 4 and 5) expressed good fit [18,20]. In other cases, those two items were a source of variance across age groups [19] or country [13], and an acceptable alternative was to create a new independent domain that would comprise items 4 and 5 [17,18,19]. This newly added construct is minor as it was reported to account for 12% of the total variance relative to the main domain, which accounted for 73% of the variance [17].
Although the presence of a trivial minor factor in the SWLS structure does not compromise the interpretation of the scales’ total score [17], it seems to influence scale equivalence across various groups [13,19]. Particularly, the unidimensional structure expressed scalar variance across countries in a sample of 7004 managers from local companies in 26 countries from Europe, Asia, North and South America, and Australia [16]. Scalar variance was also reported across 62 out of 65 countries and 40 languages in another international study involving 56968 adults [12]. In both studies, three out of the five items (2, 4, and 5) contributed to the variance, and the authors compared SWLS means across countries and languages based on items 1 and 3 only i.e., they dropped more than half the items to make a robust mean comparison [12,16]. Likewise, a review of 27 studies comprising 66380 participants from 24 countries reported configural invariance of the SWLS across gender and age. However, it did not hold scalar invariance in half studies evaluating equivalence across genders and in 10 out of 11 studies evaluating equivalence across age groups [15]. Consequently, the need for determining SWLS structures that would represent the data and operate equivalently across groups is intense. This study aimed to investigate various structures of the SWLS including the three-item version (SWLS3) in a sample of managers. It also addressed scale stability across various groups and criterion validity in relation to personality traits, general organizational traits, and COVID distress.
Methods
Design, Participants, and Procedure
This methodological study is a secondary analysis based on a cross-sectional design and a convenience sample of 255 Polish chief executive officers and chief financial officers. Data collection was conducted by an independent external company between September 2021 and June 2022, during the 4th and 5th waves of the Covid-19 pandemic. Invitations to take part in the study were sent by email and phone to all companies listed on Warsaw Stock Exchange (WSE) main market. The survey was administered in a digital format through computer-assisted telephone interviews (CATIs) and computer-assisted web interviews (CAWIs). A specially-prepared web form was designed to ensure that the form is not completed more than once by the same respondent. To stimulate participation, managers were assured that the survey is anonymous, and they were promised that a fixed charitable donation would be made for each completed questionnaire. More details of the study are described elsewhere [21]. In the current study, we analyzed a public dataset “Baza_OPUS_20_ENG”, which is shared under the terms of CC0 Creative Commons Zero 1.0 at https://danebadawcze.uw.edu.pl/dataset.xhtml?persistentId=doi:10.58132/WCXROG.
Measures
Satisfaction With Life Scale (SWLS) is a brief measure that comprises five items, which capture an individual’s overall cognitive appraisal of his/her life “e.g., my life is close to my ideal, the conditions of my life are excellent, I am satisfied with my life”. Responses are rated on a seven-point scale ranging from 1 (strongly disagree) to 7 (strongly agree).
Ten Item Personality Inventory (TIPI) [22] is a brief measure that comprises five pairs of items that capture the Big Five personality traits (extraversion, agreeableness, conscientiousness, emotional stability, and openness to experiences). Example items include “extraverted, enthusiastic”, “ anxious, easily upset”, and “sympathetic, warm”. Responses are rated on a seven-point scale ranging from 1 (strongly disagree) to 7 (strongly agree).
Covid-19 distress was measured by a single item “How stressful is the situation regarding the COVID-19 pandemic for you in the context of practicing the profession of a manager?” Responses are rated on a five-point Likert scale ranging from 1 (not at all) to 5 (very much). Higher scores indicate higher pandemic-related profession distress and vice versus.
A brief measure of financial and organizational control comprising five items was used in testing the structure of the SWLS3. Items include “I care about accurately tracking my financial expenses, I keep a regular record of my earnings and expenditures, I am able to roughly say how much money I have spent this month, I always categorize my financial expenses into different categories (e.g., clothing, entertainment, education).” The whole scale was used in a latent variable model to examine the SWLS3. The last item “Generally, I am someone whom others would describe as well-organized” was used alone in criterion validity testing as a single-item measure of general organizational trait. Responses are rated on a seven-point scale ranging from 1 (does not apply to me at all) to 7 (perfectly applies to me).
Statistical Analysis
The descriptive statistics of the continuous and categorical variables are reported as mean ± standard deviation and frequency with percentage, respectively. The structure of the SWLS was evaluated through confirmatory factor analysis (CFA). Five competing models were examined: 1) one-factor SWLS without and with error correlations (mode 1) [11], 2) bi-factor SWLS comprising present (items 1, 2, 3) and past (items 4, 5) life satisfaction without and with error correlations (mode 2) [17,18], bi-factor SWLS comprising achievement/congruence (items 1, 2, 4) and acceptance/fulfilment (items 3, 5) without and with error correlations (mode 3), 4) bi-factor SWLS comprising congruence (items 1, 2, 5) and achievement (items 3, 4) without error correlations (mode 4), and 5) one-factor SWLS3 without error correlations (mode 5) [11,23]. Model 3 and model 4 were developed by integrating items with consistent error correlations in the former models into new independent factors as an attempt to meet the assumption of local independence i.e., apart from the influence of the latent variables (factors), there is no remaining statistical relationship between the observed items (indicators). In model 5, the SWLS3 was anchored to the financial and organizational control measure. This is because CFA models of short measures (less than four items) produce a non-informative saturated model with zero values of the chi square index (χ2) and Degree of Freedom (DF) [24]. Overall, non-significant χ2 and Minimum Discrepancy Function by Degrees of Freedom divided (χ2/DF) <3 flag fitting models. Because χ2 is sensitive to sample size, absolute fit indices are consulted for confirming model fit including Comparative Fit Index (CFI), Tucker–Lewis Index (TLI), Root Mean Square Error of Approximation (RMSEA), and Standardized Root Mean Square Residual (SRMR). In this respect, acceptable and good fit are indicated by CFI and TLI >0.90 and 0.95, along with RMSEA and SRMR <0.08 and 0.06, respectively [25,26]. For SWLS models comprising two items, heterotrait-monotrait (HTMT) ratio of correlations were estimated to describe scale discriminant validity. HTMT values exceeding 0.90 indicate that scale factors capture overlapping latent variables while HTMT values below this range correspond to factors uniqueness [27].
Multigroup CFA was used to evaluate measurement invariance of the best fitting model at the configural, metric, scalar, and strict levels across groups of gender, age (defined based on median age as 50 and below, above 50) and marital status (single vs in a committed relation). This procedure first evaluates the fit of the crude model in its overall form separately in each group. Then, it incrementally set constraints (on factor loadings, intercepts, and residuals) and check for changes in model fit after the implementation of each constraint. Significant change in model fit should indicate scale variance, and it is spotted by ΔCFI and ΔTLI >0.020 and ΔRMSEA >0.015 [28,29,30]. Variant models were further investigated through two-step cluster analysis—a machine learning approach that uses sequential distance measures to separate the data into distinct subclusters, which get further grouped into larger clusters. Participants in each cluster are similar in their characteristics, but clusters are different from each other. Clustering quality is evaluated based on silhouette measure of cohesion and separation (>0.50) and Akaike information criterion (AIC). The best fitting solution is indicated by the lowest AIC. The items of the SWLS are included as continuous variables in the model while the characteristic encountering variance is included as a categorical variable. Multigroup was re-ran to examine invariance across the resulting clusters.
Th reliability of the scale was evaluated through alpha coefficient (α) and omega coefficient (ω). Intraclass correlation coefficient (ICC) single measure estimates with 95% confidence interval (CI) were calculated using a consistency definition, mean-rating (k = 255), absolute-agreement, and two-way random-effect models. The convergent validity of the SWLS was evaluated at the item level through item total correlations and at the factor level through average variance extracted (AVE). AVE is an index of the amount of variance captured by factors; AVE values > 0.50 indicate that items efficiently relate to the underlying latent construct [31]. Correlations of the SWLS with its subscales were tested to evaluate its predictive validity. Criterion validity was evaluated through correlating the SWLS and its subscales with TIPI dimensions, COVID distress, and the general organizational trait measure. The analyses were performed in SPSS version 25 and Amos version 26. AVE, HTMT, and α/ω coefficients were obtained from JASP version 0.19.3. Significance was indicated in two-tails tests at a probability level below 0.05.
Sociodemographic Characteristics
Responses came from more than half the companies listed on WSE main market (N = 255 out of a total of 415 companies). Respondents were predominantly males (n = 200, 78.4%). Their mean age was 48.9 ± 8.2 years (range = 26 – 63 years). Only 11.8% (n = 30) reported being single while the rest reported being in a committed relation (n = 222, 87.1%)—1.2% did not report their marital status. The most prominent sectors from which managers came were manufacturing (n = 78, 30.6%), wholesale and retail trade (n = 30, 11.8%), professional, scientific and technical activities (n = 29, 11.4%), information and communication (n = 20, 7.8%), financial and insurance activities (n = 19, 7.5%) among others [21].
Factor Structure of the SLWS
The one-factor SWLS expressed poor fit—CMIN/DF and RMSEA were exceptionally out the acceptable range (Table 1). However, correlating two pairs of error terms (Figure 1: b) resulted in an excellent fit. Likewise, the formerly reported two-factor SWLS (model 2: present and past life satisfaction) expressed good fit only when item 3 correlated with item 4 (Figure 1: d). Based on error correlations in model 1 and model 2, two independent factors were created. The first factor comprised item 1 “In most ways my life is close to my ideal”, item 2 “The conditions of my life are excellent”, which reflect congruence (i.e., between real and ideal self/life condition), in addition to item 4 “So far, I have gotten the important things I want in life”. Accordingly, it was called congruence/achievement. The second factor was called acceptance/fulfillment as it comprised item 3 “I am satisfied with my life” and item 5 “If I could live my life over, I would change almost nothing”. This structure also demonstrated suboptimal fit, which considerably improved when two items (1 and 2) on factor congruence/achievement correlated with each other. Notably, three items had loadings of 1.00 while factor covariance was out of the acceptable range after correlating the errors of items 1 and 2 (Figure 1: e, f). In model 4, congruence comprised items 1, 2, and 5 while the achievement factor comprised items 3 and 4 (Figure 1: g). This model is the only SWLS structure to express good fit in the absence of any error correlations. All item loadings of the SWLS3 were out of the acceptable range (Figure 1: h).
Measurement Invariance of the SLWS
As shown in Table 2, model 4 (two-factor SLWS: congruence, achievement) upheld measurement invariance at the configural, metric, scalar, and strict levels across gender and relation. However, it was variant at the scalar level across age groups. Examination of this model in each age group separately (Supplementary Figure S1: a, b) shows excellent fit in both groups at the configural level, with slight reductions in the loadings of all items in the older group. Scalar non-invariance across age groups is associated with reduced loading of item 5 “If I could live my life over, I would change almost nothing” better in older groups) in the younger group compared to older group (Supplementary Figure S1: c, d). To investigate the problem further, two-step cluster analysis was conducted to cluster the sample according to the items of the SWLS across age groups (≤50: n = 124 and >50: n = 126). The model expressed good fit as indicated by silhouette measure of cohesion and separation (0.55) and lower AIC of the three-cluster solution (653.8) relative to the two former cluster solutions. Three clusters originated. As shown in Supplementary Figure S2, cluster 1 (n = 34) expressed the lowest levels of all SWLS items, and it comprised mainly participants aged 50 or below (n = 28, 11.0%). Cluster 2 also comprised managers aged only 50 or below while cluster 3 comprised managers aged above 50. The respondents in the last two clusters expressed higher levels of all SWLS items (Supplementary Figure S2: d, e).
Multigroup CFA evaluating model 4 across the three clusters indicated invariance at the configural, scalar and metric levels—ΔRMSEA was high for model change at the metric level but other indices were within acceptable range (Supplementary Table S1). In all models, item 5 had the lowest loadings in the younger groups, especially in that group with low satisfaction level (Supplementary materials: S1, S2, S3). AVE expressed by the congruence factor (which includes item 5) was the lowest in this cluster (0.28) relative to older and satisfied respondents from the same age category (0.48 and 0.49, respectively). Inter-factor correlations (factor covariances) were at the highest level in the older group while the lowest level was spotted in the less satisfied younger cluster. HTMT values expressed a similar pattern (0.945, 0.720, and 0.693).
Convergent and Discriminant Validity of the SLWS
According to Table 3, AVE displayed by all SWLS structures was above 0.50, indicating adequate convergent validity of the one-factor and two-factor SWLS i.e., both scale total score and subscale scores adequately reflect the underlying latent trait. Obviously, factors on model 4 expressed the highest AVE values, indicating the highest convergent validity. HTMT values of model 2 and model 4 were above the lenient limit (0.90). However, the HTMT value demonstrated by factors comprising model 4 was marginally above this benchmark (0.911), indicating that those two factors are more distinct than factors comprising other models.
Internal Consistency, Predictive Validity, and Criterion Validity of the SLWS
Both ω and α coefficients show that the internal consistency of the SLWS is excellent. Its subscales expressed good to excellent reliability, and the highest subscale reliability (α = 0.85, 0.91) was expressed by factors comprising model 4 (Table 3). ICC single measures indicate acceptable intra class reliability of the SWLS and its subscales. All item total correlations were high, in support of convergent validity (Table 4).
Both SWLS subscales significantly correlated with each other and with the parent scale, indicating adequate predictive validity. Age was positively associated with congruence but not with SWLS or achievement (Table 4). Neither the SWLS nor its subscales correlated with personality traits (Supplementary Table S2), except for the achievement subscale, which was positively associated with openness to experiences. On the other hand, the SWLS and its congruence subscale were inversely associated with COVID-19 as being stressful for practicing manger’s profession. The SWLS and its subscales significantly correlated with the single-item general organizational trait, albeit the strongest correlation was expressed by the achievement subscale.
Discussion
This study evaluated the structure and stability of the SWLS in a sample of Polish mangers that was recruited during the COVID pandemic. It indicates good fit of a new bifactor structure that comprises congruence (i.e., between real and ideal self) and achievement. This model was invariant across gender and social status but did not hold scalar invariance across age. The factors of this structure expressed the highest reliability, convergent validity, and discriminant validity among all tested structures.
Because of correlations persistently reported between the error terms of items 4 and 5 [17,18,20] and their possible contribution to inequivalent scale performance across groups [13,19], those two items have been grouped in a separate factor “past life satisfaction” to produce good fit without violating the assumption of local independence [17,18,19]. Nonetheless, the present results indicate that one size does not fit all i.e., this bifactor SWLS expressed poor fit in this manger sample (CMIN/DF = 11.11, TLI = 0.894, RMSEA = 0.199). Local dependence persisted, and it was necessary to correlate a new pair of residuals (items 3 and 4) to obtain good fit (CMIN/DF = 0.60, TLI = 0.999, RMSEA = 0.000). Alternatively, Kjell and Diener have recently decided to alter items 4 and 5 so that the shortened three-item version of the SWLS (SWLS3) would keep only the first three items, which were thought to efficiently reflect present rather than past life satisfaction [23]. Our former investigations among university students and individuals with acquired movement disabilities signpost the SWLS3 as a suitable alternative to the five-item parent scale [18,32]. Although most fit indices approached satisfactory fit, this abbreviated SWLS3 did not express excellent fit as expected (RMSEA = 0.102) while the loadings of the three items were awkwardly above acceptable limits (Figure 1, h). Thus, the results show that despite the robust performance of the SWLS3 in former studies, this brief measure should undergo extensive testing in various populations before being declared as a brief alternative of the SWLS.
Interestingly, best fit in absence of any error correlations was recorded for a two-factor structure that comprises two brand-new latent constructs: 1) congruence between ideal self and real self (items 1 “my life is close to my ideal”, 2 “the conditions of my life are excellent”, and 5 “if I could live my life over, I would change almost nothing”) and 2) achievement (items 3 “I am satisfied with my life”, and 4 “I have gotten the important things that I want in life”). While the SWLS as a whole scale may be considered as covering two latent constructs, underlying constructs should be deeply investigated.
In our study, model 4 (congruence, achievement) demonstrated invariance at all levels across gender and committed relation, but it did not hold scalar variance across age groups. The intercept of item 5 “if I could live my life over, I would change almost nothing” was associated with non-invariance in younger mangers. Clustering analysis shows that age was the most important factor in clustering the participants relative to all items of the SWLS. It indicates that almost all older mangers and 77.4% of younger mangers expressed all SWLS at high levels. Meanwhile, 22.6% (n = 28) of younger managers and only 4.8% (n = 6) of older mangers expressed the lowest levels of all items. Multigroup CFA across clusters (Supplementary Table 1) shows that item 5 interfered with scale performance (Supplementary materials: S1, S2, and S3). The corresponding domain-specific factor on which item 5 loaded (congruence subscale) demonstrated the lowest AVE in the cluster of younger and less satisfied manger. In our respondents, age was positively correlated with congruence (which comprises item 5) but not with the SWLS or achievement. In line, item 5 was one of two items (4 and 5) inducing variance across age in the Swedish SWLS [19]. It is also one of three items (2, 4, and 5) that are reported as a source of scalar variance of the unidimensional SWLS across country among managers from 26 different countries [16] as well as across country and language among adults from 65 nations who speak one of 40 languages [12]. Evidently, the number of variant items in the congruence-achievement SWLS is smaller than that reported for the unidimensional scale. In both structures, item 5 needs phrasing as our and former findings stress its contribution to scalar variance of the SWLS i.e., it is endorsed more by older rather than younger respondents.
The SWLS also exhibited excellent internal consistency (Table 3) same as in former studies [14,30]. It was higher than that reported in samples from the UAE (0.47) or collected in the Tamil language (0.63) [12]. In support of its construct validity, subscales of the congruence-achievement SWLS exhibited the highest convergent and discriminant validities as well as the highest reliability among all tested subscales (Table 3). Studies on the subscales of the SWLS are scare; however, the subscale of present life satisfaction expressed high reliability in people with movement disability and Arab university students [18,32], same as in our study. Therefore, the results support the SWLS stability in this managerial group, albeit more investigations are needed to confirm the best SWLS domains and their psychometrics.
As shown in Table 4, all SWLS items were largely endorsed by the participants, especially older managers (Supplementary Figure S2: clustering analysis). Increased age coincides with experiencing more life events and making more critical life decisions. Therefore, older managers were more satisfied as they may be more established than younger managers [16]. In line, SWLS mean scores largely varied across nations and languages in a study involving 56968 respondents from 65 countries. However, greater levels of life satisfaction significantly correlated with greater financial security [12]. Achievement was the only life satisfaction trait exhibiting a significant association with openness to experience among all personality traits. Meanwhile, the SWLS and both subscales significantly and positively correlated with “general organizational trait”, believing that others perceive them as well-organized. This is, to some extent, congruent with a large-scale Spanish study depicting an immediate positive effect of government efficiency on individuals’ SWB [8]. Individuals’ autonomy is a drive of the impact of achieved functioning (e.g., financial security or health) on their wellbeing. Therefore, the observed associations in our study may be attributed to the fact that managers are embedded in a socio-economic context that can provide more opportunities (e.g., higher income) and enable individual choice (e.g., impactful decisions) [6]. Thus, our results align with studies associating SWB with full functioning and other achieved characteristics (e.g., acquiring a well-paid administrative position) [2,4,5,10].
Strength, Implications, and Limitations
This study has the merit of employing public data to test various and novel structures of the SWLS. The results have important implications—they show that the SWLS3 may not always be a better alternative to the SWLS. However, the one-factor and past and present life satisfaction structures do not offer the best presentation of the parent scale. The phrasing of item 5 should be modified as this item tends to be endorsed more by older rather than younger managers.
The results should also be interpreted with caution due to generalizability limitations, including relatively old data that were collect during the 4th/5th waves of the COVID pandemic as well as a convenience sample from one European country that predominantly comprised male managers. The cross-sectional design would also limit the evaluation of the structure stability over time. We used already available anonymous data, and it is not clear in the original report that an ethical approval has been obtained from and academic entity before data collection [21]. More robust results would ensue should future studies handle these limitations.
Conclusions
SWLS in its unidimensional and bidimensional (past and present life satisfaction) forms achieved satisfactory fit only after correlating error terms, indicating that the SWLS and its past and present life satisfaction subscales do not fully account for shared variance of some items. Two factors reflecting congruence between ideal and real self and achievement expressed the best fit, highest convergent validity, highest internal consistency, acceptable discriminant validity, and adequate criterion validity. As for the latter, the SWLS did not correlate with age or personality traits while its congruence subscale was positively correlated with age and its achievement subscale correlated with openness to experience. This structure performed evenly between men and women as well as between single and cohabiting managers. However, item 5 contributed to scalar variance between younger and older managers. More investigations are needed to address this issue.
Supplementary Materials
The following supporting information can be downloaded at the website of this paper posted on Preprints.org, Figure S1. Confirmatory factor analysis (model 4) in age subgroups; Table S1. Invariance across clusters; Figure S2. SWLS cluster analysis; Supplementary materials (S1) Cluster Configural; Supplementary materials (S2) Cluster metric; Supplementary materials (S3) Cluster scalar; Supplementary Table 2 SWLS correlation with personality traits.
Author Contributions
Conceptualization, A.M.A., C.L., and A.D.G.H.; Methodology, A.M.A., A.A.A., H.E.E., and S.A.A.; Data curation, H.K. and A.A.; Software, M.Y. and H.K.; Formal analysis, S.A.A., S.H., F.F.-R. and M.A.Z.; Validation, A.D.G.H. and R.A.; Resources, S.H. and H.E.E.; Visualization, A.M.A.; Writing—original draft, F.F.-R. ; A.A., A.A.A., M.A.Z., H.K., R.A. and S.A.A.; Writing—review and editing, A.M.A., A.A.A., M.Y., C.L., and A.D.G.H. All authors have read and agreed to the published version of the manuscript.
Institutional Review Board Statement
This study is a secondary analysis of a public data set. Because we did not interact with respondents in anyway (i.e., there is no possibility to violate subjects’ rights), no ethical approval has been obtained in the present study.
Informed Consent Statement
Informed consent was obtained from all subjects involved in the original study that collected the data [21].
Data Availability Statement
The data presented in this study are available at https://danebadawcze.uw.edu.pl/dataset.xhtml?persistentId=doi:10.58132/WCXROG [November 03, 2024].
Acknowledgements
The Researchers would like to thank the Deanship of Graduate Studies and Scientific Research at Qassim University for financial support (QU-APC-2025).
Conflicts of Interest
The authors declare no conflict of interest.
References
- Şimşek, Ö.F. , Happiness Revisited: Ontological Well-Being as a Theory-Based Construct of Subjective Well-Being. Journal of Happiness Studies 2009, 10, 505–522. [Google Scholar]
- Lingán-Huamán, S.K.; et al. , The satisfaction with life scale and the well-being index WHO-5 in young Peruvians: a network analysis. International Journal of Adolescence and Youth 2024, 29, 2331586. [Google Scholar]
- Vanhoutte, B. , The Multidimensional Structure of Subjective Well-Being In Later Life. Journal of Population Ageing 2014, 7, 1–20. [Google Scholar] [CrossRef]
- Boyadjieva, P. and P. Ilieva-Trichkova, IS THERE ANYTHING BEYOND HAPPINESS? A COMPARATIVE EUROPEAN PERSPECTIVE TOWARDS THE MULTI-DIMENSIONAL CHARACTER OF SUBJECTIVE WELL-BEING. Sociological Problems 2022, 54. [Google Scholar]
- Sarriera, J.C. and L.M. Bedin, A Multidimensional Approach to Well-Being, in Psychosocial Well-being of Children and Adolescents in Latin America: Evidence-based Interventions, J.C. Sarriera and L.M. Bedin, Editors. 2017, Springer International Publishing: Cham. 3-26.
- Steckermeier, L.C. The Value of Autonomy for the Good Life. An Empirical Investigation of Autonomy and Life Satisfaction in Europe. Social Indicators Research 2021, 154, 693–723. [Google Scholar]
- Paloma, V.; et al. , Determinants of Life Satisfaction of Economic Migrants Coming from Developing Countries to Countries with Very High Human Development: a Systematic Review. Applied Research in Quality of Life 2021, 16, 435–455. [Google Scholar] [CrossRef]
- Cárcaba, A. R. Arrondo, and E. González, Does good local governance improve subjective well-being? European Research on Management and Business Economics 2022, 28, 100192. [Google Scholar] [CrossRef]
- Qasim, M. A. Grimes, Sustainability and wellbeing: the dynamic relationship between subjective wellbeing and sustainability indicators. Environment and Development Economics 2021, 27, 1–19. [Google Scholar] [CrossRef]
- Barrington-Leigh, C.P. , Life satisfaction and sustainability: a policy framework. SN Social Sciences 2021, 1, 176. [Google Scholar] [PubMed]
- Diener, E.; et al. , The Satisfaction With Life Scale. J Pers Assess 1985, 49, 71–5. [Google Scholar] [CrossRef] [PubMed]
- Swami, V.; et al. , Life satisfaction around the world: Measurement invariance of the Satisfaction With Life Scale (SWLS) across 65 nations, 40 languages, gender identities, and age groups. PLoS One 2025, 20, e0313107. [Google Scholar] [CrossRef] [PubMed]
- Oishi, S. , The concept of life satisfaction across cultures: An IRT analysis. Journal of Research in Personality 2006, 40, 411–423. [Google Scholar] [CrossRef]
- Dominguez-Vergara, J.; et al. , New Psychometric Evidence of the Life Satisfaction Scale in Older Adults: An Exploratory Graph Analysis Approach. Geriatrics (Basel) 2024, 9. [Google Scholar] [CrossRef] [PubMed]
- Emerson, S.D. Guhn, and A.M. Gadermann, Measurement invariance of the Satisfaction with Life Scale: reviewing three decades of research. Quality of Life Research 2017, 26, 2251–2264. [Google Scholar] [CrossRef]
- Jang, S.; et al. , Measurement Invariance of the Satisfaction With Life Scale Across 26 Countries. Journal of Cross-Cultural Psychology 2017, 48, 560–576. [Google Scholar] [CrossRef]
- Slocum-Gori, S.L.; et al. , A Note on the Dimensionality of Quality of Life Scales: An Illustration with the Satisfaction with Life Scale (SWLS). Social Indicators Research 2009, 92, 489–496. [Google Scholar] [CrossRef]
- Ali, A.M.; et al. , The Arabic Satisfaction with Life Scale (SWLS) and its three-item version: Factor structure and measurement invariance among university students. Acta Psychologica 2025, 255, 104867. [Google Scholar] [CrossRef]
- Hultell, D. and J. Petter Gustavsson, A psychometric evaluation of the Satisfaction with Life Scale in a Swedish nationwide sample of university students. Personality and Individual Differences 2008, 44, 1070–1079. [Google Scholar] [CrossRef]
- Clench-Aas, J.; et al. , Dimensionality and measurement invariance in the Satisfaction with Life Scale in Norway. Qual Life Res 2011, 20, 1307–17. [Google Scholar] [CrossRef]
- Rzeszutek, M. Szyszka, and S. Okoń, Personality and Risk-Perception Profiles with Regard to Subjective Wellbeing and Company Management: Corporate Managers during the Covid-19 Pandemic. The Journal of Psychology 2023, 157, 297–317. [Google Scholar] [CrossRef]
- Gosling, S.D. J. Rentfrow, and W.B. Swann, A very brief measure of the Big-Five personality domains. Journal of Research in Personality 2003, 37, 504–528. [Google Scholar] [CrossRef]
- Kjell, O.N.E. and E. Diener, Abbreviated Three-Item Versions of the Satisfaction with Life Scale and the Harmony in Life Scale Yield as Strong Psychometric Properties as the Original Scales. J Pers Assess 2021, 103, 183–194. [CrossRef]
- Ali, A.M.; et al. , Loneliness among dementia caregivers: evaluation of the psychometric properties and cutoff score of the Three-item UCLA Loneliness Scale. Front Psychiatry 2025, 16, 1526569. [Google Scholar] [CrossRef]
- Ali, A.M.; et al. , Psychometric evaluation of the Depression Anxiety Stress Scale 8 among women with chronic non-cancer pelvic pain. Scientific Reports 2022, 12, 20693. [Google Scholar] [CrossRef]
- Ali, A.M.; et al. , Effects of Hormonal Replacement Therapy and Mindfulness-Based Stress Reduction on Climacteric Symptoms Following Risk-Reducing Salpingo-Oophorectomy. Healthcare 2024, 12, 1612. [Google Scholar] [CrossRef]
- Ali, A.M.; et al. , The Depression Anxiety Stress Scale 8-items expresses robust psychometric properties as an ideal shorter version of the Depression Anxiety Stress Scale 21 among healthy respondents from three continents. Frontiers in Psychology 2022, 13, 799769. [Google Scholar] [CrossRef]
- Ali, A.M.; et al. , Cardiometabolic Morbidity (Obesity and Hypertension) in PTSD: A Preliminary Investigation of the Validity of Two Structures of the Impact of Event Scale-Revised. J Clin Med 2024, 13, 6045. [Google Scholar] [CrossRef] [PubMed]
- Sabah, A.; et al. , Psychometric characteristics of the Narcissistic Admiration and Rivalry Questionnaire (NARQ): Arabic version. PeerJ 2024, 12, e17982. [Google Scholar] [CrossRef] [PubMed]
- Ali, A.M.; et al. , Cut-off scores of the Depression Anxiety Stress Scale-8: Implications for improving the management of chronic pain. J Clin Nurs 2023, 32, 8054–8062. [Google Scholar] [CrossRef] [PubMed]
- El-Gazar, H.E.; et al. , Decent work and nurses’ work ability: A cross-sectional study of the mediating effects of perceived insider status and psychological well-being. International Journal of Nursing Studies Advances 2025, 8, 100283. [Google Scholar] [CrossRef]
- Ali, A.; et al. The three-item version of the Satisfaction with Life Scale (SWLS) outperforms various structures of the SWLS: Psychometric investigation among people with and without acquired movement disability. 2025. [CrossRef]
Figure 1.
Competing models of the factor structure of the Satisfaction with Life Scale (SWLS) among Polish managers (N= 255).
Figure 1.
Competing models of the factor structure of the Satisfaction with Life Scale (SWLS) among Polish managers (N= 255).
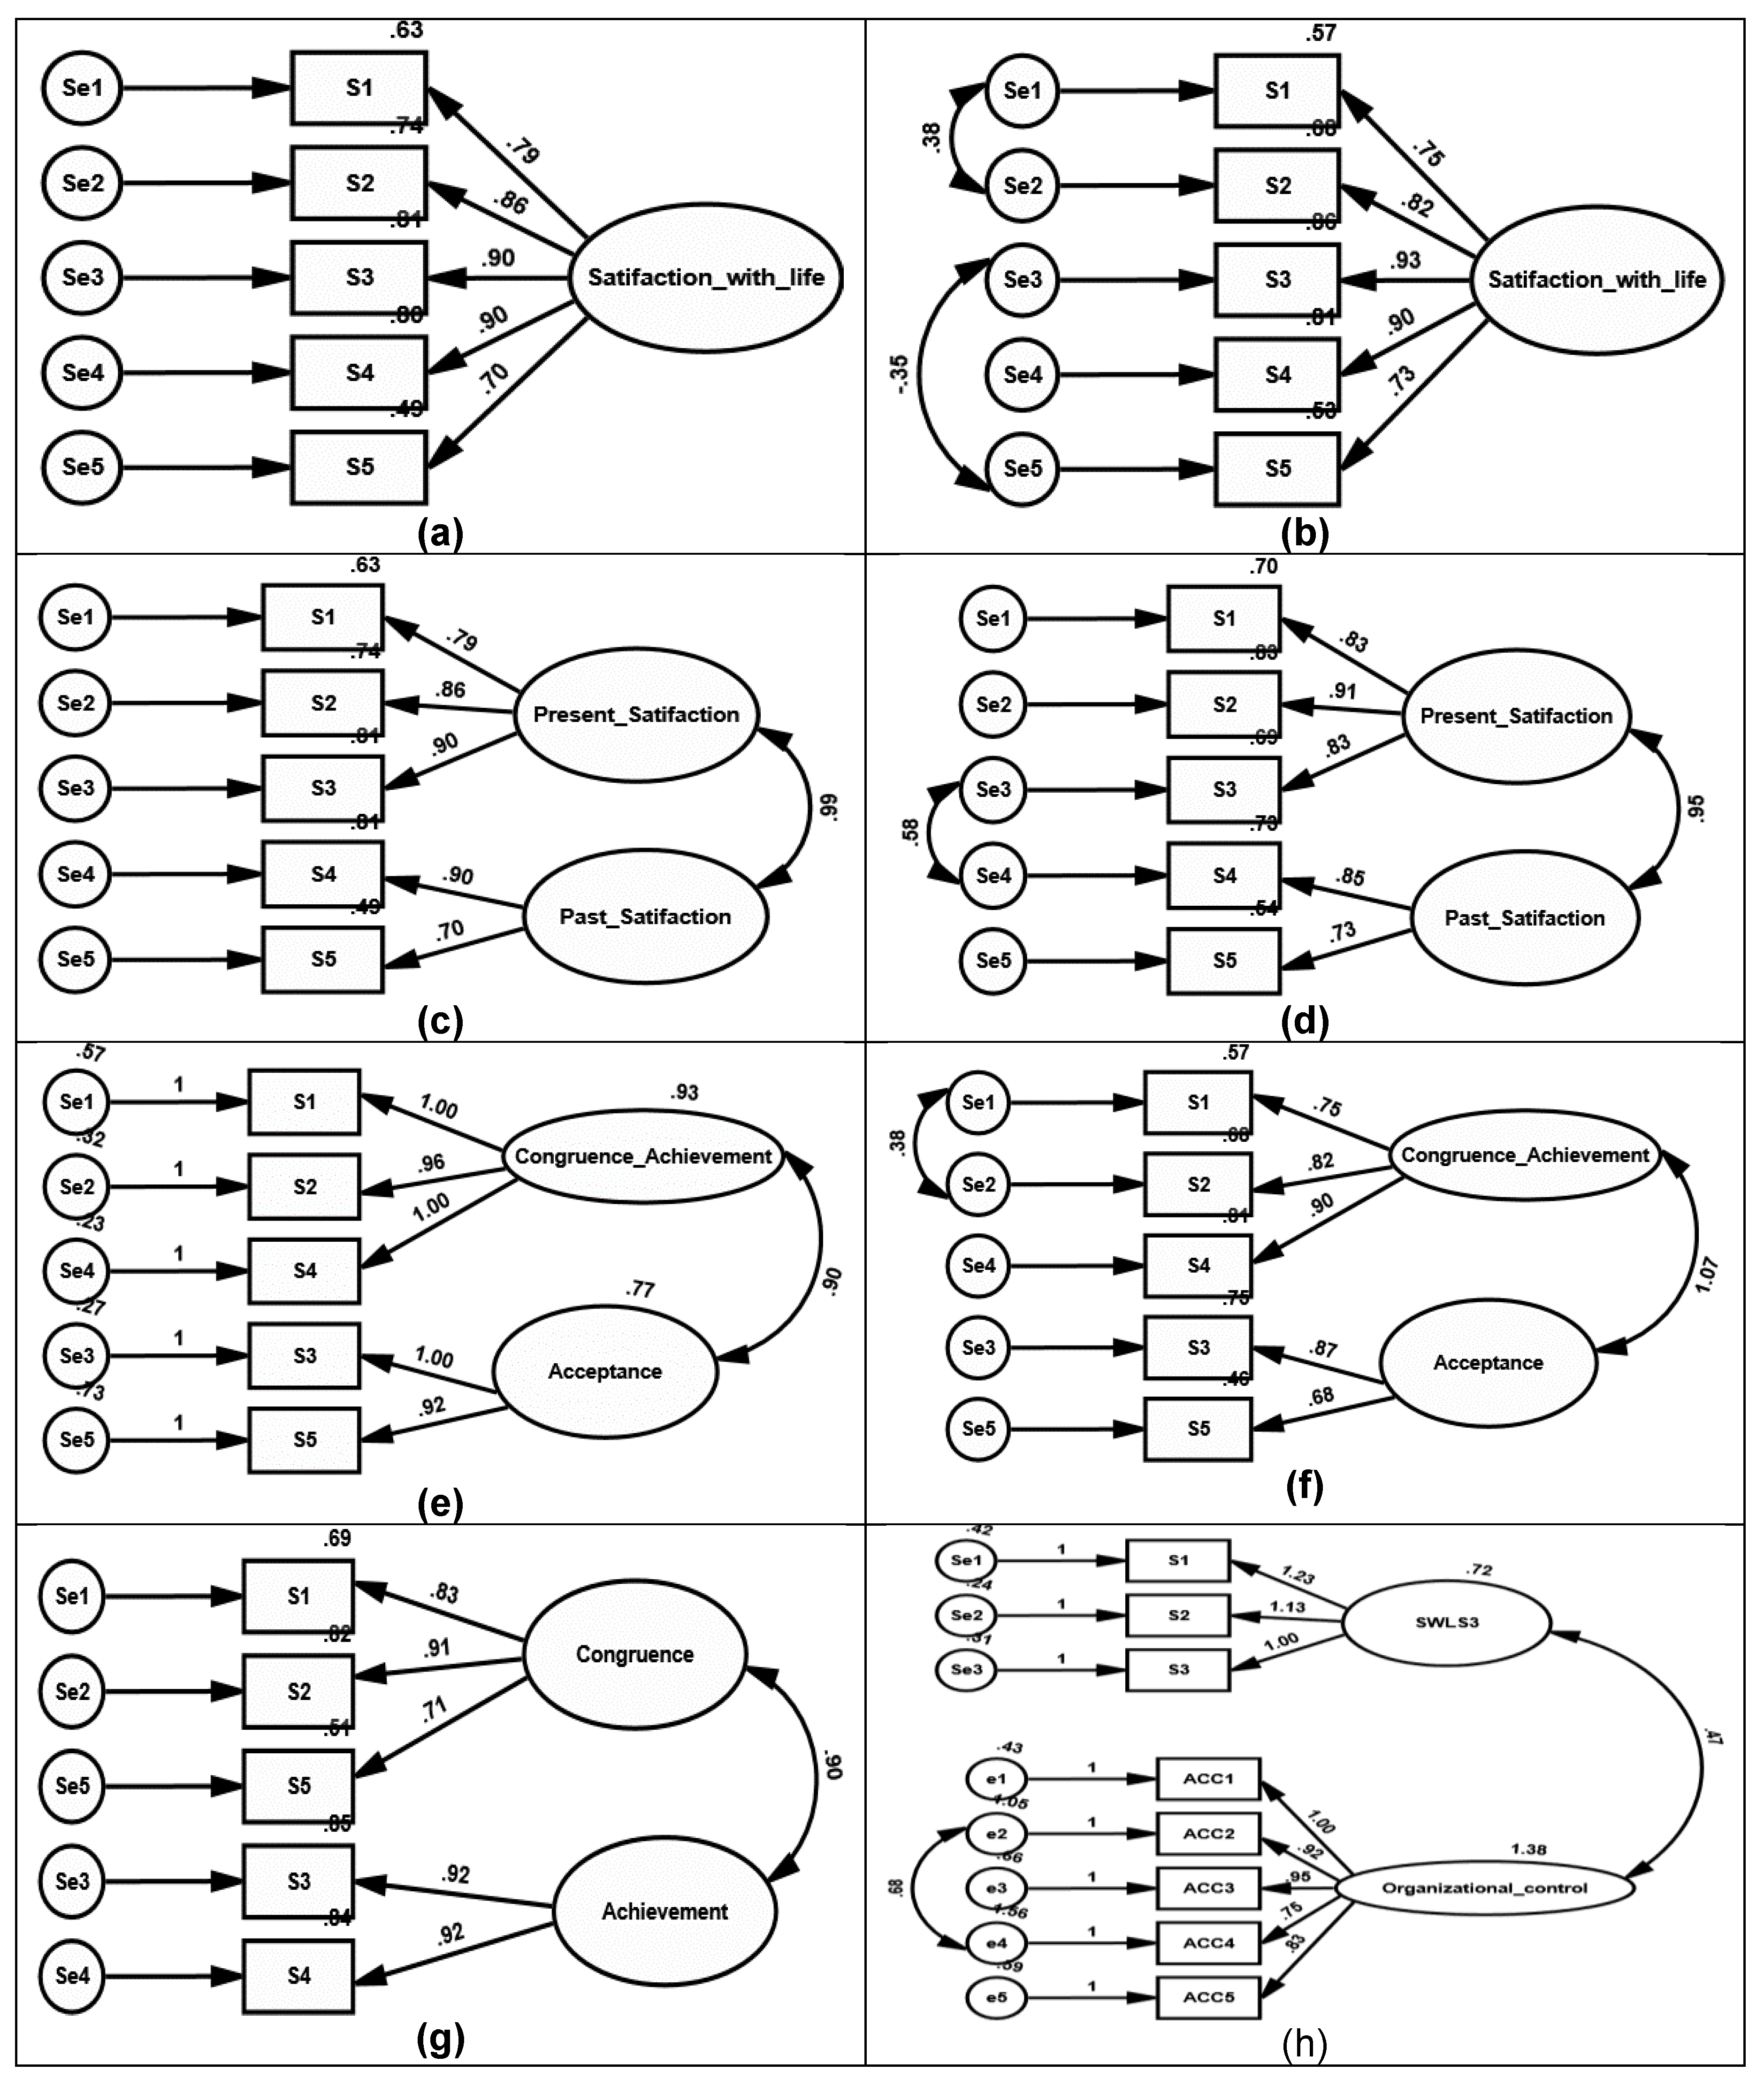

Table 1.
Goodness-of-fit of the confirmatory factor analysis models representing the Satisfaction with Life Scale (SWLS) among Polish managers (N= 255).
Table 1.
Goodness-of-fit of the confirmatory factor analysis models representing the Satisfaction with Life Scale (SWLS) among Polish managers (N= 255).
| Models | χ2 | p | DF | CMIN/DF | CFI | TLI | RMSEA | RMSEA 90% CI | SRMR | |
|---|---|---|---|---|---|---|---|---|---|---|
| Model 1 (SWLS 1F) | Crude | 44.51 | 0.001 | 4 | 8.90 | 0.958 | 0.917 | 0.176 | 0.131 to 0.226 | 0.0314 |
| Error | 6.09 | 0.107 | 3 | 2.03 | 0.997 | 0.989 | 0.064 | 0.000 to 0.137 | 0.0148 | |
| Model 2 (SWLS 2F: Present life, Past life) | Crude | 44.42 | 0.001 | 4 | 11.11 | 0.957 | 0.894 | 0.199 | 0.149 to 0.254 | 0.0314 |
| Error | 1.81 | 0.614 | 3 | 0.60 | 0.999 | 0.999 | 0.000 | 0.000 to 0.087 | 0.0052 | |
| Model 3 (SWLS 2F: Achievement/Congruence, Acceptance/fulfilment) | Crude | 36.44 | 0.001 | 4 | 9.11 | 0.966 | 0.915 | 0.179 | 0.128 to 0.234 | 0.0293 |
| Error | 6.09 | 0.107 | 3 | 2.03 | 0.997 | 0.989 | 0.064 | 0.000 to 0.137 | 0.0148 | |
| Model 4 (SWLS 2F: Achievement, Congruence) | Crude | 7.38 | 0.117 | 4 | 1.85 | 0.996 | 0.991 | 0.058 | 0.000 to 0.122 | 0.0136 |
| Model 5 (SWLS3 1F) | Crude | 65.52 | 0.001 | 18 | 3.64 | 0.962 | 0.940 | 0.102 | 0.076 to 0.129 | 0.0472 |
Abbreviations: χ2, chi-square; DF, degrees of freedom; CFI, comparative fit index; TLI, Tucker–Lewis index; RMSEA, root mean square error of approximation; CI, confidence interval; SRMR, standardized root mean residual.
Table 2.
Invariance of the two-factor structure of the Satisfaction with Life Scale (SWLS: Congruence, Achievement) across gender, age, and relationship groups among Polish managers (N= 255).
Table 2.
Invariance of the two-factor structure of the Satisfaction with Life Scale (SWLS: Congruence, Achievement) across gender, age, and relationship groups among Polish managers (N= 255).
| Groups | Invariance levels | χ2 | DF | P | Δχ2 | ΔDF | p(Δχ2) | CFI | ΔCFI | TLI | ΔTLI | RMSEA | ΔRMSEA | SRMR |
|---|---|---|---|---|---|---|---|---|---|---|---|---|---|---|
| Gender | Configural Metric Scalar Strict |
19.80 22.73 35.09 42.84 |
8 11 14 19 |
0.011 0.019 0.001 0.001 |
2.94 12.35 7.75 |
3 3 5 |
0.401 0.006 0.171 |
0.988 0.988 0.978 0.975 |
0.000 0.010 0.003 |
0.969 0.978 0.969 0.974 |
-0.007 0.007 -0.005 |
0.076 0.065 0.077 0.070 |
0.009 -0.012 0.007 |
0.0199 0.0181 0.0299 0.0292 |
| Age | Configural Metric Scalar Strict |
8.99 11.87 57.08 95.65 |
8 11 14 19 |
0.343 0.374 0.001 0.001 |
2.88 45.21 38.58 |
3 3 5 |
0.411 0.001 0.001 |
0.999 0.999 0.951 0.912 |
0.000 0.048 0.039 |
0.997 0.998 0.930 0.908 |
-0.001 0.068 0.022 |
0.022 0.018 0.111 0.128 |
0.002 -0.093 -0.017 |
0.01690.0231 0.0726 0.0290 |
| Relation | Configural Metric Scalar Strict |
27.79 29.87 30.81 38.37 |
8 11 14 19 |
0.001 0.002 0.006 0.005 |
2.08 0.95 6.57 |
3 3 5 |
0.556 0.814 0.182 |
0.979 0.980 0.982 0.980 |
-0.001 -0.002 0.002 |
0.948 0.964 0.975 0.979 |
-0.016 -0.011 -0.004 |
0.099 0.083 0.069 0.064 |
0.016 0.014 0.003 |
0.0701 0.0748 0.0912 0.1181 |
Abbreviations: χ2, chi-square; DF, degree of freedom; CFI, comparative fit index; TLI, Tucker–Lewis index; RMSEA, root mean square error of approximation; CI, confidence interval; SRMR, standardized root mean residual.
Table 3.
Heterotrait-monotrait ratio of correlations, average variance explained, and internal consistency of the Satisfaction with Life Scale (SWLS) among Polish managers (N= 255).
Table 3.
Heterotrait-monotrait ratio of correlations, average variance explained, and internal consistency of the Satisfaction with Life Scale (SWLS) among Polish managers (N= 255).
| Models | HTMT | AVE | ω | α | ||||
|---|---|---|---|---|---|---|---|---|
| F1 | F2 | F1 | F2 | F1 | F2 | |||
| Model 1 (SWLS 1F) | Crude | -- | 0.682 | -- | 0.911 | -- | 0.915 | -- |
| Error | -- | 0.675 | -- | 0.903 | -- | 0.915 | -- | |
| Model 2 (SWLS 2F: Present life, Past life) | Crude | 0.984 | 0.716 | 0.640 | 0.872 | 0.779 | 0.890 | 0.773 |
| Error | 0.984 | 0.736 | 0.627 | 0.892 | 0.769 | 0.890 | 0.773 | |
| Model 3■ (SWLS 2F: Achievement/Congruence, Acceptance/fulfilment) | Crude | -- | -- | -- | -- | -- | 0.886 | 0.737 |
| Error | -- | -- | -- | -- | -- | 0.886 | 0.737 | |
| Model 4 (SWLS 2F: Achievement, Congruence) | Crude | 0.911 | 0.667 | 0.842 | 0.859 | 0.915 | 0. 851 | 0.914 |
Abbreviations: HTMT: heterotrait-monotrait ratio of correlations, AVE: average variance explained, ω: omega coefficient, α: alpha coefficient, SWLS: Satisfaction With Life Scale, F: factor,■the covariance matrix of the latent variables was not positive definite.
Table 4.
Descriptive statistics, reliability, convergent validity, and distribution of the Satisfaction with Life Scale (SWLS) among Polish managers (N= 255).
Table 4.
Descriptive statistics, reliability, convergent validity, and distribution of the Satisfaction with Life Scale (SWLS) among Polish managers (N= 255).
| Items | Mean (SD) | 1F SWLS | Congruence | Achievement | |||
|---|---|---|---|---|---|---|---|
| ITC | Alpha if item deleted | ITC | Alpha if item deleted | ITC | Alpha if item deleted | ||
| My life is close to my ideal | 4.7 (1.2) | 0.767 | 0.901 | 0.764 | 0.856 | -- | -- |
| The conditions of my life are excellent | 4.8 (1.1) | 0.837 | 0.885 | 0.828 | 0.795 | -- | -- |
| I am satisfied with my life | 5.0 (1.0) | 0.826 | 0.889 | -- | -- | 0.589 | -- |
| I have gotten the important things that I want in life | 5.0 (1.0) | 0.827 | 0.887 | 0.750 | 0.862 | -- | -- |
| If I could live my life over, I would change almost nothing | 4.7 (1.2) | 0.678 | 0.918 | -- | -- | 0.589 | -- |
| ICC single measures 95% CI | 0.683 (0.636-0.728) | 0.721 (0.670-0.767) | 0.583 (0.496-0.658) | ||||
| Mean (SD) | 24.1 (4.8) | 14.4 (3.1) | 9.7 (3.8) | ||||
| Scale correlations with: | |||||||
| SWLS | -- | 0.758** | 0.885** | ||||
| Age | 0.090 | 0.126* | 0.036 | ||||
| COVID-19 distress | -0.158* | -0.149* | -0.101 | ||||
| Openness to experiences | 0.097 | 0.031 | 0.191** | ||||
| General organizational trait | 0.303** | 0.356** | 0.263** | ||||
ITC: Item-total correlations, ICC: intra class coefficient, CI: confidence interval, SWLS: Satisfaction with Life Scale, * and **: significance <0.05 and 0.01, respectively. Mean scores of COVID-19 as stressful for practicing manger’s profession (3.0 ± 0.7), Openess to experience (8.9 ± 1.2), and General organizational trait (5.0 ± 1.2).
Disclaimer/Publisher’s Note: The statements, opinions and data contained in all publications are solely those of the individual author(s) and contributor(s) and not of MDPI and/or the editor(s). MDPI and/or the editor(s) disclaim responsibility for any injury to people or property resulting from any ideas, methods, instructions or products referred to in the content. |
© 2025 by the authors. Licensee MDPI, Basel, Switzerland. This article is an open access article distributed under the terms and conditions of the Creative Commons Attribution (CC BY) license (http://creativecommons.org/licenses/by/4.0/).
Copyright: This open access article is published under a Creative Commons CC BY 4.0 license, which permit the free download, distribution, and reuse, provided that the author and preprint are cited in any reuse.


