Submitted:
08 September 2025
Posted:
09 September 2025
Read the latest preprint version here
Abstract
Altered lipid metabolism is an emerging hallmark of cancer. In glioblastoma, sufficient lipids are key to driving rapid cancer proliferation. SREBF1, a key regulator of fatty acid synthesis, recently gained therapeutic interest. SREBF1 methylation is implicated in metabolic diseases with currently unknown effects in cancer, including glioblastoma. This study characterizes SREBF1 methylation in two independent, population-scale glioblastoma cohorts. Unsupervised clustering of SREBF1 methylation sites reveals two predominant clusters with contrasting levels of cancer stemness (P < 0.01). The high-stemness cluster is younger in epigenetic age (P < 0.05) and higher in the neuronal-stromal composition (P < 0.05). Independent of age, sex, and MGMT subtype, the genome-wide epigenetic landscapes of the clusters were distinct at the global (P < 5e-8) and single-nucleotide resolution (all Bonferroni P < 0.05). Genes involved in neuronal specification and organization were hypo-methylated in the high-stemness cluster (all Bonferroni P < 0.05), which also showed worse overall survival (hazard ratios ≥ 1.25). Taken together, this study offered novel insights into SREBF1 methylation, warranting future research into the epigenetics of the lipid metabolism machinery.
Keywords:
DNA methylation
; epigenetics
; fatty acid synthesis
; glioblastoma
; stemness
1. Introduction
Lipids are macromolecules critical for the normal functioning of human tissue. In brain tissue, lipids account for more than half of the dry weight of the human brain. The building blocks of lipids—fatty acids—participate in multiple processes of brain tissue1. While the role of lipid metabolism in normal brain function and neurological disease is well-known, emerging evidence suggests that altered lipid metabolism, including fatty acid synthesis (FAS), may contribute to carcinogenesis in the brain1,2.
Glioblastoma (GBM), also known as the World Health Organization grade IV glioma, is the most common and deadly form of brain cancer [1,2,3,4,5]. Most GBM patients receive maximum surgical removal of the tumor with concurrent radiation and temozolomide-based chemotherapy, both of which are invasive treatments with severe side effects [2,4]. Despite rigorous therapeutics, the prognosis of GBM is dismal. The median survival of GBM is slightly over a year, and fewer than 1 in 10 patients would survive 5 years post-diagnosis [2,6].
GBM hosts a substantial amount of cancer stem cells with self-renewing and proliferative ability4. Stemness, a phenomenon involving loss of the differentiated cellular features, makes a cell resemble its stem-cell progenitor [7]. In cancer, such de-differentiated cells tend to be more aggressive, exhibiting a greater potential for proliferation and invasion of other tissues [7]. Stem cells are defined by their ability to give rise to other cell types through the process of differentiation. Consequently, higher stemness in tumors introduces a more diverse reservoir of cell types, contributing to elevated heterogeneity, which makes the disease harder to treat [4,6,7]. The progenitor capability of GBM stem cells also enables the persistence of the treatment-resistant cells [4]. Clinically, stemness facilitates cancer progression and manifests in worse prognosis as well as therapeutic resistance, evidenced by most metastatic tumors displaying a de-differentiated state [7].
Emerging evidence links FAS to brain tumor onset and progression [1]. In GBM, a substantial amount of lipid is required to fuel the growth and proliferation of tumor cells [2,6]. Recent evidence has pointed to altered FAS machinery as a candidate driver of GBM stemness. Experiments with a high-fat diet promoted proliferative and anti-apoptotic properties in brain tumor stem cells, while RNA interference targeting of FAS machinery repressed stem-cell features in GBM1. Metabolomic profiling revealed that lipid metabolism levels could distinguish GBM stem and non-stem cell populations6. Targeting FAS has since been proposed as a therapeutic strategy [1,2]. Potential therapeutic targets include fatty acid synthase, a FAS workhorse, as well as sterol regulatory element binding protein 1 (SREBF1), a major FAS regulator [1,2,6].
DNA methylation, the addition of a methyl group to the DNA cytosine base position 5 (5 mC) in the cytosine-phosphate-guanine (CpG) dinucleotide context, plays a crucial role in regulating gene expression and many biological processes, including cellular differentiation and cell-identity maintenance [8,9,10]. The 5mC landscape at the SREBF1 gene has been implicated in lipid metabolism alterations in diseases [11]. In type-2 diabetes, SREBF1 methylation is linked to insulin-resistance risk, thus permitting clinically relevant patient stratification [12]. However, the understanding of SREBF1 methylation in cancer remains limited. In GBM specifically, the role of SREBF1 methylation has not been reported. Given the role of FAS in brain carcinogenesis and the regulatory effect of SREBF1 in FAS, the epigenetics of SREBF1 deserves in-depth investigation.
The goal of this study is to investigate the biological and prognostic relevance of SREBF1 methylation in GBM tumors. In two independent, population-scale cohorts, SREBF1 methylation helps identify a GBM cluster exhibiting significantly higher cancer stemness and younger epigenetic age. The study subsequently reveals a link between SREBF1 methylation and genome-wide epigenetic landscapes at both global and single-nucleotide resolution. The more stem-cell-like cluster is enriched for distinct biological pathways and shows worse survival. All together, this study warrants further research into the biological and translational effects driven by the epigenetics of FAS machinery.
2. Materials and Methods
Study cohorts and samples. This study leveraged two independent, population-scale GBM cohorts with publicly available Illumina’s Infinium HumanMethylation450 BeadChip (450K) and relevant clinical profiles with survival data: n=153 The Cancer Genome Atlas (TCGA) [3] and n=157 Deutsches Krebsforschungszentrum (DKFZ), excluding n=24 non-GBM [5]. The 5mC data for all cohorts were available as matrices of beta-values, which represent the proportion of methylated alleles in a bulk sample and follow a bimodal beta-distribution bound between 0 (unmethylated) and 1 (methylated) [8,9].
MGMT subtype estimation. MGMT promoter methylation status is a well-established prognostic biomarker and a known correlate to isocitrate dehydrogenase (IDH) mutation and the CpG island methylator phenotype (CIMP) in brain tumors [2,3,4,5]. Here, MGMT subtypes were determined by the mgmtstp27 machine-learning algorithm (R package v0.8). The input was the 5mC M-values of CpG probes cg12434587 and cg12981137 [13] obtained by logit transformation of their beta-values [8].
Biological sex inference for DKFZ. Sex can be reliably determined from the median intensities of sex-chromosome probes of methylation arrays [8]. Here, the biological sex of the DKFZ samples, which were not available in the public data accession, was determined by applying the minfi (R/Bioconductor packagev1.46.0) [8] procedures to the intensity data files.
Additional filtering of 5mC DNA methylation data. CpGs tracking to sex chromosomes and annotated as non-specific or cross-reactive (curated list available at https://github.com/sirselim/illumina450k_filtering) [14] were excluded. The CpGs located within SREBF1 and MGMT were also excluded. After filtering, 361,281 CpGs shared between the TCGA and DKFZ cohorts were kept for downstream analyses. Missing values in 5mC were imputed by R/Bioconductor impute v1.74.1 function impute.knn with default k=10.
SREBF1 methylation-based cohort stratification. Of the 42 SREBF1 CpG probes on the 450K array, 38 (90.5%) were present in the filtered datasets and used for GBM stratification. Each sample was assigned a cluster label L or R by applying Recursively Partitioned Mixture Model (R package RPMM v1.25 function blcTree), an iterative unsupervised clustering algorithm designed for the beta-distributed 5mC [15], one cohort at a time. The algorithm also returned a terminal solution with labels LL, LR, RL, and RR (Figure S1). Cluster assignment and sample ordering were determined with seriation (R package v1.5.7) [16] as previously described [17,18,19]. Heat maps with tracking bars labeling cluster membership and CpG annotation were plotted with pheatmap v1.0.12 as described previuosly17–21.
Cancer stemness scores. Malta et al. [7] developed mDNAsi, a methylation-based cancer stemness index using a 219-CpG signature panel. In the filtered cohorts, 212 (96.8%) CpGs were available and none were located within SREBF1 or MGMT genes. The raw mDNAsi values of all samples within each GBM cohort, m, were calculated as m = wT x, where vectors x and w are the beta-values and the corresponding signature weights, respectively. The final mDNAsi value in the k-th sample (mk’) was calculated by intra-cohort min-max transformation [7].
Epigenetic aging. Epigenetic age is an indicator of the biological aging process and cellular differentiation potential and can be calculated by the Horvath method using a 353-CpG panel [22]. Here, epigenetic age was calculated by applying R/Bioconductor package wateRmelon v2.6.0 function agep [9] to the 323 (91.5%) CpGs available, which were not located within SREBF1 or MGMT.
Deconvolution of tumor microenvironment. MDBrainT (R package v0.1.0) is a novel method that dissects the tumor microenvironment using a reference library of 25,913 CpGs from the 450K array. The approach is brain tumor-specific and outperforms several existing approaches [23]. In the filtered cohorts, 20,347 CpGs (78.5%) were present, excluding cg03641529 located within SREBF1. The proportions of tumor cells (i.e. tumor purity), pre-defined immune cells, and pre-defined neuronal-stromal cells were determined by applying the function TMEdeconvolute with reference annotations available as built-in R objects [23].
Global epigenetic summaries. A background set of 47,224 CpGs was obtained by keeping only the sites with the greatest inter-sample variability in each cohort and excluding sites lacking a known-gene annotation. Global methylation was then summarized by the topmost dimensions from a principal component analysis (PCA), PC1 and PC2 (base R function prcomp). The raw components were then standard-normalized within each GBM cohort. The PCA groups, A and B, were assigned based on whether a sample was above or below an unbiased decision line, PC1 = PC2, as described in published genomics studies [21,24,25].
Differential methylation analysis at nucleotide resolution and pathway analysis. The aforementioned background set of 47,224 CpGs was subsequently analyzed for differential methylation adjusting for age, sex, and MGMT subtypes with limma (R/Bioconductor package v3.56.2) as described previously [17,18,19]:
where Mk is the M-value of j-th CpG in k-th sample. All significant CpGs had a Bonferroni-corrected P < 0.05, corresponding to a raw P < 1.06e-6. Volcano plots summarizing differential methylation were implemented in ggrepel (R package v0.9.6) as described previously [17,18,19].
The gene set-based Gene Ontology (GO) [26] and Kyoto Encyclopedia of Genes and Genomes (KEGG) analyses [27] were implemented in WebGestalt2024 (https://www.webgestalt.org), which accepted a target and a background gene set as separate text files [28]. Here, the former was the list of 904 genes associated with the 1,182 hypo-methylated CpGs detected in both cohorts, and the latter was the 12,761-gene list associated with the 47,224-CpG background set. The raw P-values of the GO and KEGG terms were subject to Bonferroni correction.
Survival analysis. The overall survival models were implemented in survival (R package v3.5-5) as described previously [17,20,29]. The time-to-event profiles for overall survival were censored at the 5-year mark. Kaplan-Meier curves were drawn with wrapper function ggsurvplot (R package survminer v0.4.9). Multivariate Cox proportional hazard regression adjusting for age, sex, and MGMT subtypes was also implemented in survival. Hazard ratio (HR) estimates were determined by exponentiating the regression coefficients.
Statistical analyses. All analyses were implemented in R v4.3.1. A continuous variable between the SREBF1 clusters was tested in a univariate manner with a two-sided Welch’s t-test (base R function t.test). A follow-up test adjusting for potential confounders was performed with a Gaussian-linked generalized linear model (base R glm) as described previously [30]. The association between any two binary variables was tested with a two-sided Fisher’s exact test (base R fisher.test) reporting odds ratio (OR) estimates. Similarly, generalized linear models were used for follow-up analyses adjusting for potential confounders, except that the binomial link was used and the adjusted OR estimates were obtained by exponentiating the model coefficients, as described previously [17,24,30]. Visualizations for statistical graphics were implemented in ggplot2 v3.5.2 [31].
3. Results
3.1. SREBF1 methylation stratifies GBM tumors
To identify the GBM subsets driven by SREBF1 methylation, the Recursively Partitioned Mixture Model15 was applied to the DNA 5mC methylation landscape of SREBF1 in TCGA (n=153) [3,32] and DKFZ (n=157) [5], one cohort at a time. Figure 1 shows the cohort-specific heat maps displaying 5mC levels (beta-values, representing the proportion of methylated alleles in a bulk sample). This clustering analysis placed each tumor in Cluster L or R (indicated by the innermost vertical tracking bars in Figure 1 heat maps) based on the SREBF1 methylation patterning. The terminal solution of clustering with sub-clusters is shown in Figure S1.
Table 1 summarizes the clinical characteristics of the identified SREBF1 clusters. Patient age and sex were similar across the clusters. Tumor subtypes according to MGMT promoter methylation, a known correlate to IDH mutation and CIMP relevant in brain tumors, as well as an established biomarker for GBM prognosis [2,3,4,5], did not show a clear association with cluster membership (Table 1). Tumor purity, inferred from genome-wide methylation using a brain tumor-specific algorithm, was also similar by cluster (Figure S2A).
3.2. Cancer stemness delineates SREBF1 methylation clusters
Since FAS is implicated in increased stem cell-like properties of GBM tumor cells [1,2], the relationship between tumor stemness and SREBF1 methylation was investigated next. The level of cancer stemness was measured as mDNAsi, a stemness metric inferred from a panel of DNA methylation biomarkers [7]. Cluster R scored significantly higher in mDNAsi by 5.7-17.2% (both cohorts’ Welch’s t-test P < 0.01; Figure 2A). Adjusting for the potential confounders, the observed difference remained consistent (both cohorts’ P < 0.01; Table S1A).
Epigenetic landscapes reflect biological aging processes, including cellular differentiation potential [20,22]. Younger epigenetic age is linked to more aggressive cancers with poorly differentiated features [20]. Here, Cluster R cases showed significantly younger epigenetic age by 10-14 years (both cohorts’ P < 0.05; Figure 2B). The covariate-adjusted difference in epigenetic age remained significant (both cohorts’ P < 0.05; Table S1B).
Elevated stemness is seen in cancers with rich and complex tumor microenvironments [4,7]. To investigate whether this would be the case in the SREBF1 clusters, cell-type proportions were inferred using a novel methylation-based, brain tumor-specific deconvolution method [23]. The inferred infiltrating immune cell types were generally low and similar across the clusters (Figure S2B). However, Cluster R had a 4-5% higher proportion of neuronal and stromal cell types within the GBM tumor microenvironment (both cohorts’ Welch’s t-test P < 0.01; Figure 2C). Controlling for the potential confounders did not alter the observed relationship (both cohorts’ P < 0.05; Table S1C).
3.3. SREBF1 methylation clusters display distinct genome-wide epigenetic landscapes at the global-summary and single-nucleotide resolution
Epigenetic landscapes contribute to the establishment and maintenance of cell identity by regulating the genes involved in determining cell fate [10]. Given the mounting evidence of differential stemness between SREBF1 methylation clusters, the genome-wide epigenetic landscapes were investigated next. First, the most variable 47,224 CpGs were summarized into a single data point on a two-dimensional feature space with PCA. Each tumor was then assigned to group “A” (above) or “B” (below) an unbiased linear boundary, PC1 = PC2 [21,24,25] (Figure 3A). The PCA-based group assignment and SREBF1 cluster membership were strongly and significantly related (both cohorts’ OR > 7 and Fisher’s exact P < 5e-8; Figure 3A). This association remained strong and significant after adjusting for the potential confounders (both cohorts’ adjusted OR > 9 and P < 5e-7; Table S1D).
The finding in global epigenetics led to the hypothesis that each SREBF1 cluster would be undergoing distinct biological processes. To test this, individual differentially methylated CpGs were first identified from the 47,224-CpG background adjusting for age, sex, and MGMT subtypes [29,30]. Nearly all significant CpGs (all Bonferroni P < 0.05) were hypo-methylated in Cluster R (Figure 3B and Table S2A-B). GO and KEGG enrichment analyses were then applied to the genes associated with the hypomethylated CpGs consistently detected in both cohorts. Table 2 lists the significant terms (all Bonferroni P < 0.05), which were predominantly neuron-specific biological processes, cellular components, molecular functions, and pathways, linked to the hypo-methylated gene sets in Cluster R.
3.4. SREBF1 methylation may be a biomarker for patient survival
Figure 4 shows the univariate Kaplan-Meier analysis of 5-year overall survival with respect to the SREBF1 clusters. Cluster R exhibited reduced median overall survival, although the reduction was statistically significant only in TCGA (log-rank P < 0.01). The Kaplan-Meier curves also suggested that the DKFZ survival data might be noisy. Table 3 lists the findings of the multivariate Cox proportional hazards regression. Adjusting for age, sex, and MGMT subtype, Cluster R cases were at a greater risk of death in both TCGA (HR = 1.7, 95% CI = 1.1-2.6) and DKFZ (HR = 1.3, 95% CI = 0.8-1.9).
4. Discussion
FAS is an emerging therapeutic area of research in the aggressive GBM tumor context. While the principal regulator of FAS, SREBF1, has been targeted experimentally, the understanding of the epigenetic mechanisms of SREBF1 remains limited. This study investigates the biological and clinical value of SREBF1 5mC DNA methylation, the most well-studied epigenetic modification, offering evidence to support further investment into researching epigenetic modification of the FAS machinery. Importantly, the analyses of this study address the known confounders age and sex, as well as the MGMT subtype relevant in brain tumors.
The Recursively Partitioned Mixture Model applied to the 5mC methylation landscape of SREBF1 revealed two predominant clusters in the GBM cohorts. One cluster showed significantly higher stemness, a characteristic involving increased proliferative capacity, cellular heterogeneity, and aggressive cancers [7]. Supporting this observation, a younger epigenetic age, indicative of greater cellular differentiation potential [22], coincided with elevated stemness. These findings are in line with an earlier study reporting the link between lipid metabolism alteration, which delineated stem cells from non-stem cells in GBM [6].
Epigenetic landscapes help establish and maintain cell identity by modulating cellular differentiation programs [10]. This concept motivated an interrogation of the genome-wide epigenetic landscapes in relation to the SREBF1 clusters. At the global-summary level, epigenetic landscapes were strongly and significantly associated with SREBF1 cluster membership. At the single-nucleotide resolution, a substantial number of hypo-methylated CpGs were detected in the stemness-high cluster, hinting at fundamentally distinct molecular programs underlying the tumor clusters.
Tumor microenvironments are typically more complex in brain tumors of higher grades and poorer differentiation status [4]. The results here showed the high-stemness cluster exhibited increased proportions of neuronal and stromal cell types, consistent with existing knowledge. Biological processes and pathways, as well as molecular functions and cellular components, were linked to the consistently hypo-methylated genes. Since hypo-methylation is generally linked to increased expression [17], this finding implies that the neuron-specific genes might be overexpressed in the more stem cell-like GBM, which in turn, could harbor more complex tumor microenvironments consisting of heterogeneous neuronal cell types.
This study has limitations and observations that it cannot fully explain. First, the differences across the SREBF1 clusters appeared rather modest in the absence of a systematic clustering algorithm. This study overcame this by leveraging population-scale sample sizes and applying the Recursively Partitioned Mixture Model most well-suited to the beta-distributed 5mC data. It is important to note that the clustering solution here might be challenging to replicate in less-empowered cohorts and susceptible to unstable output due to sample-size variations. Similarly, while the difference in tumor microenvironment composition was statistically significant in the two independent cohorts, whether the magnitude was biologically or clinically relevant remained unclear.
Second, prior research suggested that elevated heterogeneity in GBM tumors includes contributions from infiltrating immune cells [7]. Immune-related processes also play a key role in human tissues involved in lipid metabolism and storage [14,24], and epigenetics-based immune repertoire is closely linked to metabolism-related phenotypes [19]. Here, immune cell-type proportions showed few differences between the SREBF1 clusters despite varying neuronal-stromal composition detected. This discrepancy from the literature could be due to technical artifacts in the tumor deconvolution procedure, as evidenced by the heavily zero-inflated output of the inference algorithm. Currently, deconvolution methodologies in non-blood tissue, let alone in brain tumors, are still in their infancy. Developing robust deconvolution approaches should remain an ongoing research focus.
Although the potential confounders important in GBM were addressed, the findings here might be weakened by unmeasured and unknown confounders. Since metabolism was being investigated, body mass index and prior obesity diagnosis are examples that could affect the observed associations [24]. Similarly, chemotherapy and radiation treatment, which could impact epigenetic landscapes and survival outcomes, should also be considered in future studies, ideally through a prospective design with complete data collection on survival and treatment [17,21].
Another intriguing future direction is the landscape 5-hydroxymethylation (5hmC), the epigenetic modification downstream of 5mC and occasionally referred to as “de-methylation”, of the FAS machinery. Notably, 5hmC is preferentially enriched in the brain compared to other tissue types, and 5hmC exhibits pronounced alterations in brain tumors and subtype-driven heterogeneity [33]. Interrogating the relationship between FAS and 5hmC, a lesser-studied epigenetic mark, will help elucidate the bio-molecular process while identifying new opportunities for novel brain tumor therapeutics.
In summary, this study demonstrated consistent stratification of GBM tumors based on 5mC DNA methylation of SREBF1, a principal regulator of FAS. The SREBF1 methylation-based GBM stratification is characterized by varying levels of cancer stemness, tumor microenvironment composition, and genome-wide epigenetic landscapes at global and nucleotide resolution. The findings from this study support the potential clinical utility of SREBF1 methylation and warrant ongoing research in the epigenetics of FAS machinery.
5. Declarations
Author Contributions
Y.C. curated the publicly available datasets, conducted data analysis, and wrote the manuscript.
Funding
None.
Data Availability Statement
All datasets used in this study were open-access and freely available without special approval. The TCGA methylation and sample-level metadata were publicly available under Synapse (https://www.synapse.org) accession syn19101973. TCGA survival data was from the Pan-cancer Clinical Data Resource available in Liu et al32. The methylation and clinical data of DKFZ were available under Gene Expression Omnibus (https://www.ncbi.nlm.nih.gov/geo) accessions GSE1036595. R code used in this study was deposited in GitHub at https://github.com/ydavidchen/gbm_efas.
Acknowledgments
The author would like to thank the editorial team of MDPI Lipidology for providing guidance throughout the publication process and the anonymous peer reviewers for their scientific contributions.
Conflict of Interest
The author declares no competing financial interests.
Abbreviations
450K, Illumina HumanMethylation450 BeadChip; 5mC, 5-methylcytosine; CI, confidence interval; CpG, cytosine-phosphate-guanine; DKFZ, Deutsches Krebsforschungszentrum (cohort); FAS, fatty acid synthesis; GBM, glioblastoma; HR, hazard ratio; OR, odds ratio; SREBF1, gene encoding the steroid response element binding factor protein 1; TCGA, The Cancer Genome Atlas (cohort)
References
- Miska, J.; Chandel, N.S. Targeting fatty acid metabolism in glioblastoma. Journal of Clinical Investigation. 2023, 133. [Google Scholar] [CrossRef]
- Kou, Y.; Geng, F.; Guo, D. Lipid Metabolism in Glioblastoma: from de novo Synthesis to Storage. Biomedicines. 2022, 10, 1943. [Google Scholar] [CrossRef]
- Brennan, C.W.; Verhaak, R.G.W.; McKenna, A.; et al. The Somatic Genomic Landscape of Glioblastoma. Cell. 2013, 155, 462–477. [Google Scholar] [CrossRef] [PubMed]
- Lathia, J.D.; Mack, S.C.; Mulkearns-Hubert, E.E.; Valentim, C.L.L.; Rich, J.N. Cancer stem cells in glioblastoma. Genes Dev. 2015, 29, 1203–1217. [Google Scholar] [CrossRef]
- Kickingereder, P.; Neuberger, U.; Bonekamp, D.; et al. Radiomic subtyping improves disease stratification beyond key molecular, clinical, and standard imaging characteristics in patients with glioblastoma. Neuro Oncol. 2018, 20, 848–857. [Google Scholar] [CrossRef]
- Shakya, S.; Gromovsky, A.D.; Hale, J.S.; et al. Altered lipid metabolism marks glioblastoma stem and non-stem cells in separate tumor niches. Acta Neuropathol Commun. 2021, 9, 101. [Google Scholar] [CrossRef]
- Malta, T.M.; Sokolov, A.; Gentles, A.J.; et al. Machine Learning Identifies Stemness Features Associated with Oncogenic Dedifferentiation. Cell. 2018, 173, 338–354.e15. [Google Scholar] [CrossRef]
- Aryee, M.J.; Jaffe, A.E.; Corrada-Bravo, H.; et al. Minfi: A flexible and comprehensive Bioconductor package for the analysis of Infinium DNA methylation microarrays. Bioinformatics. 2014, 30, 1363–1369. [Google Scholar] [CrossRef] [PubMed]
- Pidsley, R.; YWong, C.C.; Volta, M.; Lunnon, K.; Mill, J.; Schalkwyk, L.C. A data-driven approach to preprocessing Illumina 450K methylation array data. BMC Genomics. 2013, 14, 293. [Google Scholar] [CrossRef]
- Suelves, M.; Carrió, E.; Núñez-Álvarez, Y.; Peinado, M.A. DNA methylation dynamics in cellular commitment and differentiation. Brief Funct Genomics. 2016, 15, 443–453. [Google Scholar] [CrossRef] [PubMed]
- Moody, L.; Hernández-Saavedra, D.; Kougias, D.G.; Chen, H.; Juraska, J.M.; Pan, Y.X. Tissue-specific changes in Srebf1 and Srebf2 expression and DNA methylation with perinatal phthalate exposure. Environ Epigenet. 2019, 5, dvz009. [Google Scholar] [CrossRef] [PubMed]
- Krause, C.; Sievert, H.; Geißler, C.; et al. Critical Evaluation of the DNA-Methylation Markers ABCG1 and SREBF1 for Type 2 Diabetes Stratification. Epigenomics. 2019, 11, 885–897. [Google Scholar] [CrossRef]
- Bady, P.; Sciuscio, D.; Diserens, A.C.; et al. MGMT methylation analysis of glioblastoma on the Infinium methylation BeadChip identifies two distinct CpG regions associated with gene silencing and outcome, yielding a prediction model for comparisons across datasets, tumor grades, and CIMP-status. Acta Neuropathol. 2012, 124, 547–560. [Google Scholar] [CrossRef]
- Benton, M.C.; Johnstone, A.; Eccles, D.; et al. An analysis of DNA methylation in human adipose tissue reveals differential modification of obesity genes before and after gastric bypass and weight loss. Genome Biol. 2015, 16, 8. [Google Scholar] [CrossRef] [PubMed]
- Houseman, E.A.; Accomando, W.P.; Koestler, D.C.; et al. DNA methylation arrays as surrogate measures of cell mixture distribution. BMC Bioinformatics. 2012, 13, 86. [Google Scholar] [CrossRef] [PubMed]
- Hahsler, M.; Hornik, K.; Buchta, C. Getting Things in Order: An Introduction to the R Package seriation. J Stat Softw 2008, 25. [Google Scholar] [CrossRef]
- Chen, Y.; Salas, L.A.; Marotti, J.D.; et al. Extensive epigenomic dysregulation is a hallmark of homologous recombination deficiency in triple-negative breast cancer. Int J Cancer. 2025, 156, 1191–1202. [Google Scholar] [CrossRef]
- Chen, Y.; Armstrong, D.A.; Salas, L.A.; et al. Genome-wide DNA methylation profiling shows a distinct epigenetic signature associated with lung macrophages in cystic fibrosis. Clin Epigenetics. 2018, 10, 152. [Google Scholar] [CrossRef]
- Armstrong, D.A.; Chen, Y.; Dessaint, J.A.; et al. DNA Methylation Changes in Regional Lung Macrophages Are Associated with Metabolic Differences. Immunohorizons. 2019, 3, 274–281. [Google Scholar] [CrossRef]
- Chen, Y.; Wang, Y.; Salas, L.A.; et al. Molecular and epigenetic profiles of BRCA1-like hormone-receptor-positive breast tumors identified with development and application of a copy-number-based classifier. Breast Cancer Res. 2019, 21, 14. [Google Scholar] [CrossRef]
- Chen, Y. Reproducible and Generalizable Framework for Multi-class Hierarchical Classification Demonstrated by DNA Methylation-based Glioma Subtyping. International Journal for Cross-Disciplinary Subjects in Education. 2024, 15, 4946–4950. [Google Scholar] [CrossRef]
- Horvath, S. DNA methylation age of human tissues and cell types. Genome Biol. 2013, 14, R115. [Google Scholar] [CrossRef] [PubMed]
- Liu, F.; Qian, J.; Ma, C. DNA Methylation-Based Cell Type Deconvolution Reveals the Distinct Cell Composition in Brain Tumor Microenvironment. arXiv (preprint), 22 January 2025. [Google Scholar] [CrossRef]
- Chen, Y. Transcriptomic profiling of subcutaneous adipose tissue in relation to bariatric surgery: a retrospective, pooled re-analysis. J Obes Metab Syndr. 2023, 32, 98–02. [Google Scholar] [CrossRef]
- Chen, Y. Pooled microarray expression analysis of failing left ventricles reveals extensive cellular-level dysregulation independent of age and sex. Journal of Molecular and Cellular Cardiology Plus. 2024, 7, 100060. [Google Scholar] [CrossRef] [PubMed]
- Gene Ontology Consortium. The Gene Ontology Resource: 20 years and still GOing strong. Nucleic Acids Res. 2019, 47, D330–D338. [Google Scholar] [CrossRef]
- Kanehisa, M.; Furumichi, M.; Tanabe, M.; Sato, Y.; Morishima, K. KEGG: new perspectives on genomes, pathways, diseases and drugs. Nucleic Acids Res. 2017, 45, D353–D361. [Google Scholar] [CrossRef]
- Elizarraras, J.M.; Liao, Y.; Shi, Z.; Zhu, Q.; Pico, A.R.; Zhang, B. WebGestalt 2024: faster gene set analysis and new support for metabolomics and multi-omics. Nucleic Acids Res. 2024, 52, W415–W421. [Google Scholar] [CrossRef]
- Chen, Y. A Cancer Proliferation Gene Signature Supervised by Ki-67 Strata Specific to Luminal A, Estrogen Receptor-Positive, and HER2-Negative Ductal Carcinomas. Med Res Arch 2022, 10. [Google Scholar] [CrossRef]
- Chen, Y. Transcriptomic signature of CD4-expressing T-cell abundance developed in healthy peripheral blood predicts strong anti-retroviral therapeutic response in HIV-1: A retrospective and proof-of-concept study. INNOSC Theranostics and Pharmacological Sciences. 2024, 7, 2761. [Google Scholar] [CrossRef]
- Wickham, H. GGPLOT2: Elegant Graphics for Data Analysis. Springer-Verlag; 2016.
- Liu, J.; Lichtenberg, T.; Hoadley, K.A.; et al. An Integrated TCGA Pan-Cancer Clinical Data Resource to Drive High-Quality Survival Outcome Analytics. Cell. 2018, 173, 400–416.e11. [Google Scholar] [CrossRef]
- Azizgolshani, N.; Petersen, C.L.; Chen, Y.; et al. DNA 5-hydroxymethylcytosine in pediatric central nervous system tumors may impact tumor classification and is a positive prognostic marker. Clin Epigenetics. 2021, 13, 176. [Google Scholar] [CrossRef] [PubMed]
Figure 1.
GBM tumor stratification based on SREBF1 methylation for TCGA and DKFZ cohorts. Heat maps show tumor strata identified by the unsupervised Recursively Partitioned Mixture Model. Rows represent GBM samples ordered by clustering solutions. Columns represent CpG probes ordered by genomic position in the direction of SREBF1 gene transcription. Heat color represents 5mC methylation beta-value, the proportion of methylated alleles in a bulk sample, where 0=unmethylated and 1=methylated.
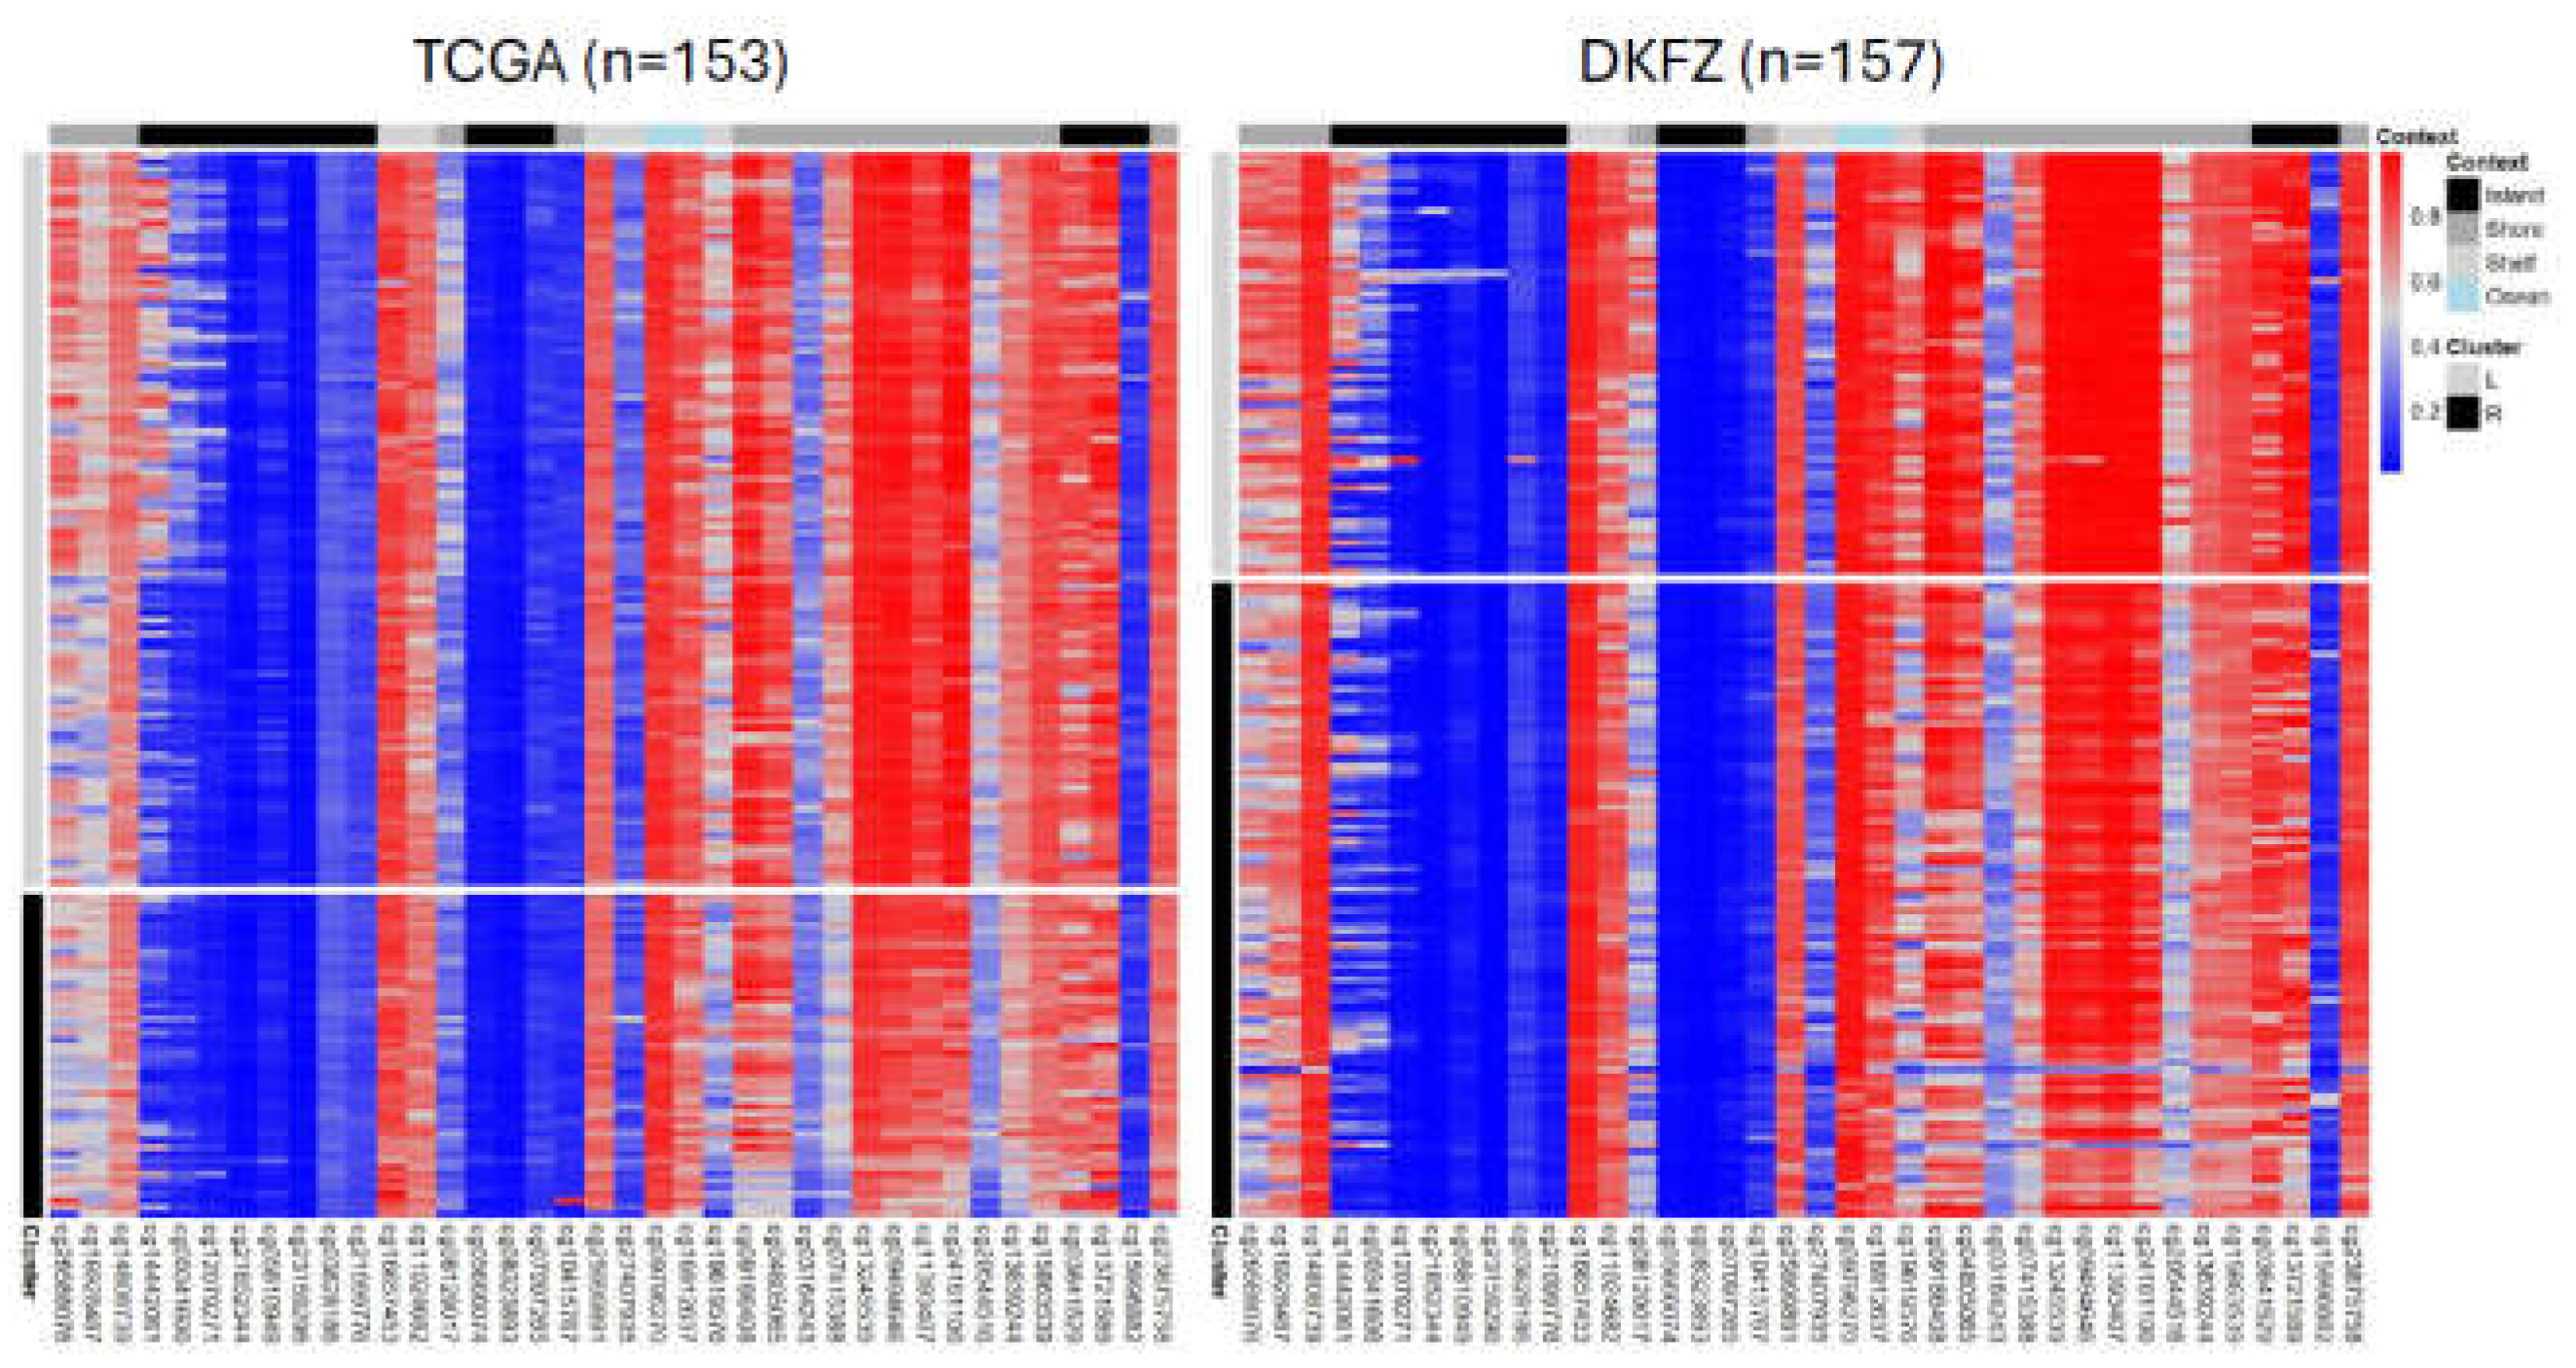
Figure 2.
Elevated cancer stemness measures in SREBF1 Cluster R. (A) Methylation-based cancer stemness index, mDNAsi. (B) Epigenetic age by the Horvath method. Chronological age is included as a comparison. (C) Proportion of neuronal-stromal cell types. Related to Table S1A-C. n.s. not significant, *P < 0.05, **P < 0.01, ***P < 0.001, two-sided Welch’s t-test.
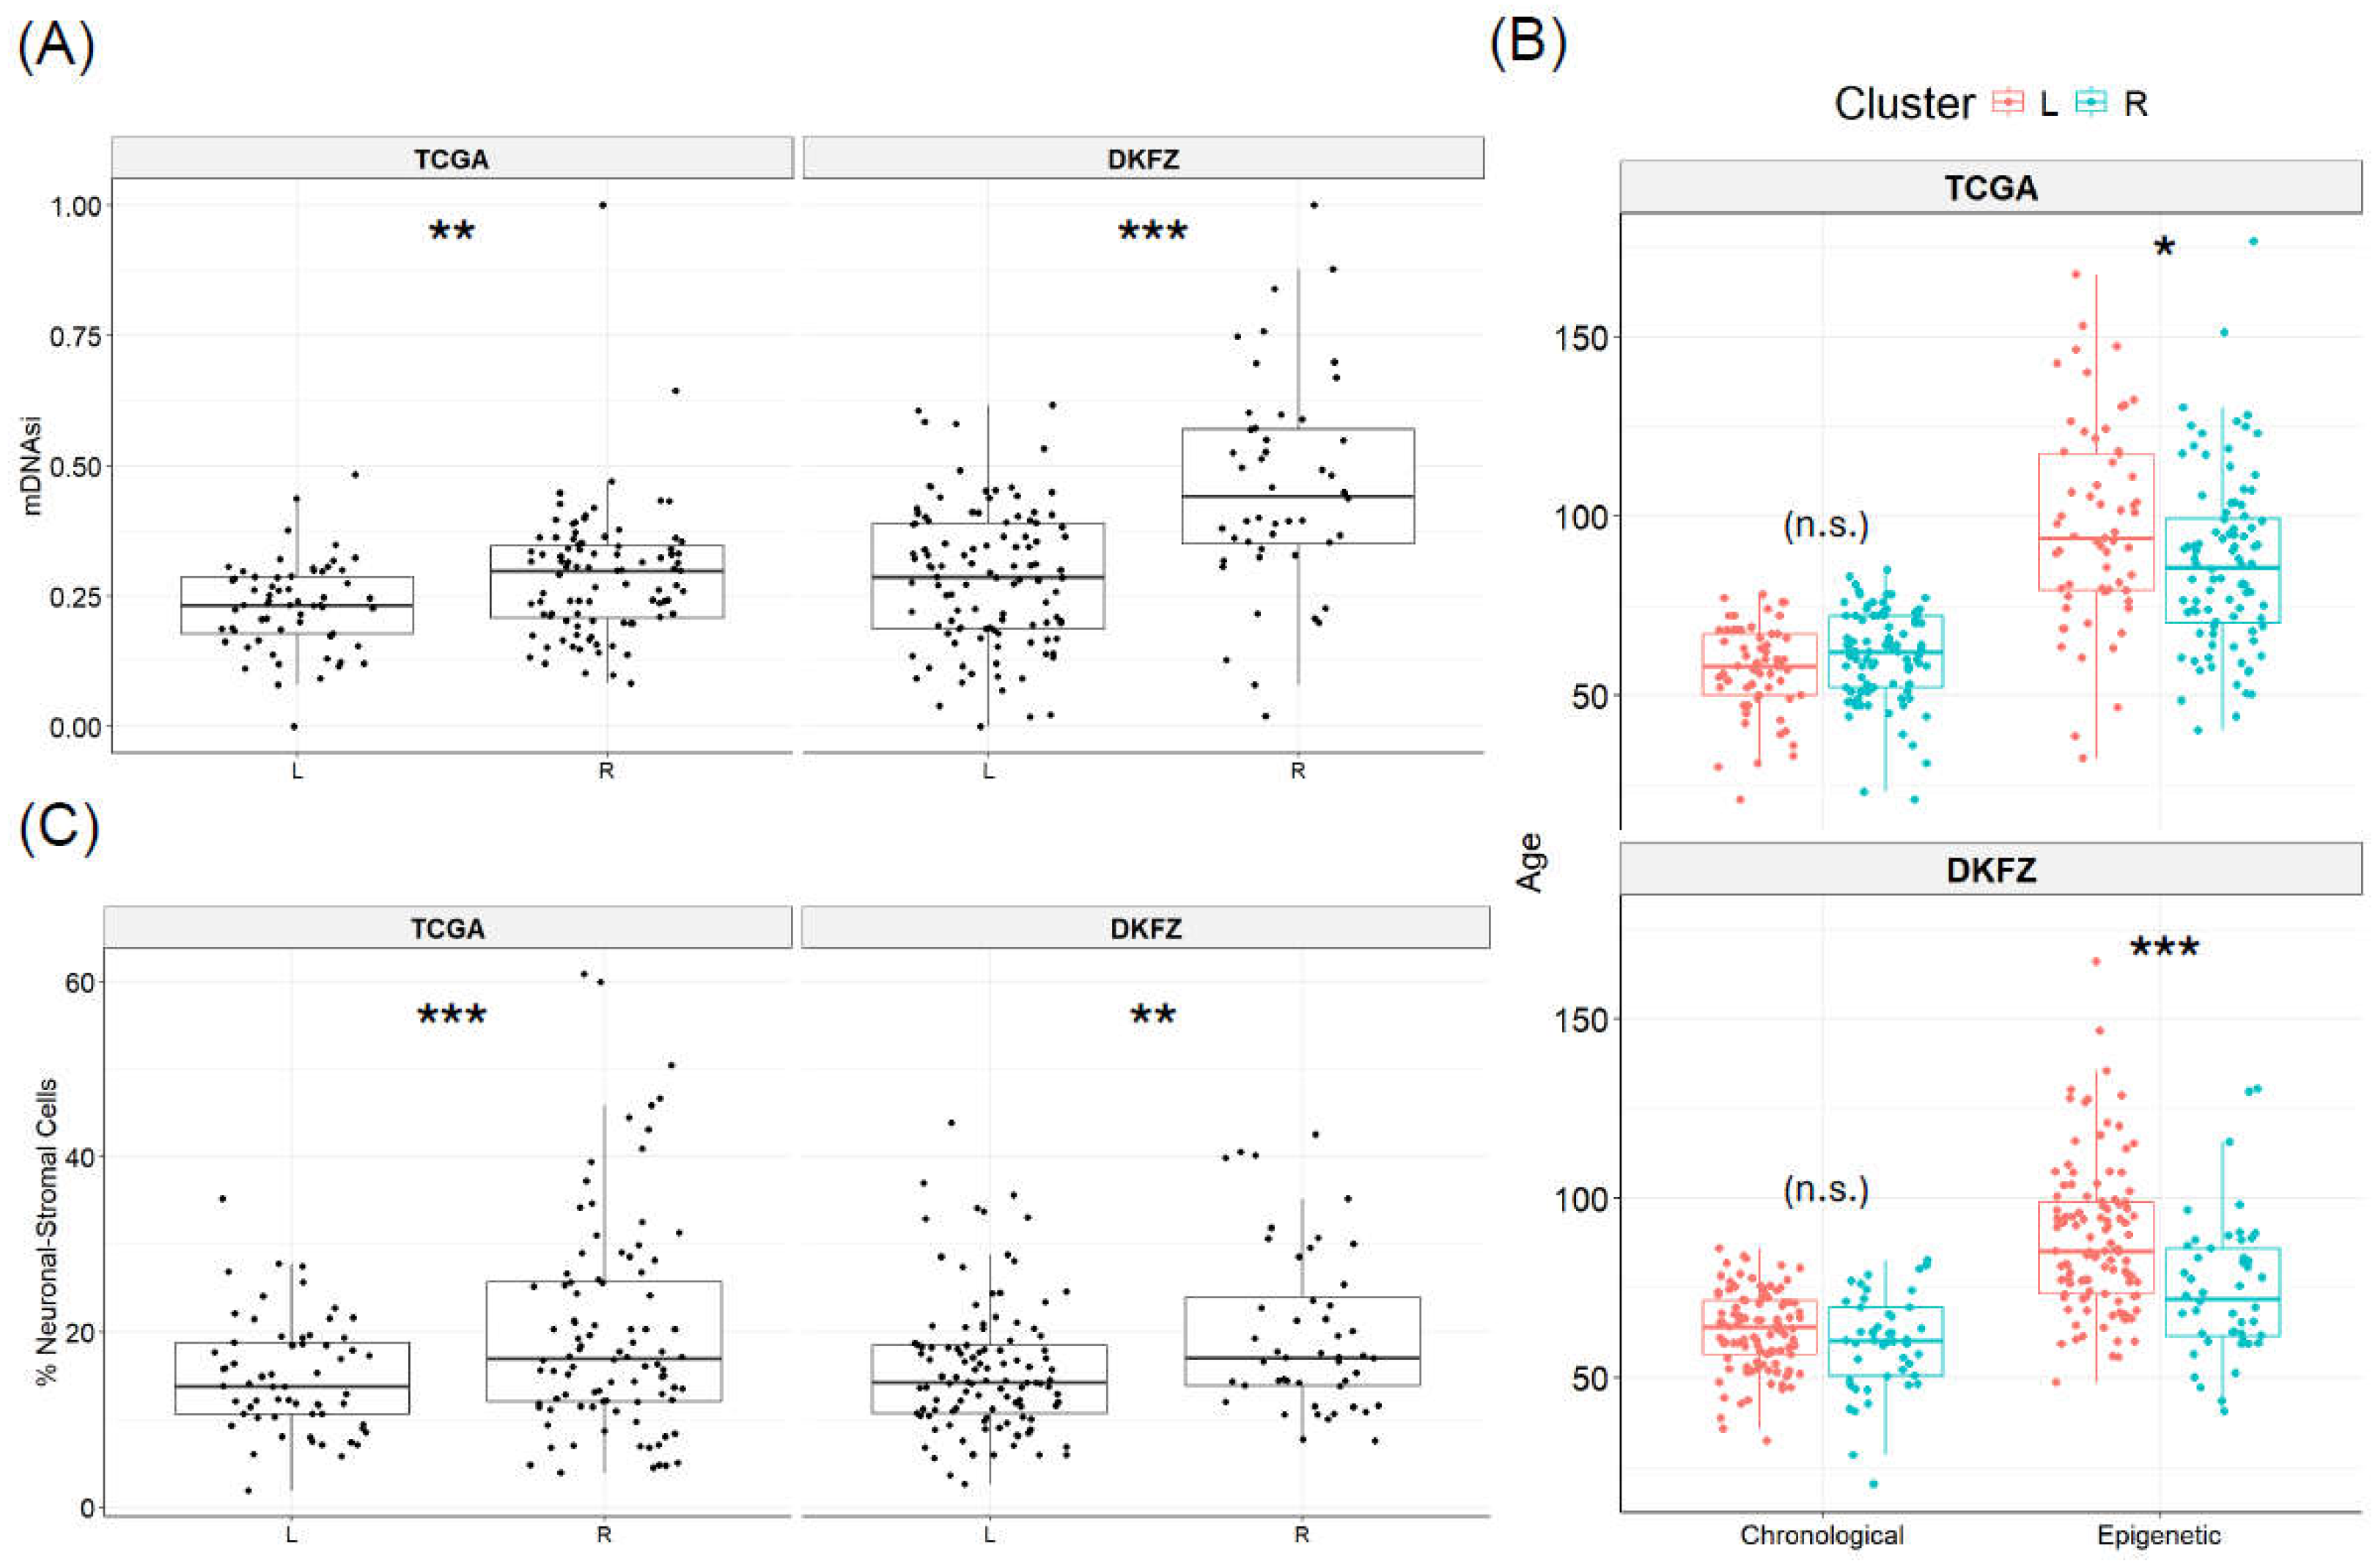
Figure 3.
Genome-wide epigenetic landscapes of SREBF1 methylation clusters. (A) Topmost principal components based on 47,224 most variable gene-associated CpGs shared across the cohorts. Groups A and B were defined based on linear decision boundary PC2 = PC1. Related to Table S1D. (B) Volcano plot showing differentially methylated CpGs relative to the background set in gray. All non-gray points are CpGs with Bonferroni P < 0.05 or raw P < 1.06e-6. Related to Table S2.
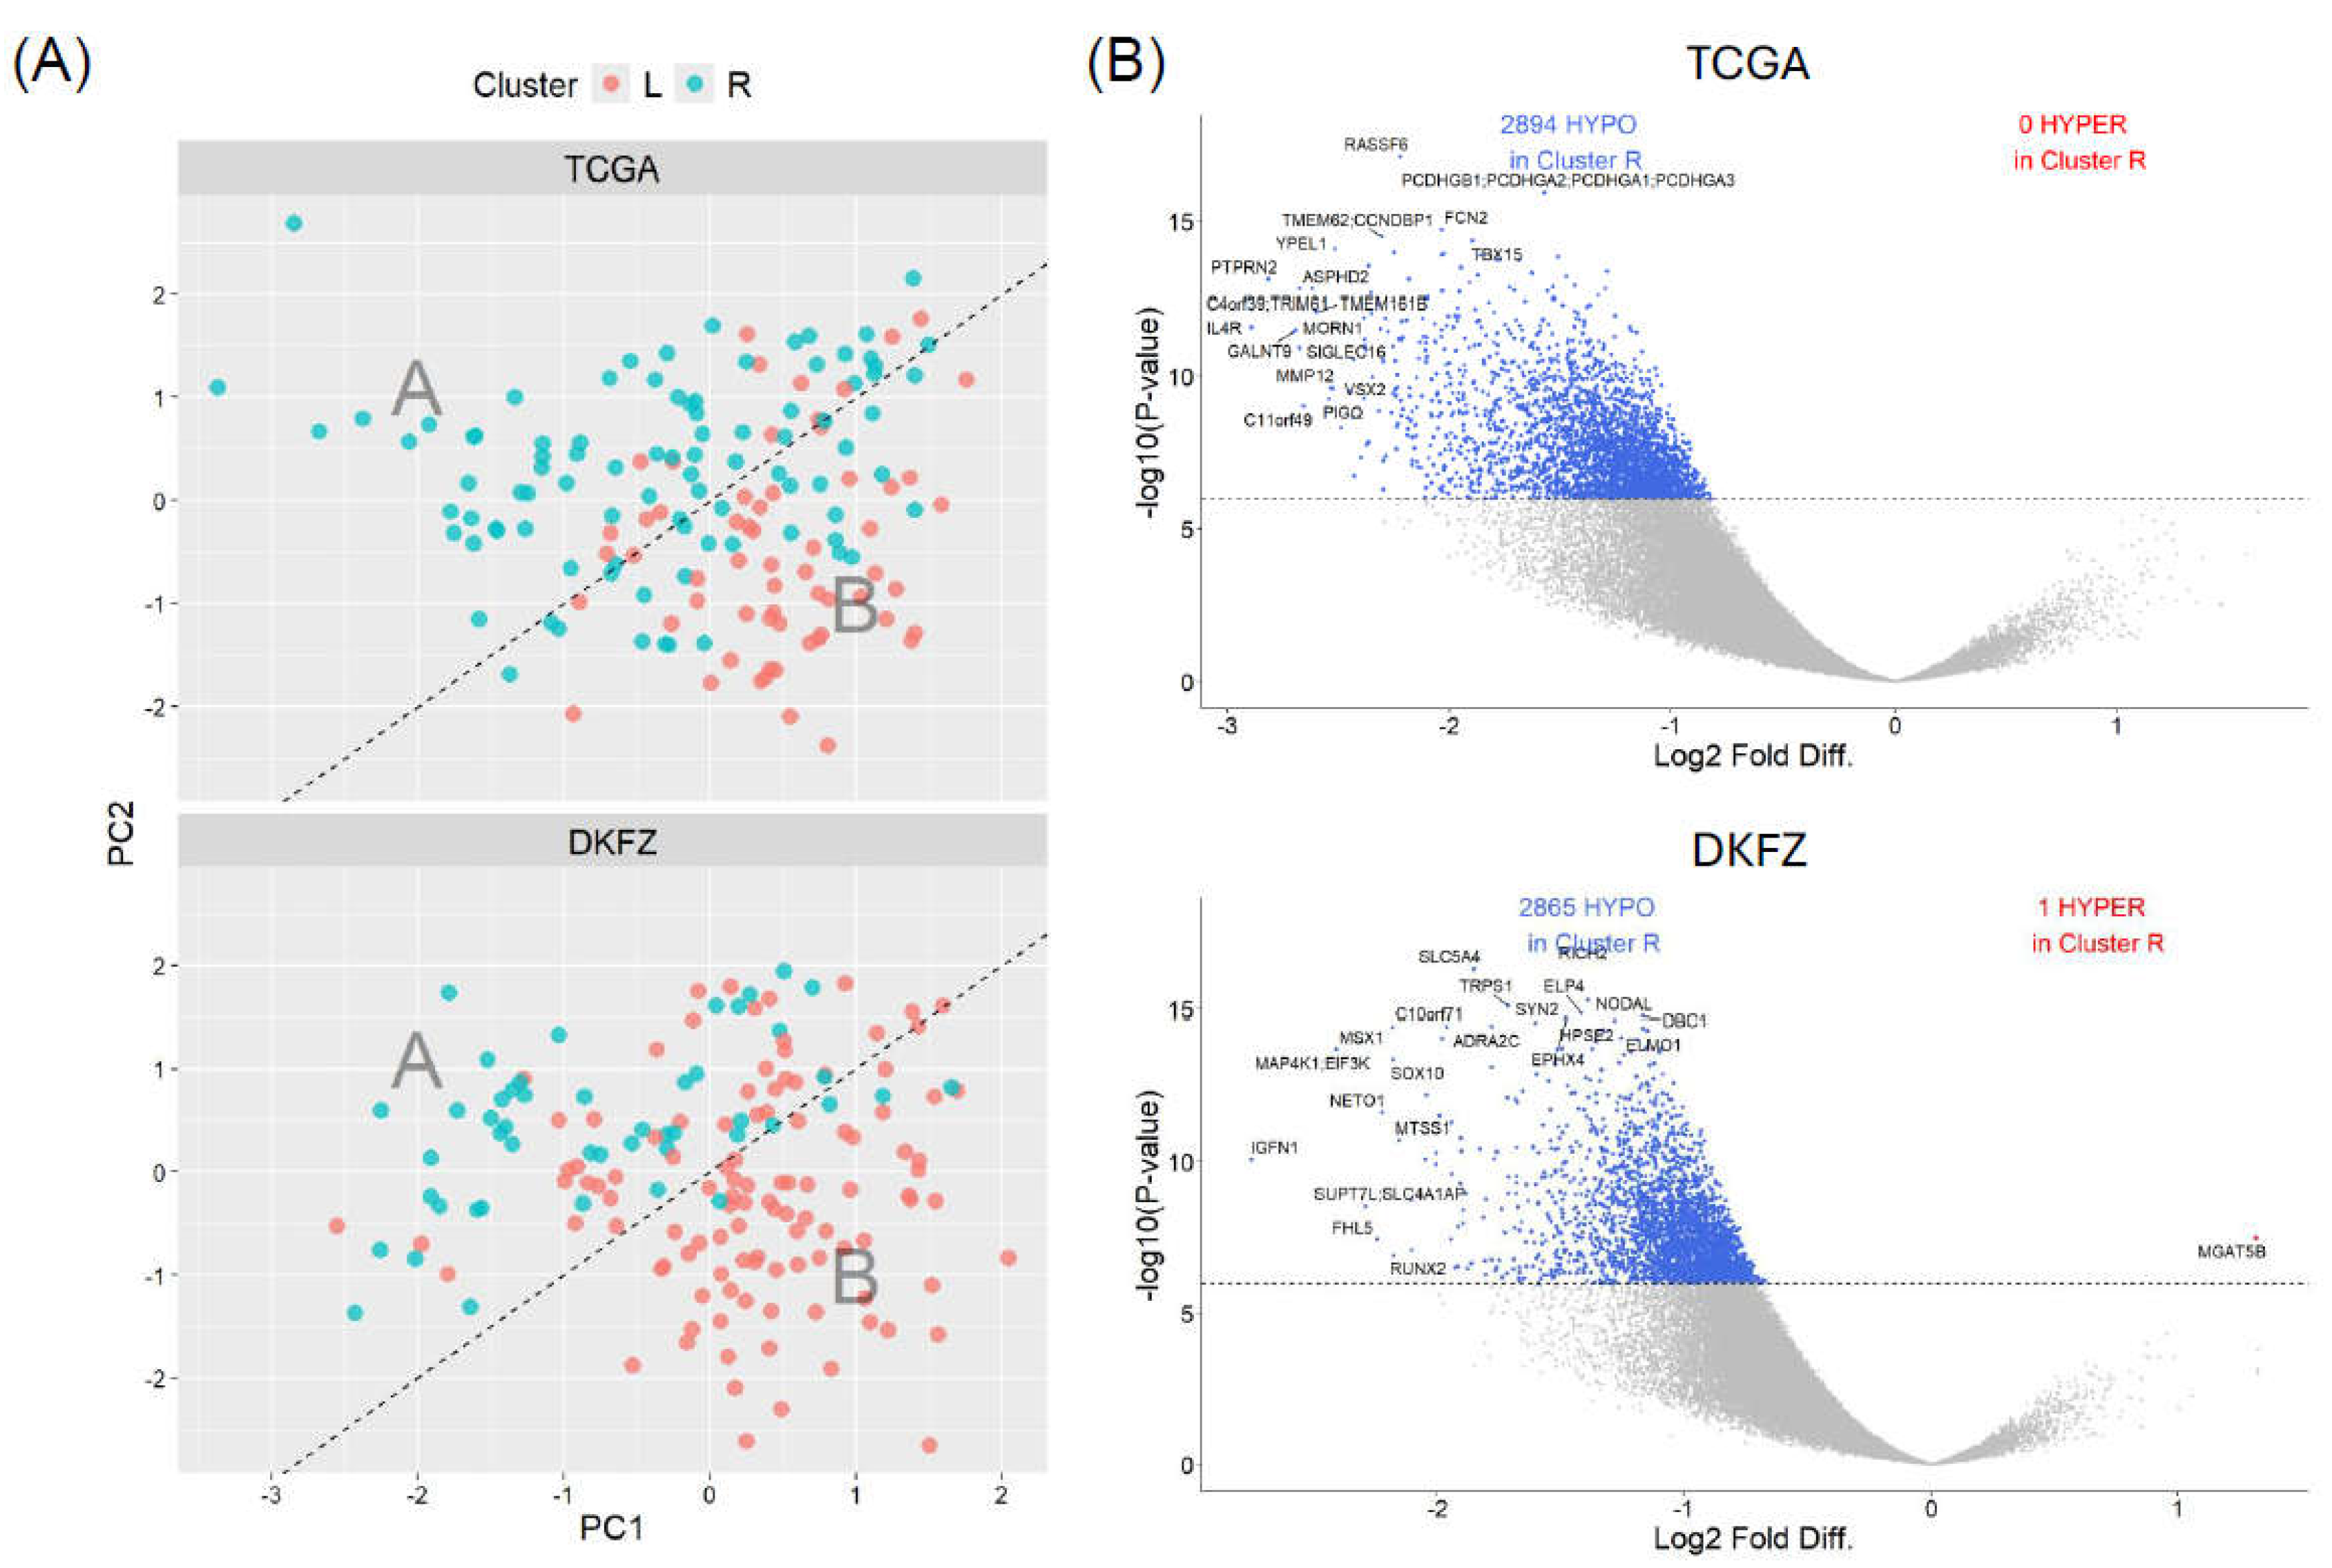
Figure 4.
Kaplan-Meier plots comparing overall survival over 60 months between the SREBF1 clusters.
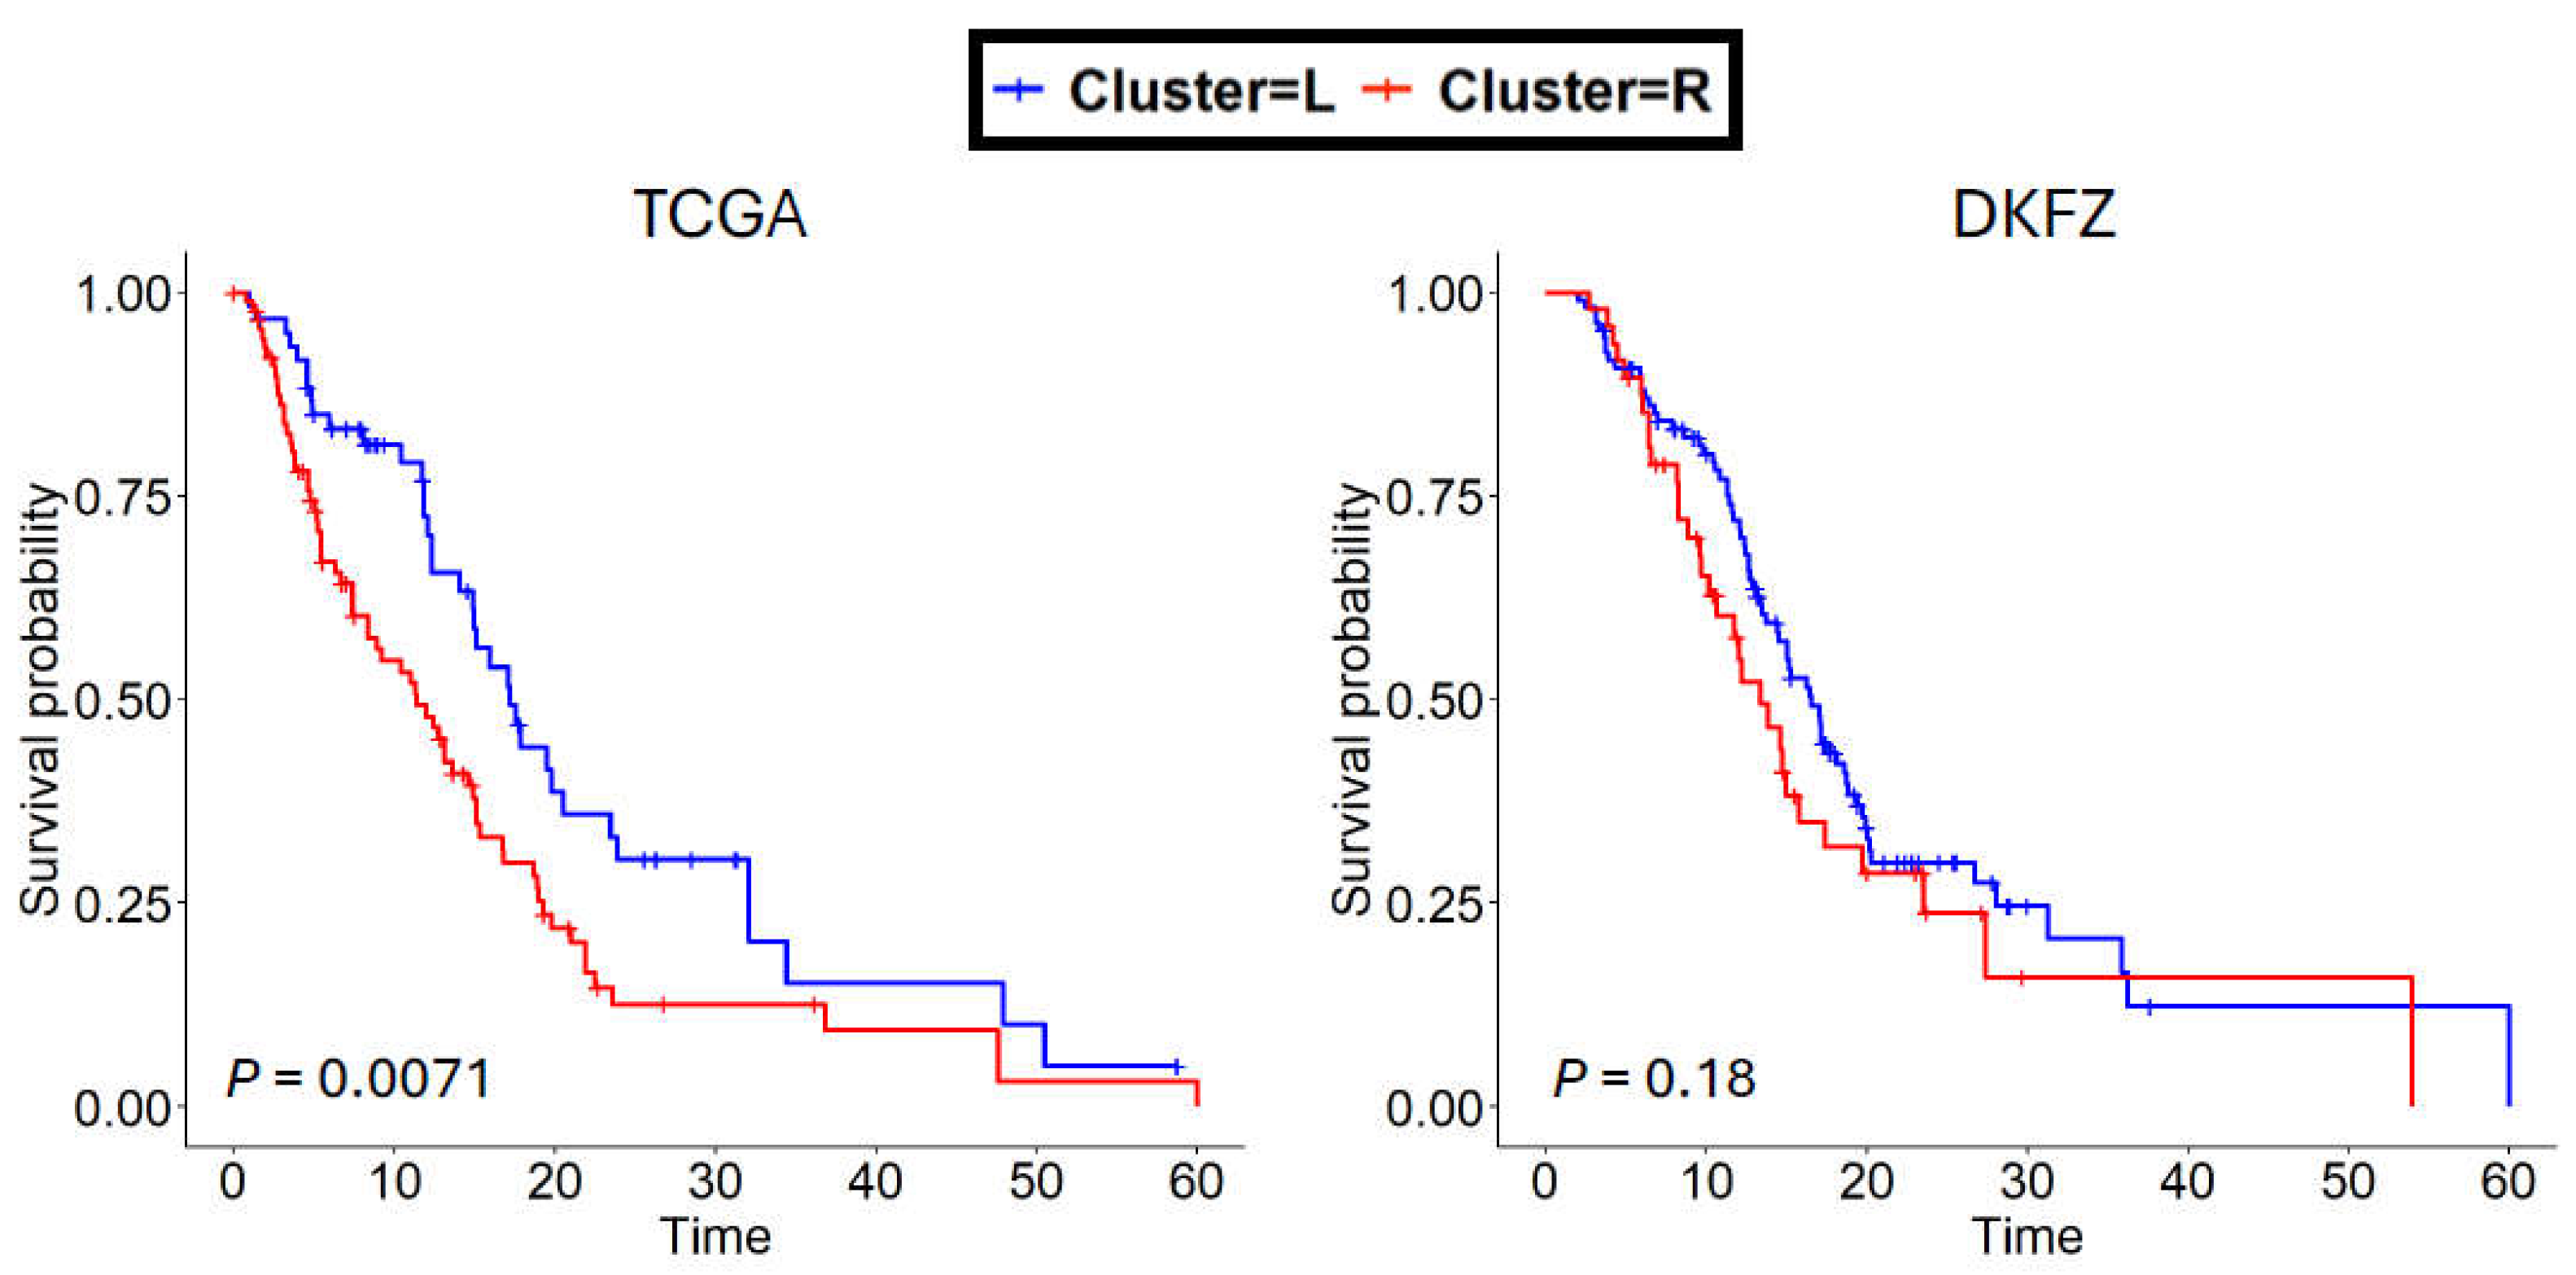

Table 1.
Clinical characteristics across the SREBF1 methylation clusters in TCGA and DKFZ cohorts.P-values were calculated by a two-sided Welch’s t-test and Fisher’s exact test for any continuous and discrete variables, respectively.
Table 1.
Clinical characteristics across the SREBF1 methylation clusters in TCGA and DKFZ cohorts.P-values were calculated by a two-sided Welch’s t-test and Fisher’s exact test for any continuous and discrete variables, respectively.
| SREBF1 Cluster | |||
| L | R | P-value | |
| TCGA | |||
| n (%) | 61 (39.87) | 92 (60.13) | - |
| Age (mean (s.d.)) | 57.07 (12.48) | 61.01 (12.76) | 0.062 |
| Sex (%) | |||
| Male | 41 (67.2) | 47 (52.2) | 0.096 |
| Female | 20 (32.8) | 43 (47.8) | |
| MGMT subtype (%) | |||
| Unmethylated | 34 (55.7) | 54 (58.7) | 0.85 |
| Methylated | 27 (44.3) | 38 (41.3) | |
| DKFZ | |||
| n (%) | 109 (69.43) | 48 (30.57) | - |
| Age (mean (s.d.)) | 63.06 (10.91) | 59.64 (13.35) | 0.094 |
| Sex (%) | |||
| Male | 64 (58.7) | 20 (41.7) | 0.072 |
| Female | 45 (41.3) | 28 (58.3) | |
| MGMT subtype (%) | |||
| Unmethylated | 50 (45.9) | 29 (60.4) | 0.13 |
| Methylated | 59 (54.1) | 19 (39.6) | |
Table 2.
Significant Gene Ontology (GO) and Kyoto Encyclopedia of Genes and Genomes (KEGG) terms associated with hypo-methylated genes detected in both TCGA and DKFZ cohorts.
Table 2.
Significant Gene Ontology (GO) and Kyoto Encyclopedia of Genes and Genomes (KEGG) terms associated with hypo-methylated genes detected in both TCGA and DKFZ cohorts.
| Term Identifier | Term Description | Total | Observed | Expected | Enrichment Ratio | Raw P | Bonferroni P |
| GO Biological Processes | |||||||
| GO:0010975 | Regulation of neuron projection development | 313 | 56 | 24.4 | 2.30 | 2.10E-09 | 1.76E-06 |
| GO:0007409 | Axonogenesis | 330 | 52 | 25.7 | 2.02 | 5.81E-07 | 4.88E-04 |
| GO:0031346 | Positive regulation of cell projection organization | 238 | 40 | 18.5 | 2.16 | 2.38E-06 | 2.00E-03 |
| GO:0031345 | Negative regulation of cell projection organization | 127 | 26 | 9.9 | 2.63 | 3.85E-06 | 3.23E-03 |
| GO:0050808 | Synapse organization | 332 | 49 | 25.8 | 1.90 | 8.28E-06 | 6.95E-03 |
| GO:0051960 | Regulation of nervous system development | 324 | 48 | 25.2 | 1.90 | 9.25E-06 | 7.76E-03 |
| GO:0016358 | Dendrite development | 162 | 29 | 12.6 | 2.30 | 1.73E-05 | 1.45E-02 |
| GO:0060560 | Developmental growth involved in morphogenesis | 180 | 31 | 14.0 | 2.21 | 1.99E-05 | 1.67E-02 |
| GO:0106027 | Neuron projection organization | 59 | 15 | 4.6 | 3.27 | 3.13E-05 | 2.63E-02 |
| GO Molecular Functions | |||||||
| GO:0060589 | Nucleoside-triphosphatase regulator activity | 282 | 46 | 22.7 | 2.03 | 2.39E-06 | 6.63E-04 |
| GO:0015631 | Tubulin binding | 215 | 36 | 17.3 | 2.08 | 1.70E-05 | 4.70E-03 |
| GO:0048156 | tau protein binding | 26 | 10 | 2.1 | 4.78 | 1.73E-05 | 4.78E-03 |
| GO Cellular Components | |||||||
| GO:0098984 | Neuron to neuron synapse | 238 | 40 | 20.2 | 1.98 | 1.69E-05 | 3.20E-03 |
| GO:0099572 | Postsynaptic specialization | 223 | 38 | 18.9 | 2.01 | 2.00E-05 | 3.79E-03 |
| GO:0098978 | Glutamatergic synapse | 280 | 44 | 23.8 | 1.85 | 3.60E-05 | 6.81E-03 |
| KEGG Pathways | |||||||
| hsa04919 | Thyroid hormone signaling pathway | 81 | 19 | 6.3 | 3.02 | 9.11E-06 | 3.14E-03 |
| hsa04360 | Axon guidance | 139 | 26 | 10.8 | 2.40 | 1.82E-05 | 6.28E-03 |
| hsa04725 | Cholinergic synapse | 87 | 18 | 6.8 | 2.66 | 9.40E-05 | 0.032 |
Table 3.
Cox proportional hazard regression for multivariate adjusted 5-year overall survival. *P < 0.05, ** P < 0.01, *** P < 0.001.
Table 3.
Cox proportional hazard regression for multivariate adjusted 5-year overall survival. *P < 0.05, ** P < 0.01, *** P < 0.001.
| HR | 95% CI, lower | 95% CI, upper | P-value | |
| TCGA | ||||
| Age in years | 1.05 | 1.03 | 1.07 | ***4.76e-7 |
| Sex | ||||
| Male | 1.00 (reference) | |||
| Female | 0.53 | 0.33 | 0.83 | **5.98e-3 |
| MGMT subtype | ||||
| Unmethylated | 1.00 (reference) | |||
| Methylated | 0.86 | 0.56 | 1.30 | 0.46 |
| Cluster | ||||
| L | 1.00 (reference) | |||
| R | 1.69 | 1.11 | 2.57 | *0.015 |
| DKFZ | ||||
| Age in years | 1.03 | 1.01 | 1.05 | **1.86e-3 |
| Sex | ||||
| Male | 1.00 (reference) | |||
| Female | 1.13 | 0.76 | 1.67 | 0.54 |
| MGMT subtype | ||||
| Unmethylated | 1.00 (reference) | |||
| Methylated | 0.48 | 0.32 | 0.72 | ***4.57e-4 |
| Cluster | ||||
| L | 1.00 (reference) | |||
| R | 1.25 | 0.81 | 1.92 | 0.31 |
Disclaimer/Publisher’s Note: The statements, opinions and data contained in all publications are solely those of the individual author(s) and contributor(s) and not of MDPI and/or the editor(s). MDPI and/or the editor(s) disclaim responsibility for any injury to people or property resulting from any ideas, methods, instructions or products referred to in the content. |
© 2025 by the authors. Licensee MDPI, Basel, Switzerland. This article is an open access article distributed under the terms and conditions of the Creative Commons Attribution (CC BY) license (http://creativecommons.org/licenses/by/4.0/).
Copyright: This open access article is published under a Creative Commons CC BY 4.0 license, which permit the free download, distribution, and reuse, provided that the author and preprint are cited in any reuse.


