
Submitted:
08 June 2025
Posted:
09 June 2025
You are already at the latest version
Abstract
Glioblastoma is an aggressive brain tumor that invariably recurs despite treatment, partly due to metabolic adaptations, including altered lipid metabolism. This study investigates plasma lipidomic profiles in glioblastoma patients to explore their potential as a liquid biopsy for disease monitoring. Plasma samples were collected from 36 patients with histopathologically-confirmed IDH wild-type glioblastoma at four treatment stages: Pre-Surgery (n=36), Post-Surgery (n=32), Pre-Radiation (n=28), and Post-Radiation (n=17). Untargeted lipidomics analysis was performed using liquid chromatography-high resolution mass spectrometry (LC-HR-MS/MS. Plasma lipidomic signatures differed significantly across treatment stages. Specifically, the lipidomic profile prior to surgery was distinct from those at subsequent stages, demonstrating increased compound abundance of numerous lipids prior to surgery that are decreased at subsequent stages, including linolenic acid (fold change 2.58, p=4.21x10⁻¹¹), behenic acid (fold change 2.09, p=9.3x10⁻¹⁰), and linolenic acid (fold change 4.44, p=5.83x10⁻⁶). Random Forest modeling could predict pre-surgical samples with 85.7% accuracy. Plasma lipidomics shows promise as a liquid biopsy approach for monitoring glioblastoma treatment. The distinct lipidomic profile observed prior to surgery suggests potential for early detection.
Keywords:
plasma lipidomics
; glioblastoma
; liquid biopsy
; tumor metabolism
; machine learning
1. Introduction
Glioblastoma is an aggressive and lethal primary brain tumor. Despite aggressive treatment strategies involving surgery, radiation, and chemotherapy, glioblastoma invariably recurs [1]. A key factor contributing to recurrence is the ability of surviving tumor cells to acquire new mutations that allow them to adapt and proliferate, often involving alterations in cellular metabolism [2]. Examination of the metabolic changes occurring within tumors is an area of avid interest; however, little is known about the metabolic changes experienced systemically in patients with glioblastoma. Small retrospective studies have demonstrated an association between metabolic risk factors and survival outcomes [3,4,5,6], which suggest that gaining a deeper understanding of systemic metabolism may give insights for patient management and potentially improved outcomes.
Clinical management of patients with glioblastoma is hindered by diagnostic limitations of current approaches. Neuroimaging with magnetic resonance imaging (MRI) is the primary modality used to track the tumor’s response to treatment [1]. However, MRI is often unable to distinguish true tumor progression from pseudoprogression—reactive changes that are due to radiation-associated necrosis [1]. As such, there is intense research interest in the development of alternative biomarkers to assess tumor progression [7]. A main approach has been to develop “liquid biopsies” that evaluate the cerebrospinal fluid or blood of patients to identify molecular biomarkers of the tumor [7]. Another approach is evaluating cell-free DNA released by cancer cells [8]. A few promising studies have examined blood plasma metabolomics [9,10,11,12,13,14,15,16,17,18,19]. However, a comprehensive evaluation of plasma lipidomics is lacking. Examination of the plasma lipid profile may hold promise as glioblastoma has been found to be lipid rich [20], and these lipids may leak across the blood brain barrier and be detected in the blood [21].
Here we utilize plasma lipidomics to evaluate the signature of lipids in the blood of patients with glioblastoma with hopes of both developing a sensitive liquid biopsy approach, as well as gleaning biologic insights into systemic lipid metabolism in these patients. We also utilize a machine learning model to enhance the predictive accuracy of this diagnostic approach.
2. Materials and Methods
2.1. Patient Selection and Sample Collection
The study included 36 patients with IDH wild-type glioblastoma WHO grade 4, confirmed with both histopathologic and molecular testing. All patients underwent standard of care treatment with the Stupp protocol [22]. Blood samples were collected at four treatment stage time points: Pre-Surgery, Post-Surgery, Pre-Radiation, and Post-Radiation. Some samples were unable to be collected due to practical patient care issues; those that were collected are designated by an “X” in Table 1. The samples were spun down and the plasma component was saved for future lipidomic analysis.
2.2. Lipidomics Analysis
Untargeted plasma lipidomics was performed using liquid chromatography-high resolution mass spectrometry (LC-HR-MS/MS) at the UC Davis West Coast Metabolomics Center. Detailed sample preparation and metabolomics analysis methods were previously published[23]. A total of 468 lipid metabolites were measured for each patient at each time point.
2.3. Statistical Analysis
MetaboAnalyst 6.0 was utilized for the metabolomics work flow. Unpaired t-tests were used to compare metabolite compound abundances between different time points. Volcano plots were generated to display p-values and metabolite level fold changes. Partial least squares discriminant analysis (PLS-DA) was performed on the entire dataset. Graphs of the first and second principal components were generated to visualize lipidomics signature relationships between treatment time points. Heatmaps were used to evaluate the top 25 lipids that best represent the dataset's variance. Variable importance in projection (VIP) scores were determined of the top 15 lipids that explain most of the variance of the datasets. Volcano plots employed a fold change threshold of greater than 2 and a p-value threshold based on a false discover rate of less than 0.05. Bar graphs displaying the mean and standard error of the mean are presented for the most significantly altered lipids; these were generated using GraphPad Prism version 10. Unpaired T tests were performed and statistical significance was determined as follows: * p < 0.05; **** p < 0.0001.
2.4. Machine Learning
A Random Forest model was used for machine learning examination of the lipidomic profiles of different treatment stages. MetaboAnalyst 6.0 was used to perform the analysis with 500 trees guiding the group discrimination. Out-of-bag error was reported to assess the model's accuracy in predicting treatment stages.
3. Results
3.1. Plasma Lipidomic Signatures Differ by Treatment Stage
Examination of the plasma lipidomic profiles of patients with glioblastoma across the four treatment stages demonstrated distinct lipidomic signatures, particularly in the Pre-Surgery samples. Hierarchical clustering was performed evaluating the top 25 lipids that best represented the variance of the broader dataset. This demonstrates increased levels of numerous lipids prior to surgery that are reduced at subsequent treatment stages, resulting in a clear separation between the Pre-Surgery samples compared to the other samples (Figure 1A). The variable importance in projection (VIP) scores of the top 15 lipids that best explain the group differences are depicted in Figure 1B. Partial least squares-discriminant analysis (PLS-DA) was performed examining the variance of the lipids across the entire dataset from all treatment stages, and this demonstrated a similar result with clear separation of the Pre-Surgery samples from other samples (Figure 1C).
3.2. Surgery But Not Chemoradiation Alters the Plasma Lipidome
The lipidomic profile was next specifically compared between the Pre-Surgery and Post-Surgery treatment stages. Hierarchical clustering demonstrates clear separation of the Pre-Surgery samples from the Post-Surgery samples, when evaluating the variance driven by the top 25 lipids (Figure 2A). Numerous lipids were found to have increased abundance Pre-Surgery compared to Post-Surgery, while only one lipid (CE 22:6) was found to have lower abundance prior to surgery (Table 2). The volcano plot depicts the significant lipids with the fold change threshold drawn at 2 and the p-value threshold less than 0.1 (Figure 2B). PLS-DA again demonstrates that the Pre-Surgery samples separate significantly from the Post-Surgery samples when examining the first and second principal components (Figure 2C). VIP scores of the top 15 lipids that best explain the group differences are depicted, with linoleic acid having the largest score (Figure 2D).
Concurrent chemoradiation was not associated with any significant alterations in the plasma lipidomic signature. Hierarchical clustering demonstrates some separation in the lipidomic signatures of Pre-Radiation vs Post-Radiation; however, this effect is less robust compared to the results seen with surgery (Figure 3A). As depicted in the Volcano plot, no lipids met both the fold-change and p-value thresholds when correcting for a false-discovery rate of 0.05 (Figure 3B). PLS-DA again demonstrated partial separation of the groups, though this effect is less robust compared to the results seen with surgery (Figure 3C). VIP scores of the 15 lipids that best explained group differences are depicted in Figure 3D.
An important observation is that the lipids that were found to have decreased abundance following surgery, remained at a low abundance during the later treatment stages of Pre-Radiation and Post-Radiation. The five lipids that had the most significant decrease following surgery are quantified below in bar graphs, including linoleic acid, TG 54:6, TG 54:5 isomer A, oleic acid, and TG 54:5 (Figure 4).
3.3. Random Forest Model Enables Predictive Sample Classification
The Random Forest machine learning model was employed to examine whether the lipidomic signatures generated from each treatment stage could be employed as predictive tools that could aid in diagnostics. Impressively, the Pre-Surgery samples could be identified with a low class error rate of 0.143, corresponding to an accuracy of 85.7% (Figure 5).
4. Discussion
Results presented in this study demonstrate that plasma lipidomic profiles are significantly altered across different treatment stages in glioblastoma patients. The most impressive change was seen following surgery, wherein numerous lipids were found to have higher abundance in the Pre-Surgery samples compared to Post-Surgery. In fact, as shown in Figure 1C, the Pre-Surgery samples appear to have a unique signature compared to the other three treatment stages. Additionally, results of the Random Forest classification demonstrate that the Pre-Surgery samples can be predicted with a low class error rate—suggesting high accuracy.
There are two main novel implications of this work. The first promising aspect is that these results demonstrate that lipidomics has merit as a diagnostic tool that can be employed as a liquid biopsy for patients with glioblastoma. Results of this study demonstrate that we can accurately predict patient groups based on their lipidomic signatures. There are multiple limitations of this work, however, that will need to be addressed in future studies. First, as a pilot study, the sample size was limited, so future studies will employ much larger cohorts of patients. These findings are limited to changes seen within patients with glioblastoma at different treatment stages; healthy controls are needed to examine whether this approach holds merit as a diagnostic of tumor presence. Lastly, the Random Forest classification approach suffers from an overfitting bias. However, results of this work can be used to test on future datasets.
The second novel finding may allow for speculation regarding the tumor’s biology. Results here demonstrate a broad elevation in numerous lipids in the plasma of patients with glioblastoma prior to surgery, including triglycerides (TG), phosphatidylethanolamines (PE), phosphatidylcholines (PC), lysophosphatidylethanolamines (LPE), free fatty acids (FA), and diglycerides (DG). These broad increases may result from leakage of lipids from the tumor, given that these tumors have impaired fatty acid oxidation which results in lipid accumulation [20]. On the other hand, this lipid accumulation may represent systemic metabolic dysregulation that has been found in patients with glioblastoma [3]. Elevated levels of the lipids linoleic acid and linolenic acid prior to surgery may be associated with eicosanoids and inflammatory mediators that are suspected of being overexpressed in gliomas [24] Interestingly there was lower levels of docosahexaenoate (CE 22:6) in the plasma prior to surgery. CE 22:6 is a critical fatty acid known for its roles in maintaining neuronal functions [25].
Future studies will examine this question by performing correlative analyses with the lipidomic profiles of the same patient’s tumor itself. We also plan to examine healthy controls for comparison, as well as examining the lipidomic profile of patients at the time of tumor recurrence—there would be expected to be increased lipid abundance at that time. If we can demonstrate that this plasma lipidomic signature is indeed originating from lipids shed by the tumor, this may allow for indirect examination of glioblastoma metabolism, particularly in response to treatment and experimental therapeutics.
5. Conclusions
Plasma lipidomic profiles are dynamically altered throughout the treatment course of glioblastoma patients, with the pre-surgical state exhibiting a particularly distinct signature characterized by elevated levels of numerous lipids. The ability of Random Forest modeling to accurately classify pre-surgical samples underscores the potential of plasma lipidomics as a non-invasive liquid biopsy tool for disease monitoring and potentially early detection. While future studies with larger, multi-center cohorts and the inclusion of healthy controls are essential to validate these findings and address limitations such as potential overfitting, the observed changes in circulating lipids following surgical resection suggest a potential link between the tumor and systemic lipid metabolism. Further investigation into the specific lipids identified and their correlation with tumor tissue lipid profiles holds promise for elucidating the metabolic interplay between the tumor and the host, potentially revealing novel biomarkers for disease progression and therapeutic response in this challenging malignancy.
Author Contributions
Conceptualization, O.A., O.B., and O.F..; methodology, J.P.A., O.A., O.F., L.D., and R.H..; data curation, J.P.A.; writing—original draft preparation, J.P.A.; writing—review and editing, J.P.A., Y.L., O.F., L.D., R.F., H.S.L., J.R., R.H., O.B., and O.A. visualization, J.P.A.; supervision, O.A.; funding acquisition, O.A. All authors have read and agreed to the published version of the manuscript.
Funding
Aboud is supported in part by the UC Davis Paul Calabresi Career Development Award for Clinical Oncology as funded by the National Cancer Institute, National Institutes of Health through grant #2K12CA138464-11.
Institutional Review Board Statement
This project was reviewed by the Institutional Review Board of the University of California, Davis, and granted 2019 Protocol # UCD 1412052.
Informed Consent Statement
Consent was waived with approval by the Institutional Review Board due to this being a retrospective review of deidentified data available in the electronic medical record.
Data Availability Statement
All data can be made available upon request.
Acknowledgments
The authors would like to thank Robert O’Donnell for his critical review of this manuscript.
Conflicts of Interest
The authors declare no conflicts of interest.
References
- Wen, P.Y.; Weller, M.; Lee, E.Q.; Alexander, B.M.; Barnholtz-Sloan, J.S.; Barthel, F.P.; Batchelor, T.T.; Bindra, R.S.; Chang, S.M.; Chiocca, E.A.; et al. Glioblastoma in adults: a Society for Neuro-Oncology (SNO) and European Society of Neuro-Oncology (EANO) consensus review on current management and future directions. Neuro Oncol 2020, 22, 1073–1113. [Google Scholar] [CrossRef] [PubMed]
- Garcia, J.H.; Jain, S.; Aghi, M.K. Metabolic Drivers of Invasion in Glioblastoma. Front Cell Dev Biol 2021, 9, 683276. [Google Scholar] [CrossRef] [PubMed]
- Aboubechara, J.P.; Aboud, O. Metabolic Risk Factors and Survival in Patients with Glioblastoma. Cancers (Basel) 2024, 16. [Google Scholar] [CrossRef]
- Lucas, D.; Carvalho, B.; Tuna, R.; Linhares, P. Metabolic Syndrome and Survival in Glioblastoma Patients: Retrospective Cohort Study and Review of the Literature. Cureus 2024, 16, e53641. [Google Scholar] [CrossRef] [PubMed]
- McManus, E.J.; Frampton, C.; Tan, A.; Phillips, M.C.L. Metabolics risk factors in a New Zealand glioblastoma cohort. Neurooncol Pract 2022, 9, 43–49. [Google Scholar] [CrossRef]
- Rogers, L.R.; Ostrom, Q.T.; Schroer, J.; Vengoechea, J.; Li, L.; Gerson, S.; Nock, C.J.; Machtay, M.; Selman, W.; Lo, S.; et al. Association of metabolic syndrome with glioblastoma: a retrospective cohort study and review. Neurooncol Pract 2020, 7, 541–548. [Google Scholar] [CrossRef]
- Soffietti, R.; Bettegowda, C.; Mellinghoff, I.K.; Warren, K.E.; Ahluwalia, M.S.; De Groot, J.F.; Galanis, E.; Gilbert, M.R.; Jaeckle, K.A.; Le Rhun, E.; et al. Liquid biopsy in gliomas: A RANO review and proposals for clinical applications. Neuro Oncol 2022, 24, 855–871. [Google Scholar] [CrossRef]
- Mair, R.; Mouliere, F. Cell-free DNA technologies for the analysis of brain cancer. Br J Cancer 2022, 126, 371–378. [Google Scholar] [CrossRef]
- Ferrasi, A.C.; Puttini, R.; Galvani, A.F.; Hamamoto Filho, P.T.; Delafiori, J.; Argente, V.D.; de Oliveira, A.N.; Dias-Audibert, F.L.; Catharino, R.R.; Silva, O.C.; et al. Metabolomics Approach Reveals Important Glioblastoma Plasma Biomarkers for Tumor Biology. Int J Mol Sci 2023, 24. [Google Scholar] [CrossRef]
- Liu, Y.A.; Aboud, O.; Dahabiyeh, L.A.; Bloch, O.; Fiehn, O. Metabolomic characterization of human glioblastomas and patient plasma: a pilot study. F1000Res 2024, 13, 98. [Google Scholar] [CrossRef]
- Fontanilles, M.; Heisbourg, J.D.; Daban, A.; Di Fiore, F.; Pépin, L.F.; Marguet, F.; Langlois, O.; Alexandru, C.; Tennevet, I.; Ducatez, F.; et al. Metabolic remodeling in glioblastoma: a longitudinal multi-omics study. Acta Neuropathol Commun 2024, 12, 162. [Google Scholar] [CrossRef] [PubMed]
- Godlewski, A.; Mojsak, P.; Pienkowski, T.; Lyson, T.; Mariak, Z.; Reszec, J.; Kaminski, K.; Moniuszko, M.; Kretowski, A.; Ciborowski, M. Metabolomic profiling of plasma from glioma and meningioma patients based on two complementary mass spectrometry techniques. Metabolomics 2025, 21, 33. [Google Scholar] [CrossRef]
- Zhao, H.; Heimberger, A.B.; Lu, Z.; Wu, X.; Hodges, T.R.; Song, R.; Shen, J. Metabolomics profiling in plasma samples from glioma patients correlates with tumor phenotypes. Oncotarget 2016, 7, 20486–20495. [Google Scholar] [CrossRef] [PubMed]
- Divé, I.; Hahnefeld, L.; Wenger, K.J.; Kögel, D.; Steinbach, J.; Geisslinger, G.; Ronellenfitsch, M.W.; Tegeder, I. Plasma lipidomic and metabolomic profiles in high-grade glioma patients before and after 72-h presurgery water-only fasting. Mol Oncol 2025. [Google Scholar] [CrossRef] [PubMed]
- Zhou, J.; Ji, N.; Wang, G.; Zhang, Y.; Song, H.; Yuan, Y.; Yang, C.; Jin, Y.; Zhang, Z.; Zhang, L.; et al. Metabolic detection of malignant brain gliomas through plasma lipidomic analysis and support vector machine-based machine learning. EBioMedicine 2022, 81, 104097. [Google Scholar] [CrossRef]
- Muller Bark, J.; Karpe, A.V.; Doecke, J.D.; Leo, P.; Jeffree, R.L.; Chua, B.; Day, B.W.; Beale, D.J.; Punyadeera, C. A pilot study: Metabolic profiling of plasma and saliva samples from newly diagnosed glioblastoma patients. Cancer Med 2023, 12, 11427–11437. [Google Scholar] [CrossRef]
- Hodeify, R.; Yu, N.; Balasubramaniam, M.; Godinez, F.; Liu, Y.; Aboud, O. Metabolomic Profiling and Machine Learning Models for Tumor Classification in Patients with Recurrent IDH-Wild-Type Glioblastoma: A Prospective Study. Cancers (Basel) 2024, 16. [Google Scholar] [CrossRef]
- Aboud, O.; Liu, Y.; Dahabiyeh, L.; Abuaisheh, A.; Li, F.; Aboubechara, J.P.; Riess, J.; Bloch, O.; Hodeify, R.; Tagkopoulos, I.; et al. Profile Characterization of Biogenic Amines in Glioblastoma Patients Undergoing Standard-of-Care Treatment. Biomedicines 2023, 11. [Google Scholar] [CrossRef]
- Aboud, O.; Liu, Y.A.; Fiehn, O.; Brydges, C.; Fragoso, R.; Lee, H.S.; Riess, J.; Hodeify, R.; Bloch, O. Application of Machine Learning to Metabolomic Profile Characterization in Glioblastoma Patients Undergoing Concurrent Chemoradiation. Metabolites 2023, 13. [Google Scholar] [CrossRef]
- Maraqah, H.H.; Aboubechara, J.P.; Abu-Asab, M.S.; Lee, H.S.; Aboud, O. Excessive lipid production shapes glioma tumor microenvironment. Ultrastruct Pathol 2024, 48, 367–377. [Google Scholar] [CrossRef]
- Jain, R.K.; di Tomaso, E.; Duda, D.G.; Loeffler, J.S.; Sorensen, A.G.; Batchelor, T.T. Angiogenesis in brain tumours. Nat Rev Neurosci 2007, 8, 610–622. [Google Scholar] [CrossRef] [PubMed]
- Stupp, R.; Mason, W.P.; van den Bent, M.J.; Weller, M.; Fisher, B.; Taphoorn, M.J.; Belanger, K.; Brandes, A.A.; Marosi, C.; Bogdahn, U.; et al. Radiotherapy plus concomitant and adjuvant temozolomide for glioblastoma. N Engl J Med 2005, 352, 987–996. [Google Scholar] [CrossRef] [PubMed]
- Bishop, L.M.; Shen, T.; Fiehn, O. Improving Quantitative Accuracy in Nontargeted Lipidomics by Evaluating Adduct Formation. Anal Chem 2023, 95, 12683–12690. [Google Scholar] [CrossRef] [PubMed]
- Nathoo, N.; Barnett, G.H.; Golubic, M. The eicosanoid cascade: possible role in gliomas and meningiomas. J Clin Pathol 2004, 57, 6–13. [Google Scholar] [CrossRef]
- Kim, H.Y. Novel metabolism of docosahexaenoic acid in neural cells. J Biol Chem 2007, 282, 18661–18665. [Google Scholar] [CrossRef]
Figure 1.
The peripheral lipidomic signature of patients with glioblastoma prior to surgery is distinct from subsequent treatment stages. A) Hierarchical clustering of patient samples based on the 25 lipid metabolites that encapsulate most of the dataset’s variance demonstrates that Pre-Surgery samples have a distinct lipidomic profile. B) Variable importance in projection (VIP) scores of the 15 lipids that hold the largest contribution to the dataset’s variance. C) Partial least square discriminant analysis (PLS-DA) demonstrates that the Pre-Surgery samples separate from the other treatment stages when the first and second principal components are examined.
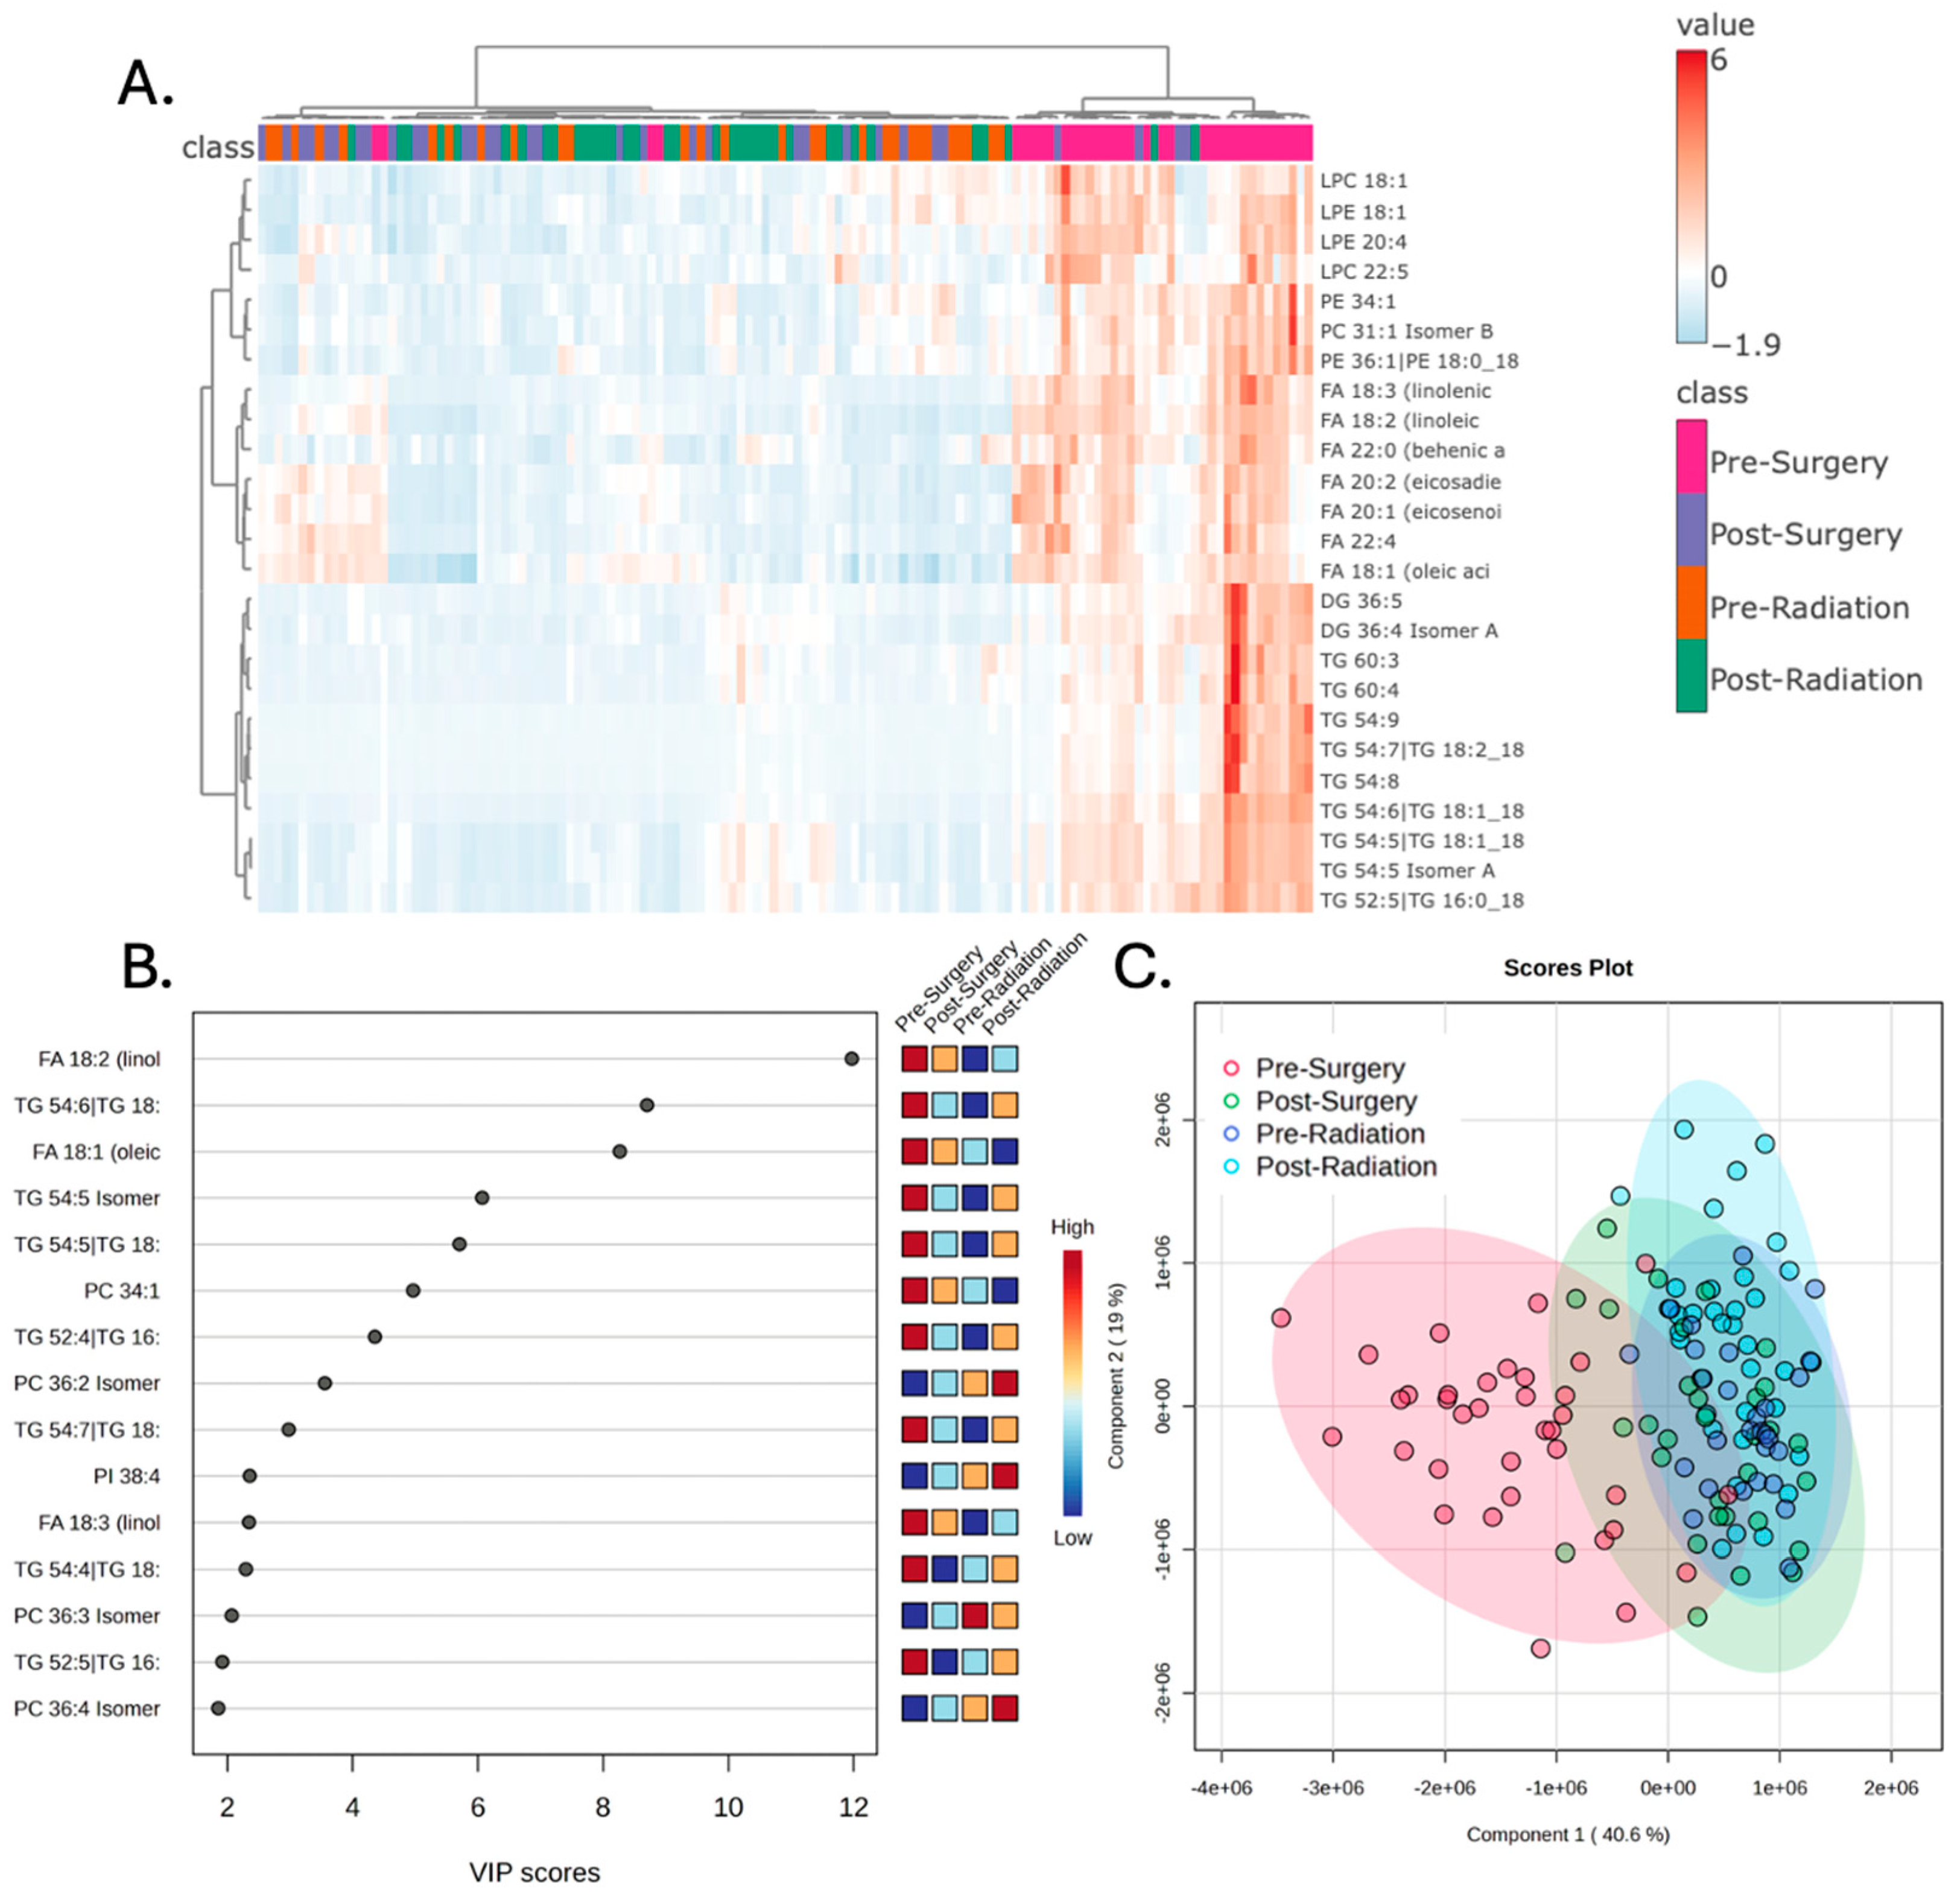
Figure 2.
Peripheral lipidomics of patients prior to surgery demonstrates increased abundance of lipids that are decreased following surgery. A) Hierarchical clustering of patient samples based on the 25 lipid metabolites that encapsulate most of the dataset’s variance demonstrates that Pre-Surgery samples have a distinct lipidomic profile compared to Post-Surgery. B) Volcano plot demonstrates numerous lipids that have increased compound abundance prior to surgery; significance drawn at fold change greater than 2 and p-values of less than 0.05 after correcting for a false discover rate of less than 0.05. C) Partial least square discriminant analysis (PLS-DA) demonstrates that the Pre-Surgery samples separate from Post-Surgery when the first and second principal components are examined. D) Variable importance in projection (VIP) scores of the 15 lipids that hold the largest contribution to the dataset’s variance.
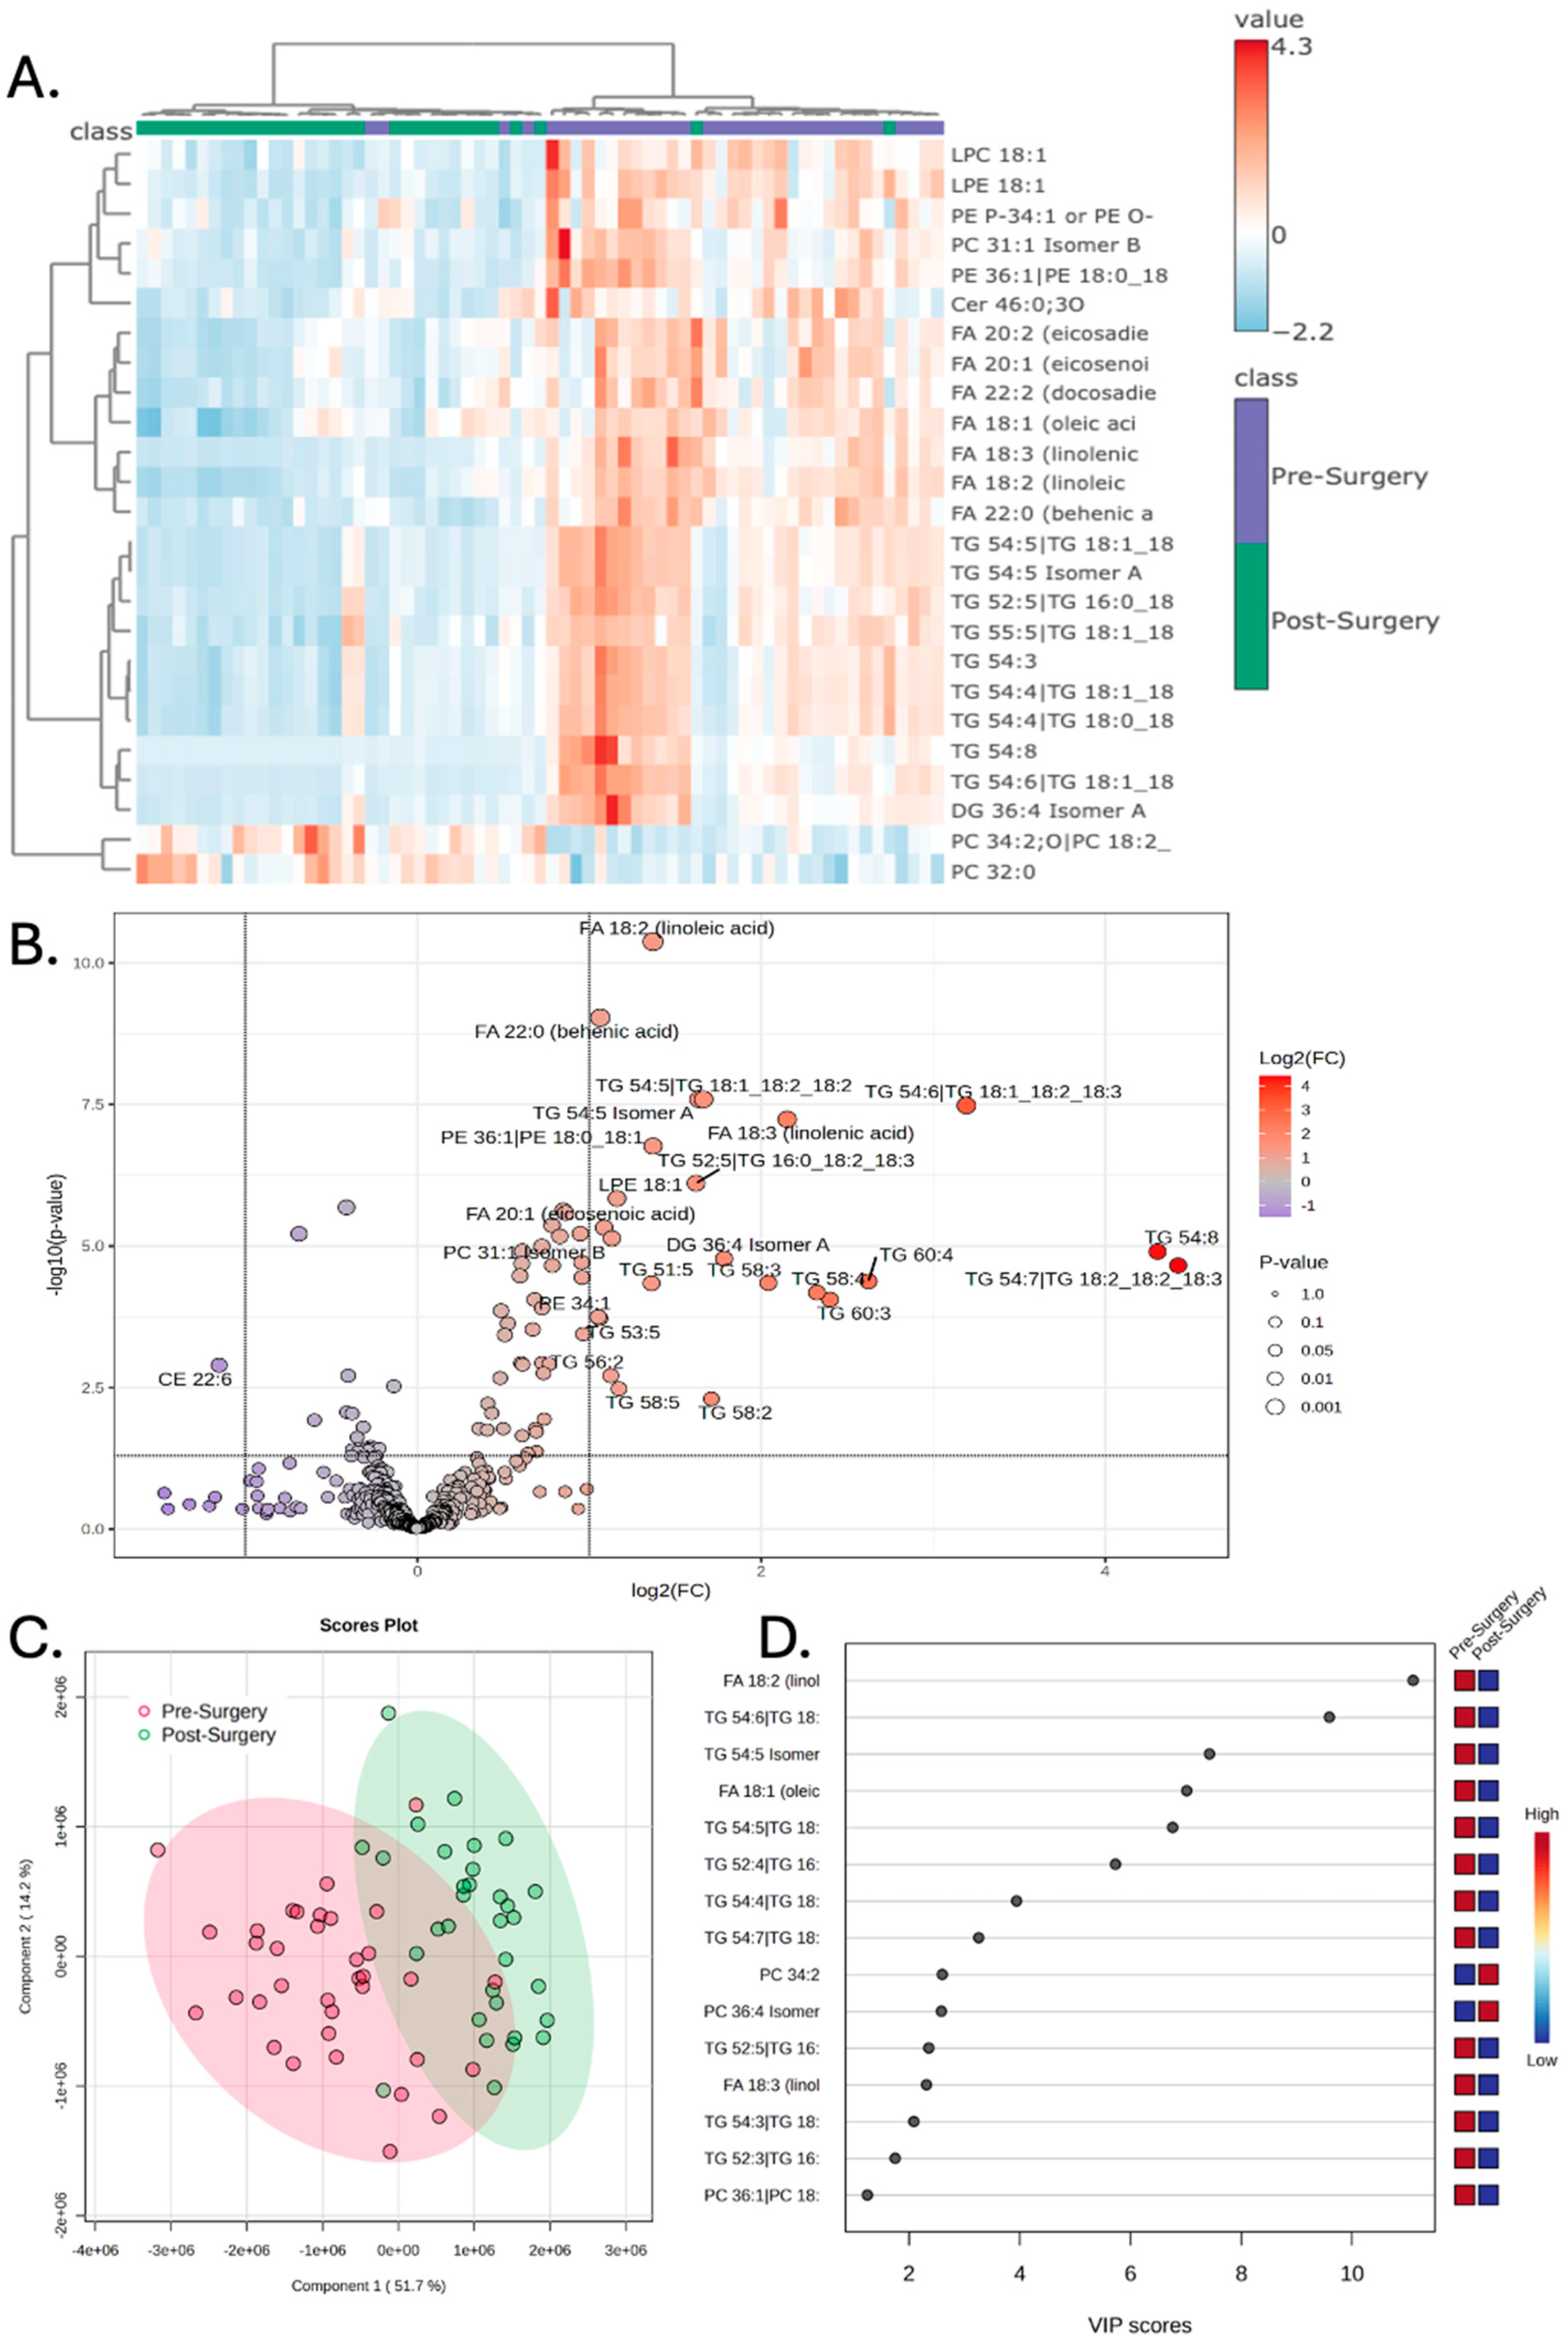
Figure 3.
Peripheral lipidomics of patients with glioblastoma changes with radiation though to a lesser extent compared to the change observed with surgery. A) Hierarchical clustering of patient samples based on the 25 lipid metabolites that encapsulate most of the dataset’s variance demonstrates that Pre-Radiation samples have a distinct lipidomic profile compared to Post-Surgery. B) Volcano plot demonstrates increased compound abundance of three lipids and decreased compound abundance of one lipid prior to radiation; significance drawn at fold change greater than 2 and p-value less than 0.05. C) Partial least square discriminant analysis (PLS-DA) demonstrates that the Pre-Radiation samples have poor separation from Post-Radiation when the first and second principal components are examined. D) Variable importance in projection (VIP) scores of the 15 lipids that hold the largest contribution to the dataset’s variance. E) Compound abundance of TG 40:0, TG 40:1, and TG 42:1 are decreased after radiation, while TG 49:1 is increased following radiation, * p < 0.05.
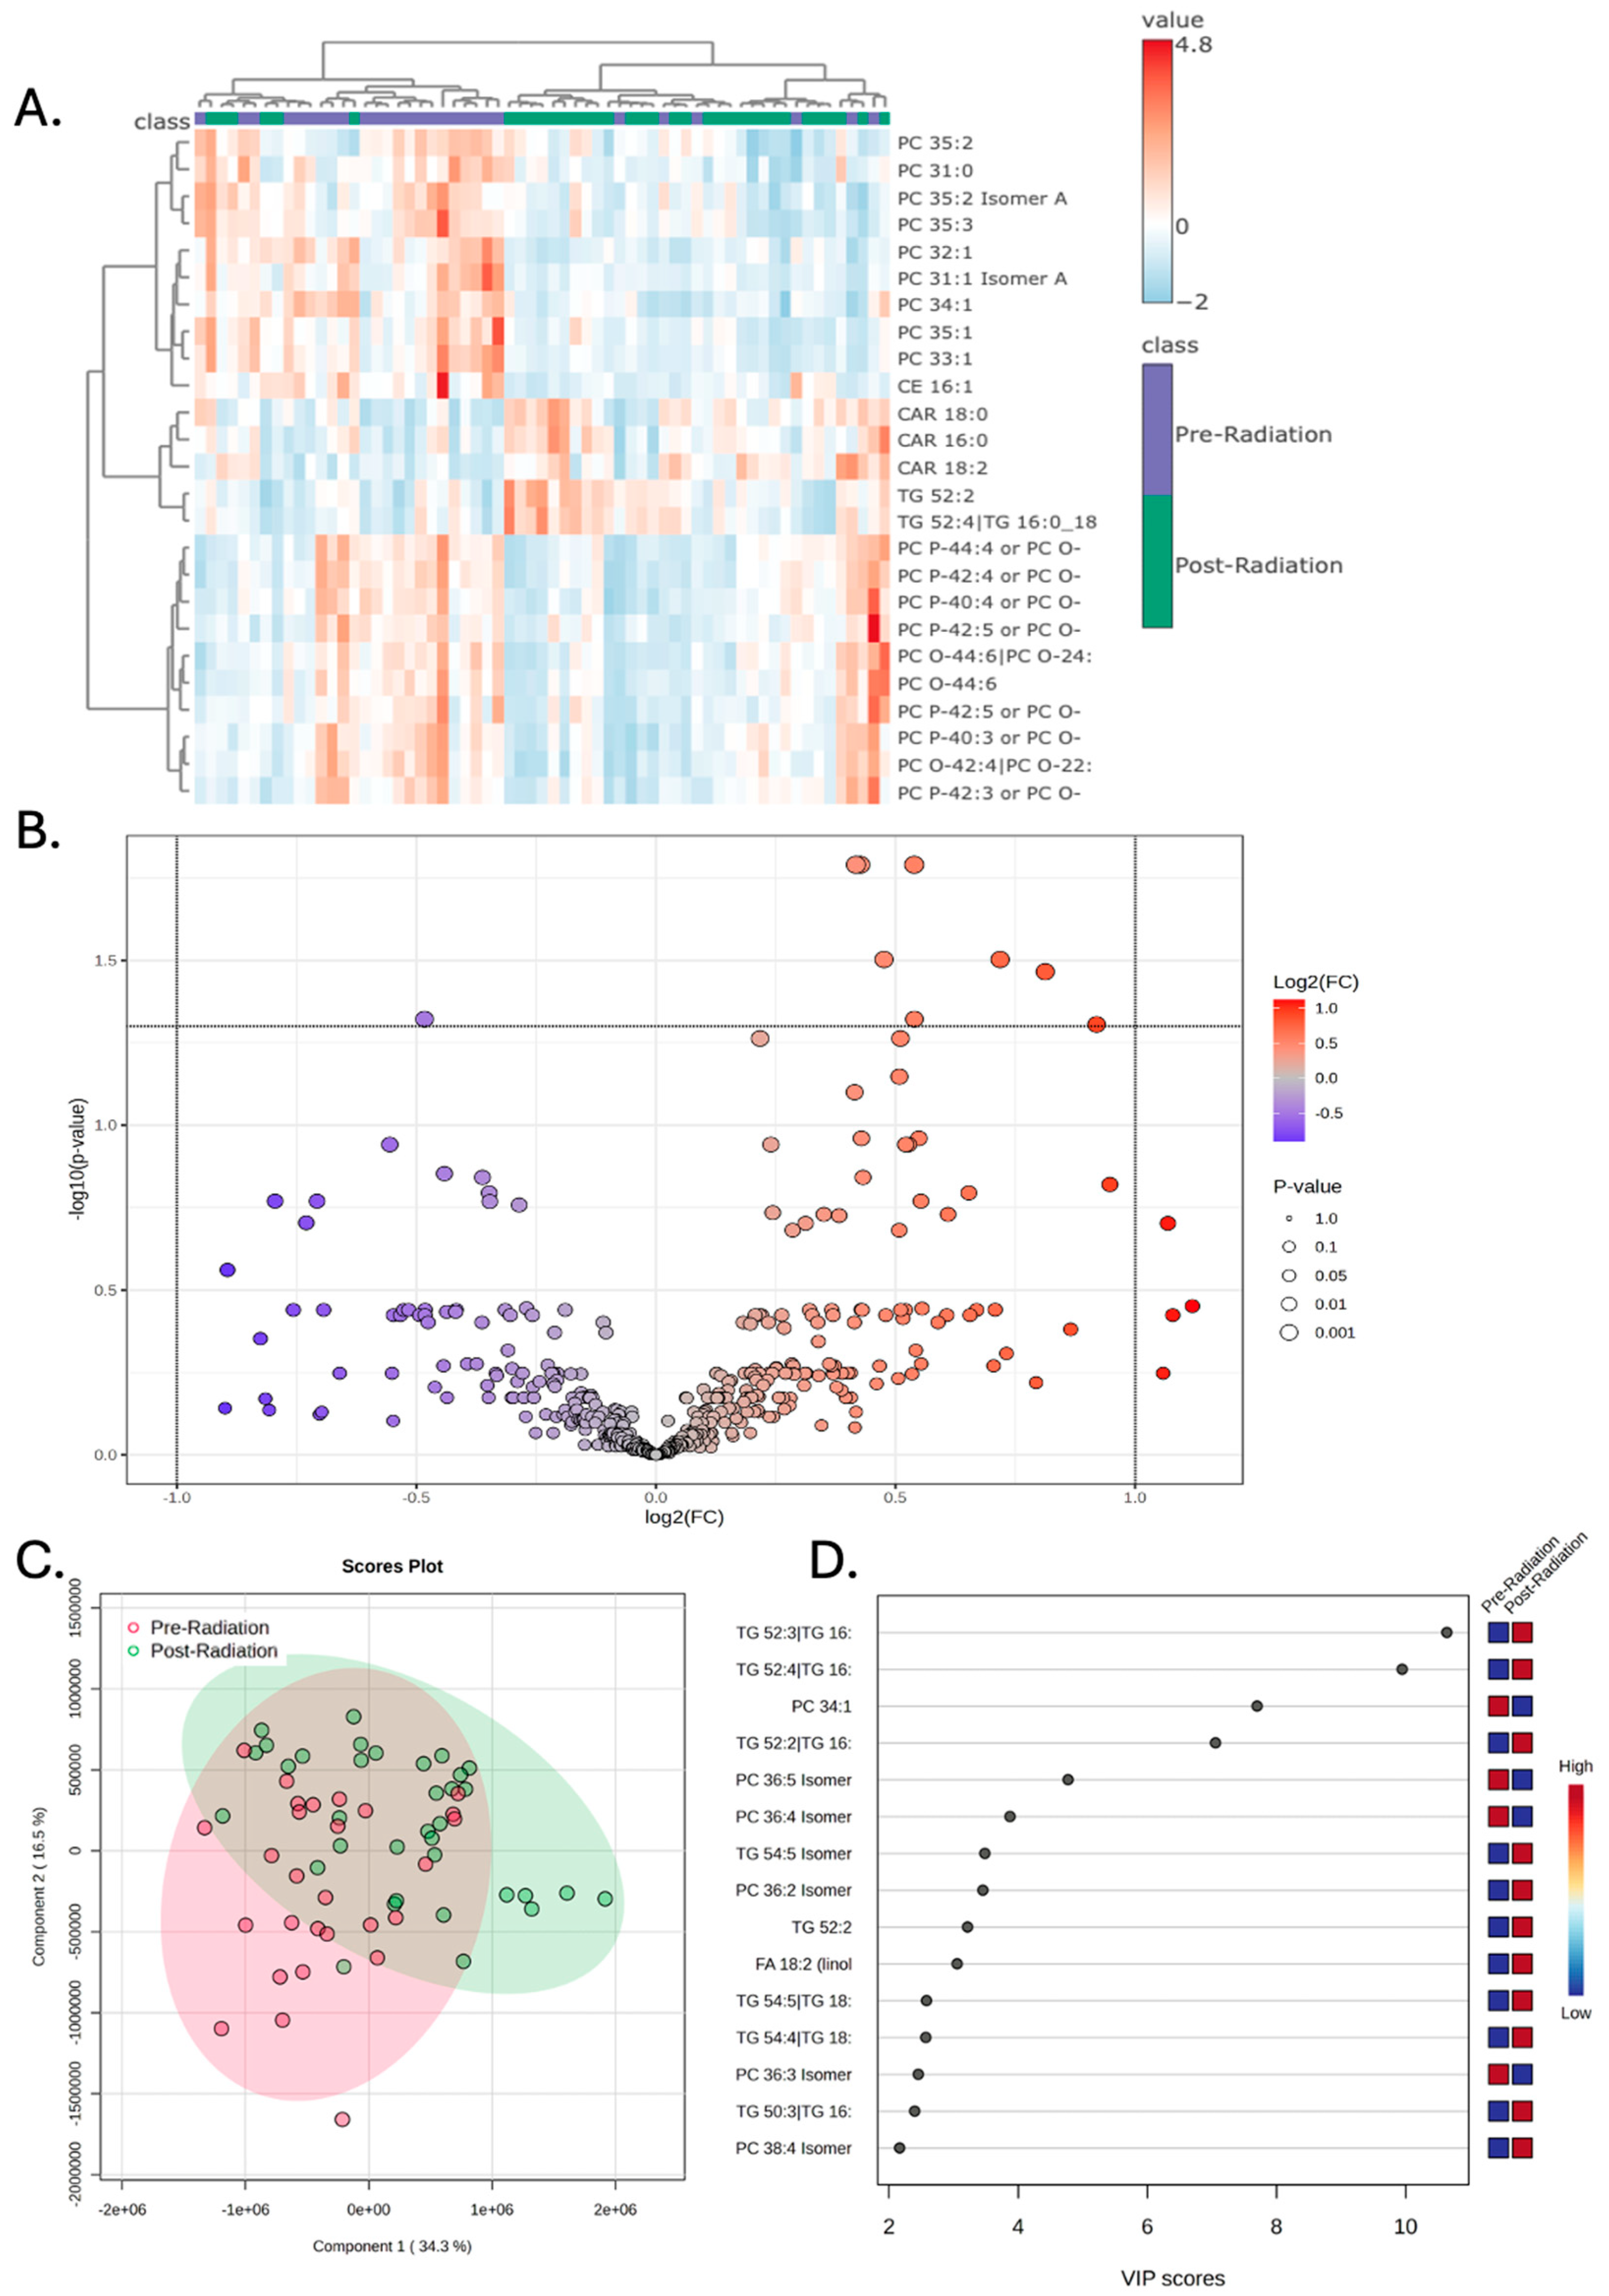
Figure 4.
Plasma lipid abundances are reduced following surgery and remain low at later treatment stages. Compound abundances of linoleic acid, TG 54:6, TG 54:5 isomer A, oleic acid, and TG 54:5 are decreased following surgery and remain low during the Pre-Radiation and Post-Radiation treatment stages, **** p < 0.0001.
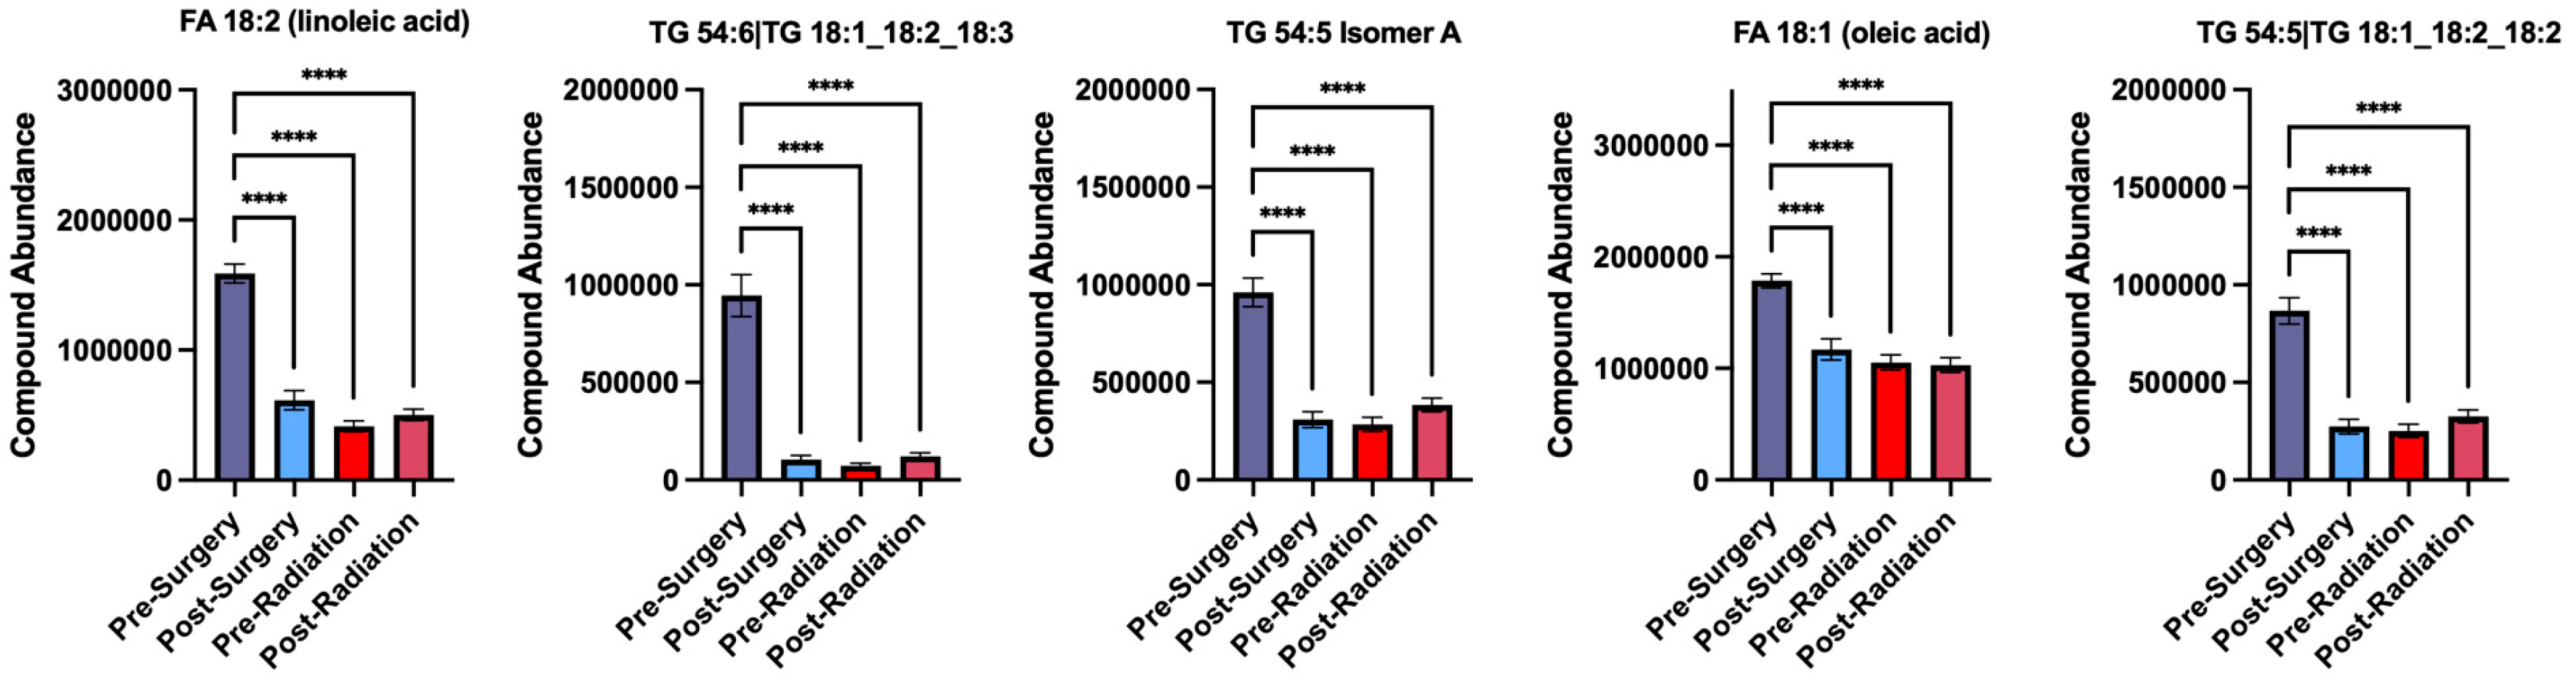
Figure 5.
Machine learning algorithm can distinguish between the lipidomic signatures of different treatment stages. Random Forest model utilizing 500 trees can identify differences in the lipidomic signatures of each treatment stage. Out-of-bag error demonstrates low predictive error (high accuracy) of 0.143 for samples from the Pre-Surgery stage and 0.257 for samples from the Post-Radiation stage. Post-Surgery and Pre-Radiation had high error rates of 0.438 and 0.607, respectively.
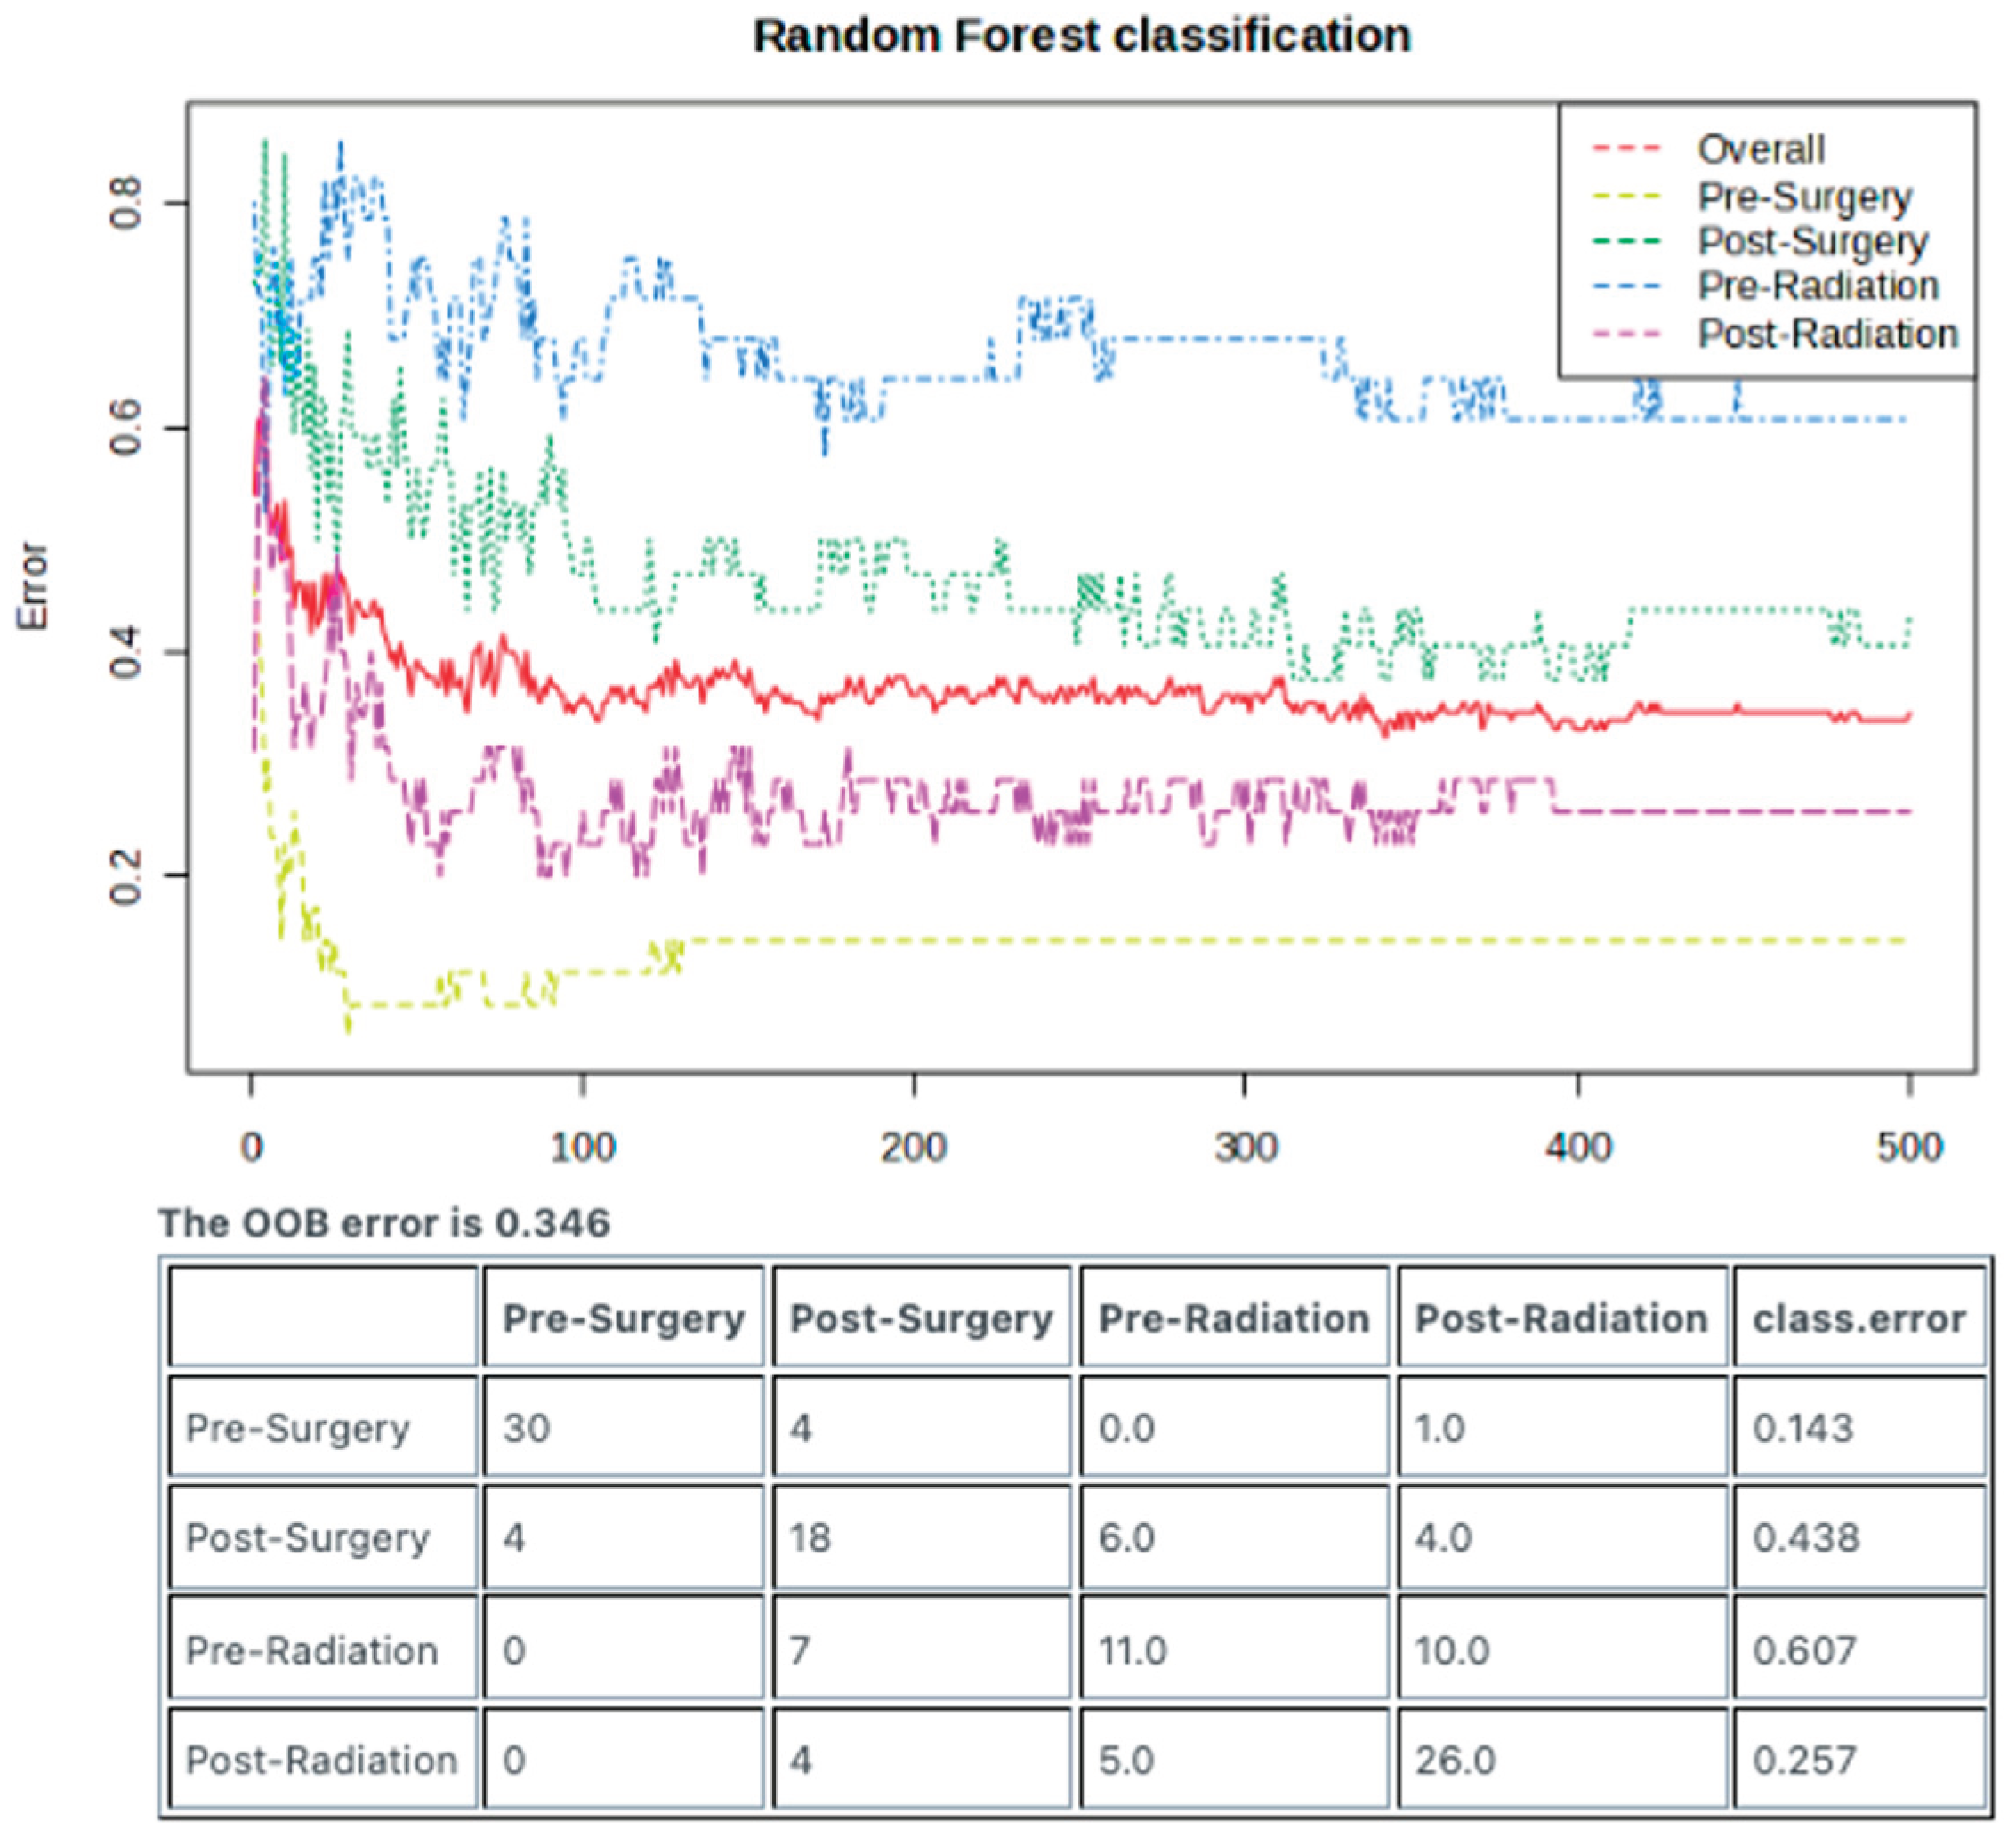

Table 1.
Demographics of patients, including sex, ethnicity, body mass index at diagnosis and treatment stage. “X” indicates that a sample was collected at the listed time point for each patient.
Table 1.
Demographics of patients, including sex, ethnicity, body mass index at diagnosis and treatment stage. “X” indicates that a sample was collected at the listed time point for each patient.
| Patient ID | Sex | Ethnicity | Diagnosis Age (years) |
BMI at Diagnosis | Pre-Surgery | Post-Surgery | Pre-Radiation | Post-Radiation |
|---|---|---|---|---|---|---|---|---|
| 1 | M | White | 60 | 40 | X | X | X | X |
| 2 | M | White | 72 | 30 | X | X | X | |
| 3 | M | Hispanic | 43 | 28 | X | X | X | |
| 4 | M | Asian | 49 | 57 | X | X | X | |
| 5 | F | White | 78 | 23 | X | X | ||
| 6 | M | Hispanic | 65 | 22 | X | X | X | |
| 7 | M | White | 72 | 41 | X | X | X | |
| 8 | M | White | 80 | 24 | X | X | X | X |
| 9 | F | White | 61 | 27 | X | X | X | |
| 10 | F | White | 69 | 25 | X | X | X | |
| 11 | M | Indian | 60 | 27 | X | X | X | |
| 12 | F | White | 61 | 25 | X | X | X | |
| 13 | F | White | 52 | 27 | X | X | ||
| 14 | M | White | 62 | 30 | X | X | X | |
| 15 | M | White | 69 | 31 | X | X | X | X |
| 16 | M | White | 67 | 44 | X | X | ||
| 17 | F | White | 82 | 28 | X | X | X | |
| 18 | F | White | 55 | 29 | X | X | ||
| 19 | M | African American | 47 | 37 | X | X | X | X |
| 20 | M | White | 63 | 30 | X | X | X | X |
| 21 | F | White | 86 | 27 | X | X | X | |
| 22 | F | White | 64 | 31 | X | X | X | X |
| 23 | M | White | 56 | 22 | X | X | X | X |
| 24 | F | White | 69 | 26 | X | X | X | X |
| 25 | F | NA | 69 | 27 | X | X | X | |
| 26 | M | White | 64 | 36 | X | X | X | X |
| 27 | M | White | 68 | 28 | X | X | X | |
| 28 | M | White | 69 | 28 | X | X | X | X |
| 29 | F | White | 58 | 27 | X | X | X | |
| 30 | F | white | 66 | 27 | X | X | X | |
| 31 | M | White | 55 | 28 | X | X | X | X |
| 32 | F | White | 60 | 20 | X | X | X | |
| 33 | M | White | 58 | 28 | X | X | X | |
| 34 | M | White | 53 | 30 | X | X | X | |
| 35 | M | White | 58 | 26 | X | X | X | |
| 36 | M | White | 76 | 35 | X |
Table 2.
List of the top ten lipids with the most significant change in abundance following surgery. P values are corrected for a false discovery rate of less than 0.05. All lipids had higher abundances prior to surgery, except for CE 22:6 that had lower abundance. Abbreviations include triglycerides (TG), phosphatidylethanolamines (PE), phosphatidylcholines (PC), and diglycerides (DG), lysophosphatidylethanolamines (LPE), and cholesteryl docosahexaenoate (CE).
| Lipid Name | Fold Change | P-Value |
| Linoleic acid | 2.58 | 4.21 x 10⁻¹¹ |
| Behenic acid | 2.09 | 9.3 x 10⁻¹⁰ |
| TG 54:5 Isomer A | 3.11 | 2.58 x 10⁻⁸ |
| TG 54:5 | 3.17 | 2.58 x 10⁻⁸ |
| TG 54:6 | 9.14 | 3.33 x 10⁻⁸ |
| Linolenic acid | 4.44 | 5.83 x 10⁻⁸ |
| PE 36:1 | 2.58 | 1.73 x 10⁻⁷ |
| TG 52:5 | 3.07 | 7.84 x 10⁻⁷ |
| LPE 18:1 | 2.24 | 1.46 x 10⁻⁶ |
| Eicosenoic acid | 2.12 | 4.79 x 10⁻⁶ |
| PC 31:1 Isomer B | 2.19 | 7.38 x 10⁻⁶ |
| TG 54:8 | 19.8 | 1.25 x 10⁻⁵ |
| DG 36:4 Isomer A | 3.44 | 1.66 x 10⁻⁵ |
| TG 54:7|TG 18:2_18:2_18:3 | 21.5 | 2.19 x 10⁻⁵ |
| TG 60:4 | 6.16 | 4.17 x 10⁻⁵ |
| TG 58:3 | 4.11 | 4.45 x 10⁻⁵ |
| TG 51:5 | 2.57 | 4.51 x 10⁻⁵ |
| TG 58:4 | 5.01 | 6.60 x 10⁻⁵ |
| TG 60:3 | 5.28 | 8.77 x 10⁻⁵ |
| PE 34:1 | 2.07 | 1.78 x 10⁻⁴ |
| TG 53:5 | 2.08 | 1.90 x 10⁻⁴ |
| CE 22:6 | 0.45 | 1.26 x 10⁻³ |
| TG 56:2 | 2.18 | 1.94 x 10⁻³ |
| TG 58:5 | 2.25 | 3.31 x 10⁻³ |
| TG 58:2 | 3.27 | 4.99 x 10⁻³ |
Disclaimer/Publisher’s Note: The statements, opinions and data contained in all publications are solely those of the individual author(s) and contributor(s) and not of MDPI and/or the editor(s). MDPI and/or the editor(s) disclaim responsibility for any injury to people or property resulting from any ideas, methods, instructions or products referred to in the content. |
© 2025 by the authors. Licensee MDPI, Basel, Switzerland. This article is an open access article distributed under the terms and conditions of the Creative Commons Attribution (CC BY) license (http://creativecommons.org/licenses/by/4.0/).
Copyright: This open access article is published under a Creative Commons CC BY 4.0 license, which permit the free download, distribution, and reuse, provided that the author and preprint are cited in any reuse.


