Submitted:
21 April 2025
Posted:
21 April 2025
You are already at the latest version
Abstract
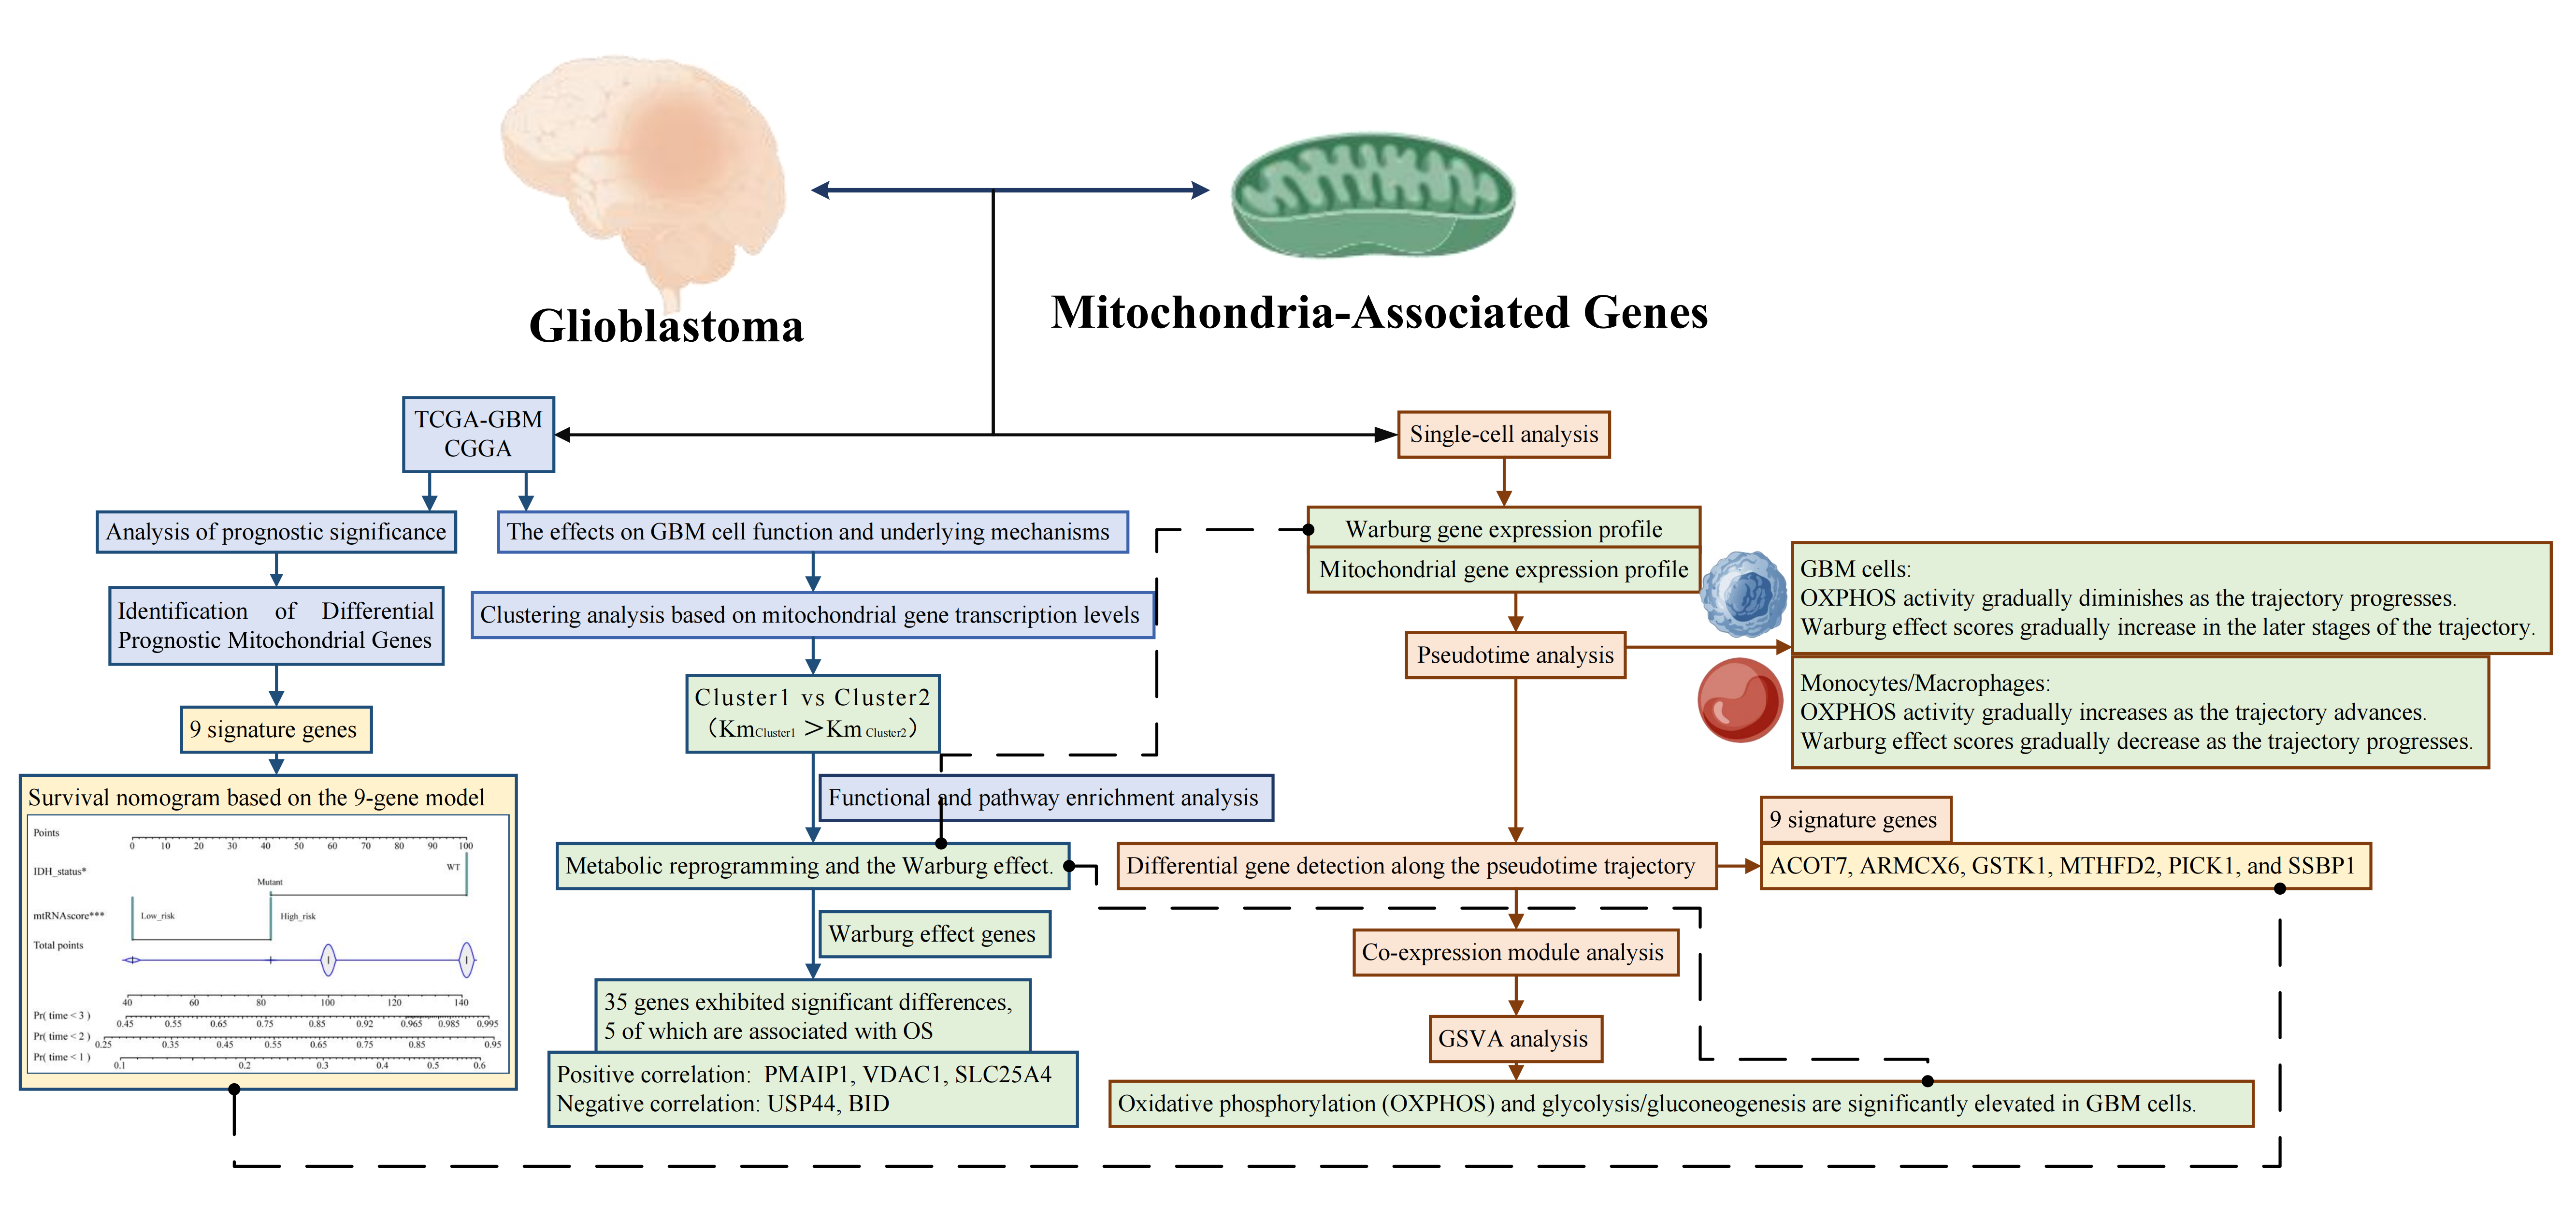
Background/Objectives Glioblastoma (GBM) is an aggressive brain tumor with poor prognosis and limited treatment options. Metabolic reprogramming, particularly the Warburg effect, plays a significant role in its progression. This study aims to explore the prognostic value and therapeutic potential of mitochondria-associated genes in GBM by integrating single-cell and bulk RNA sequencing data. Methods We analyzed single-cell RNA sequencing (scRNA-seq) data from the Gene Expression Omnibus (GEO) and bulk RNA sequencing (bulk RNA-seq) data from The Cancer Genome Atlas (TCGA) and the Chinese Glioma Genome Atlas (CGGA). Differentially expressed mi-tochondria-associated genes were identified, and a 9-gene risk signature was con-structed using LASSO and Cox regression models. Survival analysis and functional en-richment were conducted, and single-cell pseudotime analysis was employed to inves-tigate metabolic transitions. Results We identified 10 mitochondria-associated genes significantly correlated with GBM prognosis. A 9-gene risk signature was developed and validated, stratifying patients into high- and low-risk groups in both the TCGA and CGGA cohorts. This model was shown to be an independent prognostic factor. Functional enrichment revealed associations with metabolic pathways, including the Warburg effect. Single-cell analysis highlighted a shift from oxidative phosphorylation to glycolysis in malignant cells, further implicating metabolic reprogramming in GBM progression. Conclusions Our findings emphasize the prognostic value of mitochon-dria-associated genes in GBM and their potential as therapeutic targets. The developed risk model can aid in prognostic evaluation and personalized treatment strategies, particularly by targeting the metabolic reprogramming that drives tumor progression. These results provide a new avenue for improving GBM management through meta-bolic interventions.
Keywords:
Glioblastoma
; Warburg Effect
; Mitochondria-Associated Genes
; Immunity
; Bioinformatics
Graphical Abstract
1. Introduction
Glioblastoma (GBM) is the most prevalent and aggressive primary malignant brain tumor in adults. It accounts for approximately 14–15% of all central nervous system tumors and nearly half (approximately 48–50%) of malignant brain tumors.The prognosis of GBM remains dismal, with a median survival of only about 15 months despite aggressive multimodal therapeutic interventions [1]. Beyond its lethality, GBM imposes a substantial burden on patients' families and society. The tumor itself, along with the current standard treatments—including surgical resection, radiotherapy, and chemotherapy—inflicts severe damage to the brain, leading to cognitive, emotional, and behavioral impairments. Many patients experience loss of independence, inability to work, and exorbitant medical expenses.The current standard of care involves maximal safe surgical resection followed by radiotherapy combined with temozolomide chemotherapy [2]. Despite emerging therapeutic strategies such as Tumor Treating Fields and immunotherapy, these innovations have yet to significantly improve the long-term prognosis of GBM. Over the past decades, the survival rate of GBM patients has seen little improvement, underscoring the urgent need for novel research avenues to enhance patient outcomes.
Metabolic reprogramming is a hallmark of malignant tumors, including GBM, and has been closely linked to therapeutic resistance [3]. GBM cells predominantly rely on glycolysis for energy production even in the presence of oxygen, a phenomenon known as the "Warburg effect." This metabolic adaptation supplies the energy and biosynthetic intermediates necessary for rapid tumor proliferation. Mitochondria play a central role in regulating this metabolic shift. As the cellular "powerhouse," mitochondria drive oxidative phosphorylation (OXPHOS) for ATP synthesis. More importantly, alterations in mitochondrial structure and function influence critical biological processes, including cell proliferation, apoptosis, and oxidative stress, thereby promoting the invasive growth and therapeutic resistance of GBM cells [4]. Given the pivotal role of mitochondria in the metabolic adaptation of GBM, recent research has increasingly focused on targeting mitochondrial function as a therapeutic strategy [3]. These findings highlight the scientific and potential clinical significance of investigating mitochondria-associated molecular mechanisms in GBM from a tumor metabolism perspective.
However, the precise role of mitochondria-associated genes in GBM pathogenesis and progression remains inadequately understood. This study aims to conduct a comprehensive analysis of mitochondria-associated genes in GBM by integrating single-cell RNA sequencing (scRNA-seq) and bulk RNA sequencing (bulk RNA-seq) data, thereby elucidating their biological functions and clinical relevance. Single-cell transcriptomic analysis enables the characterization of tumor heterogeneity at a high resolution, revealing molecular features that may be masked in bulk analyses. By leveraging this approach, we aim to elucidate the role of mitochondrial gene expression patterns in GBM molecular subtyping and prognostic evaluation while identifying key mitochondrial-associated targets with therapeutic potential. Recent studies have reclassified GBM based on metabolic pathways and identified a tumor subtype characterized by mitochondrial oxidative metabolism, which is associated with a more favorable clinical prognosis and heightened sensitivity to OXPHOS inhibitors. Against this backdrop, our study integrates single-cell and bulk transcriptomic data to systematically investigate the expression profiles and functional roles of mitochondria-associated genes in GBM. We emphasize their significance in tumor molecular classification and prognosis assessment while exploring their potential as therapeutic targets. Through this research, we aspire to provide novel insights and a scientific foundation for GBM molecular subtyping and personalized therapeutic strategies.
2. Materials and Methods
2.1. Data Sources and Processing
We obtained single-cell RNA sequencing (scRNA-seq) data (GSE139448) from the Gene Expression Omnibus (GEO) database, comprising three GBM samples with a total of 8,360 cells. GEO, maintained by the National Center for Biotechnology Information (NCBI), is a public repository hosting extensive high-throughput gene expression datasets from around the world, encompassing RNA sequencing, microarray, DNA methylation, protein-DNA interactions, and more. Data in GEO are structured by Platform, Sample, and Series, providing broad utility in biomedical research by enabling replication and reanalysis.
Bulk RNA-seq data and clinical information for GBM were sourced from The Cancer Genome Atlas (TCGA). TCGA, jointly established by the National Cancer Institute (NCI) and the National Human Genome Research Institute (NHGRI), is a large-scale cancer genomics consortium that offers free, publicly available multi-omics data across 33 cancer types. In this study, we specifically used the TCGA-GBM data. Data were downloaded with the R package TCGAbiolinks: 1. GDCquery: Specified data type “HTSeq-count.” 2. GDCdownload: Retrieved the queried data. 3.GDCprepare: Processed and converted queried data into a SummarizedExperiment (SE) object for downstream R analysis. Clinical information was also downloaded via GDCquery_clinic in TCGAbiolinks (retrieval date: November 19, 2024).
We additionally collected GBM expression and clinical data from the Chinese Glioma Genome Atlas (CGGA), a specialized resource for GBM genomic data in Chinese patients, including expression profiles, genomic variations, and DNA methylation. Specifically, we used the dataset CGGA.mRNAseq_325.RSEM-genes.20200506 to obtain expression profiles and clinical annotations.
2.2. Identification of Differentially Prognostic Mitochondrial Genes
We first downloaded 1,136 human mitochondria-associated genes from MitoCarta3.0 (https://www.broadinstitute.org/mitocarta) and identified 1,105 of these genes in the TCGA-GBM dataset. Next, using the R package edgeR, we discovered 94 differentially expressed genes (DEGs) (adj. p < 0.01 and |log2FC| > 1) between 94 GBM samples and normal control tissue, including 28 upregulated and 66 downregulated genes in GBM. Finally, by applying the survival R package, we examined the association between overall survival (OS) and each of the 1,105 mitochondrial genes, ultimately identifying 10 that were both differentially expressed and prognostically significant.
2.3. Construction and Validation of the Mitochondria-Associated Gene Signature
From the TCGA-GBM dataset, we used the glmnet R package to perform regression and further select genes for computing a mitochondrial risk score. Nine genes remained in the final model. After constructing this risk model, samples from the TCGA cohort were split into high-risk and low-risk groups. We used the survival and survminer R packages to compare survival between these two groups and employed the timeROC R package to conduct time-dependent receiver operating characteristic (ROC) curve analyses at 1, 2, and 3 years. We then validated the model in an external cohort derived from the CGGA database by applying the same risk scoring, subgroup classification, survival analyses, and ROC calculations.
2.4. Independent Prognostic Analysis and Nomogram Construction
To determine whether the mitochondrial gene signature could serve as an independent prognostic factor for GBM, we conducted univariate and multivariate Cox regression analyses. A nomogram was subsequently developed using the rms and regplot R packages to visualize the relationships between clinical variables and the prognostic model. We employed 1-, 2-, and 3-year calibration curves to assess and predict the nomogram’s performance.
2.5. Clustering Analysis
Using the ConsensusClusterPlus R package, we classified the TCGA-GBM cohort based on mitochondria-associated gene expression to investigate whether these genes were associated with GBM. When k=2, we observed strong intracluster correlations and moderate intercluster correlations. Further survival-related analyses showed a significant difference in prognosis between the two clusters. Lastly, we conducted GSEA and GSVA analyses to explore differences in metabolism-related pathways between the two subgroups.
2.6. Functional Enrichment Analysis
Using the ClusterProfiler R package, we performed Gene Ontology (GO) and Kyoto Encyclopedia of Genes and Genomes (KEGG) pathway analyses. We visualized the GO and KEGG results with the circlize R package. We further examined three Warburg effect–related gene sets obtained from MSigDB using the GSVA algorithm, identifying enrichment differences between the subgroups.
2.7. Single-Cell Data Processing
We employed the MAESTRO v1.5.1 [PMID: 32767996 ] standardized workflow to process all collected datasets, including quality control, batch effect correction, cell clustering, differential expression analysis, and cell-type annotation. Two metrics were used to assess cell quality: the total number of counts (UMIs) per cell (library size) and the number of detected genes per cell. Cells with a library size <1,000 or fewer than 500 detected genes were discarded. We identified the top 2,000 variable features, performed PCA for dimensionality reduction, and applied KNN and Louvain algorithms for clustering. To better capture cell differences and variability across datasets with different cell numbers, we set the number of principal components to 30 and the graph-based clustering resolution to 1, then used Uniform Manifold Approximation and Projection (UMAP) for further dimensionality reduction and cluster visualization. In total, 17 clusters were identified. We used the Wilcoxon test, with log fold-change (|logFC| ≥ 0.25) and false discovery rate (FDR < 1e-05), to detect differentially expressed (DE) genes in each cluster compared with all other cells. For cluster annotation, we applied a marker-based approach implemented in MAESTRO, which references DE genes against published marker gene resources. Ultimately, four types of immune cells were identified. We conducted pseudotime trajectory analysis with the default settings in, which infers cell differentiation paths by placing single cells along a trajectory that corresponds to biological processes (e.g., cell differentiation).
2.8. Statistical Analysis
We used the survivalROC R package to generate ROC curves for survival prediction and calculate the area under the curve (AUC). The rms package was used to construct and evaluate nomograms and calibration curves. GO and KEGG enrichment analyses were conducted with the clusterProfiler R package. Continuous variables between two groups were compared using the Wilcoxon rank-sum test, and continuous variables among three or more groups were compared via the Kruskal–Wallis test. Categorical variables were compared using Fisher’s exact test or the chi-square test as appropriate. Unless otherwise specified, p < 0.05 was considered statistically significant. All statistical analyses were performed in R version 4.2.3.
3. Results
3.1. Identification of Differentially Prognostic Mitochondria-Associated Genes
Differential expression analysis between TCGA-GBM samples and control tissues identified 94 mitochondria-associated genes exhibiting significant changes (FDR < 0.01, |log₂FC| > 1), with 28 genes upregulated and 66 downregulated in GBM (Figure 1A, volcano plot). Subsequently, prognostic analysis revealed 87 genes significantly associated with overall survival (OS) (Figure 1B). The intersection of these 87 prognostic genes with the differentially expressed mitochondria-associated genes yielded 10 genes, which were selected for further analysis (Figure 1C).
3.2. Construction and Validation of the Mitochondria-Associated Risk Model
After excluding TCGA-GBM samples with missing survival time or status, 155 cases were retained as the training set. Based on the 10 differentially prognostic mitochondria-associated genes, we further refined the gene set and constructed a prognostic model. LASSO Cox regression analysis was performed using the glmnet R package to streamline the model. Examination of the coefficient trajectories indicated that as the lambda parameter increased, more coefficients converged to zero. Ten-fold cross-validation was employed to determine the optimal lambda value (λ = 0.0339602; see Figure A 1A and A 1B), resulting in the following risk score formula:
mtRNAscore9 = 0.3093*expACOT7 + 0.00123*expTHEM5 - 0.2569*expMTHFD2 -0.7604*expABCB7 + 0.2328*expPICK1 + 0.3265*expPDK3 - 0.1568*expARMCX6 + 0.1609*expGSTK1 + 0.6045*expSSBP1
Risk scores were calculated for each sample in both the training and external datasets, and the distribution of mtRNAscores demonstrated that samples with higher risk scores had markedly shorter OS compared to those with lower scores. Analysis of the nine signature genes revealed that high expression of MTHFD2, ABCB7, and ARMCX6 was associated with lower risk (protective factors), whereas high expression of SSBP1, GSTK1, PDK3, PICK1, THEM5, and ACOT7 correlated with higher risk (risk factors) (Figure 2A and 2B). By stratifying samples into high- and low-risk groups using the median mtRNAscore, Kaplan–Meier (KM) survival analysis showed a significant difference in OS in the training cohort (log-rank p = 3.37e−07, HR = 2.781 [95% CI: 1.877–4.12]; 78 high-risk vs. 77 low-risk samples) with a 1-year AUC > 0.729. Validation in the external CGGA cohort confirmed the model’s robustness (log-rank p = 0.0396, HR = 1.579 [95% CI: 1.022–2.439]; 107 high-risk vs. 30 low-risk samples; 2-year AUC = 0.65) (Figure 2 C–F).
3.3. Development and Validation of a Nomogram Based on the 9-Gene Model
To translate the 9-gene model into clinical practice, we integrated the risk score with clinical variables to develop a nomogram for predicting patient survival. Univariate and multivariate Cox regression analyses were performed using the 9-gene risk score and clinical factors (age, sex, race, and IDH mutation status). Univariate analysis showed that both IDH mutation status and the 9-gene model were significantly associated with OS, while multivariate analysis confirmed that race, IDH mutation status, and the 9-gene model are independent prognostic factors (Figure 3A and 3B). Consequently, a nomogram was constructed to estimate GBM patients’ survival probabilities (Figure 3C). Calibration curves, which compare predicted and actual survival probabilities at different time points, demonstrated good concordance (Figure 3D). The 1-, 2-, and 3-year AUC values were 0.649, 0.82, and 0.854, respectively (Figure 3F), and KM analysis further validated the effective stratification of patients into high- and low-risk groups.
3.4. Clustering Analysis
To explore the potential mechanisms by which mitochondria-associated genes influence GBM prognosis, we performed consensus clustering based on their expression profiles. GBM samples were divided into two clusters (Figure 4A–E). Kaplan–Meier survival analysis demonstrated that patients in Cluster 2 had significantly poorer survival compared to those in Cluster 1 (Figure 4F).
Subsequently, using the limma package, we identified differentially expressed genes (DEGs) between the two clusters and conducted enrichment analysis. KEGG analysis revealed significant differences in pathways including the p53 signaling, TNF signaling, and IL-17 signaling pathways (Figure 5B), while GO enrichment analysis is summarized in Figure 5A. Furthermore, GSVA analysis showed that Cluster 1 was primarily enriched in metabolic pathways such as Terpenoid_backbone_biosynthesis and Glyoxylate_and_dicarboxylate_metabolism, whereas Cluster 2 was enriched in Phenylalanine_metabolism and Starch_and_sucrose_metabolism (Figure 5C). GSEA of the DEGs between clusters identified significant enrichment of the “GALLUZZI_PREVENT_MITOCHONDRIAL_PERMEABILIZATION” pathway in Cluster 2 (Figure 5D).
3.5. Comparison of Warburg Effect Gene Expression Between Subtypes
To assess the influence of mitochondria-associated genes on the effectors of the Warburg effect, we extracted 74 genes from three Warburg effect–related pathways. Analysis showed that 35 of these genes were significantly differentially expressed between Cluster 1 and Cluster 2 (Figure 6A), while the remaining 39 genes did not exhibit significant differences (Figure 6B). Kaplan–Meier analysis further revealed that five genes were significantly associated with OS: low expression of BID and USP44 correlated with higher risk, whereas high expression of PMAIP1, VDAC1, and SLC25A4 was linked to increased risk (Figure 6C).
3.6. Single-Cell Data Analysis
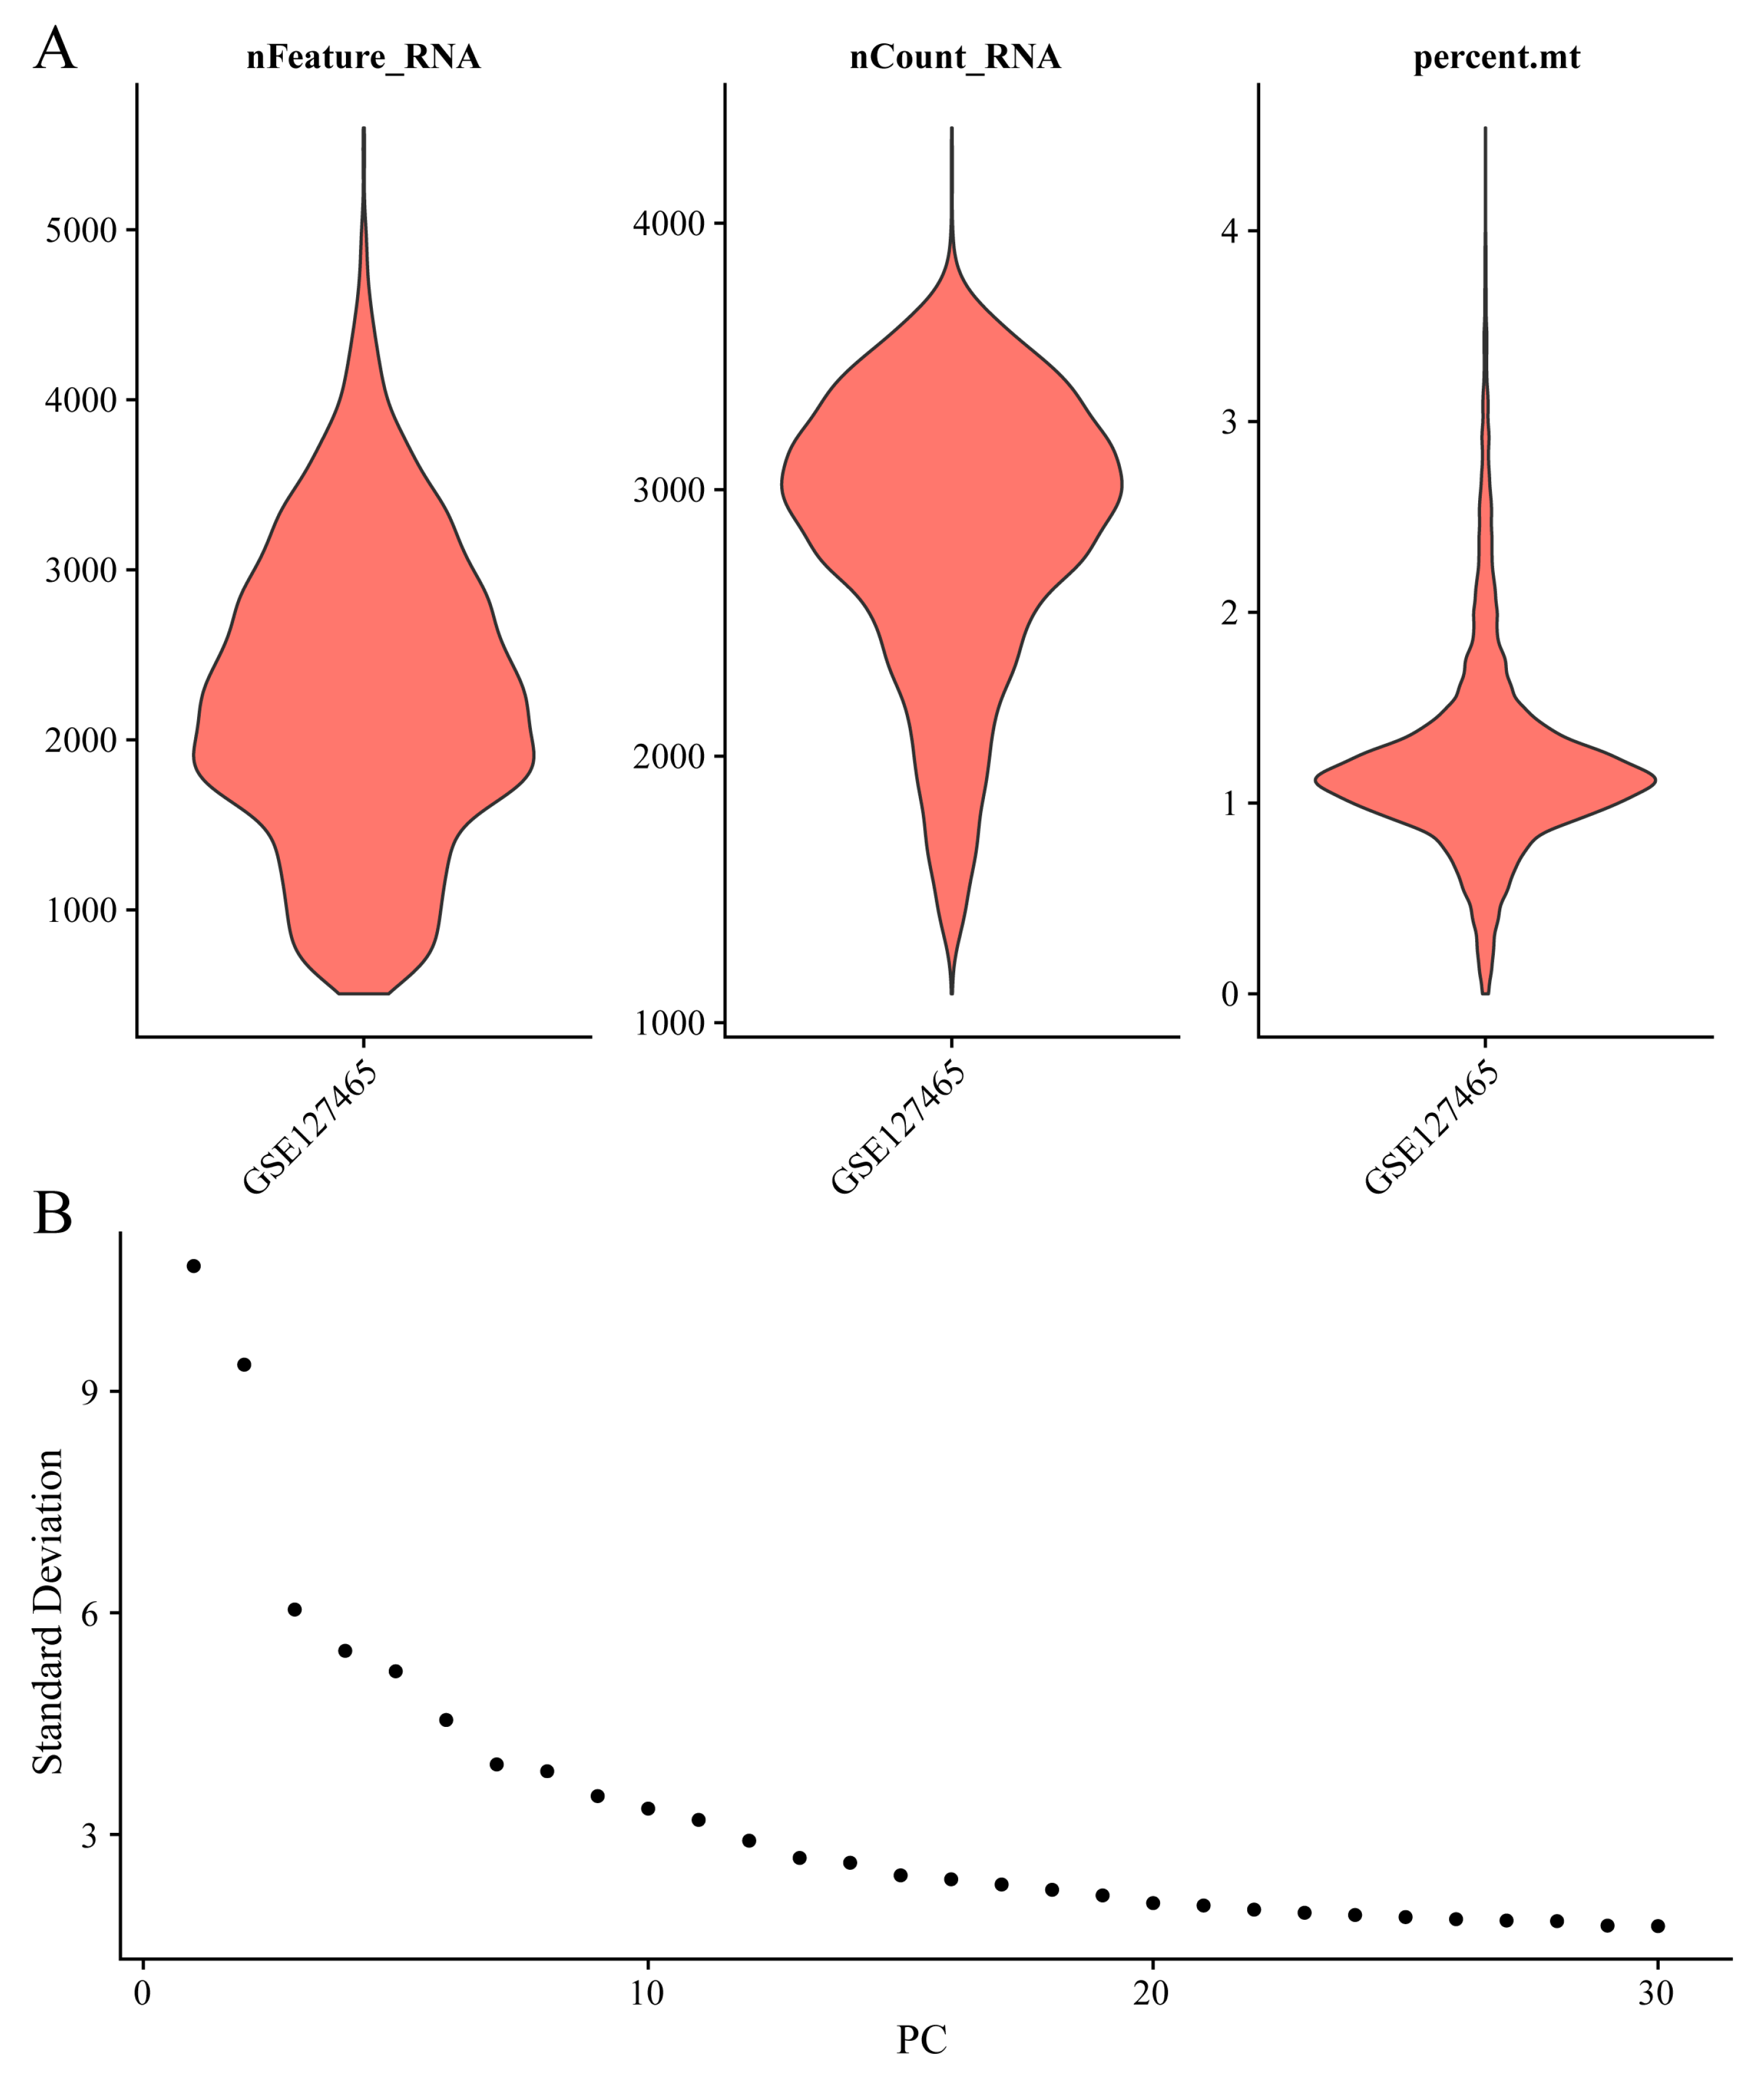
Following quality control, 17,029 genes and 8,360 cells were retained (see Figure A 2for assessments of gene and mitochondrial content). The MAESTRO pipeline was employed to identify the top 2,000 variable features, perform PCA for dimensionality reduction, and cluster cells using KNN and the Louvain algorithm. To effectively capture cell-to-cell variability across datasets with differing cell counts, 30 principal components and a graph-based clustering resolution of 1 were used, followed by UMAP for visualization. The distribution of cells across the three samples is shown in Figure 7A, and UMAP visualization revealed 17 distinct clusters (Figure 7B). Subsequent cell-type annotation identified 461 immune cells, 87 stromal cells, and 7,812 malignant cells (Figure 7C). Annotation based on known marker genes further refined the cluster identities (Figure 7D).
Next, we examined the differential expression of mitochondria-associated genes and Warburg effect-related genes across cell types. Mitochondria-associated genes exhibited distinct expression patterns in malignant versus immune cells (Figure 8A), with further differences among immune cell subtypes (Figure 8B). Similarly, the expression of Warburg effect-related genes in malignant compared to immune cells is shown in Figure 8C, with additional details across immune cell subgroups in Figure 8D. Notably, while PMAIP1 was expressed at relatively low levels across cell subgroups, VDAC1 and SLC25A4 were markedly overexpressed in malignant cells compared to stromal, endothelial, and monocyte populations. These findings corroborate earlier observations (Figure 5).
3.7. Pseudotime Analysis
Pseudotime analysis was conducted using Monocle 3, which employs reverse graph embedding to quantitatively estimate pseudotime and reconstruct trajectories of biological progression [PMID: 24658644, PMID: 28114287 , PMID: 28825705 ]. Initially, the function was used to identify cell trajectories (Figure 9A). Subsequently, manually selected starting points allowed us to refine the trajectory (Figure 9B). To explore metabolic changes along the trajectory, AUCell was used to calculate metabolic enrichment scores based on a mitochondrial gene set (mtDNA-encoded genes) and a Warburg effect-related gene set. In malignant cells, the mitochondrial gene (OXPHOS-related) score showed an overall declining trend along the pseudotime trajectory, indicating high OXPHOS activity at the trajectory’s origin that diminished over time. Conversely, the Warburg effect score increased in later stages, suggesting a metabolic reprogramming from oxidative phosphorylation toward glycolysis (Figure 9C and 9D).
Further, the graph_test function was applied to identify genes that significantly varied along the pseudotime trajectory. Among the nine model genes, six were identified as differentially expressed (q-value < 0.0001) along the trajectory. Their dynamic expression patterns across different cell types are shown in Figure 10A, with corresponding UMAP visualizations in Figure 10B. These results indicate that these genes may play crucial roles in cell state transitions and metabolic reprogramming, reinforcing the concept of dynamic transcriptional changes at the single-cell level.
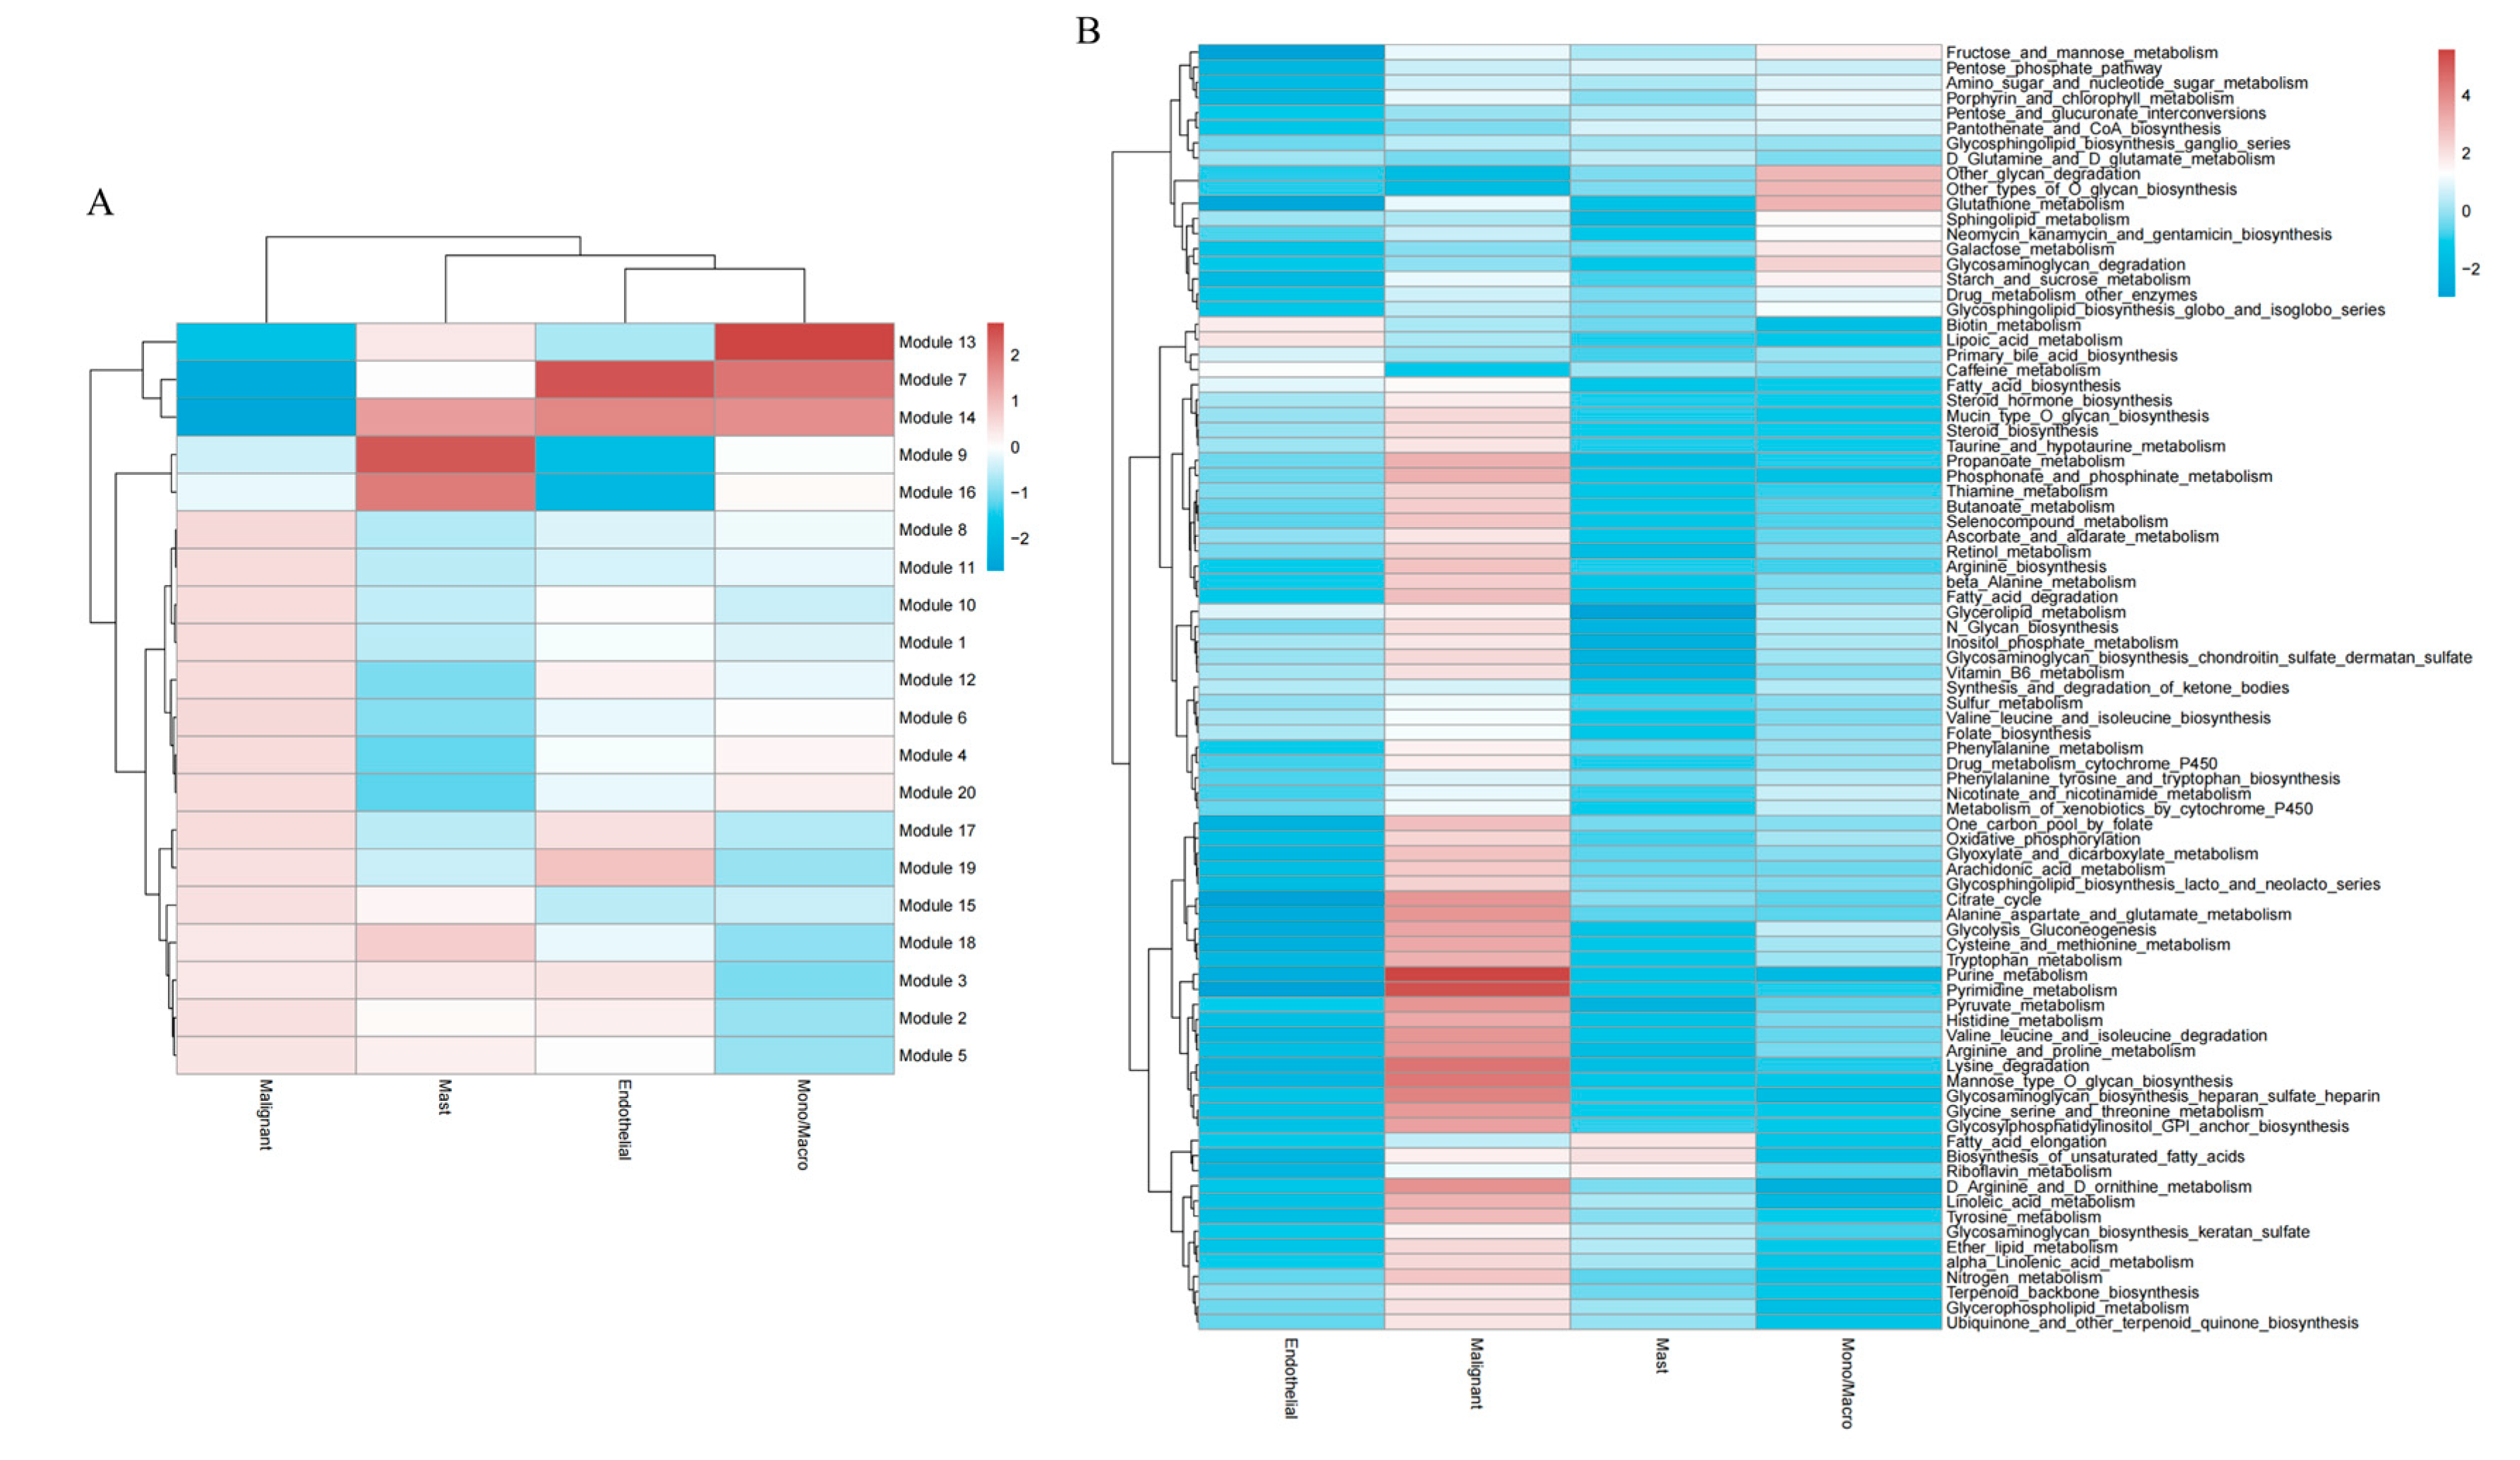
Finally, using the find_gene_modules function, co-expression module analysis was performed on pseudotime DEGs, generating a file (Genes_Module.csv) detailing the composition of each module. As shown in Figure 11 A, Modules 13, 7, and 14 exhibited the lowest expression in malignant cells (dark blue), suggesting potential suppression—possibly involving tumor suppressor genes, cell differentiation, or immune-related pathways—while these modules were most highly expressed in mono/macro cells, implying roles in monocyte/macrophage functional regulation (e.g., inflammatory signaling). Modules 7 and 14 were most highly expressed in endothelial cells (dark red), suggesting involvement in endothelial function, angiogenesis, or tumor microenvironment regulation. In contrast, Modules 9 and 16 were suppressed in endothelial cells (dark blue). In mast cells, Modules 14, 9, and 16 were highly activated, indicating possible roles in allergic responses, inflammatory modulation, or angiogenesis.
Subsequently, average expression values for each cell type were calculated to construct a matrix, and GSVA was employed to assess the distribution of metabolic pathway scores across cell types (Figure 11 B). The results revealed that both Oxidative phosphorylation (OXPHOS) and Glycolysis/Gluconeogenesis were significantly elevated in malignant cells, underscoring the critical role of the Warburg effect in glioblastoma and suggesting the therapeutic potential of targeting metabolic reprogramming.
4. Discussion
Glioblastoma (GBM) is one of the most common and aggressive malignant gliomas in the central nervous system, accounting for approximately 50% of all malignant brain tumors [5]. Despite recent advances in treatment modalities—including surgical resection, radiotherapy, and combination therapies such as temozolomide (TMZ)—overall survival (OS) remains dismal, with a 5-year survival rate below 5% [5,6]. The high costs associated with treatment and care, frequent recurrences, and significant neurological impairments not only impose a tremendous economic and psychological burden on patients and their families but also strain healthcare systems [7,8]. Thus, identifying novel prognostic markers and potential therapeutic targets is critical for the precision management of GBM. In this context, extensive research has been conducted to elucidate the molecular mechanisms underlying GBM, with tumor metabolic reprogramming emerging as a key factor in its development and progression.
Recent studies have underscored the pivotal role of metabolic reprogramming in GBM, drawing particular attention to mitochondrial function and its associated genes. Given their central roles in cellular energy production, metabolic regulation, and signal transduction, aberrations in mitochondrial function and the dysregulation of related proteins have been linked to tumor proliferation, invasion, and patient survival [9,10]. Therefore, further investigation into how mitochondrial proteins affect clinical outcomes and tumor biology in GBM is of paramount importance for improving prognostic assessments and identifying novel therapeutic targets.
In the present study, we analyzed GBM transcriptome data from public databases (TCGA and CGGA) to perform differential expression and survival analyses, ultimately identifying 10 mitochondria-associated genes significantly correlated with patient prognosis. Building on these findings, we employed LASSO and Cox regression analyses to construct a risk score model comprising 9 genes. This model was rigorously validated in both internal and external cohorts. In all cohorts, patients classified as high-risk exhibited significantly shorter overall survival compared to those in the low-risk group, suggesting that the expression profile of mitochondria/metabolism-related genes can effectively stratify GBM prognosis. Moreover, multivariate Cox analyses that integrated clinical variables further demonstrated that both the 9-gene model and IDH mutation status serve as independent prognostic factors, thereby enhancing the molecular-based framework for GBM prognostication. Based on these results, we developed and validated a nomogram for survival prediction, which holds promise as a decision-making tool for personalized treatment strategies in GBM.
A notable feature of tumor metabolic reprogramming is the preferential reliance on glycolysis for energy production under aerobic conditions, a phenomenon known as the Warburg effect. GBM cells typically exhibit the Warburg effect, relying on rapid aerobic glycolysis to generate ATP and biosynthetic intermediates to support their high proliferation and invasive capacity [11]. Our enrichment analysis of differentially expressed mitochondria-associated genes revealed a strong association with the Warburg effect in GBM—a finding that was corroborated by subsequent single-cell analyses [12]. Notably, pseudotime analysis of single-cell data from GBM showed that mitochondrial gene scores (indicative of oxidative phosphorylation, or OXPHOS, activity) decline along the cellular trajectory, suggesting that cells at the beginning of the trajectory exhibit high OXPHOS activity that diminishes over time. In contrast, the Warburg effect score increased in later stages, indicating that malignant cells may undergo metabolic reprogramming from a state primarily dependent on mitochondrial oxidative metabolism to one dominated by glycolysis. This metabolic shift likely promotes tumor cell survival by reducing oxidative stress, evading apoptosis, and facilitating immune escape and invasiveness, ultimately leading to poorer outcomes. We speculate that mutations in mitochondria-associated genes may drive the Warburg effect by altering the metabolic landscape of GBM, thereby promoting tumorigenesis and progression. Inhibiting this metabolic reprogramming may reverse GBM cell dedifferentiation and serve as a potential therapeutic target. Indeed, prior studies have provided evidence supporting this notion: for example, inhibiting pyruvate dehydrogenase kinase (PDK) with dichloroacetate (DCA) forces pyruvate into the mitochondrial oxidative pathway, partially reversing the Warburg metabolism, reducing the growth advantage of tumor cells, and enhancing their sensitivity to radiotherapy [13]. Moreover, DCA treatment has been shown to promote the differentiation of glioma stem cells, thereby diminishing their stem-like properties [14].
Furthermore, the Warburg effect is closely intertwined with immune responses through its impact on metabolic byproducts and the tumor microenvironment. High lactate levels and low pH can suppress the function of antitumor immune cells such as T cells and dendritic cells while promoting the polarization of macrophages (including microglia) toward an immunosuppressive M2 phenotype, further dampening the antitumor immune response [13]. Our single-cell data revealed pronounced metabolic heterogeneity among various cell subpopulations. In particular, within the monocyte/macrophage population, oxidative phosphorylation-related gene expression was relatively upregulated, whereas the Warburg effect score was comparatively lower—possibly reflecting an adaptive compensatory mechanism in response to the glycolytic tumor microenvironment. Notably, the gradual upregulation of genes such as MTHFD2, SSBP1, GSTK1, and ARMCX6 along the pseudotime trajectory in monocyte/macrophage populations suggests that these genes may play roles in the differentiation or functional transition of these cells, thereby shaping the local immune microenvironment in GBM. Consequently, targeting these key genes might not only inhibit tumor metabolic reprogramming but also remodel the immune landscape, thereby improving therapeutic outcomes.
5. Conclusions
In summary, by integrating large-scale bulk transcriptome analyses (TCGA/CGGA) with single-cell sequencing data, our study elucidates the critical role of mitochondria-associated genes in GBM and highlights the profound impact of the Warburg effect on tumor biology and the immune microenvironment. The mitochondria metabolism gene risk model developed herein offers novel insights into GBM molecular subtyping and prognostic evaluation, and it holds promise for guiding personalized therapeutic decisions. The observed metabolic pathway differences among GBM subtypes suggest that reclassifying patients based on tumor metabolic characteristics could enable more targeted metabolic interventions. Moreover, our in-depth analysis of the interplay between the Warburg effect, tumor stemness, and immune responses provides fresh perspectives for immunotherapy, suggesting that targeting key metabolic genes may concurrently reverse tumor stem-like properties and mitigate immune suppression, ultimately leading to improved treatment efficacy. Overall, our findings offer important insights and a new framework for GBM molecular subtyping, prognostic assessment, and the development of innovative combined metabolic and immune-targeted therapeutic strategies.
Supplementary Materials
The following supporting information can be downloaded at: https://www.mdpi.com/article/doi/s1, Figure S1: title; Table S1: title; Video S1: title.
Author Contributions
Conceptualization, Fangyuan Wang and Chenglin Zhao; methodology, Fangyuan Wang; software, Fangyuan Wang and Chenglin Zhao; validation, Fangyuan Wang, Yupei Guo and Hao Li; formal analysis, Ao Huo; investigation, Bingqi Lu; resources, Minghe Li; data curation, Fangyuan Wang; writing—original draft preparation, Qingyi Wang; writing—review and editing, Zhou Jing; visualization, Fangyuan Wang; supervision, Fangyuan Wang.; project administration, Xudong Fu; funding acquisition, Xudong Fu, Weihua Hu and Wulong Liang. All authors have read and agreed to the published version of the manuscript.
Funding
Please add: This research was funded by Science and Technology Department of Henan Province (Item number: 232102311134), Health Commission of Henan province (Item number: YXKC2022020), National Natural Science Foundation of China (Item number: 82303029), and the Zhengzhou Science and Technology Innovation Project for Healthcare (Item number: 2024YLZDJH027).
Institutional Review Board Statement
No new human participants were directly involved in this study. All data utilized were obtained from publicly accessible databases (TCGA, CGGA, and GEO), which have existing ethics approvals or consent protocols in place. Accordingly, additional institutional review board approval or individual participant consent was not required for this analysis.
Informed Consent Statement
Not applicable.
Data Availability Statement
The single-cell RNA-seq dataset supporting the findings of this study is publicly available at the Gene Expression Omnibus (GEO) under accession number GSE139448. The bulk RNA-seq data and corresponding clinical information for glioblastoma (GBM) were obtained from The Cancer Genome Atlas (TCGA) database (specifically, the TCGA-GBM project) via the NCI Genomic Data Commons (GDC) portal (https://portal.gdc.cancer.gov/). Additional GBM expression and clinical data were acquired from the Chinese Glioma Genome Atlas (CGGA) (http://www.cgga.org.cn/). The list of human mitochondria-associated genes was retrieved from MitoCarta3.0 (https://www.broadinstitute.org/mitocarta). All datasets and resources are publicly accessible, and details regarding data processing and analysis steps are provided within the article. Further information is available from the corresponding author upon reasonable request.
Acknowledgments
Not applicable.
Conflicts of Interest
The authors declare no conflicts of interest.
Appendix A
Figure A1.
a) Confidence intervals of each lambda value during LASSO variable selection; (b) Trajectories of variable coefficients plotted against log(lambda).
Figure A1.
a) Confidence intervals of each lambda value during LASSO variable selection; (b) Trajectories of variable coefficients plotted against log(lambda).
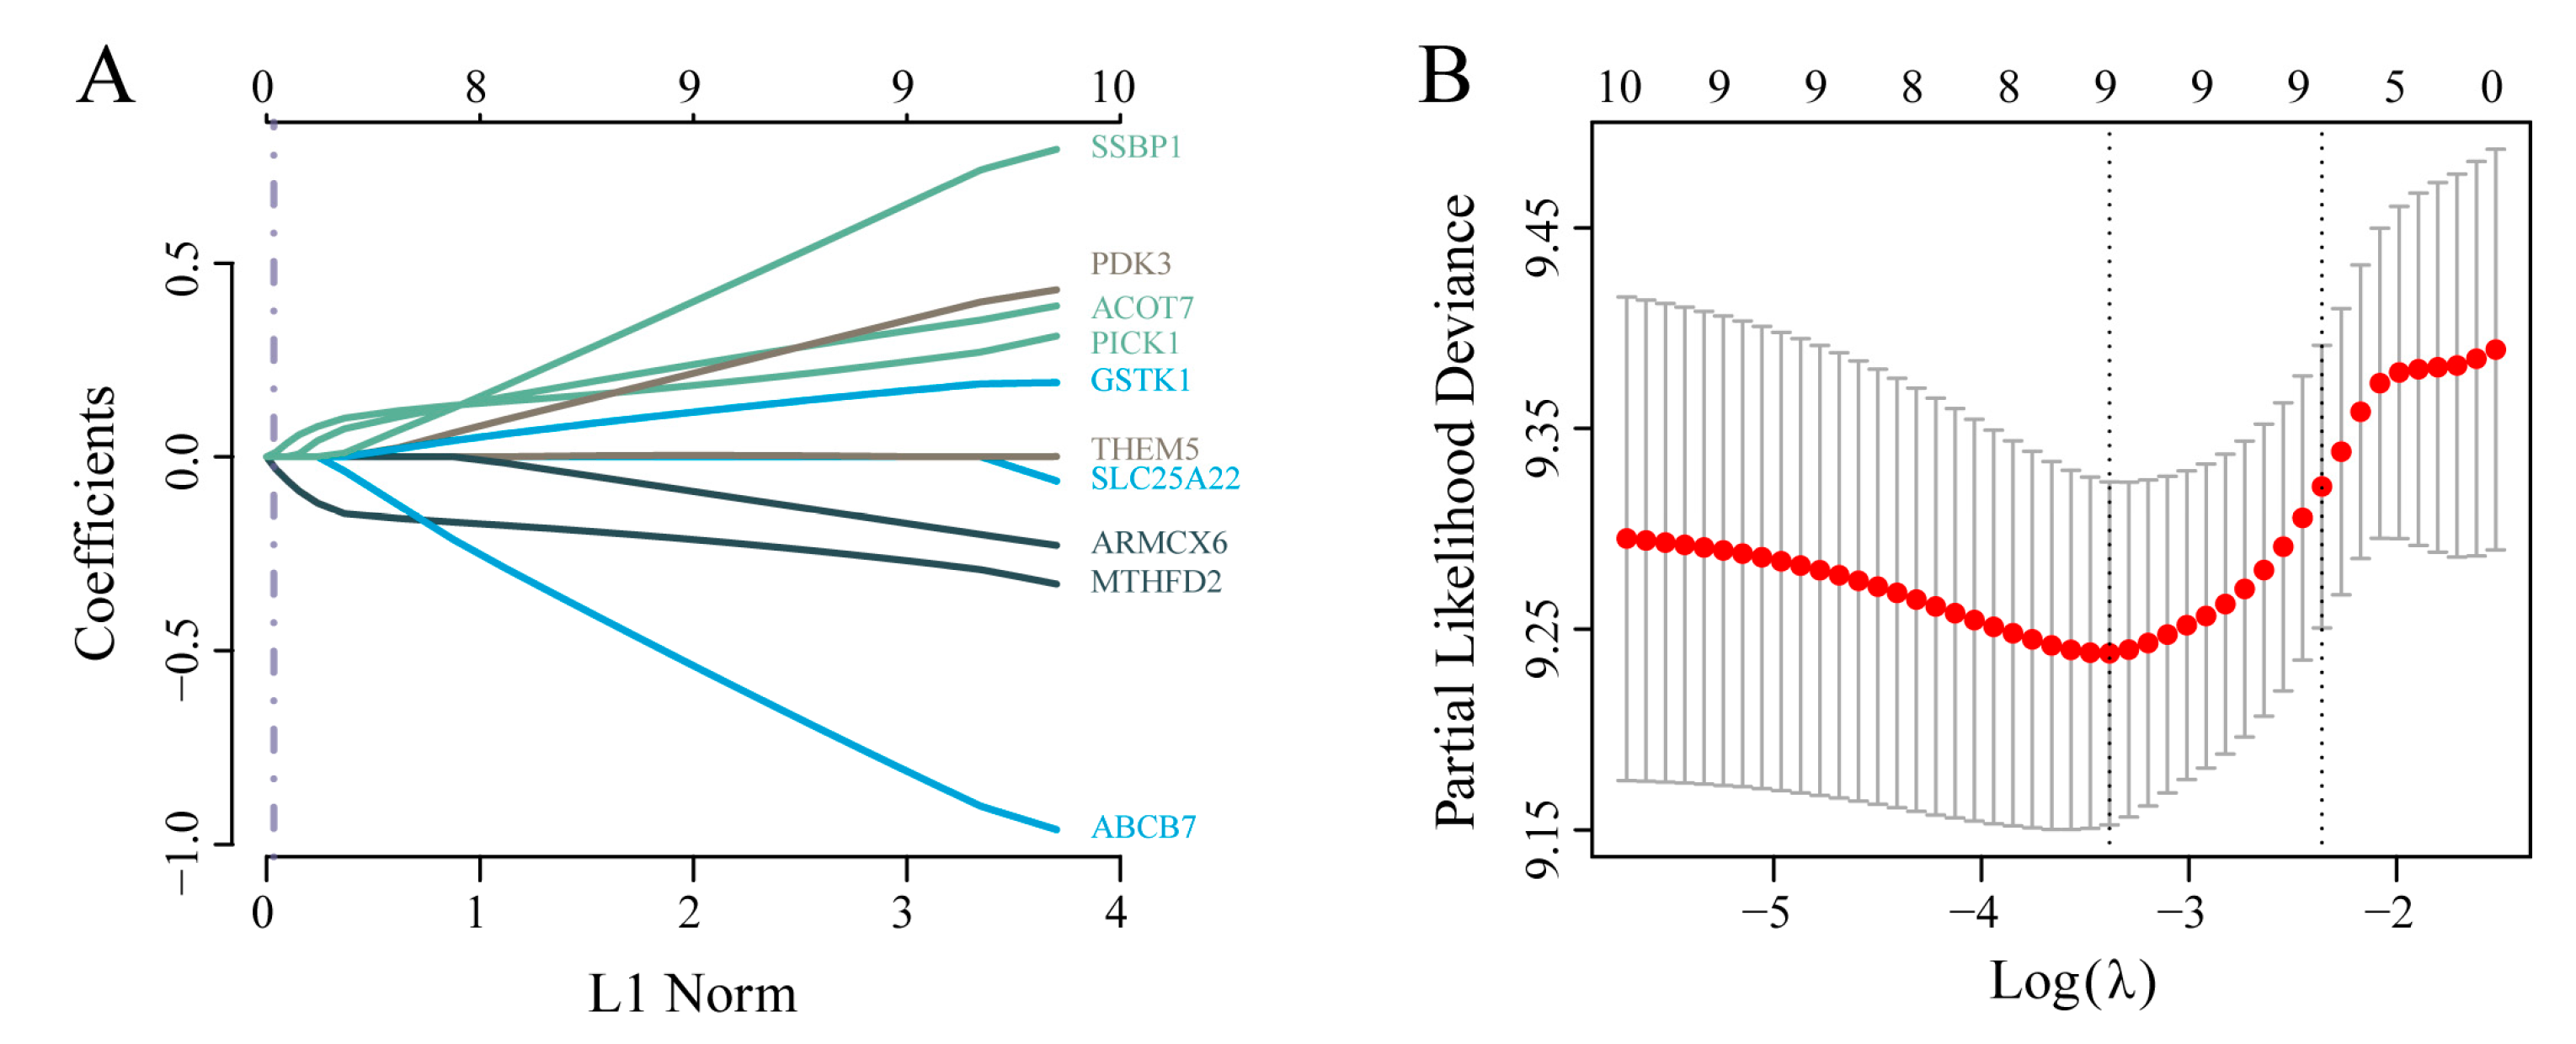
Figure A2.
Assessments of gene and mitochondrial content from single-cell data.
References
- Szymon Grochans, Anna Maria Cybulska, Donata Simińska, Jan Korbecki, Klaudyna Kojder, Dariusz Chlubek, and Irena Baranowska-Bosiacka (2022). Epidemiology of Glioblastoma Multiforme-Literature Review. Cancers.
- Ashley Irin Cortes Ballen, Maryam Amosu, Surya Ravinder, Joey Chan, Emre Derin, Hasan Slika, and Betty Tyler (2024). Metabolic Reprogramming in Glioblastoma Multiforme: A Review of Pathways and Therapeutic Targets. Cells.
- Lidia Gatto, Vincenzo Di Nunno, Anna Ghelardini, Alicia Tosoni, Stefania Bartolini, Sofia Asioli, Stefano Ratti, Anna Luisa Di Stefano, and Enrico Franceschi (2024). Targeting Mitochondria in Glioma: New Hopes for a Cure. Biomedicines.
- Liwen Chen, Hui Zhang, Chao Shang, and Yang Hong (2024). The Role and Applied Value of Mitochondria in Glioma-Related Research. CNS neuroscience & therapeutics.
- Quinn, T. Ostrom, Nirav Patil, Gino Cioffi, Kristin Waite, Carol Kruchko, and Jill S. Barnholtz-Sloan (2020). CBTRUS Statistical Report: Primary Brain and Other Central Nervous System Tumors Diagnosed in the United States in 2013-2017. Neuro-Oncology.
- Aaron, C. Tan, David M. Ashley, Giselle Y. López, Michael Malinzak, Henry S. Friedman, and Mustafa Khasraw (2020). Management of glioblastoma: State of the art and future directions. CA: a cancer journal for clinicians.
- Antonio Omuro, and Lisa M. DeAngelis (2013). Glioblastoma and other malignant gliomas: a clinical review. JAMA.
- Mary Elizabeth Davis (2016). Glioblastoma: Overview of Disease and Treatment. Clinical Journal of Oncology Nursing.
- Edoardo Gaude, and Christian Frezza (2014). Defects in mitochondrial metabolism and cancer. Cancer & Metabolism.
- Sejal Vyas, Elma Zaganjor, and Marcia C. Haigis (2016). Mitochondria and Cancer. Cell.
- Kristina, M. Cook, Han Shen, Kelly J. McKelvey, Harriet E. Gee, and Eric Hau (2021). Targeting Glucose Metabolism of Cancer Cells with Dichloroacetate to Radiosensitize High-Grade Gliomas. International Journal of Molecular Sciences.
- Matthew, G. Vander Heiden, Lewis C. Cantley, and Craig B. Thompson (2009). Understanding the Warburg effect: the metabolic requirements of cell proliferation. Science (New York, N.Y.).
- Shuai Wang, Tengfei Huang, Qiulian Wu, Huairui Yuan, Xujia Wu, Fanen Yuan, Tingting Duan, Suchet Taori, Yingming Zhao, Nathaniel W. Snyder, Dimitris G. Placantonakis, and Jeremy N. Rich (2024). Lactate reprograms glioblastoma immunity through CBX3-regulated histone lactylation. The Journal of Clinical Investigation.
- Miran Jang, Sung Soo Kim, and Jinhwa Lee (2013). Cancer cell metabolism: implications for therapeutic targets. Experimental & Molecular Medicine.
Figure 1.
Identification of Differentially Prognostic Mitochondria-Associated Genes. (a) Volcano plot showing the differential expression of mitochondria-associated genes between GBM and control samples; (b) Forest plot of the top 20 prognostically significant mitochondria-associated genes; (c) Venn diagram illustrating the selection of 10 differentially prognostic genes.
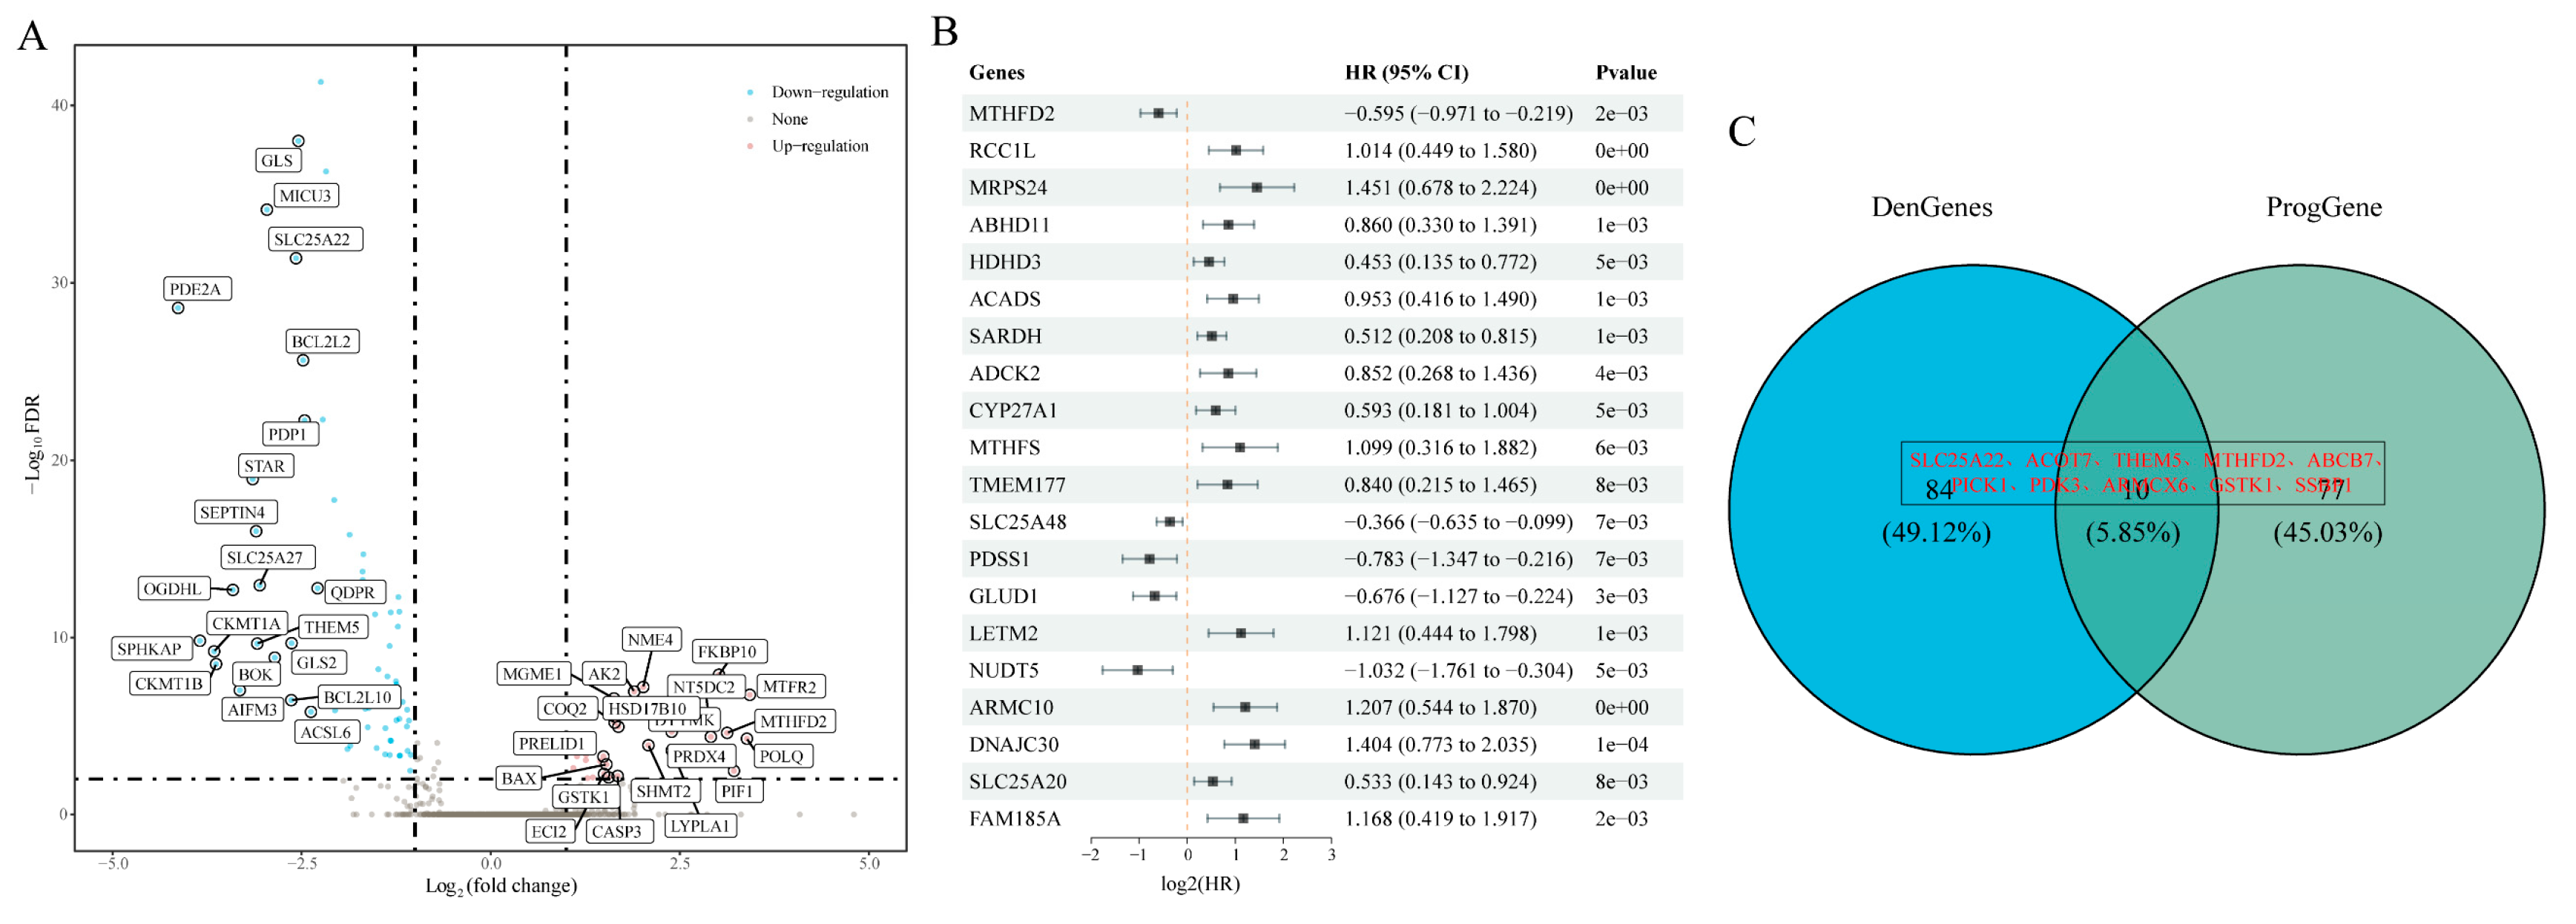
Figure 2.
Construction and Validation of the Predictive Risk Model. (a,c,e) In the training cohort: distribution of the risk model with corresponding survival status and expression patterns of the 9 genes, KM survival curves, and ROC curves with AUC; (b,d,f) In the external validation cohort: similar analyses depicting survival status, gene expression, KM survival curves, and ROC curves with AUC.
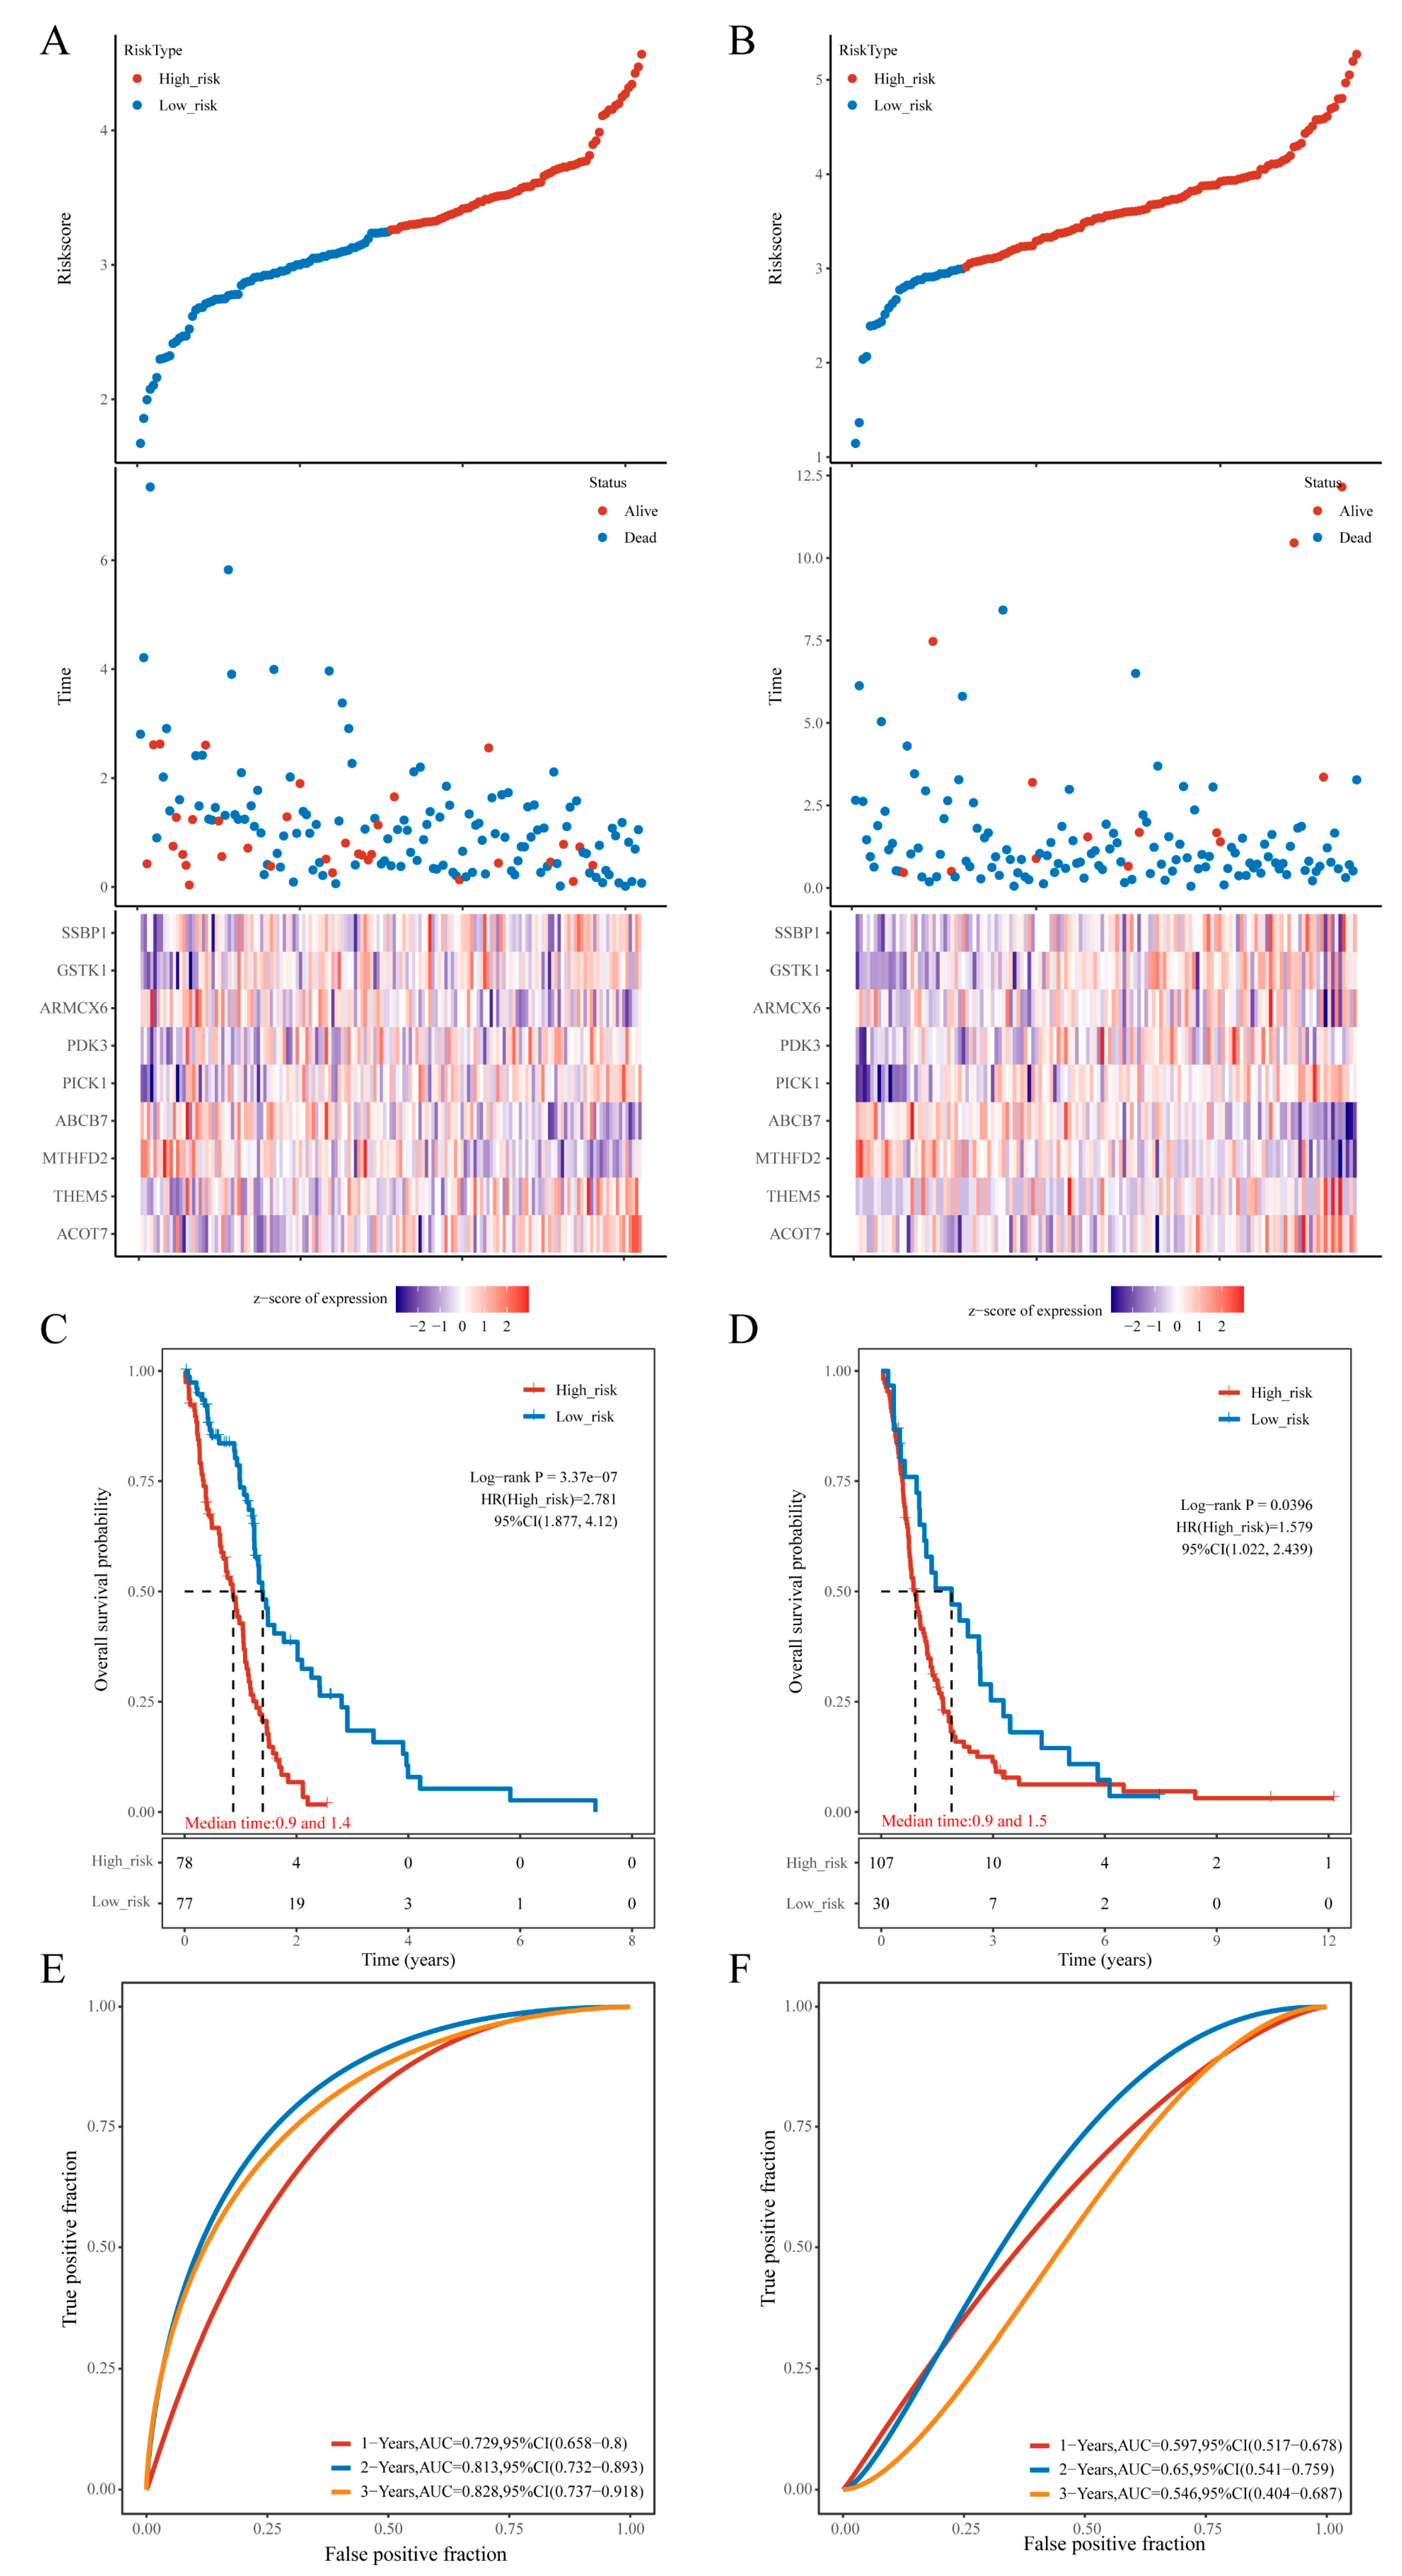
Figure 3.
Nomogram Construction for GBM Survival Prediction. (a,b) Forest plots of univariate and multivariate Cox regression analyses; (c) The nomogram based on the 9-gene risk score; (d) Calibration curves; (e) KM survival curves; (f) ROC curves for the nomogram.
Figure 3.
Nomogram Construction for GBM Survival Prediction. (a,b) Forest plots of univariate and multivariate Cox regression analyses; (c) The nomogram based on the 9-gene risk score; (d) Calibration curves; (e) KM survival curves; (f) ROC curves for the nomogram.
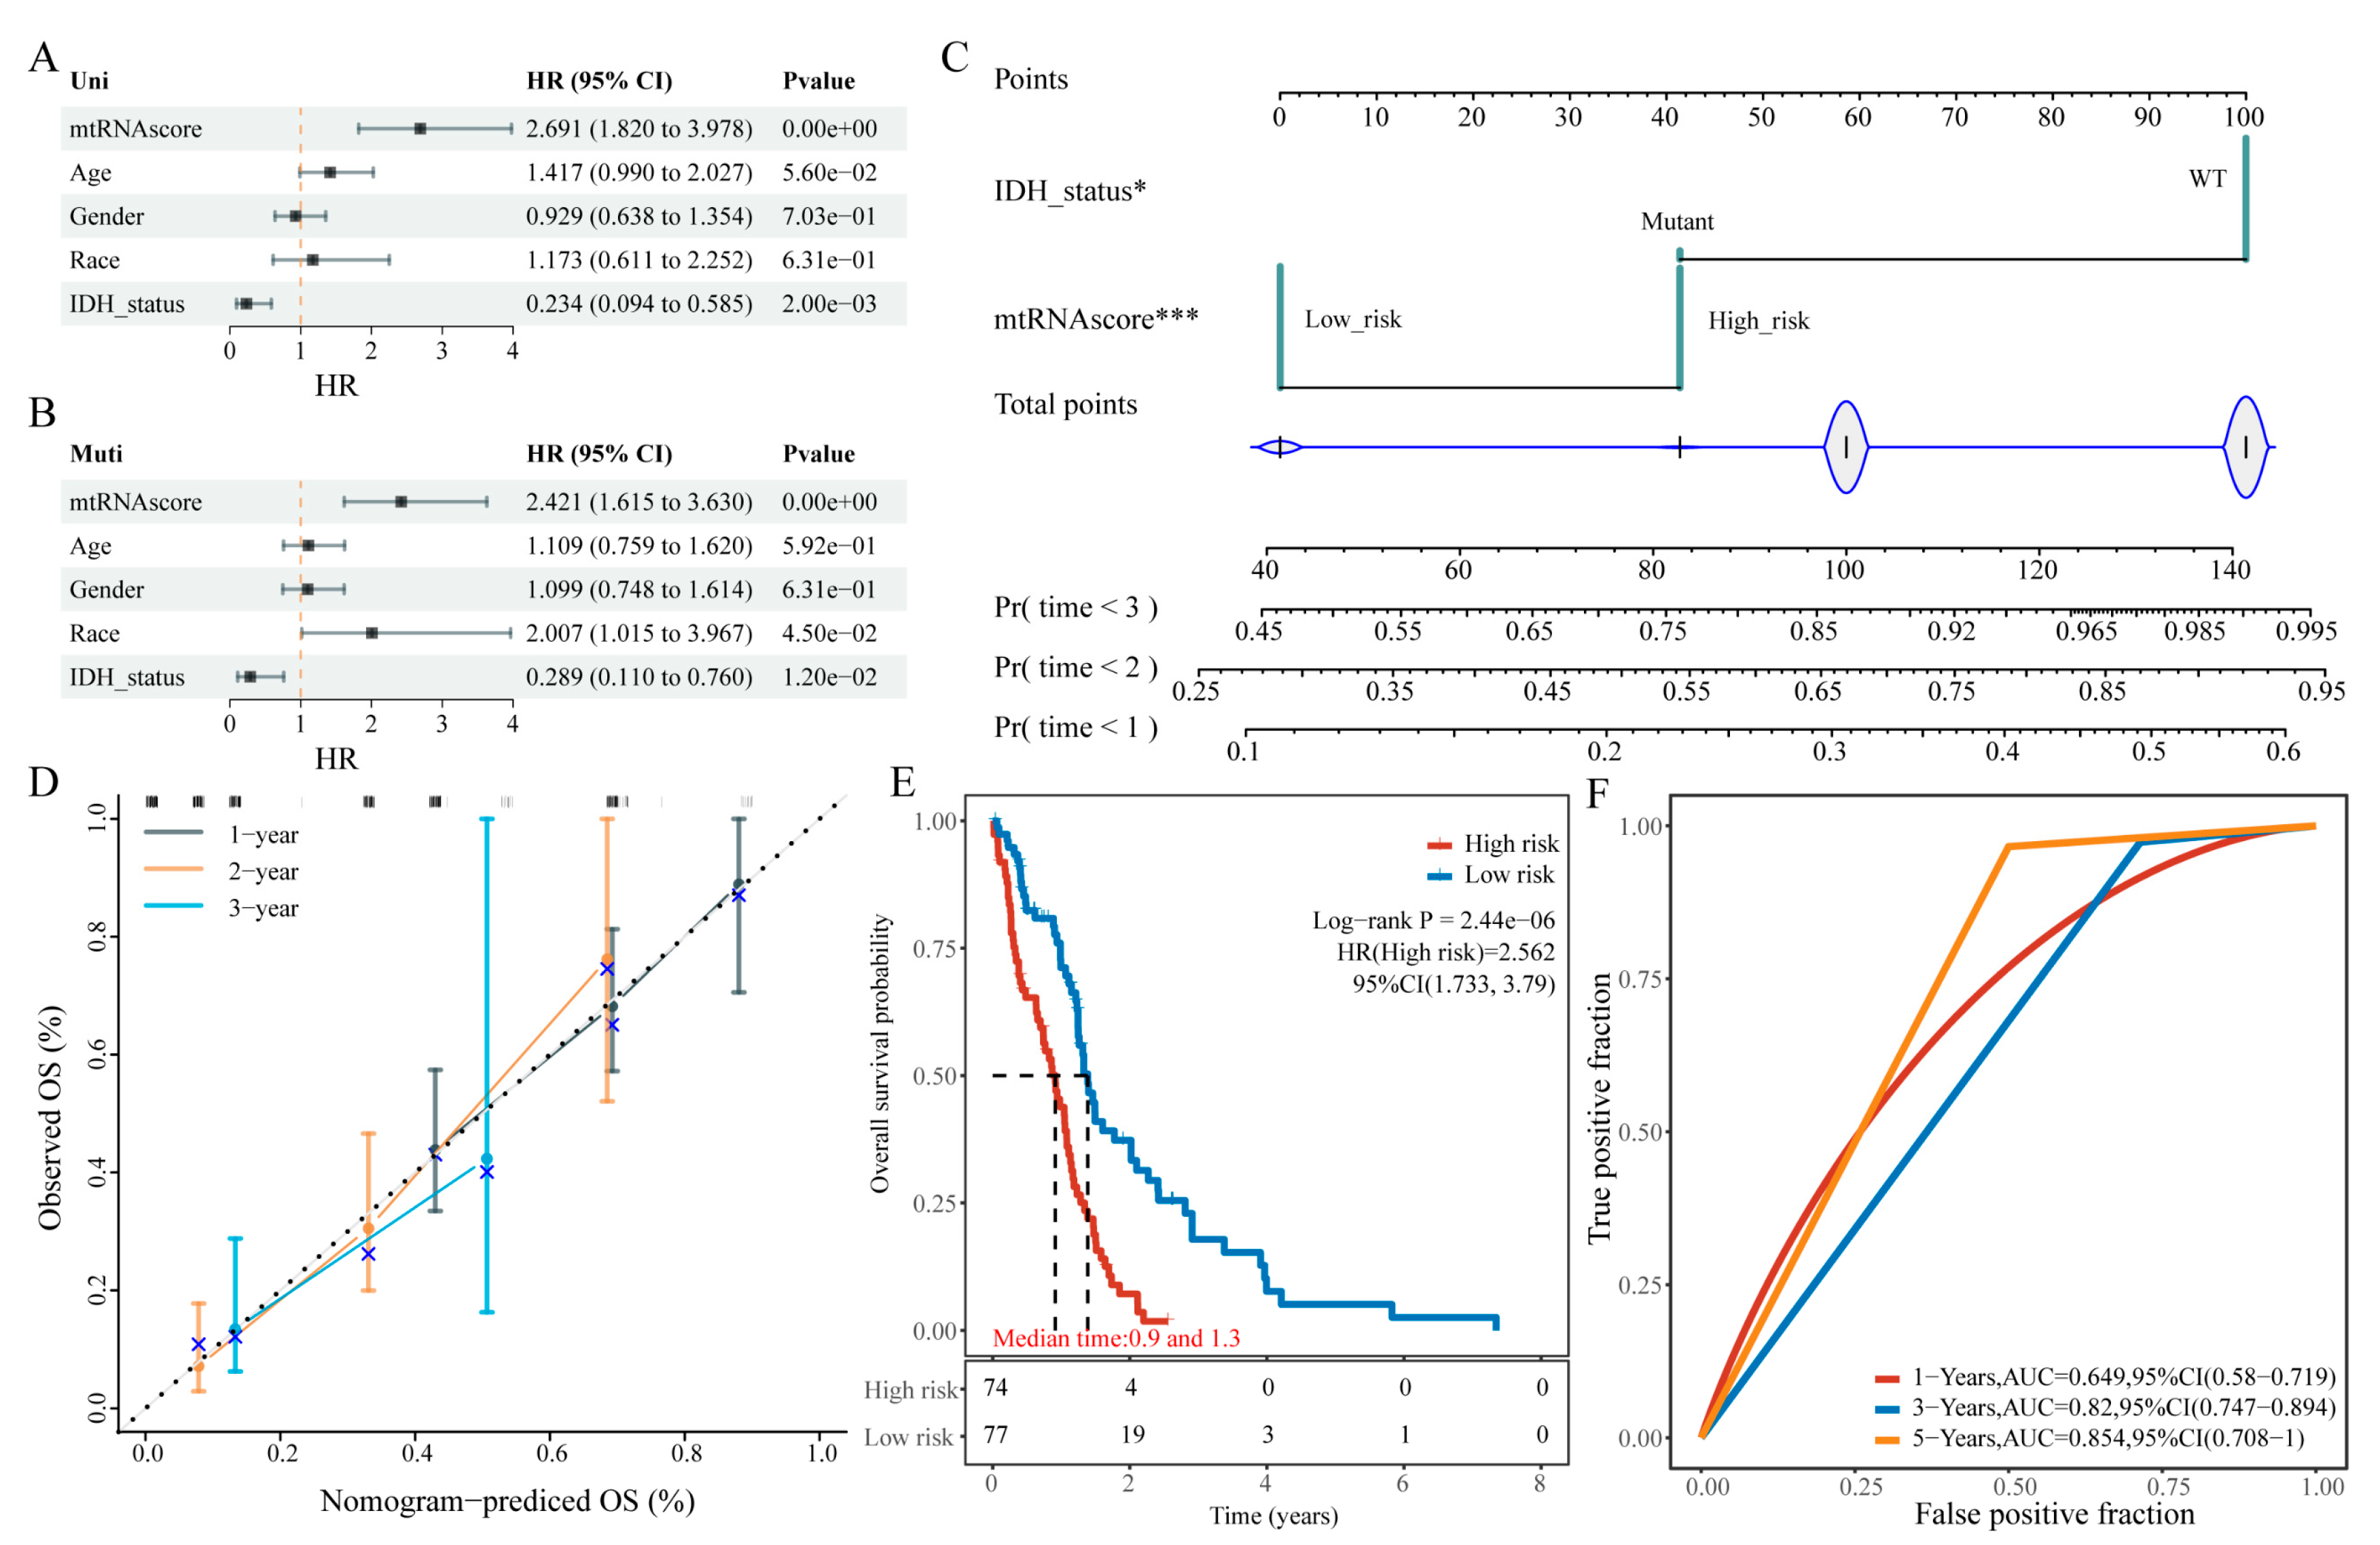
Figure 4.
Classification of GBM Samples Based on Mitochondria-Associated Genes. (a)–(e) Cumulative distribution function (CDF) curves and corresponding area under the CDF curves for k = 2–10, with heatmaps for clustering into 2, 3, 4, and 5 subgroups; (f) KM survival curves comparing the two clusters.
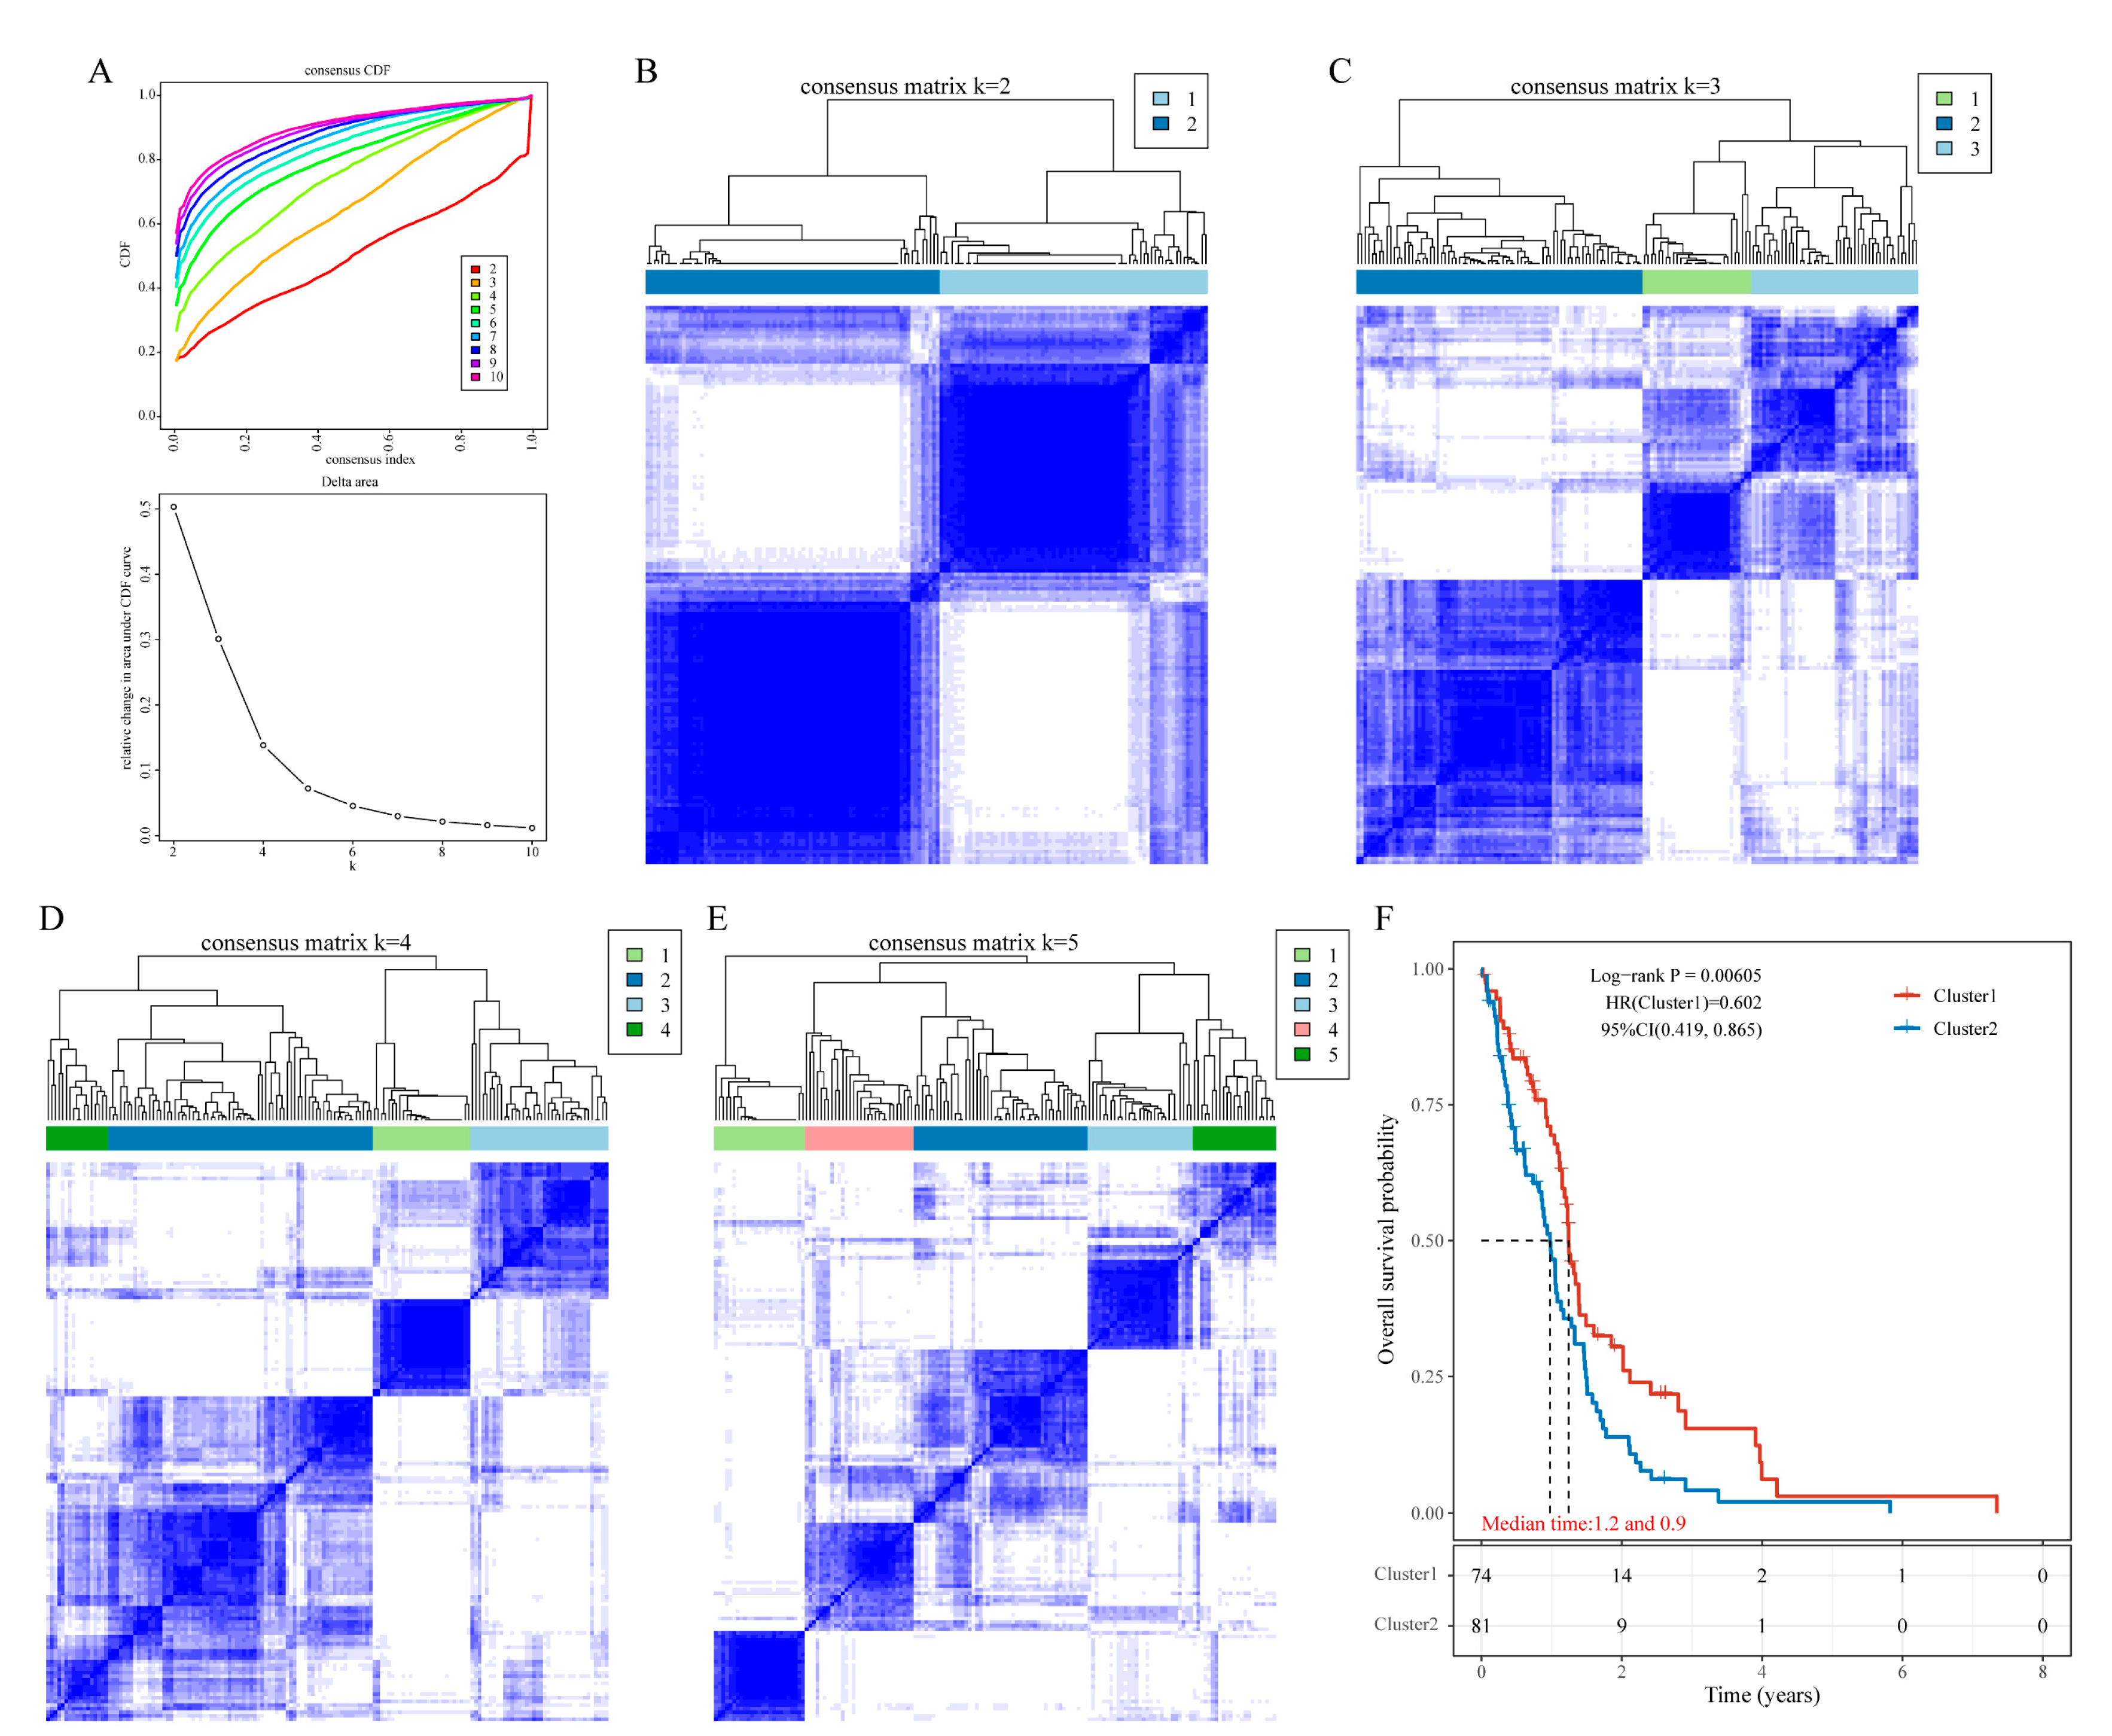
Figure 5.
Functional Analysis. (a) GO enrichment analysis of DEGs between subgroups; (b) KEGG enrichment analysis; (c) GSVA results; (d) GSEA enrichment of Warburg-related pathways.
Figure 5.
Functional Analysis. (a) GO enrichment analysis of DEGs between subgroups; (b) KEGG enrichment analysis; (c) GSVA results; (d) GSEA enrichment of Warburg-related pathways.
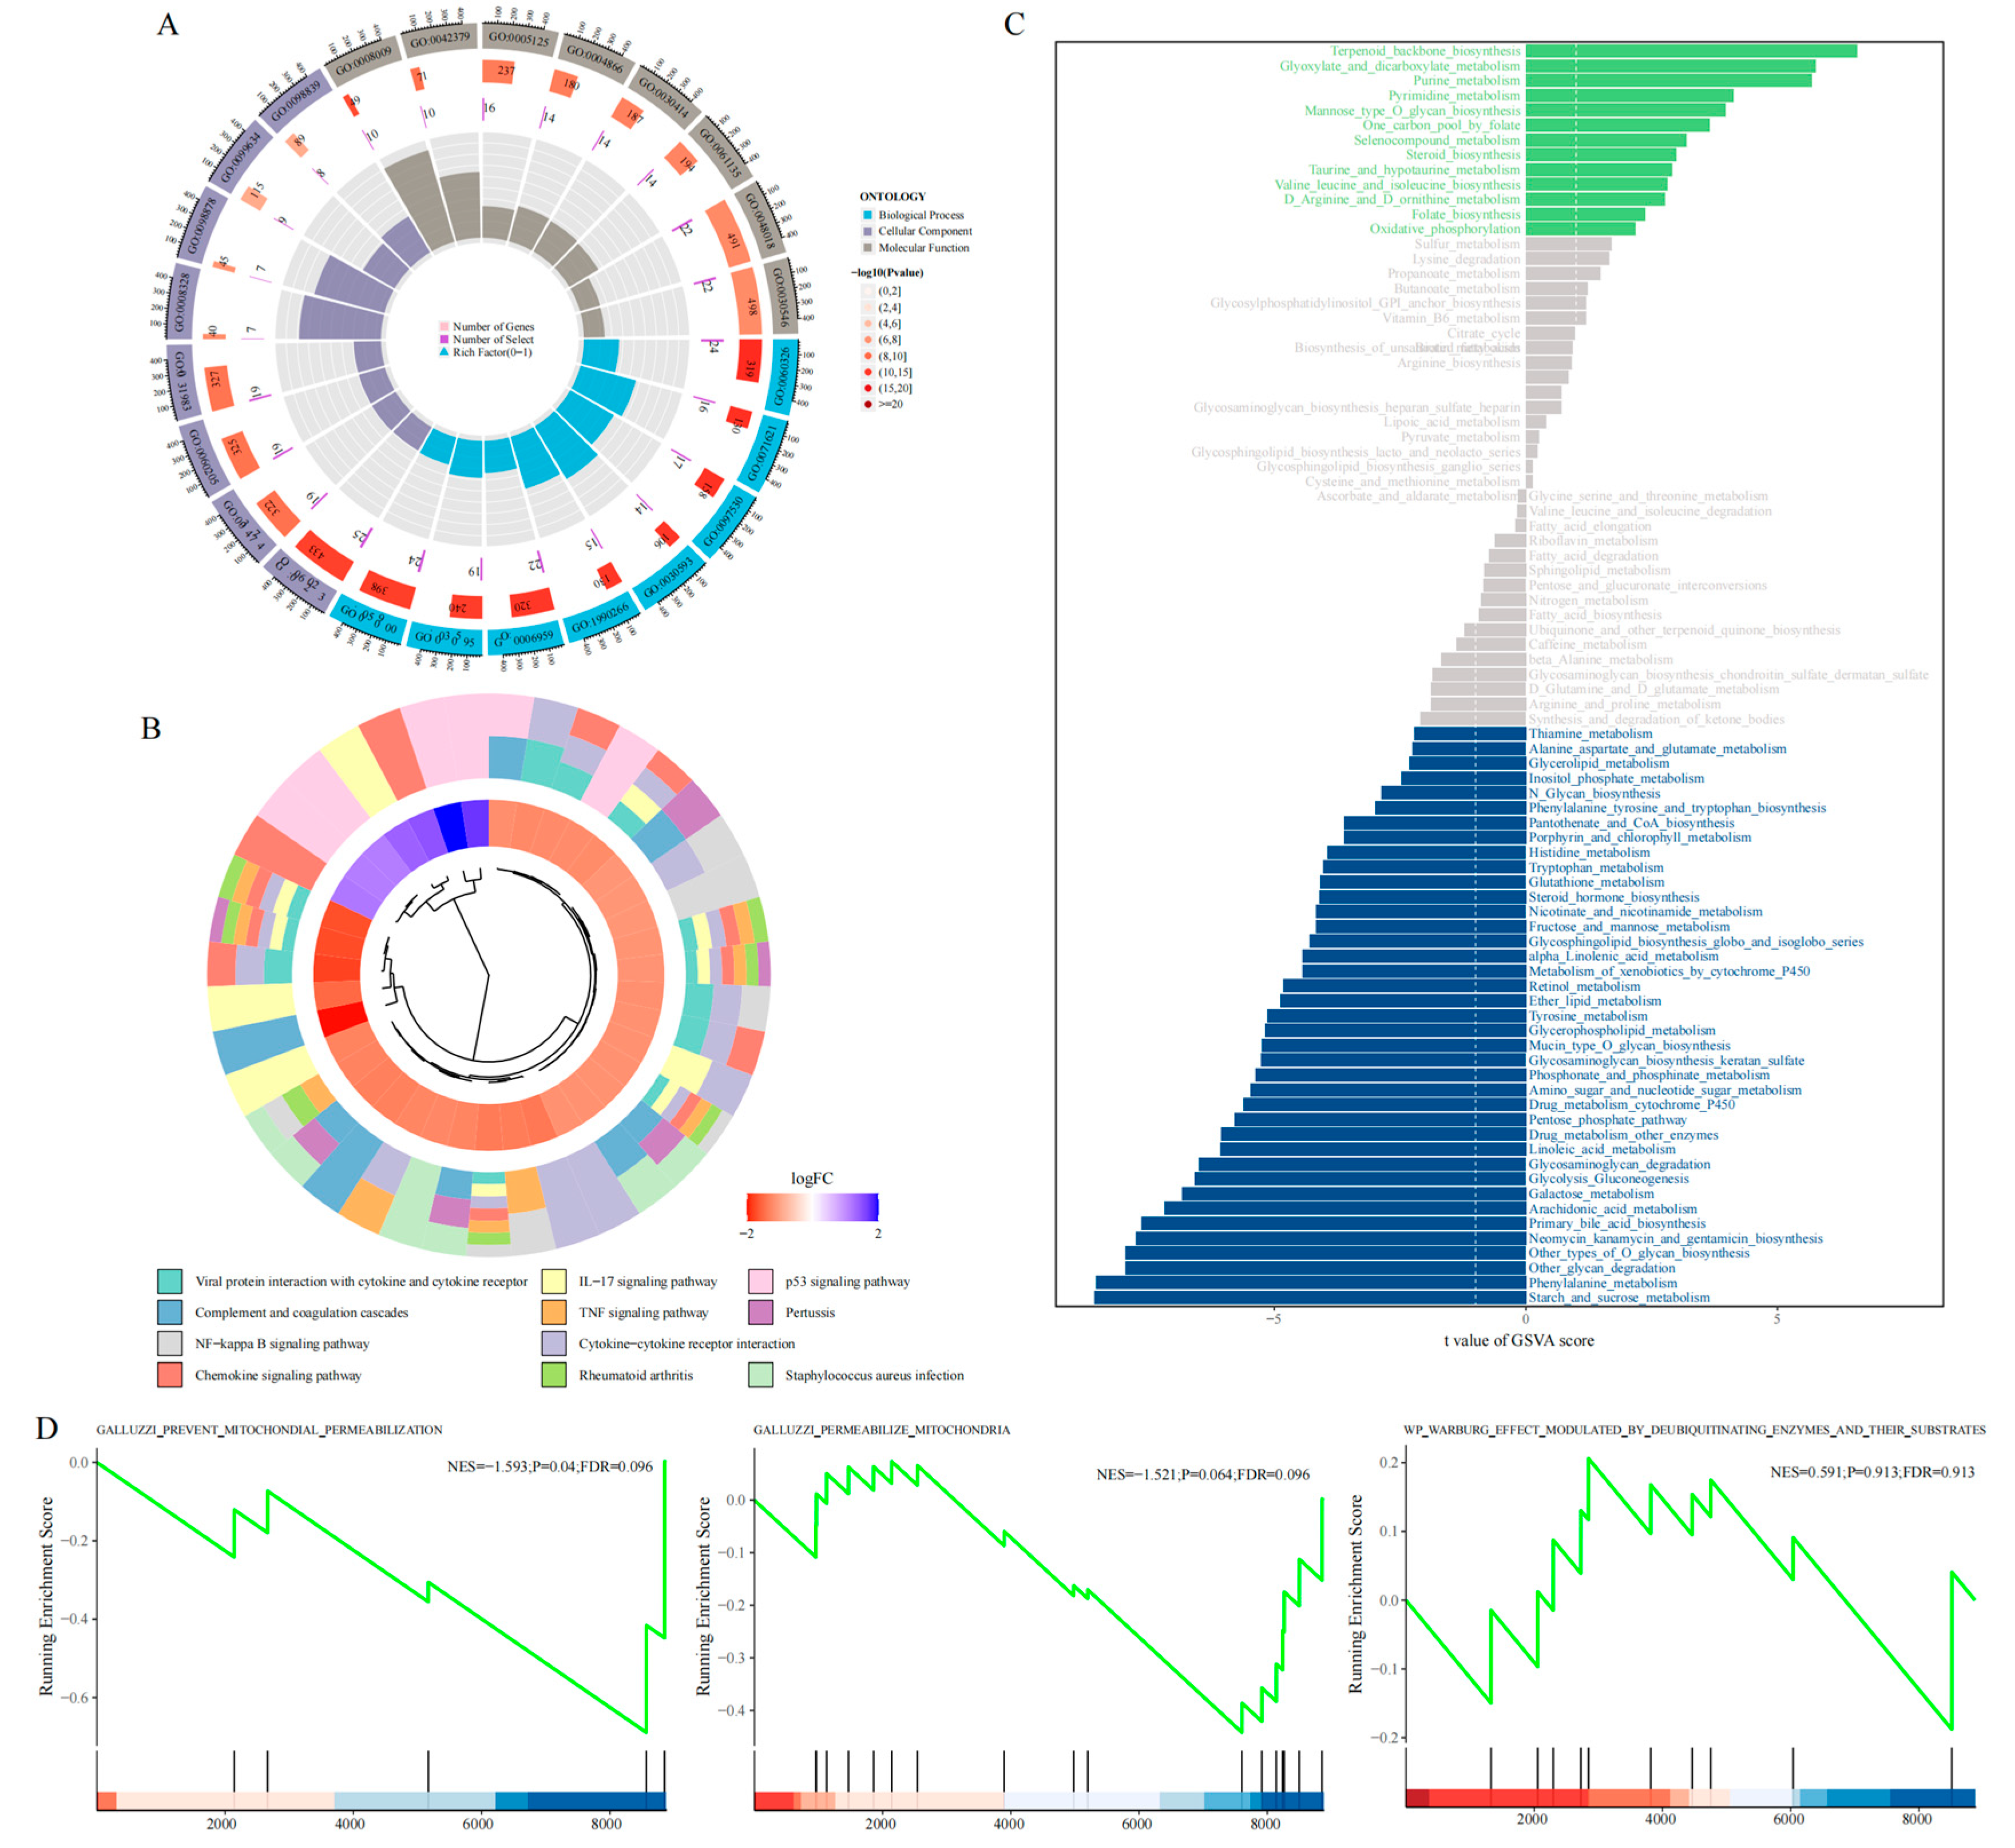
Figure 6.
(a,b) Expression profiles of the 74 Warburg effect-related genes across different clusters; (c) KM survival curves for these genes in relation to OS.
Figure 6.
(a,b) Expression profiles of the 74 Warburg effect-related genes across different clusters; (c) KM survival curves for these genes in relation to OS.
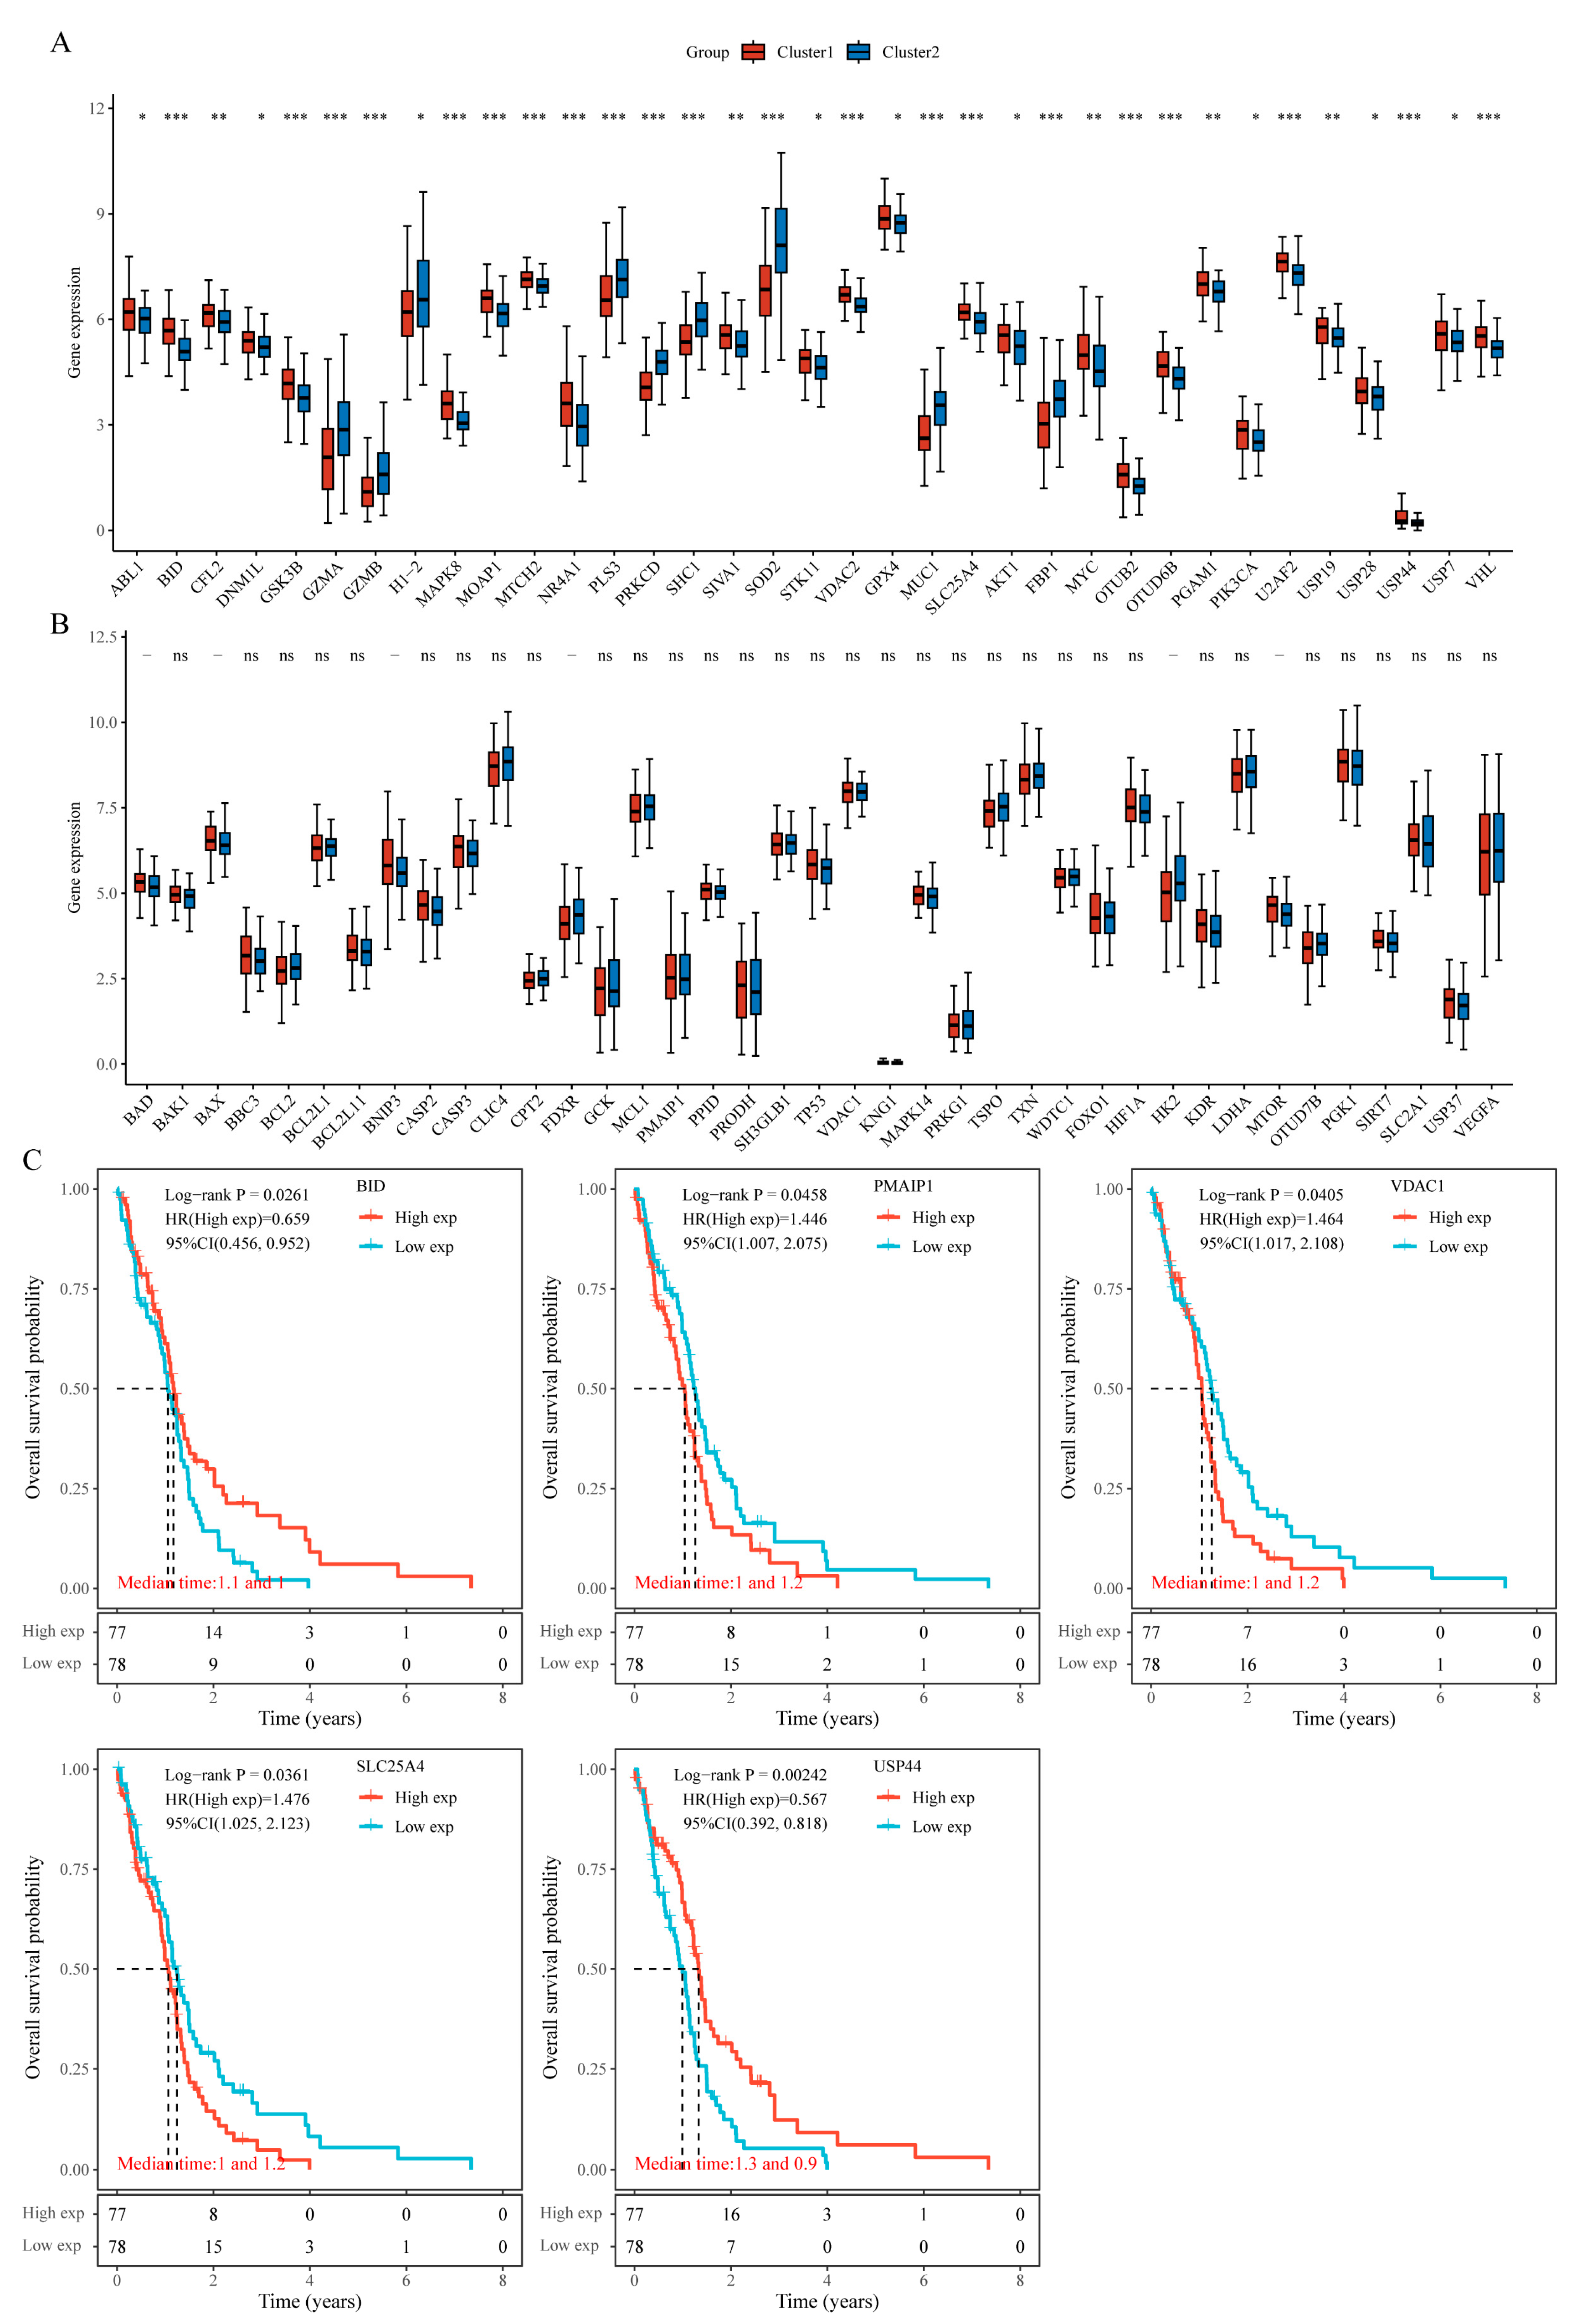
Figure 7.
Single-Cell Data Processing and Annotation. (a) Cell distribution across the three samples; (b) UMAP plot of 17 clusters; (c) Cell type classification; (d) Annotated cell clusters.
Figure 7.
Single-Cell Data Processing and Annotation. (a) Cell distribution across the three samples; (b) UMAP plot of 17 clusters; (c) Cell type classification; (d) Annotated cell clusters.
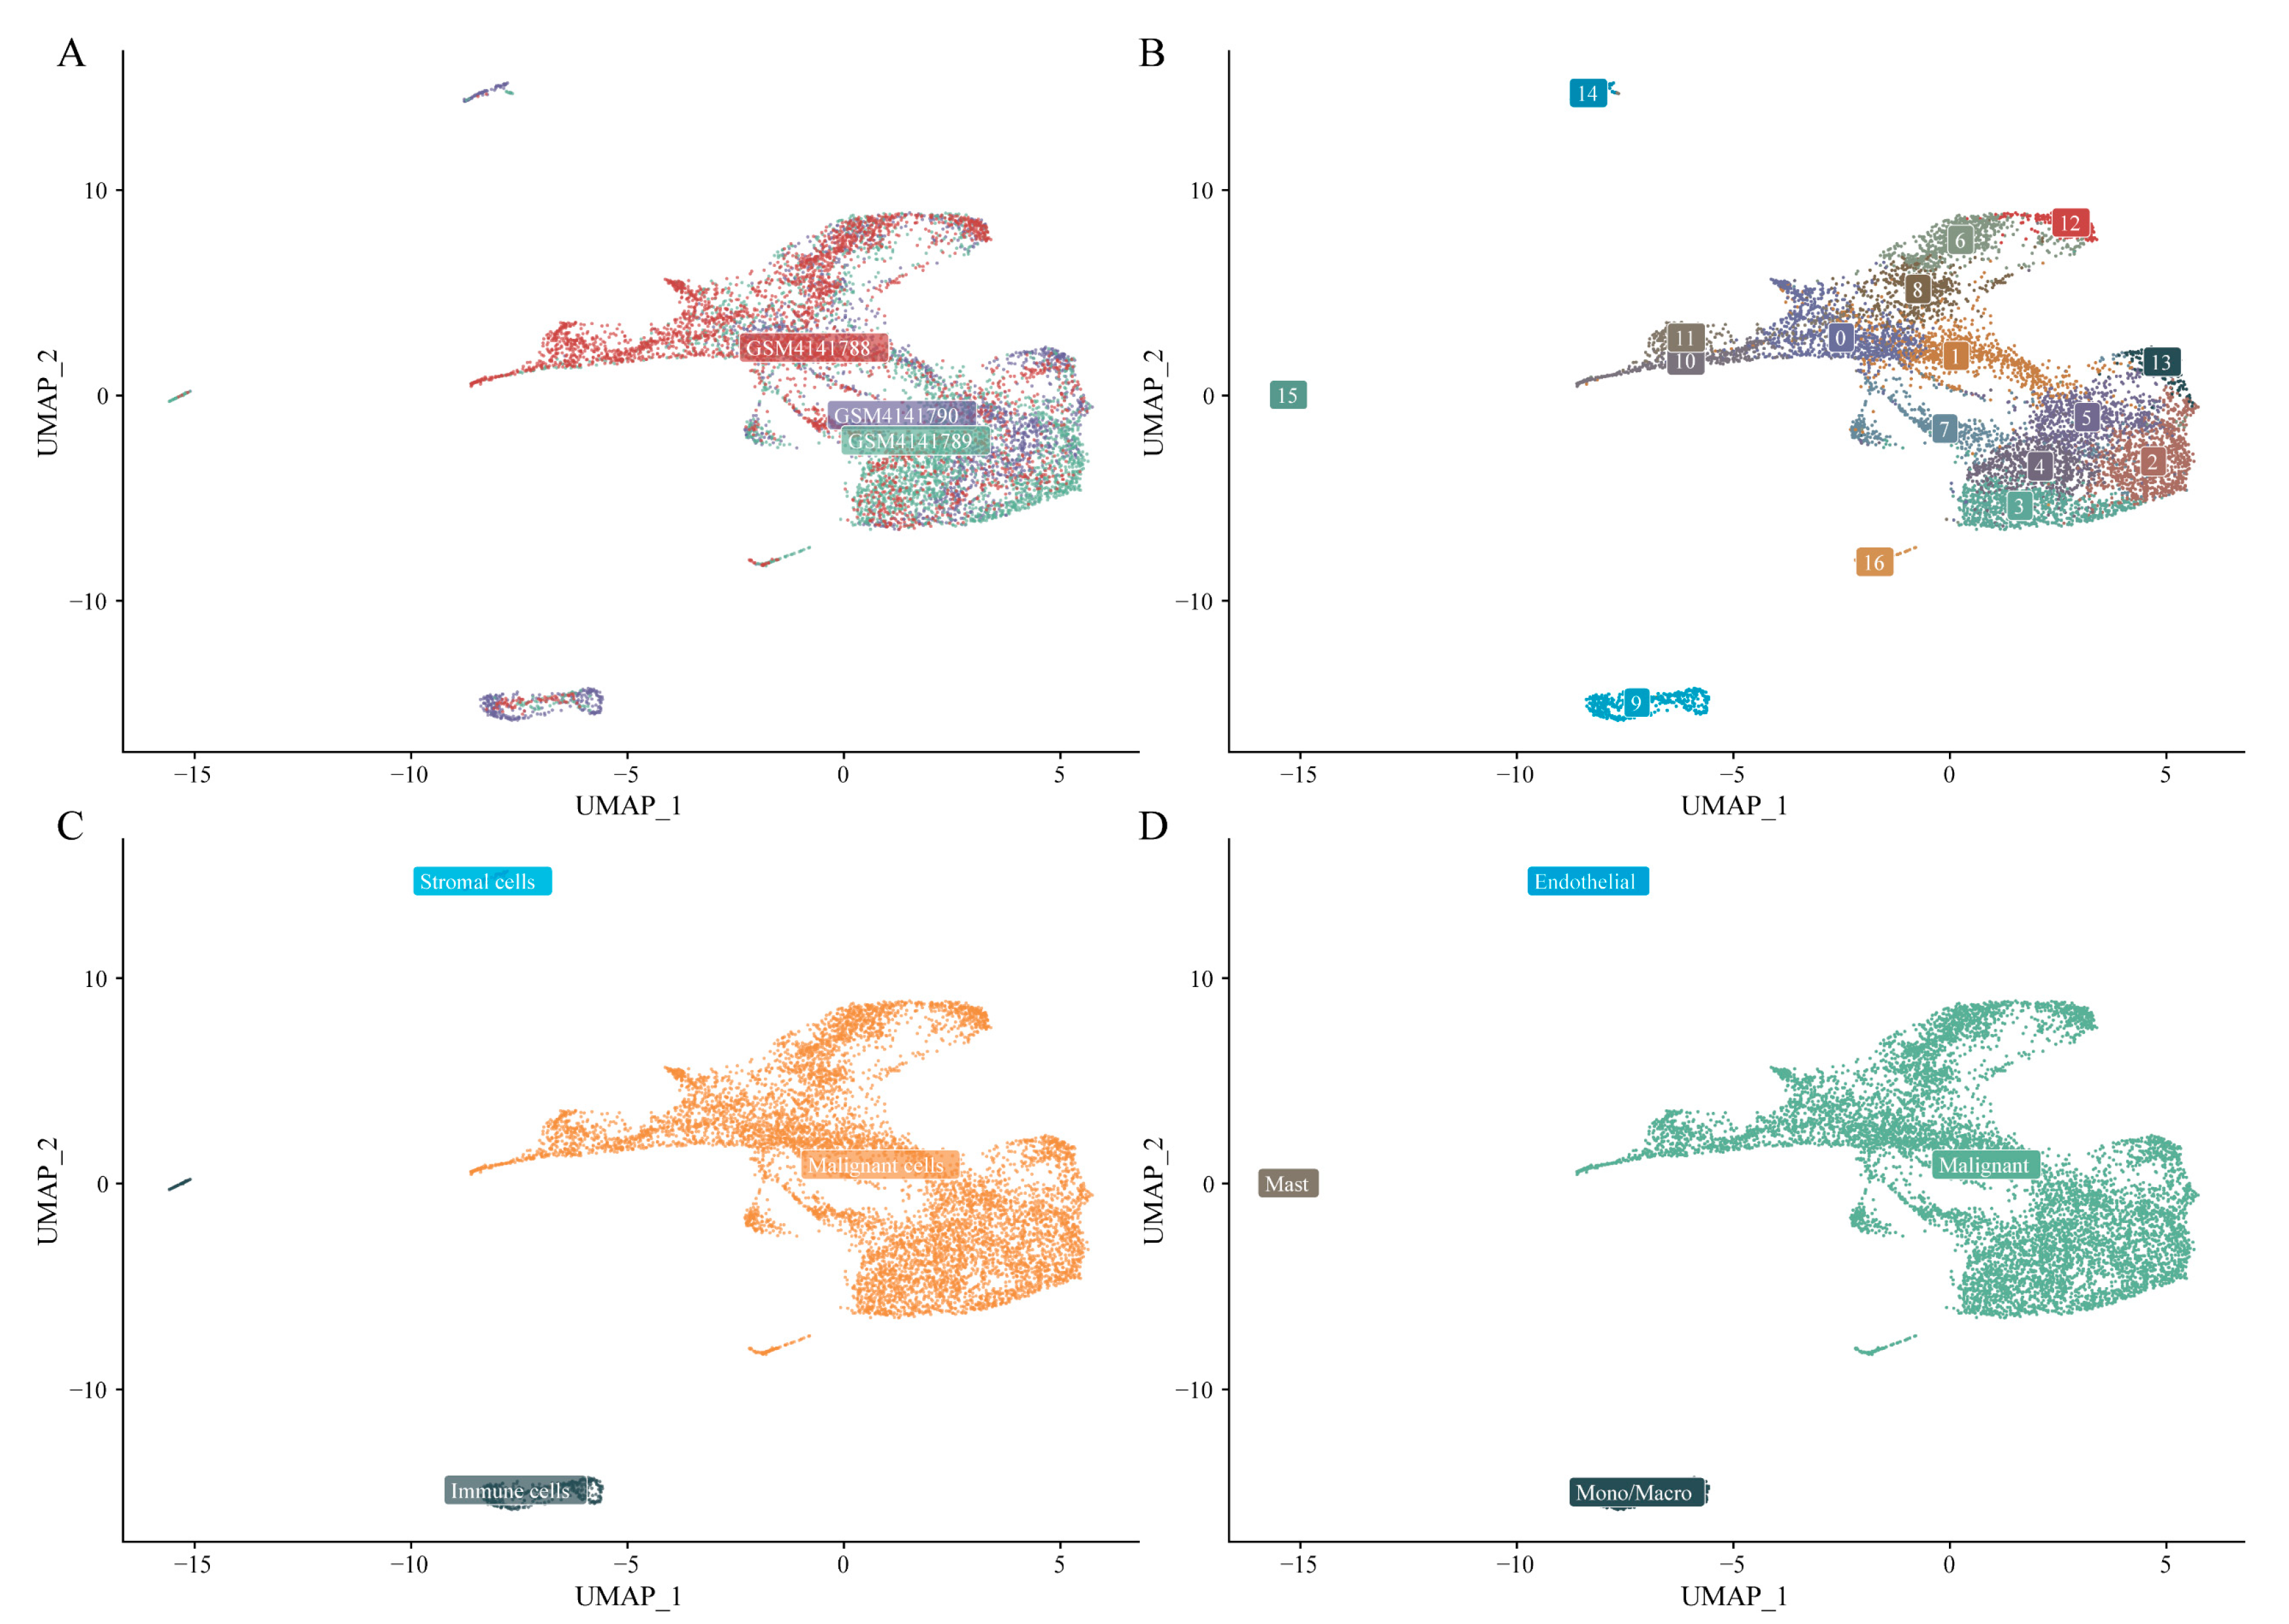
Figure 8.
Differential Expression of Mitochondria-Associated and Warburg Effect-Related Genes Across Cell Types. (a,b) Expression patterns of mitochondria-associated genes; (c,d) Expression patterns of Warburg effect-related genes.
Figure 8.
Differential Expression of Mitochondria-Associated and Warburg Effect-Related Genes Across Cell Types. (a,b) Expression patterns of mitochondria-associated genes; (c,d) Expression patterns of Warburg effect-related genes.
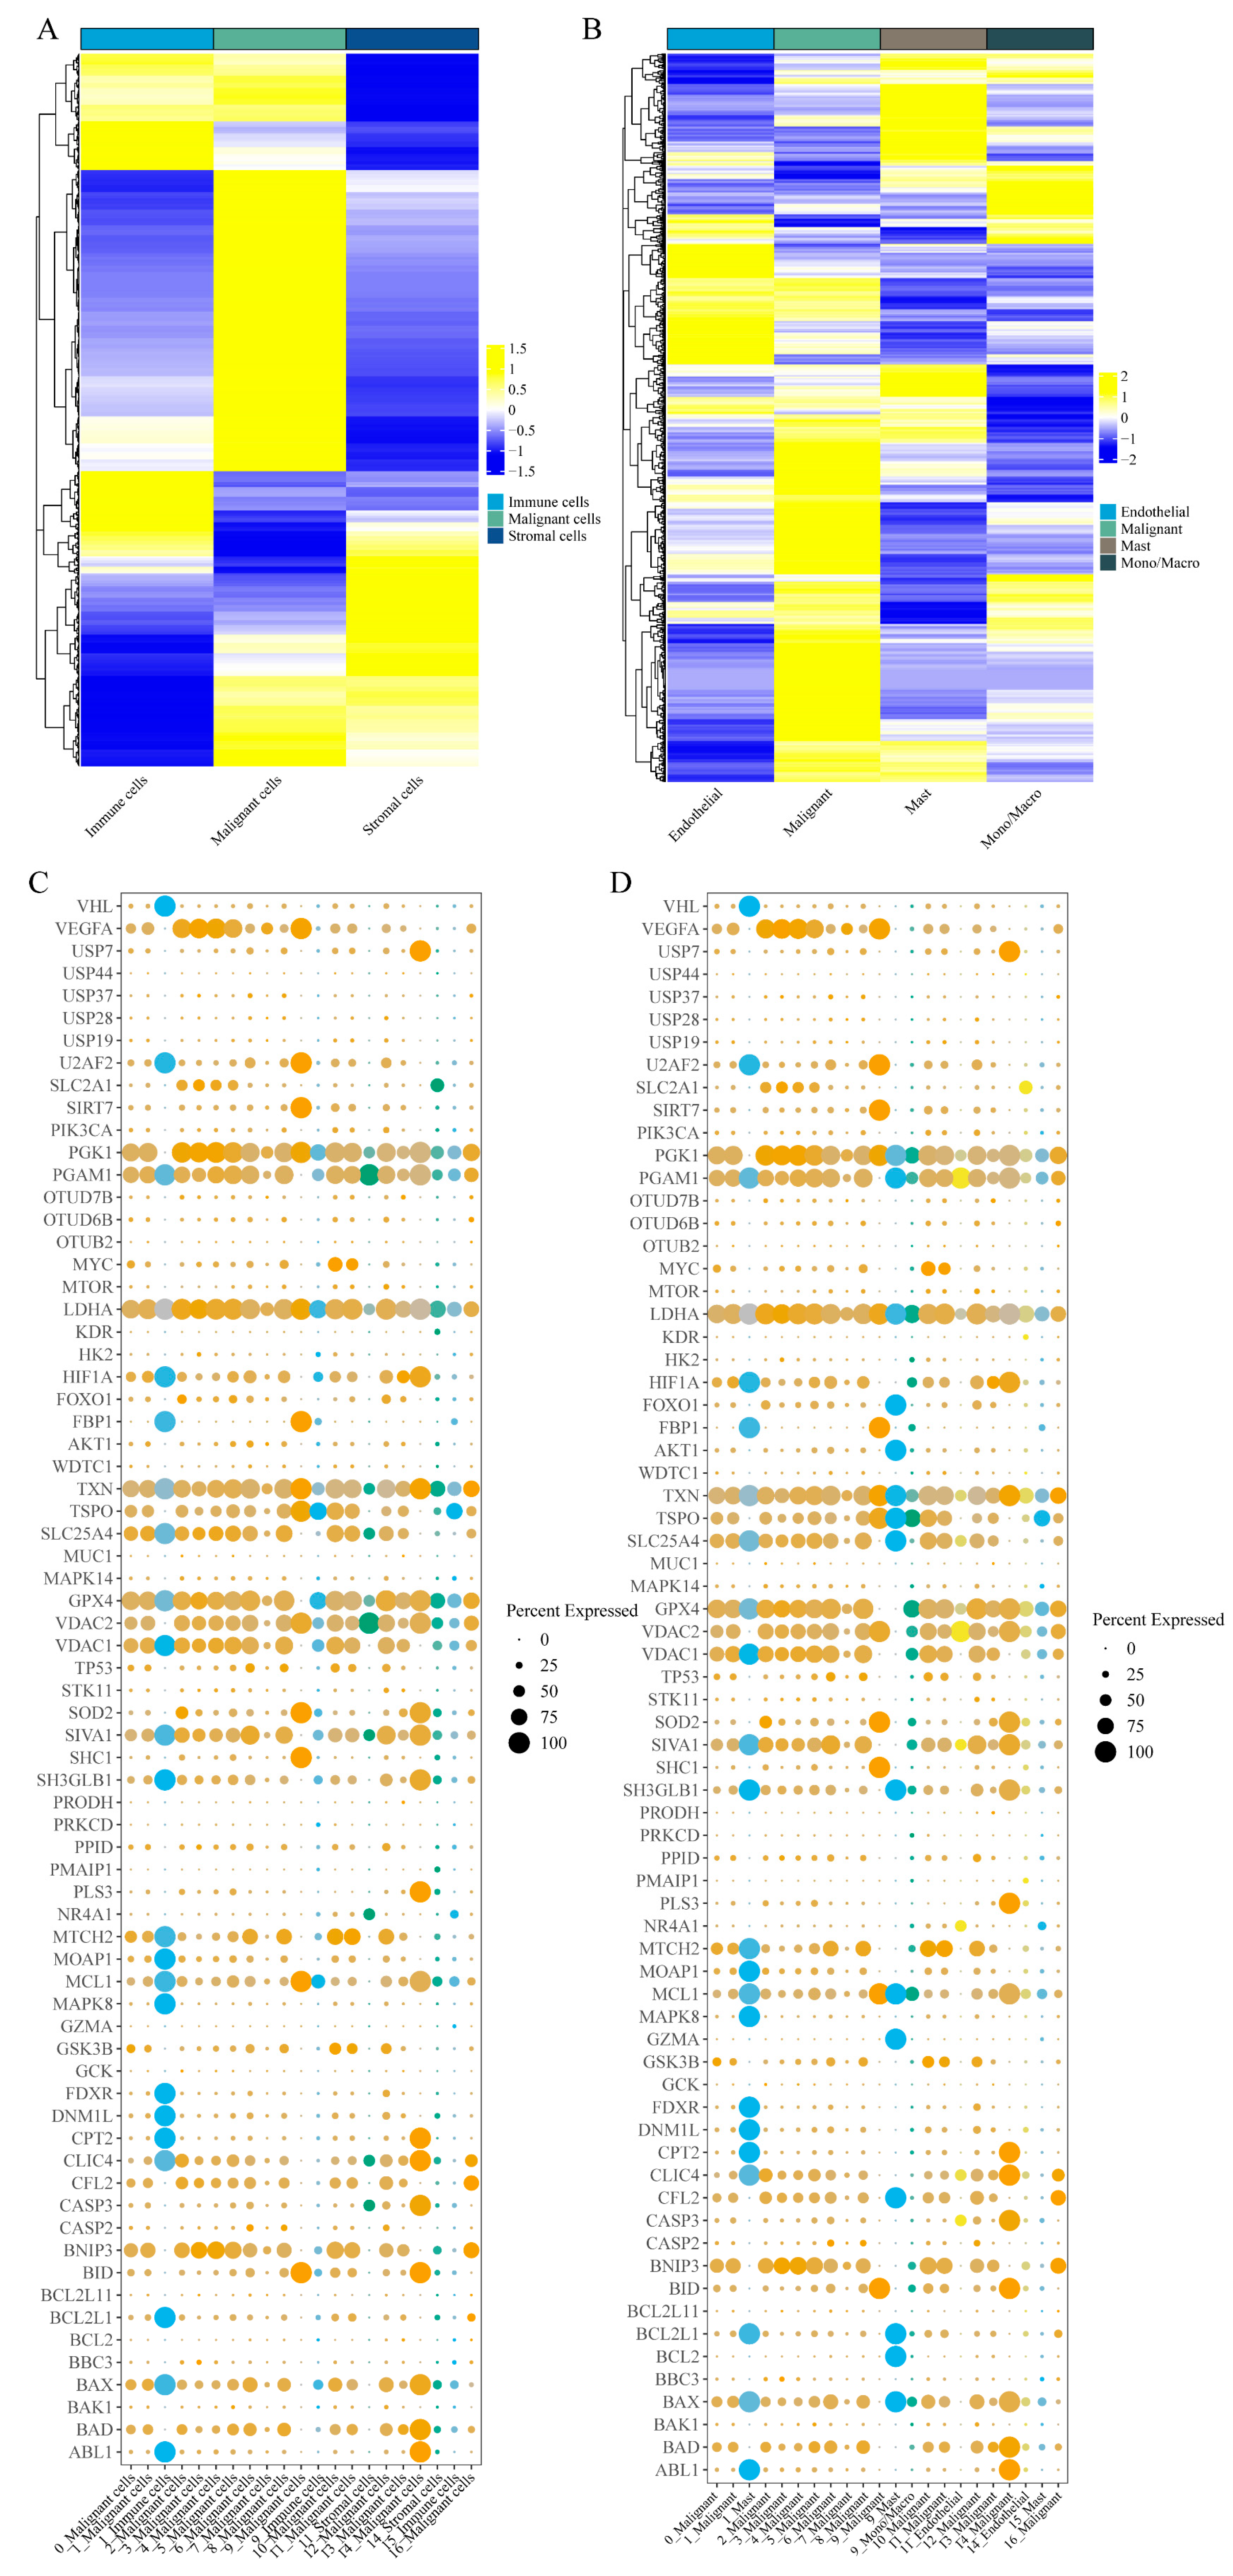
Figure 9.
Single-Cell Trajectory Analysis. (a) Trajectory analysis of immune cells; (b) Refined pseudotime trajectory; (c) Distribution of AUCell scores for the mitochondrial gene set; (d) Distribution of AUCell scores for the Warburg effect gene set.
Figure 9.
Single-Cell Trajectory Analysis. (a) Trajectory analysis of immune cells; (b) Refined pseudotime trajectory; (c) Distribution of AUCell scores for the mitochondrial gene set; (d) Distribution of AUCell scores for the Warburg effect gene set.
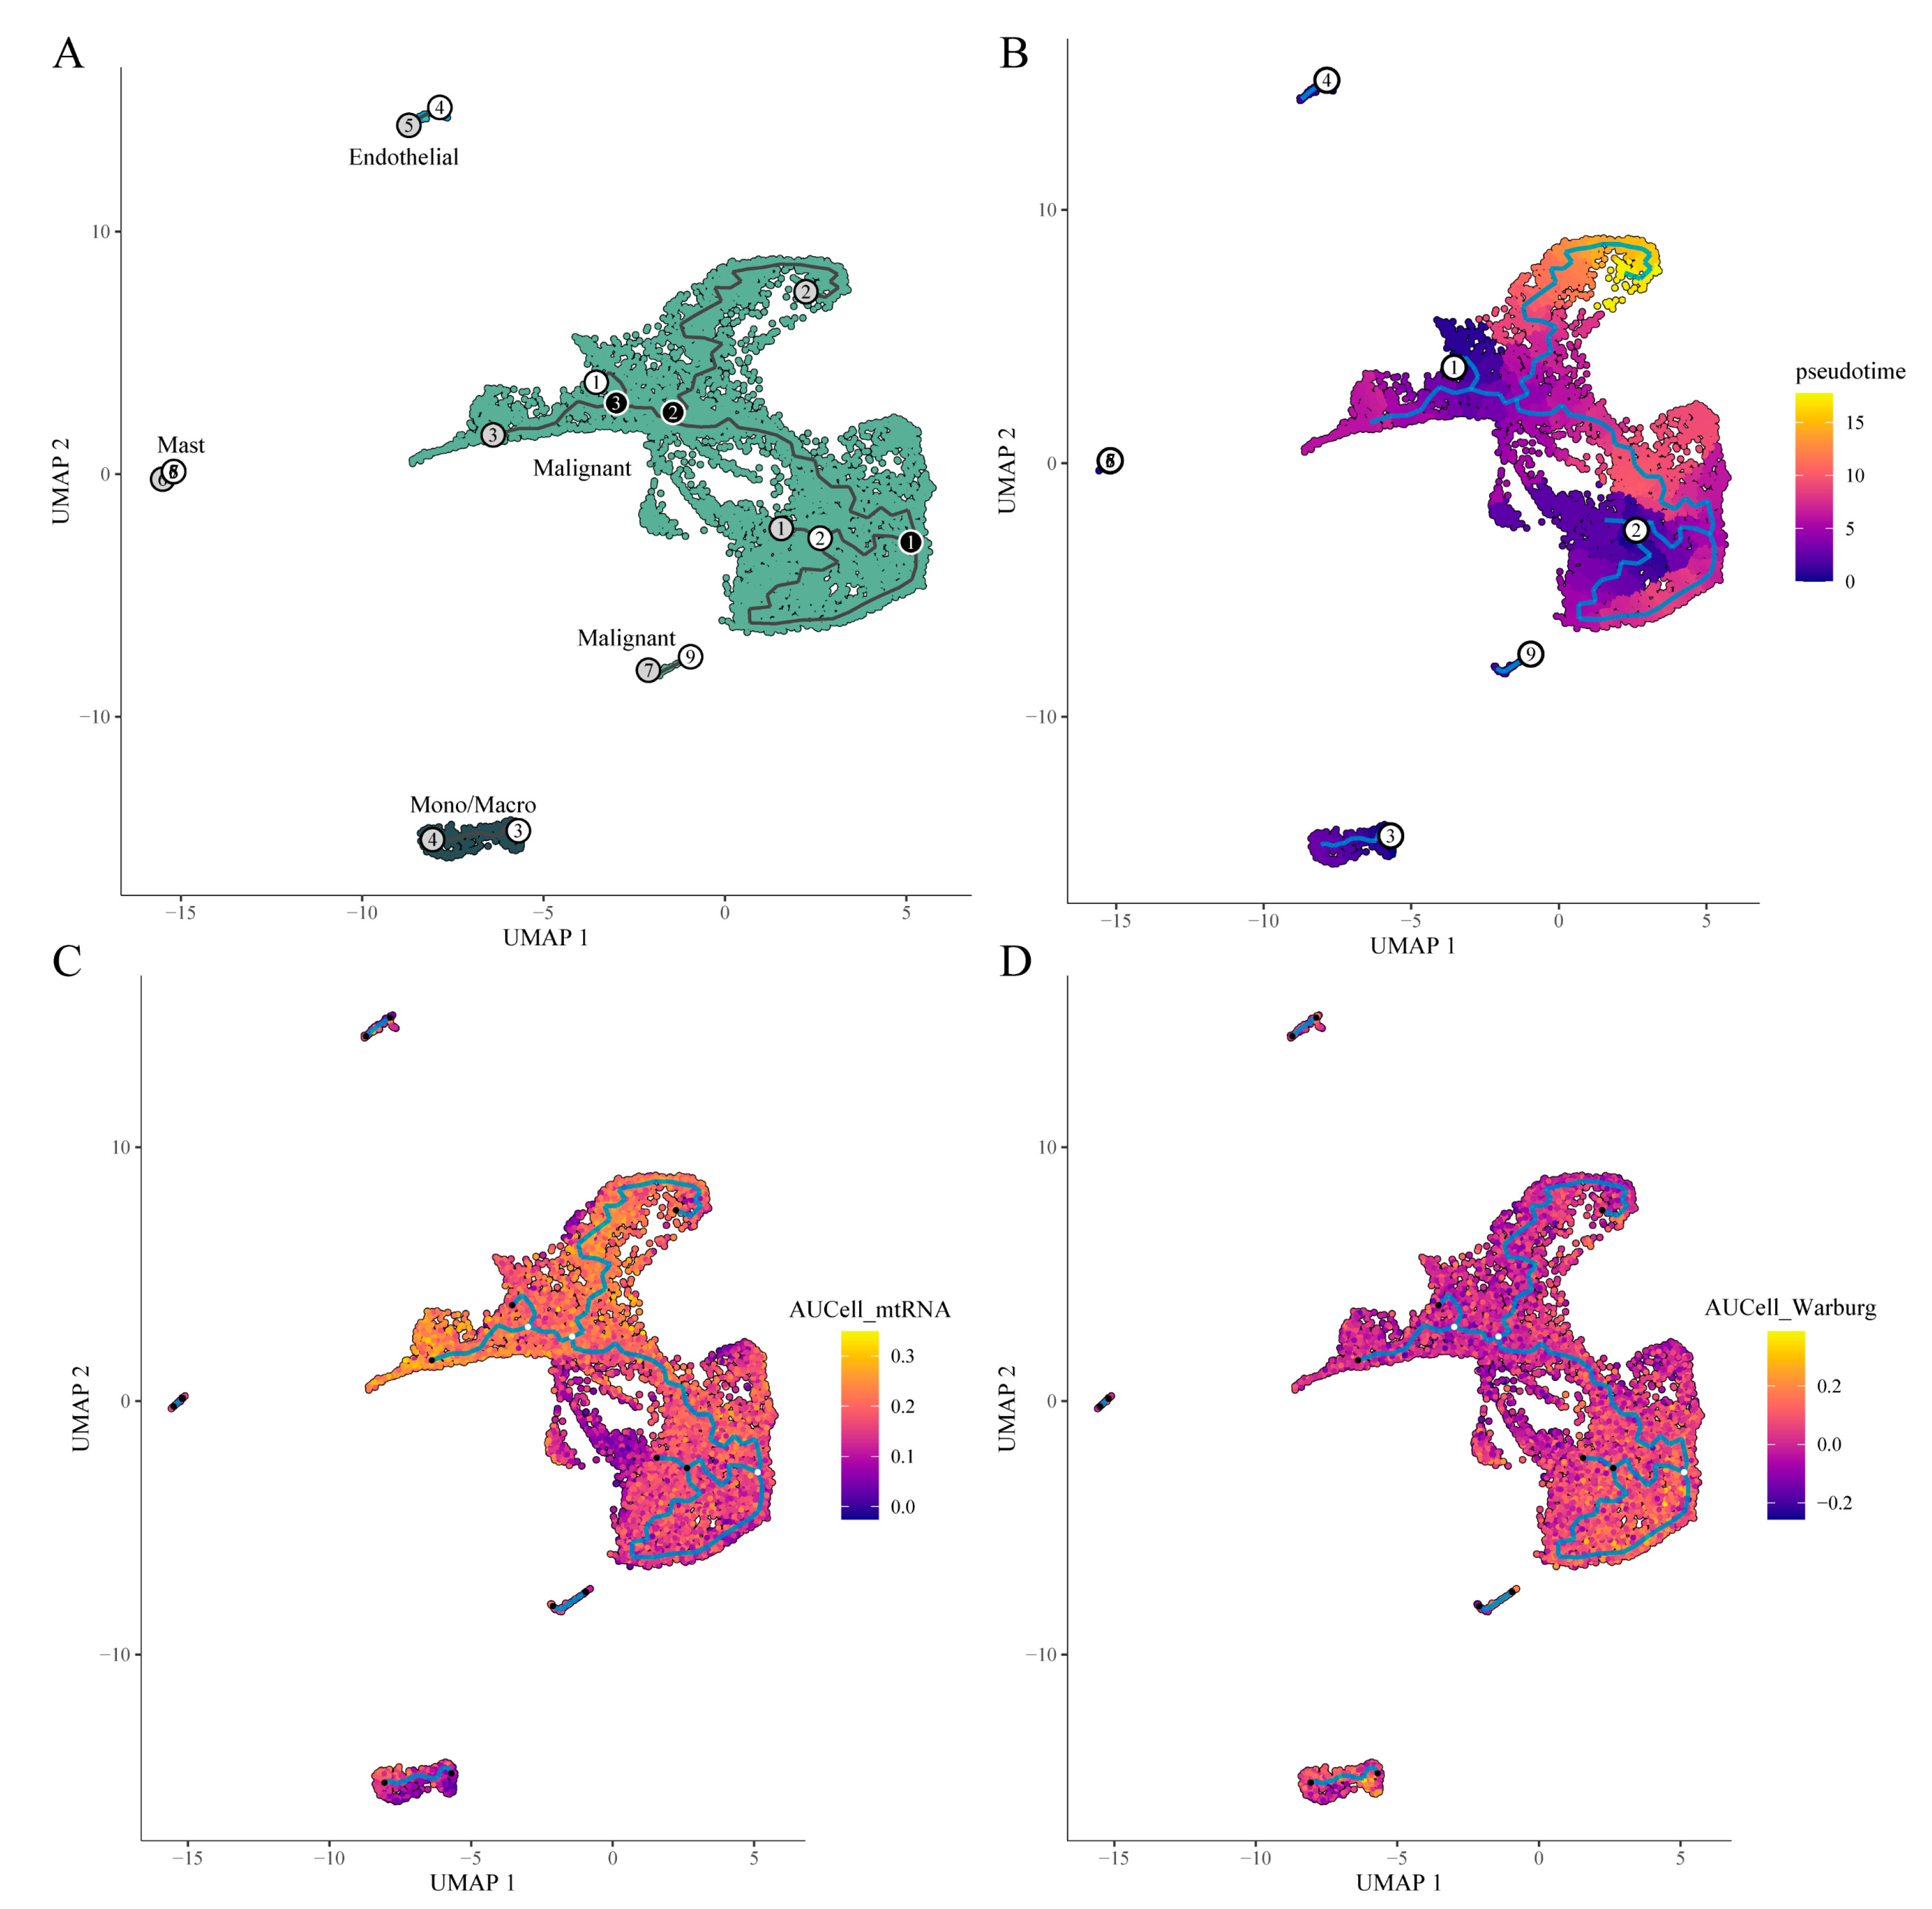
Figure 10.
Expression Dynamics of the Six Model Genes. (a) Expression trends along the trajectory; (b) Feature plots of the six genes.
Figure 10.
Expression Dynamics of the Six Model Genes. (a) Expression trends along the trajectory; (b) Feature plots of the six genes.
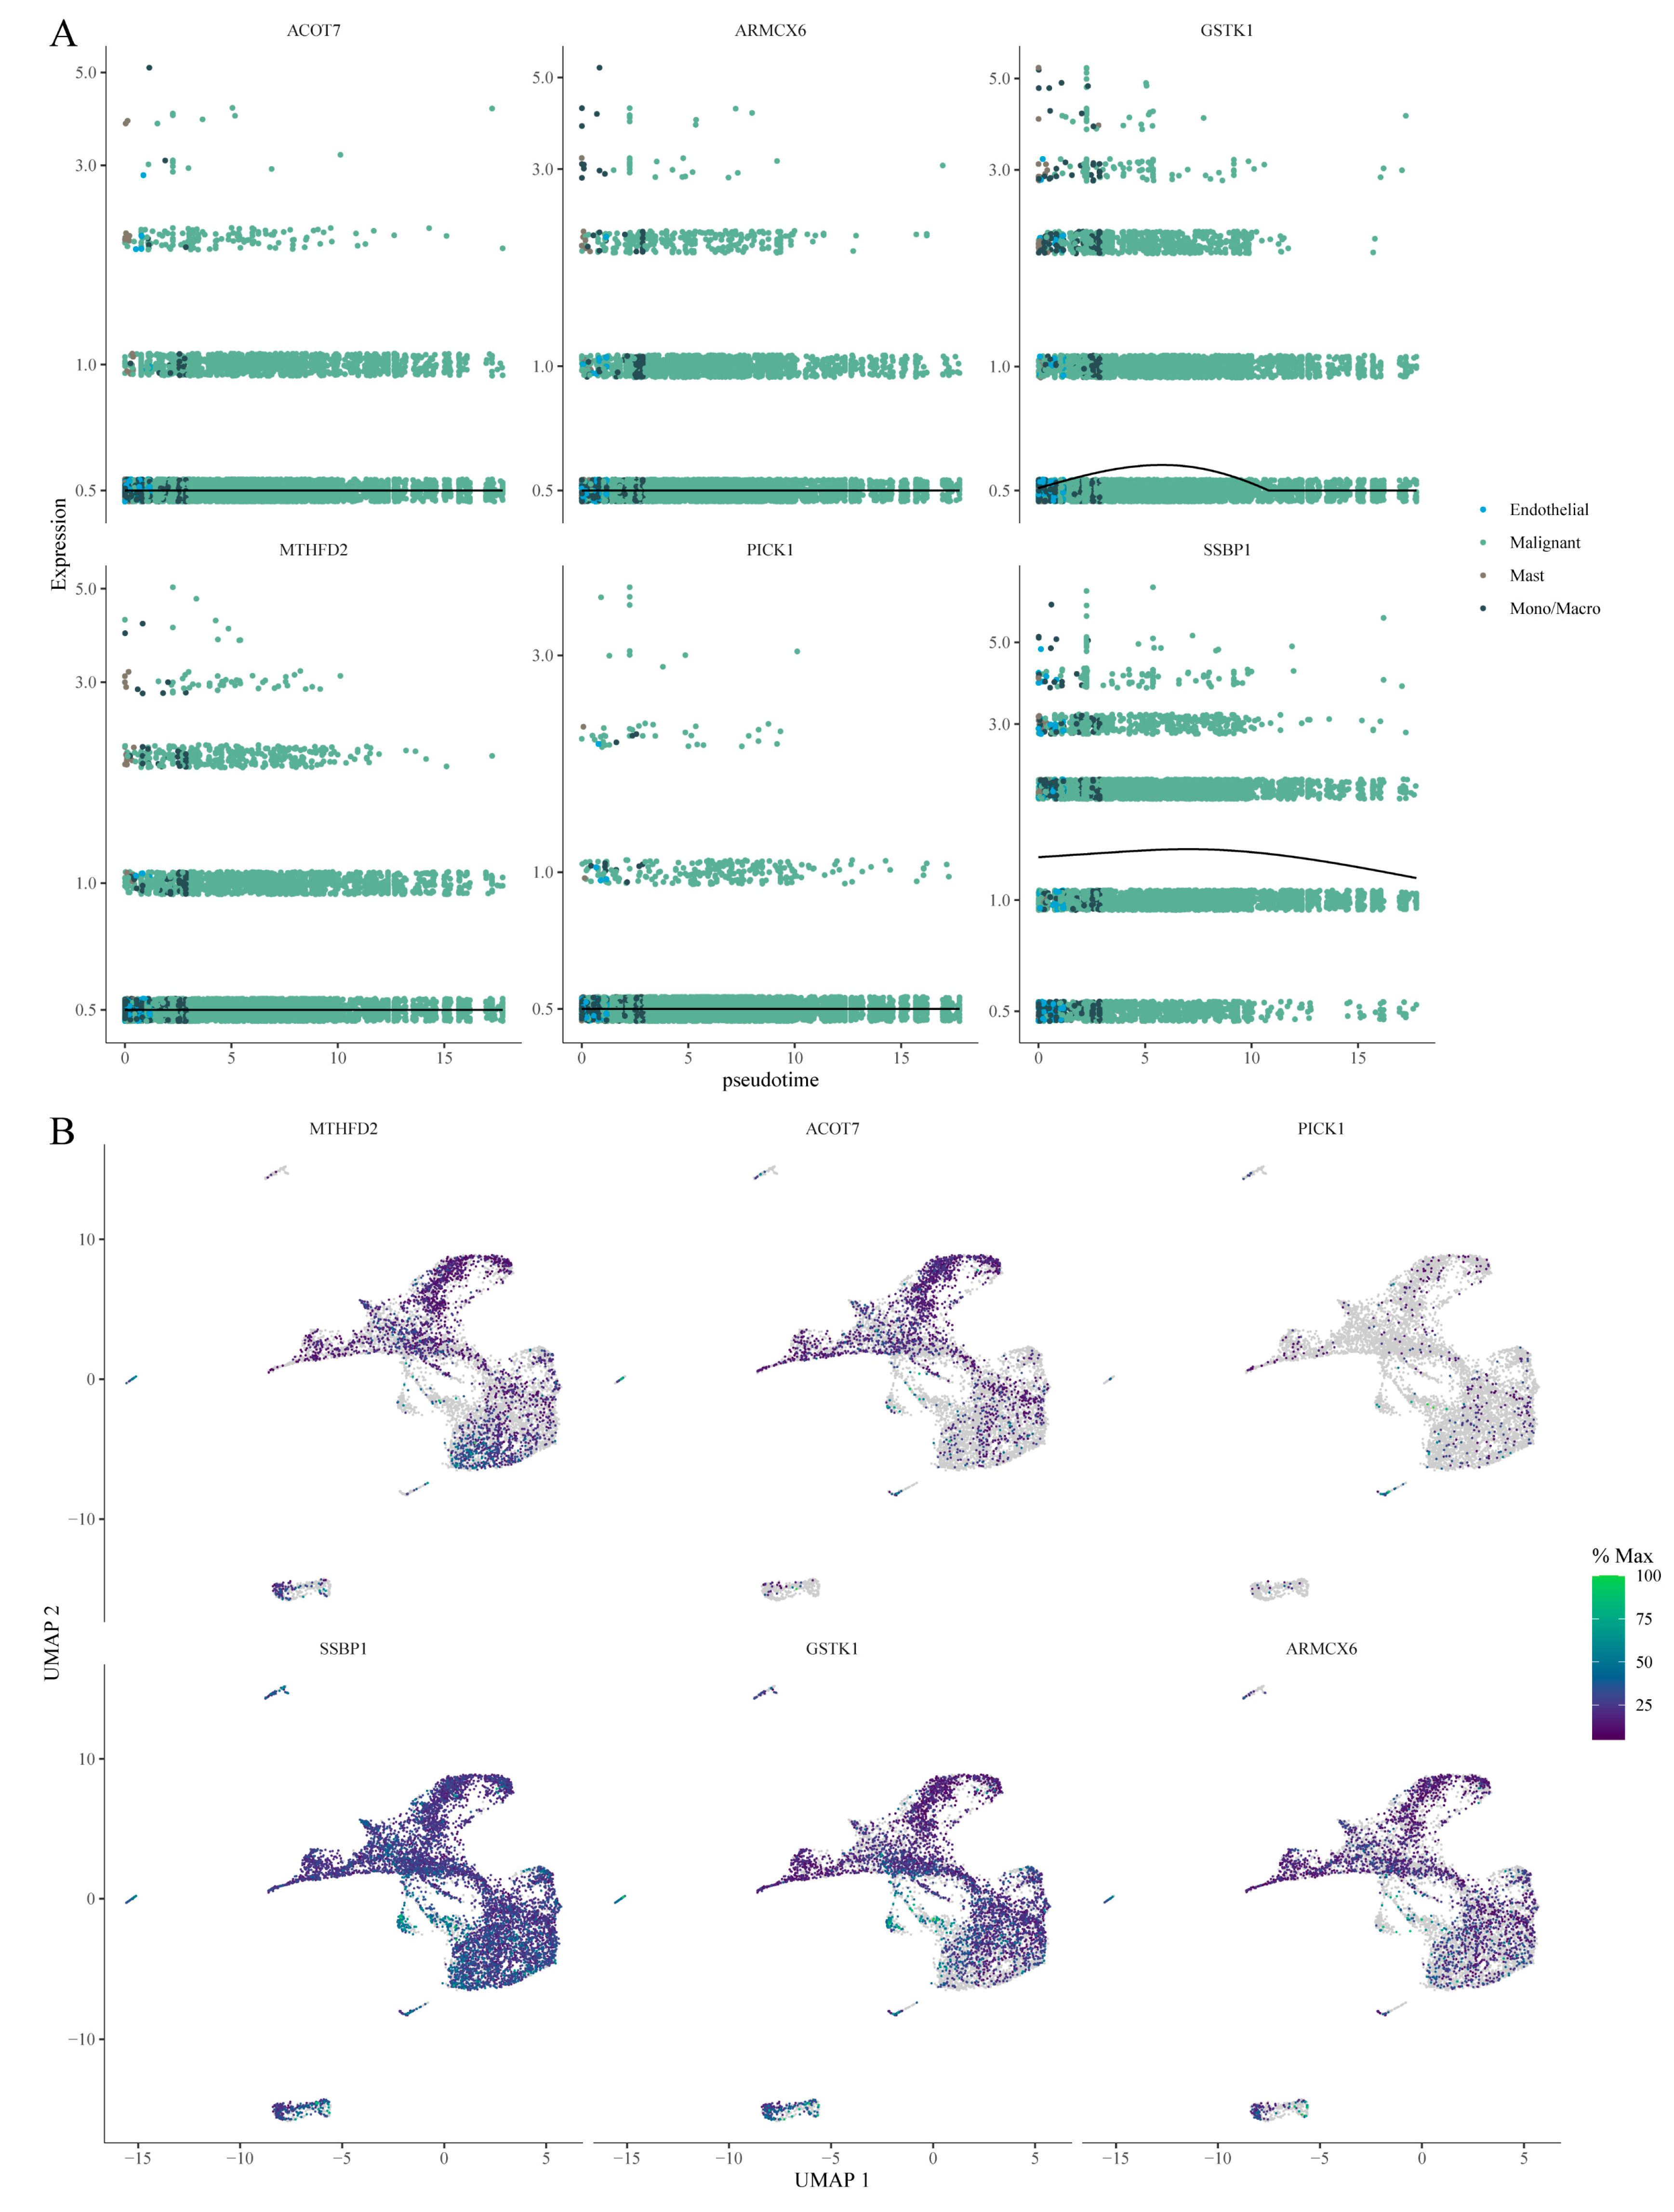
Figure 11.
(a) Distribution of co-expression gene modules across different cell types; (b) Distribution of metabolic pathway scores across cell types.
Figure 11.
(a) Distribution of co-expression gene modules across different cell types; (b) Distribution of metabolic pathway scores across cell types.
Disclaimer/Publisher’s Note: The statements, opinions and data contained in all publications are solely those of the individual author(s) and contributor(s) and not of MDPI and/or the editor(s). MDPI and/or the editor(s) disclaim responsibility for any injury to people or property resulting from any ideas, methods, instructions or products referred to in the content. |
© 2025 by the authors. Licensee MDPI, Basel, Switzerland. This article is an open access article distributed under the terms and conditions of the Creative Commons Attribution (CC BY) license (http://creativecommons.org/licenses/by/4.0/).
Copyright: This open access article is published under a Creative Commons CC BY 4.0 license, which permit the free download, distribution, and reuse, provided that the author and preprint are cited in any reuse.


