
Submitted:
11 December 2024
Posted:
11 December 2024
You are already at the latest version
Abstract
Medulloblastoma (MB) is the most common malignant brain tumor in children, typically arising during infancy and childhood. Despite multimodal therapies achieving a response rate of 70% in children older than 3 years, treatment remains challenging. Ferroptosis, a form of regulated cell death, can be induced in medulloblastoma cells in vitro using erastin or RSL3. Using two independent medulloblastoma RNA-sequencing cohorts (MB-PBTA and MTAB-10767), we investigated the expression of ferroptosis-related molecules through multiple approaches, including Weighted Gene Co-Expression Network Analysis (WGCNA), molecular subtype stratification, protein-protein interaction (PPI) networks, and univariable and multivariable overall survival analyses. A prognostic expression score was computed based on a cross-validated ferroptosis signature. In training and validation cohorts, regulation of the ferroptosis transcriptional program distinguished the four molecular subtypes of medulloblastoma. WGCNA identified nine gene modules in the MB tumor transcriptome; five correlated with molecular subtypes, implicating pathways related to oxidative stress, hypoxia, and trans-synaptic signaling. One module, associated with disease recurrence, included epigenetic regulators and nucleosome organizers. Univariable survival analyses identified a 45-gene ferroptosis prognostic signature associated with nutrient sensing, cysteine and methionine metabolism, and trans-sulfuration within one-carbon metabolism. The top ten unfavorable ferroptosis genes included: CCT3, SNX5, SQOR, G3BP1, CARS1, SLC39A14, FAM98A, FXR1, TFAP2C, and ATF4. Patients with a high ferroptosis score showed worse prognosis, particularly in G3 and SHH subtypes. The PPI network highlighted IL6 and CBS as unfavorable hub genes. In a multivariable overall survival model, which included gender, age, and molecular subtype classification, the ferroptosis expression score was validated as an independent adverse prognostic marker (hazard ratio: 5.8; p-value = 1.04 × 10⁻⁹). This study demonstrates that regulation of the ferroptosis transcriptional program is linked to medulloblastoma molecular subtypes and patient prognosis. A cross-validated ferroptosis signature was identified in two independent RNA-sequencing cohorts, and the ferroptosis score was confirmed as an independent and adverse prognostic factor in medulloblastoma.
Keywords:
ferroptosis
; prognosis
; medulloblastoma
; RNA-sequencing
; response to oxidative stress
; methionine-cysteine catabolism
; epigenetic
; recurrence
; trans-sulfuration
1. Introduction
Medulloblastoma is an embryonic tumor arising in the cerebellum and is the most common pediatric brain tumor, with an incidence rate of 5 to 11 cases per million individuals [1]. Standard therapy includes surgical resection, craniospinal irradiation, and chemotherapy. This multimodal therapeutic protocol has achieved a cure rate of 70-75% in children aged 3 years or older [2,3,4].
Medulloblastoma tumors are classified into distinct molecular subtypes based on transcriptional expression profiles [5,6,7,8,9] and, subsequently, DNA methylation patterns [10,11]. These multi-omics investigations have identified four major subtypes: Group 3, Group 4, WNT-activated, and SHH-activated, each with distinct clinic-biological characteristics [12].
Ferroptosis is a form of regulated cell death distinct from apoptosis and autophagy [13]. It is an iron-dependent, reactive oxygen species (ROS)-driven process characterized by specific cytological changes, including reduced or absent mitochondrial cristae, a ruptured outer mitochondrial membrane, and a condensed mitochondrial matrix [14]. ROS play a dual role in physiology and pathology. While physiological levels of ROS are essential for brain development, supporting neural stem cell proliferation and differentiation, excessive ROS levels can lead to oxidative stress and cellular damage [15].
There is emerging evidence that ferroptosis contributes to medulloblastoma tumor behavior. In vitro studies have demonstrated that ferroptosis inducers, such as erastin and RSL3, can induce ferroptosis in medulloblastoma cells [16]. In SHH-MB, FANCD2 has been implicated as an oncogene, predicting poor prognosis. FANCD2 deficiency leads to Fe²⁺ accumulation, increased divalent metal transporter 1 expression, impaired glutathione peroxidase 4 (GPX4) activity, and subsequent ferroptosis activation, which reduces SHH-MB cell proliferation [17]. Furthermore, the RNF126-FSP1-CoQ10 pathway plays a critical role in suppressing phospholipid peroxidation and ferroptosis. RNF126 is overexpressed in G3-MB and is associated with reduced survival. It regulates ferroptosis sensitivity by ubiquitinating ferroptosis suppressor protein 1 (FSP1) [18]. These findings suggest that ferroptosis holds potential as a therapeutic target for medulloblastoma and other malignancies [19,20].
In this study, the diversity of the ferroptosis transcriptional program was investigated in medulloblastoma tumors. Regulation of this program was associated with the molecular classification of the four medulloblastoma subgroups, involving processes such as oxidative stress response, hypoxia, and trans-synaptic signaling. Part of the ferroptosis transcriptional program linked to epigenetic regulation and nucleosome organization was further associated with disease recurrence.
A cross-validated ferroptosis signature was identified and shown to predict medulloblastoma prognosis. Patients with high ferroptosis scores had worse outcomes, particularly within the G3 and SHH-activated subtypes. A protein-protein interaction (PPI) network formed by the cross-validated signature was enriched in pathways such as cysteine-methionine catabolism, nutrient response, and trans-sulfuration in one-carbon metabolism. In a multivariable overall survival model incorporating age, gender, and molecular classification, the ferroptosis score was confirmed as an independent adverse prognostic marker for medulloblastoma.
2. Materials and Methods
2.1. Public Datasets of RNA-Sequencing
2.1.1. Training Cohort
The training cohort of medulloblastoma tumor RNA-seq data was obtained from the Pediatric Brain Tumor Atlas (PBTA) consortium study [21] via the Pediatric CBioPortal website [22]. After filtering and clinical annotation, the cohort comprised 257 RNA-seq experiments (Table 1).
Most samples were derived from male patients (157 males and 100 females), with an average patient age of 8 years at diagnosis. The mean survival duration was 52 months. Most tumor samples were collected from the posterior fossa, ventricles, or mixed regions. The four molecular subtypes of medulloblastoma (WNT, SHH, Group 3, and Group 4) were well represented within the cohort. Additionally, nearly half of the patients experienced disease progression during follow-up (Table 1).
For preprocessing, RNA-seq quantifications were transformed into pseudocounts, normalized using quantile normalization, and batch effects were adjusted with the ComBat algorithm (Supplemental Figure S1).
2.1.2. Validation Cohort
An independent cohort of medulloblastoma tumor RNA-sequencing data was downloaded from the ArrayExpress database under accession number E-MTAB-10767 [23]. This cohort included 331 RNA-sequencing experiments. Most tumor samples were obtained from male children. The validation cohort also included samples from all four molecular subtypes (Table 2); however, overall survival follow-up data were available only for patients in Groups 3 (G3) and 4 (G4) (Table 2). For preprocessing, RNA-sequencing quantifications were transformed into pseudo-counts, normalized using quantile normalization, and batch effects were corrected with the ComBat algorithm (Supplemental Figure S2).
2.2. Normalization of RNA-Sequencing Data
Bioinformatics analyses were conducted using the R software environment (version 4.4.1). Raw RNA-sequencing data were transformed into pseudocounts (log2+1) and filtered for positive detection. Quantile normalization was performed using the preprocessCore Bioconductor R package (version 1.66.0) [24]. Ferroptosis-related genes were filtered based on the FerrDbV2 database [25] using the ferroviz R package (version 1.0.0), available at https://github.com/cdesterke/ferroviz (accessed on December 7, 2024) [26]. Following k-means clustering, batch normalization was applied using the sva R package (version 3.52.0) [27].
2.3. Weighted Gene Co-Expression Network Analysis
The expression of ferroptosis-related genes was used as input to perform Weighted Gene Co-Expression Network Analysis (WGCNA) on PBTA medulloblastoma tumor samples. These analyses were conducted using the WGCNA R package (version 1.73) [28,29]. Sample clustering was applied to the input matrix to identify and exclude outliers. The soft power threshold was estimated to compute the adjacency matrix and the Topological Overlap Matrix (TOM). Gene modules were detected, and multidimensional scaling was performed to reduce dimensions. Correlation analyses were then conducted to associate gene module distribution with phenotypic traits. Functional enrichment of the identified gene modules was performed using the clusterProfiler R package (version 4.12.6) [30,31], with enrichment analyses conducted on the Gene Ontology Biological Process database [32].
2.4. Univariate Survival Analyses
Univariate Cox overall survival analysis was performed on the expression of ferroptosis-related genes in two independent RNA-sequencing cohorts using the loopcolcox R package (version 1.0.0), available at https://github.com/cdesterke/loopcolcox (accessed on December 8, 2024) [33]. A cross-survival signature was generated by intersecting the results from the univariate Cox analyses of the two cohorts (Supplemental Tables S1 and S2). A ferroptosis expression score was calculated as the sum of products between the gene expression values and the corresponding Cox beta coefficients for each ferroptosis gene included in the cross-survival signature, using the following formula:
Score = ∑ (Expression x Cox.beta)
Optimal cutpoint threshold on expression score was determined on overall survival logrank residuals with survminer R package version 0.5.0 [34]. Kaplan Meier and logrank on overall survival were also performed with survminer R-package.
2.5. Protein-Protein Interaction Network
A protein-protein interaction (PPI) network was constructed starting with the ferroptosis cross-signature (45 molecules) using the STRING online proteomic tool (version 12), available at https://string-db.org (accessed on December 8, 2024) [35,36]. After constructing the PPI network, functional enrichment was performed using the Gene Ontology Biological Process (GO::BP) database [32] and the Wikipathways database [37].
2.6. Multivariable Survival Modeling
For the PBTA medulloblastoma cohort, comprehensive clinical annotations were available (Table 1). After excluding samples from the WNT subtype (due to all cases having experienced a death event during follow-up), a multivariable overall survival model was constructed using the remaining samples. Ferroptosis expression score categories were incorporated into the Cox multivariable model, along with clinical and epidemiological covariates such as age at diagnosis, gender, and molecular subtypes [38]. The linearity of the Cox residuals for each covariate was assessed by performing global and individual Schoenfeld tests. Model optimization was based on the highest concordance index. After calibrating the model using the rms R package (version 6.8-2, with 500 bootstrap iterations), a nomogram was generated to predict survival at 24 months of follow-up [39].
3. Results
3.1. Ferroptosis Related Gene Regulatory Modules are Associated to the Molecular Phenotype and Prognosis of Medulloblastoma
RNA-sequencing data from medulloblastoma samples were filtered from the Pediatric Brain Tumor Atlas (PBTA) cohort [21]. A total of 257 medulloblastoma tumor samples (Table 1) were preprocessed to select ferroptosis-related genes expressed in these tissues (Supplemental Figure S1). Principal component analysis (PCA) based on the expression profiles of 642 ferroptosis-related genes effectively stratified the molecular subtypes of medulloblastoma (G3, G4, WNT, and SHH), as described in previous studies (Figure 1A). This stratification of molecular subtypes was further confirmed by unsupervised clustering using Euclidean distances (Figure 1B). These findings suggest that the transcriptional program of ferroptosis is regulated in accordance with the molecular diversity of medulloblastoma subtypes.
To further investigate the association between the ferroptosis transcriptional program and clinical phenotypes in medulloblastoma, a gene regulatory network (GRN) analysis was conducted using the Weighted Gene Co-Expression Network Analysis (WGCNA) method [28,29]. Sample clustering confirmed the absence of outliers based on ferroptosis-related gene expression in the PBTA medulloblastoma cohort (Supplemental Figure S3A). Optimal network topology, determined by ferroptosis gene expression, identified a soft-threshold power of 16 for initiating the WGCNA analysis (Supplemental Figure S3B). This analysis identified nine independent gene regulatory modules in the ferroptosis transcriptional program of medulloblastoma tumors (Figure 2A and Supplemental Figure S3C). Correlations between these nine gene regulatory modules and clinical phenotypes were assessed (Figure 2B).
The turquoise module was significantly activated in the transcriptomes of SHH subtype tumors (r=0.57, p-value=8×10⁻²⁴, Figure 2B) and in tumors from patients with a positive death status (r=0.22, p-value=4×10⁻⁴, Figure 2B). The green module was notably repressed in Group 4 tumors (r=-0.75, p-value=0.003, Figure 2B) but activated in tumors from patients with a positive death status (r=0.18, p-value=4×10⁻⁴, Figure 2B). The red module was prominently activated in the transcriptomes of Group 3 tumors (r=0.7, p-value=8×10−40, Figure 2B). The black module was activated in tumors during disease recurrence (r=0.16, p-value=0.009, Figure 2B). The pink module exhibited significant activation in Group 4 tumors (r=0.55, p-value=2×10⁻²¹, Figure 2B) and was specifically enriched for genes involved in trans-synaptic signaling (Figure 2C). The brown module was activated in Group 4 tumors (r=0.78, p-value=9×10−55, Figure 2B) and repressed in SHH tumors (r=-0.66, p-value=4×10⁻³⁴, Figure 2B).
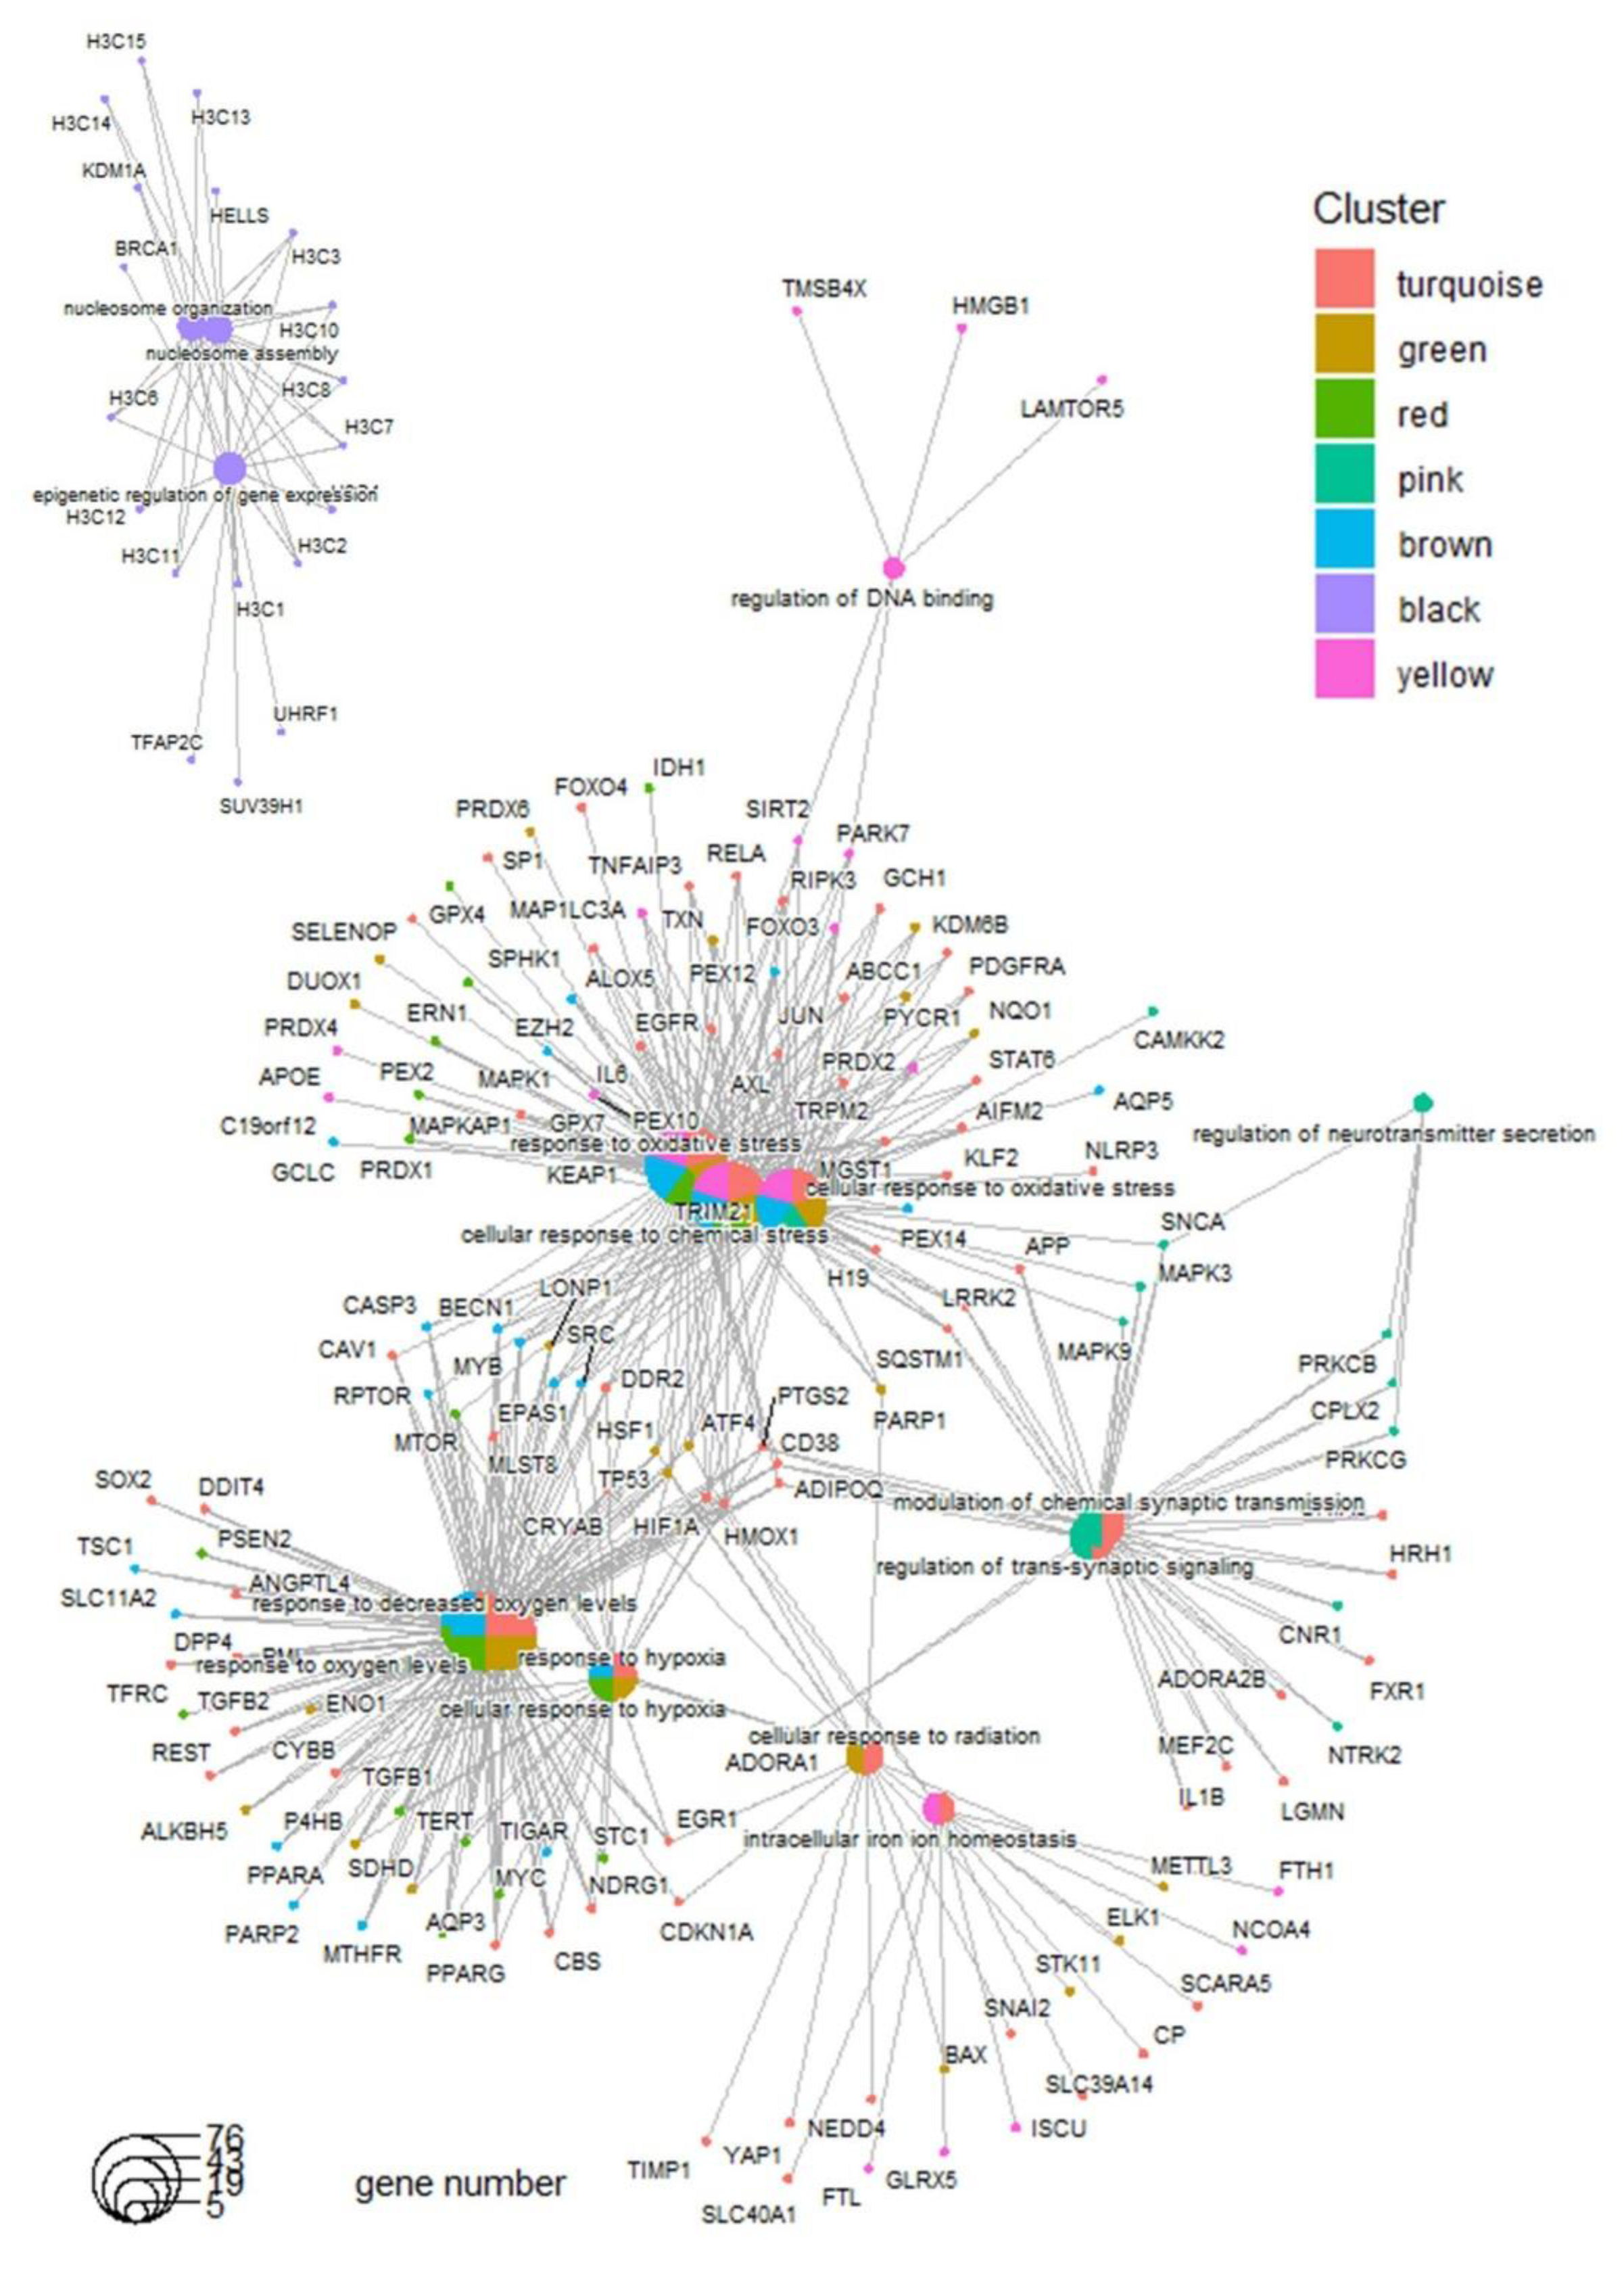
Functional enrichment analysis of the gene modules using the Gene Ontology Biological Process database revealed that the turquoise, green, red, and brown modules, which are implicated in molecular subtype stratification, shared common functions associated with the response to oxidative stress ([Figure 2C and [Figure 3).
Figure 1.
Ferroptosis-related genes stratified the molecular subtypes of medulloblastoma in the PBTA training cohort through unsupervised analyses. (A) Principal component analysis (PCA) was performed using the expression profiles of ferroptosis-related genes. (B) An expression heatmap and unsupervised hierarchical clustering were generated based on ferroptosis-related gene expression, utilizing Euclidean distances and the Ward.D2 method.
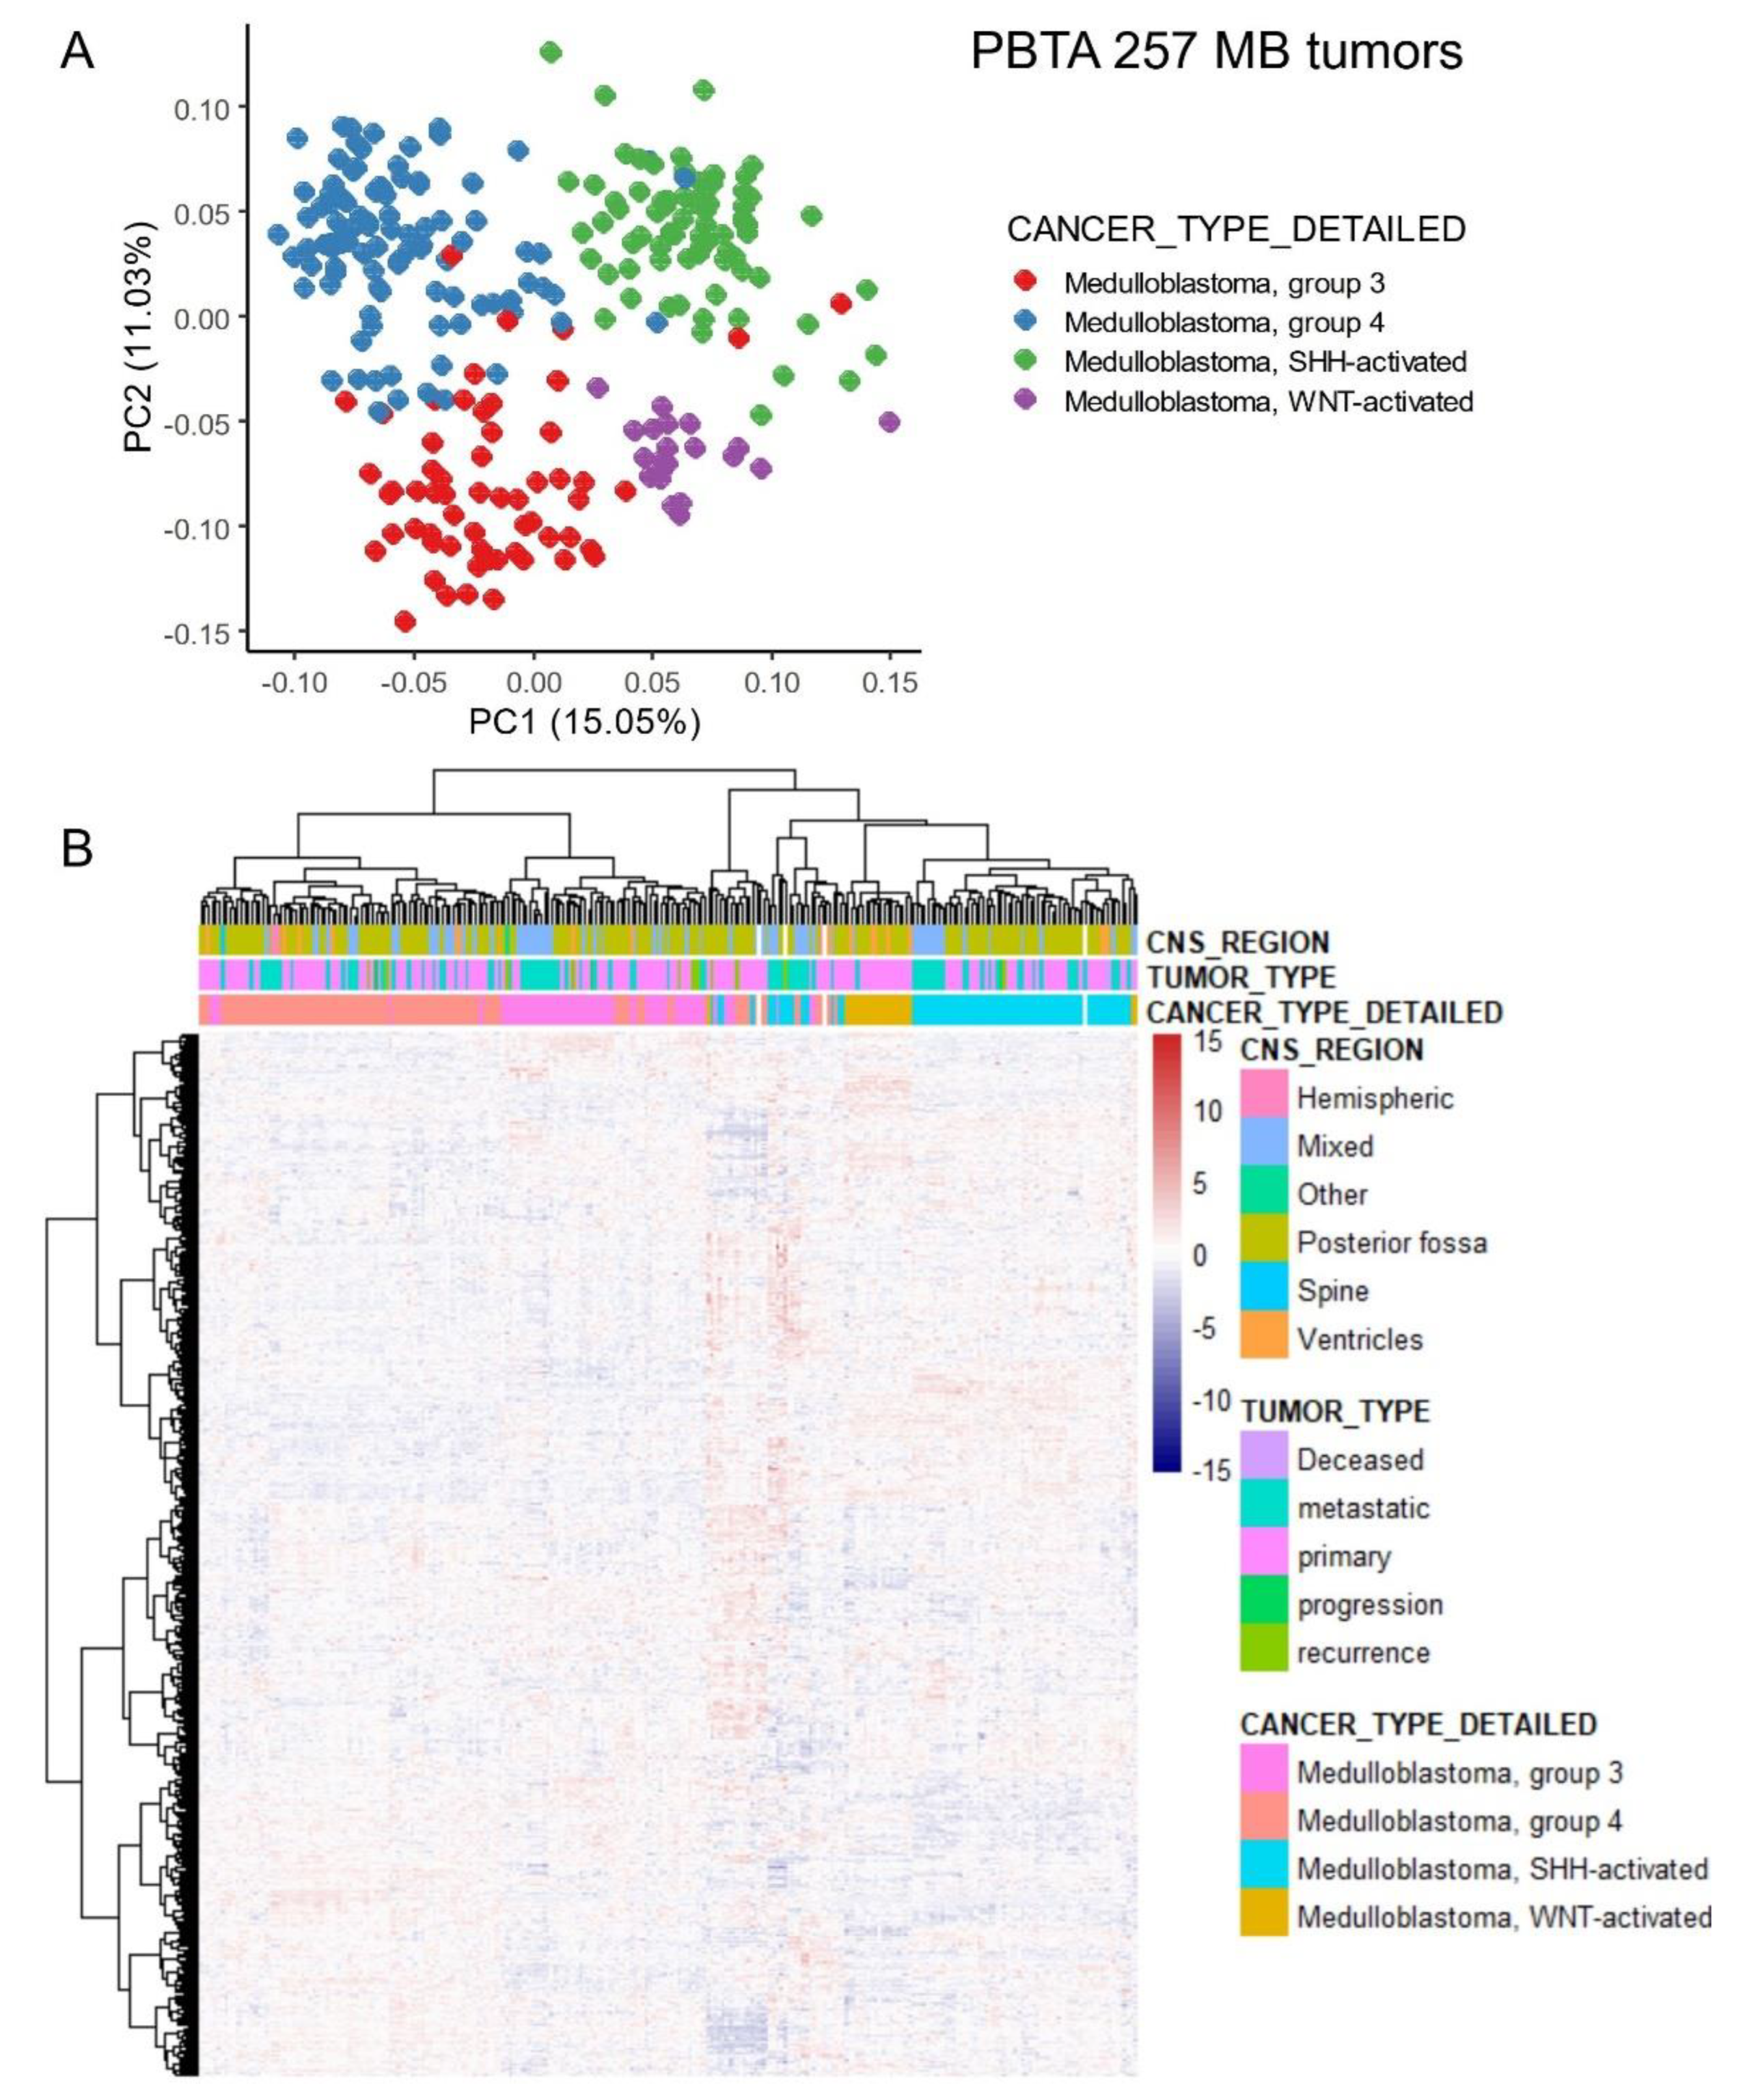
Figure 2.
Ferroptosis-related genes identified gene regulatory modules associated with the molecular subtypes and prognosis of medulloblastoma. (A) Gene module clustering was performed based on the expression profiles of ferroptosis-related genes. (B) Correlation analysis between phenotypic traits and gene regulatory modules, identified from ferroptosis-related gene expression, was conducted. Each intersection cell displays the Pearson correlation coefficient and corresponding p-value. (C) A dot plot illustrating functional enrichment analysis for each module, performed using the Gene Ontology Biological Process database.
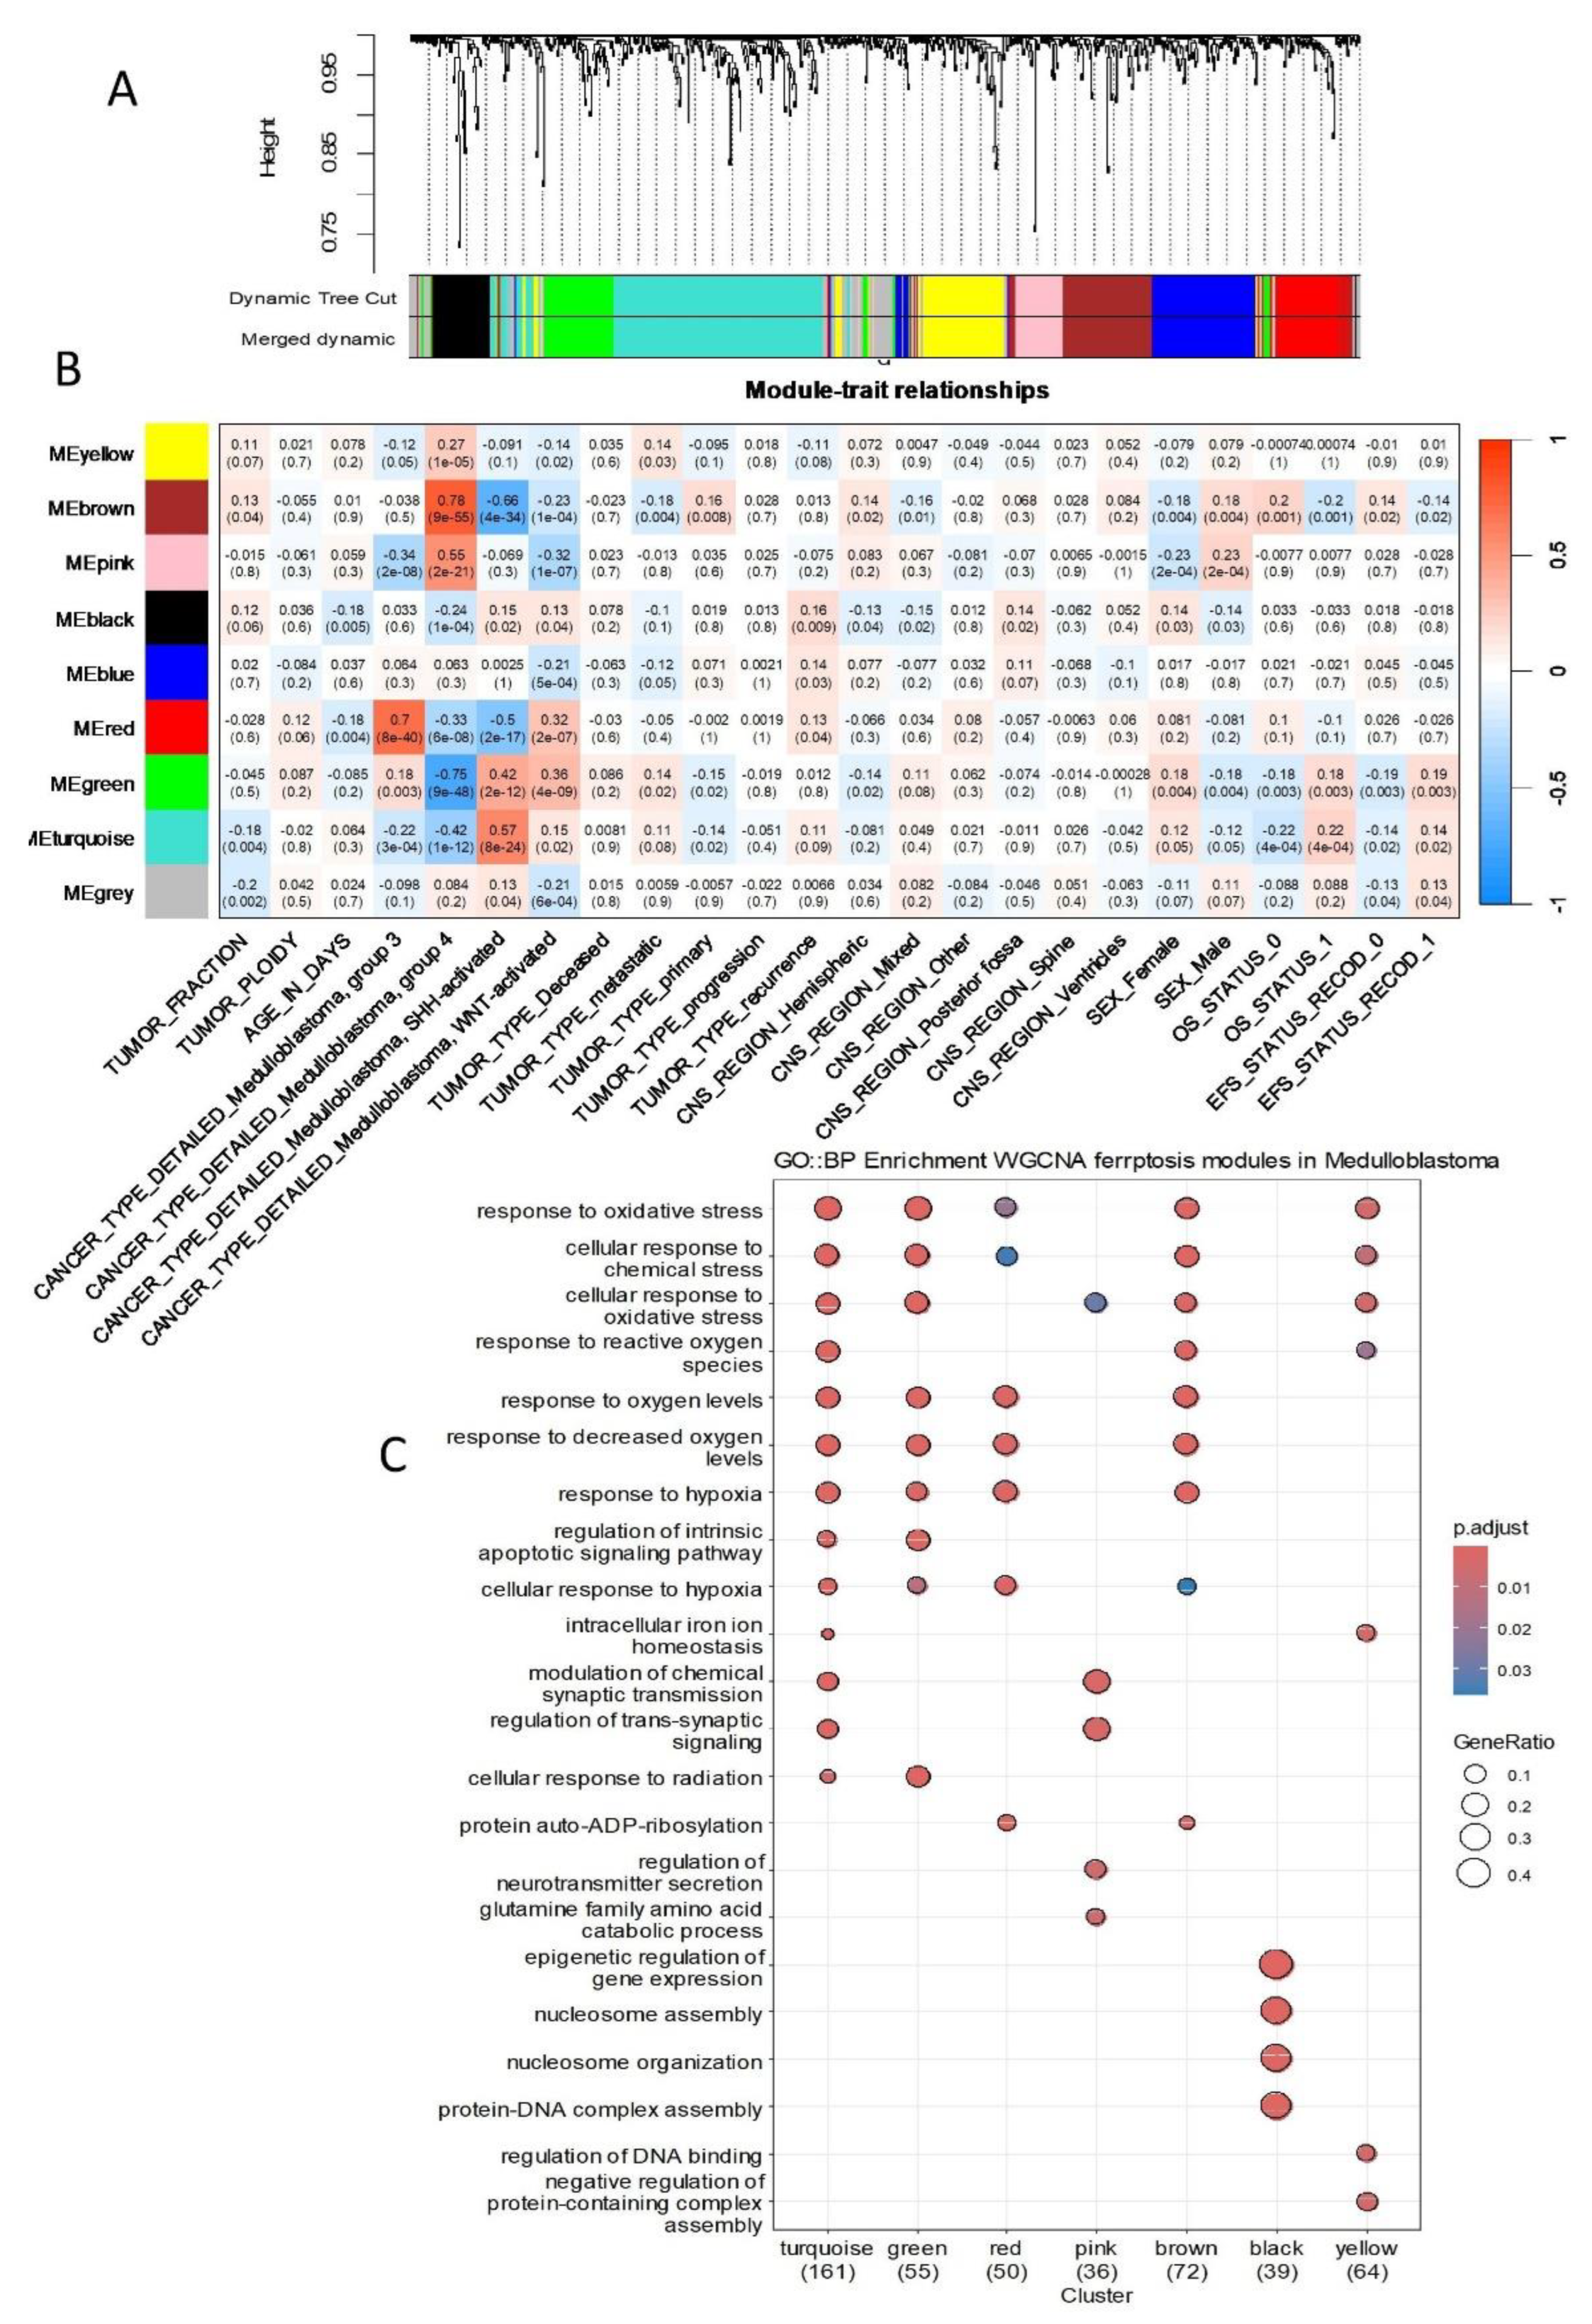
In opposite, genes belonging to black module and associated to the recurrence of the disease (Figure 2B) were found enriched in epigenetic regulation and nucleosome organization (Figure 2C and Figure 3).
Figure 3.
Functional gene network associated to ferroptosis gene regulatory modules detected in tumor of medulloblastoma: enrichment performed by module on gene ontology biological process database.
Figure 3.
Functional gene network associated to ferroptosis gene regulatory modules detected in tumor of medulloblastoma: enrichment performed by module on gene ontology biological process database.
3.2. Validation of Molecular Sub-Type Stratification by Ferroptosis Transcriptional Program in an Independent Cohort of Medulloblastoma Tumor RNA-Sequencing
An independent RNA-sequencing cohort comprising 331 medulloblastoma tumor samples (Table 1) [23] was preprocessed prior to the filtration of ferroptosis-expressed genes (Supplemental Figure S 2). Unsupervised principal component analysis (PCA) confirmed effective stratification of molecular subtypes based on the expression of the ferroptosis transcriptional program, although a degree of overlap was observed between the SHH and WNT subtypes (Figure 4A). However, the ferroptosis transcriptional program lacked the resolution to further stratify the intermediary groups (G3-G4) described by Williamson et al. [23] within this cohort (Figure 4A). Hierarchical clustering using Euclidean distances proved more effective than PCA in stratifying the molecular subgroups, demonstrating clear distinctions between the SHH and WNT subtypes (Figure 4B).
3.3. Cross-Validated Ferroptosis Signature Associated to the Prognosis of Medulloblastoma
To evaluate the association between ferroptosis gene expression and patient prognosis, iterative Cox proportional hazards analyses were performed with respect to overall survival in each transcriptomic cohort, focusing on all genes involved in ferroptosis. In the PBTA training cohort, Cox analyses identified 182 ferroptosis-related genes significantly associated with overall survival (Figure 5A, Supplemental Table S1). Similarly, in the validation cohort, Cox analyses identified 133 genes significantly associated with overall survival (Figure 5B, Supplemental Table S2). A cross-analysis of univariate survival data from both cohorts revealed a shared signature comprising 45 ferroptosis-related genes whose expression was significantly associated with the prognosis of medulloblastoma patients (Table 3, Figure 5C).
Using the prognostic cross-validated ferroptosis signature (45 molecules, Table 3), a protein-protein interaction (PPI) network was constructed using the STRING proteomics online application (Figure 6A). Functional enrichment analysis of the PPI network with the WikiPathways database highlighted key roles in cysteine and methionine catabolism, followed by transsulfuration and one-carbon metabolism pathways (Figure 6B). Further functional enrichment analysis using the Gene Ontology Biological Process database revealed significant involvement in cellular responses to nutrient levels, extracellular stimuli, and decreased oxygen levels (Figure 6C).
3.4. Computing of a Ferroptosis Expression Score Confirmed Association of Ferroptosis Regulation to Medulloblastoma Prognosis
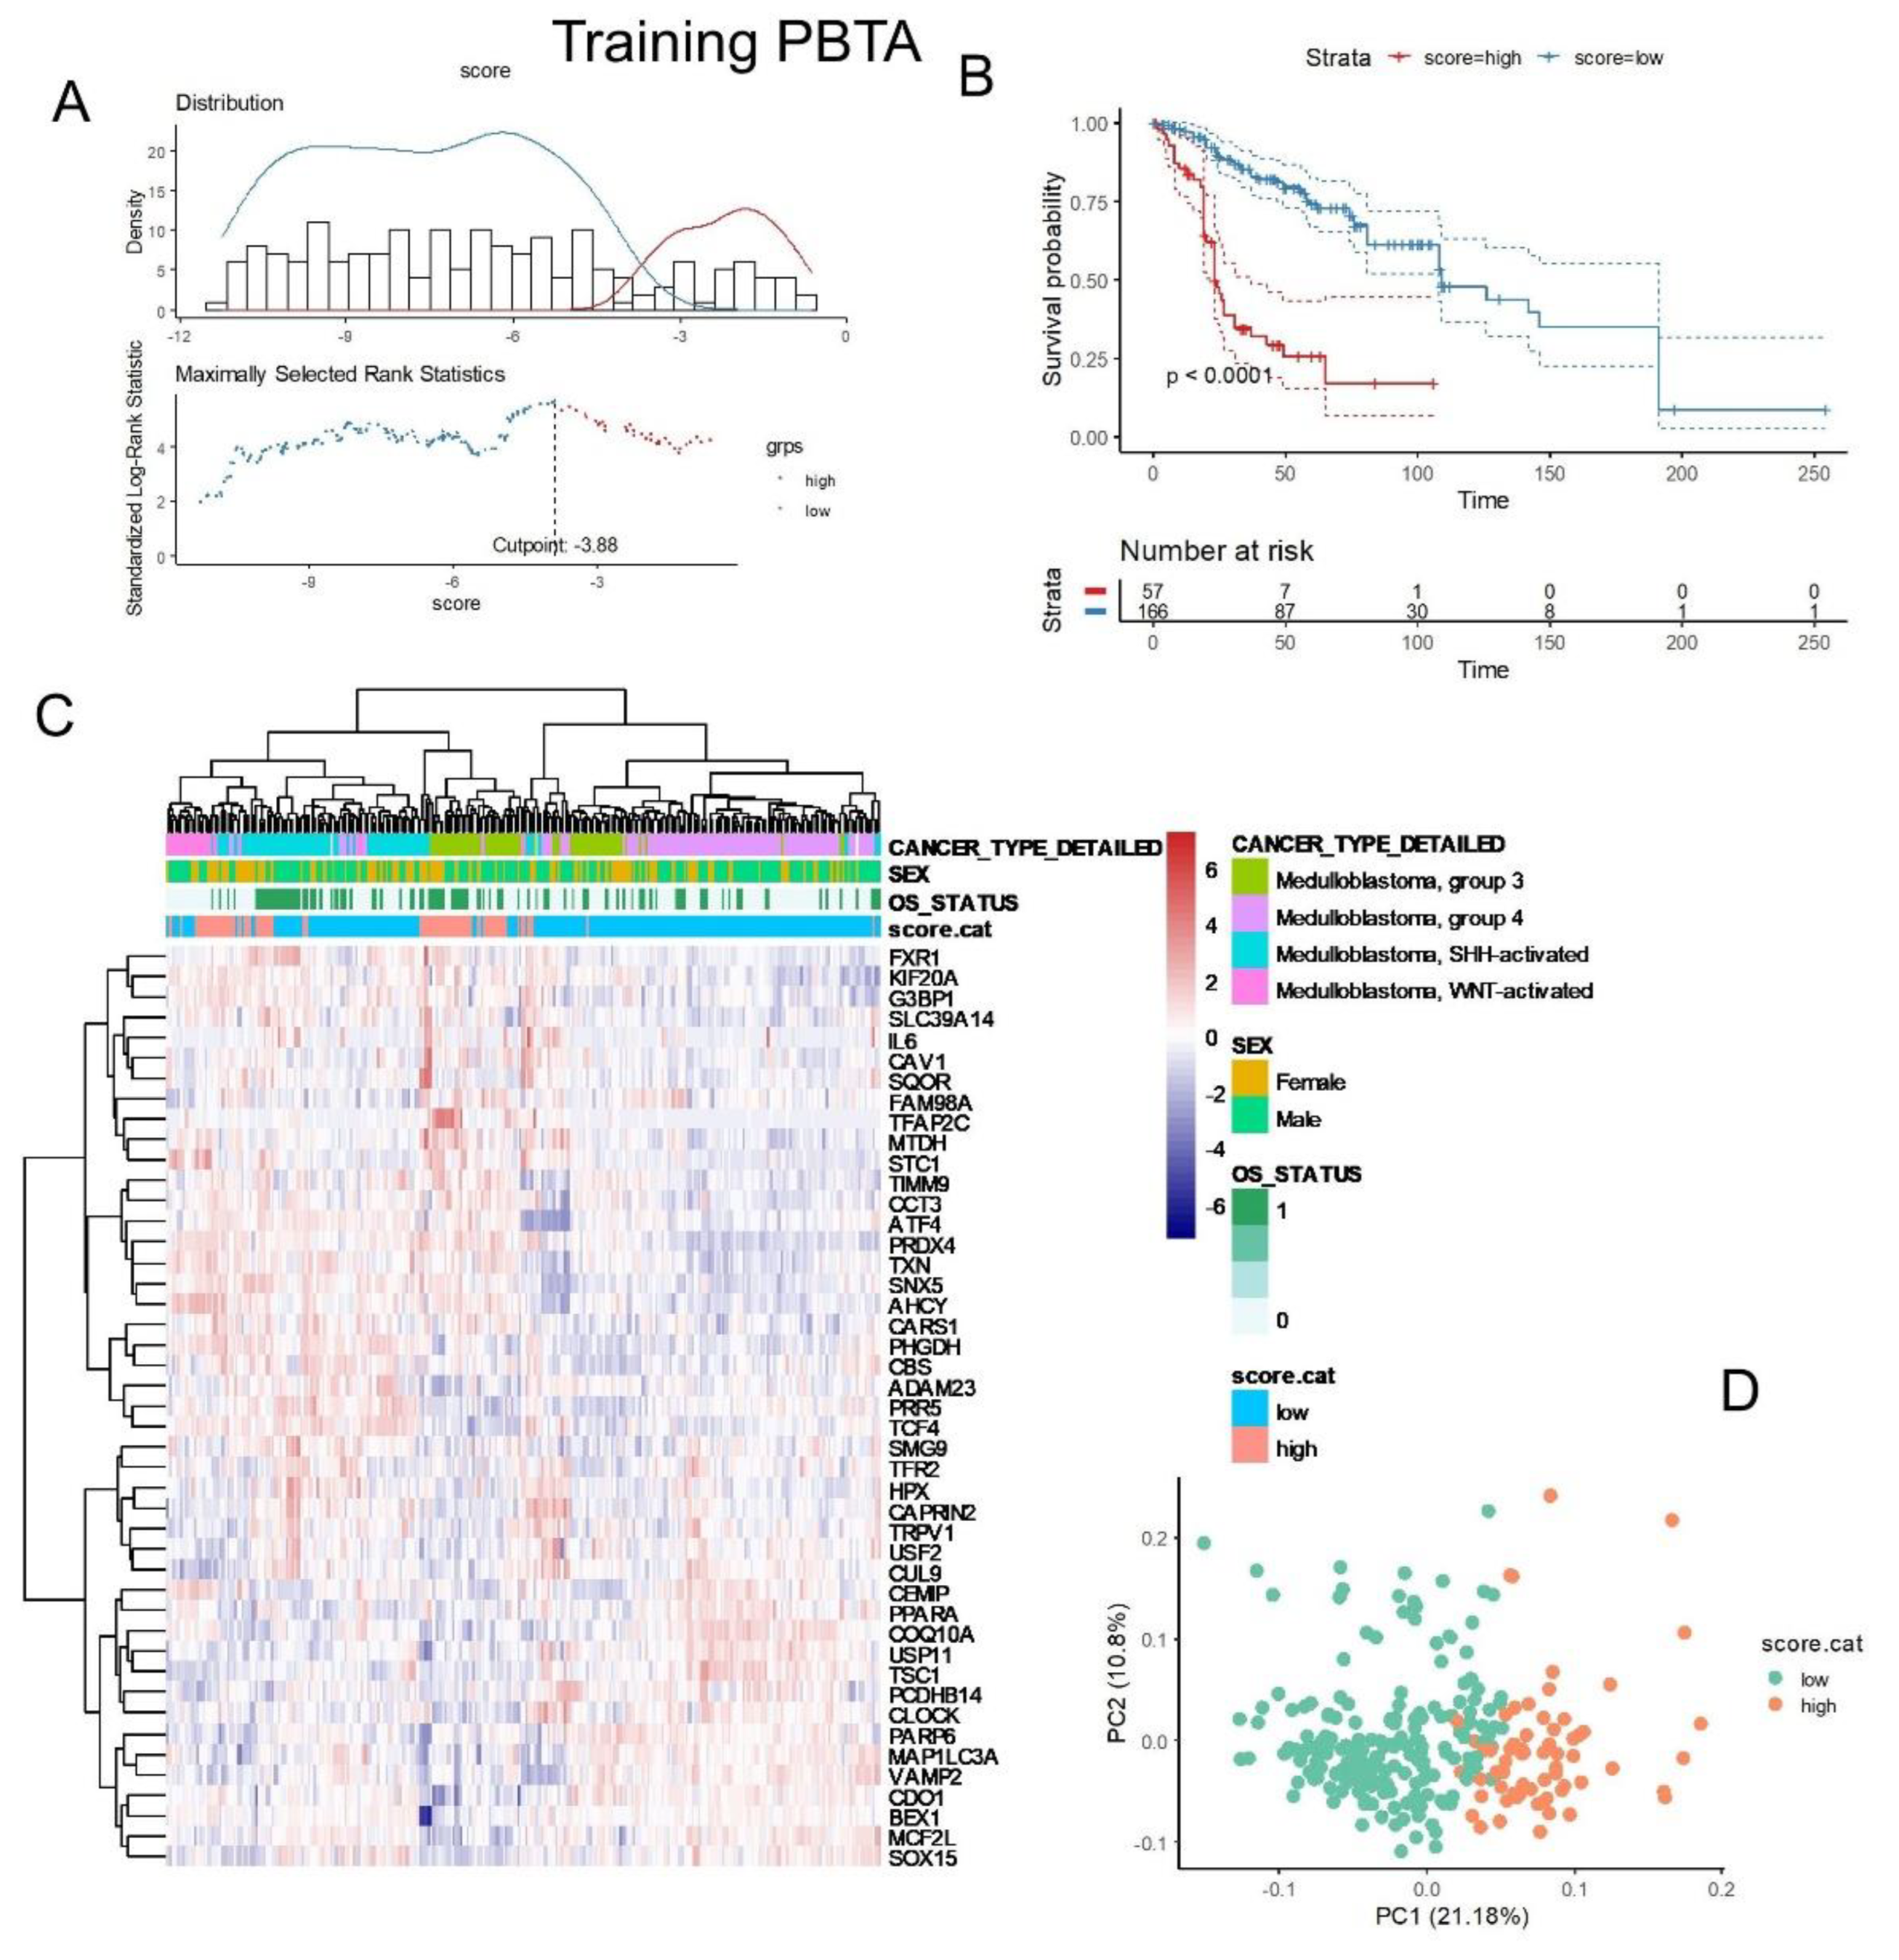
Based on the expression levels and Cox beta coefficients of the 45 ferroptosis molecules from the cross-validated signature (Table 3), a ferroptosis expression score was calculated for two independent cohorts of medulloblastoma tumor transcriptomes. For the PBTA training cohort, an optimal cutoff for the ferroptosis score was determined based on overall patient survival (Figure 7A). Following stratification into two classes, PBTA patients with high ferroptosis scores exhibited significantly worse prognoses compared to those with low scores (log-rank test, p-value < 0.0001, Figure 7B). Specifically, patients in the high-ferroptosis group (n=57) had a median overall survival of 23 months, while those in the low-ferroptosis group (n=166) had a median overall survival of 109 months.
The expression of the 45 ferroptosis molecules allowed for the identification of a leftward cluster of patients enriched in the high-score category, which included patients with a positive death status, particularly from the SHH and G3 molecular subtypes (Figure 7C). Principal component analysis (PCA) based on the expression of these 45 molecules effectively stratified patients into ferroptosis prognostic categories (Figure 7D).
A higher proportion of female patients was observed in the high-score group compared to the low-score group (p-value = 0.016, Table 1). Additionally, the high-score group had significantly higher proportions of recurrence and metastasis (p-value = 0.0002, Table 1). Conversely, the low-score group had a greater proportion of patients from the Group 4 subtype (p-value < 1×10⁻⁴, Table 1).
Unsupervised clustering based on the expression of the 45 ferroptosis prognostic molecules further highlighted a leftward cluster comprising patients from the G3 and SHH subtypes and those in the high-ferroptosis prognostic category (Figure 8C, p-value < 1×10⁻⁴, Table 2). The ferroptosis prognostic categories were confirmed to be well stratified through PCA in the validation cohort (Figure 8D).
Figure 7.
Ferroptosis expression score associated with the overall survival of patients in the PBTA training cohort: (A) Optimal cut-point stratification for the ferroptosis expression score based on overall patient survival. (B) Kaplan-Meier survival analysis and log-rank test for stratification by ferroptosis score in relation to overall patient survival. (C) Expression heatmap and unsupervised clustering (using Euclidean distances) based on the expression profiles of the 45 ferroptosis prognostic molecules. (D) Principal component analysis (PCA) based on the expression of the 45 ferroptosis prognostic molecules, with colors indicating ferroptosis expression score categories.
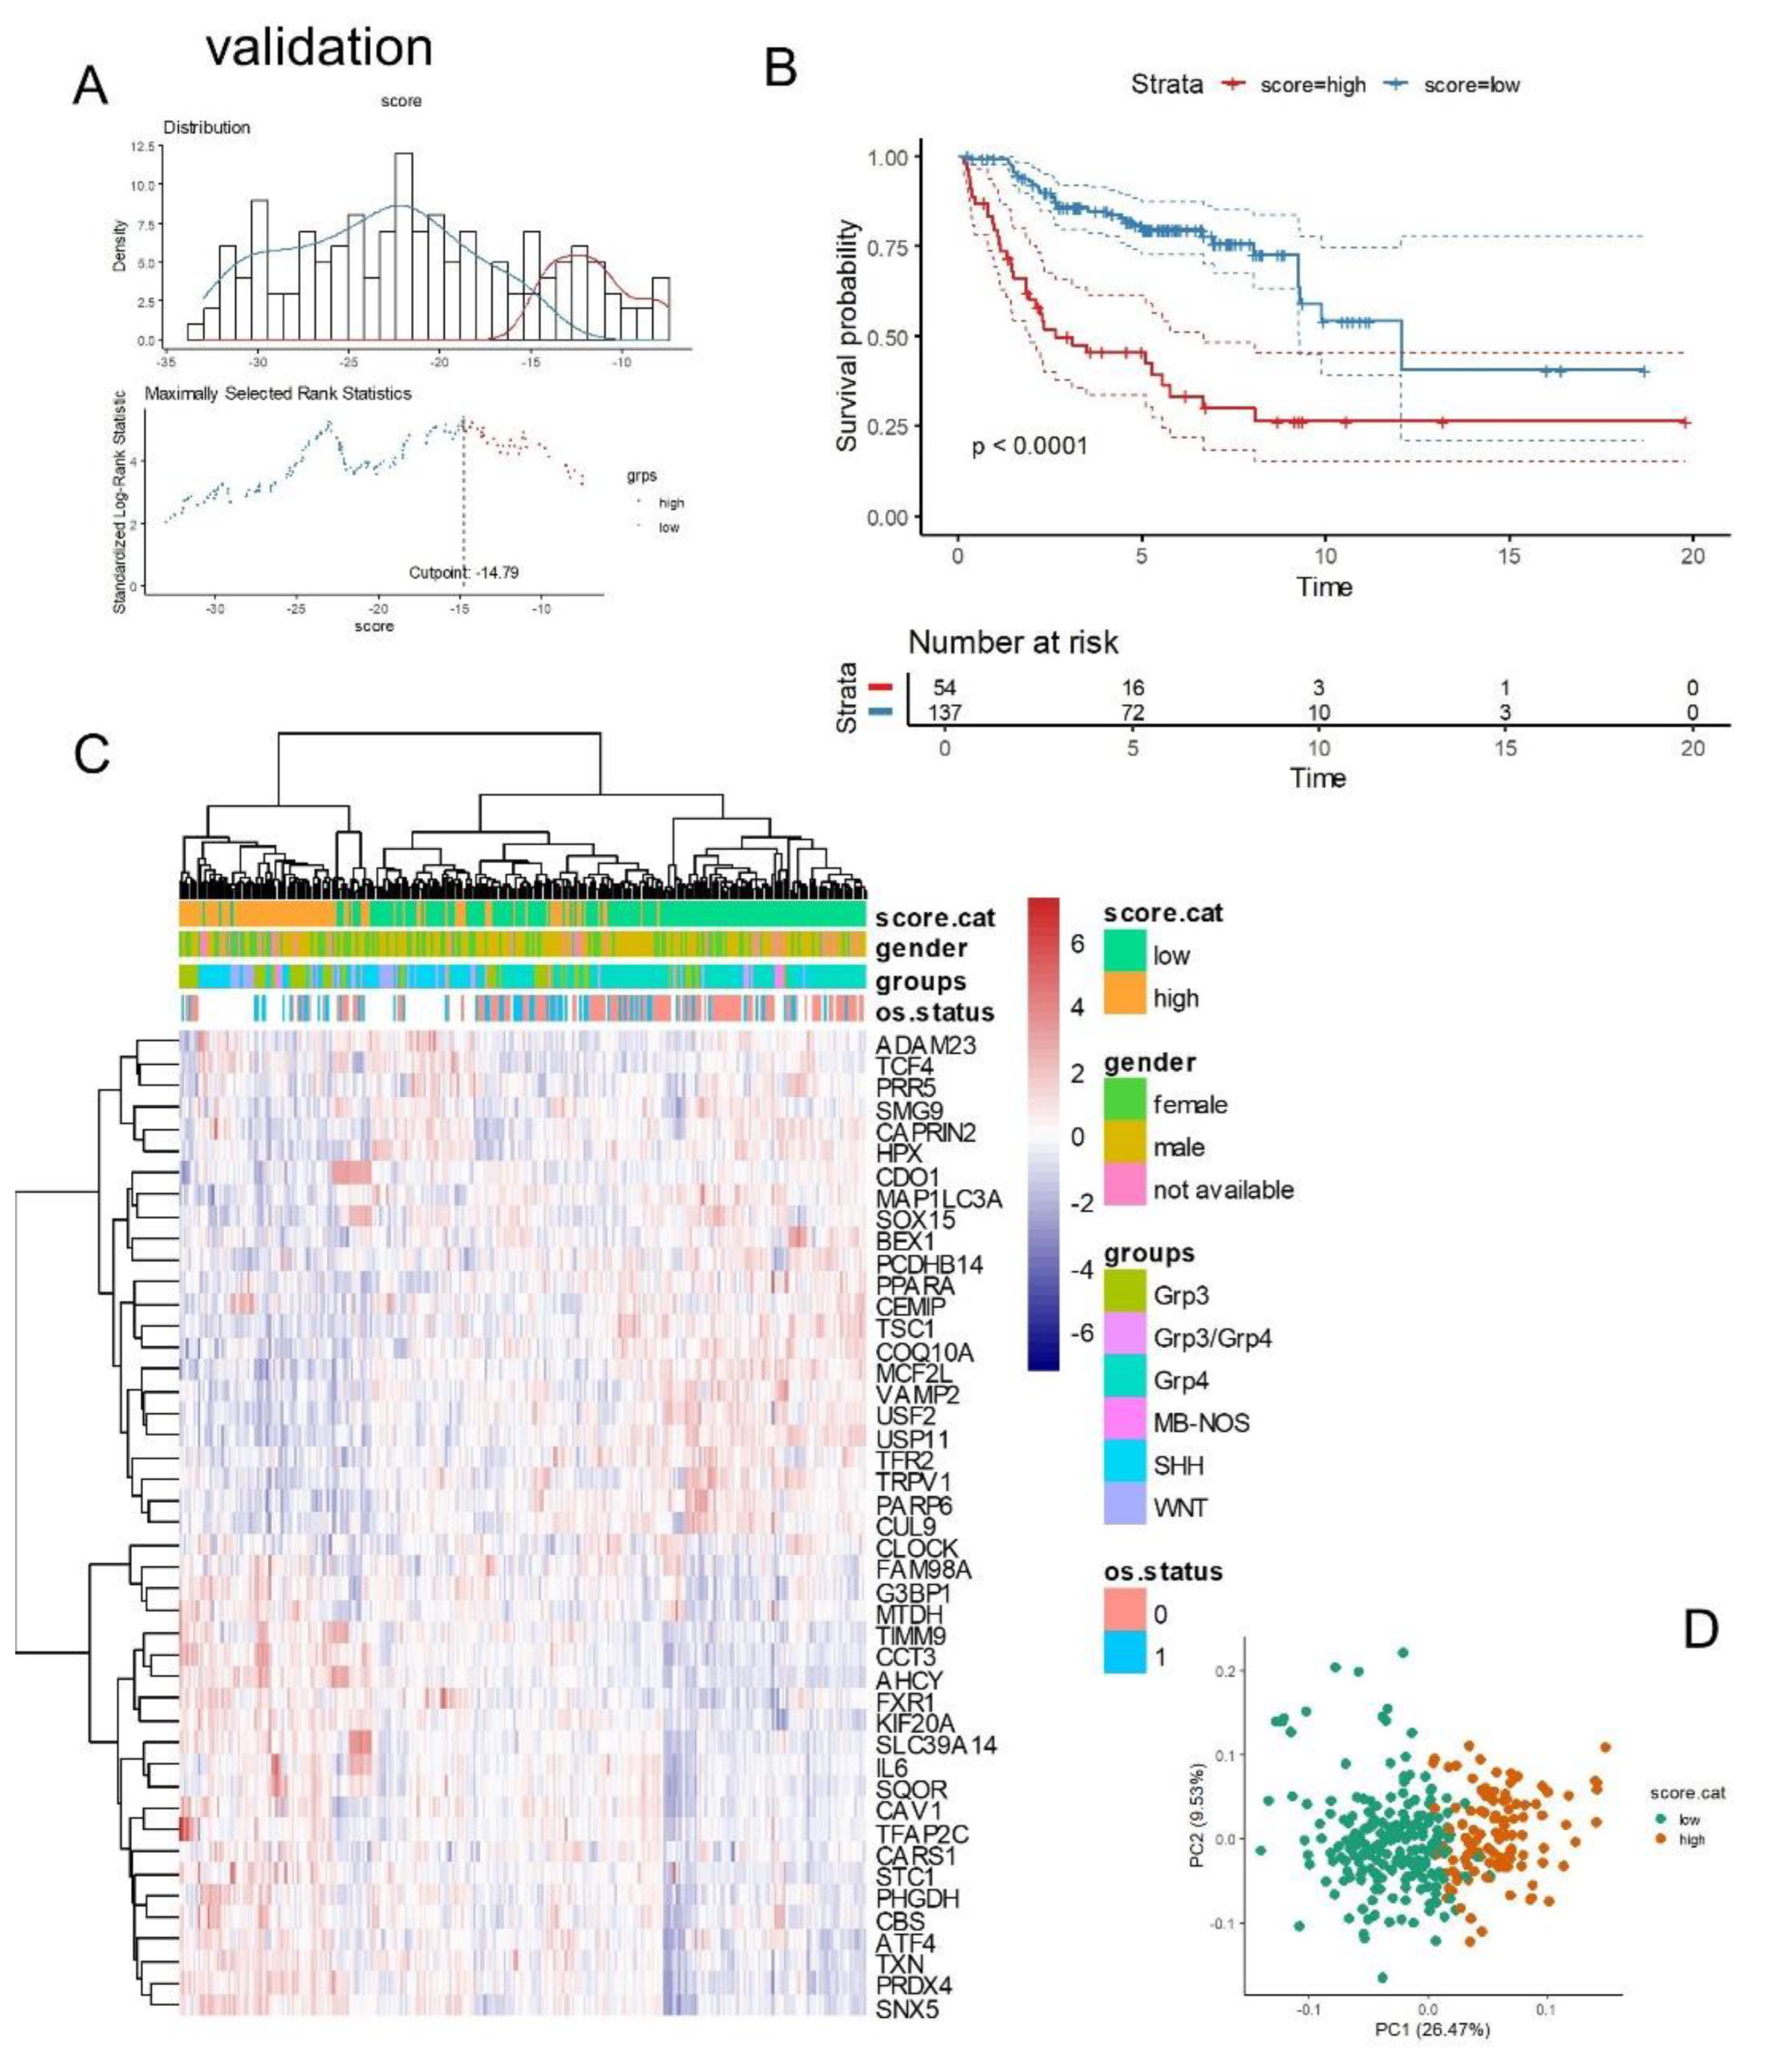
Similarly, in the validation cohort, the ferroptosis expression score was calculated using the expression levels and Cox beta coefficients of the 45 ferroptosis molecules included in the cross-validated signature (Table 3). In this cohort, overall survival data were available only for patients belonging to the G3 and G4 subtypes [23]. An optimal cut-point for the ferroptosis score based on overall survival was determined for the validation cohort (Figure 8A). A significant difference in prognosis (overall survival) was observed between patients with high ferroptosis scores (n=54) and those with low ferroptosis scores (n=137) (log-rank test, p-value < 0.0001, Figure 8B). Specifically, high-ferroptosis score patients in the validation cohort had a median overall survival of 2.68 years, compared to 12.07 years for low-ferroptosis score patients.
Figure 8.
Ferroptosis expression score associated with overall survival of patients in the validation cohort: (A) Optimal cut-point stratification for the ferroptosis expression score based on overall patient survival. (B) Kaplan-Meier survival analysis and log-rank test for stratification by ferroptosis score in relation to overall survival. (C) Expression heatmap and unsupervised clustering (using Euclidean distances) based on the expression profiles of the 45 ferroptosis prognostic molecules. (D) Principal component analysis (PCA) based on the expression of the 45 ferroptosis prognostic molecules, with colors indicating ferroptosis expression score categories.
3.5. Ferroptosis Expression Score is an Independent Adverse Prognosis Marker During Medulloblastoma
As the ferroptosis score was strongly associated with patient prognosis in univariate analyses across two independent cohorts, an evaluation of its independence as a prognostic marker was performed through the construction of a multivariable overall survival model. The PBTA medulloblastoma cohort included several annotated clinical parameters (Table 1), and overall survival information was available for the majority of patients. An optimal cut-point for age at diagnosis was determined, identifying 15 years as the threshold (Supplemental Figure S4A-B). Since no positive death events were observed in patients with the WNT subtype (Supplemental Figure S4C), these patients were excluded from the multivariable analysis.
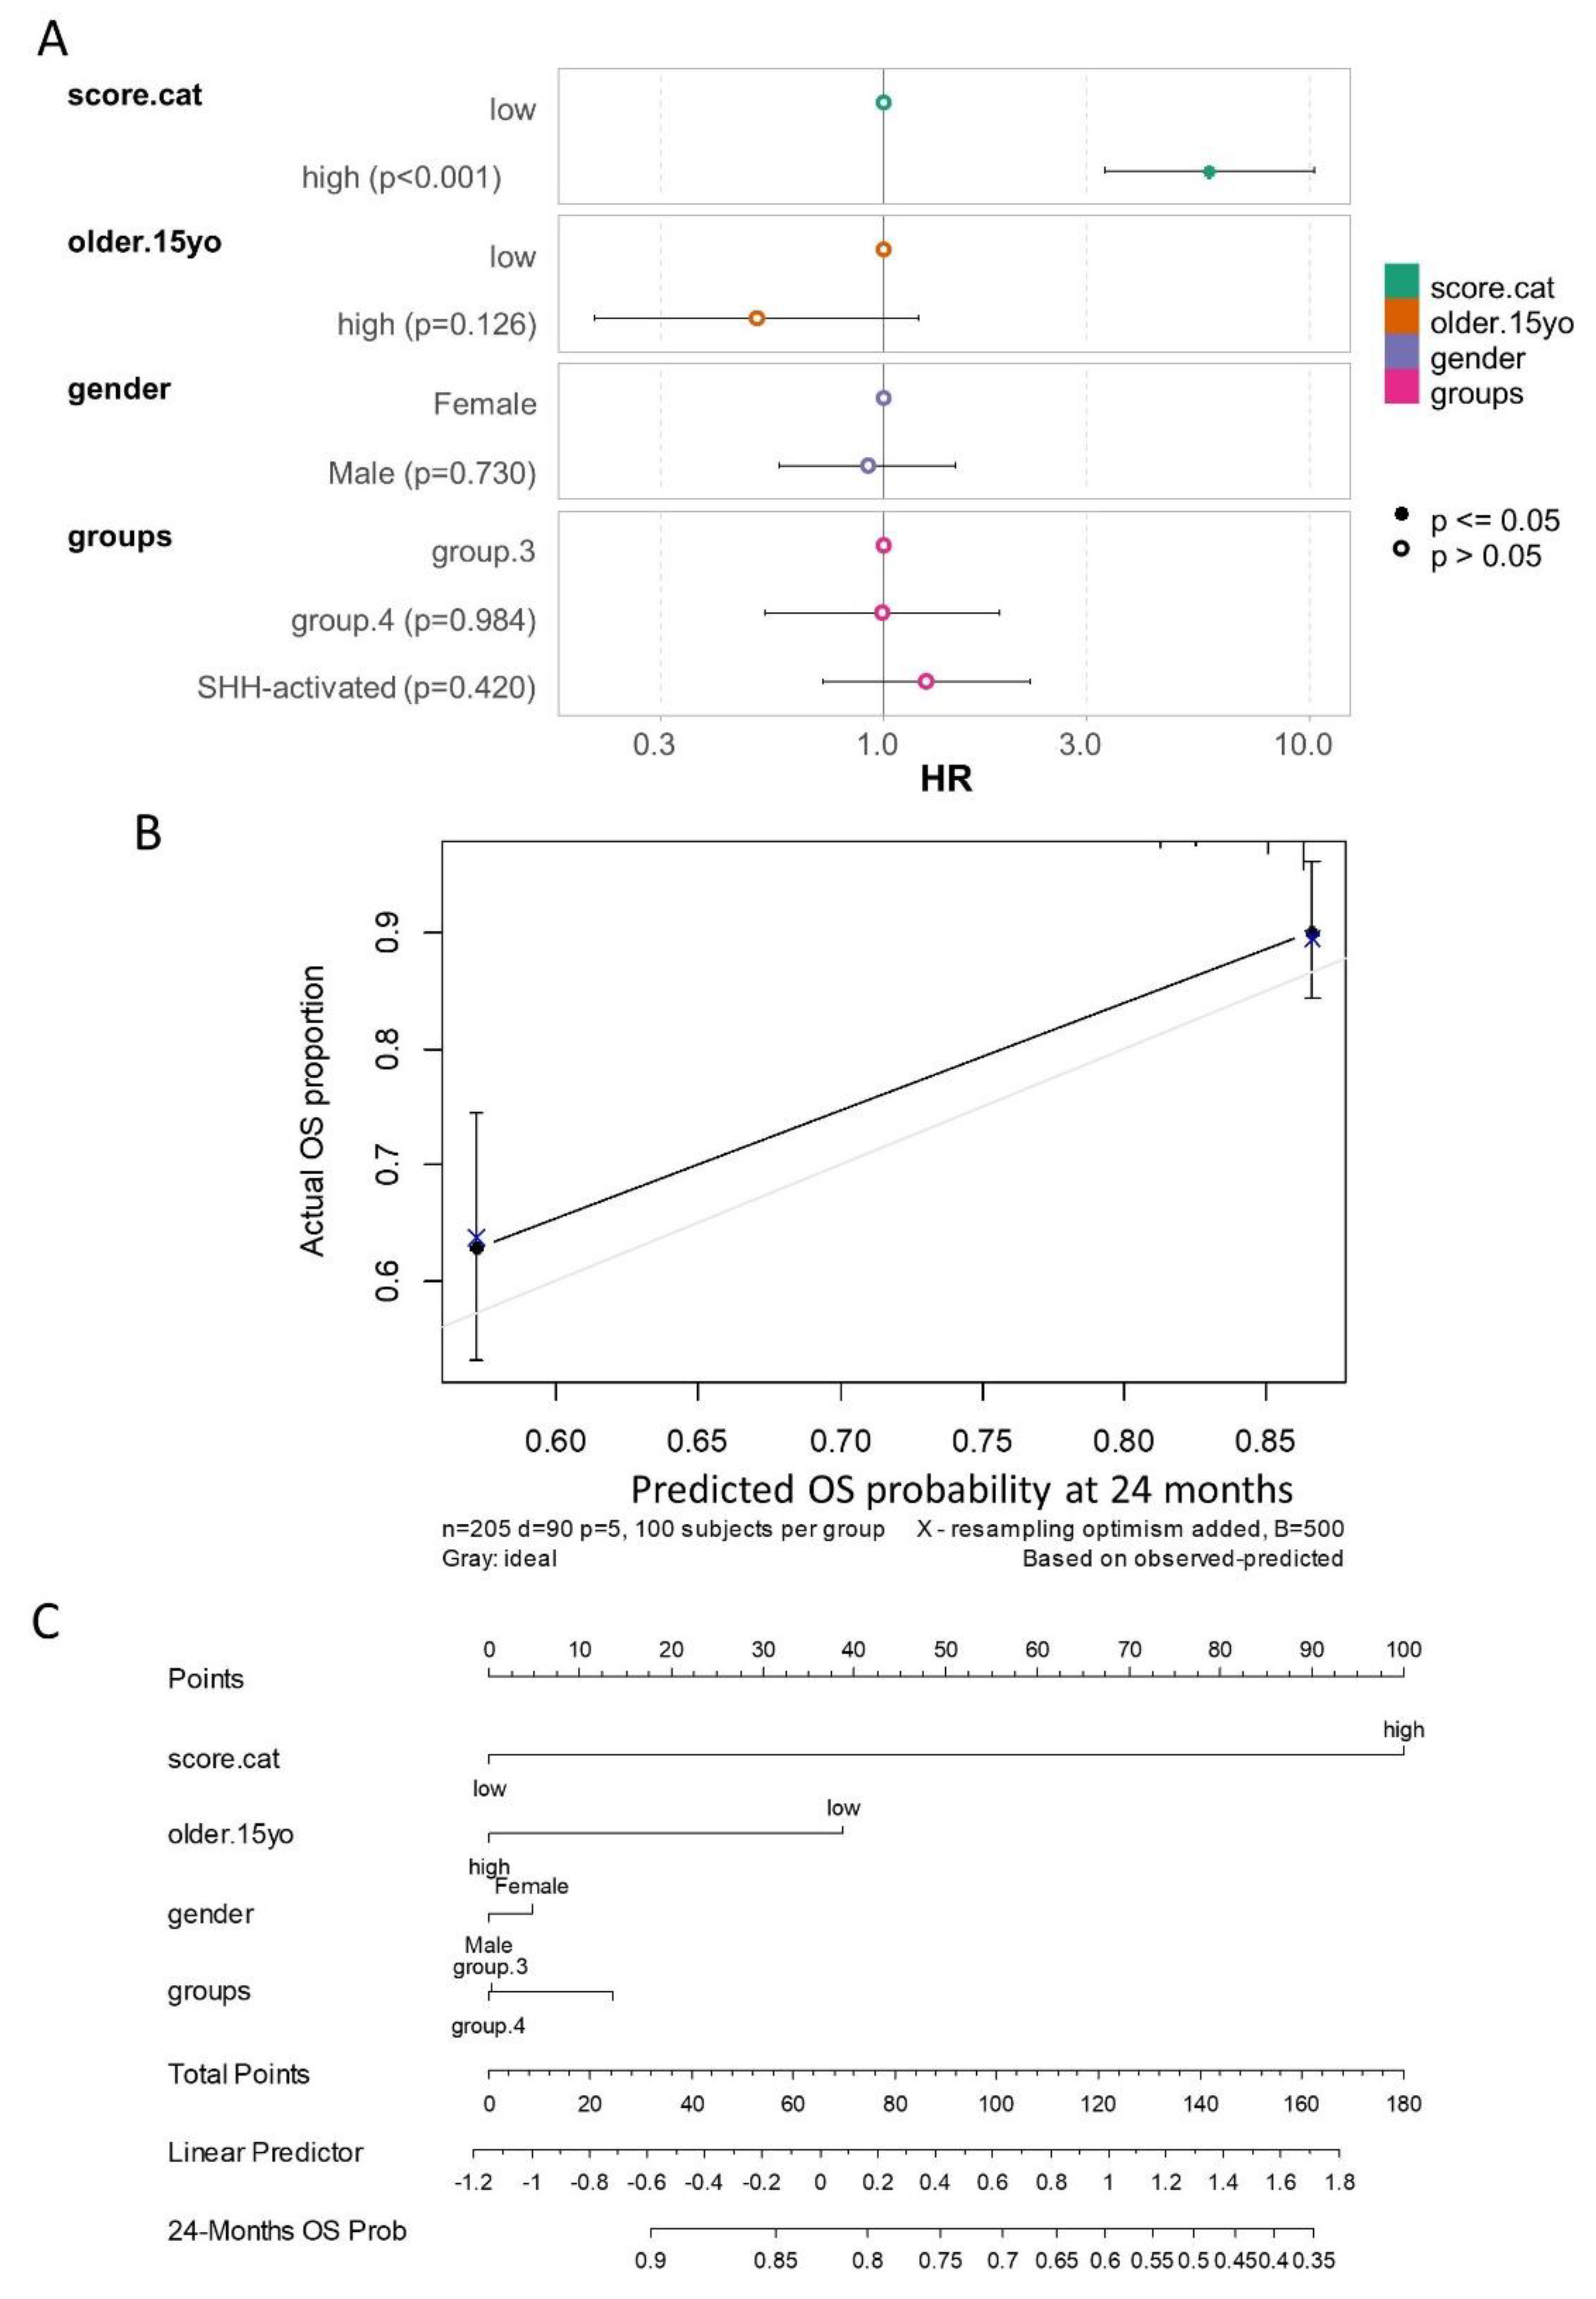
The multivariable overall survival model incorporated ferroptosis score categories, age at diagnosis categories, gender, and molecular subtypes. Global and individual Schoenfeld residual tests confirmed the linearity of residuals for each included covariate (Supplemental Figure S4D). The log-rank test for the multivariable model yielded a highly significant p-value (<2×10⁻¹⁶, Figure 9A). The model demonstrated a concordance index of 0.742 (standard error: 0.026), indicating strong predictive accuracy.
In this multivariable analysis, the ferroptosis expression score was confirmed as an independent adverse prognostic marker (Figure 9A, Table 4), with a hazard ratio of 5.84 (95% confidence interval: 3.31–10.28) for high-score patients compared to low-score patients, and a multivariable p-value of 1.04×10⁻⁹.
Following calibration with 500 bootstrap iterations of the multivariable model, prediction stability was achieved at 24 months of follow-up (Figure 9B). The calibrated nomogram of the multivariable overall survival model further emphasized the critical role of the ferroptosis score in predicting patient prognosis at 24 months of follow-up (Figure 9C).
Figure 9.
Multivariable overall survival model evaluating the prognosis of medulloblastoma in the PBTA cohort: (A) Forest plot of the multivariable overall survival model, including ferroptosis score categories (score.cat), age at diagnosis (older.15yo), gender, and molecular subtypes of patients as covariates (HR: hazard ratios). (B) Calibration of the multivariable overall survival model using 500 bootstrap iterations for prediction at 24 months of follow-up. (C) Nomogram of the calibrated overall survival model for predicting prognosis at 24 months of follow-up.
4. Discussion
Ferroptosis, an iron-dependent form of non-apoptotic cell death, is characterized by the accumulation of lipid peroxidation products and lethal reactive oxygen species (ROS) generated through iron metabolism [40]. In medulloblastoma, cell radioresistance has been linked to integrin-αvβ3 expression. β3-depleted (β3_KO) medulloblastoma cells exhibit lipid hydroperoxide accumulation after radiotherapy, indicating ferroptosis, a regulated cell death process induced by ROS and inhibited by antioxidants such as cysteine, glutathione (GSH), and glutathione peroxidase 4 (GPx4) [41]. This study found that the regulation of this pathway is associated with the molecular classification of medulloblastoma into four subgroups, involving processes such as cellular responses to oxidative stress and hypoxia, and more specifically the regulation of trans-synaptic signaling.
During medulloblastoma therapy combining the topoisomerase I inhibitor camptothecin (CPT) and the agonistic anti-Fas antibody (CH-11), it was shown that these agents synergize with Fas activation to induce cell death through mechanisms involving ROS and oxidative stress pathways [42]. Consequently, the cellular response to oxidative stress could serve as a potential marker for therapy sensitivity, particularly for treatments that induce cell death. Hypoxia-inducible factor-1 (HIF-1) activation, driven by mitochondrial ROS formation, shifts cellular metabolism from oxidative phosphorylation (OXPHOS) to glycolysis by upregulating glycolytic enzymes, thereby promoting tumor progression and metastasis [43].
Part of the ferroptosis transcriptional program identified in this study is implicated in epigenetic regulation and nucleosome organization, both of which are associated with disease recurrence. Mutations in epigenetic regulators affecting H3K27 and H3K4 trimethylation have been reported in G3 and G4 medulloblastoma subtypes [44]. Loss of H3K27 trimethylation contributes to radiotherapy resistance in medulloblastoma and creates a vulnerability that can be targeted with BET inhibition [45].
A cross-validated ferroptosis signature associated with medulloblastoma prognosis was identified. Patients with high ferroptosis scores exhibited poorer outcomes and were predominantly enriched in the G3 and SHH-activated subtypes. Notably, G3 tumors are associated with poor prognosis, while SHH tumors have an intermediate prognosis [5,46]. Within the protein-protein interaction (PPI) network derived from this signature, IL6 and CBS emerged as central hub genes (Figure 6A) and were also identified as unfavorable markers (Table 3). IL6 has been shown to promote medulloblastoma cell viability, proliferation, and glycolysis [47]. In G3 medulloblastoma, autocrine IL6 signaling activates the STAT3 pathway, contributing to drug resistance; thus, targeting the IL6/STAT3 axis has been proposed as a therapeutic strategy for G3 medulloblastoma [48].
Cystathionine Beta-Synthase (CBS), involved in the trans-sulfuration pathway, facilitates the conversion of homocysteine to cystathionine [49,50]. The PPI network of the cross-validated signature was enriched in processes such as cysteine-methionine catabolism, nutrient response pathways, trans-sulfuration, and one-carbon metabolism. Trans-sulfuration, a key component of one-carbon metabolism, is crucial for converting homocysteine into cystathionine and subsequently into cysteine, which is essential for glutathione synthesis, a potent antioxidant [51]. Nutrient deprivation is a common stressor in the brain tumor microenvironment [52].
Among the unfavorable ferroptosis genes dysregulated in medulloblastoma were CCT3, SNX5, SQOR, G3BP1, CARS1, SLC39A14, FAM98A, FXR1, TFAP2C, and ATF4 (Table 3). Their roles in ferroptosis have been well-documented. For instance:
- —
- CCT3 silencing induces ferroptosis via the NOD1-NF-κB signaling pathway in bladder cancer [53].
- —
- SNX5 promotes ferroptosis in Parkinson's disease, with knockdown experiments reducing intracellular lipid peroxidation and Fe²⁺ accumulation [54].
- —
- SQOR is implicated in selenium-dependent ferroptosis suppression [55].
- —
- G3BP1 mediates nuclear sequestration of p53, influencing apoptosis and ferroptosis [56].
- —
- CARS1 regulates GPX4 expression to induce ferroptosis [57].
- —
- SLC39A14, a divalent metal transporter, mediates manganese, zinc, iron, and cadmium uptake; silencing SLC39A14 inhibits glioblastoma ferroptosis and progression [58].
- —
- FAM98A suppresses ferroptosis, promoting resistance to 5-fluorouracil in colorectal cancer [59].
- —
- FXR1 modulates glioma sensitivity to temozolomide by regulating ferroptosis [60].
- —
- TFAP2C directly upregulates GPX4 expression in response to selenium supplementation, reducing brain injury from hemorrhagic stroke [61].
- —
Finally, in a multivariable overall survival model incorporating age, gender, and molecular classification, the ferroptosis score was confirmed as an independent adverse prognostic marker for medulloblastoma. The significance of trans-sulfuration in this context underscores its role in glutathione biosynthesis, providing a mechanistic link to ferroptosis regulation and therapeutic resistance.
5. Conclusions
This study establishes a strong link between the ferroptosis transcriptional program and medulloblastoma molecular subtypes, identifying a cross-validated ferroptosis signature associated with patient prognosis. High ferroptosis scores were confirmed as independent adverse prognostic markers in two independent cohorts, with IL6 and CBS highlighted as key hub genes driving unfavorable outcomes. Our findings underscore the importance of ferroptosis regulation in medulloblastoma pathogenesis and recurrence, offering valuable insights into subtype-specific vulnerabilities. The ferroptosis score represents a promising tool for patient stratification and therapeutic monitoring, particularly in the context of ferroptosis-targeting interventions. Future studies should explore the clinical translation of these findings to enhance therapeutic outcomes for medulloblastoma patients.
Supplementary Materials
Supplemental Figures: Supplemental Figure S1. RNA-sequencing preprocess of training cohort of Medulloblastoma tumors; Supplemental Figure S2. RNA-sequencing preprocess of validation cohort of Medulloblastoma tumors: RNA-sequencing preprocess of training cohort of Medulloblastoma tumors; Supplemental Figure S3. Preprocess for gene regulated network (WGCNA) for ferroptosis related genes in PBTA RNA-sequencing cohort; Supplemental Figure S4. Accessory data for the construction of the multivariable overall survival model on PBTA cohort with exclusion of WNT-subgroup; Supplemental Tables: Supplemental Table S1. Univariate overall survival Cox analyses performed on expression of ferroptosis related genes in training cohort; Supplemental Table S2. Univariate overall survival Cox analyses performed on expression of ferroptosis related genes in validation cohort.
Author Contributions
J.M.-G. and R.F designed the study. C.D. analyzed and interpreted the data and wrote the manuscript. C.D. performed most of the experiments, with contributions from Y.F., J.B-M and C.M. P.P. contributed to manuscript correction and data analysis. All authors have read and agreed to the published version of the manuscript.
Funding
P.P. and J.M-G. received the funding for this study from MEAE AMBASS FRANCE AU PEROU FSPI—S-AC23007, Filière Santé Maladie Rare du Foie de l’Adulte et de l’Enfant.
Institutional Review Board Statement
The study was conducted in accordance with the Declaration of Helsinki, and approved by institutional boards from original source of data: PBTA consortium and Williamson cohorts. No animals were used during this study.
Informed Consent Statement
Informed consent was obtained from all subjects involved during the process of the two independent cohorts of RNA-sequencing: PBTA and Williamson original studies.
Data Availability Statement
Scripts computed during this study are available at the following web address: https://github.com/cdesterke/scriptsForFerroptosisMedulloblastoma (accessed on 2024, December 7th).
Acknowledgments
Many thanks to Pediatric Brain Tumor Atlas consortium and Williamson et al to made avaiblable and open access their RNA-sequencing performed on medulloblastoma tumors
Conflicts of Interest
The authors declare no conflicts of interest.
References
- Gajjar, A.J.; Robinson, G.W. Medulloblastoma—Translating Discoveries from the Bench to the Bedside. Nat. Rev. Clin. Oncol. 2014, 11, 714–722. [Google Scholar] [CrossRef]
- Packer, R.J.; Gajjar, A.; Vezina, G.; Rorke-Adams, L.; Burger, P.C.; Robertson, P.L.; Bayer, L.; LaFond, D.; Donahue, B.R.; Marymont, M.H.; et al. Phase III Study of Craniospinal Radiation Therapy Followed by Adjuvant Chemotherapy for Newly Diagnosed Average-Risk Medulloblastoma. J. Clin. Oncol. 2006, 24, 4202–4208. [Google Scholar] [CrossRef] [PubMed]
- Gajjar, A.; Chintagumpala, M.; Ashley, D.; Kellie, S.; Kun, L.E.; Merchant, T.E.; Woo, S.; Wheeler, G.; Ahern, V.; Krasin, M.J.; et al. Risk-Adapted Craniospinal Radiotherapy Followed by High-Dose Chemotherapy and Stem-Cell Rescue in Children with Newly Diagnosed Medulloblastoma (St Jude Medulloblastoma-96): Long-Term Results from a Prospective, Multicentre Trial. Lancet Oncol. 2006, 7, 813–820. [Google Scholar] [CrossRef] [PubMed]
- Rutkowski, S.; Bode, U.; Deinlein, F.; Ottensmeier, H.; Warmuth-Metz, M.; Soerensen, N.; Graf, N.; Emser, A.; Pietsch, T.; Wolff, J.E.A.; et al. Treatment of Early Childhood Medulloblastoma by Postoperative Chemotherapy Alone. N. Engl. J. Med. 2005, 352, 978–986. [Google Scholar] [CrossRef] [PubMed]
- Cho, Y.-J.; Tsherniak, A.; Tamayo, P.; Santagata, S.; Ligon, A.; Greulich, H.; Berhoukim, R.; Amani, V.; Goumnerova, L.; Eberhart, C.G.; et al. Integrative Genomic Analysis of Medulloblastoma Identifies a Molecular Subgroup That Drives Poor Clinical Outcome. J. Clin. Oncol. 2011, 29, 1424–1430. [Google Scholar] [CrossRef]
- Fattet, S.; Haberler, C.; Legoix, P.; Varlet, P.; Lellouch-Tubiana, A.; Lair, S.; Manie, E.; Raquin, M.; Bours, D.; Carpentier, S.; et al. Beta-catenin Status in Paediatric Medulloblastomas: Correlation of Immunohistochemical Expression with Mutational Status, Genetic Profiles, and Clinical Characteristics. J. Pathol. 2009, 218, 86–94. [Google Scholar] [CrossRef] [PubMed]
- Kool, M.; Koster, J.; Bunt, J.; Hasselt, N.E.; Lakeman, A.; Van Sluis, P.; Troost, D.; Meeteren, N.S.; Caron, H.N.; Cloos, J.; et al. Integrated Genomics Identifies Five Medulloblastoma Subtypes with Distinct Genetic Profiles, Pathway Signatures and Clinicopathological Features. PLoS ONE 2008, 3, e3088. [Google Scholar] [CrossRef] [PubMed]
- Northcott, P.A.; Korshunov, A.; Witt, H.; Hielscher, T.; Eberhart, C.G.; Mack, S.; Bouffet, E.; Clifford, S.C.; Hawkins, C.E.; French, P.; et al. Medulloblastoma Comprises Four Distinct Molecular Variants. J. Clin. Oncol. 2011, 29, 1408–1414. [Google Scholar] [CrossRef]
- Thompson, M.C.; Fuller, C.; Hogg, T.L.; Dalton, J.; Finkelstein, D.; Lau, C.C.; Chintagumpala, M.; Adesina, A.; Ashley, D.M.; Kellie, S.J.; et al. Genomics Identifies Medulloblastoma Subgroups That Are Enriched for Specific Genetic Alterations. J. Clin. Oncol. 2006, 24, 1924–1931. [Google Scholar] [CrossRef]
- Hovestadt, V.; Jones, D.T.W.; Picelli, S.; Wang, W.; Kool, M.; Northcott, P.A.; Sultan, M.; Stachurski, K.; Ryzhova, M.; Warnatz, H.-J.; et al. Decoding the Regulatory Landscape of Medulloblastoma Using DNA Methylation Sequencing. Nature 2014, 510, 537–541. [Google Scholar] [CrossRef]
- Schwalbe, E.C.; Williamson, D.; Lindsey, J.C.; Hamilton, D.; Ryan, S.L.; Megahed, H.; Garami, M.; Hauser, P.; Dembowska-Baginska, B.; Perek, D.; et al. DNA Methylation Profiling of Medulloblastoma Allows Robust Subclassification and Improved Outcome Prediction Using Formalin-Fixed Biopsies. Acta Neuropathol. (Berl.) 2013, 125, 359–371. [Google Scholar] [CrossRef] [PubMed]
- Taylor, M.D.; Northcott, P.A.; Korshunov, A.; Remke, M.; Cho, Y.-J.; Clifford, S.C.; Eberhart, C.G.; Parsons, D.W.; Rutkowski, S.; Gajjar, A.; et al. Molecular Subgroups of Medulloblastoma: The Current Consensus. Acta Neuropathol. (Berl.) 2012, 123, 465–472. [Google Scholar] [CrossRef]
- Dixon, S.J.; Lemberg, K.M.; Lamprecht, M.R.; Skouta, R.; Zaitsev, E.M.; Gleason, C.E.; Patel, D.N.; Bauer, A.J.; Cantley, A.M.; Yang, W.S.; et al. Ferroptosis: An Iron-Dependent Form of Nonapoptotic Cell Death. Cell 2012, 149, 1060–1072. [Google Scholar] [CrossRef] [PubMed]
- Yu, H.; Guo, P.; Xie, X.; Wang, Y.; Chen, G. Ferroptosis, a New Form of Cell Death, and Its Relationships with Tumourous Diseases. J. Cell. Mol. Med. 2017, 21, 648–657. [Google Scholar] [CrossRef] [PubMed]
- Popa-Wagner, A.; Mitran, S.; Sivanesan, S.; Chang, E.; Buga, A.-M. ROS and Brain Diseases: The Good, the Bad, and the Ugly. Oxid. Med. Cell. Longev. 2013, 2013, 1–14. [Google Scholar] [CrossRef] [PubMed]
- Segui, F.; Daher, B.; Gotorbe, C.; Pouyssegur, J.; Picco, V.; Vucetic, M. Revealing the Ferroptotic Phenotype of Medulloblastoma. J. Vis. Exp. 2024, 66645. [Google Scholar] [CrossRef] [PubMed]
- Zhou, H.; Wang, Y.; Wu, M.; Lan, X.; Xiang, D.; Cai, R.; Ma, Q.; Miao, J.; Fang, X.; Wang, J.; et al. FANCD2 Deficiency Sensitizes SHH Medulloblastoma to Radiotherapy via Ferroptosis. J. Pathol. 2024, 262, 427–440. [Google Scholar] [CrossRef] [PubMed]
- Xie, W.; Wang, J.; Tian, S.; Zhao, H.; Cao, L.; Liang, Z.; Yang, J.; Zhao, Y.; Wang, B.; Jiang, F.; et al. RNF126-Mediated Ubiquitination of FSP1 Affects Its Subcellular Localization and Ferroptosis. Oncogene 2024, 43, 1463–1475. [Google Scholar] [CrossRef] [PubMed]
- Zhu, J.; Xiong, Y.; Zhang, Y.; Wen, J.; Cai, N.; Cheng, K.; Liang, H.; Zhang, W. The Molecular Mechanisms of Regulating Oxidative Stress-Induced Ferroptosis and Therapeutic Strategy in Tumors. Oxid. Med. Cell. Longev. 2020, 2020, 1–14. [Google Scholar] [CrossRef] [PubMed]
- Fan, Z.; Wirth, A.-K.; Chen, D.; Wruck, C.J.; Rauh, M.; Buchfelder, M.; Savaskan, N. Nrf2-Keap1 Pathway Promotes Cell Proliferation and Diminishes Ferroptosis. Oncogenesis 2017, 6, e371–e371. [Google Scholar] [CrossRef]
- Shapiro, J.A.; Gaonkar, K.S.; Spielman, S.J.; Savonen, C.L.; Bethell, C.J.; Jin, R.; Rathi, K.S.; Zhu, Y.; Egolf, L.E.; Farrow, B.K.; et al. OpenPBTA: The Open Pediatric Brain Tumor Atlas. Cell Genomics 2023, 3, 100340. [Google Scholar] [CrossRef] [PubMed]
- Gao, J.; Aksoy, B.A.; Dogrusoz, U.; Dresdner, G.; Gross, B.; Sumer, S.O.; Sun, Y.; Jacobsen, A.; Sinha, R.; Larsson, E.; et al. Integrative Analysis of Complex Cancer Genomics and Clinical Profiles Using the cBioPortal. Sci. Signal. 2013, 6, pl1. [Google Scholar] [CrossRef] [PubMed]
- Williamson, D.; Schwalbe, E.C.; Hicks, D.; Aldinger, K.A.; Lindsey, J.C.; Crosier, S.; Richardson, S.; Goddard, J.; Hill, R.M.; Castle, J.; et al. Medulloblastoma Group 3 and 4 Tumors Comprise a Clinically and Biologically Significant Expression Continuum Reflecting Human Cerebellar Development. Cell Rep. 2022, 40, 111162. [Google Scholar] [CrossRef] [PubMed]
- Zhao, Y.; Wong, L.; Goh, W.W.B. How to Do Quantile Normalization Correctly for Gene Expression Data Analyses. Sci. Rep. 2020, 10, 15534. [Google Scholar] [CrossRef]
- Zhou, N.; Yuan, X.; Du, Q.; Zhang, Z.; Shi, X.; Bao, J.; Ning, Y.; Peng, L. FerrDb V2: Update of the Manually Curated Database of Ferroptosis Regulators and Ferroptosis-Disease Associations. Nucleic Acids Res. 2023, 51, D571–D582. [Google Scholar] [CrossRef]
- Desterke, C.; Xiang, Y.; Elhage, R.; Duruel, C.; Chang, Y.; Hamaï, A. Ferroptosis Inducers Upregulate PD-L1 in Recurrent Triple-Negative Breast Cancer. Cancers 2023, 16, 155. [Google Scholar] [CrossRef]
- Leek, J.T.; Johnson, W.E.; Parker, H.S.; Jaffe, A.E.; Storey, J.D. The Sva Package for Removing Batch Effects and Other Unwanted Variation in High-Throughput Experiments. Bioinforma. Oxf. Engl. 2012, 28, 882–883. [Google Scholar] [CrossRef] [PubMed]
- Horvath, S. Weighted Network Analysis; Applications in Genomics and Systems Biology; Springer, 2011; ISBN 978-1-4419-8819-5.
- Langfelder, P.; Horvath, S. WGCNA: An R Package for Weighted Correlation Network Analysis. BMC Bioinformatics 2008, 9, 559. [Google Scholar] [CrossRef] [PubMed]
- Wu, T.; Hu, E.; Xu, S.; Chen, M.; Guo, P.; Dai, Z.; Feng, T.; Zhou, L.; Tang, W.; Zhan, L.; et al. clusterProfiler 4.0: A Universal Enrichment Tool for Interpreting Omics Data. The Innovation 2021, 2, 100141. [Google Scholar] [CrossRef] [PubMed]
- Xu, S.; Hu, E.; Cai, Y.; Xie, Z.; Luo, X.; Zhan, L.; Tang, W.; Wang, Q.; Liu, B.; Wang, R.; et al. Using clusterProfiler to Characterize Multiomics Data. Nat. Protoc. 2024, 19, 3292–3320. [Google Scholar] [CrossRef]
- Ashburner, M.; Ball, C.A.; Blake, J.A.; Botstein, D.; Butler, H.; Cherry, J.M.; Davis, A.P.; Dolinski, K.; Dwight, S.S.; Eppig, J.T.; et al. Gene Ontology: Tool for the Unification of Biology. The Gene Ontology Consortium. Nat. Genet. 2000, 25, 25–29. [Google Scholar] [CrossRef] [PubMed]
- Desterke, C.; Cosialls, E.; Xiang, Y.; Elhage, R.; Duruel, C.; Chang, Y.; Hamaï, A. Adverse Crosstalk between Extracellular Matrix Remodeling and Ferroptosis in Basal Breast Cancer. Cells 2023, 12, 2176. [Google Scholar] [CrossRef] [PubMed]
- Kassambara, A.; Kosinski, M.; Biecek, P.; Fabian, S. Survminer: Drawing Survival Curves Using “Ggplot2” 2021.
- Szklarczyk, D.; Nastou, K.; Koutrouli, M.; Kirsch, R.; Mehryary, F.; Hachilif, R.; Hu, D.; Peluso, M.E.; Huang, Q.; Fang, T.; et al. The STRING Database in 2025: Protein Networks with Directionality of Regulation. Nucleic Acids Res. 2024, gkae1113. [Google Scholar] [CrossRef] [PubMed]
- Szklarczyk, D.; Gable, A.L.; Nastou, K.C.; Lyon, D.; Kirsch, R.; Pyysalo, S.; Doncheva, N.T.; Legeay, M.; Fang, T.; Bork, P.; et al. The STRING Database in 2021: Customizable Protein-Protein Networks, and Functional Characterization of User-Uploaded Gene/Measurement Sets. Nucleic Acids Res. 2021, 49, D605–D612. [Google Scholar] [CrossRef] [PubMed]
- Martens, M.; Ammar, A.; Riutta, A.; Waagmeester, A.; Slenter, D.N.; Hanspers, K.; A Miller, R.; Digles, D.; Lopes, E.N.; Ehrhart, F.; et al. WikiPathways: Connecting Communities. Nucleic Acids Res. 2021, 49, D613–D621. [Google Scholar] [CrossRef]
- Therneau, T.M.; Grambsch, P.M. Modeling Survival Data: Extending the Cox Model; Springer.; New York. 2000. [Google Scholar]
- Harrell, F.E. Multivariable Modeling Strategies. In Regression Modeling Strategies: With Applications to Linear Models, Logistic and Ordinal Regression, and Survival Analysis; Harrell, Jr., Frank, E., Eds.; Springer International Publishing: Cham, 2015; pp. 63–102. ISBN 978-3-319-19425-7. [Google Scholar]
- Xie, Y.; Hou, W.; Song, X.; Yu, Y.; Huang, J.; Sun, X.; Kang, R.; Tang, D. Ferroptosis: Process and Function. Cell Death Differ. 2016, 23, 369–379. [Google Scholar] [CrossRef] [PubMed]
- Gotorbe, C.; Segui, F.; Echavidre, W.; Durivault, J.; Blanchard, T.; Vial, V.; Pagnuzzi-Boncompagni, M.; Villeneuve, R.; Amblard, R.; Garnier, N.; et al. Exploiting Integrin-αVβ3 to Enhance Radiotherapy Efficacy in Medulloblastoma via Ferroptosis. Curr. Oncol. 2024, 31, 7390–7402. [Google Scholar] [CrossRef] [PubMed]
- Li, Y.; Rory Goodwin, C.; Sang, Y.; Rosen, E.M.; Laterra, J.; Xia, S. Camptothecin and Fas Receptor Agonists Synergistically Induce Medulloblastoma Cell Death: ROS-Dependent Mechanisms. Anticancer. Drugs 2009, 20, 770–778. [Google Scholar] [CrossRef]
- Lluis, J.M.; Buricchi, F.; Chiarugi, P.; Morales, A.; Fernandez-Checa, J.C. Dual Role of Mitochondrial Reactive Oxygen Species in Hypoxia Signaling: Activation of Nuclear Factor-κB via c-SRC– and Oxidant-Dependent Cell Death. Cancer Res. 2007, 67, 7368–7377. [Google Scholar] [CrossRef] [PubMed]
- Robinson, G.; Parker, M.; Kranenburg, T.A.; Lu, C.; Chen, X.; Ding, L.; Phoenix, T.N.; Hedlund, E.; Wei, L.; Zhu, X.; et al. Novel Mutations Target Distinct Subgroups of Medulloblastoma. Nature 2012, 488, 43–48. [Google Scholar] [CrossRef]
- Gabriel, N.; Balaji, K.; Jayachandran, K.; Inkman, M.; Zhang, J.; Dahiya, S.; Goldstein, M. Loss of H3K27 Trimethylation Promotes Radiotherapy Resistance in Medulloblastoma and Induces an Actionable Vulnerability to BET Inhibition. Cancer Res. 2022, 82, 2019–2030. [Google Scholar] [CrossRef] [PubMed]
- Kool, M.; Korshunov, A.; Remke, M.; Jones, D.T.W.; Schlanstein, M.; Northcott, P.A.; Cho, Y.-J.; Koster, J.; Schouten-van Meeteren, A.; Van Vuurden, D.; et al. Molecular Subgroups of Medulloblastoma: An International Meta-Analysis of Transcriptome, Genetic Aberrations, and Clinical Data of WNT, SHH, Group 3, and Group 4 Medulloblastomas. Acta Neuropathol. (Berl.) 2012, 123, 473–484. [Google Scholar] [CrossRef] [PubMed]
- Chen, X.; Wei, J.; Li, C.; Pierson, C.; Finlay, J.; Lin, J. Blocking Interleukin-6 Signaling Inhibits Cell Viability/Proliferation, Glycolysis, and Colony Forming Activity of Human Medulloblastoma Cells. Int. J. Oncol. 2017. [Google Scholar] [CrossRef]
- Sreenivasan, L.; Wang, H.; Yap, S.Q.; Leclair, P.; Tam, A.; Lim, C.J. Autocrine IL-6/STAT3 Signaling Aids Development of Acquired Drug Resistance in Group 3 Medulloblastoma. Cell Death Dis. 2020, 11, 1035. [Google Scholar] [CrossRef]
- Persa, C.; Osmotherly, K.; Chao-Wei Chen, K.; Moon, S.; Lou, M.F. The Distribution of Cystathionine β-Synthase (CBS) in the Eye: Implication of the Presence of a Trans-Sulfuration Pathway for Oxidative Stress Defense. Exp. Eye Res. 2006, 83, 817–823. [Google Scholar] [CrossRef] [PubMed]
- Zheng, X.; Chen, W.; Yi, J.; Li, W.; Liu, J.; Fu, W.; Ren, L.; Li, S.; Ge, B.; Yang, Y.; et al. Apolipoprotein C1 Promotes Glioblastoma Tumorigenesis by Reducing KEAP1/NRF2 and CBS-Regulated Ferroptosis. Acta Pharmacol. Sin. 2022, 43, 2977–2992. [Google Scholar] [CrossRef] [PubMed]
- Moore, L.E.; Malats, N.; Rothman, N.; Real, F.X.; Kogevinas, M.; Karami, S.; García-Closas, R.; Silverman, D.; Chanock, S.; Welch, R.; et al. Polymorphisms in One-carbon Metabolism and Trans-sulfuration Pathway Genes and Susceptibility to Bladder Cancer. Int. J. Cancer 2007, 120, 2452–2458. [Google Scholar] [CrossRef] [PubMed]
- Reuss, A.M.; Groos, D.; Buchfelder, M.; Savaskan, N. The Acidic Brain—Glycolytic Switch in the Microenvironment of Malignant Glioma. Int. J. Mol. Sci. 2021, 22, 5518. [Google Scholar] [CrossRef]
- Huang, J.; Luo, Y.; Wang, Y.; Wang, S.; Huang, R.; An, Y. Silencing CCT3 Induces Ferroptosis through the NOD1-NF-κB Signaling Pathway in Bladder Cancer. Sci. Rep. 2024, 14, 26188. [Google Scholar] [CrossRef]
- Huang, Z.; Han, J.; Wu, P.; Wu, C.; Fan, Y.; Zhao, L.; Hao, X.; Chen, D.; Zhu, M. Sorting Nexin 5 Plays an Important Role in Promoting Ferroptosis in Parkinson’s Disease. Oxid. Med. Cell. Longev. 2022, 2022, 1–9. [Google Scholar] [CrossRef]
- Lee, N.; Park, S.J.; Lange, M.; Tseyang, T.; Doshi, M.B.; Kim, T.Y.; Song, Y.; Kim, D.I.; Greer, P.L.; Olzmann, J.A.; et al. Selenium Reduction of Ubiquinone via SQOR Suppresses Ferroptosis. Nat. Metab. 2024, 6, 343–358. [Google Scholar] [CrossRef]
- Mao, C.; Wang, X.; Liu, Y.; Wang, M.; Yan, B.; Jiang, Y.; Shi, Y.; Shen, Y.; Liu, X.; Lai, W.; et al. A G3BP1-Interacting lncRNA Promotes Ferroptosis and Apoptosis in Cancer via Nuclear Sequestration of P53. Cancer Res. 2018, 78, 3484–3496. [Google Scholar] [CrossRef] [PubMed]
- Zhang, W.; Lin, X.; Chen, S. Cysteinyl-tRNA Synthetase 1 Promotes Ferroptosis-Induced Cell Death via Regulating GPX4 Expression. J. Oncol. 2022, 2022, 1–16. [Google Scholar] [CrossRef] [PubMed]
- Zhang, Y.; Wu, X.; Zhu, J.; Lu, R.; Ouyang, Y. Knockdown of SLC39A14 Inhibits Glioma Progression by Promoting Erastin-Induced Ferroptosis SLC39A14 Knockdown Inhibits Glioma Progression. BMC Cancer 2023, 23, 1120. [Google Scholar] [CrossRef] [PubMed]
- He, Z.; Yang, J.; Sui, C.; Zhang, P.; Wang, T.; Mou, T.; Sun, K.; Wang, Y.; Xu, Z.; Li, G.; et al. FAM98A Promotes Resistance to 5-Fluorouracil in Colorectal Cancer by Suppressing Ferroptosis. Arch. Biochem. Biophys. 2022, 722, 109216. [Google Scholar] [CrossRef] [PubMed]
- Wei, Y.; Duan, S.; Gong, F.; Li, Q. The RNA-Binding Protein Fragile-X Mental Retardation Autosomal 1 (FXR1) Modulates Glioma Cells Sensitivity to Temozolomide by Regulating Ferroptosis. Biochem. Biophys. Res. Commun. 2022, 603, 153–159. [Google Scholar] [CrossRef] [PubMed]
- Alim, I.; Caulfield, J.T.; Chen, Y.; Swarup, V.; Geschwind, D.H.; Ivanova, E.; Seravalli, J.; Ai, Y.; Sansing, L.H.; Ste. Marie, E.J.; et al. Selenium Drives a Transcriptional Adaptive Program to Block Ferroptosis and Treat Stroke. Cell 2019, 177, 1262–1279.e25. [Google Scholar] [CrossRef]
- Tang, H.; Kang, R.; Liu, J.; Tang, D. ATF4 in Cellular Stress, Ferroptosis, and Cancer. Arch. Toxicol. 2024, 98, 1025–1041. [Google Scholar] [CrossRef] [PubMed]
- Dai, C.; Chen, X.; Li, J.; Comish, P.; Kang, R.; Tang, D. Transcription Factors in Ferroptotic Cell Death. Cancer Gene Ther. 2020, 27, 645–656. [Google Scholar] [CrossRef] [PubMed]
Figure 4.
Validation of molecular subtype stratification based on the ferroptosis transcriptional program in an independent cohort of medulloblastoma tumor transcriptomes: (A) Principal component analysis (PCA) performed using the expression profiles of ferroptosis-related genes. (B) Expression heatmap and unsupervised clustering using Euclidean distances and the Ward.D2 method, based on the ferroptosis transcriptional program.
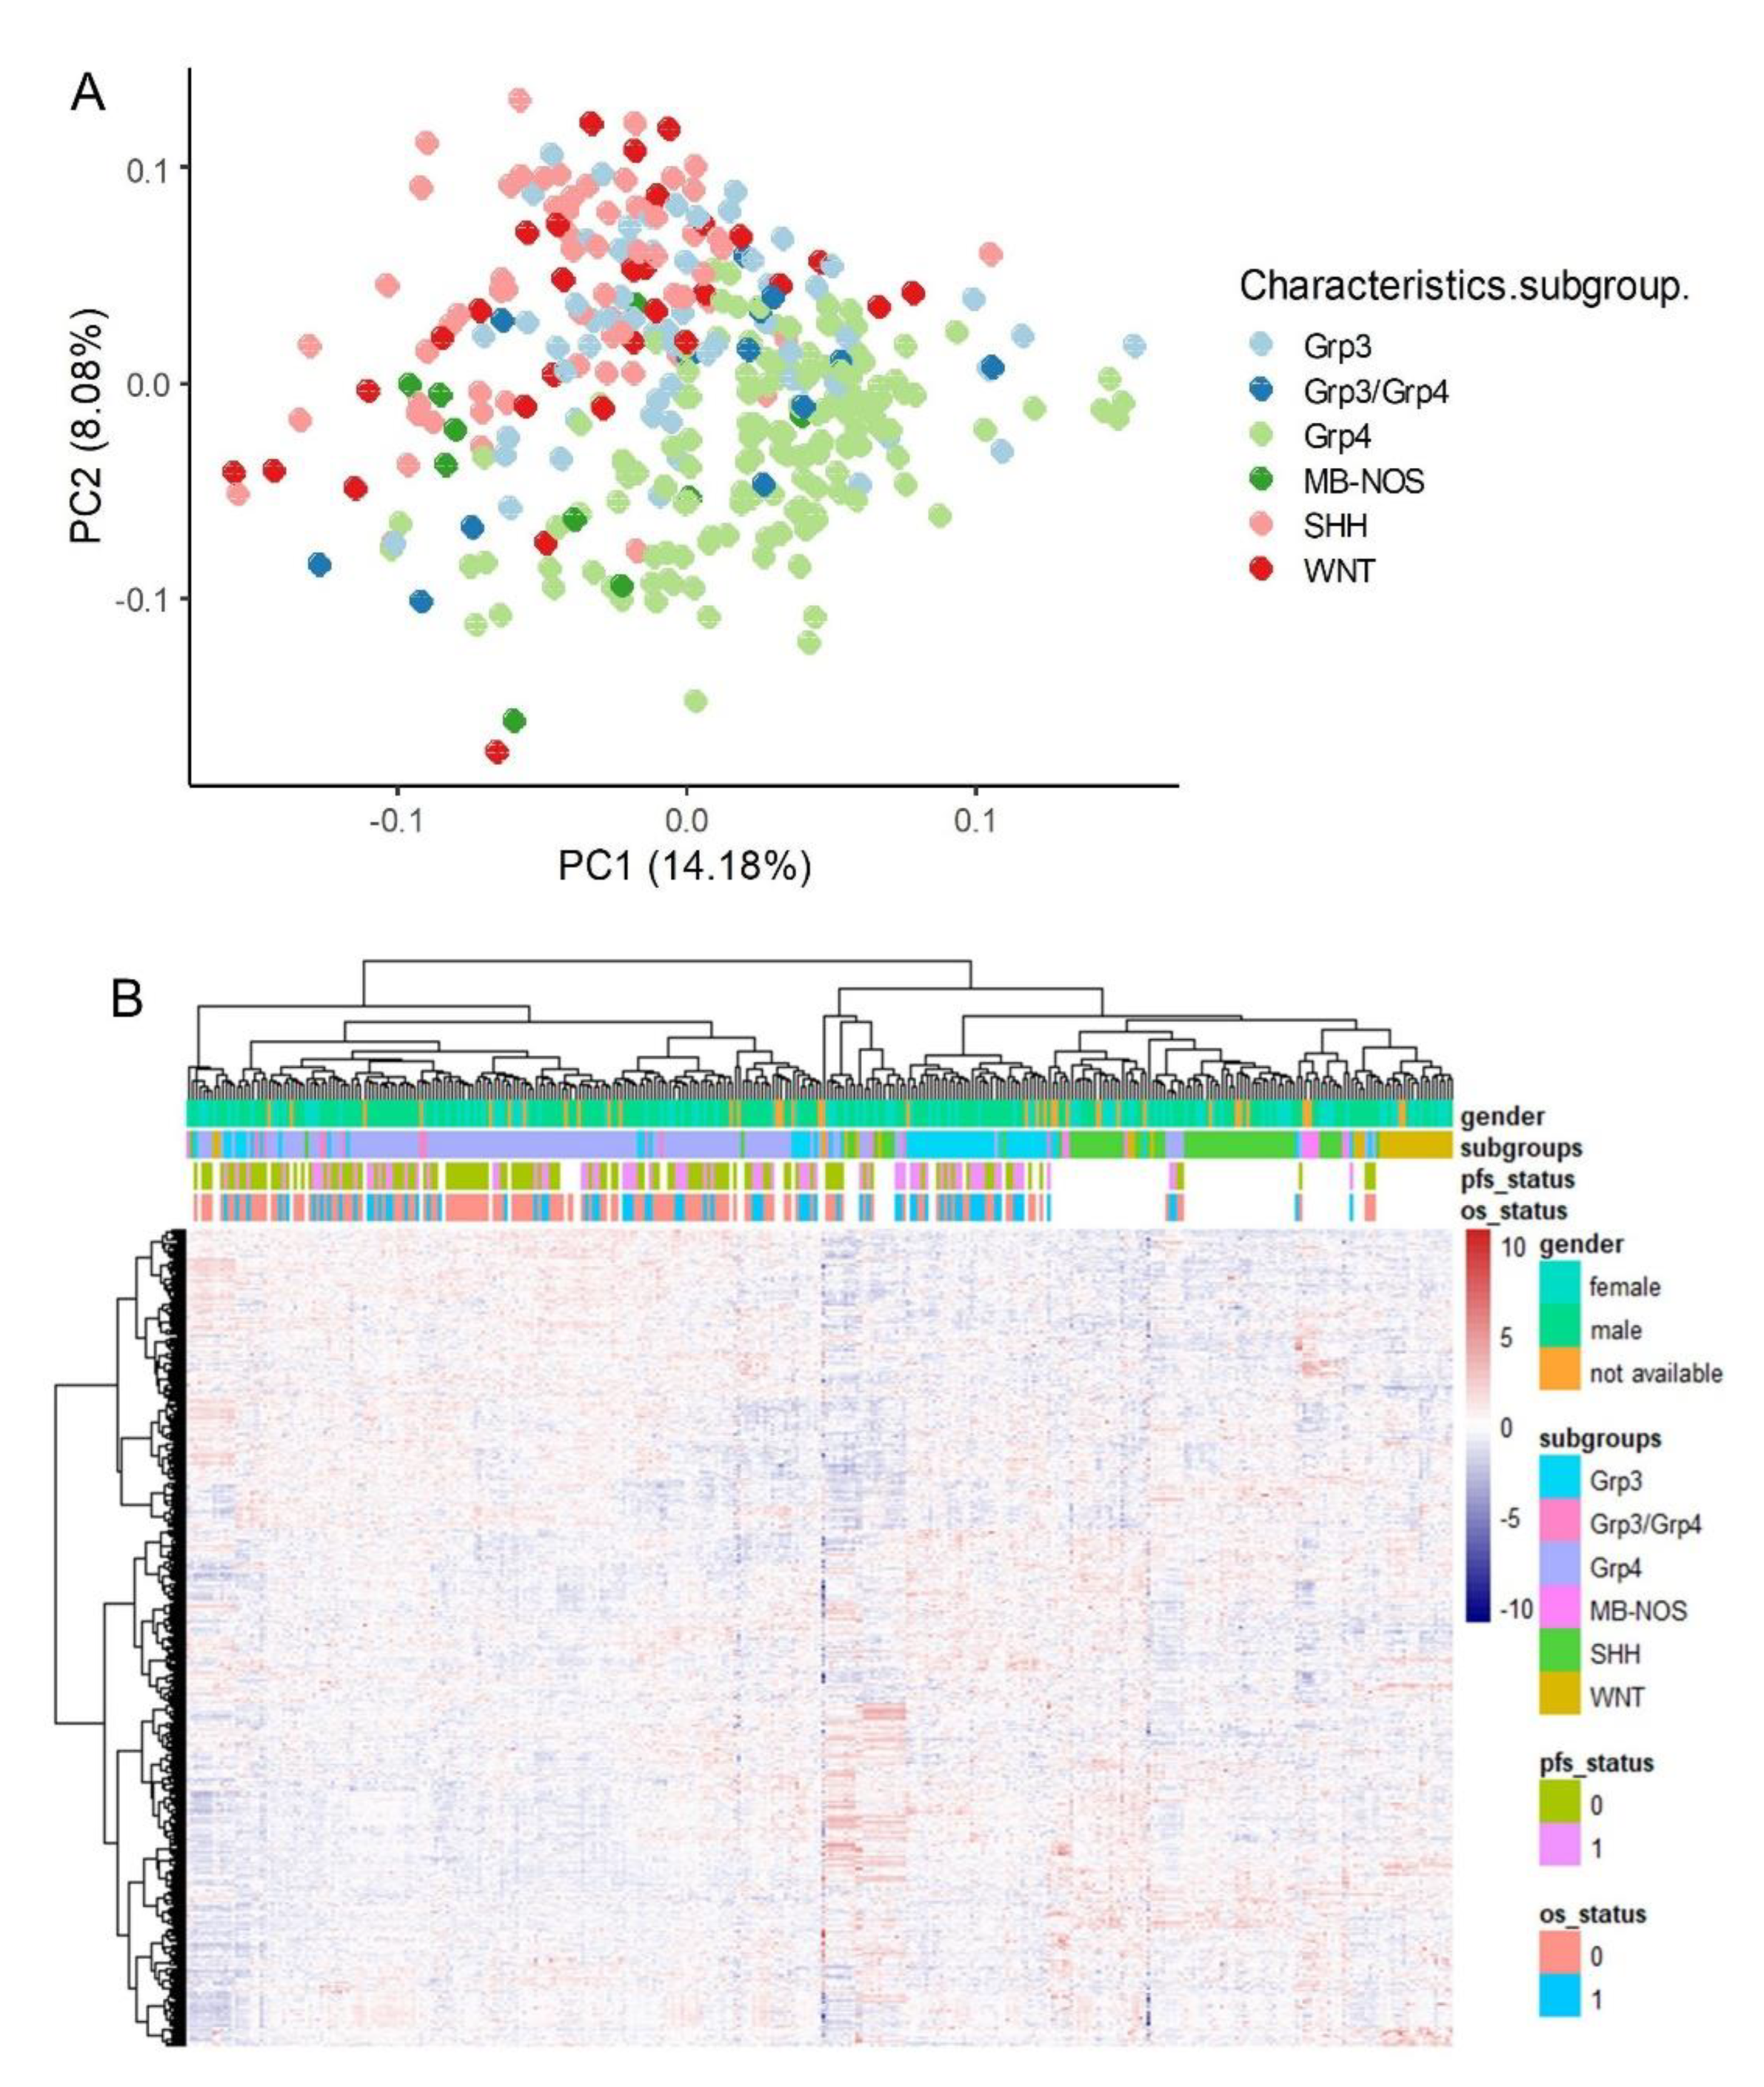
Figure 5.
Cross-validated ferroptosis signature associated with the prognosis of medulloblastoma: (A) Volcano plot showing beta coefficients versus negative log10 p-values from univariate Cox tests performed on the expression of ferroptosis-related genes in the PBTA training cohort. (B) Volcano plot showing beta coefficients versus negative log10 p-values from univariate Cox tests performed on the expression of ferroptosis-related genes in the validation cohort. (C) Scatter plot of Cox beta coefficients from the two independent cohorts for ferroptosis molecules commonly associated with patient prognosis. The size of the dots represents the mean negative log10 Cox p-values; tomato-colored dots indicate expression associated with unfavorable prognosis, while blue dots indicate expression associated with favorable prognosis. The green line represents the linear regression fit to the data.
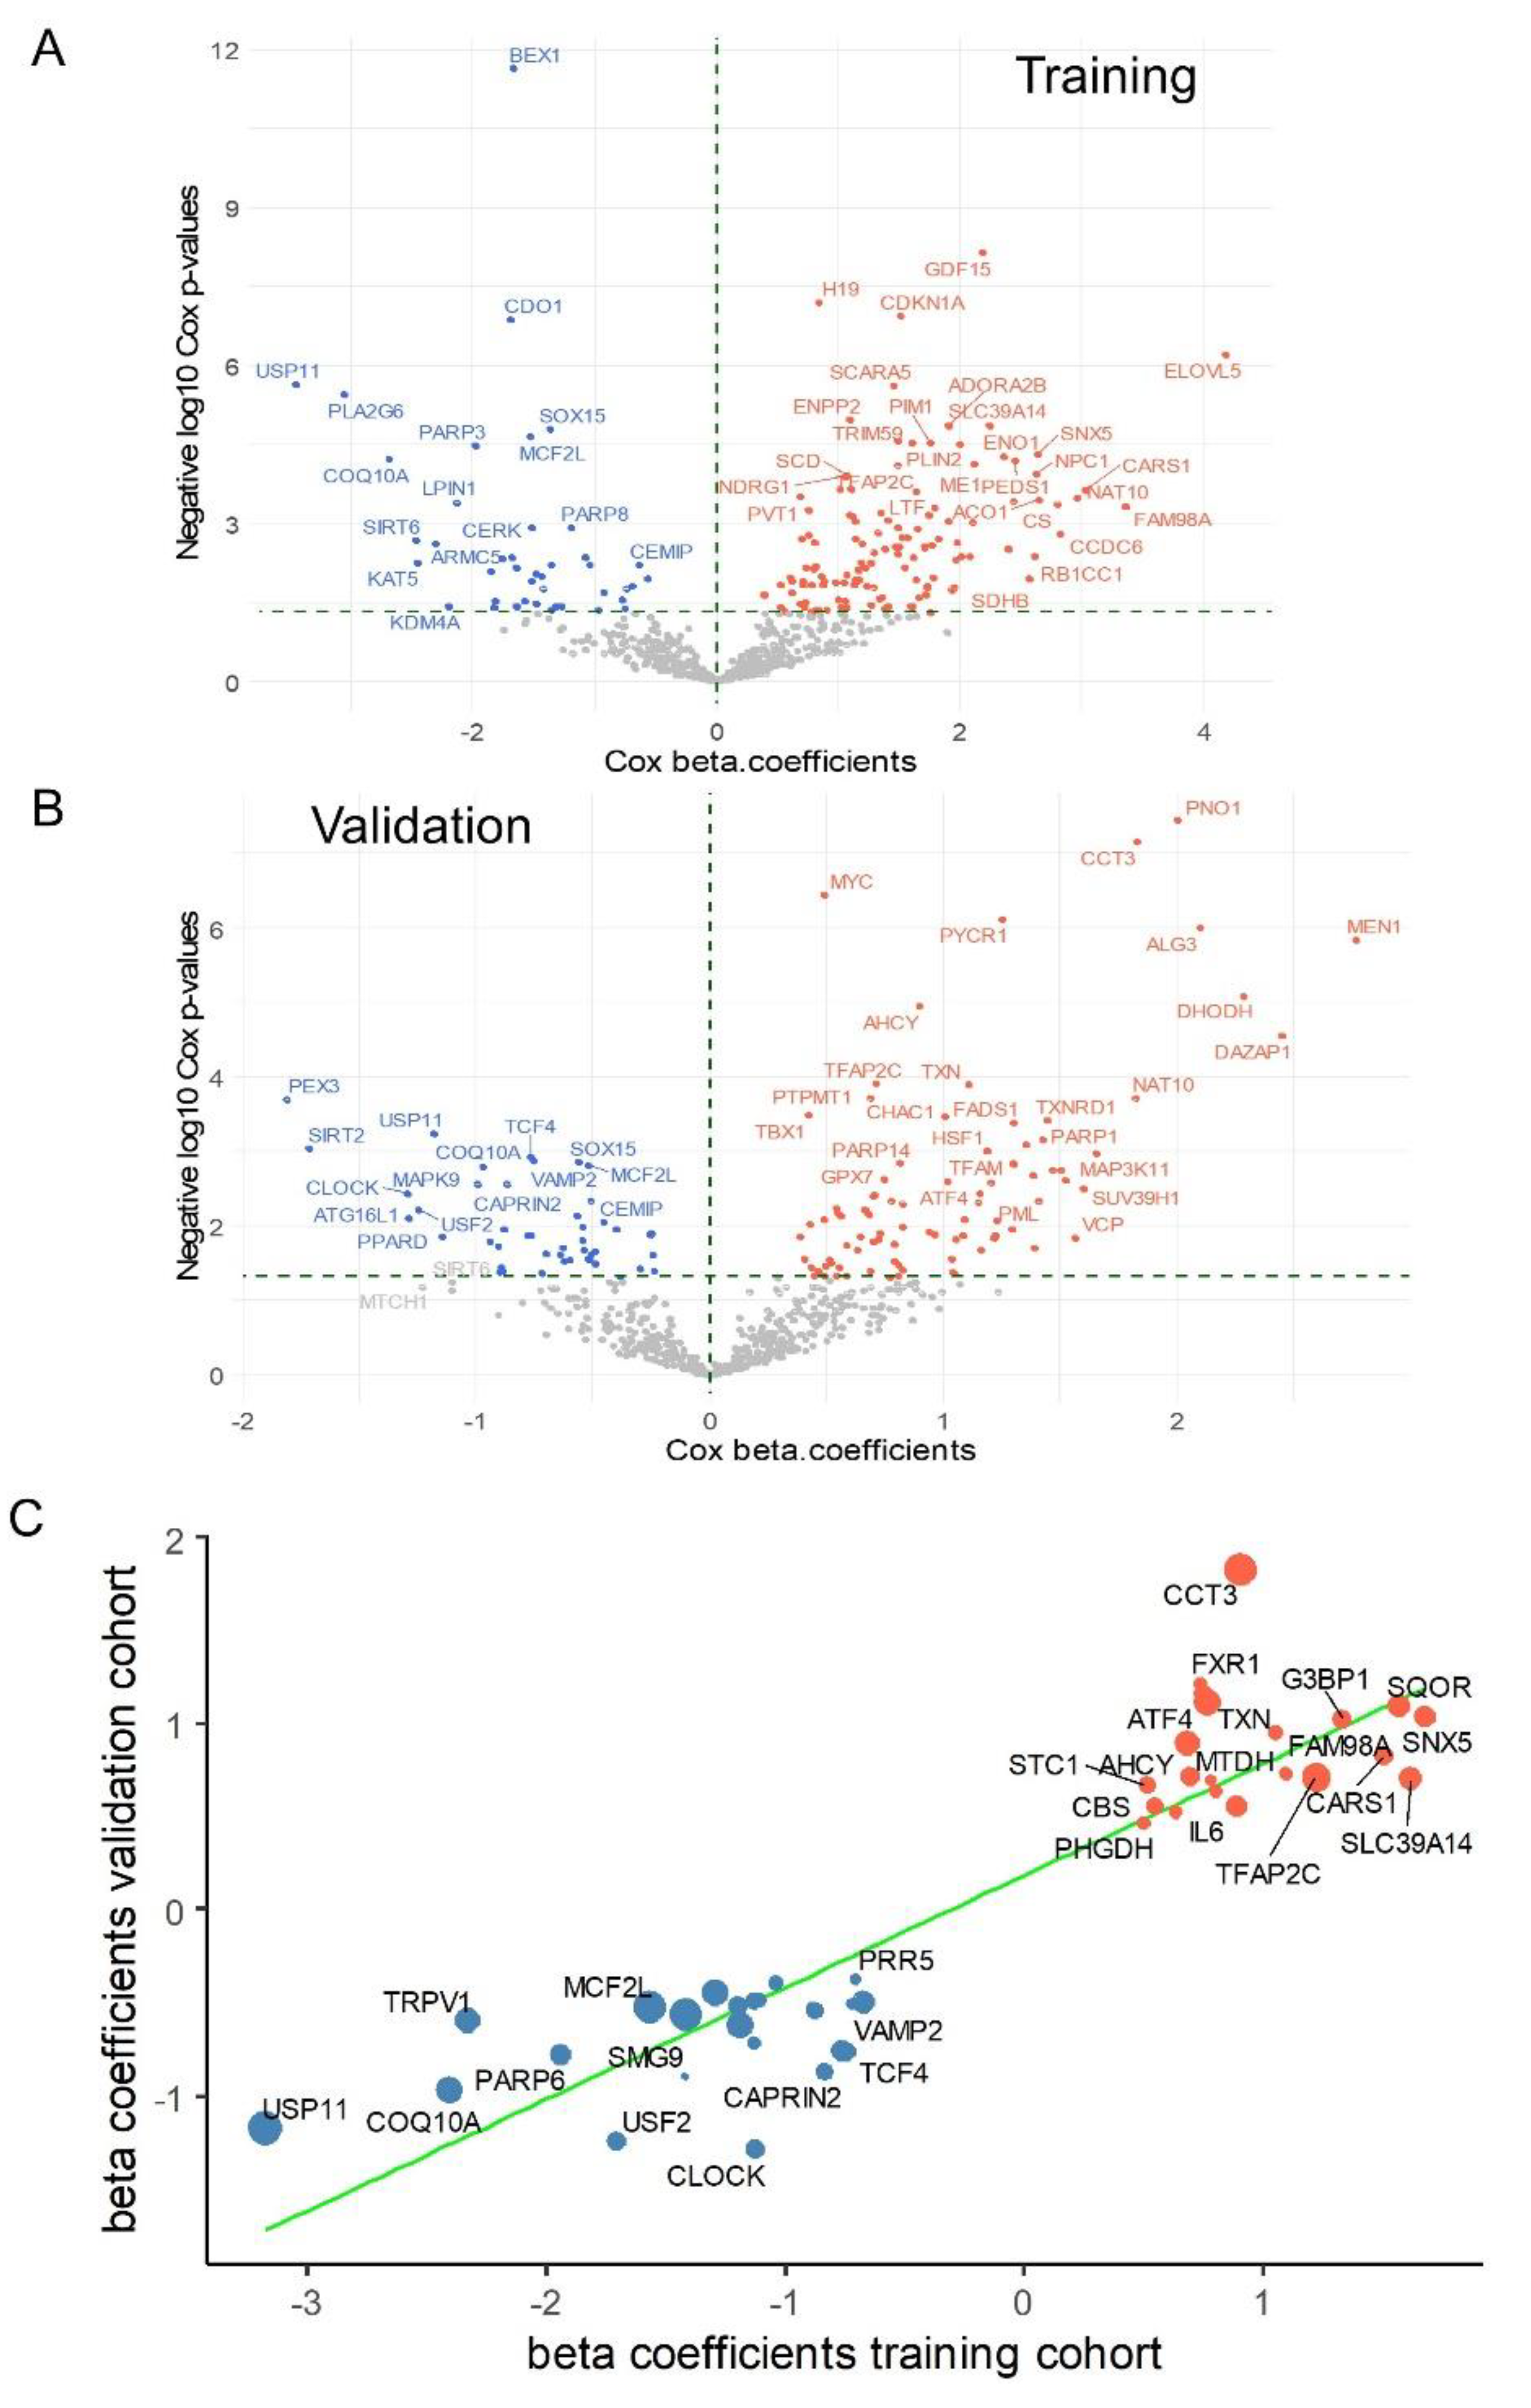
Figure 6.
Protein-protein interaction (PPI) network analysis of the ferroptosis cross-validated prognostic signature in medulloblastoma: (A) PPI network constructed using edges generated from the STRING proteomics application. (B) Functional enrichment analysis of the PPI network using the WikiPathways database. (C) Functional enrichment analysis of the PPI network using the Gene Ontology Biological Process database.
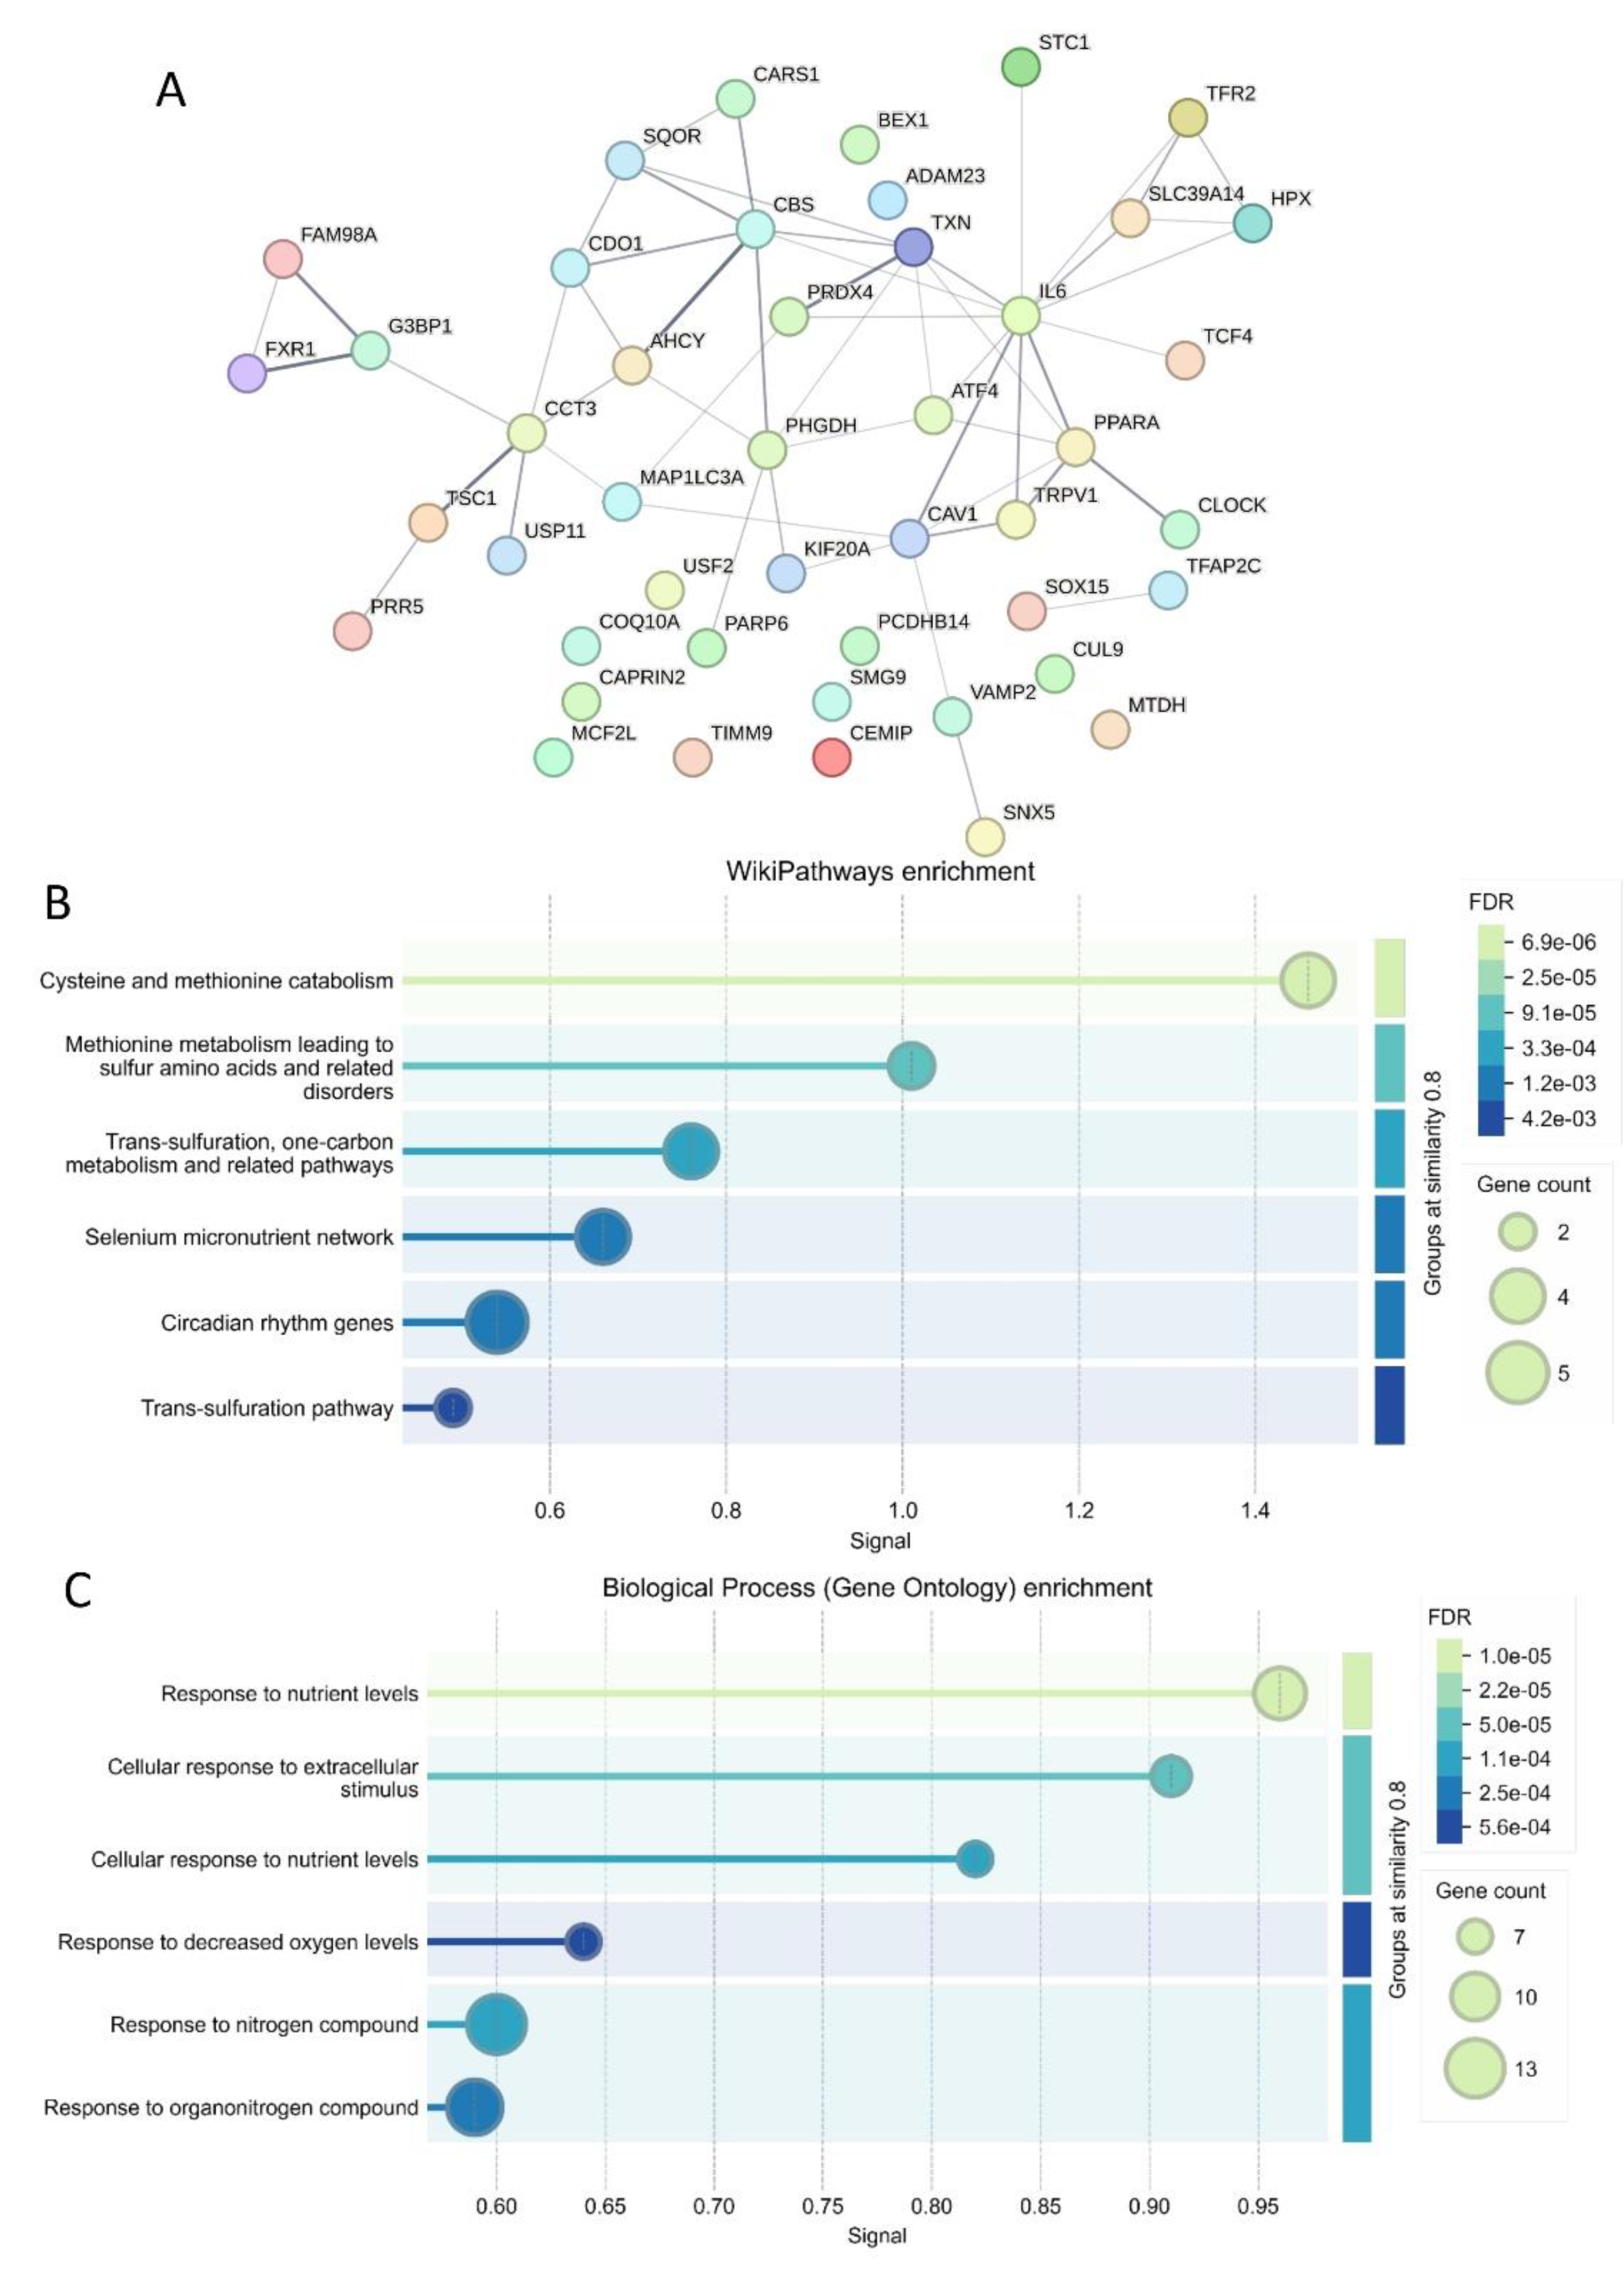

Table 1.
Clinical characteristics from MB patients with processed RNA-sequencing samples in training PBTA cohort.
Table 1.
Clinical characteristics from MB patients with processed RNA-sequencing samples in training PBTA cohort.
| Variable | Level | Low (n=192) | High (n= 65) | Total (n=257) | p-Value |
|---|---|---|---|---|---|
| SEX | Male | 126 (65.6) | 31 (47.7) | 157 (61.1) | |
| Female | 66 (34.4) | 34 (52.3) | 100 (38.9) | 0.0156940 | |
| AGE | mean (sd) | 8.3 (5.5) | 7 (4.9) | 8 (5.4) | 0.0873753 |
| AGE_IN_DAYS | mean (sd) | 3,268.9 (1,996.9) | 2,766.4 (1,809.4) | 3,146.3 (1,961.2) | 0.0831632 |
| OS_MONTHS | mean (sd) | 60 (46) | 27.6 (20.7) | 51.7 (43.4) | < 1e-04 |
| CNS_REGION | Ventricles | 12 (6.3) | 5 (7.8) | 17 (6.7) | |
| Mixed | 45 (23.8) | 21 (32.8) | 66 (26.1) | ||
| Posterior fossa | 128 (67.7) | 37 (57.8) | 165 (65.2) | ||
| Spine | 1 (0.5) | 0 (0.0) | 1 (0.4) | ||
| Hemispheric | 3 (1.6) | 0 (0.0) | 3 (1.2) | ||
| Other | 0 (0.0) | 1 (1.6) | 1 (0.4) | 0.2467076 | |
| CANCER_TYPE_DETAILED | Medulloblastoma, WNT-activated | 10 (5.3) | 11 (16.9) | 21 (8.3) | |
| Medulloblastoma, group 3 | 34 (18.0) | 26 (40.0) | 60 (23.6) | ||
| Medulloblastoma, group 4 | 96 (50.8) | 3 (4.6) | 99 (39.0) | ||
| Medulloblastoma, SHH-activated | 49 (25.9) | 25 (38.5) | 74 (29.1) | < 1e-04 | |
| EFS_STATUS | 1:Recurrence | 23 (12.0) | 14 (21.5) | 37 (14.4) | |
| 0:No Event | 118 (61.5) | 23 (35.4) | 141 (54.9) | ||
| 1:Progressive - Metastatic | 16 (8.3) | 18 (27.7) | 34 (13.2) | ||
| 1:Deceased - due to disease | 7 (3.6) | 2 (3.1) | 9 (3.5) | ||
| 1:Recurrence - Metastatic | 16 (8.3) | 7 (10.8) | 23 (8.9) | ||
| 1:Second Malignancy | 5 (2.6) | 1 (1.5) | 6 (2.3) | ||
| 1:Progressive | 7 (3.6) | 0 (0.0) | 7 (2.7) | 0.0002396 |
Table 2.
Clinical characteristics from MB patients with processed RNA-sequencing samples in validation cohort (E-MTAB-10767).
Table 2.
Clinical characteristics from MB patients with processed RNA-sequencing samples in validation cohort (E-MTAB-10767).
| Variable | Level | Low (n=214) | High (n=117) | Total (n=331) | p-Value |
|---|---|---|---|---|---|
| developmental.stage | adult | 6 (2.8) | 3 (2.6) | 9 (2.7) | |
| infant | 23 (10.7) | 21 (17.9) | 44 (13.3) | ||
| child | 167 (78.0) | 79 (67.5) | 246 (74.3) | ||
| not available | 18 (8.4) | 14 (12.0) | 32 (9.7) | 0.16596 | |
| gender | male | 132 (61.7) | 62 (53.0) | 194 (58.6) | |
| female | 60 (28.0) | 41 (35.0) | 101 (30.5) | ||
| not available | 22 (10.3) | 14 (12.0) | 36 (10.9) | 0.30286 | |
| subgroup | Grp4 | 127 (59.3) | 20 (17.1) | 147 (44.4) | |
| SHH | 33 (15.4) | 34 (29.1) | 67 (20.2) | ||
| MB-NOS | 6 (2.8) | 4 (3.4) | 10 (3.0) | ||
| Grp3 | 23 (10.7) | 40 (34.2) | 63 (19.0) | ||
| WNT | 17 (7.9) | 14 (12.0) | 31 (9.4) | ||
| Grp3/Grp4 | 8 (3.7) | 5 (4.3) | 13 (3.9) | < 1e-04 | |
| os.time | mean (sd) | 6.2 (10) | 3.8 (3.8) | 5.5 (8.8) | 0.08842 |
Table 3.
Cross-validated ferroptosis signature associated to the prognosis of medulloblastoma.
| Identifiers | Prognosis | Negative log10 p-Values | Cox Beta Coefficients |
|---|---|---|---|
| CCT3 | unfavorable | 4.404 | 1.368 |
| SNX5 | unfavorable | 2.318 | 1.356 |
| SQOR | unfavorable | 2.559 | 1.332 |
| G3BP1 | unfavorable | 2.169 | 1.178 |
| CARS1 | unfavorable | 1.991 | 1.170 |
| SLC39A14 | unfavorable | 2.682 | 1.163 |
| FAM98A | unfavorable | 1.656 | 0.999 |
| FXR1 | unfavorable | 1.577 | 0.979 |
| TFAP2C | unfavorable | 3.549 | 0.968 |
| ATF4 | unfavorable | 2.119 | 0.956 |
| TXN | unfavorable | 3.291 | 0.941 |
| MTDH | unfavorable | 1.580 | 0.910 |
| AHCY | unfavorable | 3.129 | 0.788 |
| TIMM9 | unfavorable | 1.475 | 0.736 |
| CAV1 | unfavorable | 2.258 | 0.723 |
| KIF20A | unfavorable | 1.538 | 0.718 |
| PRDX4 | unfavorable | 2.042 | 0.704 |
| STC1 | unfavorable | 1.840 | 0.589 |
| IL6 | unfavorable | 1.535 | 0.577 |
| CBS | unfavorable | 1.870 | 0.553 |
| PHGDH | unfavorable | 1.589 | 0.483 |
| PRR5 | favorable | 1.513 | -0.540 |
| CEMIP | favorable | 2.509 | -0.590 |
| ADAM23 | favorable | 1.484 | -0.615 |
| CUL9 | favorable | 1.493 | -0.711 |
| TSC1 | favorable | 1.802 | -0.711 |
| HPX | favorable | 1.686 | -0.716 |
| TCF4 | favorable | 2.218 | -0.755 |
| VAMP2 | favorable | 2.224 | -0.758 |
| TFR2 | favorable | 1.683 | -0.798 |
| PCDHB14 | favorable | 1.902 | -0.812 |
| CAPRIN2 | favorable | 1.952 | -0.852 |
| MAP1LC3A | favorable | 2.195 | -0.861 |
| CDO1 | favorable | 3.232 | -0.872 |
| BEX1 | favorable | 3.414 | -0.908 |
| PPARA | favorable | 1.556 | -0.924 |
| SOX15 | favorable | 4.387 | -0.992 |
| MCF2L | favorable | 4.384 | -1.045 |
| SMG9 | favorable | 1.385 | -1.159 |
| CLOCK | favorable | 2.008 | -1.209 |
| PARP6 | favorable | 2.469 | -1.363 |
| TRPV1 | favorable | 2.961 | -1.466 |
| USF2 | favorable | 2.037 | -1.474 |
| COQ10A | favorable | 3.324 | -1.688 |
| USP11 | favorable | 5.137 | -2.180 |
Table 4.
Summary table of the multivariable overall survival model for medulloblastoma prognosis in PBTA cohort.
Table 4.
Summary table of the multivariable overall survival model for medulloblastoma prognosis in PBTA cohort.
| term | Hazard Ratios | CI95-Low | CI95-High | p-Values |
|---|---|---|---|---|
| score.cat (high) | 5.836 | 3.312 | 10.284 | 1.04E-09 |
| older.15yo (high) | 0.505 | 0.210 | 1.213 | 1.26E-01 |
| gender (Male) | 0.919 | 0.571 | 1.480 | 7.30E-01 |
| groups (group.4) | 0.994 | 0.526 | 1.877 | 9.84E-01 |
| groups (SHH-activated) | 1.260 | 0.719 | 2.209 | 4.20E-01 |
Disclaimer/Publisher’s Note: The statements, opinions and data contained in all publications are solely those of the individual author(s) and contributor(s) and not of MDPI and/or the editor(s). MDPI and/or the editor(s) disclaim responsibility for any injury to people or property resulting from any ideas, methods, instructions or products referred to in the content. |
© 2024 by the authors. Licensee MDPI, Basel, Switzerland. This article is an open access article distributed under the terms and conditions of the Creative Commons Attribution (CC BY) license (http://creativecommons.org/licenses/by/4.0/).
Copyright: This open access article is published under a Creative Commons CC BY 4.0 license, which permit the free download, distribution, and reuse, provided that the author and preprint are cited in any reuse.


