
Submitted:
13 June 2023
Posted:
14 June 2023
You are already at the latest version
Abstract
Abstract: (1) Background: Cancer immune escape is associated with the metabolic reprogramming of TME, and combining metabolic targets with immunotherapy has great potential to improve clinical outcomes. Among all metabolic processes, lipid metabolism, especially fatty acid (FA) metabolism, has a huge role in cancer cell survival, migration, and proliferation, but its mechanism and role in the tumor immune microenvironment remain to be investigated. (2) Methods: We comprehensively analyzed 309 fatty acid-related genes, screened 121 different genes, and used one-way COX regression to select 15 genes with prognostic impact. Systematically evaluated the correlation between FMGs modification patterns and Tumor Microenvironment Infiltration, prognosis, and Immunotherapy. The FMGs-Score was constructed to quantify the FMGs modification patterns using principal component analysis. (3) Results: Three clusters based on FMGs-related genes were demonstrated in breast cancer, with three patterns of distinct immune cell infiltration and biological behavior. An FMGsScore signature was constructed to reveal that patients with a low FMGsScore had higher immune checkpoint expression, higher immune checkpoint inhibitor (ICI) scores, increased immune microenvironment infiltration, better survival advantage, and were more sensitive to immunotherapy than those with a high FMGsScore. Finally, the expression and function of the signature key gene NDUFAB1 were examined by in vitro experiments. (4) Conclusions: This study significantly demonstrates the non-negligible role of FMGs in the immune microenvironment of breast cancer, and that FMGsScores can be used to guide the prediction of immunotherapy in breast cancer patients. In in vitro experiments, knockdown of the NDUFAB1 gene resulted in reduced proliferation and migration of MCF-7 cell lines.
Keywords:
Fatty Acid Metabolism
; Immunotherapy
; Breast cancer
; Tumor microenvironment
; Single-cell sequencing
1. Introduction
In recent years, the incidence of breast cancer has surpassed that of lung cancer as the most prevalent cancer worldwide[1], with an estimated 2.3 million new cases (11.7%) and its incidence is increasing[2]. With the development of diagnostic tools and imaging techniques, the early detection rate of breast cancer has greatly improved and the mortality rate has decreased. However, breast cancer is a highly heterogeneous cancer, which makes the treatment of breast cancer patients difficult to be precise and its prognosis is often poor. Therefore, new biomarkers are urgently needed to guide the treatment of breast cancer patients. A significant amount of metabolic reprogramming occurs during breast cancer progression to meet the demands of tumor cell growth, with fatty acid metabolic reprogramming being particularly critical, as cancer cells require fatty acid metabolism to participate in biological processes such as energy metabolism, signaling, and cell membrane formation[3](p. 36). Moreover, it is now generally understood that the proportion of saturated, monounsaturated, and polyunsaturated fatty acids in membranes is crucial for encouraging cell survival and preventing lipotoxicity and ferroptosis [4]. Additionally, it has been demonstrated that fatty acid metabolism plays a significant role in the differentiation and migration of tumor-associated immune cells[5]. TME refers to the microenvironment surrounding tumor cells, including endothelial cells, immune cells, stromal fibroblasts, various signaling molecules, cytokines, and extracellular matrix[6]. TME has been associated with the emergence of breast cancer in an expanding number of studies [7], such as the combination of suppressive immune cells, soluble factors, and altered extracellular mesenchyme, leading to immune escape and promoting the progression and metastasis of breast cancer[8]. Immune checkpoint blockade (ICB), pericyte therapy (ACT), and tumor vaccines are currently the main tumor immunotherapy pathways[9], and immune checkpoint blockade (ICB), in particular, has become the latest treatment for various cancers [10]. However, the efficacy of immunotherapy in breast cancer is suboptimal compared to other cancers. It has been shown that metabolic reformatting in TME leads to immune escape[11], and in particular, fatty acid metabolic reprogramming affects the differentiation of relevant immune cells and tumor cell migration in the tumor microenvironment[12]. Finding metabolic targets with prognostic impact on breast cancer and combining them with immunotherapy may improve the immune efficacy in breast cancer patients. We identified 15 fatty acid metabolic genes associated with breast cancer prognosis in this study and comprehensively evaluated the impact of fatty acid-related gene expression on mutation, prognosis, and immune response pathways in BRCA. Unsupervised clustering was then used to identify three different fatty acid patterns of BRCA and to assess the differences in prognosis as well as immune infiltration pathways among the three patterns. We found that the three FMGs patterns were closely associated with the three immune types. In addition, we classified patients into three different genomic subgroups by three FMGs pattern-related differentially expressed genes (DEGs). And we established a FMGsScore that effectively predicted prognosis and immunotherapy response in BCRA patients.
2. Results
2.1. Identification of Prognostic Fatty Acid Metabolism-Related Genes and Genetic Variation in BRCA
The flow chart of this study was shown in Figure 1. Differential analysis of 309 FMGs in TCGA, using thresholds |log2FC| > 0.585 and FDR < 0.05, detected 121 DEGs by comparing 1082 breast cancer samples with 113 normal breast samples. In deg, there were 50 significantly enhanced FMGs in BC patients, while 71 FMGs in BC samples were largely attenuated (Figure 2A,B). To determine the potential prognostic value of each available FMG, DEG genes were analyzed using univariate Cox risk regression to screen for OS-related FMGs, and 15 significant OS-related FMGs were retrieved separatelywere eligible for further analysis (Figure 2C). The reciprocal network between these 15 FMGs. An overview of FMGs methylation modification patterns through regulators is presented through the FMGs modulator network, including mutual effects, modulator associations, and prognoses for patients with BRCA patients. (Figure 2D). We analyzed the somatic mutations and copy number variants of 15 FMGs in the TCGA cohort. Only 21 of 986 samples (2.13%) experienced mutations in FMGs, only CYFIP1, LARP1, EIF4G3 and AGO2 were mutated, and the overall mutation frequency was low ≤1% (Supplementary Figure S1A). The location of CNV alterations in FMGs represents CNV amplification and green dots represent CNV deletion (Supplementary Figure S1B). Compared with other FAM-related genes, ACSL1, ACSL5 and ALOX15B have a higher frequency of CNV deletion, while UBE2L6, HSPH1 and PSME1 have a higher frequency of CNV amplification (Supplementary Figure S1C).
2.2. Immune Infiltration and Biological Functions with FMGs-Modification Patterns
In our analysis, we used two BRCA datasets (TCGA-BRCA, GSE42568), OS, and clinical dat. To determine which patients had distinct FMGs modification patterns, expression levels of 15 FMGs modulators were quantified using the R software of Consensus Cluster Plus, and three different modification patterns were identified via unsupervised clustering, including 477 patients with pattern A, 418 patients with pattern B and 261 patients with pattern C (Figure 3B). To explore the biological behavior of different FMGs patterns, we performed an enrichment analysis using GSVAs(Figure 3D,F). FMGsCluster-A was significantly enriched in the matrix and oncogenic activation pathways such as ECM receptor interactions, TGF β signaling pathway, cell adhesion, JAK-STA signaling pathway, and activation of the chemokine signaling pathway, cytokine-cytokine receptor interactions, T cell receptor signaling pathway, and Toll-like receptor signaling pathway. Activation-related pathways were also enriched (Figure 3D). FMGsCluster - B was not associated with the enrichment of immune-related activation pathways (Figure 3E), while FMGsCluster-C included the activation of the chemokine signaling pathway, cytokine-cytokine receptor interaction, T-cell receptor signaling pathway, and B-cell receptor signaling pathway (Figure 3F). Subsequent analysis of FMGsCluster cell infiltration in TME of breast cancer patients using ssGSEA revealed that natural immune cell infiltration was higher in FMGsCluster-A than in FMGsCluster - B and FMGsCluster-C. Among them, FMGsCluster - B had the highest immune cell infiltration (Figure 3G). FMGsCluster-A was enriched with natural immune cell infiltration, including B cells, CD4+ T cells, CD8+ T cells, natural killer cells, macrophages, eosinophils, mast cells, MDSC, and plasmacytoid dendritic cells (Figure 3G). However, patients with FMGsCluster-A did not show a matched survival advantage (Figure 3C). Previous studies have shown that immune rejection phenotypes with immune cell infiltration have immune cells that do not enter the parenchyma of the tumor cell nest but remain in the interstitium surrounding the tumor cell nest[13]. The associated stromal pathway activation is thought to be T-cell suppression. The GSAV results showed that FMGsCluster-A was also significantly enriched in the stromal-activated pathway, so it was speculated that this was because stromal activation in FMGsCluster-A suppressed the tumor-killing effect of its immune cells. The subsequent analysis also showed that FMGsCluster-A had significantly higher activation in cell adhesion, transforming growth factor β (TGFb), and angiogenic pathways than FMGsCluster-B and FMGsCluster- C (Figure 3H). Therefore, we classified FMGsCluster-A as an immune rejection phenotype, characterized by innate immune cell infiltration and stromal activation; FMGsCluster - B as an immune desert phenotype, characterized by immunosuppression; and FMGsCluster-C as an immune inflammatory phenotype, characterized by adaptive immune cell infiltration and immune activation.
2.3. Construction of Gene Signatures Based on Differential Genes of FMGsCluster
To explore the biological features of the potential regulation among the three FMGsClusters, we identified 898 DEGs associated with the three FMGsClusters using the limma package (Figure 4A). GO enrichment analysis showed that 898 DEGs were significantly associated with immunity in terms of cellular components (BP), molecular functions (CC), and biological processes (MF) (Figure 4B). KEGG enrichment analysis showed that these genes were also significantly enriched in immune pathways, such as Cytokine-cytokine receptor, Natural killer cell-mediated Cytotoxicity, T cell receptor signaling pathway, etc(Figure 4C). The above results suggest that fatty acid metabolism genes are critical to the role of immune cells in the tumor microenvironment. To understand and validate their regulatory pathways, the 898 fatty acid-related genes obtained were subjected to unsupervised clustering analysis to classify patients into different genomic subtypes. Consistent with the clustering grouping of FMGs modification patterns, the unsupervised clustering algorithm also revealed 3 different modified genomic phenotypes, and we named these 3 clusters as FMGs gene clusters A-C, respectively. Survival analysis showed that geneClusterA was more productive than geneCluster-B and geneCluster-C (Figure 4D). The heat map showing the comparison of clinical information among the three geneClusters shows that geneClusterA and geneCluster-B clearly exhibit different clinical characteristics (Figure 4E). The expression of most FMGs in the three geneClusters was significantly different (Figure 4F). All these results suggest that three different patterns of fatty acid metabolic modifications do exist in breast cancer patients. To further explore the role of FMGs in breast cancer, the survival differences between the high and low FMGsScore groups were analyzed using K-M curves, and the results showed that the low-scoring group had a better prognosis (Figure 5A). In addition to this, it can be seen that FMGsCluster-B and geneCluster-B had higher FMGsScore scores (Figure 5B,C), and FMGsCluster-B (Figure 3C) and geneCluster-B had a worse prognosis (Figure 4D) worse. Spearman correlation analysis of FMGsScore and immune cell infiltration showed that FMGsScore was negatively correlated with most of the immune cell infiltration, and the lower the score, the greater the proportion of immune cell infiltration in patients (Figure 5D). In addition, as shown in the allogram (Figure 5E), most of the FMGs clusters A was grouped into gene clusters A and C. Almost half of the FMGs clusters B was grouped into gene cluster B and a small fraction of the other half into gene cluster C, while most of the FMGs clusters C was grouped into gene cluster C and a small fraction of the other half into gene cluster B. Both gene clusters B and C were grouped into the high FMGsScore group. The majority of the low FMGsScore group survived, while a small proportion of the high group died.
2.4. Clinical and Tumor Somatic Cell Mutation Characteristics between Patient High and Low FMGsScore Groups
A higher proportion of patients survived in the low subgroup and a higher FMGsScore in patients who died (Figure 6A). The proportion of patients with age between the low and high FMGsScore subgroups was approximately the same between the two groups, and the FMGsScore was higher in the high age group (Figure 6B). The proportion of patients with high FMGsScore in stage1-2 and N1-3 in patient stage grading and N grading was higher, and the proportion of patients with high and low scores in T stage T1-2 and T-3 was consistent. In patient subgroups, high FMGsScore was significantly associated with poor prognosis in patients with stage1-2, T1-2, and N0 (Figure 6C–E). We then determined the FMGsScore and tumor mutational burden and how this relates to patient prognosis. The R package "maftools" was used to create a panorama of mutations in somatic cells between the high and low FMGsScore groups. The mutation rates of somatic cells were similar between the high and low groups, 82.5% and 90.7%, respectively (Figure 7A,B). Secondly, the difference in TMB between high and low groups was not statistically significant (Figure 7C), and the correlation analysis between FMGsScore and TMB also showed no statistically significant negative correlation (Figure 7D), but the results of survival analysis showed that the higher the tumor mutation burden (TMB), the worse the prognosis (Figure 7E). Among them, H-TMB+ H - FMGsScore had the worst prognosis (Figure 7F).
2.5. Effect of FMGsScore on Immunotherapy
Immune checkpoint blockade therapy has become the main modality of immunotherapy for many cancers. Therefore we analyzed the differences between high and low FMGsScore high and low groups and some immune checkpoint genes (PD1, PD-L1, CTLA4, LAG3, HAVCR2, IDO1). We found that the expression of immune checkpoint genes was all higher in the low FMGsScore group than in the high FMGsScore group(Figure 8A). ICB therapy with the blockade of PD1 and CLAT4 is an effective treatment for certain cancers. To explore the relationship between FMGsScore and immunotherapy, immunotherapy data were downloaded from the TCIA database for BRCA patients in all ctla4_neg_pd1neg, CTLA4_neg_PD1_pos, CTLA4_pos_PD1_neg and ctla4_pos_pd1_pos groups. Patients with lower FMGsScore had higher IPS, indicating that these patients had a better response to immunotherapy (Figure 8B). Comparing the infiltration abundance of immune cells between the high and low FMGsScore groups, it was found that the infiltration abundance of immune cells in the low FMGsScore group was higher than that in the high FMGsScore group(Figure 8C). GSVA enrichment analysis of pathway differences between high and low FMGsScore groups, low FMGsScore groups were highly enriched in tumor and immune-related pathways compared to high, such as primary immunodeficiency, B-cell receptor signaling pathway, chemokine signaling pathway, cytokine receptor interactions, natural killer cell-mediated cytotoxicity, JAK/STAT signaling pathway, T-cell receptor signaling pathway, et al. (Figure 8D). Thus, it can be seen that tumor patients with low FMGsScore have high fatty acid metabolism, abundant immune cell infiltration, high immune checkpoint expression, good prognosis, and good response to immunotherapy. The validity of the FMGsScore score was verified by the GSE20685 dataset, and the expression of six immune check suppressor site genes was significantly higher between the low FMGsScore group than the high FMGsScore group like the training group (Supplementary Figure S2A), and patients in the low FMGsScore group had a survival advantage over those in the high FMGsScore group as seen by the survival curves, with the death patients were less, which also validated the accuracy of FMGsScore in the training group (Supplementary Figure S2B,C). To further verify whether FMGsScore can predict the response of patients in the immunotherapy cohort to ICI treatment, we next included the metastatic melanoma immunotherapy cohort and the IMvigor210 cohort in the study to investigate the prognostic value of FMGsScore and the predictive effect of immunotherapy response. In both the metastatic melanoma cohort and the IMvigor210 cohort, patients with low FMGsScore had significantly higher overall survival than those with high FMGsScore, and a higher proportion of patients with low FMGsScore responded to immunotherapy (Supplementary Figure S2D–G).
2.6. Single-Cell Profiling Data Reveal the Relationship between 15 Fatty Acid Metabolism Genes and Tumor Immunity
Annotation of single-cell sequencing data identified a total of 8 cell types. t-SNE plots show cell subtypes in breast cancer samples (Figure 9A). heat map of maker genes, part of the 8 cell types annotated (Figure 9B). Stacked plots show a higher percentage of T-cell and myeloid infiltration in patients with triple-negative breast cancer than in patients with other types of breast cancer, and a higher percentage of T-cells in HR+ patients than in ER+ patients (Figure 9C). The expression of 15 fatty acid metabolism genes was scored between cells using the function "Addmodulescore", which comes with the R package "Seurat", and divided into two groups based on the average score. t-SNE plots show the fatty acid metabolism of cell subtypes in breast cancer samples. The t-SNE plot shows the fatty acid metabolism gene scores of the cell subtypes in the breast cancer samples (Figure 9D). It can be seen that the scores of triple-negative breast cancer patients in the six samples were higher than those of other patients and normal samples (Figure 9E). The scores of T cells and myeloid were higher than those of other cells (Figure 9F). To explore intercellular interactions in the high and low Score groups, we used the R package "CellChat" to infer intercellular interactions based on ligand-receptor signaling. The Circos plot shows the number of intercellular interactions between the highscore group and the lowscore group (Figure 10A,B). It can be seen that the number of interactions between cells in the highscore group is more than that in the lowscore group, and the interaction strength is stronger than that in the lowscore group (Figure 10C). Interactions between epithelial and endothelial cells were enhanced in the lowscore group relative to the highscore group, while interactions between immune cells (T cells, mast cells, and myeloid cells) were not as strong as in the highscore group (Figure 10D). Comparison of cell-to-cell interaction pathways in the lowscore group versus the highscore group. We found enhanced MHC-I and MHC-II pathway signaling in Highscore samples, suggesting activation of antigen-presenting functions of CD8+ T cells and CD4+ T cells in Highscore samples, in addition to activation of CXCL-related pathways, such as CXCL9-CXCR3, CXCL10-CXCR, and CXCL13-CXCR (Figure 10E). The CXCL9, -10, -11/CXCR3 axis mainly regulates immune cell migration, differentiation, and activation. The immune response rate recruits immune cells such as cytotoxic lymphocytes (CTL), natural killer (natural killer) cells, NKT cells, and macrophages through this axis[14]. Second, interactions related to interferon-mediated signaling pathways and antigen processing and presentation (IFNG-IFNG R1, IFNG-IFNGR2, HLA-DRB1-CD4, HLA-DRA-CD4, H LA-DRPB1-CD4, and HLA-DRA1-CD4) were also elevated in the Highscore high group (Figure 10F). This suggests that immune pathways are more active in patients with high expression of 15 fatty acid-related genes.
2.7. Critical Role of NDUFAB1 Gene in Migration and Proliferation in Breast Cancer Cells
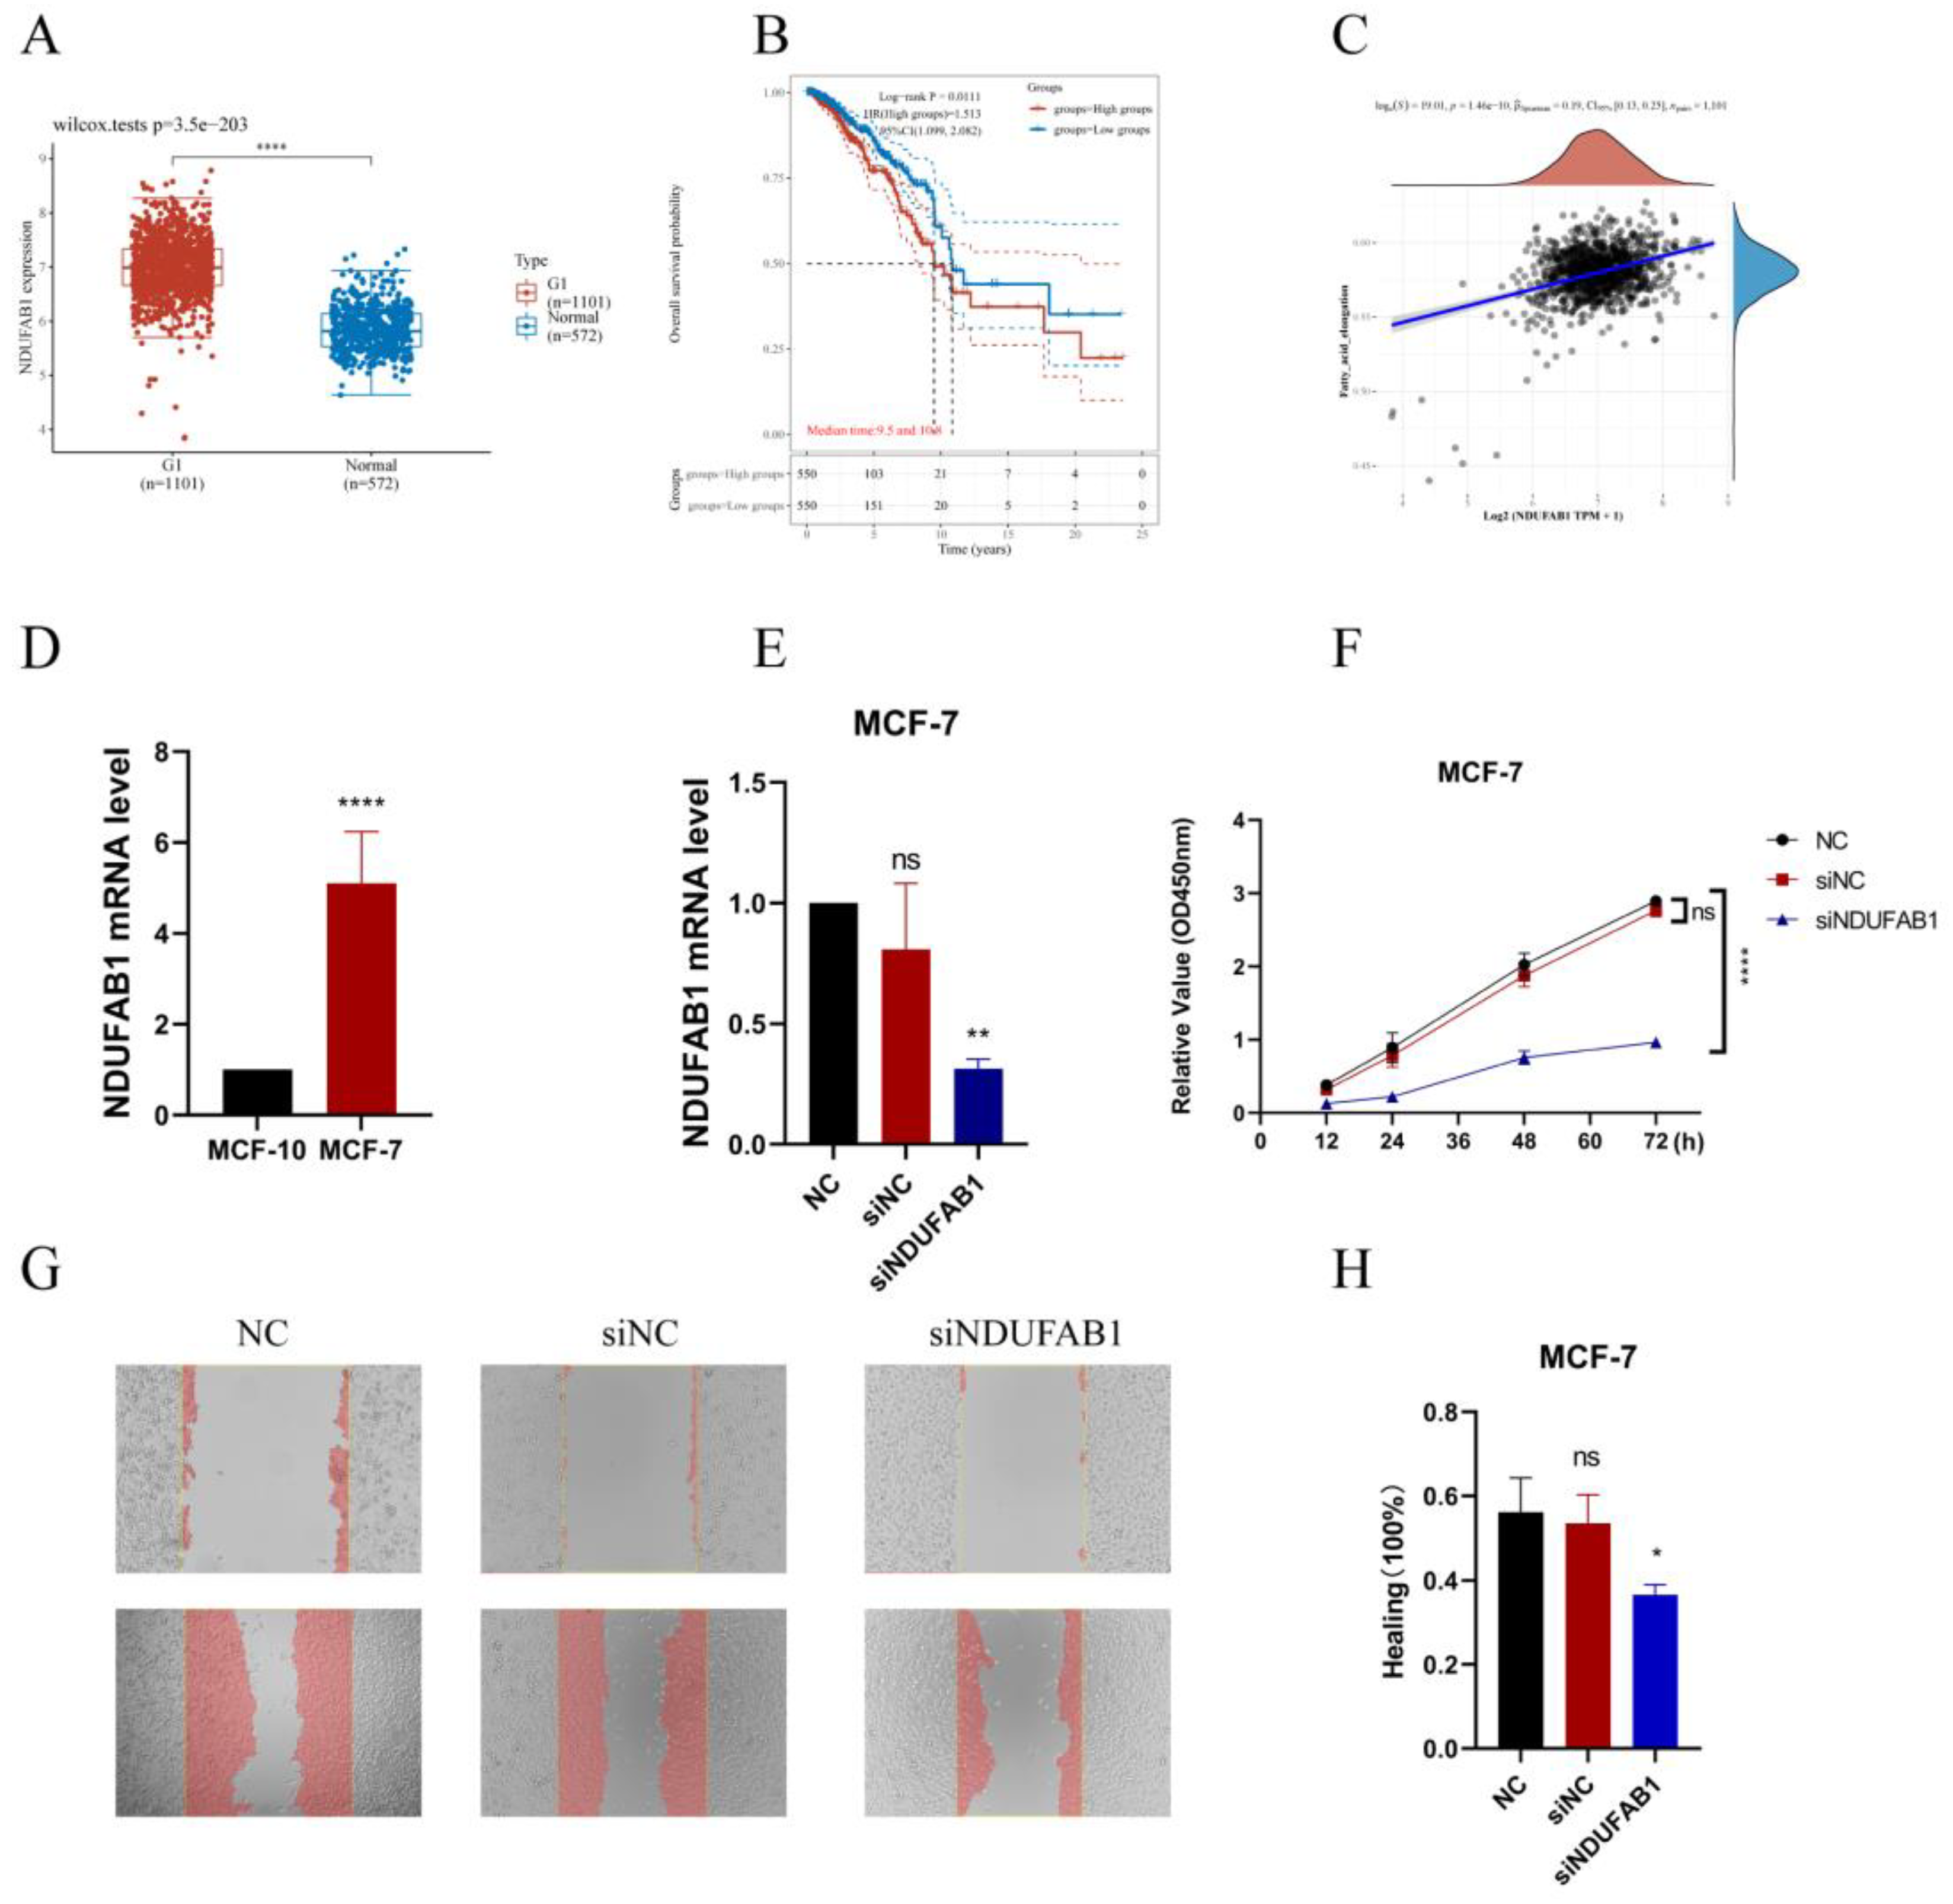
A significant upregulation of the NDUFAB1 gene in tumor samples was verified in TCGA data (Figure 11A), and patients with high NDUFAB1 expression also had a poorer prognosis (Figure 11B), and a significant positive correlation between NDUFAB1 and fatty acid elongation was subsequently found (Figure 11C). Very long-chain fatty acids have been strongly associated with cancer development. We have subsequently demonstrated through in vitro experiments that NDUFAB1 promotes proliferation and migration of breast cancer cells. qRT-PCR verified the upregulation of NDUFAB1 in breast cancer, and NDUFAB1 was significantly upregulated in MCF-7 cell line (Figure 11D). Subsequently Figure 11E showed a significant decrease in NDUFAB1 expression in transfected MCF-7 cells (Figure 11E). In CCK8 analysis, knockdown of NDUFAB1 resulted in greatly reduced cell viability in MCF-7 cell lines, suggesting that NDUFAB1 may promote proliferation (Figure 11F). Wound healing assays in Figure 12G, H showed that cells migrated more slowly after NDUFAB1 knockdown than in the NC and siNC groups, suggesting that NDUFAB1 may promote migration of breast cancer cells. The differences were statistically significant.
3. Discussion
Breast cancer is the most prevalent cancer in women worldwide, and while immunotherapy works well for many cancer patients today, breast cancer patients rarely profit, so new genes are needed to mark patients who respond better to immunotherapy. The use of different approaches to construct models to screen for molecular targets with prognostic and therapeutic effects on breast cancer has become a major focus of research at this stage. The breast is a fat-rich tissue with relatively activated fatty acid metabolism, and there are fewer studies on comprehensive fatty acid metabolism genes regulating mechanisms in breast cancer. Tang et al, screened fatty acid metabolism genes associated with OS in breast cancer patients and used lasso regression to construct a prognostic model[15]. This is similar to our study, but our study focused on the relationship between fatty acid metabolism and tumor microenvironment. The model was constructed by unsupervised cluster analysis of typing, screening for differential genes in typing, and scoring the model by PCA based on the differential genes associated with prognosis. This has the advantage of incorporating more differential genes associated with fatty acid metabolism, rather than studying fatty acid metabolism genes alone. Therefore, this study screened for differential genes in breast cancer patients and normal samples based on 309 genes related to fatty acid metabolism and extracted 15 genes with prognostic impact on breast cancer patients (ALOX15B, CEL, UBE2L6, ABCD1, HSPH1, PTGDS, NDUFAB1, ALDH3A1, ADH6, ACSL1, PSME1, NUDT19, ACSL5, RDH16, IL4I1) have been studied. Relevant studies have been conducted to demonstrate the role of these genes in tumors, for example, arachidonate 15-lipoxygenase type B (ALOX15B), This gene encodes a member of the lipoxygenase family of structurally related nonheme iron dioxygenases involved in the production of fatty acid hydroperoxides. ALOX15B in TAM may be a major contributor to bioactive lipid mediators in TME, and blocking ALOX15 reduces the infiltration of MDSCs or monocyte infiltration, thereby reducing the number of TAMs[16]. Also as a ferroptosis-related gene, it may act as a breast cancer-independent prognostic factor [17]. ATP binding cassette subfamily D member 1 (ABCD1), the protein encoded by this gene is a member of the ATP-binding cassette transporter protein family (ABC) transporter protein superfamily. This protein is a member of the ALD subfamily and is involved in the peroxisomal import of fatty acids and/or fatty acyl-coenzyme A into the organelle[18]. The observed downregulation of ABCDs in certain types of tumors may in some cases lead to lipid accumulation, which may then promote tumor growth and progression in a manner similar to X-ALD, through oxidative stress and inflammatory stimuli leading to loss of peroxisome function[19].
In this study, we first genetic variants in fatty acid metabolism-related genes, which are dysregulated in BRCA patients and associated with prognosis, although the frequency of mutations in 15 fatty acid metabolism-related genes is low. Then unsupervised cluster analysis was applied to classify BRCA patients into three categories, yielding three different fatty acid gene patterns (FMGsCluster-A, FMGsCluster-B, and FMGsCluster-C). Due to the complexity of fatty acid metabolism-related gene interactions, we searched for 898 DEGs based on three patterns (Figure 4A). GO enrichment analysis and KEGG enrichment analysis showed that these genes were significantly enriched in immune pathways such as a cytokine-cytokine receptor, natural killer cell-mediated cytotoxicity, and T cell receptor signaling pathways. These results suggest that fatty acid metabolism genes are critical for immunomodulatory roles in the tumor microenvironment. Three genomic subtypes were identified based on 898 related genes, and an FMGsScore was developed to comprehensively quantify individual BRCA cases and assess the FMGsScore about clinical, tumor mutational load, immune checkpoint, and immune therapy response. The low FMGsScore group had more abundant immune cell infiltration and better prognosis, higher expression of immune checkpoints, better prognosis, better response to immunotherapy, and more suitability for immunotherapy. The existing literature reports a huge role of TME in the development and progression of BRCA [20]. Existing studies have demonstrated the huge role of fatty acid metabolism in TME that cannot be ignored, and its huge impact on different immune cell differentiation and value-added [21]. Its fatty acid synthesis provides the raw material for effector T cell value addition, while fatty acid oxidation inhibits effector T cell activation and also reduces interferon synthesis[22]. Abnormal accumulation of fatty acids in TME also induces T cell senescence and promotes tumor development[23]. In contrast, the CD8+ and CD4+ T-cell infiltration abundance was higher in the low FMGsScore group, which is consistent with the expected results of this study. The inhibition of immune checkpoints such as PD-1 and PD-L1 restores the cytotoxicity of immune cells thus achieving anti-tumor[24]. However, the success rate of immunotherapy for breast cancer has been low due to its low immunogenicity [25]. And some breast cancer patients, mostly triple-negative breast cancer patients (TNBC) are immunogenic and present with poor prognosis and chemotherapy tolerance[26]. These patients are suitable targets for immunotherapy that we are looking for[27].
Therefore, this study assessed the FMGsScore constructed from fatty acid metabolism-related genes about immune checkpoints and immunotherapy. Here, we showed that FMGsScore was significantly associated with BRCA response to ICI treatment with immune checkpoints. The low FMGsScore group with higher levels of immune checkpoint gene expression (PD1, PD-L1, CTLA4, LAG3, HAVCR2, IDO1) had higher ICI scores in CTLA-4/PD-1 immunotherapy and were more sensitive to ICI treatment than the high PyroptosisScore group. This suggests that the application of FMGsScore can help screen breast cancer patients suitable for immunotherapy. Prolonged survival in mice by combining Fatostatin, an inhibitor of SREBP1, with anti-PD-1 treatment in a B16 tumor model. It stopped tumor growth and prolonged survival in a B16 mouse model. A decrease in M2-like TAMs and an increase in CD8+ T cells have been observed[28].
However, most of the current studies are in vitro cell line experiments or in vivo experiments in mice, which differ significantly from the tumor microenvironment in humans and cannot solve the immunotherapy problem in clinical patients. In addition, single-cell sequencing has a high resolution that is not available with ordinary sequencing, and it can measure tumor heterogeneity at the level of individual cells, which is of great significance for the study of tumor microenvironment[29]. For the emerging single-cell sequencing multi-omics data, revealing its regulatory program remains one of the challenges in genomics, and the study by Song et al. provides a novel approach, Single-cell Multi-omics Gene co-regulatory algorithm (SMGR), which is a good solution to this problem. The use of single-cell sequencing technology to study the metabolic characteristics in the tumor microenvironment can better distinguish the metabolic patterns of different cells in the tumor microenvironment[30]. For example, the study by Yu et al. used Bulk and single-cell transcriptome profiling to reveal the metabolic heterogeneity in human breast cancers, and they used energy-related metabolic signatures to construct Prognostic and therapeutic value of the classifier revealed the heterogeneity of energy metabolism, dividing breast cancer patients into two distinct metabolic signature clusters: cluster 1 exhibited high glycolytic activity and lower survival, and cluster 2 was characterized by an enrichment in fatty acid oxidation and glutamine catabolism. Its study uses single-cell sequencing technology to provide new metabolic insights that can ultimately tailor therapeutic strategies based on patient or cell-type-specific cancer metabolism[31]. Therefore, this study uses single-cell sequencing technology to investigate the role of 15 important fatty acid metabolism genes in cellular communication in the breast cancer tumor microenvironment to reveal the role of fatty acid metabolism among immune pathways.
Addmodulescore function scores divided the samples into two groups with high and low scores, and we found that antigen-presentation pathways were more active in the high-scoring samples than in the low-scoring samples. Increased lipid accumulation within lipid droplets in tumor-associated DCs has been reported to lead to DC dysfunction through reduced antigen presentation and result in poor stimulation of T cell responses[32,33]. 15 fatty acid metabolism genes selected for this study were mainly associated with fatty acid oxidation, and lipid accumulation in DC cells in the low-scoring samples resulted in the inactivation of the antigen-presentation pathway. LGALS9-HAVCR2, LGALS9-CD45, and LGALS9-CD44 in GALECTIN were observed in high Scores samples by CellChat, and LGALS9 encodes a tandem protein galectin-9, which was found in recent studies to interact with PD-1 and TIM-3 interacts to regulate T-cell death and is a target for cancer immunotherapy[34]. In addition to this, it has also been found in previous studies that its binding to CD44 leads to increased inducible regulatory stability and suppressive function of T (iTreg) cells[35]. Thus ICB combined with inhibition of LGALS9 as well as fatty acid metabolic pathways could greatly enhance the success of tumor immunotherapy. NDUFAB1 is the gene with the highest prognostic risk factor among 15 fatty acid-related genes; therefore, we decided to validate the role of this gene through in vitro experiments. We found that NDUFAB1 was highly expressed in cancer patients through TCGA database analysis; also, patients with high NDUFAB1 expression had a lower survival rate. In previous studies, NDUFAB1 was also found to be a potential target for BC, but its role was not verified by in vivo in vitro experiments. We demonstrated for the first time through in vitro experiments that NDUFAB1 promotes migration and proliferation of breast cancer cells.
This adds to the evidence that NDUFAB1 plays a role in BC. Many previous studies have suggested a function for NDUFAB1 in cardioprotection[36], but specific mechanisms have not been investigated in cancer. We found that NDUFAB1 is associated with fatty acid elongation, and fatty acid elongation has been shown to be closely associated with many cancers. For example, extra-long-chain fatty acid protein 5 (ELOVL5)-mediated fatty acid elongation has been shown to promote the development of gastric cancer[37]. In addition to this, elongation expression of extra-long-chain fatty acid protein 5 (ELOVL5) and fatty acid desaturase 1 (FADS1) is upregulated in mesenchymal gastric cancer cells (GCs), leading to the development of ferroptosis[38]. In our study, NDUFAB1 also has both the potential to be a potential target.
4. Materials and Methods
4.1. Breast Cancer Dataset Source
The public TCGA dataset (https://cancergenome.nih.gov/) was used to gather gene expression data for BRCA samples and clinical annotations. BRCA RNA sequencing data (in FPKM format) translated to transcripts per million kilobases (TPM) format. The clinical annotations that were gathered for this project BRC included survival time, survival status, age, sex, stage, grading, and TNM stage. The data were normalized using the "normalize.quantiles" function in the R software package "preprocessCore" and log2 for data that were not normalized. Probe IDs were transformed into gene symbols according to the annotation information of the corresponding platform, probes with multiple genes were excluded, the average value of genes corresponding to multiple probes was calculated, and samples with no survival data were removed from further analysis. ComBat" algorithm of the "sva" package was used to correct for batch effects of non-biotechnical bias. Additional RNA-seq data and clinical survival information for 110 breast cancer samples were obtained from GSE162228 (https://www.ncbi.nlm.nih.gov/geo/). RNA-seq data and clinical survival information of 327 breast cancer patients from GSE20685 were used to validate the accuracy of the model. Data for single-cell sequence RNA analysis were downloaded from the GEO database (GSE161529). Expression data were normalized using the R packages "Seurat" and "NormalizeData". The first 2000 highly variable genes were identified using the R package "FingVariableGenes". The cellular subpopulation annotation was performed using the "singleR" package. The distribution of cellular components was mapped with the R package "t-SNE". BRC mutations in the genome information (such as somatic mutations and copy number) CNVs were acquired, and R programs were used to analyze them. Breast cancer mutation data (including somatic mutations and copy number variants (CNV)) were obtained, and somatic mutation detection and copy number visualization were performed using the R packages "mafTools" and "RCircos". To investigate the predictive validity of FMGsScore for immunotherapy response, we included a metastatic uroepithelial carcinoma (mUC) cohort (EGAS00001002556), obtained through the R package IMvigor210CoreBiologies (http://research-pub.gene.com/ IMvigor210CoreBiologies)[39]. We also obtained a cohort of patients treated with anti-PD1 ICB from the Large Melanoma Genome Sequencing Project (MGSP), including processed RNA-seq data and clinical data from the transcript in a million (TPM) matrix[40]. Data for single-cell sequence RNA analysis were downloaded from the GEO database (GSE161529). Expression data were normalized using the R packages "Seurat" and "NormalizeData". The first 2000 highly variable genes were identified using the"FingVariableGenes". The cellular subpopulation annotation was performed using the "singleR" package. The distribution of cellular components was mapped with the R package "t-SNE".
4.2. Produces Fatty Acid Metabolism-Related Genes Associated with Prognosis
Three gene units regarding FA metabolism, inclusive of KEGG fatty acid metabolism pathways, Hallmark fatty acid metabolism genes, and Reactome fatty acid metabolism genes, had been acquired from the Molecular Signature Databasev7.4(MSigDB), and 3098 FMGs had been accrued after the overlapping genes in the above three gene units have been remove. The "limma" package in R language used to be used to pick 121 distinct genes in TCGA statistics (logFC=0.585, Fdr=0.05). DEG genes were analyzed using univariate Cox risk regression to screen for OS-related FMGs, and 15 significant OS-related FMGs were retrieved separately (ALOX15B, CEL, UBE2L6, ABCD1, HSPH1, PTGDS, NDUFAB1, ALDH3A1, ADH6, ACSL1, PSME1, NUDT19, ACSL5, RDH16, and IL4I1).
4.3. Consensus Clustering of FMGs Regulators
Unsupervised clustering analysis used to be used to discover special FMGs amendment patterns based totally on the expression of these regulators and breast most cancers samples into significantclusters. Consistent clustering used to be carried out the usage of the R bundle "Consensus Cluster Plus" and we carried out one thousand instances repetitions to warranty the balance of clusters[41].
4.4. Gene Set Variation Analysis
The "GSVA" R package was utilized to explore contrasts in biological processes across FMGS signature designs[42]. The "ClusterProfiler" bundle for useful explanation and the gene set document (c2.cp.kegg.v7.2.symbs.GMT) was gotten from the MSigDB information base (https://www.gsea-msigdb.org)[43,44].
4.5. Estimation of TME Cell Infiltration
We used the Single Sample Gene Set Enrichment Analysis (ssGSEA) procedure to measure the relative abundance of each cell infiltrate in BRCA TME. Genetic markers for each TME-infiltrating immune cell type were obtained from the Charoentong study, which identified multiple human immune cell subsets such as stimulatory CD8 T cells, stimulatory dendritic cells, macrophages, NKT, and regulatory T cells [19]. Enrichment values calculated by ssGSEA analysis were used to calculate the relative abundance of each TME-infiltrating cell in each sample.
4.6. Construction of the FMGs Gene Signature
To construct FMGs scoring patterns, utilizing the empirical Bayesian approach of the "limma" R package, differentially expressed genes between FMGs modification patterns were identified. Significant p-values were adjusted for p<0.001. Differential analysis and Venn diagrams revealed 898 different genes in common across the three FMGs clusters. Each gene was then subjected to a single COX regression analysis to screen for genes associated with prognosis, with a total of 210 genes [20], [21]. Principal component analysis (PCA) was used to construct the FMGs gene signature. FMGs-Score was defined as:
where i represents each FMGs. PC1 and PC2 are the first two principal components resulting from the PCA. In the scRNA-seq data-set, FMGsScore is defined as the average expression level of FMGs for each single cell. The scoring of the single-cell dataset was based on the function "AddModuleScore" of the R package "Seurat"[45].
4.7. Comprehensive Analysis of the FMGs-Score Signature with Genomic Mutations, Clinical Information, and Immunity Correlation
Differences in genomic mutations, tumor mutation load, and clinical annotation between the FMGs-Score groups were analyzed. The Wilcoxon test was then used to assess between-group differences in potential immune checkpoints (PD-L1, PD-1, CTLA4, LAG3, and TIGHT, e.g.) Between the high and low-scoring groups. Immune checkpoint inhibitor (ICI) immune epistasis score files were obtained from the Cancer Immunome Database (TCIA, https://tcia.at/home). Immunophenoscore (IPS) is a good predictor of CTLA-4 and PD-1 responsiveness and response to immunotherapy. And predicts intergroup differences in immunotherapy with CTLA-4 and PD-1 blockers [46,47].
4.8. Analysis of Single-Cell Sequencing Data
Single-cell sequencing data of breast cancer patients and normal breast were downloaded from GEO database GSE161529, from which single-cell sequencing data of 2 TNBC patients, 1 ER+ patient, 1 HR+ patient, and 2 normal individuals were obtained. Single-cell sequencing data were searched for maker gene annotation from CellMarker (http://bio-bigdata.hrbmu.edu.cn/CellMarker/) and panglaoDB (https://panglaodb.se/) and annotated with the aid of "SingleR" automated annotation tool. CellChat (http://www.cellchat.org/)was used to analyze intercellular communication networks from scRNA-seq data (24).
4.9. Cell Lines Culture and Transfection
The human breast cancer MCF-7 cell line was procured from the Wuhan Pronosai Life Sciences Co., Ltd. (Priscilla, Wuhan, China), and these cells were cultured in DMEM (Gibco BRL, USA) with a 10% fetal bovine serum (Biological Industries, USA), 1% penicillin/streptomycin mixture(Liji,Shanghai,China) in 95% humidity and 5% CO2 at 37°C. Cells were transfected with the previously synthesized small interfering RNAs (GenePharma Inc, Shanghai, China) targeting gene NDUFAB1 using the Lipofectamine3000 (Thermo Fisher Scientific, Waltham, MA, USA) according to the manufacturer’s protocol. The siRNA sequences for gene NDUFAB1 are provided in Supplemental Table S1.
4.10. qRT-PCR
Total RNA was extracted from the cell lines using AG RNAex Pro RNA Kit (AG21101, Accurate Biotechnology, Hunan, China). Then cDNA was synthesized and reverse transcribed using Evo M-MLV RT Kit with gDNA Clean for RT-qPCR (AG11705, Accurate Biotechnology, Hunan, China). Real-time polymerase chain reaction (RT-PCR ) was performed with SYBR Green Pro Taq HS premixed qPCR kit (AG11701, Accurate Biotechnology, Hunan, China), and expression levels were calculated by the 2 DDCt method. The mRNA expression was normalized by the expression level of mRNA β-acting. All primers were provided by Accurate Biotechnoloy Co., Ltd (Hunan, China), and the detailed primer sequences are shown in Supplementary Table S1. All data are expressed as the mean ± SD of three independent experiments. *P < 0.05, **P < 0.01, ***P < 0.001,****P<0.0001.
4.11. CCK8 Assay to Detect Cell Proliferation
Cell Counting Kit-8 (CCK-8) kit (bs-4975R, Bioss, China) was used to detect MCF-7 cell viability. After transfection of MCF-7 cells, the cells were changed after 7-8 h of transfection, digested and resuspended with fresh medium, and the cell density was diluted to 2* 104 cells/ml were added to 96-well plates, and 0.1 ml was added to each well, and 5 wells were added in each group. There were three groups of NC, siNC, and siNDUFAB1. Cells were incubated in a thirty-seven-degree incubator with five percent CO2 for 12, 24, 48 and 72 hours. After removal, the cells in each well were added 10 μl of CCK-8 solution and incubated for 90 min at 37°C in a cell incubator. The absorbance values were measured at 450 nm using a Spectra MR ELISA (Dynex, USA). All data are expressed as the mean ± SD of three independent experiments. *P < 0.05, **P < 0.01, ***P < 0.001, ****P < 0.0001.
4.12. Healing Assay
Transfect each group of MCF-7 cells for 7 hours as designed, digest them and spread them all over the monolayer on a six-well plate. Take 4.0×10⁵/ml density of cells, add 2 ml of cells to each well, and incubate them for 24 hours to spread them evenly over the six-well plate. Use a 200 μl pipette tip to score the wells vertically on the horizontal lines drawn in advance, and score each well 3 times, equally spaced and parallel to each other. After scratching, 1 ml of PBS was added to gently wash the cells 3 times, and then 2 ml of complete medium was added to each well and observed under an inverted microscope as a record for 0 h. After 24 h, the record was re-observed under the microscope, and the widths after scratching for 0 h and 24 h were calculated by the software, respectively, and the results were analyzed by Image J software. All data are expressed as the mean ± SD of three independent experiments. *P<0.05, **P<0.01, ***P<0.001.
4.13. Statistical Analysis
Correlations between variables were tested by Pearson correlation analysis. Two continuous variables conforming to a normal distribution were compared using the t-test. The Kruskal-Wallis test was used to compare two and more groups of differences. The best cutoff was obtained using the "surv_cutpoint" function in the "survminer" R package, based on the association between survival outcomes and FMGsScore for each individual data set. The samples were divided into two groups with high and low FMGsScore. The cutoff value for the training group was -12.63661. Survival curves were generated for each subgroup in the data set using the Kaplan-Meier method, and log-rank tests were used to determine statistical differences. All statistical analyses were implemented using R4.2.1 (https://www.r-project.org/). p-values were two-sided. P-values below 0.05 were considered statistically significant.
5. Conclusions
This study used FMGS to type breast cancer disease, identified the great therapeutic potential of fatty acid metabolism-related genes in TME and BRCA, and contributed to the development of new immunotherapeutic strategies.
Supplementary Materials
The following supporting information can be downloaded at the website of this paper posted on Preprints.org. Figure S1: Supplementary Figure S1; Supplementary Figure S2 Table S1: Supplementary Table S1;.
Author Contributions
YX: original manuscript preparation, methods, and data curation. CX and JX: manuscript review and editing. YZ, RQ, RX, ZH and WW: software analysis. And study supervision: XF. All authors have read and approved the final version submitted.
Funding
This study was supported by the Foundation of Liaoning Province Education Administration (No. LJKZ0849).
Data Availability Statement
The public TCGA dataset (https://cancergenome.nih.gov/) was used to gather gene expression data for BRCA samples and clinical annotations. Additional RNA-seq data and clinical survival information for 110 breast cancer samples were obtained from GSE162228 (https://www.ncbi.nlm.nih.gov/geo/). RNA-seq data and clinical survival information of 327 breast cancer patients from GSE20685 were used to validate the accuracy of the model. Data for single-cell sequence RNA analysis were downloaded from the GEO database (GSE161529). we included a metastatic uroepithelial carcinoma (mUC) cohort (EGAS00001002556), obtained through the R package IMvigor210CoreBiologies (http://research-pub.gene.com/ IMvigor210CoreBiologies.
Acknowledgments
We are very grateful for the data provided by the TCGA and GEO observation databases. Thanks to the reviewers and editors for their sincere comments. We thank Dr.Jianming Zeng(University of Macau), and all the members of his bioinformatics team, biotrainee, for generously sharing their experience and codes.
Conflicts of Interest
The funders had no role in the design of the study; in the collection, analyses, or interpretation of data; in the writing of the manuscript; or in the decision to publish the results.
References
- D. Glodzik et al., “Comprehensive molecular comparison of BRCA1 hypermethylated and BRCA1 mutated triple negative breast cancers,” Nat. Commun., vol. 11, no. 1, p. 3747, Dec. 2020. https://doi.org/10.1038/s41467-020-17537-2. [CrossRef]
- K. L. Britt, J. Cuzick, and K.-A. Phillips, “Key steps for effective breast cancer prevention.,” Nat. Rev. Cancer, vol. 20, no. 8, pp. 417–436, Aug. 2020. https://doi.org/10.1038/s41568-020-0266-x. [CrossRef]
- J. Zhao et al., “Exogenous lipids promote the growth of breast cancer cells via CD36.,” Oncol. Rep., vol. 38, no. 4, pp. 2105–2115, Oct. 2017. https://doi.org/10.3892/or.2017.5864. [CrossRef]
- A. J. Hoy, S. R. Nagarajan, and L. M. Butler, “Tumour fatty acid metabolism in the context of therapy resistance and obesity.,” Nat. Rev. Cancer, vol. 21, no. 12, pp. 753–766, Dec. 2021. https://doi.org/10.1038/s41568-021-00388-4. [CrossRef]
- A. E. Ringel et al., “Obesity Shapes Metabolism in the Tumor Microenvironment to Suppress Anti-Tumor Immunity.,” Cell, vol. 183, no. 7, Dec. 2020. https://doi.org/10.1016/j.cell.2020.11.009. [CrossRef]
- D. F. Quail and J. A. Joyce, “Microenvironmental regulation of tumor progression and metastasis.,” Nat. Med., vol. 19, no. 11, pp. 1423–1437, Nov. 2013. https://doi.org/10.1038/nm.3394. [CrossRef]
- B. Lim, W. A. Woodward, X. Wang, J. M. Reuben, and N. T. Ueno, “Inflammatory breast cancer biology: the tumour microenvironment is key.,” Nat. Rev. Cancer, vol. 18, no. 8, pp. 485–499, Aug. 2018. https://doi.org/10.1038/s41568-018-0010-y. [CrossRef]
- S. D. Soysal, A. Tzankov, and S. E. Muenst, “Role of the Tumor Microenvironment in Breast Cancer.,” Pathobiol. J. Immunopathol. Mol. Cell. Biol., vol. 82, no. 3–4, pp. 142–152, Sep. 2015. https://doi.org/10.1159/000430499. [CrossRef]
- Y. Yang, “Cancer immunotherapy: harnessing the immune system to battle cancer.,” J. Clin. Invest., vol. 125, no. 9, pp. 3335–3337, Sep. 2015. https://doi.org/10.1172/JCI83871. [CrossRef]
- S. L. Topalian, J. M. Taube, R. A. Anders, and D. M. Pardoll, “Mechanism-driven biomarkers to guide immune checkpoint blockade in cancer therapy.,” Nat. Rev. Cancer, vol. 16, no. 5, pp. 275–287, May 2016. https://doi.org/10.1038/nrc.2016.36. [CrossRef]
- J. E. Bader, K. Voss, and J. C. Rathmell, “Targeting Metabolism to Improve the Tumor Microenvironment for Cancer Immunotherapy.,” Mol. Cell, vol. 78, no. 6, pp. 1019–1033, Jun. 2020. https://doi.org/10.1016/j.molcel.2020.05.034. [CrossRef]
- Y. Luo, H. Wang, B. Liu, and J. Wei, “Fatty Acid Metabolism and Cancer Immunotherapy.,” Curr. Oncol. Rep., vol. 24, no. 5, pp. 659–670, May 2022. https://doi.org/10.1007/s11912-022-01223-1. [CrossRef]
- D. S. Chen and I. Mellman, “Elements of cancer immunity and the cancer-immune set point.,” Nature, vol. 541, no. 7637, pp. 321–330, Jan. 2017. https://doi.org/10.1038/nature21349. [CrossRef]
- R. Tokunaga et al., “CXCL9, CXCL10, CXCL11/CXCR3 axis for immune activation - A target for novel cancer therapy.,” Cancer Treat. Rev., vol. 63, pp. 40–47, Feb. 2018. https://doi.org/10.1016/j.ctrv.2017.11.007. [CrossRef]
- Y. Tang et al., “Prognosis and Dissection of Immunosuppressive Microenvironment in Breast Cancer Based on Fatty Acid Metabolism-Related Signature.,” Front. Immunol., vol. 13, p. 843515, 2022. https://doi.org/10.3389/fimmu.2022.843515. [CrossRef]
- A. Weigert, E. Strack, R. G. Snodgrass, and B. Brüne, “mPGES-1 and ALOX5/-15 in tumor-associated macrophages.,” Cancer Metastasis Rev., vol. 37, no. 2–3, pp. 317–334, Sep. 2018. https://doi.org/10.1007/s10555-018-9731-3. [CrossRef]
- Z.-H. Wu, Y. Tang, H. Yu, and H.-D. Li, “The role of ferroptosis in breast cancer patients: a comprehensive analysis.,” Cell Death Discov., vol. 7, no. 1, p. 93, May 2021. https://doi.org/10.1038/s41420-021-00473-5. [CrossRef]
- M. Dean, A. Rzhetsky, and R. Allikmets, “The human ATP-binding cassette (ABC) transporter superfamily.,” Genome Res., vol. 11, no. 7, pp. 1156–1166, Jul. 2001.
- V. Hlaváč and P. Souček, “Role of family D ATP-binding cassette transporters (ABCD) in cancer.,” Biochem. Soc. Trans., vol. 43, no. 5, pp. 937–942, Oct. 2015. https://doi.org/10.1042/BST20150114. [CrossRef]
- J. Wang, Z. Yang, C. Zhang, J. Ouyang, G. Zhang, and C. Wu, “A four-gene signature in the tumor microenvironment that significantly associates with the prognosis of patients with breast cancer.,” Gene, vol. 761, p. 145049, Nov. 2020. https://doi.org/10.1016/j.gene.2020.145049. [CrossRef]
- R. J. DeBerardinis, “Tumor Microenvironment, Metabolism, and Immunotherapy.,” N. Engl. J. Med., vol. 382, no. 9, pp. 869–871, Feb. 2020. https://doi.org/10.1056/NEJMcibr1914890. [CrossRef]
- C. Ecker et al., “Differential Reliance on Lipid Metabolism as a Salvage Pathway Underlies Functional Differences of T Cell Subsets in Poor Nutrient Environments.,” Cell Rep., vol. 23, no. 3, pp. 741–755, Apr. 2018. https://doi.org/10.1016/j.celrep.2018.03.084. [CrossRef]
- A. Gao et al., “Tumor-derived ILT4 induces T cell senescence and suppresses tumor immunity.,” J. Immunother. Cancer, vol. 9, no. 3, Mar. 2021. https://doi.org/10.1136/jitc-2020-001536. [CrossRef]
- J. Bellmunt, T. Powles, and N. J. Vogelzang, “A review on the evolution of PD-1/PD-L1 immunotherapy for bladder cancer: The future is now.,” Cancer Treat. Rev., vol. 54, pp. 58–67, Mar. 2017. https://doi.org/10.1016/j.ctrv.2017.01.007. [CrossRef]
- M. Yarchoan, A. Hopkins, and E. M. Jaffee, “Tumor Mutational Burden and Response Rate to PD-1 Inhibition.,” N. Engl. J. Med., vol. 377, no. 25, pp. 2500–2501, Dec. 2017. https://doi.org/10.1056/NEJMc1713444. [CrossRef]
- S. Adams et al., “Current Landscape of Immunotherapy in Breast Cancer: A Review.,” JAMA Oncol., vol. 5, no. 8, pp. 1205–1214, Aug. 2019. https://doi.org/10.1001/jamaoncol.2018.7147. [CrossRef]
- A. Polk, I.-M. Svane, M. Andersson, and D. Nielsen, “Checkpoint inhibitors in breast cancer - Current status.,” Cancer Treat. Rev., vol. 63, pp. 122–134, Feb. 2018. https://doi.org/10.1016/j.ctrv.2017.12.008. [CrossRef]
- C. Liu et al., “Treg Cells Promote the SREBP1-Dependent Metabolic Fitness of Tumor-Promoting Macrophages via Repression of CD8 T Cell-Derived Interferon-γ.,” Immunity, vol. 51, no. 2, Aug. 2019. https://doi.org/10.1016/j.immuni.2019.06.017. [CrossRef]
- S. Liu, A. Thennavan, J. P. Garay, J. S. Marron, and C. M. Perou, “MultiK: an automated tool to determine optimal cluster numbers in single-cell RNA sequencing data.,” Genome Biol., vol. 22, no. 1, p. 232, Aug. 2021. https://doi.org/10.1186/s13059-021-02445-5. [CrossRef]
- Q. Song, X. Zhu, L. Jin, M. Chen, W. Zhang, and J. Su, “SMGR: a joint statistical method for integrative analysis of single-cell multi-omics data.,” NAR Genomics Bioinforma., vol. 4, no. 3, p. lqac056, Sep. 2022. https://doi.org/10.1093/nargab/lqac056. [CrossRef]
- T.-J. Yu et al., “Bulk and single-cell transcriptome profiling reveal the metabolic heterogeneity in human breast cancers.,” Mol. Ther. J. Am. Soc. Gene Ther., vol. 29, no. 7, pp. 2350–2365, Jul. 2021. https://doi.org/10.1016/j.ymthe.2021.03.003. [CrossRef]
- D. L. Herber et al., “Lipid accumulation and dendritic cell dysfunction in cancer.,” Nat. Med., vol. 16, no. 8, pp. 880–886, Aug. 2010. https://doi.org/10.1038/nm.2172. [CrossRef]
- F. Veglia et al., “Lipid bodies containing oxidatively truncated lipids block antigen cross-presentation by dendritic cells in cancer.,” Nat. Commun., vol. 8, no. 1, p. 2122, Dec. 2017. https://doi.org/10.1038/s41467-017-02186-9. [CrossRef]
- R. Yang et al., “Galectin-9 interacts with PD-1 and TIM-3 to regulate T cell death and is a target for cancer immunotherapy.,” Nat. Commun., vol. 12, no. 1, p. 832, Feb. 2021. https://doi.org/10.1038/s41467-021-21099-2. [CrossRef]
- F. Gieseke, A. Kruchen, N. Tzaribachev, F. Bentzien, M. Dominici, and I. Müller, “Proinflammatory stimuli induce galectin-9 in human mesenchymal stromal cells to suppress T-cell proliferation.,” Eur. J. Immunol., vol. 43, no. 10, pp. 2741–2749, Oct. 2013. https://doi.org/10.1002/eji.201343335. [CrossRef]
- T. Hou et al., “NDUFAB1 confers cardio-protection by enhancing mitochondrial bioenergetics through coordination of respiratory complex and supercomplex assembly,” Cell Res., vol. 29, no. 9, pp. 754–766, Sep. 2019. https://doi.org/10.1038/s41422-019-0208-x. [CrossRef]
- S. Nitta et al., “ELOVL5-mediated fatty acid elongation promotes cellular proliferation and invasion in renal cell carcinoma,” Cancer Sci., vol. 113, no. 8, pp. 2738–2752, Aug. 2022. https://doi.org/10.1111/cas.15454. [CrossRef]
- J.-Y. Lee et al., “Polyunsaturated fatty acid biosynthesis pathway determines ferroptosis sensitivity in gastric cancer.,” Proc. Natl. Acad. Sci. U. S. A., vol. 117, no. 51, pp. 32433–32442, Dec. 2020. https://doi.org/10.1073/pnas.2006828117. [CrossRef]
- S. Mariathasan et al., “TGFβ attenuates tumour response to PD-L1 blockade by contributing to exclusion of T cells.,” Nature, vol. 554, no. 7693, pp. 544–548, Feb. 2018. https://doi.org/10.1038/nature25501. [CrossRef]
- D. Liu et al., “Integrative molecular and clinical modeling of clinical outcomes to PD1 blockade in patients with metastatic melanoma.,” Nat. Med., vol. 25, no. 12, pp. 1916–1927, Dec. 2019. https://doi.org/10.1038/s41591-019-0654-5. [CrossRef]
- M. D. Wilkerson and D. N. Hayes, “ConsensusClusterPlus: a class discovery tool with confidence assessments and item tracking.,” Bioinforma. Oxf. Engl., vol. 26, no. 12, pp. 1572–1573, Jun. 2010. https://doi.org/10.1093/bioinformatics/btq170. [CrossRef]
- S. Hänzelmann, R. Castelo, and J. Guinney, “GSVA: gene set variation analysis for microarray and RNA-seq data.,” BMC Bioinformatics, vol. 14, p. 7, Jan. 2013. https://doi.org/10.1186/1471-2105-14-7. [CrossRef]
- G. Yu, L.-G. Wang, Y. Han, and Q.-Y. He, “clusterProfiler: an R package for comparing biological themes among gene clusters.,” Omics J. Integr. Biol., vol. 16, no. 5, pp. 284–287, May 2012. https://doi.org/10.1089/omi.2011.0118. [CrossRef]
- A. Liberzon, C. Birger, H. Thorvaldsdóttir, M. Ghandi, J. P. Mesirov, and P. Tamayo, “The Molecular Signatures Database (MSigDB) hallmark gene set collection.,” Cell Syst., vol. 1, no. 6, pp. 417–425, Dec. 2015.
- A. Butler, P. Hoffman, P. Smibert, E. Papalexi, and R. Satija, “Integrating single-cell transcriptomic data across different conditions, technologies, and species.,” Nat. Biotechnol., vol. 36, no. 5, pp. 411–420, Jun. 2018. https://doi.org/10.1038/nbt.4096. [CrossRef]
- E. M. Van Allen et al., “Genomic correlates of response to CTLA-4 blockade in metastatic melanoma.,” Science, vol. 350, no. 6257, pp. 207–211, Oct. 2015. https://doi.org/10.1126/science.aad0095. [CrossRef]
- W. Hugo et al., “Genomic and Transcriptomic Features of Response to Anti-PD-1 Therapy in Metastatic Melanoma.,” Cell, vol. 165, no. 1, pp. 35–44, Mar. 2016. https://doi.org/10.1016/j.cell.2016.02.065. [CrossRef]
Figure 1.
The flowchart of this study.
Figure 2.
Identification of prognostic FMGs in BC patients. (A) Heatmap of 121 differentially expressed genes from FMGs. (B) Volcano plot exhibiting 121 DEGs among FMGs. (C) 15 FMGs associated with prognosis. (D) The interaction between FMGs in breast cancer. The circle size represented the effect of each gene on the prognosis, and the range of values calculated from Log-rank test wasp< 0.001, p< 0.01, p< 0.05 and P< 0.1, respectively. Purple in the right part of the circle, risk factors of prognosis; green in the right part of the circle, protective factors of prognosis. The lines linking regulators show their interactions, and thickness shows the correlation strength between regulators. The negative correlation was marked with blue and the positive correlation with red.
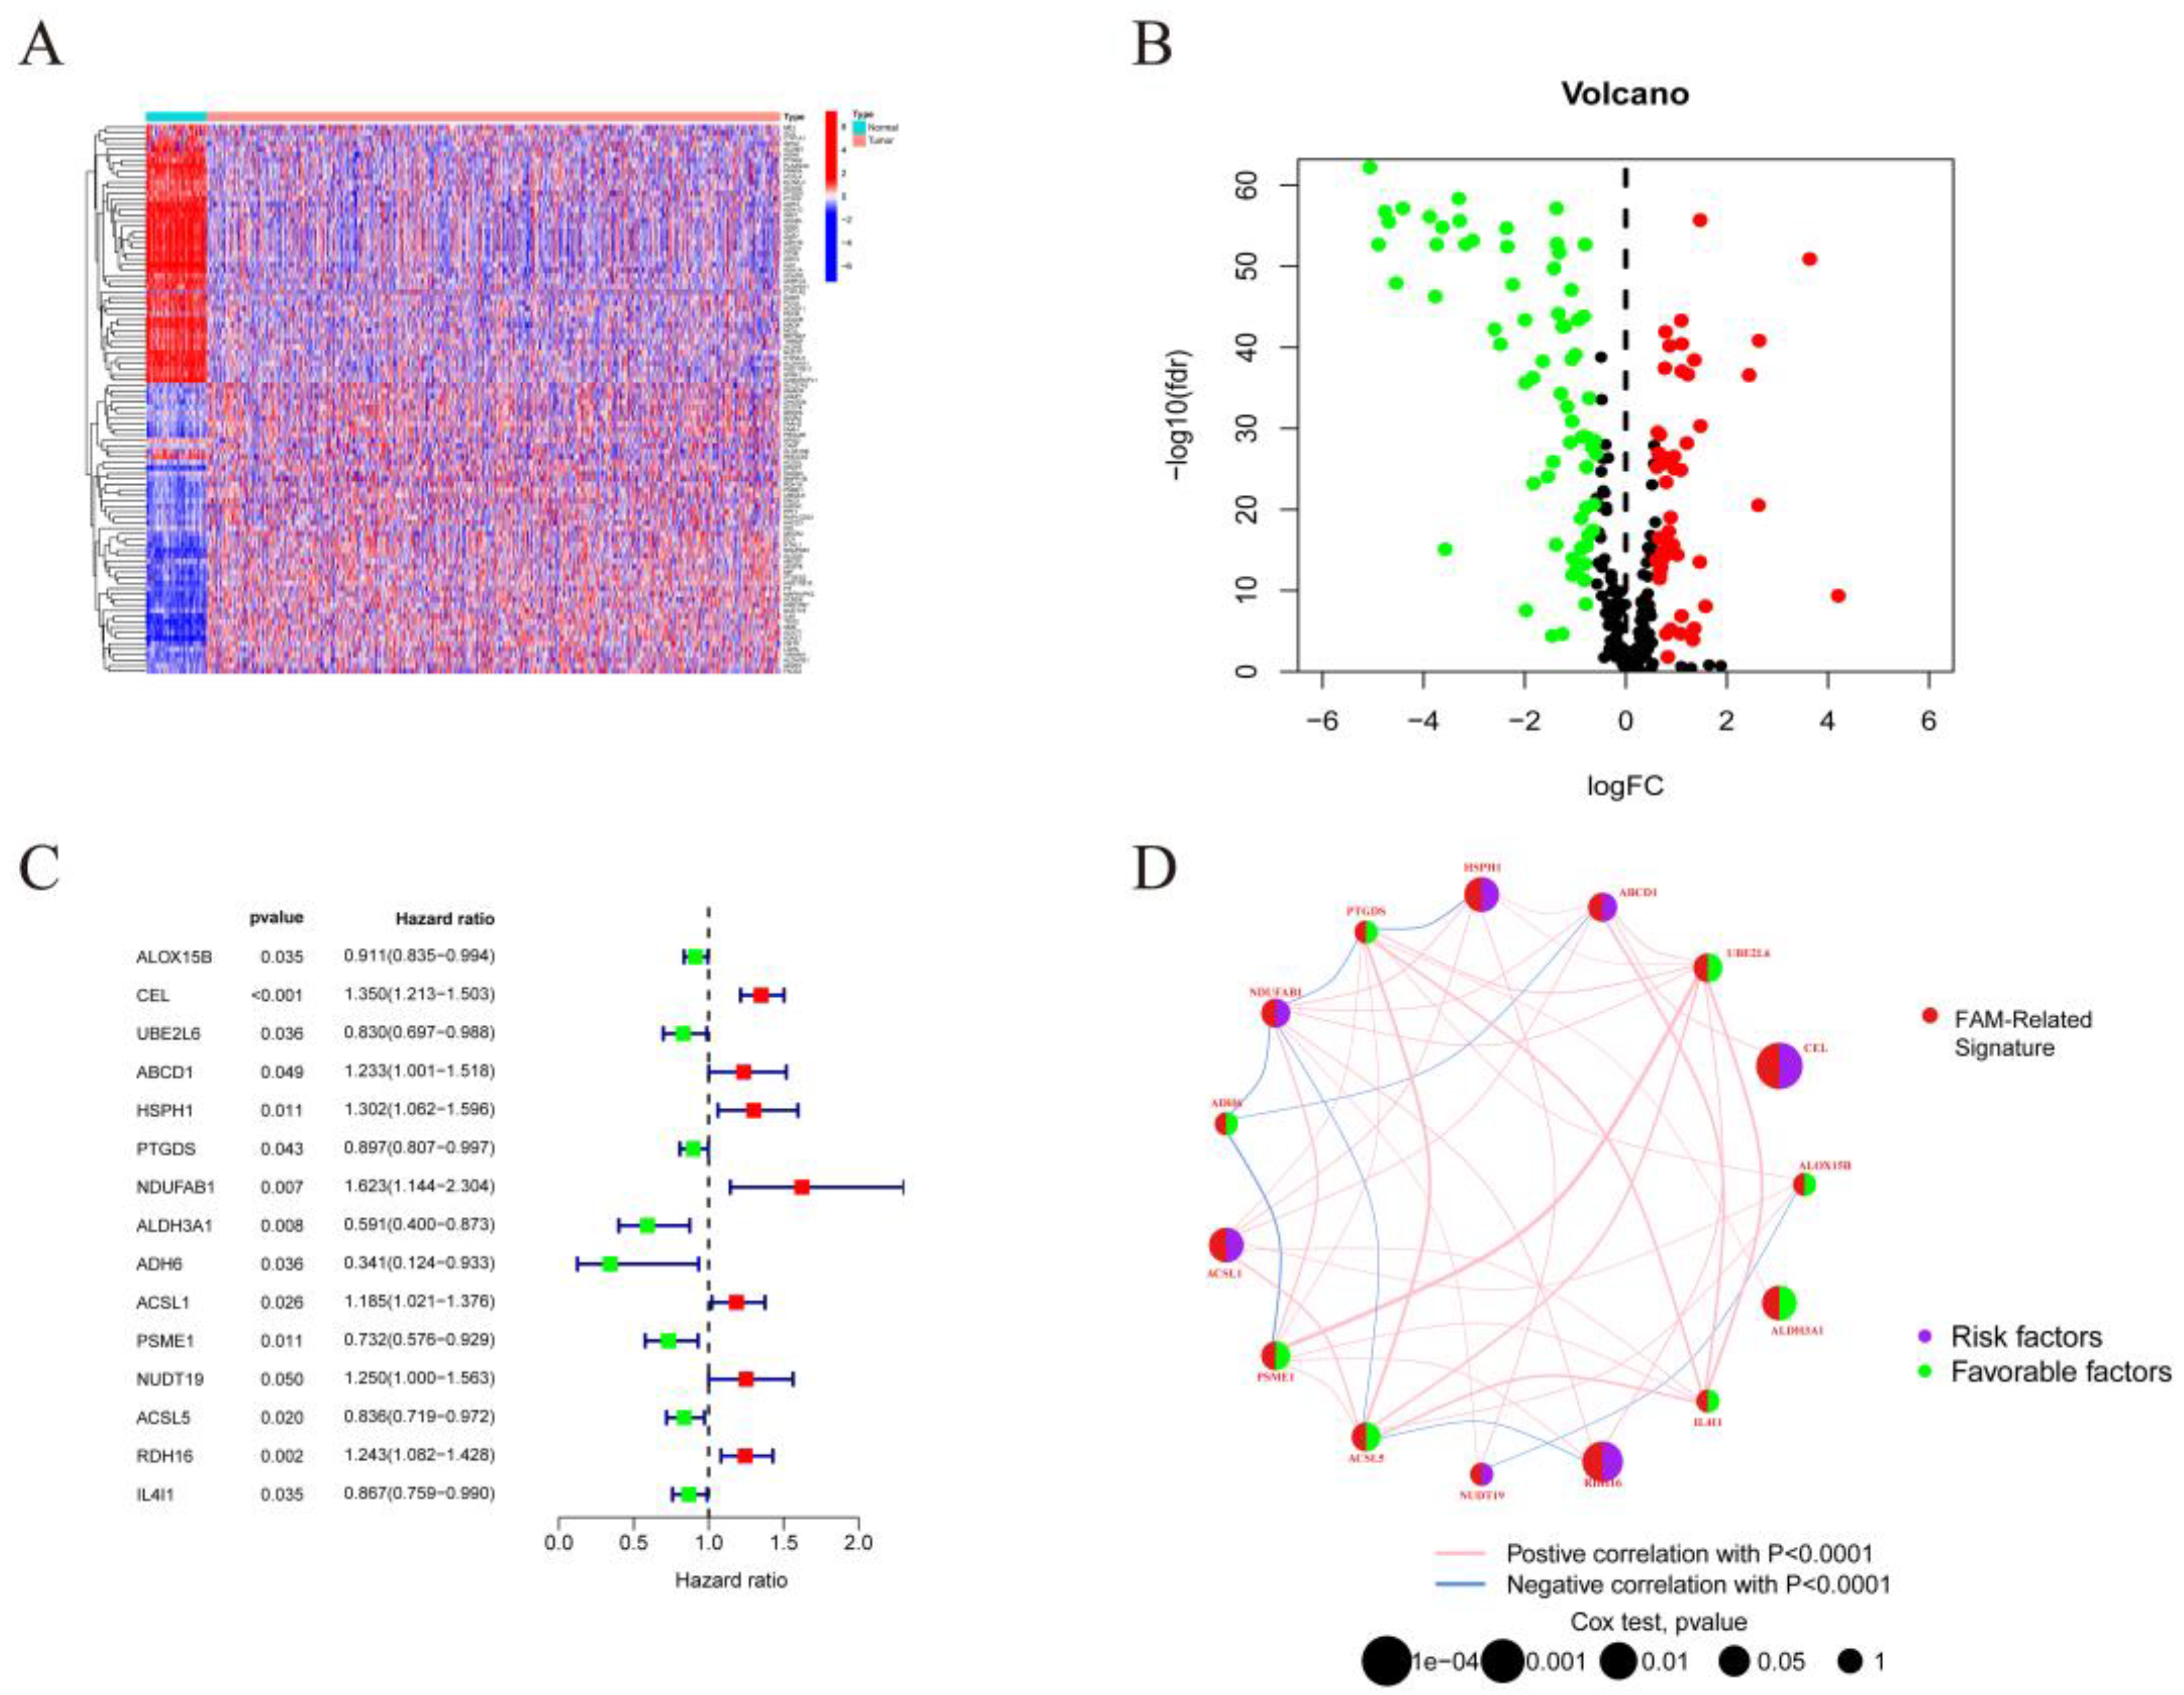
Figure 3.
| Mediation patterns of 15 fatty acid-related genes in BRCA. (A) Principal component analysis (PCA) analysis of the three FMGs-Cluster modification patterns. (B) Heat map of the clinical relevance of the three fatty acid subtypes. (C) Overall survival of the fatty acid modification patterns was determined using Kaplan-Meier curves. * p < 0.05, ** p < 0.01, *** p < 0.001; NS,non-significant. (D-F) GSVA enrichment analysis shows the activation status of biological pathways under different fatty acid modification patterns. Heat maps were used to visualize these biological processes, with red representing activated pathways and blue representing inhibited pathways. (G) The abundance of each TME infiltrating cell in the three FMGs-Cluster cells. (H) Three distinct FMGs modification patterns exhibit differences in stroma-activated pathways, including CELL_ADHESION, TGF beta, WNT, and NOTCH. The asterisks represented the statistical p-value (*P < 0.05; **P < 0.01; ***P < 0.001).
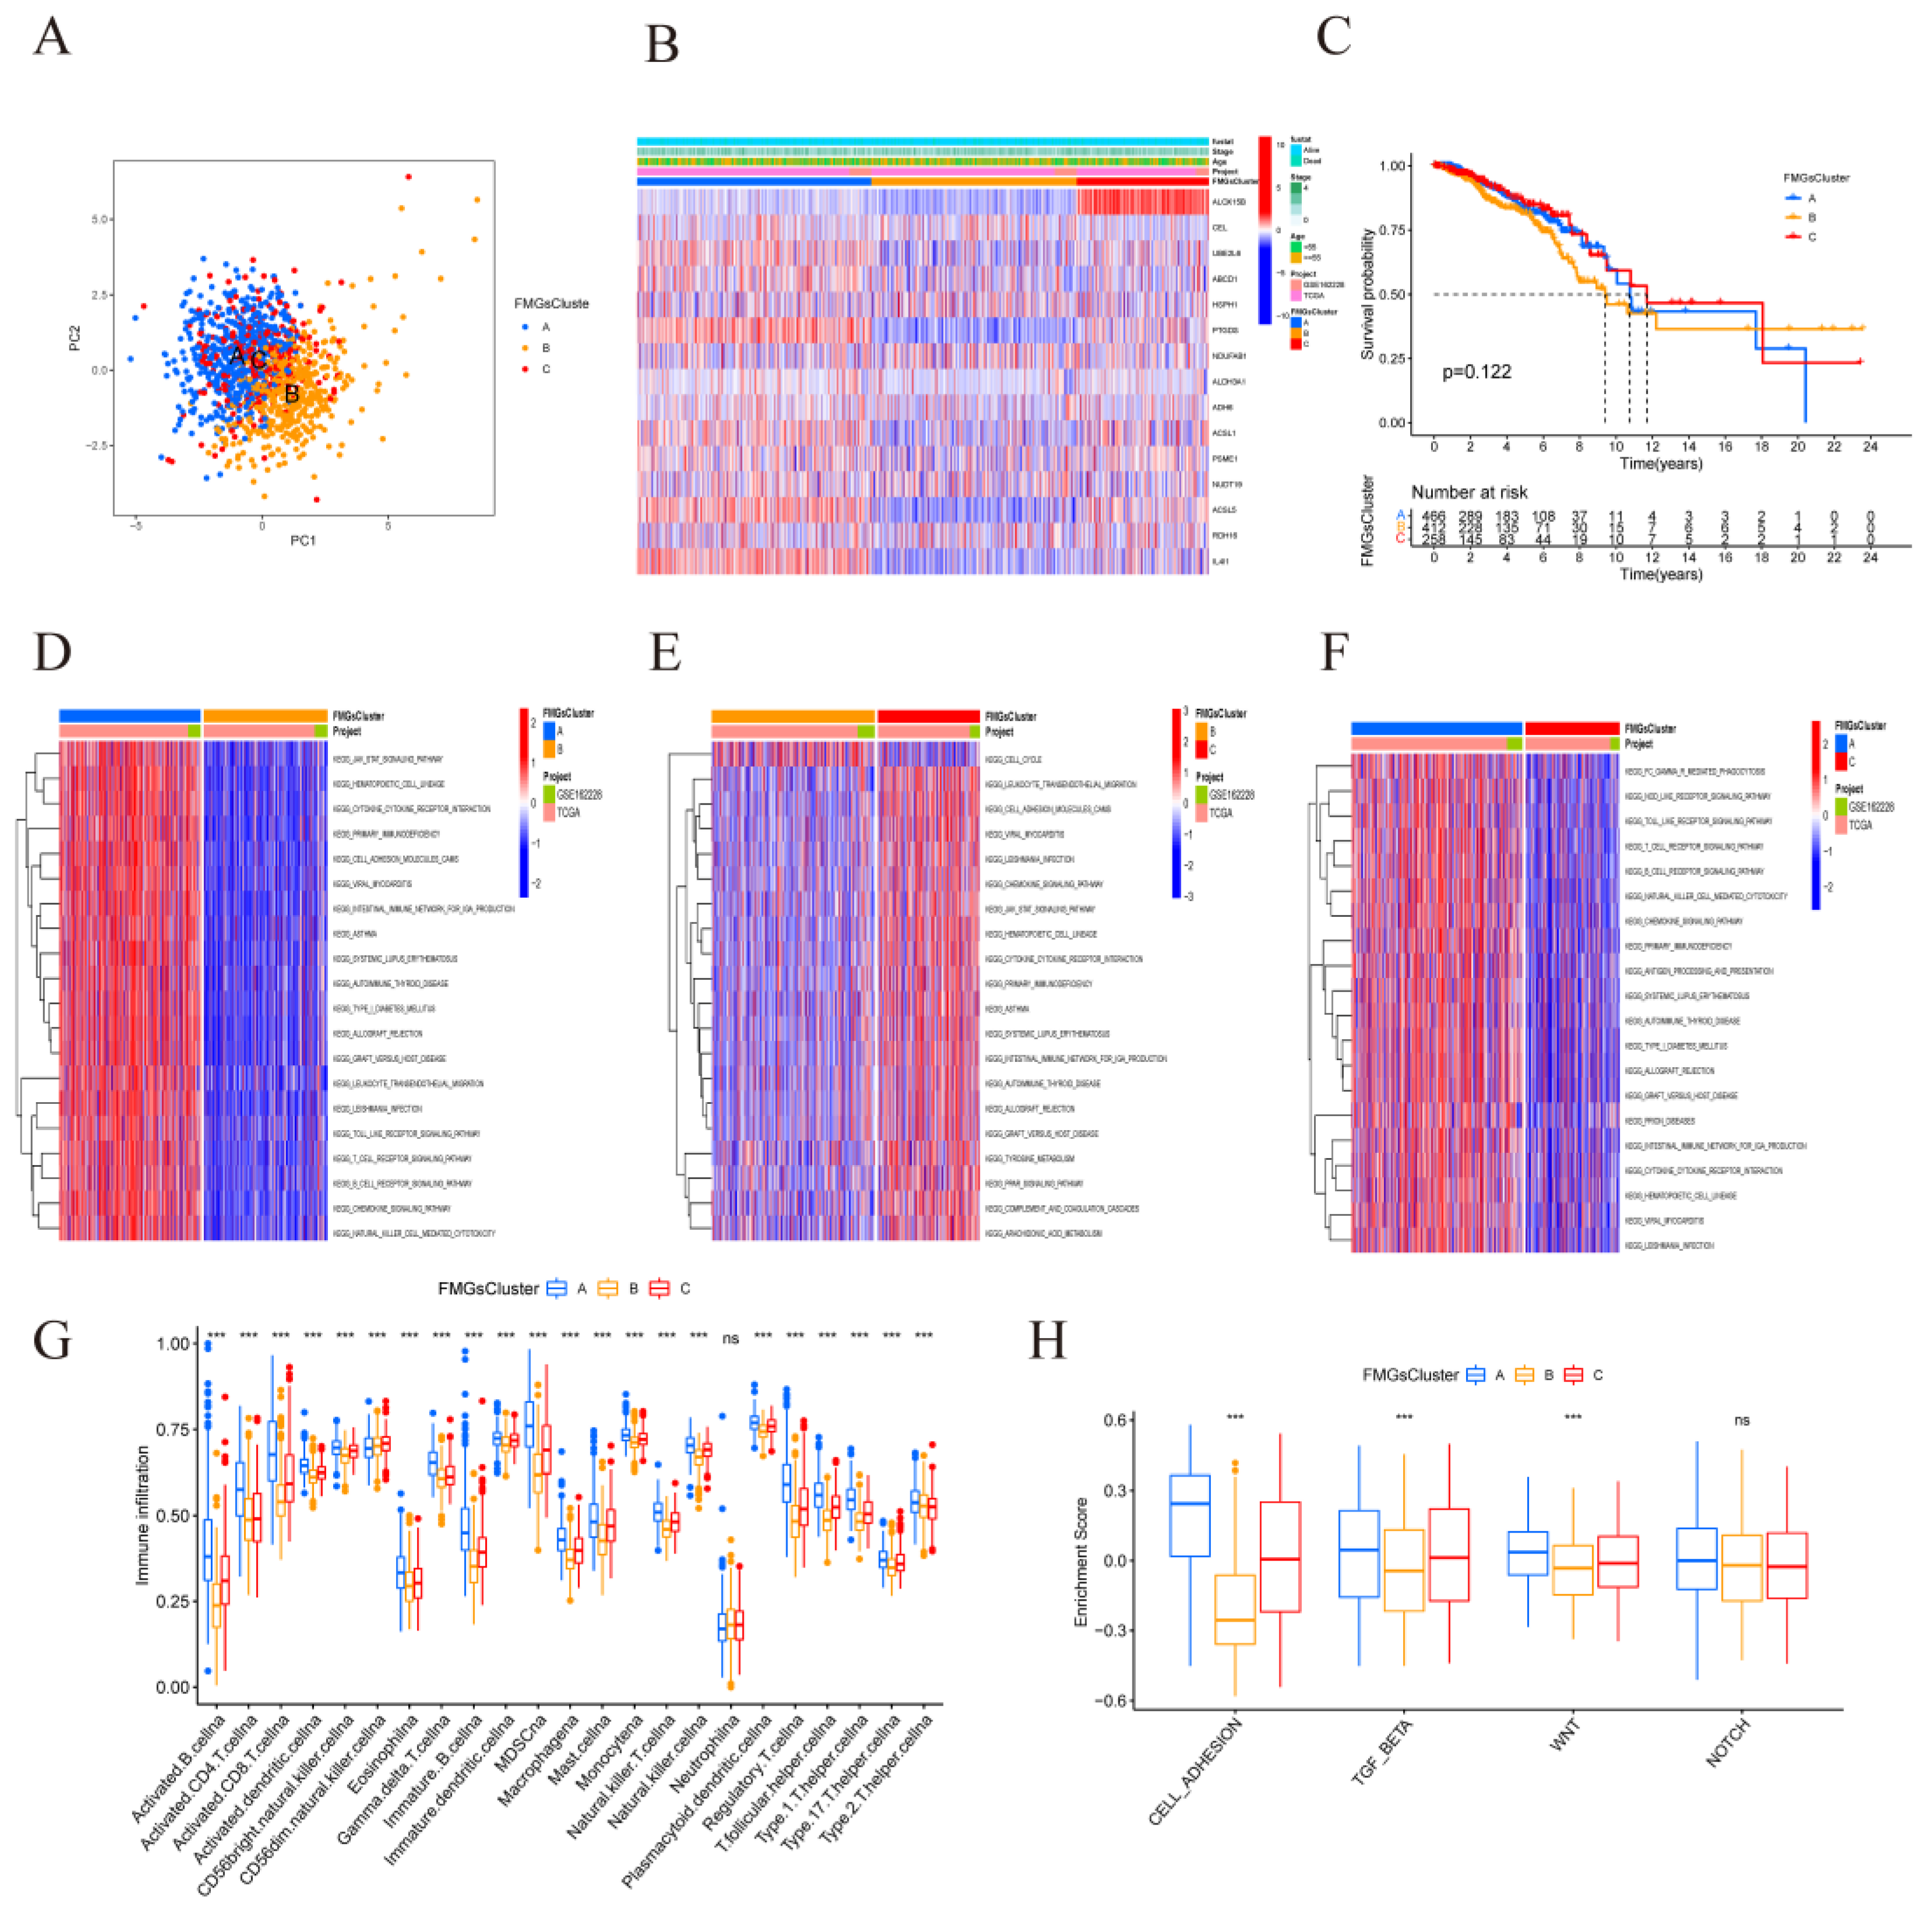
Figure 4.
| Construction of gene signatures based on differential genes of FMGsCluster. (A) Three FMGsCluster subtypes overlapping genes are demonstrated by the Venn diagram. (B-C) GO and KEGG enrichment analysis of 898 genes. (D) Kaplan-Meier curves were used to demonstrate the overall survival of the three geneClusters. KM curves showed that the FMGs genome was significantly associated with the difference in the overall survival of BRCA patients. (E) Clinical relevance of FMGsCluster and geneCluster plotted on a heat map. Annotation of BRCA patients was based on the gene clusters, FMG clusters, stage of the tumor, survival status, and age. (F) Three distinct FMGs modification patterns exhibit differences in stroma-activated pathways, including CELL_ADHESION, TGF beta, WNT, and NOTCH. The asterisks represented the statistical p-value (*P < 0.05; **P < 0.01; ***P < 0.001).
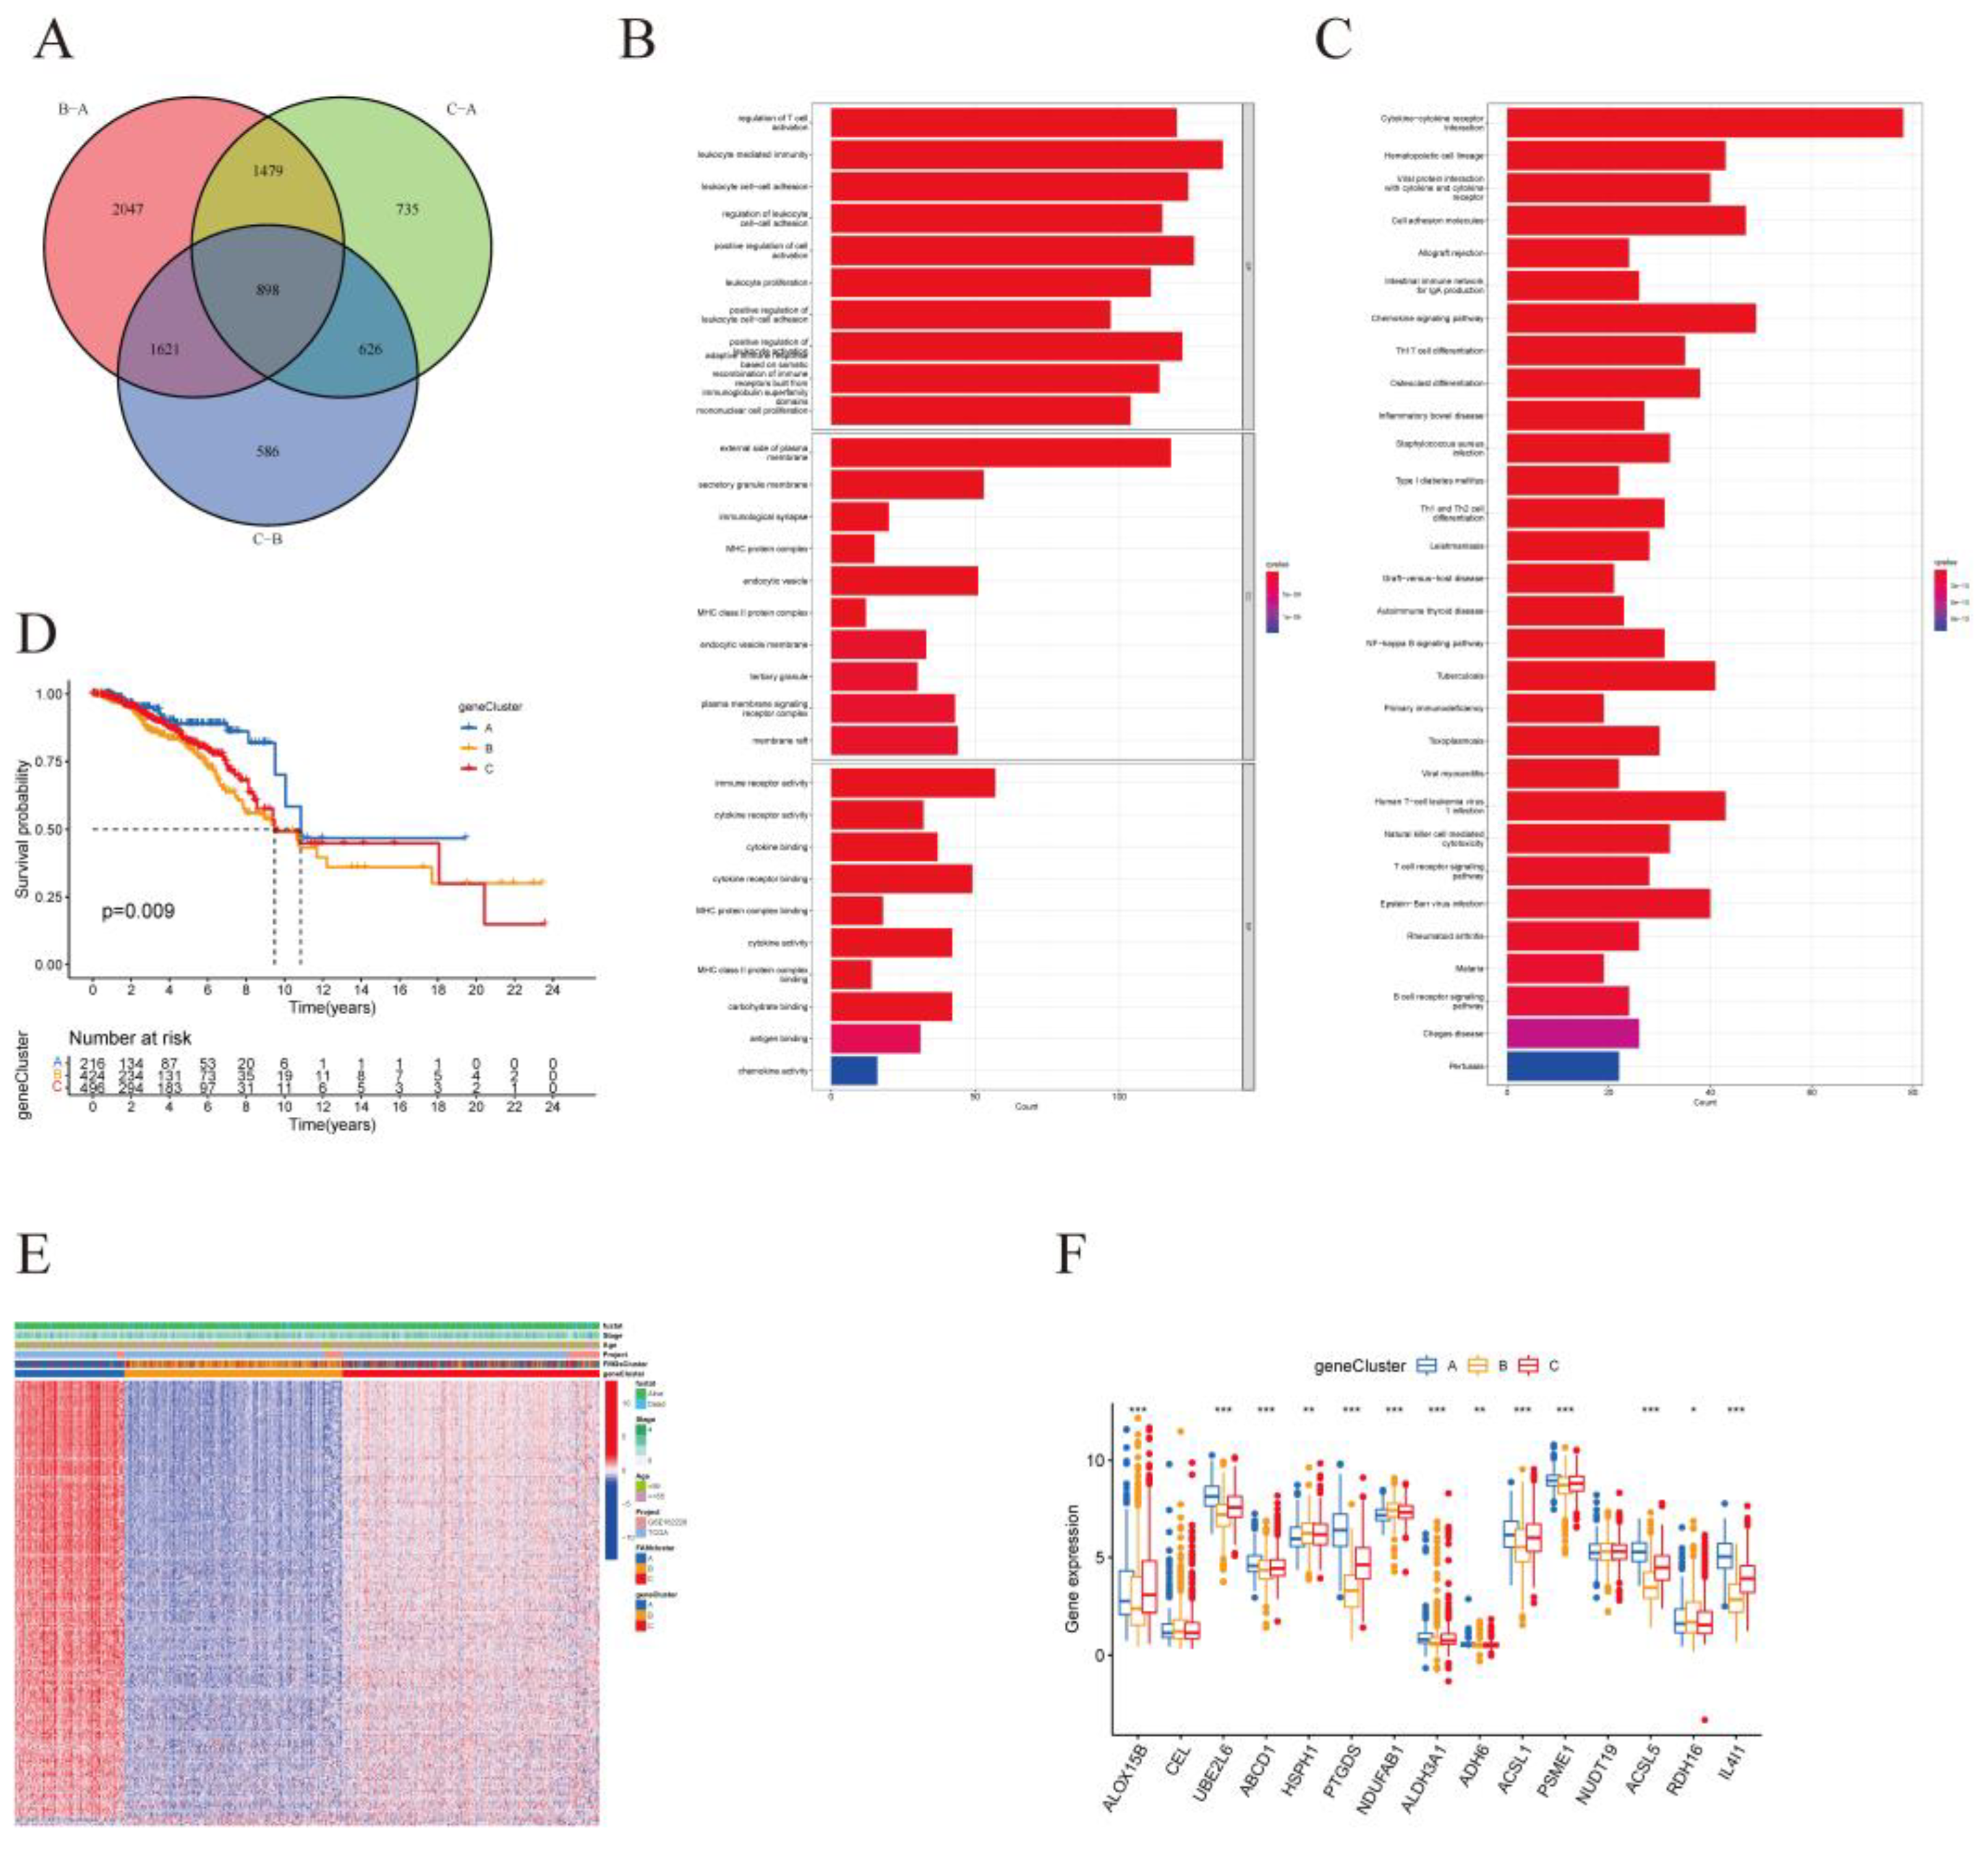
Figure 5.
Construction of FMGsSocre according to DMG. (A) K-M survival curves between groups with high and low FMGsScore scores. (B, C) Differences in FMGsScore between different FMGscluster and genecluster. (D) Correlation of FMGsScore with immune cell infiltration by Spearman correlation analysis. (E) Alluvial illustration indicating FMGscluster, genecluster, FMGsScore and fustat changes. *p<0.05 was considered statistically significant.
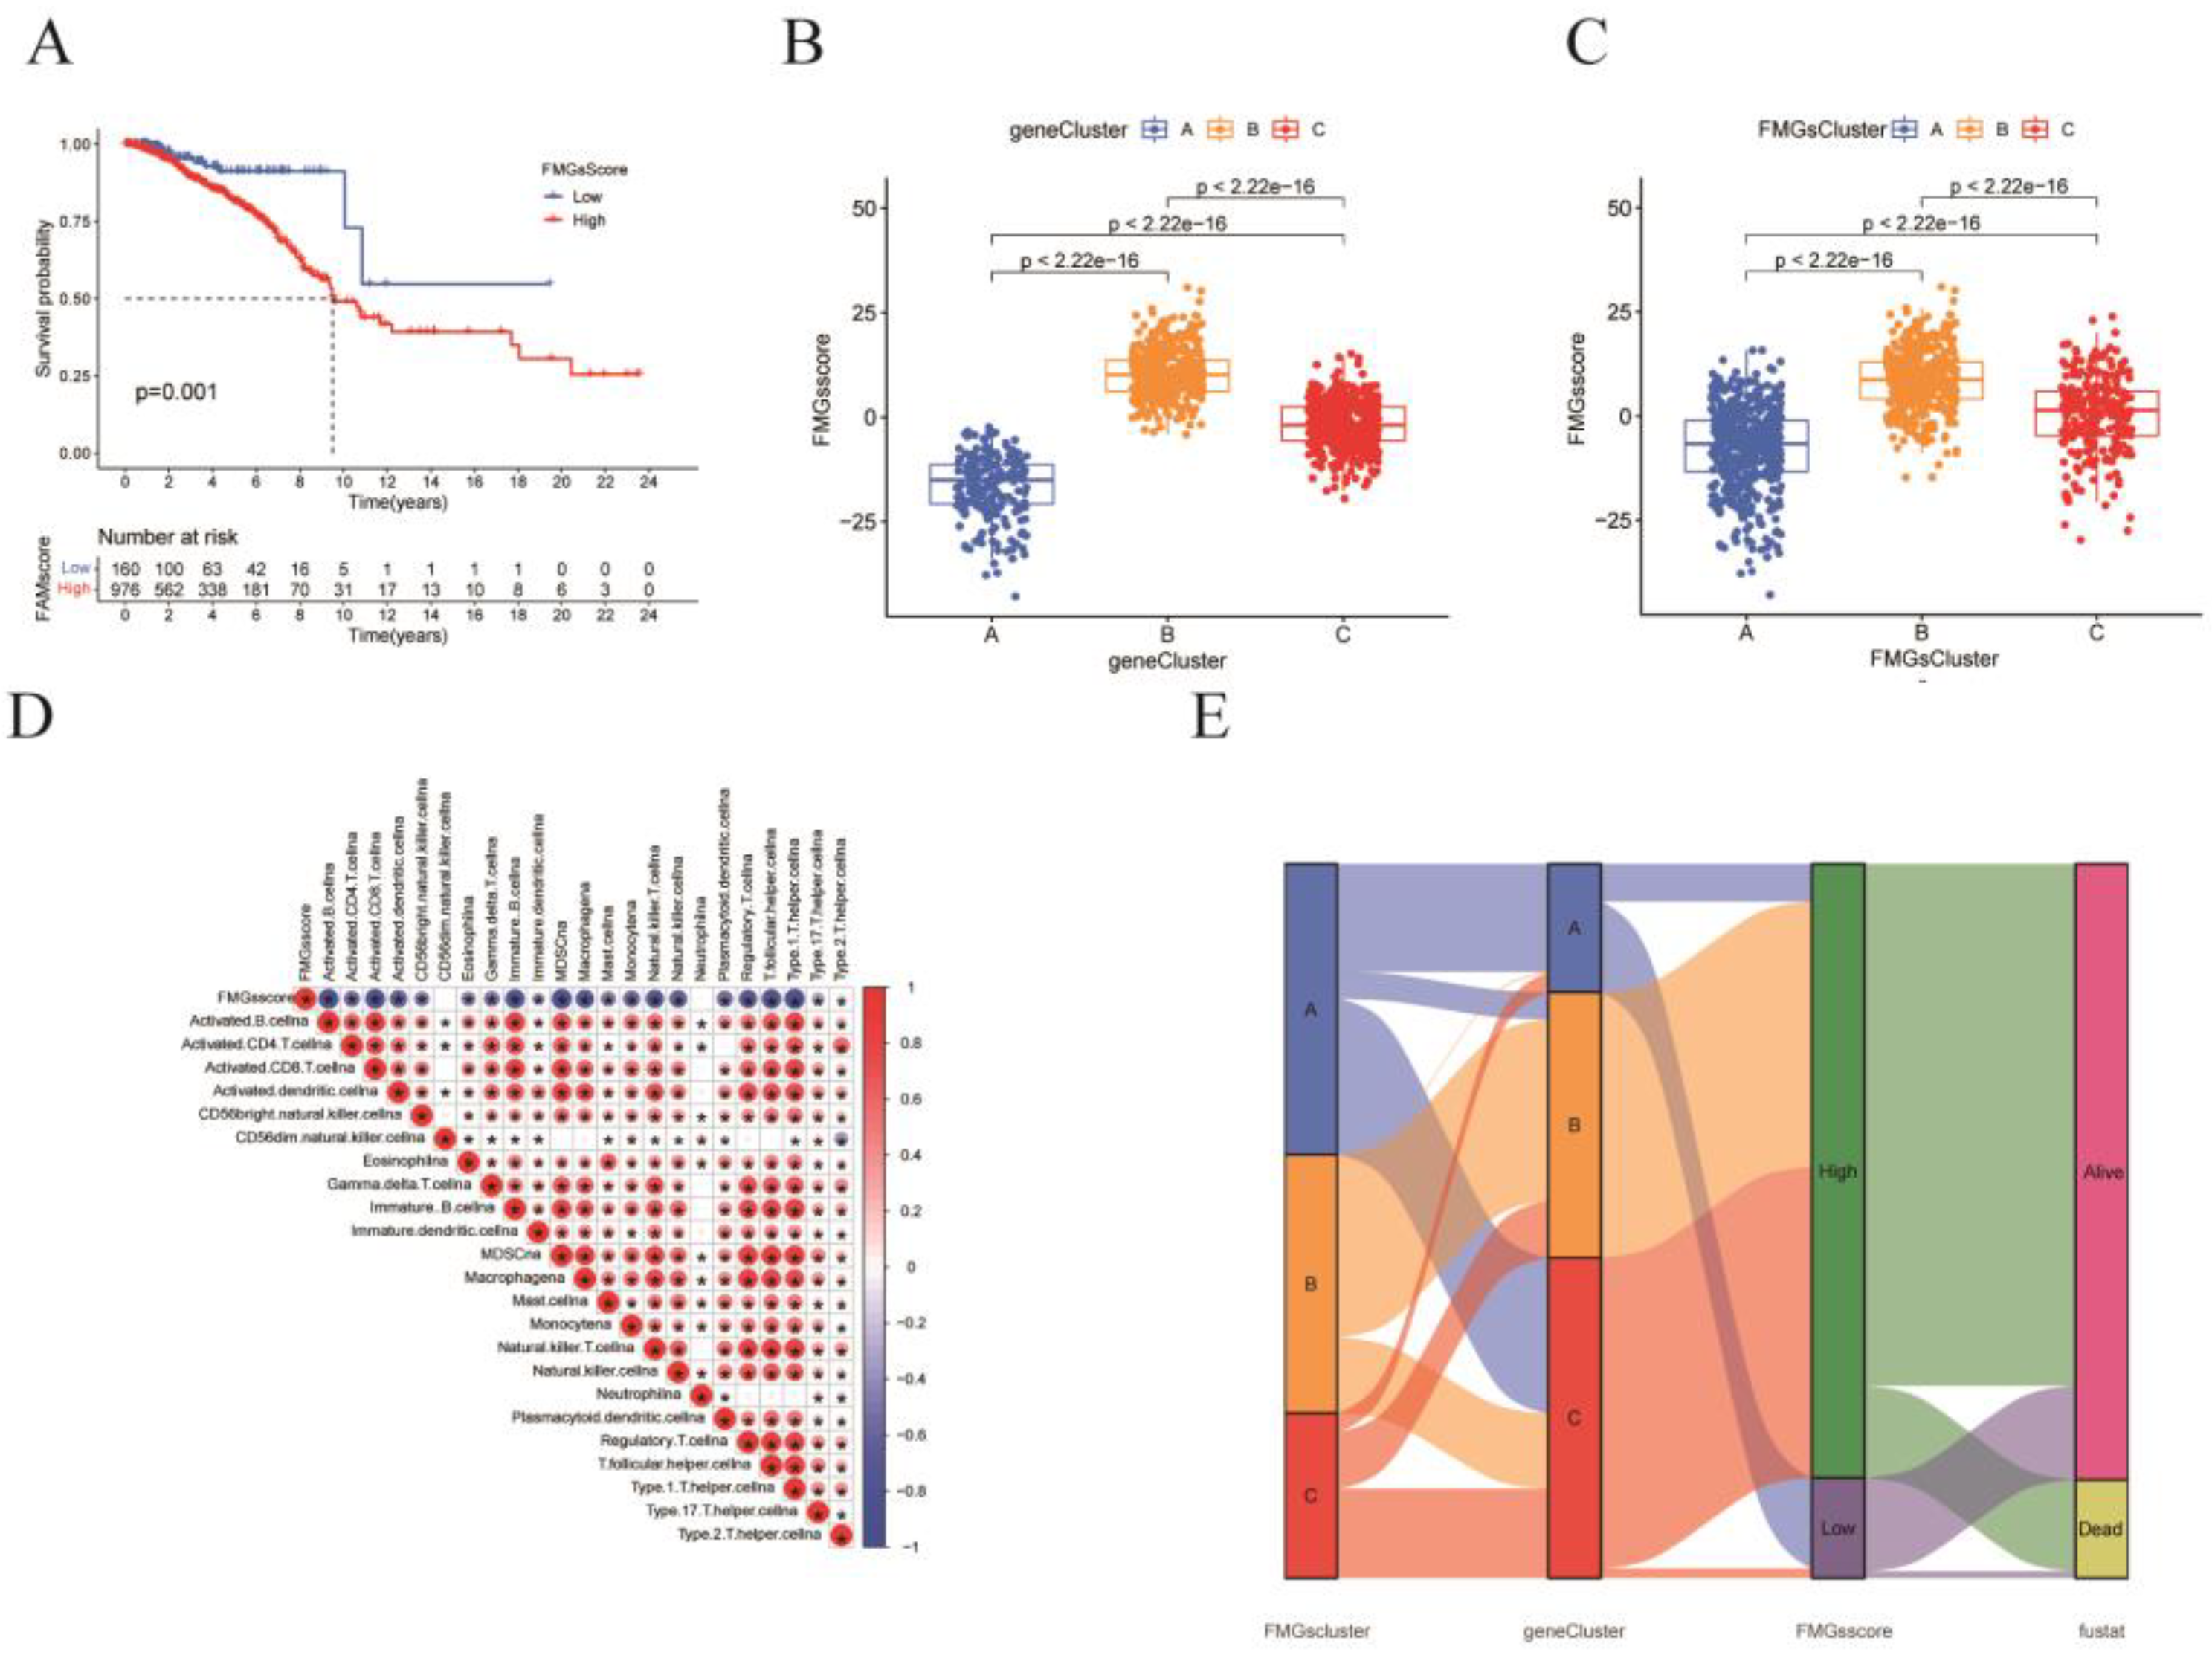
Figure 6.
| FMGsScore and clinical relevance in the TCGA-BRCA cohort. The ratio of fustat (A), age (B), stage (C), T (D), and N (E) between high and low FMGsScore patients. Patients are staged according to the TNM system (tumor-node-metastasis), with T representing the size of the tumor itself or the extent of invasion, and N representing invasion.
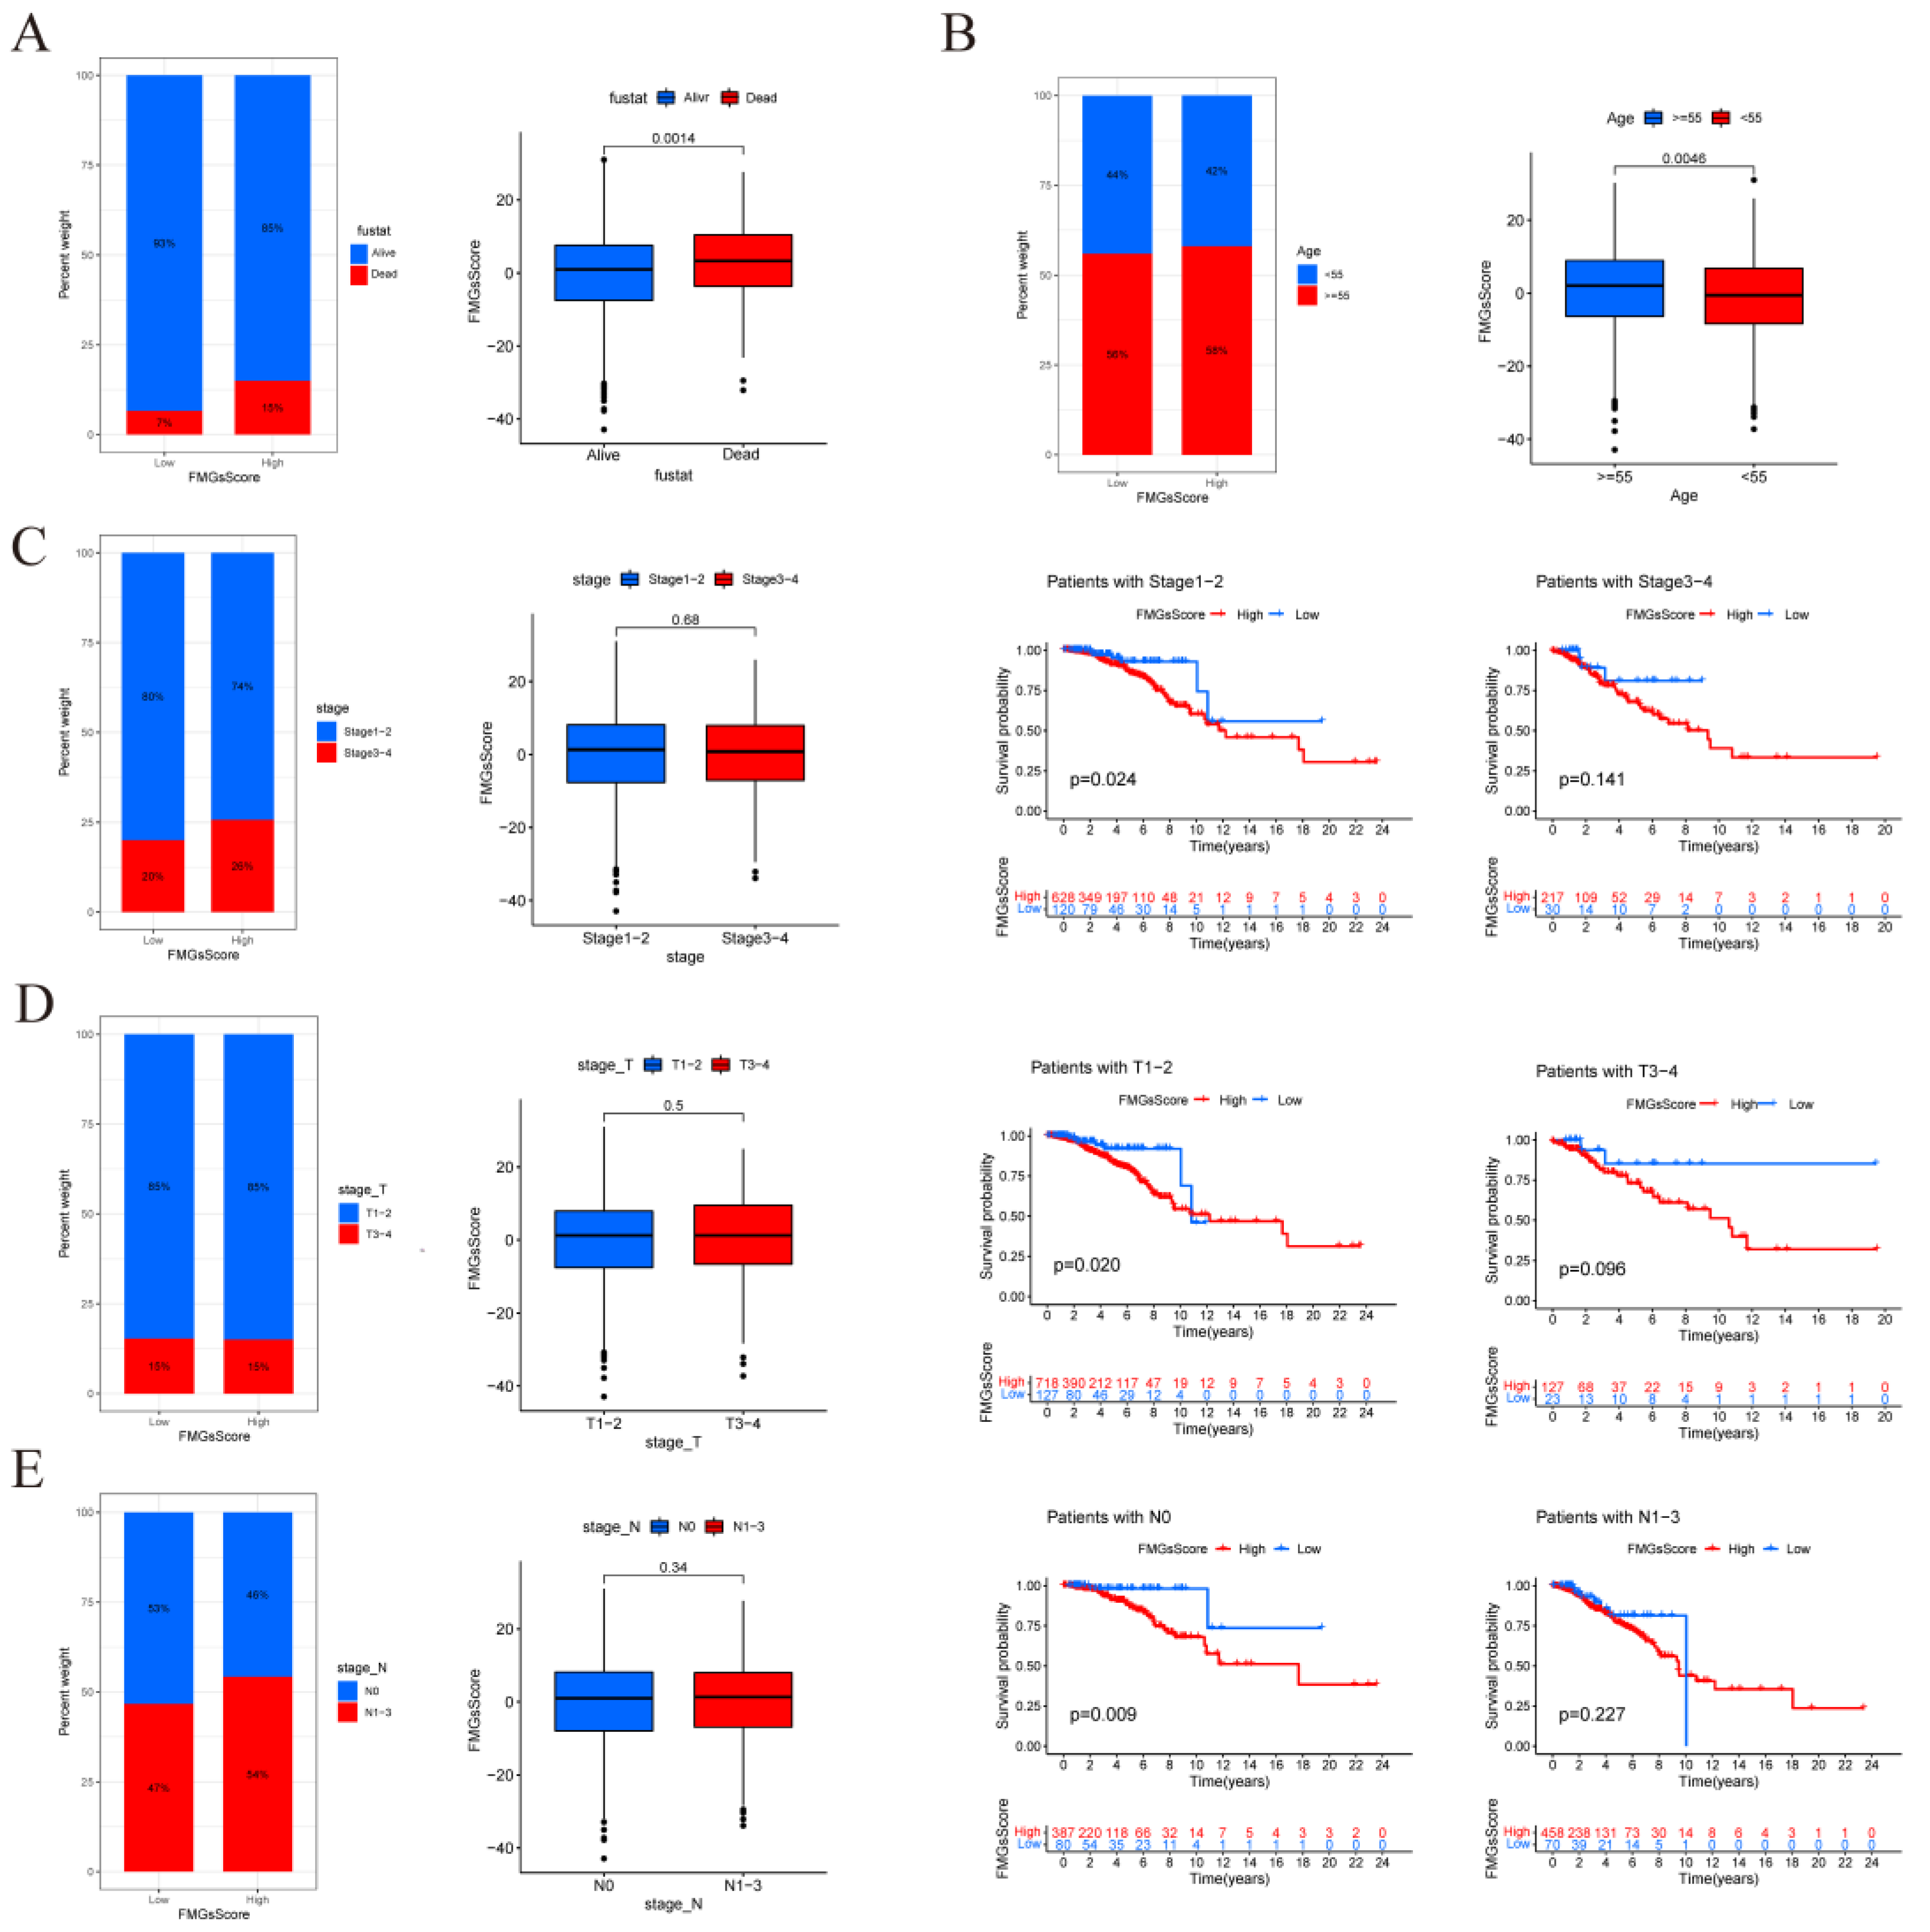
Figure 7.
| FMGsScore and clinical relevance in the TCGA-BRCA cohort. The ratio of fustat (A), age (B), stage (C), T (D), and N (E) between high and low FMGsScore patients. Patients are staged according to the TNM system (tumor-node-metastasis), with T representing the size of the tumor itself or the extent of invasion, and N representing invasion. (F)The overall survival of patients was stratified by both PyroptosisScore and TMB using Kaplan–Meier curves.
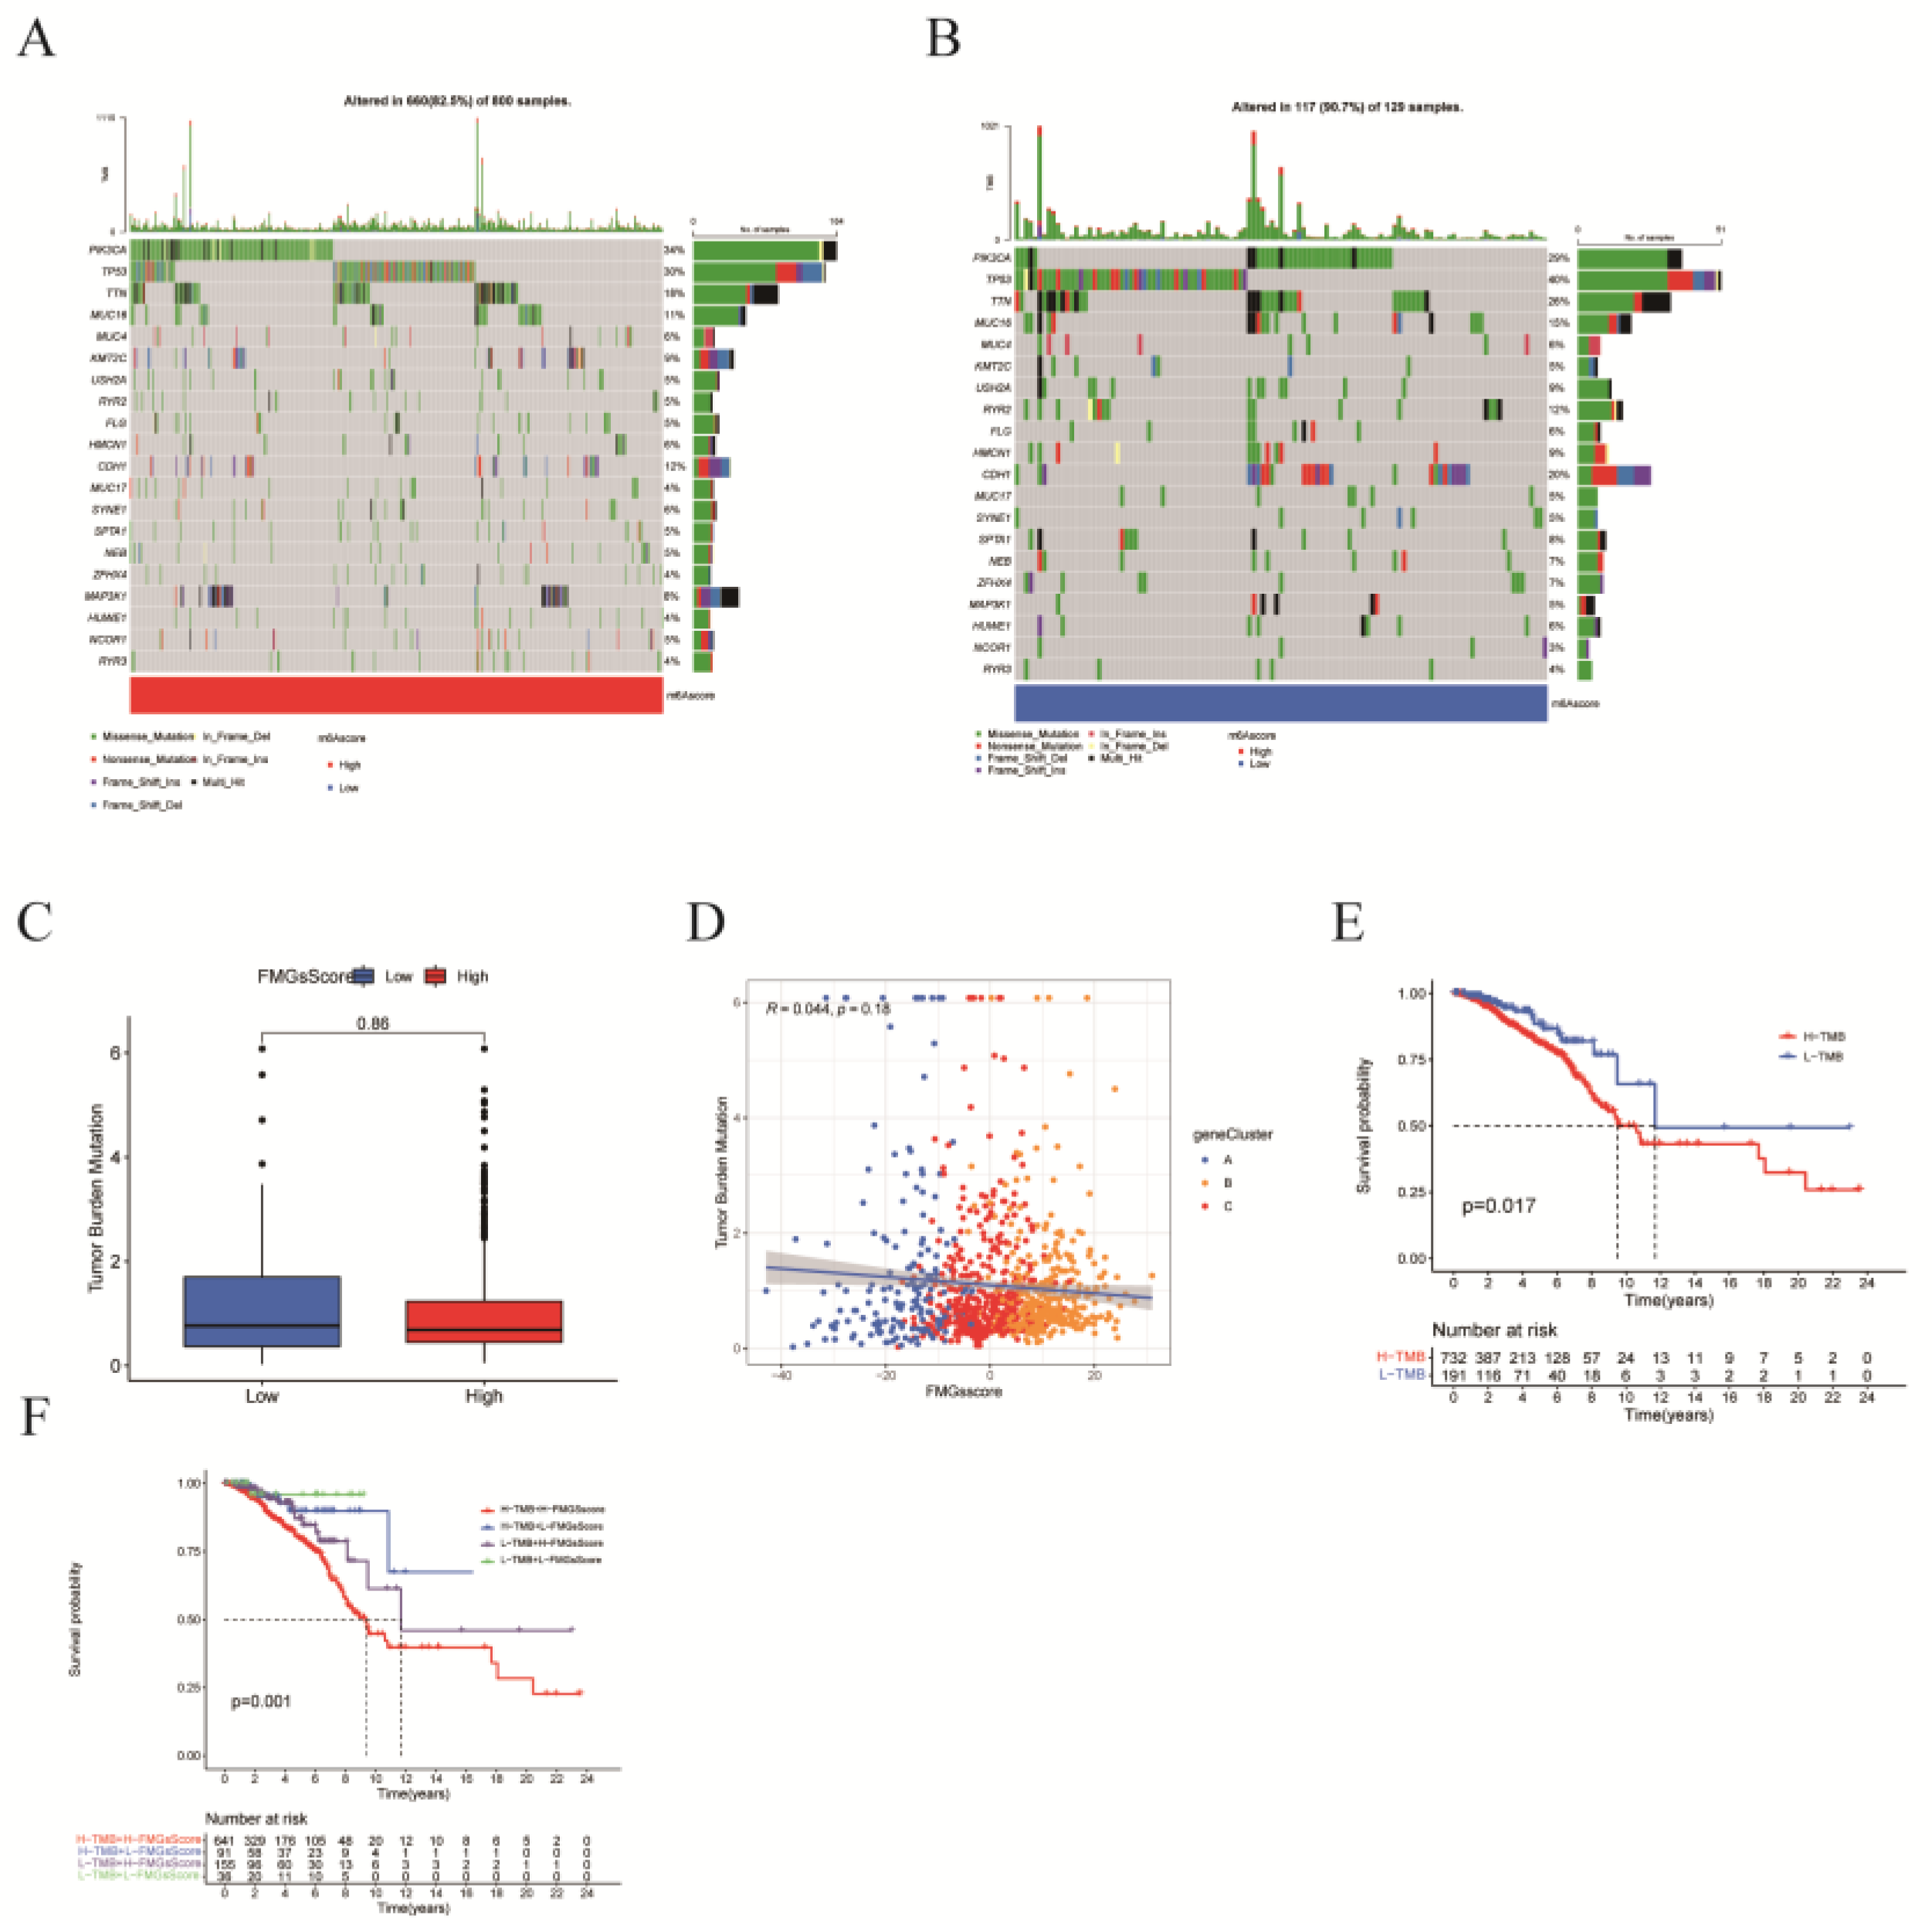
Figure 8.
| Effect of FMGsScore in immunotherapy. (A) Differences in immune checkpoint gene expression between high and low FMGsScore groups. (B)Immunotherapy response between high and low FMGsScore subgroups. (C) Differences in immune infiltrating cells in the high and low subgroups of FMGsScore. (D) GSVA enrichment analysis between high and low FMGsScore subgroups (*P < 0.05, **P < 0.01, ***P < 0.001. ns means the difference was not statistically significant).
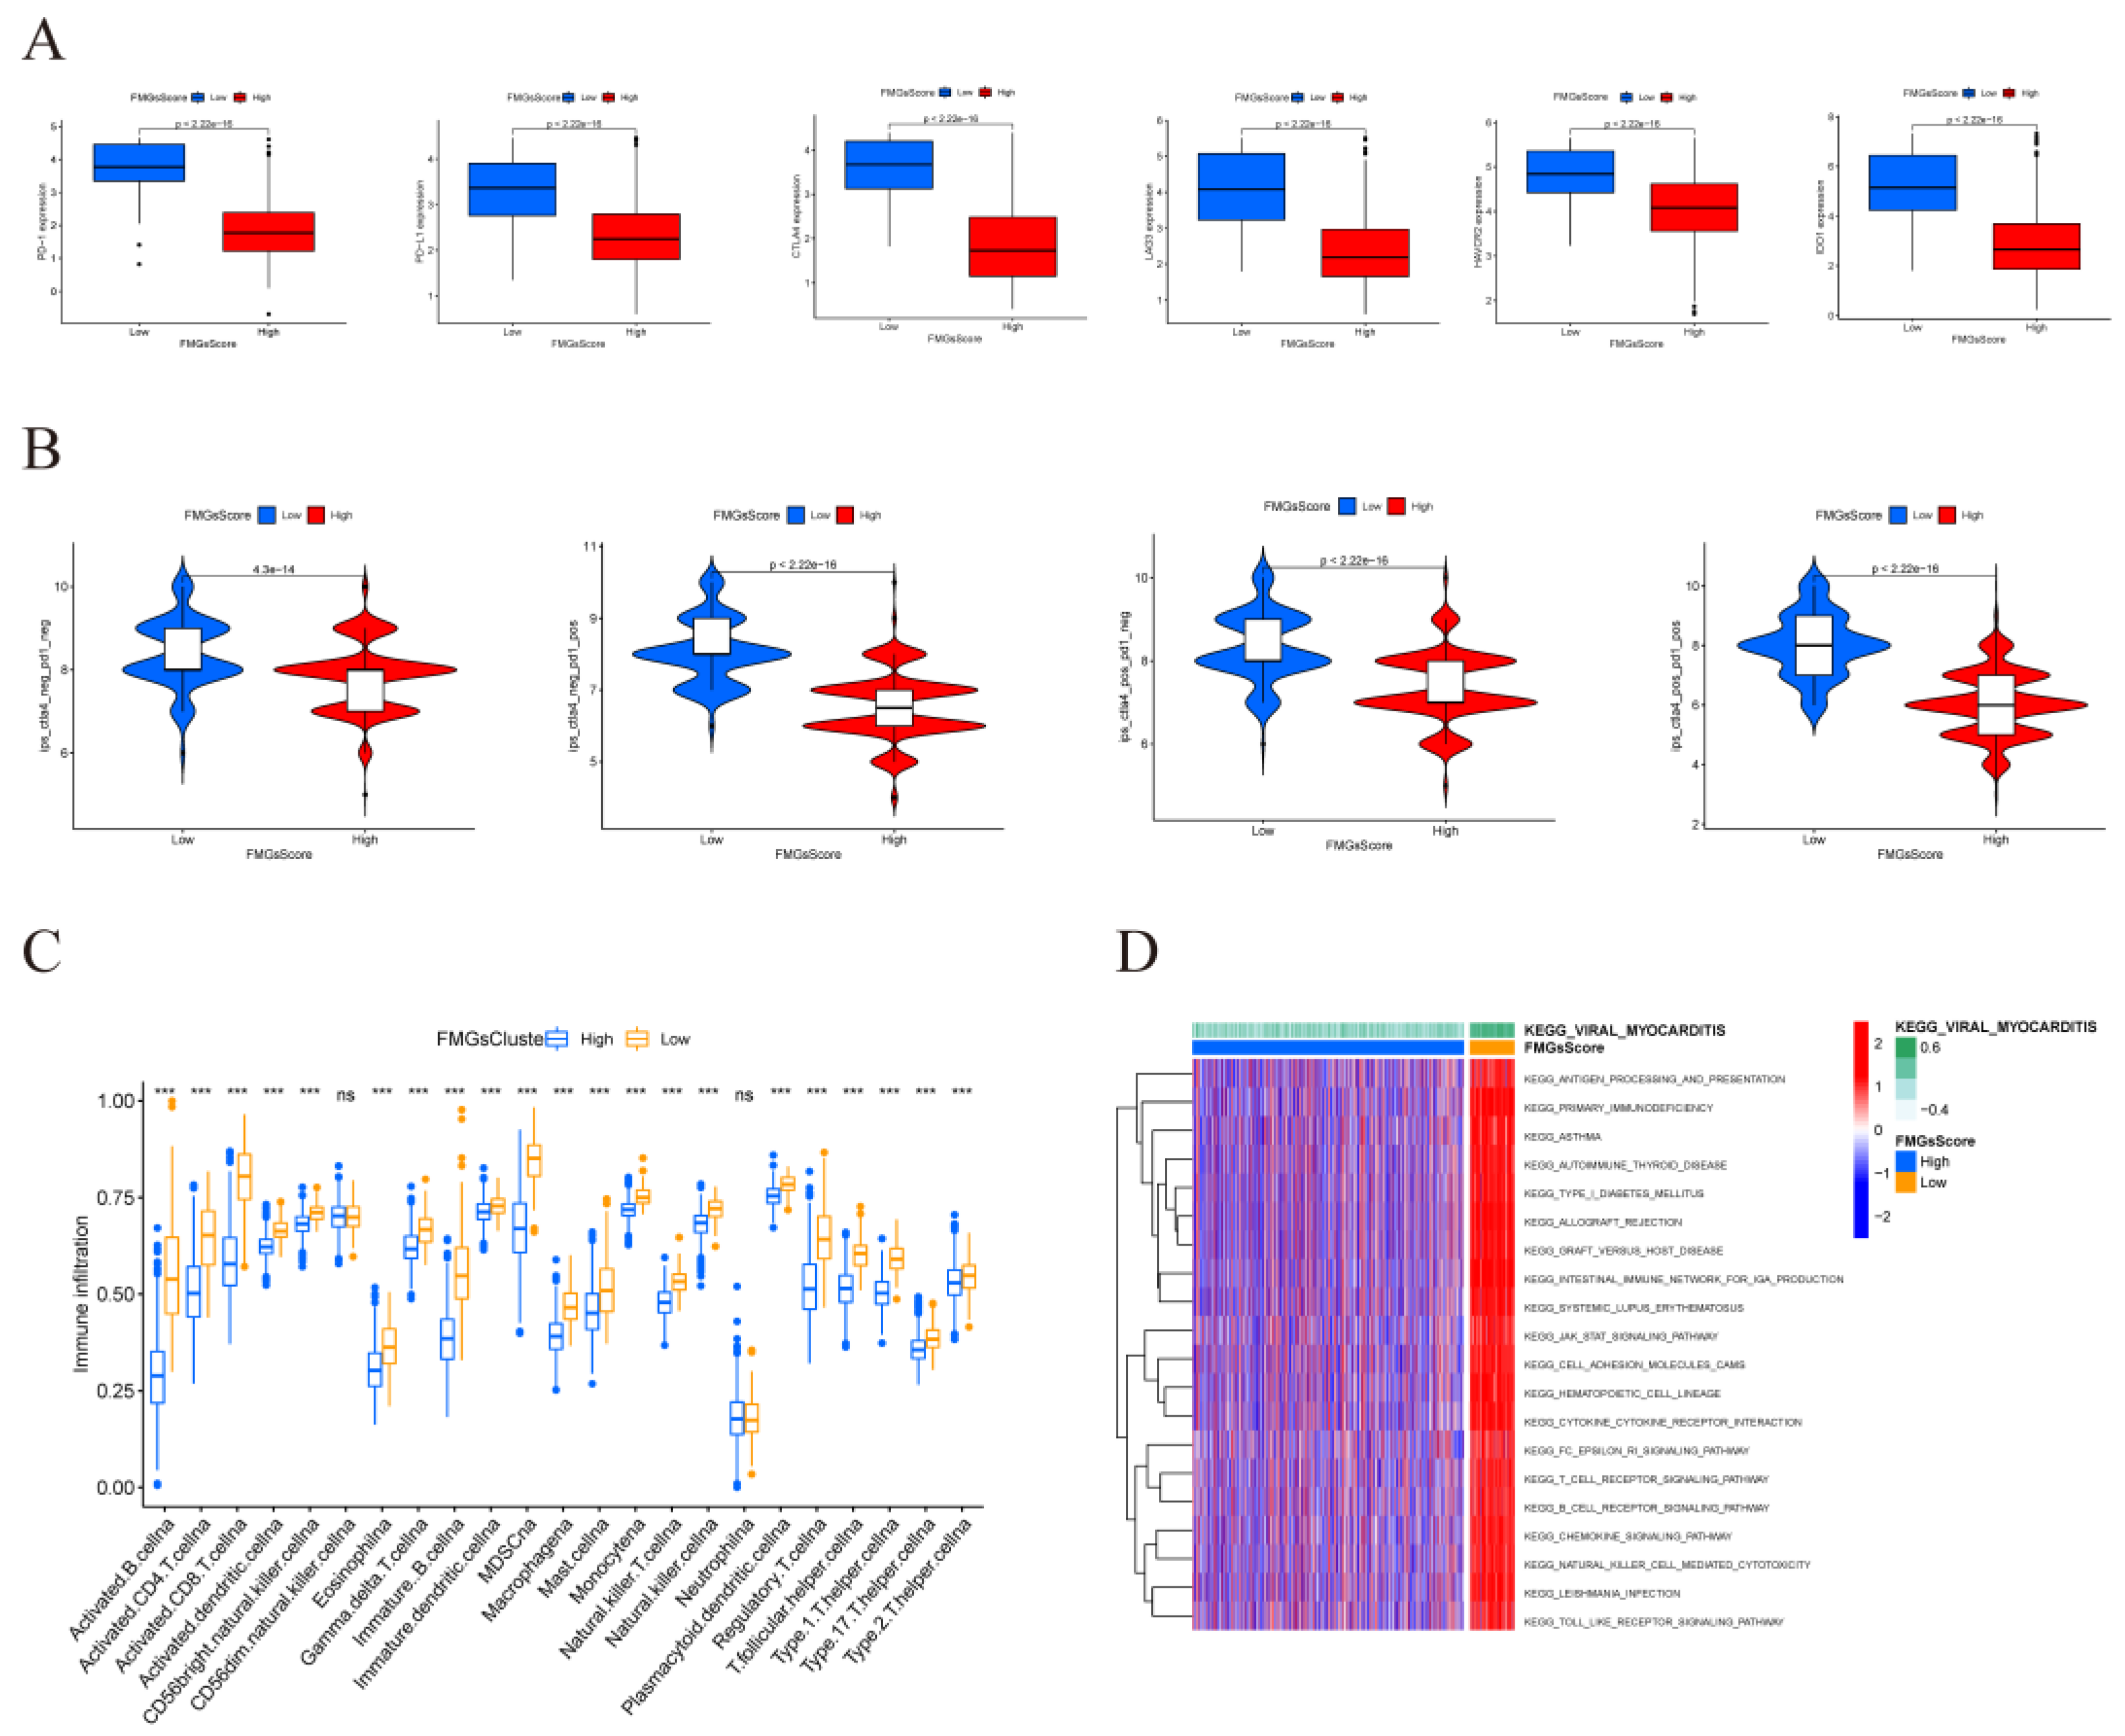
Figure 9.
| Atlas of single-cell sequencing in 6 breast cancer patients. (A) t-SNE plot showing cell subtypes in breast cancer samples. (B) Gene heat map annotated with single-cell sequencing data. (C) Stacked plots showing the cellular composition between each sample. (D) The 15 fatty acid metabolism gene scores for the 8 major cell types are represented by t-SNE plots. (E) Differences in fatty acid metabolism gene scores between the six samples are shown in violin plots (*P < 0.05, **P < 0.01, ***P < 0.001. ns means the difference was not statistically significant). (F) Differences in the scoring of fatty acid metabolism genes among 8 cell types.
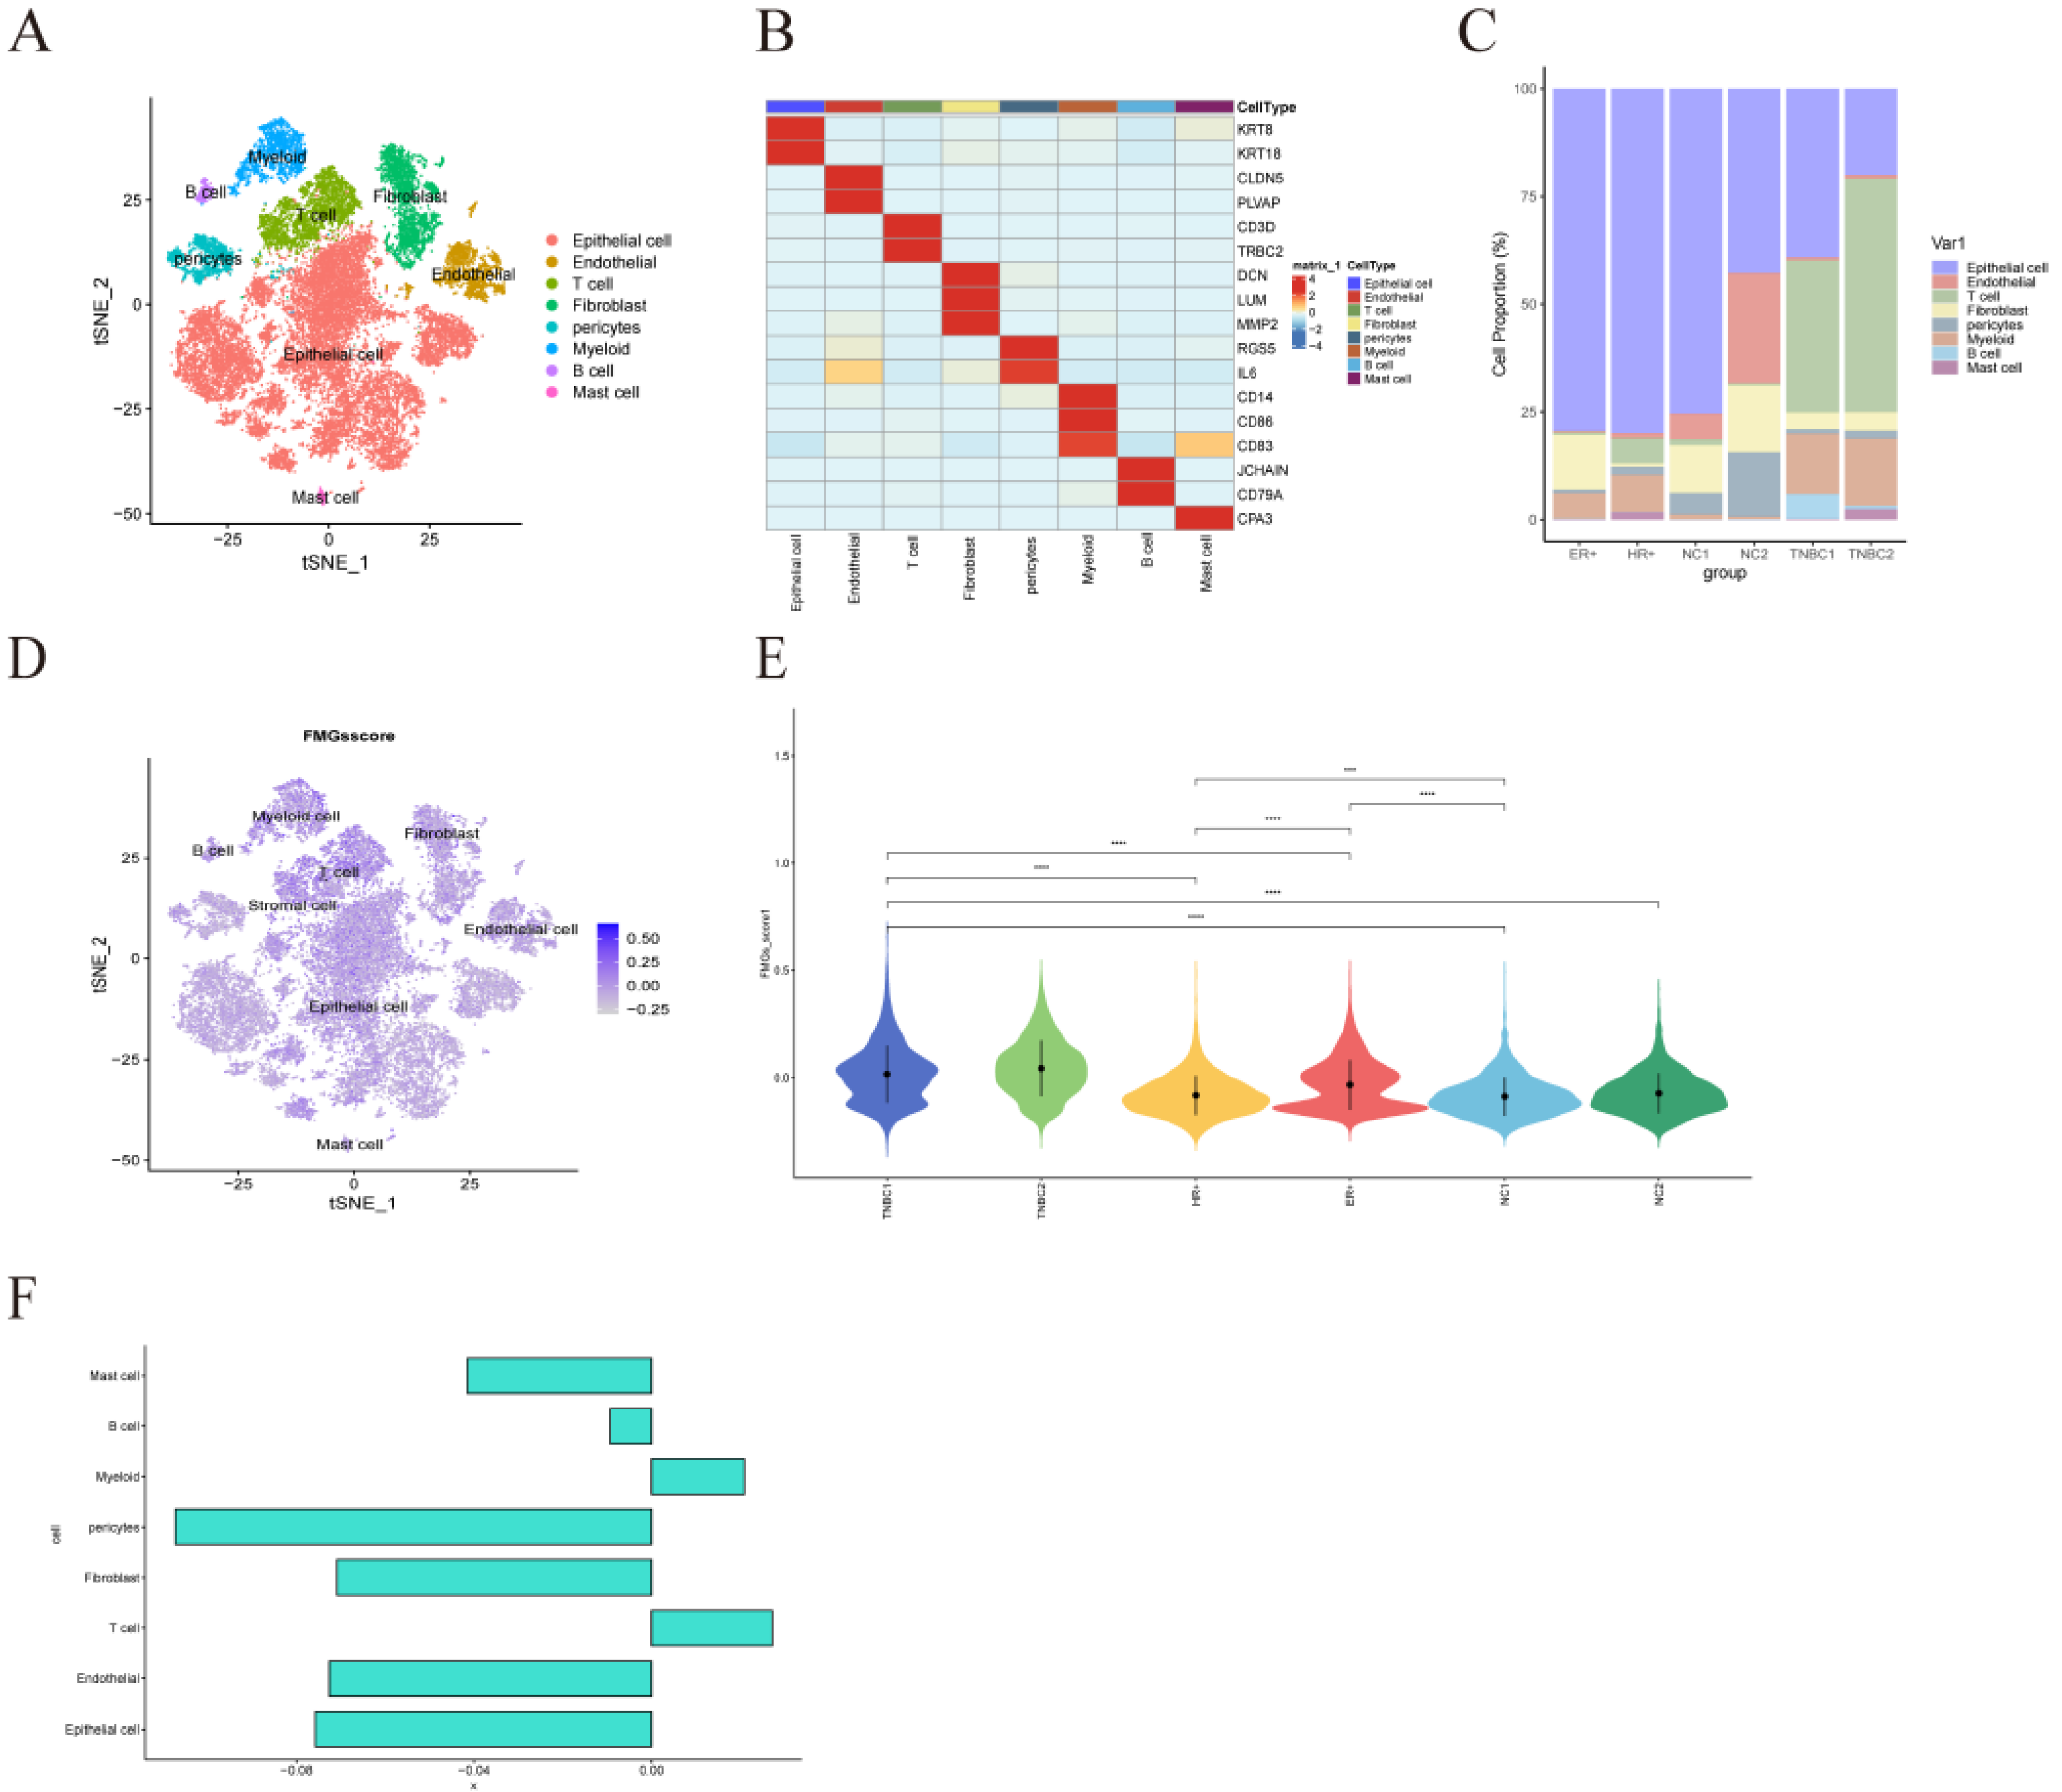
Figure 10.
| Differences in intercellular interactions between high and low scoring groups. (A) Cell interactions network diagram for Highscore grouping of cell communication numbers. (B) Cell interactions network diagram for Lowscore grouping of cell communication numbers. (C) Comparison of the number and strength of interactions between Highscore and Lowscore. (D) The number and strength of interactions of cells in the Lowscore group compared to the Howscore group. Red means stronger, blue means weaker (E) Differences in cellular communication pathways between the Lowscore and Highscore groups. (F) Comparison of important ligand-receptor pairs for T-cell signaling to epithelial and myeloid cells. The color of the dots reflects the communication probability, and the size of the dots indicates the calculated p-value. An empty space indicates a zero. communication probability.
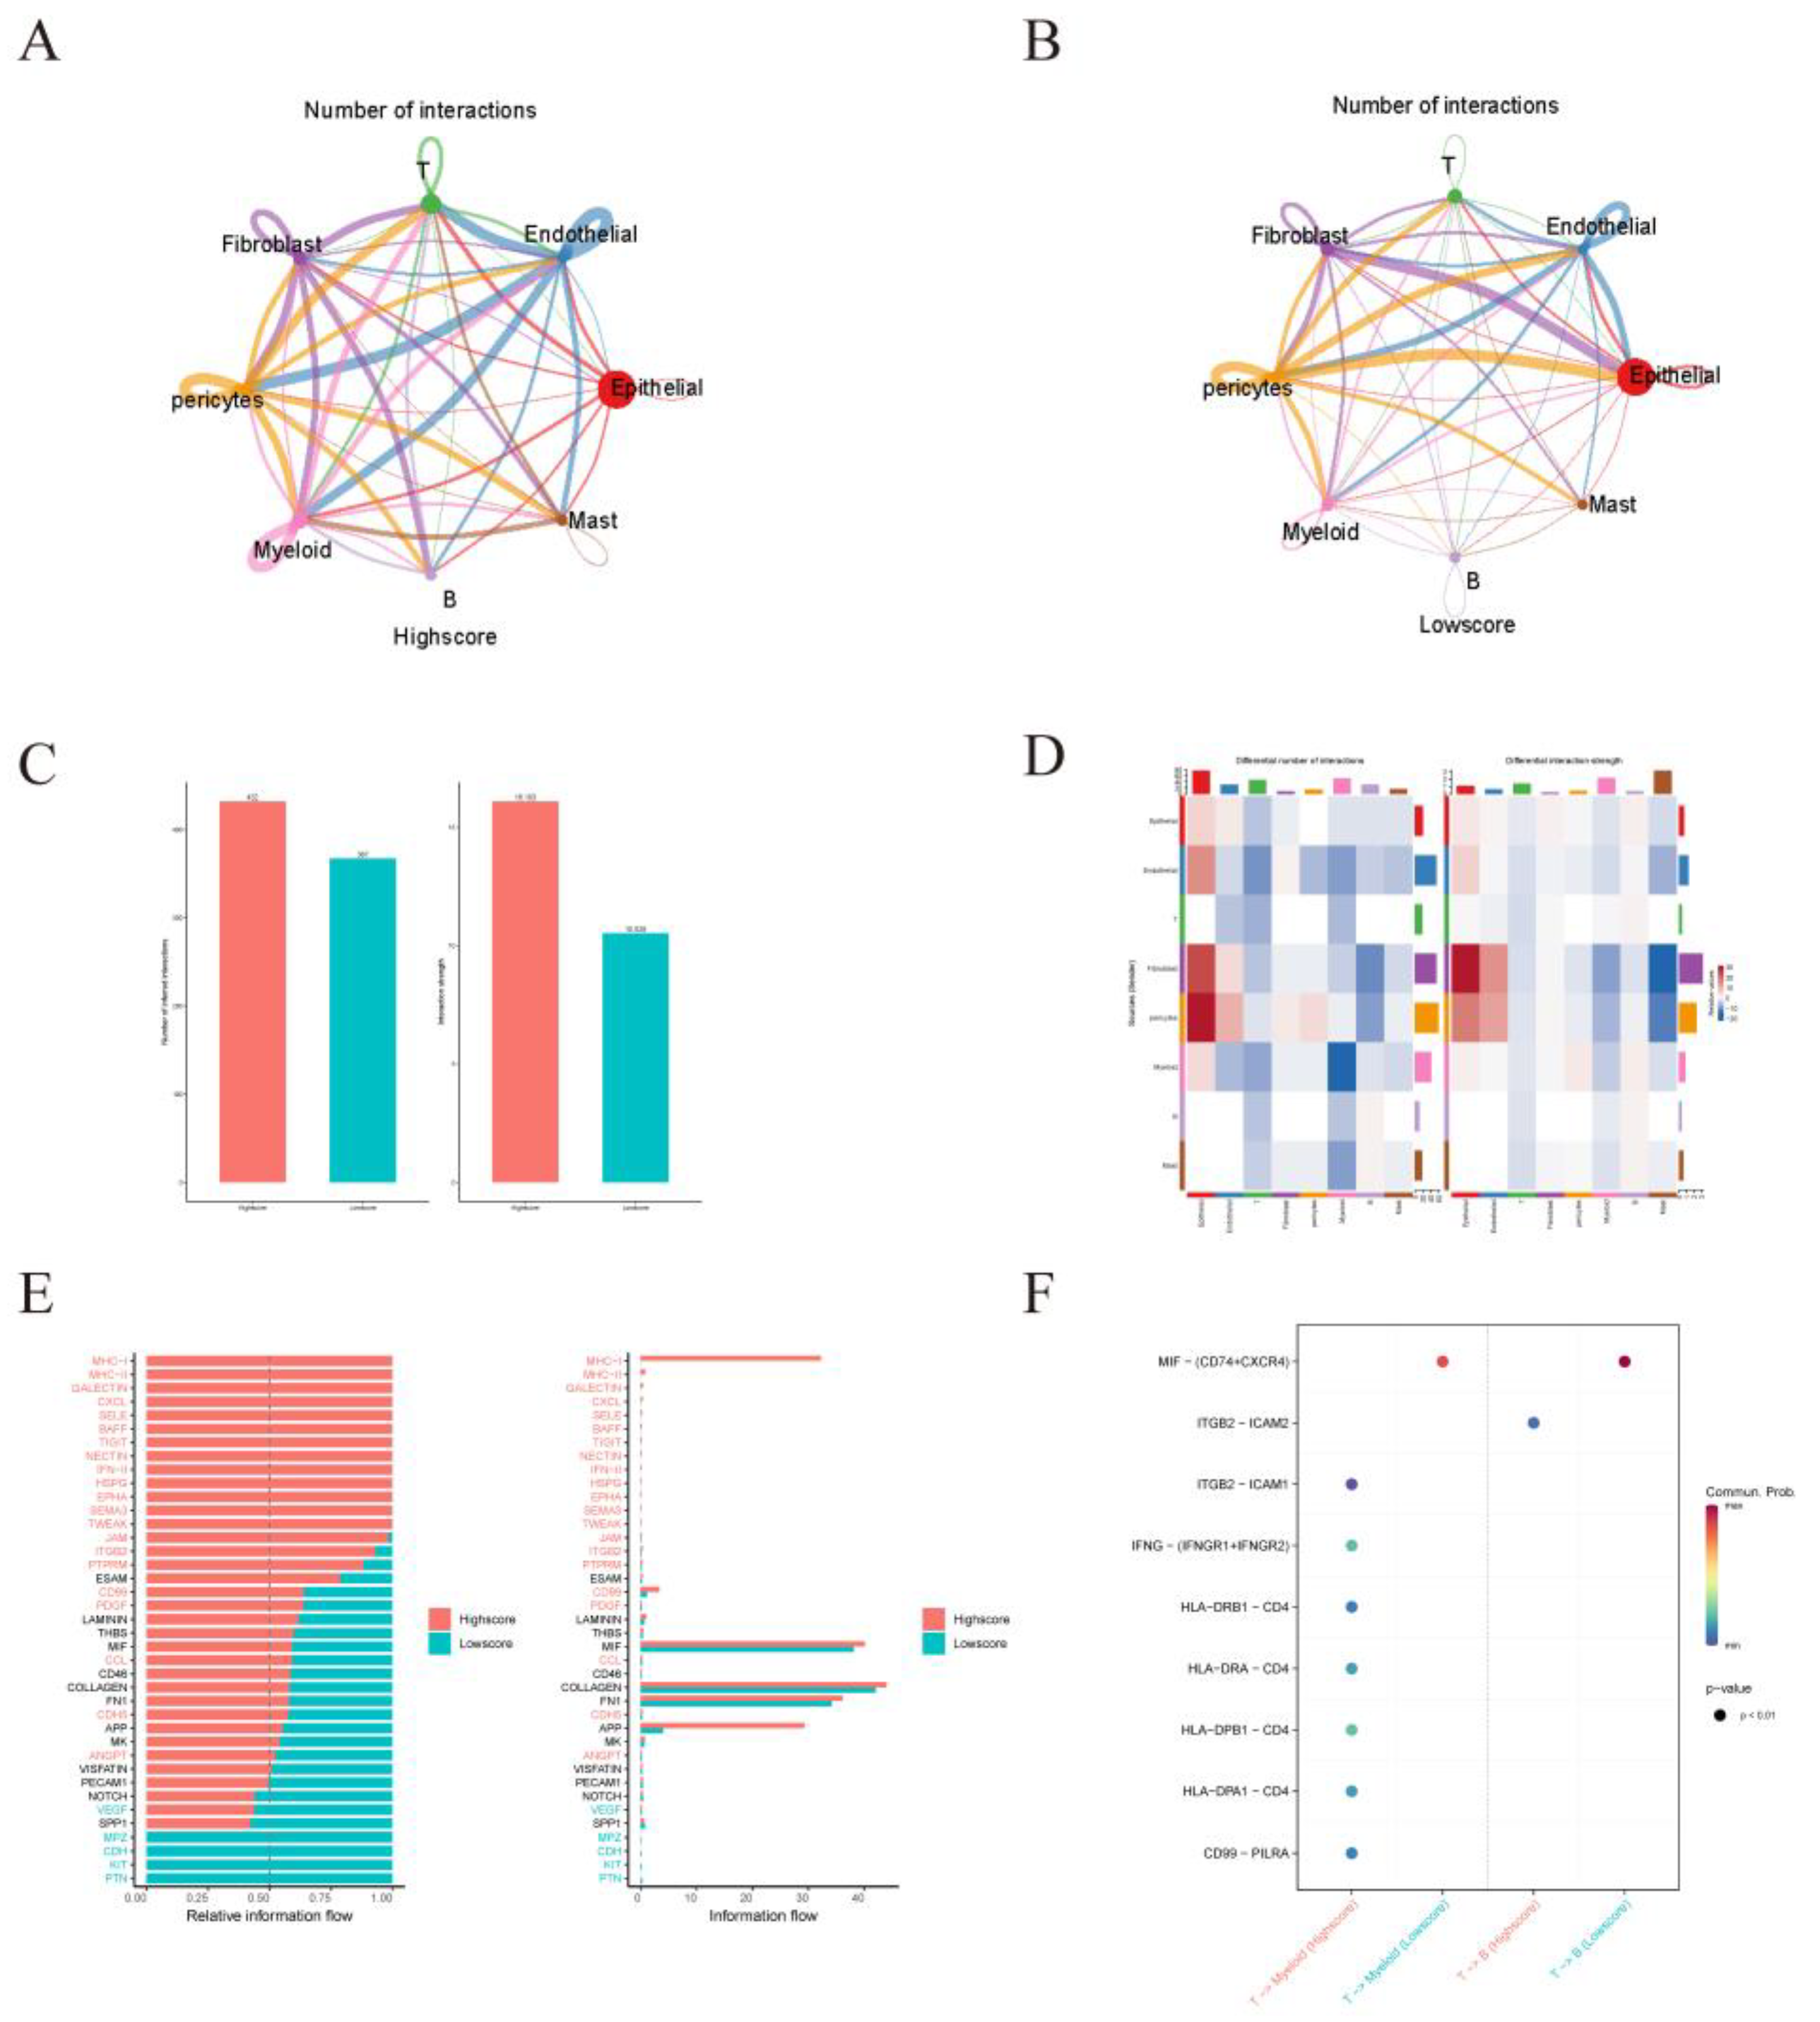
Figure 11.
| Validation of the critical role of NDUFAB1 in breast cancer. (A) Differential expression of NDUFAB1 in TCGA data. (B) Analysis of the relationship between NDUFAB1 and OS in BC patients. (C) Assessment of the correlation between NDUFAB1 and fatty acid elongation. (D) qRT-PCR to verify the difference of NDUFAB1 in breast cancer cell line MCF-7 and normal breast epithelial cell line MCF-10. (E) qRT-PCR assessment of NDUFAB1 mRNA levels after 2 days of transfection. (F) CCK8 assay. Cell viability was significantly decreased after NDUFAB1 was knocked down. (G, H) Scratch-wound healing assay. Significantly slower wound healing was observed in cells with knockdown of NDUFAB1. All data are mean ± SD of three independent experiments. *P < 0.05, **P < 0.01, ***P < 0.001,****P < 0.0001.
Disclaimer/Publisher’s Note: The statements, opinions and data contained in all publications are solely those of the individual author(s) and contributor(s) and not of MDPI and/or the editor(s). MDPI and/or the editor(s) disclaim responsibility for any injury to people or property resulting from any ideas, methods, instructions or products referred to in the content. |
© 2023 by the authors. Licensee MDPI, Basel, Switzerland. This article is an open access article distributed under the terms and conditions of the Creative Commons Attribution (CC BY) license (http://creativecommons.org/licenses/by/4.0/).
Copyright: This open access article is published under a Creative Commons CC BY 4.0 license, which permit the free download, distribution, and reuse, provided that the author and preprint are cited in any reuse.


