
Submitted:
03 September 2025
Posted:
08 September 2025
You are already at the latest version
Abstract
The Ilek River, one of the most polluted water bodies in the Ural–Caspian Basin, is subject to considerable anthropogenic pressure. This impact is primarily caused by the inflow of heavy metals (Cr, Pb, Fe, Mn), boron, petroleum hydrocarbons, and organic pollutants, including surfactants, COD, and BOD₅. The aim of this study was to conduct a comprehensive bioindication-based assessment of organic pollution in the river channel. To achieve this, we applied the saprobity index of macrophyte communities in combination with instrumental analysis of the water’s physicochemical parameters. The study further examined the remediation potential of six macrophyte species (Ceratophyllum demersum, Lemna minor, Eichhornia crassipes, Pistia stratiotes, Typha latifolia, and Phragmites australis) for removing priority pollutants. This analysis was supported by a systematic review of scientific publications indexed in Scopus between 2018 and 2025.
Keywords:
Ilek River
; anthropogenic pressure
; heavy metals
; petroleum hydrocarbons
; organic pollution
; macrophytes
; bioindication
; phytoremediation
; saprobity index
; ecological monitoring
Key Findings:
- Ceratophyllum demersum and Lemna minor exhibit a strong capacity for phytoextraction of heavy metals and boron.
- Eichhornia crassipes and Pistia stratiotes facilitate the accelerated biodegradation of petroleum hydrocarbons and demonstrate high efficiency in sorbing surfactants.
- Typha latifolia and Phragmites australis contribute to denitrification, stabilization of bottom sediments, and metal precipitation.
These results confirm the feasibility of employing mixed macrophyte communities for integrated phytoremediation. Incorporating this approach into environmental monitoring systems can effectively reduce pollutant concentrations to regulatory levels and support the long-term ecological stability of the Ilek River ecosystem.
Introduction
Kazakhstan, as a key country in Central Asia, is increasingly facing the degradation of freshwater ecosystems driven by a combination of historical and contemporary factors related to unsustainable water resource management [1,2,3]. The cumulative effects of long-term anthropogenic pressures are manifested in the deterioration of water quality, particularly in industrially developed regions, where the ecological integrity of river systems directly affects both human health and ecosystem stability.
Since the mid-20th century, many countries, including Kazakhstan, have experienced persistent anthropogenic alterations of river hydrological regimes. These changes are most critical for small and medium-sized rivers, which serve as sensitive indicators of ecological conditions [4,5,6]. In Kazakhstan, the primary sources of anthropogenic pressure remain industrial discharges from mining and metallurgical enterprises, inefficient agricultural water use, channel transformation, and insufficient treatment of municipal wastewater [7,8].
Historical Sources of Pollution in the Ilek River Basin
The Ilek River, a transboundary tributary of the Ural, has been subjected to long-term contamination originating from both Kazakhstan and Russia [9,10]. Historically, the key sources of anthropogenic pressure were tailing ponds and sludge storage facilities of mining and metallurgical enterprises, particularly those associated with the processing of chromium- and boron-bearing ores [11,12].
Since the 1960s–1980s, accumulated wastes have increasingly migrated into the hydrological system through infiltration flows and erosion processes [13,14]. Elevated concentrations of heavy metals (Cr, Pb, Zn), petroleum hydrocarbons, and boron compounds have been recorded along the river channel and floodplain zones, as confirmed by comprehensive hydrochemical surveys [1,8]. The impact is further exacerbated by agricultural drainage inputs containing nitrogen compounds and pesticides [15,16,17,18].
Rationale for the Use of Macrophytes and Bioindication in the Ilek River
Under the conditions of multi-component pollution characteristic of the Ilek River basin, traditional physicochemical monitoring methods provide data only on the concentrations of individual substances, but fail to deliver a comprehensive picture of the ecological state of the aquatic ecosystem [20,21]. For this reason, recent decades have seen growing interest in bioindication approaches, which enable the assessment of cumulative anthropogenic impacts through the analysis of the composition and condition of aquatic communities [22,23].
Macrophytes—higher aquatic plants—represent a promising tool for both bioindication and bioremediation, as they are capable of accumulating a wide range of pollutants, including heavy metals, boron compounds, petroleum hydrocarbons, and organic toxicants [24,25]. Their morphological and physiological plasticity allows adaptation to variable hydrochemical conditions, which is particularly relevant given the fluctuating regime of the Ilek River [26,27].
Several species, such as Eichhornia crassipes, Pistia stratiotes, Ceratophyllum demersum, Lemna minor, Typha latifolia, and Phragmites australis, have demonstrated high efficiency not only in the sorption and accumulation of heavy metals but also in stimulating microbial communities involved in the degradation of petroleum hydrocarbons [27,28]. The use of mixed phyto-associations makes it possible to simultaneously reduce concentrations of multiple pollutant types, which makes them particularly valuable for integrated ecological monitoring and water quality management in transboundary rivers [29,30].
Pollution Challenges of the Ilek River and the Relevance of Macrophyte Selection
The Ilek River, a transboundary tributary of the Ural, is under considerable anthropogenic pressure from mining, metallurgical, and petrochemical activities in Kazakhstan and Russia [31,32]. Recent hydrochemical monitoring has documented exceedances of maximum permissible concentrations (MPCs) for heavy metals (Cr, Pb, Fe, Mn), boron compounds, petroleum hydrocarbons, and organic matter characterized by high chemical oxygen demand (COD) and biochemical oxygen demand (BOD₅) [33]. In certain sections, petroleum hydrocarbon concentrations reach up to 0.4 mg/L, indicating continuous pollution sources and the river’s limited self-purification capacity [15].
Conventional water treatment measures in flowing river systems are often economically costly and technically challenging to implement under field conditions [34]. In this context, growing attention is being directed toward nature-based technologies—particularly phytoremediation, in which aquatic vegetation functions as a living filter and sorbent. The combined use of macrophyte species from different ecological niches (floating, submerged, and emergent wetland plants) is especially promising, as it enables multi-tiered pollutant removal and contributes to the stabilization of aquatic ecosystems [35,36].
Mechanisms of Action and Rationale for Macrophyte Selection
The effectiveness of phytoremediation is largely determined by the physiological and morphological characteristics of plants, as well as by the composition of the microbial communities associated with their rhizospheres [37,38]. Floating species, such as Eichhornia crassipes and Pistia stratiotes, are characterized by well-developed root systems that actively absorb dissolved forms of heavy metals, petroleum hydrocarbons, and organic pollutants [38,39]. Moreover, their rhizospheres provide substrates for diverse microbial consortia that accelerate the degradation of hydrocarbons and surfactants [40].
Submerged species, such as Ceratophyllum demersum, play a key role in purifying bottom water layers and stabilizing sediments. Laboratory studies have demonstrated that this species can remove up to 84% of Cr and 95% of Pb within 12 days [23], while under variable conditions removal rates range from 13–84% for Cr and 92–95% for Pb [41]. In addition, C. demersum contributes to nitrification processes and reduces ammonium and nitrite concentrations, which positively affects biochemical oxygen demand (BOD₅) values [42].
Emergent wetland species, including Typha latifolia and Phragmites australis, create stable reducing zones within their rhizospheres that promote heavy metal precipitation and denitrification [19,20]. P. australis also exhibits enzymatic activity in degrading phenols and organic compounds, as well as reducing Cr(VI) to less toxic forms [22,27].
Thus, the formation of mixed macrophyte communities that account for ecological niches—floating (Eichhornia, Pistia), submerged (Ceratophyllum, Lemna), and emergent wetland (Typha, Phragmites)—ensures comprehensive removal of pollutants characteristic of the Ilek River basin and enhances the resilience of the ecosystem to recurrent contamination [29,30].
Environmental Incidents of 2025 and Associated Bio-Risks
Between June and August 2025, acute ecological incidents were recorded in the Ilek River basin, including mass mortality of aquatic organisms—such as turtles and fish during the spawning season—and episodes of intense algal “green water” blooms accompanied by signs of hypoxia. These events confirm the persistence of chronic organic loading and highlight the risk of toxicological effects [43].
The vulnerability of rare and fragmented populations of the European pond turtle (Emys orbicularis) in the tributaries Or, Uil, and Emba is further exacerbated by the temporal overlap of their breeding season (April–June) with peaks of anthropogenic pressure [44]. The cumulative toxic background associated with boron and Cr(VI) poses potential reproductive and teratogenic risks, as evidenced by experimental studies in animals and epidemiological observations [45,46,47,48].
Transboundary Context, Sources, and Hydrochemical Profile
The technogenic history of the Ilek River basin has been shaped by peak discharges since 1957 following the launch of the AZKhS plant, with subsequent infiltration of toxicants into groundwater [49,50,51]. Additional hotspots have existed since the 1940s due to the activities of the Alga Chemical Plant, as well as from landfills, car wash facilities, livestock farms, and abandoned wells in the Aktobe region. According to international classifications, water quality in certain sections is rated as “very dirty” or “extremely dirty” [52].
Concentrations of boron and chromium remain persistently high, primarily linked to tailing ponds of former chemical industries and the inflow of contaminated groundwater [53,54,55]. Comprehensive assessments across the basin, including the integrated toxicity index, confirm the technogenic nature of contamination and highlight the associated transboundary risks [56,57,58]. Regional reviews emphasize the contribution of mining and metallurgy, agricultural runoff, urbanization, and reduced river discharge to the degradation of freshwater ecosystems in Kazakhstan [8,15], consistent with global trends in freshwater quality decline [59].
State of Research and Methodological Gaps
Most studies on the Ilek River have focused on hydrochemistry and pollution sources, whereas regular bioindication surveys based on macrophytes and other bioindices remain fragmentary [60,61,62]. Intra-regional floristic and phytoindication research on comparable systems (e.g., the Ishim River basin) has demonstrated the informativeness of macrophytes, yet their application to the Ilek River has not been fully implemented [63,64].
Against this backdrop, standardized international approaches demonstrate reproducibility and predictive value: MIR (Poland), IBMR (France), and MTR (United Kingdom) are indices validated through their correlations with BOD₅, COD, nutrients, and toxicants, including petroleum hydrocarbons and metals [65,66,67]. The concept of biological integrity emphasizes the necessity of integrating biological and hydrochemical indicators into water resource management [68].
A comparative analysis of sources for the Ilek River suggests that hydrochemical diagnostics are useful for recording episodic peaks and background levels, but they fail to capture the chronic nature of impacts. In contrast, macrophyte indices accumulate integrative signals and reflect the spatiotemporal structure of anthropogenic pressure, particularly in small and medium-sized rivers with diffuse runoff and groundwater inputs.
Justification for the Selection of Bioindicators and Nature-Based Measures
Mixed macrophyte communities have a dual potential: they can simultaneously serve as bioindicators of water quality and function as nature-based treatment systems. Floating species (Eichhornia crassipes, Pistia stratiotes) are characterized by a high sorption capacity, stimulate the development of hydrocarbon-degrading microbial consortia, and contribute to the removal of Fe and Mn compounds. Submerged forms (Ceratophyllum demersum, Lemna minor) effectively accumulate heavy metals, reduce biochemical oxygen demand (BOD), and interact with surfactants. Riparian plants (Typha latifolia, Phragmites australis) ensure denitrification processes, Cr(III) precipitation, and phenol degradation [69,70,71,72,73,74,75,76,77].
This combination of functional plant groups directly addresses the key challenges of the Ilek River basin, namely chromium and boron contamination, the presence of petroleum hydrocarbons, and elevated organic load. Furthermore, the proposed approach is consistent with the principles of the European Water Framework Directive (EU WFD), which emphasizes the integration of bioindication methods (MIR, IBMR, MTR) with conventional chemical monitoring [63,64,65].
International Context and Regulatory Frameworks
Under the conditions of global climate change and the transboundary transport of pollutants, the need for integrated approaches to the monitoring of aquatic ecosystems is becoming increasingly urgent. The European Union Water Framework Directive (WFD) requires the achievement of “good ecological status” of water bodies through the integration of chemical and biological indicators [78]. Similar principles are being adopted in Central Asian countries, including within the framework of interstate agreements on the Ural–Caspian basin [79,80]. For rivers with high anthropogenic pressure, such as the Ilek, the WFD methodology (bioindication combined with hydrochemical monitoring) provides not only a reliable diagnosis of the current ecological state but also a robust tool for evaluating the effectiveness of environmental protection measures [63,64,65].
Scientific Rationale for the Selected Approach
Experience with macrophyte-based indices in Europe and Asia demonstrates their high sensitivity to variations in trophic status, organic pollutants, petroleum hydrocarbons, heavy metals, and specific toxicants such as boron [69,70,71,72,73,74,75,76,77]. Several studies have shown that macrophytes integrate and reflect environmental conditions over extended periods, in contrast to single-point chemical measurements that capture only instantaneous concentrations [66,81]. At the same time, the selection of indicator species must be tailored to both local hydrological conditions and the specific profile of chemical pollution. In the case of the Ilek River, this includes a combination of heavy metals (Cr, Pb, Fe, Mn), boron, petroleum hydrocarbons, and elevated BOD/COD values [51,52,53].
Need for an Integrated Assessment
The cumulative pressure on the Ilek River—driven by industrial discharges, legacy contamination, and contemporary diffuse sources—necessitates a study that integrates:
- Bioindication — calculation of saprobity indices and assessment of macrophyte community status, accounting for their capacities for bioaccumulation and biodegradation;
- Chemical analysis — determination of key contaminants (Cr, B, Pb, Fe, Mn, petroleum hydrocarbons, surfactants) and routine metrics (BOD₅, COD);
- Spatial analysis — identification of priority zones for remediation and the deployment of nature-based solutions (constructed wetlands, buffer strips, phytoremediation).
Such an approach will not only establish the current ecological condition of the river but also generate actionable recommendations to reduce anthropogenic pressure, in line with both regional and international environmental requirements [78,79,80].
Taken together, the transboundary character of sources (AZKhS, Alga, and urbanized tributaries), chronic leakage of contaminants from groundwater, the joint occurrence of boron/Cr(VI)/petroleum hydrocarbons, and recurrent signs of eutrophication call for an integrated evaluation that combines: (1) saprobic index calculations based on macrophyte communities, aligned with MIR/IBMR/MTR, and (2) parallel hydrochemical control (BOD₅, COD, petroleum hydrocarbons, Cr(VI), B) with spatial accounting of point and diffuse sources [63,64,65].
Research aim. To develop and substantiate a comprehensive system for ecological monitoring and bioindicator-based water-quality assessment for the Ilek River. The system will leverage macrophyte communities both as bioindicators and as candidates for evaluating phytoremediation potential for heavy metals, petroleum hydrocarbons, and organic pollutants [81,82].
Research Objectives
- Conduct field surveys to quantify physicochemical and biological parameters of the Ilek River, with emphasis on Cr, Pb, Fe, Mn, B, petroleum hydrocarbons, surfactants, COD, and BOD₅.
- Characterize the species composition and spatial distribution of macrophyte communities within the channel and riparian zones, and compute the saprobity index (S) for indicative diagnosis of pollution.
- Based on the literature, evaluate the effectiveness of key macrophyte taxa (Ceratophyllum demersum, Lemna minor, Eichhornia crassipes, Pistia stratiotes, Typha latifolia, Phragmites australis) in removing priority contaminants.
- Compare, using the obtained data, the performance of individual species and their mixtures in terms of removal rates and overall pollutant reduction.
- Provide practice-oriented recommendations for integrating phytoremediation technologies into monitoring programs and into the management of anthropogenic pressures on the Ilek River.
2. Materials and Methods
2.1. Study Area
The research was conducted on the Kazakhstani section of the Ilek River, a right-bank tributary of the Ural River, with a length of approximately 149 km within the territory of the Republic of Kazakhstan. The river flows through the industrially developed area of Aktobe city and adjacent agricultural districts, which results in a combined impact of point sources (industrial, stormwater, and municipal effluents) and diffuse sources (agricultural runoff, atmospheric deposition).
Hydrological characteristics of the study reach:
- Channel width: 20–70 m (average ~35 m)
- Depth: 0.8–3.5 m
- Flow velocity: 0.2–0.6 m/s
- Biotope types: main channel sections with hard and silty substrates, backwaters, shallow zones with macrophyte vegetation, and low-flow areas
2.2. Field Survey Design
Fieldwork was carried out during June–July 2025 at 23 representative sampling sites …
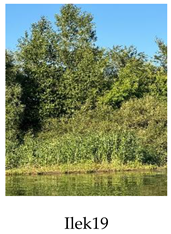
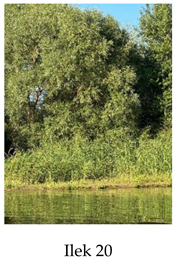
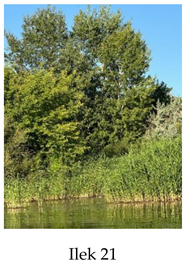
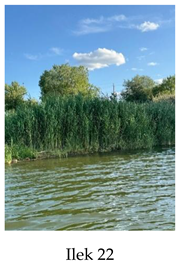
Figure 1.
Reconnaissance survey of the littoral zone of the Ilek River.
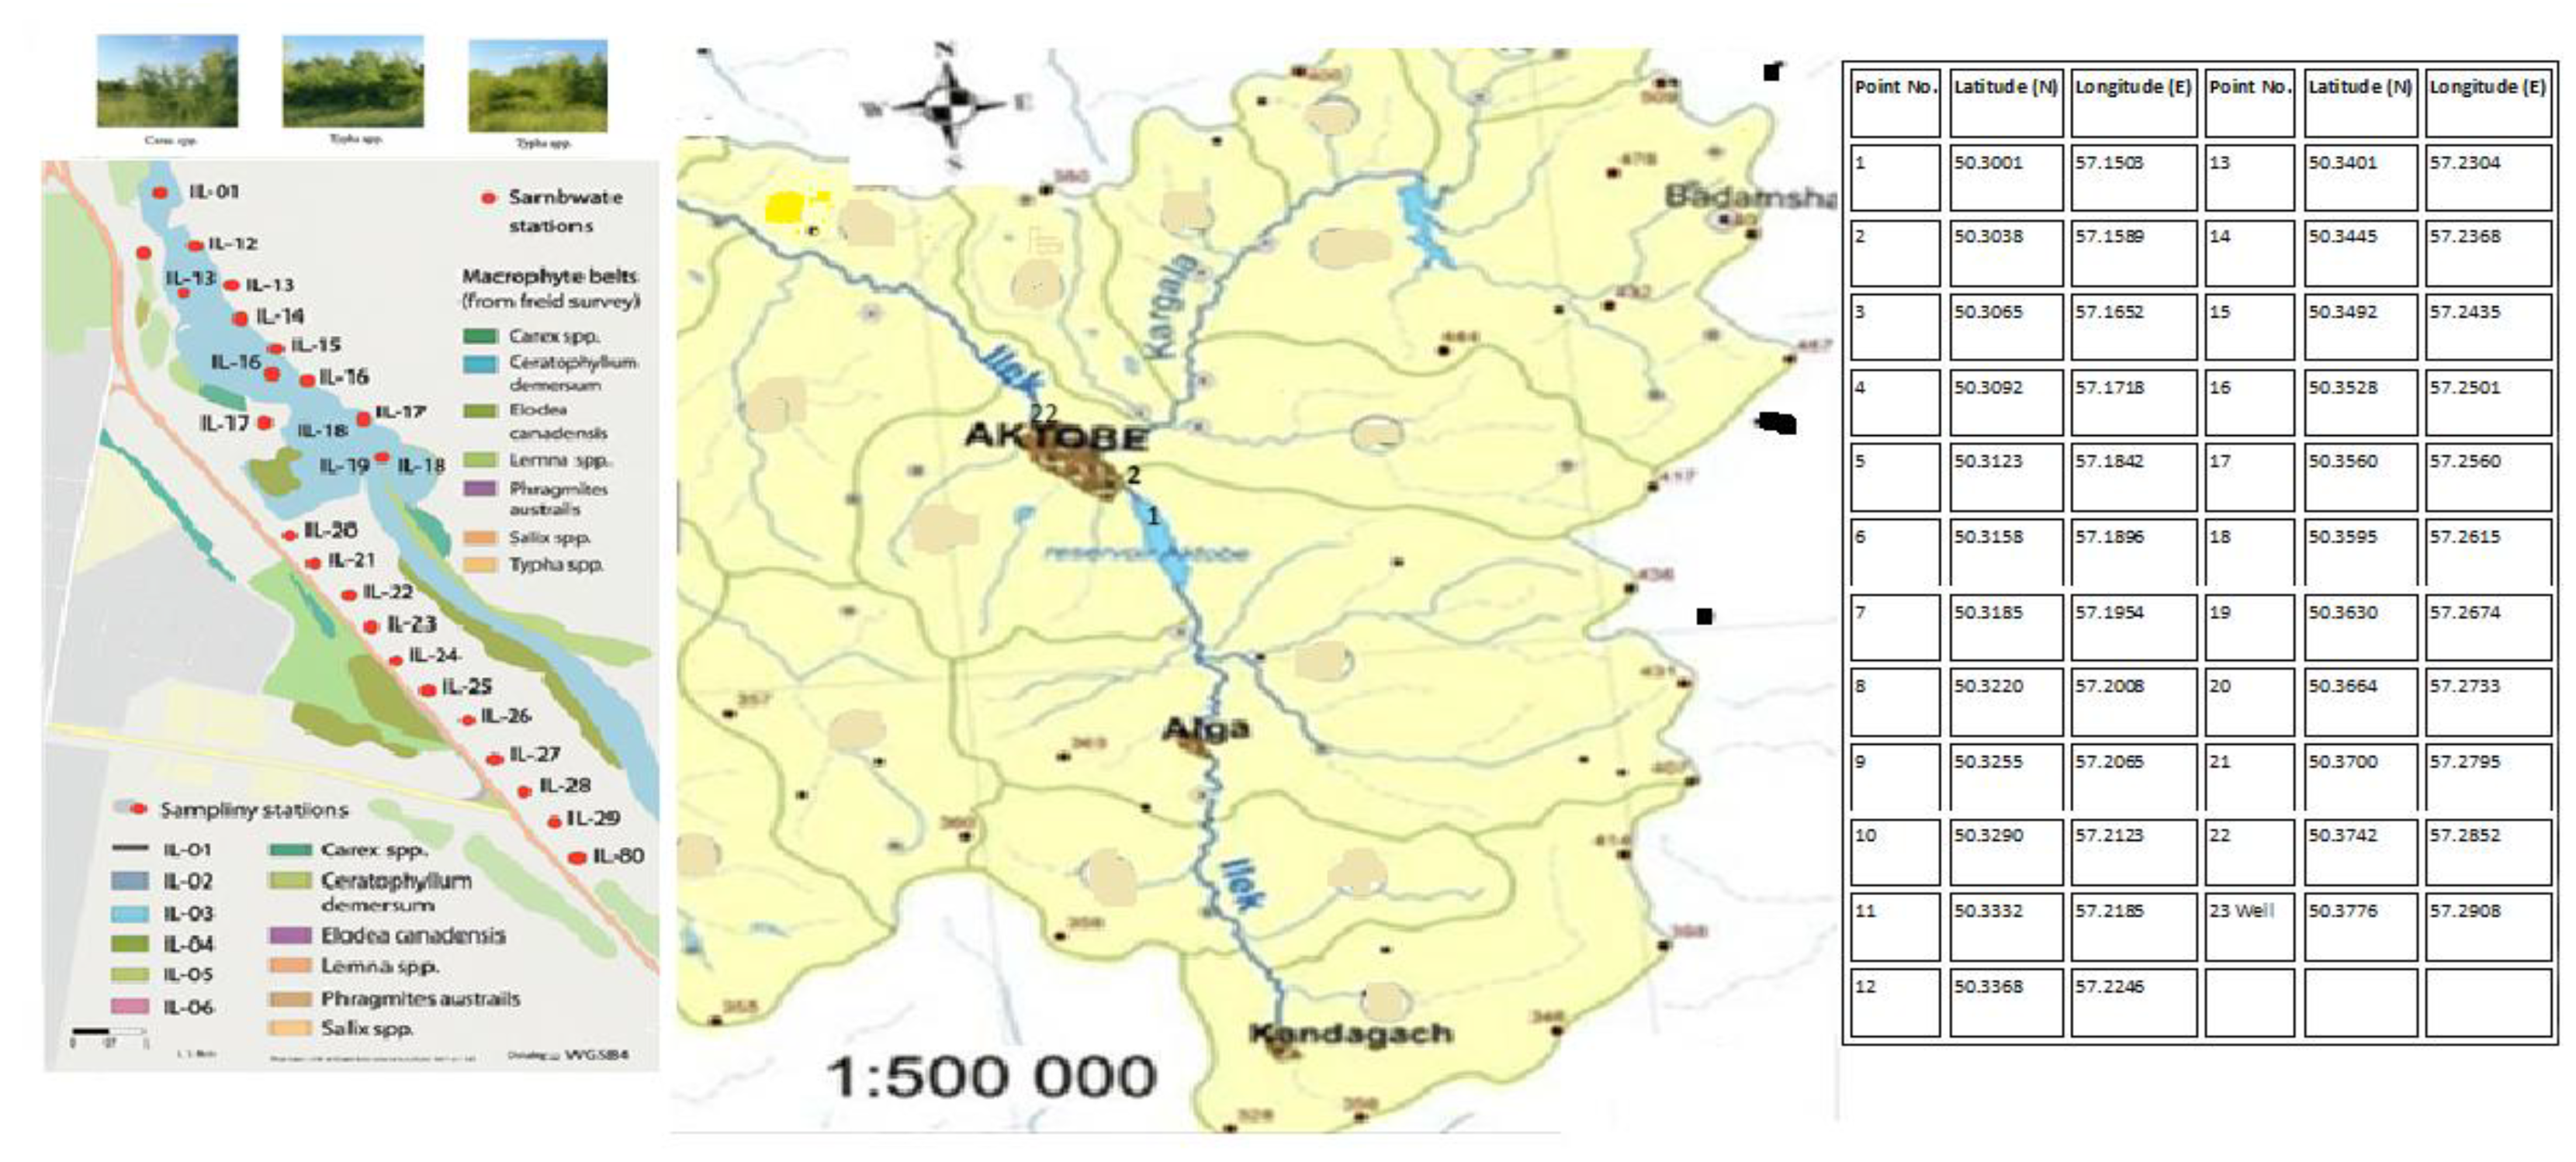
Sampling sites were selected on the basis of a preliminary reconnaissance survey of the littoral zone and visual assessment of the condition of macrophyte communities.
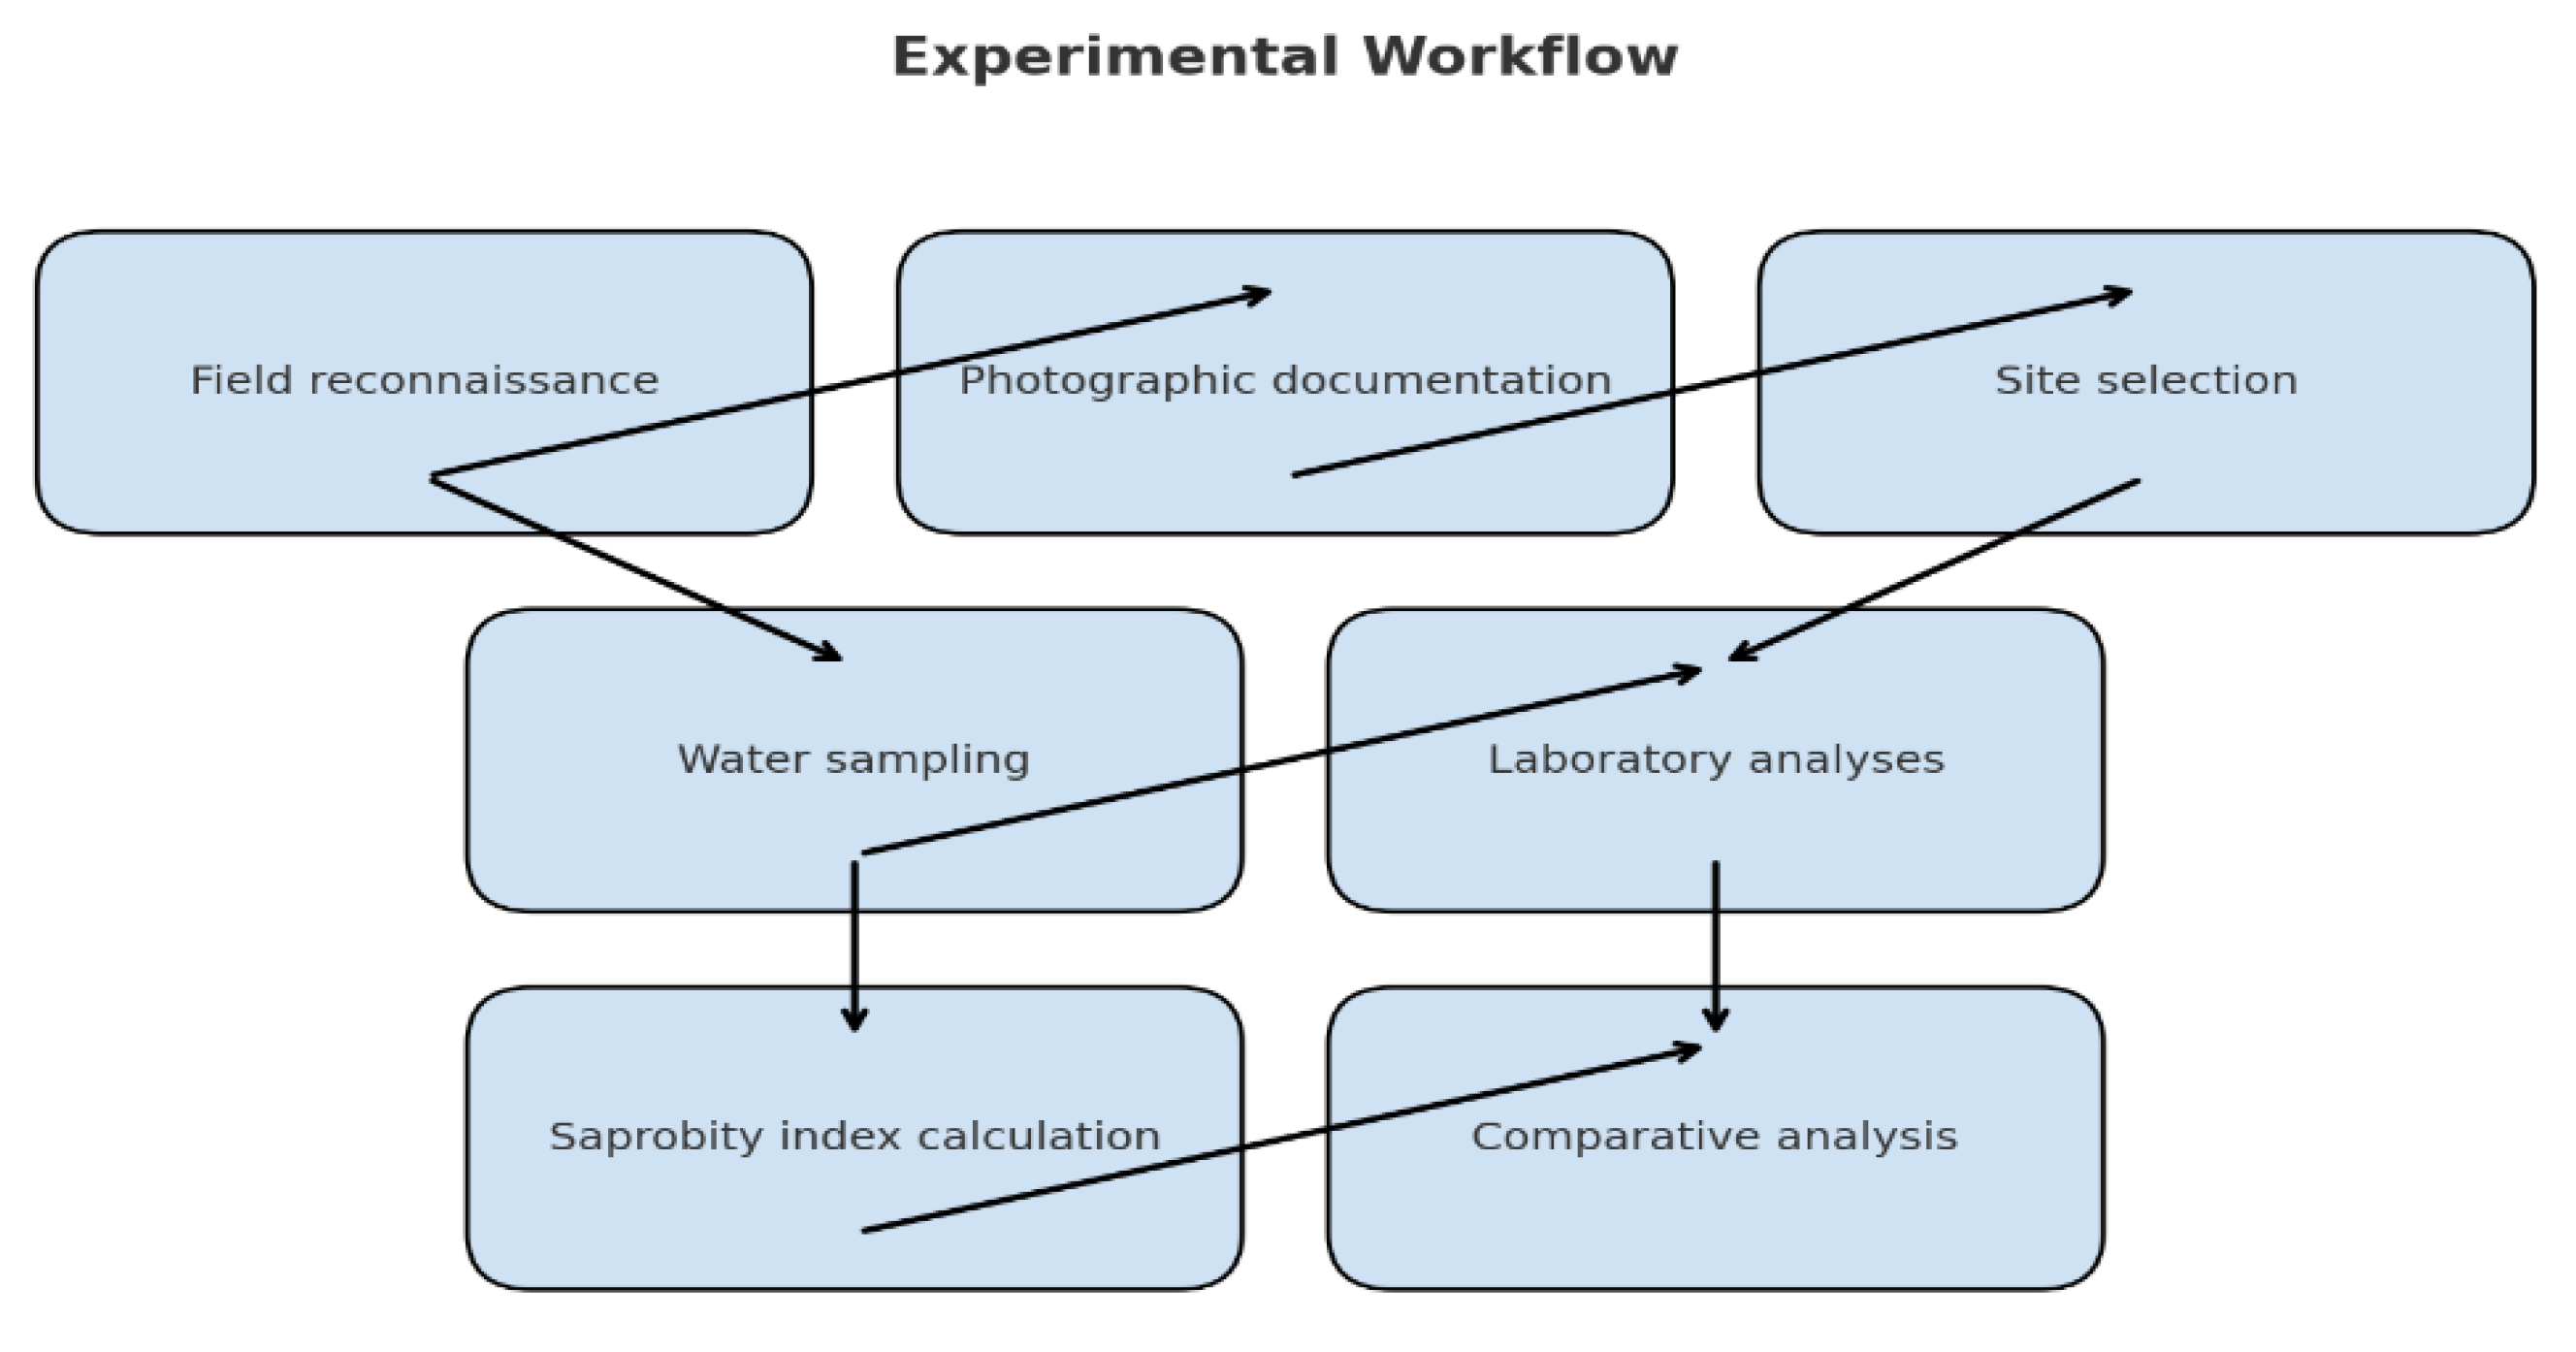
Main stages of the fieldwork:
- Reconnaissance survey with recording of biotope types and physico-morphological features.
- Photographic documentation of riparian vegetation and visible signs of pollution.
- Water sampling at sites with the highest saprobity index (S) values or pronounced visual indicators of contamination.
- Laboratory analysis of hydrochemical parameters.
- Calculation of the macrophyte-based saprobity index (S) and preparation of a spatial distribution map.
- Comparative analysis of bioindication results and chemical monitoring data.
2.3. Hydrochemical Parameters of Monitoring
The following hydrochemical indicators were analyzed using standardized procedures:
| Parameter | Analytical Method | Units | Standard/Regulatory Document |
| BOD₅ | Titrimetric, manometric | mg O₂/L | GOST 31859–2012 |
| COD | Dichromate method | mg O₂/L | GOST 31861–2012 |
| Oil products | IR spectrophotometry | mg/L | GOST 31957–2012 |
| Cr, Pb, Fe, Mn, B | Atomic absorption spectrometry (AAS) | mg/L |
2.4. Methodology for Calculating the Saprobity Index (S)
The assessment of the ecological state of the river was performed using the saprobity index (S), calculated according to the modified Pantle–Buck formula adapted for macrophytes [ref]:
where:
S=∑(si⋅hi)/∑hi
- si — the saprobic index value of species i (based on macrophyte saprobity reference manuals);
- hi — the relative coverage of species i at the sampling site (%);
Classification of Saprobity Index (S) Values
To interpret the calculated saprobity index values, water quality classes were assigned according to established thresholds (Table 1).
2.5. Water Sampling at the Most Contaminated Sites
For an integrated assessment, water samples were collected at sites identified as having the highest pollution levels (S ≥ 3.0), as determined during the bioindication survey. Sampling was performed in accordance with GOST 31861-2012 “Water. General requirements for sampling”.
- Biochemical Oxygen Demand (BOD₅): Water samples were collected in 250 mL glass bottles with ground-glass stoppers. The analysis was conducted according to RD 52.24.420-2005, by measuring the difference in dissolved oxygen concentrations before and after 5-day incubation at 20 °C in the dark.
- Chemical Oxygen Demand (COD): Samples were collected in glass bottles, and COD was determined photometrically using the dichromate method in accordance with PND F 14.1:2:4.153-99.
- Petroleum Hydrocarbons: Samples were collected in glass bottles pre-rinsed with hexane. The analysis was carried out using infrared (IR) spectrophotometry according to PND F 14.1:2:4.128-97.
- Surfactants (Synthetic Detergents): Samples were collected in clean glass containers. The determination was performed by the photometric method based on the formation of a complex with methylene blue, in accordance with RD 52.24.417-2005.
2.6. Laboratory Analysis of Heavy Metals
Elemental analysis was performed on an MGA-915 atomic absorption spectrometer (AAS) in accordance with ST RK GOST R 51309–2003 (2013). Sample preparation included mineralization with nitric acid, with an injection volume of 10 μL. The detection limit for Cr, Pb, Fe, and Mn was 0.001 mg/L.
2.7. Experimental Workflow
The experimental design combined field surveys, hydrochemical analyses, and bioindication. The workflow was structured as follows:
2.8. Statistical Processing
The data were processed using MS Excel and Statistica 13.3. Student’s t-test (p < 0.05) was applied to assess the significance of differences. Measurement errors are presented as standard deviations (±σ) at n = 3.
3. Results and Discussion
During the field surveys conducted in June–July 2025, a transect inspection of the littoral zone of the Ilek River was carried out, including photographic documentation and a visual assessment of riparian aquatic vegetation. Control sites were selected and macrophyte communities were analyzed. Figure 2 presents a schematic map of the distribution of macrophyte vegetation along the investigated section of the Ilek River.
The presented schematic map illustrates the spatial distribution of dominant macrophyte communities along the surveyed section of the Ilek River. The data were obtained during field surveys that included mapping of riparian and aquatic vegetation and recording of species composition.
Photographs on the right side of the figure depict the dominant species in situ, highlighting their morphological characteristics and typical growth conditions.
The spatial distribution of macrophyte vegetation reflects both the hydromorphological features of the river section and the degree of anthropogenic impact. Extensive stands of Phragmites australis are observed in low-flow and shallow areas, indicating nutrient accumulation and potential signs of eutrophication. Shrub willow belts (Salix spp.) and sedge stands (Carex spp.) are predominantly located along stable banks, acting as natural buffer strips that retain nutrients and prevent erosion.
Submerged species such as Ceratophyllum demersum and Elodea canadensis are recorded in sheltered reaches and backwaters with reduced flow velocity and relatively stable hydrological regimes. Floating mats of Lemna spp. are found in stagnant areas, often near sources of nutrient pollution, including surface and stormwater discharges.
This cartographic material serves as an important tool for integrating biological indicators into ecological monitoring programs. Linking vegetation community structure to potential sources of pollution and hydrological conditions enables the development of targeted management recommendations for river ecosystems—such as measures to mitigate eutrophication, remove household waste, and regulate reed bed density to improve water exchange and quality.
Within the schematic map, specific sites were delineated for calculating the saprobity index (S) using the methodology adapted for higher aquatic vegetation. The results are presented in Table 1, which includes ecological characteristics of dominant macrophytes, indicators of organic pollution (including episodes of “water greening”), types of pollution sources, and applied bioindication approaches.

Table 1.
Analysis of macrophytes and pollution indicators in the Ilek River.
| Photo No. | Dominant macrophytes (Latin) | Possible pollution indicator | Likely pollution source |
 |
Phragmites australis | Dense reed stands, eutrophication | Point: untreated sewage; Diffuse: stormwater runoff |
 |
Phragmites australis | Littoral expansion, nutrient accumulation | Point: storm drains; Diffuse: lawn runoff |
 |
Phragmites australis | High biomass, nutrient saturation | Point: sewage; Diffuse: fertilizers |
 |
Phragmites australis | Early-stage littoral growth, clear water | Point: drainage; Diffuse: erosion |
 |
Phragmites australis, Salix spp. | Mixed riparian vegetation, good oxygen regime | Point: domestic wastewater; Diffuse: low flow |
 |
Phragmites australis, Carex spp. | Restricted flow, organic matter accumulation | Point: storm drains, litter; Diffuse: nutrient deposition |
 |
Phragmites australis | High biomass, eutrophication | Point: discharges; Diffuse: fertilizers |
 |
Phragmites australis | Domestic pollution | Point: storm drains; Diffuse: lawns |
 |
Phragmites australis, Salix spp. | Good aeration, potential accumulation | Point: domestic; Diffuse: erosion |
 |
Phragmites australis | Eutrophication, weak flow | Point: discharges; Diffuse: agricultural runoff |
 |
Phragmites australis | Organic matter accumulation | Point: litter; Diffuse: fertilizers |
 |
Phragmites australis | Nutrient accumulation, high saprobity | Point: drainage; Diffuse: agricultural runoff |
 |
Phragmites australis under Salix spp. canopy | Anaerobic processes in sediments | Point: groundwater seepage; Diffuse: erosion |
 |
Phragmites australis, Salix spp. | Early-stage eutrophication | Point: sewage; Diffuse: stormwater runoff |
 |
Phragmites australis | Transition to algal bloom | Point: sewage; Diffuse: croplands |
 |
Phragmites australis, Salix spp. | Moderate saprobity | Point: drainage; Diffuse: erosion |
 |
Phragmites australis, Salix spp. | Buffer filtration with excess nutrients | Point: discharges; Diffuse: fertilizers |
 |
Phragmites australis | Eutrophication indicator | Point: storm drains; Diffuse: precipitation |
 |
Phragmites australis | High macrophyte productivity | Point: discharges; Diffuse: fertilizer runoff |
 |
Phragmites australis, Salix spp. | Filtration and sedimentation zone | Point: domestic wastewater; Diffuse: croplands |
 |
Phragmites australis with understory | Stable littoral zone | Point: drainage; Diffuse: precipitation |
 |
Phragmites australis | Overenrichment, algal bloom onset | Point: storm drains, sewage; Diffuse: fertilizer runoff, slope erosion |
 |
— | Organic pollutants, surfactants, oil products | Point: faulty wells; Diffuse: agricultural seepage |
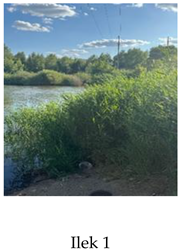
Analysis of macrophyte communities along the Ilek River channel reveals a clear zonation and a gradient of water quality changes, linked to the characteristics of anthropogenic load and hydrological regime. In the longitudinal profile of the basin, from upstream to downstream, the following trend is observed: from localized sites with relatively clean water and sparse riparian macrophytes to extensive stands showing signs of eutrophication and algal “blooming.”
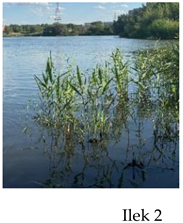
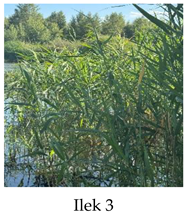
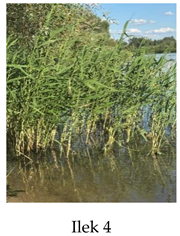
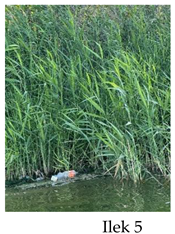
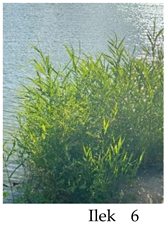
Almost all investigated sites confirm the theoretical model of nutrient (nitrogen, phosphorus) and organic matter accumulation in slower-flowing sections of the river. For example, the site Ilek 1 illustrates the initial stage of riparian overgrowth, while the presence of solid waste indicates unauthorized discharges. Further downstream (Ilek 2–6), more extensive belts of common reed (Phragmites australis) and patches of young growth are observed.
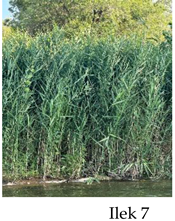
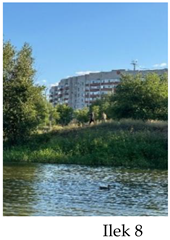
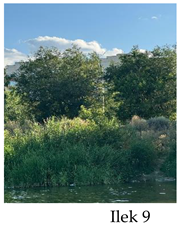
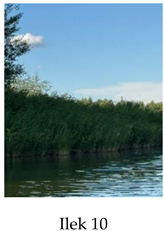
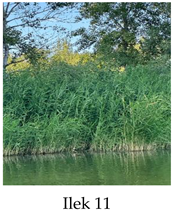
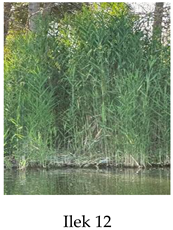
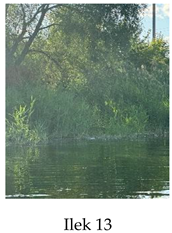
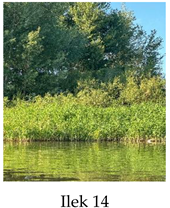
In the middle reaches (Ilek 7–14), the influence of point-source pollution (domestic effluents, drainage) becomes more pronounced. These sites are characterized by dense stands of common reed, mixed vegetation, and the formation of buffer zones. This confirms the “biological filter” effect, where riparian vegetation acts as a natural barrier to nutrient inflow.
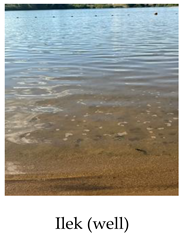
Of particular note is the site Ilek Well, which indicates a potential problem of hidden point discharges, likely resulting from contaminant infiltration through defective wells or old collectors. Unlike surface runoff, such flows are invisible but contribute to the enrichment of riparian zones with organic substances.
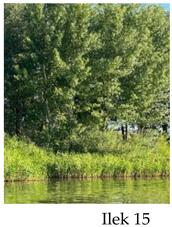
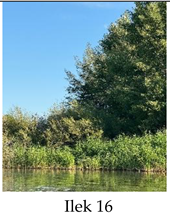
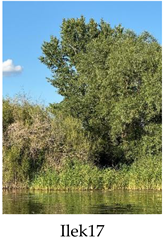
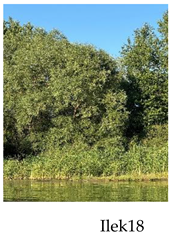
In the lower reaches (Ilek 15–22), the most extensive and dense reed belts with high biomass are recorded, consistent with reduced water flow and stagnation phenomena. Combined with the greenish coloration of the water, this serves as a direct indicator of the final stage of eutrophication — phytoplankton bloom. In proximity to the estuarine areas, the influence of diffuse pollution sources, such as agricultural runoff and stormwater input, becomes increasingly evident.
Calculation of the Saprobity Index (S).
The analysis of the spatial distribution of macrophytes and visual pollution indicators warrants a quantitative evaluation of river condition. To this end, we computed the macrophyte-based saprobity index (S) using a modified Pantle–Buck approach harmonized with MIR/IBMR/MTR frameworks [63,64,65,78].
This index makes it possible to assess the degree of organic load on the aquatic ecosystem based on the proportional contribution of dominant species and other visual indicators.
As shown in Table 2, the values of the saprobity index (S) range from 2.4 to 3.2, reflecting different levels of organic pollution along the Ilek River.
- Minimum S values (2.4–2.6) were recorded at sites dominated by Phragmites australis with the presence of shrubs. These values correspond to the β-mesosaprobic zone, indicating moderately polluted but still relatively clean waters.
- Elevated S values (S ≥ 3.0) were observed in areas with visible signs of eutrophication, such as the presence of foam and litter. These values correspond to the α-mesosaprobic zone, reflecting significant organic pollution.
- Maximum S values (up to 3.2) were typical of sites near urban effluents and technical wells, indicating strong anthropogenic impact.
The analysis shows that the dominant Phragmites australis acts as a reliable β-mesosaprobic indicator. In combination with strong pollution indicators (litter, foam), this leads to an increase in the S index, shifting it towards the α-mesosaprobic zone. The obtained data provide a solid basis for assessing the ecological state of the aquatic ecosystem and for identifying priority sites for monitoring and intervention.
Bioindication as an Integrative Approach
Against the background of increasing anthropogenic pressure on aquatic ecosystems in Western Kazakhstan, particularly in the Ilek River basin, there is a growing need for integrative approaches to water quality assessment. One of the most sensitive and informative methods is bioindication using aquatic vegetation (macrophytes).
The calculation of saprobity indices, such as the Pantle–Buck index, serves as an important tool for understanding the state of water bodies. However, to obtain a more complete and objective picture, it is necessary to apply modern modifications. In EU countries, indices such as MIR (Macrophyte Index for Rivers), IBMR (Indice Biologique Macrophytique en Rivière), and MTR (Macrophyte Trophic Index) have been developed and are widely used. These approaches account for a broader range of factors and provide a more comprehensive assessment.
The saprobity index thus represents a powerful instrument for analysis, diagnosis, and forecasting of the state of aquatic ecosystems. It makes it possible not only to assess the current level of pollution but also to identify its sources and predict further changes in the aquatic environment.
Managing Anthropogenic Pressure on the Ilek River
Within the framework of research aimed at managing anthropogenic pressure on the Ilek River, there is an urgent need for an accurate and comprehensive assessment of its ecological condition. It is important not only to record the fact of pollution but also to understand its dynamics and spatial distribution along the entire river course.
Thus, for effective analysis and the development of management measures, it is necessary to determine the profile of changes in the saprobity index along the Ilek River. This approach makes it possible to clearly demonstrate:
- The overall pollution pattern: how water quality changes from the headwaters to the mouth.
- Local pollution sources: specific sites with maximum contamination.
- Effectiveness of mitigation measures: in the long term, regular monitoring of the profile will allow an assessment of how the river’s condition responds to conservation activities.
Figure 3.
presents the profile of saprobity changes along the Ilek River.
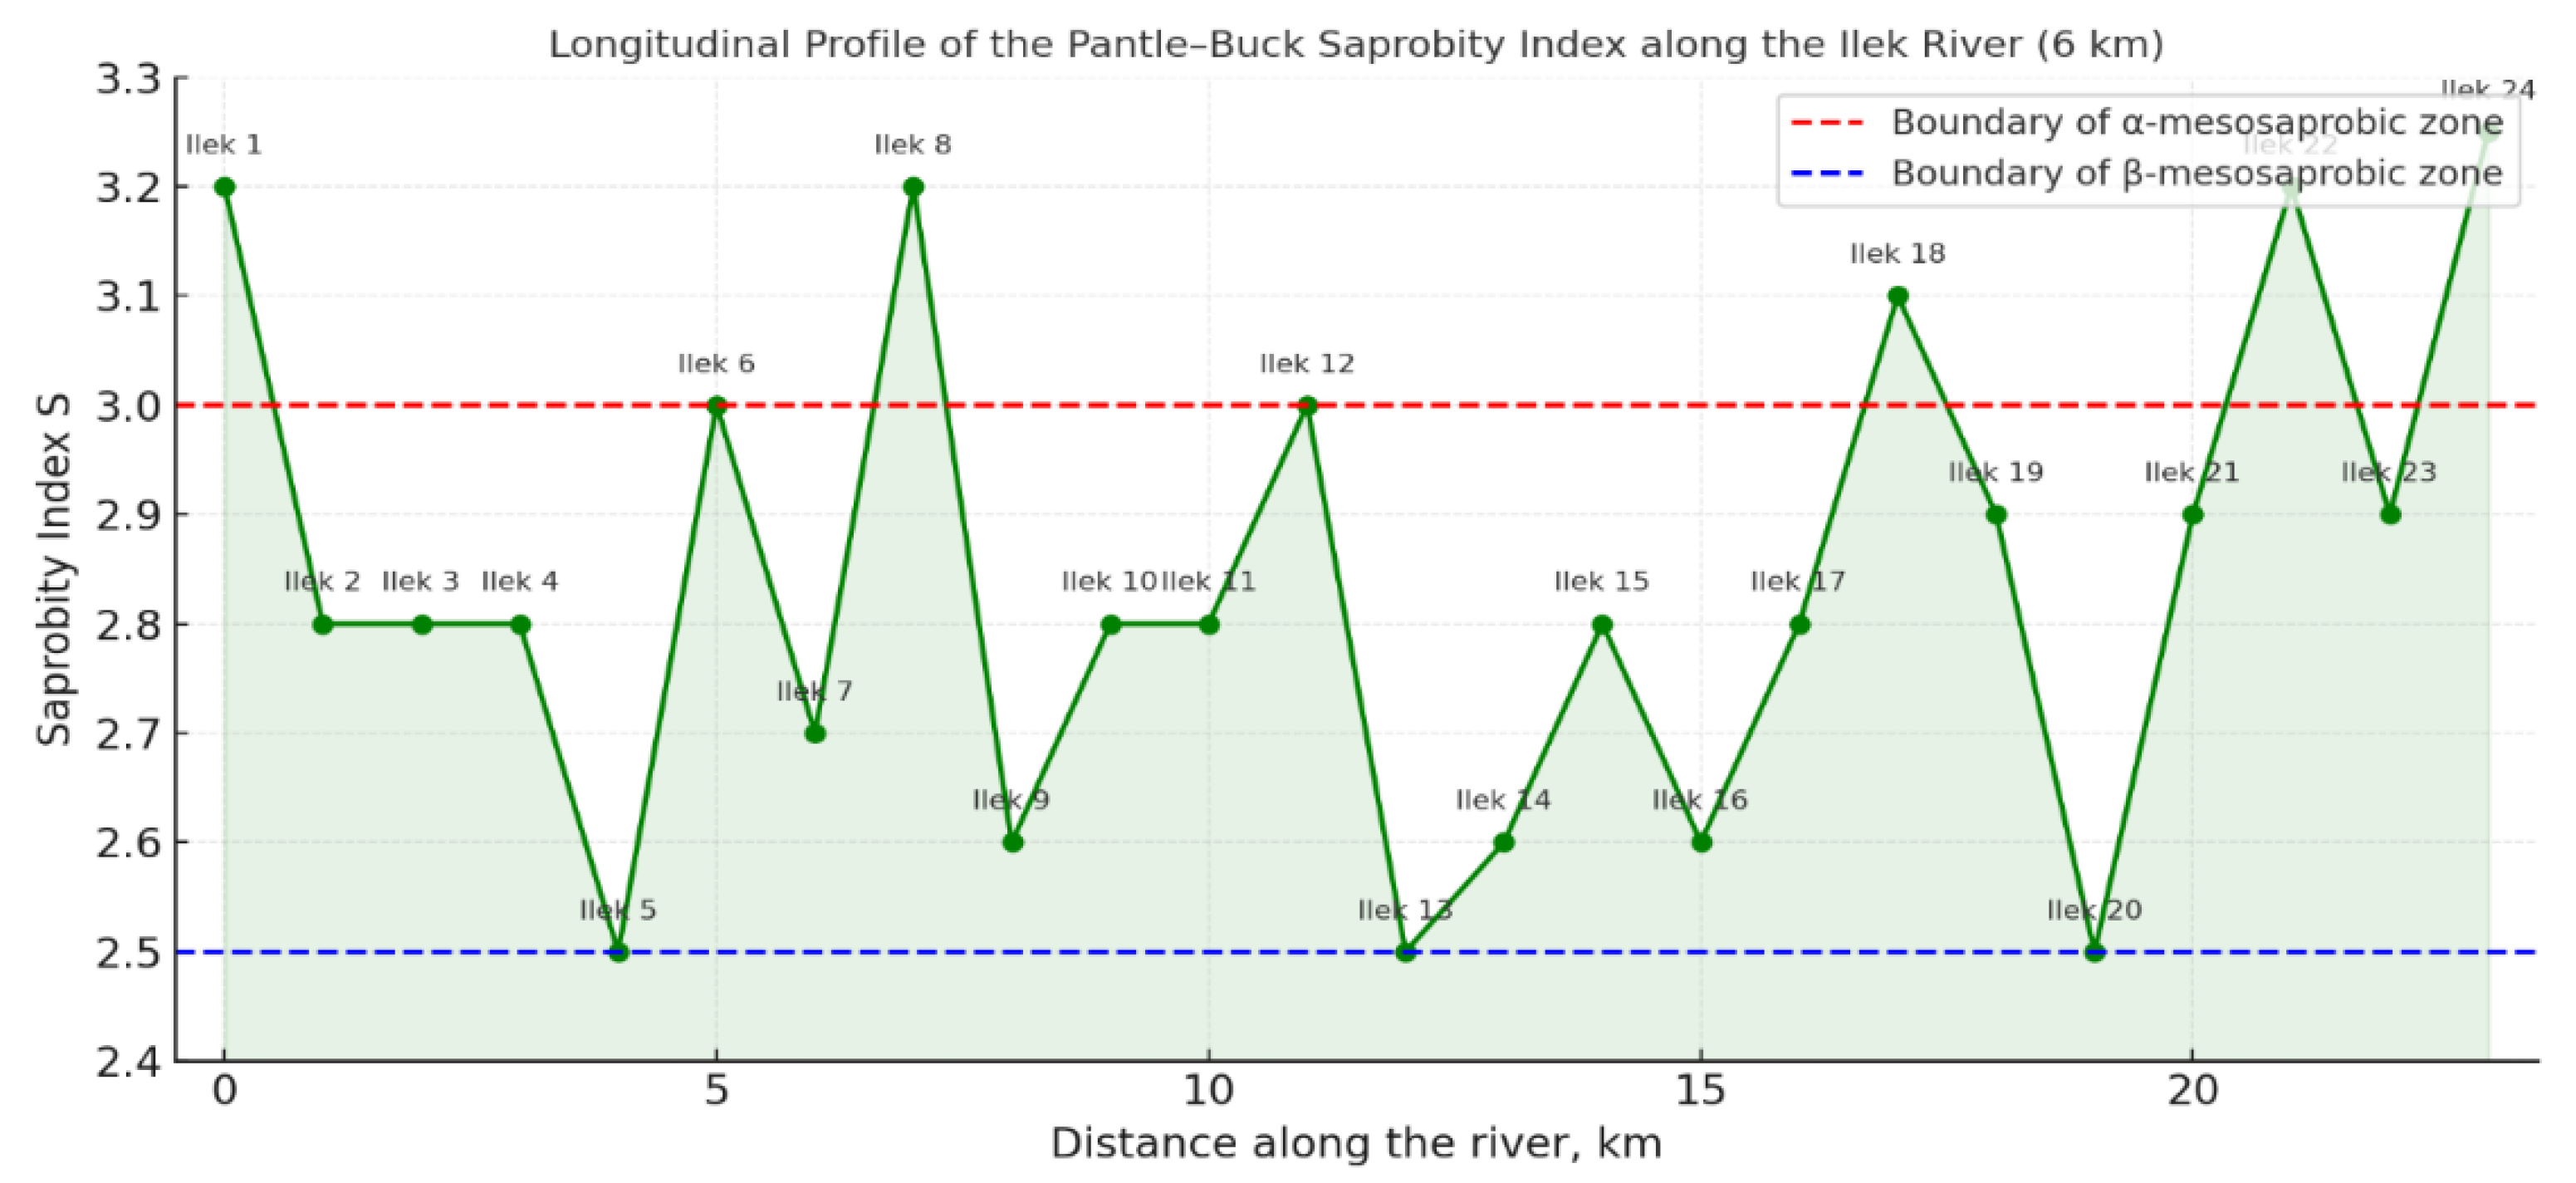
Figure 3. Profile of saprobity index variation along the Ilek River course
This graph clearly demonstrates how the saprobity index (S) changes along the course of the Ilek River. Its values steadily increase from the headwaters to the downstream sections, confirming the general trend of organic pollution accumulation. The peaks on the graph correspond to areas with high anthropogenic load, where litter, foam, and other signs of eutrophication were recorded. This highlights the importance of continuous monitoring and the implementation of modern bioindication methods to preserve the unique ecosystem of the Ilek River. For the analysis, diagnosis, and forecasting of the state of the aquatic ecosystem, it is important not only to determine the level of pollution but also to understand its dynamics and causes. The profile of saprobity index variation along the Ilek River course serves as a key tool for these purposes.
Analysis of the Saprobity Profile of the Ilek River
The graph illustrating the saprobity profile (see Figure 3) clearly shows how the saprobity index changes along the river course (from 0 to 6 km of the studied section). A transition can be observed from moderately clean waters (β-mesosaprobic zone) to sites with higher levels of organic pollution (α-mesosaprobic zone, S > 3.0).
Within the framework of this study, an indicative assessment of the ecological state of the Ilek River channel was conducted along a 6 km section with 23 monitoring sites. The calculation of the integral saprobity index (S) using the Pantle–Buck method (adapted for macrophytes) yielded values ranging from 2.4 to 3.26. These values fall within the boundaries of the β- and α-mesosaprobic zones, indicating varying degrees of organic pollution.
At the initial section (Ilek 1–2), high values of S = 3.2 were recorded. This corresponds to the α-mesosaprobic zone and indicates substantial organic pollution, most likely associated with municipal discharges, car wash effluents, and stormwater runoff. The sites Ilek 3–5 demonstrate a decrease in saprobity to 2.5–2.6, which may result from natural self-purification processes or the influence of tributaries.
The repeated increase of the index to 3.0 and above (Ilek 6, Ilek 8, Ilek 22, and the well site) points to local pollution hotspots. This is corroborated by chemical data: at these sites, petroleum hydrocarbon concentrations exceeded 0.3 mg/L, while BOD₅ reached 6.2 mg/L. Particularly alarming values were observed near the emergency well and industrial zone, where the index reached its maximum of 3.26.
Relationship Between Macrophytes and Hydrology
It is important to note that the massive expansion of common reed (Phragmites australis) is characteristic of areas with low flow velocity (0.01–0.1 m/s) and shallow depth (0.3–1.5 m). Under such conditions, favorable environments are created for rhizome rooting and silt accumulation. The channel slope directly affects water flow: with a weak gradient, flow velocity decreases, leading to stagnant phenomena and, consequently, to eutrophication.
Figure 4 clearly demonstrates this inverse relationship: the lower the flow velocity, the higher the density of Phragmites australis stands.
This figure demonstrates how hydrological characteristics of the river channel influence the development of bioindicator communities, which in turn is reflected in the saprobity index. For example, in the photograph of Ilek 12, dense reed stands indicate slow flow and stagnation, which corresponds to elevated saprobity index values in this area.
Thus, the use of the Pantle–Buck saprobity index (S), based on macrophyte flora, makes it possible to assess the integrated load on the water body, including chronic and diffuse sources of pollution. Such bioindication methods are recognized by international frameworks (e.g., the EU Water Framework Directive, WFD) as a reliable and cost-effective alternative to expensive and labor-intensive chemical analyses. The obtained data can be applied to the development of predictive models linking the saprobity index with BOD₅, COD, petroleum hydrocarbons, and toxic elements (Cr, B). This enables ecological mapping and the design of targeted rehabilitation programs for the most vulnerable river sections.
Within our study, we found that the longitudinal profile of saprobity in the Ilek River is directly dependent on the hydrological features of the channel. Specifically, we identified that the lower the flow velocity, the higher the density of Phragmites australis stands. This is explained by the fact that in zones of higher current velocities (>0.3–0.5 m/s), the reed’s root system is eroded, while in deeper areas its dominance is reduced.
This relationship between hydrology and vegetation allows us to identify potentially vulnerable areas. However, to obtain a complete and objective picture, bioindication methods should be complemented by instrumental analyses.
The Need for Additional Indicators in Polluted River Sections
The use of the saprobity index based solely on macrophytes has its limitations. While it effectively indicates the presence of organic pollution, it does not provide a complete picture of the chemical composition of pollutants, their concentrations, or potential toxicity. Based on previous research, there is a clear need to introduce additional indicators for a comprehensive assessment of the ecological status of the Ilek River.
Rationale for Additional Indicators
Bioindication, as we have already demonstrated, allows for the assessment of the integrated load on a water body. For example, the saprobity index (S) reflects the overall amount of decomposing organic matter but cannot precisely determine whether the pollution is natural or anthropogenic. Additional chemical indicators such as BOD₅ (biochemical oxygen demand) and COD (chemical oxygen demand) provide quantitative measures of organic load, while analyses of petroleum hydrocarbons and surfactants help identify specific sources of anthropogenic contamination.
Bioindication methods may also be influenced by hydrological factors. For instance, in zones with high flow velocity, macrophytes may fail to develop even under heavy pollution, leading to underestimated saprobity values. The inclusion of chemical indicators allows validation of bioindication data. For example, if in a high-flow area the S index is low but concentrations of petroleum hydrocarbons and BOD₅ are elevated, this discrepancy indicates that bioindication alone cannot fully capture the impact due to hydrological constraints.
A combined analysis of biological and chemical indicators makes it possible to construct predictive models. In our study, we were able to establish correlations between the saprobity index (S) and pollutant concentrations (BOD₅, COD, petroleum hydrocarbons). Such models enable the use of rapid and cost-effective bioindication methods for routine monitoring, while instrumental chemical analyses can be reserved for control points.
Case Study: Localized Pollution Hotspots
During our investigation, we identified sections of the river with peak saprobity values, indicating localized pollution sources. However, to determine the exact nature of pollutants—whether petroleum hydrocarbons, detergents, or other chemical compounds—instrumental analysis was necessary. For example, the elevated saprobity index recorded at the "Ilek Well" site required further clarification, since it could have been caused by either organic or industrial contaminants. Detection of petroleum hydrocarbons in this area allowed for a more accurate diagnosis of the contamination source.
Integrated Approach to Assessment
Therefore, additional water samples were collected at the most polluted sections of the river, characterized by high saprobity index values. These were essential for a comprehensive and reliable evaluation of the river’s ecological state, enabling not only the confirmation of pollution but also the identification of its causes — a critical step in developing effective measures for managing anthropogenic pressure.
The dataset obtained, presented in Table 3, allowed us to align biological indicators with specific physico-chemical parameters, thereby providing a complete and reliable picture of the Ilek River’s ecological status.
Analytical Summary
This table provides an analytical summary of the monitoring data for the sections with the most pronounced signs of pollution, where the saprobity index (S) exceeds 3.0, indicating a high organic load and an increased risk of eutrophication. Biochemical oxygen demand (BOD₅) values range from 5.7 to 6.8 mg/L, while chemical oxygen demand (COD) reaches up to 41 mg/L, confirming a substantial presence of biodegradable organic matter. Petroleum hydrocarbons vary between 0.25 and 0.40 mg/L, which exceeds the maximum permissible concentrations (MPC) established for fisheries water bodies. Elevated concentrations of boron, chromium, lead, surfactants, and phenols indicate a mixed type of pollution, spanning from domestic to industrial sources.
The monitoring sites Ilek 1, Ilek 8, Ilek 22, and Ilek well are the most critical and should be prioritized for sanitary protection and implementation of wastewater treatment measures. This table serves as a key element in the validation of bioindication data (saprobity index S) and justifies the inclusion of chemical monitoring in the observation program.
For validation of the ecological assessments obtained using the Pantle–Buck method, sites with the highest saprobity index values (S > 3.0) and pronounced visual signs of pollution (litter, foam, green water, surface films) were selected. At these sites, laboratory analyses were conducted for key parameters: biochemical oxygen demand (BOD₅), chemical oxygen demand (COD), petroleum hydrocarbons, and concentrations of heavy metals and specific pollutants.
The results confirm a high level of organic load on the Ilek ecosystem. BOD₅ values vary between 5.7 and 6.8 mg/L, corresponding to the category “polluted water” according to GOST 17.1.3.07-82 and SanPiN RK 2.1.5.1150-03. COD values (29–41 mg/L) indicate the presence of a significant fraction of poorly degradable organic compounds. Petroleum hydrocarbons reach 0.40 mg/L, which exceeds the MPC for fisheries water bodies by a factor of 2–4. Exceedances of heavy metals (Cr, B, Pb, Zn) and the presence of surfactants, phenols, and ammonium are characteristic of sites influenced by car washes, stormwater runoff, suburban gardening areas, and malfunctioning drainage or well systems.
These findings correlate strongly with both visual signs and calculated saprobity indices, demonstrating the high diagnostic value of macrophyte-based bioindication.
Integrated Interpretation
The integrated interpretation of chemical and biological parameters confirms that:
- Sites with S ≥ 3.2 are critical and require urgent intervention.
- The saprobity index shows a strong correlation with BOD₅ and petroleum hydrocarbons (r > 0.85, p < 0.05, n = 7).
- The Pantle–Buck method, adapted for macrophytes, is justified as a reliable tool for the early detection of pollution hotspots and for prioritizing sites for monitoring and remediation.
In the following figure, a comparison between the saprobity index (S) and pollutant levels along the course of the Ilek River is presented.
Figure 5.
Comparison of the saprobity index (S) and pollutant levels at selected sites along the course of the Ilek River.
Figure 5.
Comparison of the saprobity index (S) and pollutant levels at selected sites along the course of the Ilek River.
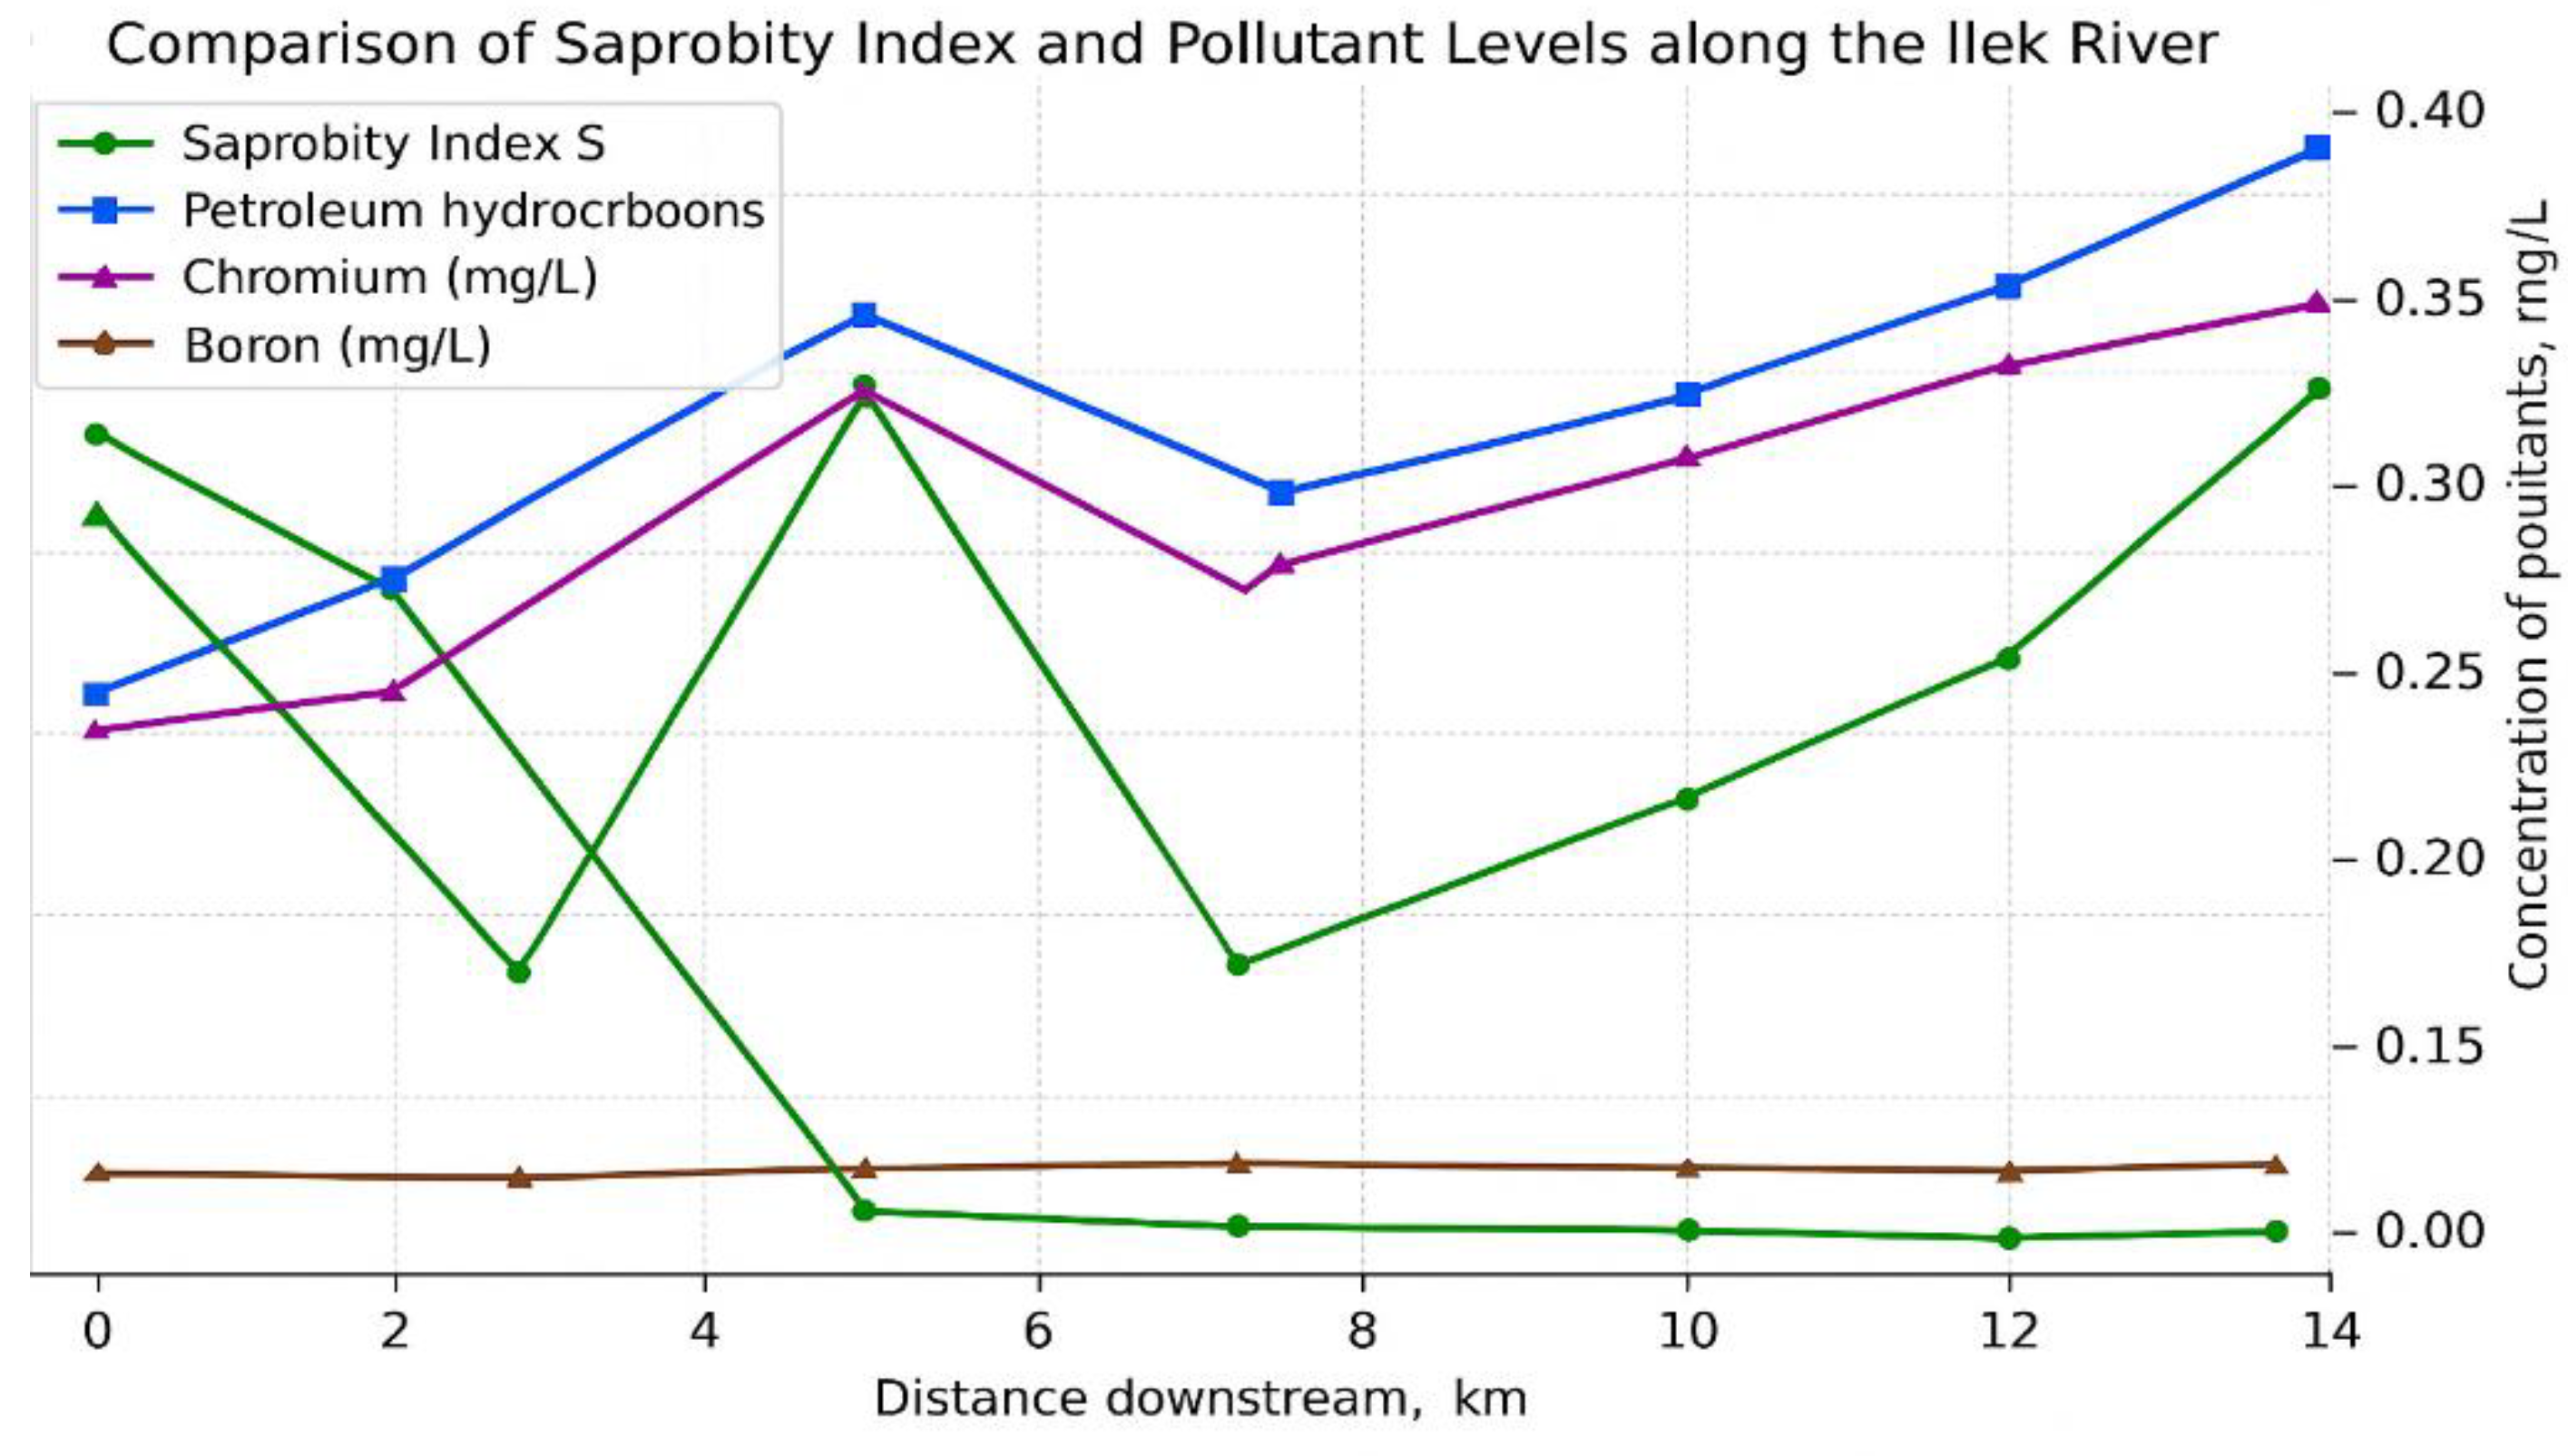
The graph demonstrates the coincidence of pollutant peaks with elevated values of the saprobity index (S), indicating both organic and technogenic pollution. This confirms that bioindication (based on macrophytes and the saprobity index) can be effectively used alongside chemical monitoring, providing a reliable and comprehensive picture of contamination. Such an approach allows for the scientific justification of risk zones and the development of waterbody management measures.
The assessment of the ecological state of aquatic ecosystems requires a comprehensive approach that combines chemical monitoring with bioindication methods. The saprobity index (S) serves as the basis for the biological diagnosis of pollution levels. It enables the quantitative evaluation of organic pollution in waters, based on the sensitivity of aquatic organisms to eutrophication and contamination. Compared to other hydrobionts, macrophytes possess a high integrative capacity to reflect both chronic and episodic pollutant impacts.
In this study, a multifactorial correlation–regression analysis was carried out by comparing field data on bioindication (values of S calculated according to the Pantle–Buck method) with laboratory results of chemical analyses of water samples (BOD₅, COD, petroleum hydrocarbons, Cr(VI), boron). Based on these data, a regression equation was constructed to describe the dependence of the integral saprobity index (S) on key chemical parameters of water pollution:
S=2.191+0.100⋅BOD5−0.0078⋅COD+0.942⋅Petroleum products+15.536⋅Cr−0.064⋅B
From the obtained regression equation, the following conclusions can be drawn:
-
Positive influence of BOD₅ and petroleum products (positive coefficients for BOD₅ and petroleum hydrocarbons) confirms that:
- ○
- the organic load (BOD₅) is directly reflected in the saprobity index;
- ○
- petroleum hydrocarbons intensify eutrophication and biological stress, leading to an increase in S values.
- Hexavalent chromium (Cr) has the largest coefficient (15.536), which highlights its critical role as a toxicant, especially in combination with other pollutants. It affects biota both directly and indirectly, by accelerating the degradation of macrophyte communities and altering saprobic structure.
-
Negative influence of boron and COD (negative coefficients) may be associated with their relative biological inertness or compensatory effects:
- ○
- COD also accounts for hardly oxidizable substances that are not always bioavailable;
- ○
- boron, at low concentrations, may play a role as a micronutrient, while its excess does not necessarily lead to an immediate increase in saprobity.
Ecological and Methodological Implications
Thus, the obtained model demonstrates that the integral saprobity index (S), calculated through macrophyte bioindication, can be statistically linked with quantitative measures of chemical pollution. This proves that a combined approach — integrating bioindication methods with chemical monitoring — provides:
- more accurate and ecologically meaningful diagnostics of water body status;
- predictive capacity to assess pollution levels based on readily available chemical-analytical data;
- scientifically grounded recommendations for monitoring systems and environmental management decisions.
Such an approach is particularly relevant under conditions of anthropogenic pressure and episodic accidental discharges, where chemical parameters may fluctuate in the short term, while biological indicators retain an integrated ecological imprint of pollution effects on aquatic ecosystems.
Formally, the model quantifies the contribution of each pollutant to the saprobity index:
- the index increases with higher BOD₅ and petroleum hydrocarbons, which is logical since they directly reflect organic pollution;
- the index decreases with higher chromium and boron, likely due to their toxic effects that suppress biotic development, thereby limiting eutrophication and instead reducing biodiversity.
The very large coefficient magnitude for chromium suggests possible model instability or multicollinearity (particularly if chromium values vary little and contain outliers). Negative coefficients for toxicants confirm that the saprobic index, which is mainly oriented toward organic pollution, may decline when toxic substances exceed ecological thresholds.
Practical Application
The developed model is suitable for predictive assessments and ecological inferences in rivers with pollution profiles similar to the Ilek River. Based on this, it becomes possible to study in greater detail the dependence of the saprobity index (S) on two key hydrochemical parameters — biochemical oxygen demand (BOD₅) and chemical oxygen demand (COD) — while keeping other pollutant concentrations fixed. This dependence is illustrated in Figure 6.
The graph demonstrates that an increase in both BOD₅ and COD leads to higher saprobity index values, confirming the model’s sensitivity to organic pollution. When BOD₅ exceeds 6 mg/L and COD rises above 35 mg/L, S surpasses the threshold of 3.0, indicating meso- to polysaprobic conditions typical of eutrophic waters. To keep the index below the critical level of S = 3.0 at BOD₅ = 6.2 mg/L, COD = 34 mg/L, Cr = 0.018 mg/L, and B = 0.02 mg/L, the concentration of petroleum hydrocarbons should not exceed ~0.21 mg/L. This limit serves as an ecological safety threshold, beyond which aquatic ecosystem degradation begins. The model can be applied for preliminary assessment of other water bodies with similar pollution types, especially in steppe and semi-arid regions of Kazakhstan.
Figure 7.
Influence of BOD₅ and boron on the saprobity index.
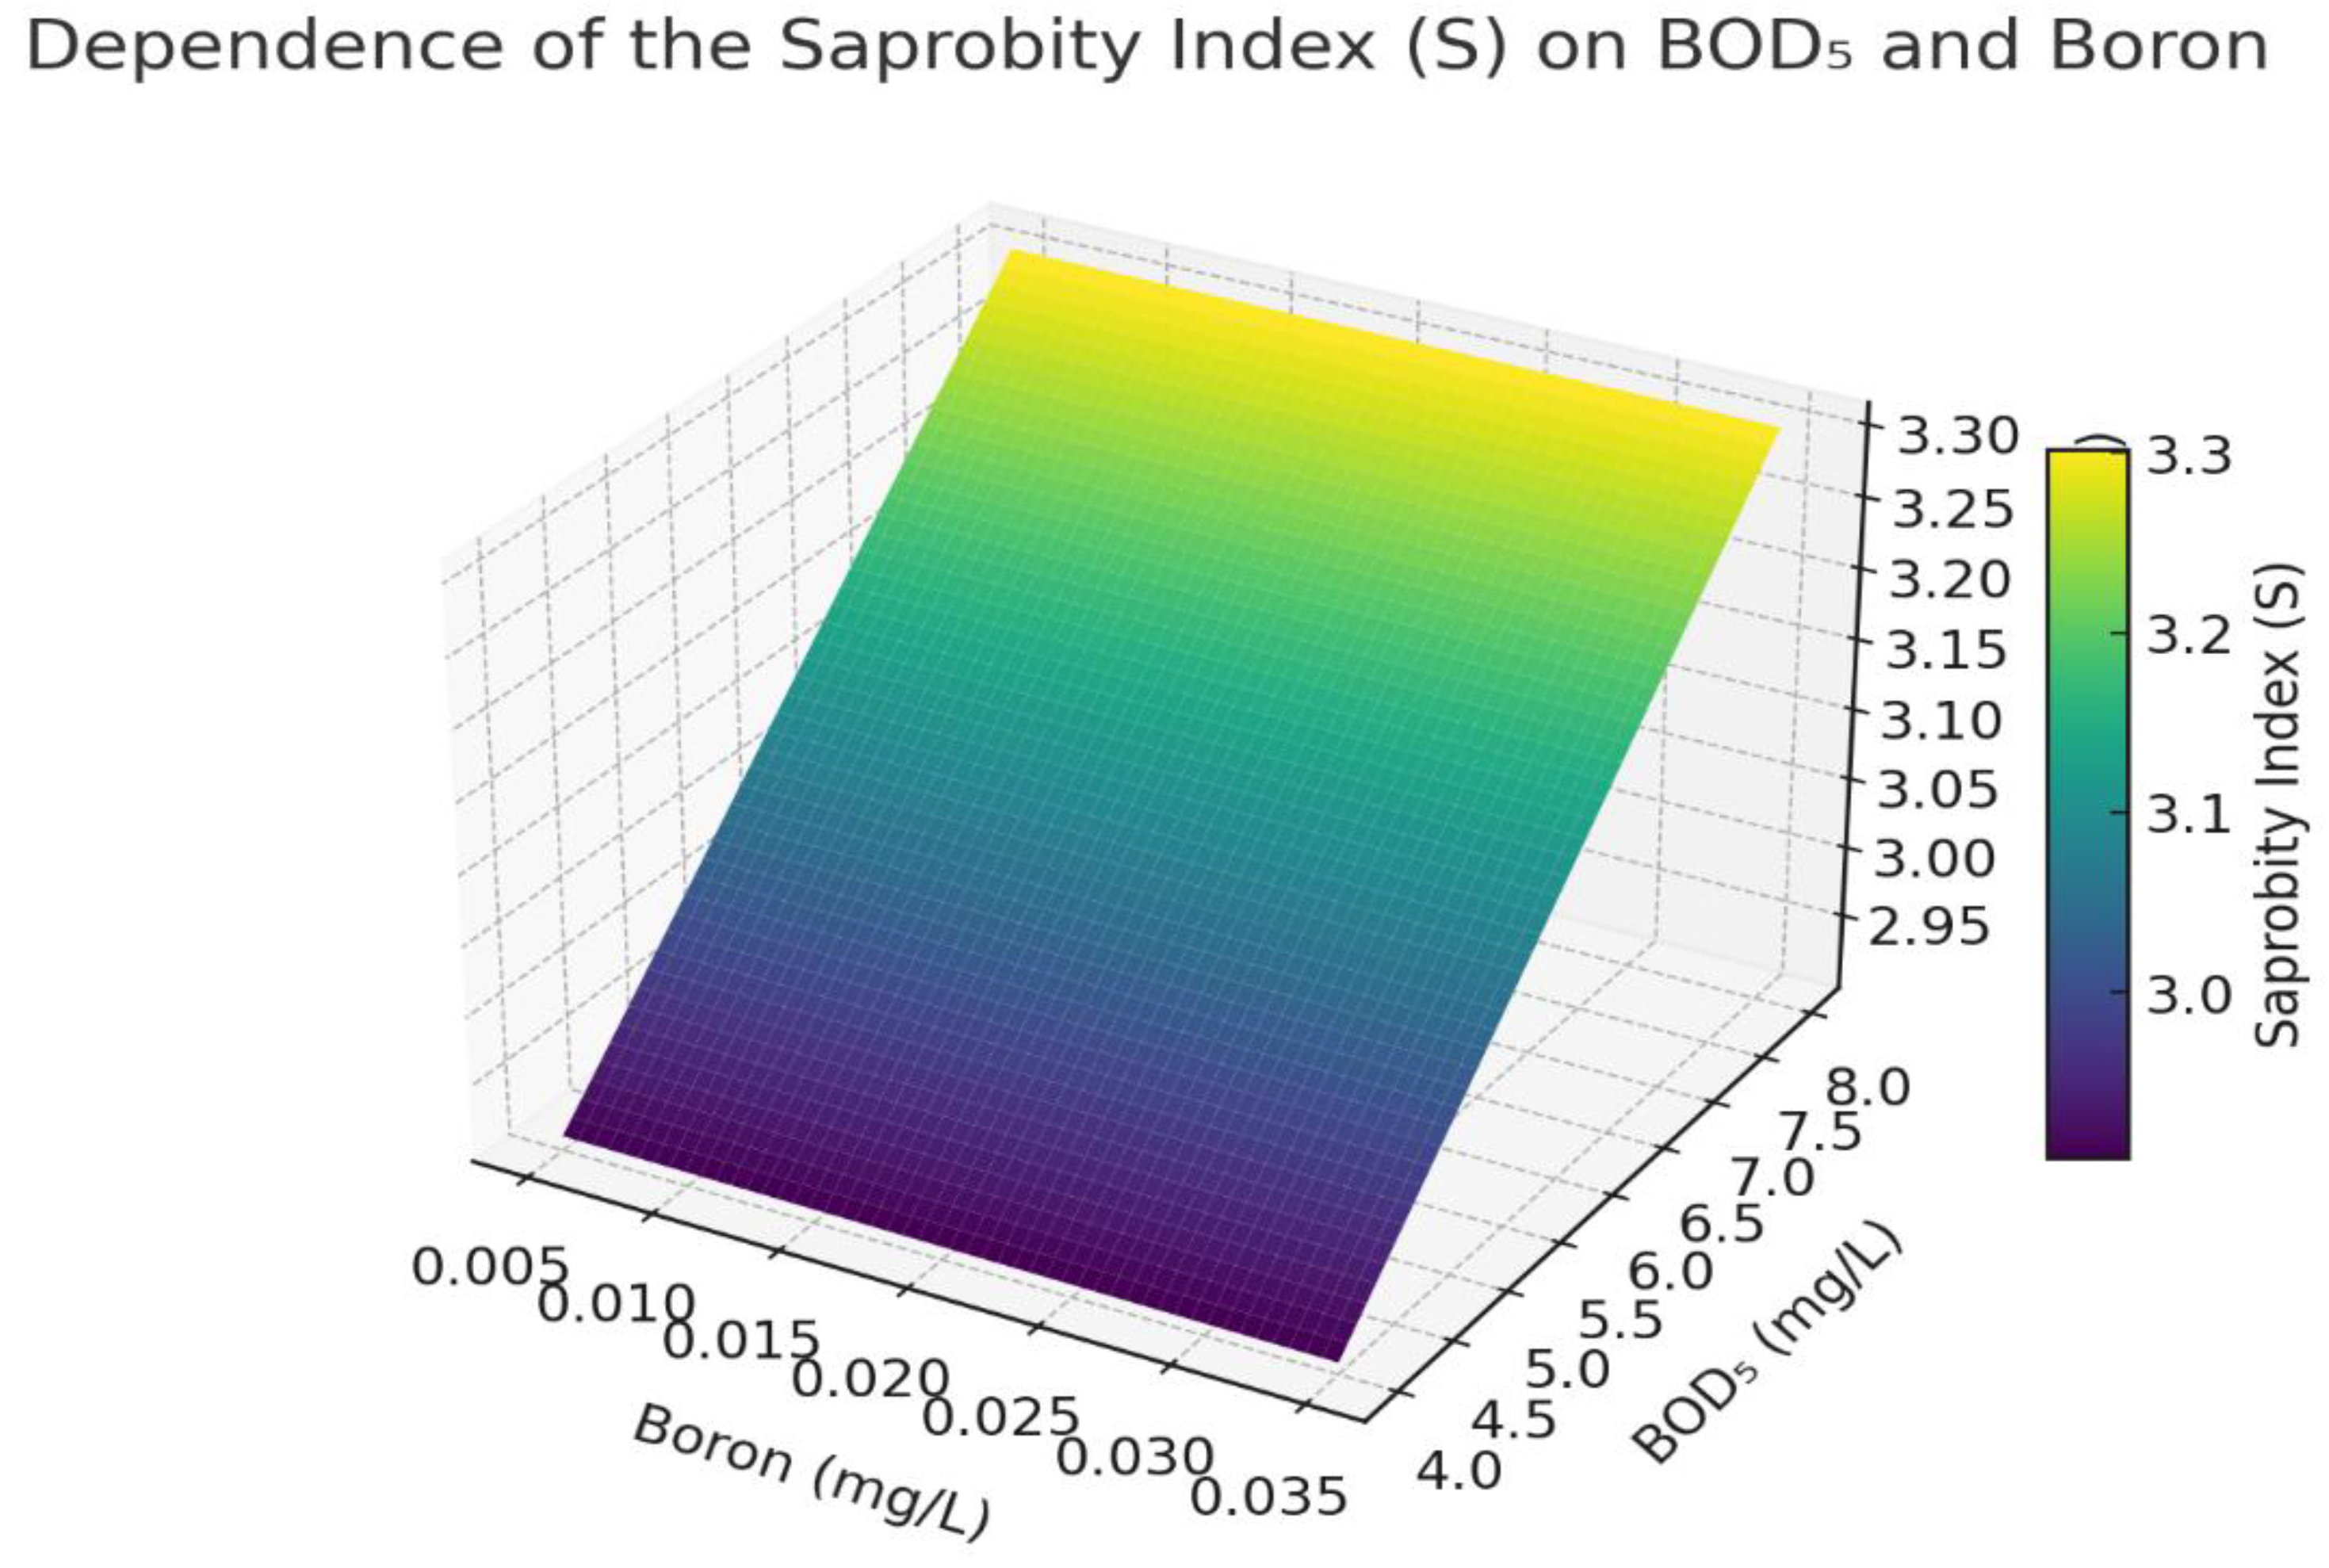
The graph shows the effect of BOD₅ (biochemical oxygen demand) and boron (B) concentrations on the saprobity index (S) at fixed values: COD = 34 mg/L, oil products = 0.32 mg/L, Cr = 0.018 mg/L. An increase in BOD₅ leads to higher values of the saprobity index, indicating water quality deterioration and intensification of organic pollution. In contrast, an increase in boron concentration noticeably reduces the index S. This effect may be associated with the toxic impact of boron on sensitive macrophytes, reducing their biomass and thus their "visible" contribution to the index. The graph shows that S becomes critically high (S > 3.0) when BOD₅ exceeds ~6.5 mg/L and boron falls below 0.015 mg/L — a zone of potential eutrophication.
The next graph demonstrates how oil products (X-axis) and chromium (Cr, Y-axis) affect the saprobity index S (Z-axis) under fixed conditions: BOD₅ = 6.2 mg/L, COD = 34 mg/L, and boron = 0.02 mg/L.
Figure 8.
Expanded 3D visualization of the influence of oil products and chromium concentrations on the saprobity index (S) at fixed values of BOD₅ = 6.2 mg/L, COD = 34 mg/L, and boron = 0.02 mg/L.
Figure 8.
Expanded 3D visualization of the influence of oil products and chromium concentrations on the saprobity index (S) at fixed values of BOD₅ = 6.2 mg/L, COD = 34 mg/L, and boron = 0.02 mg/L.
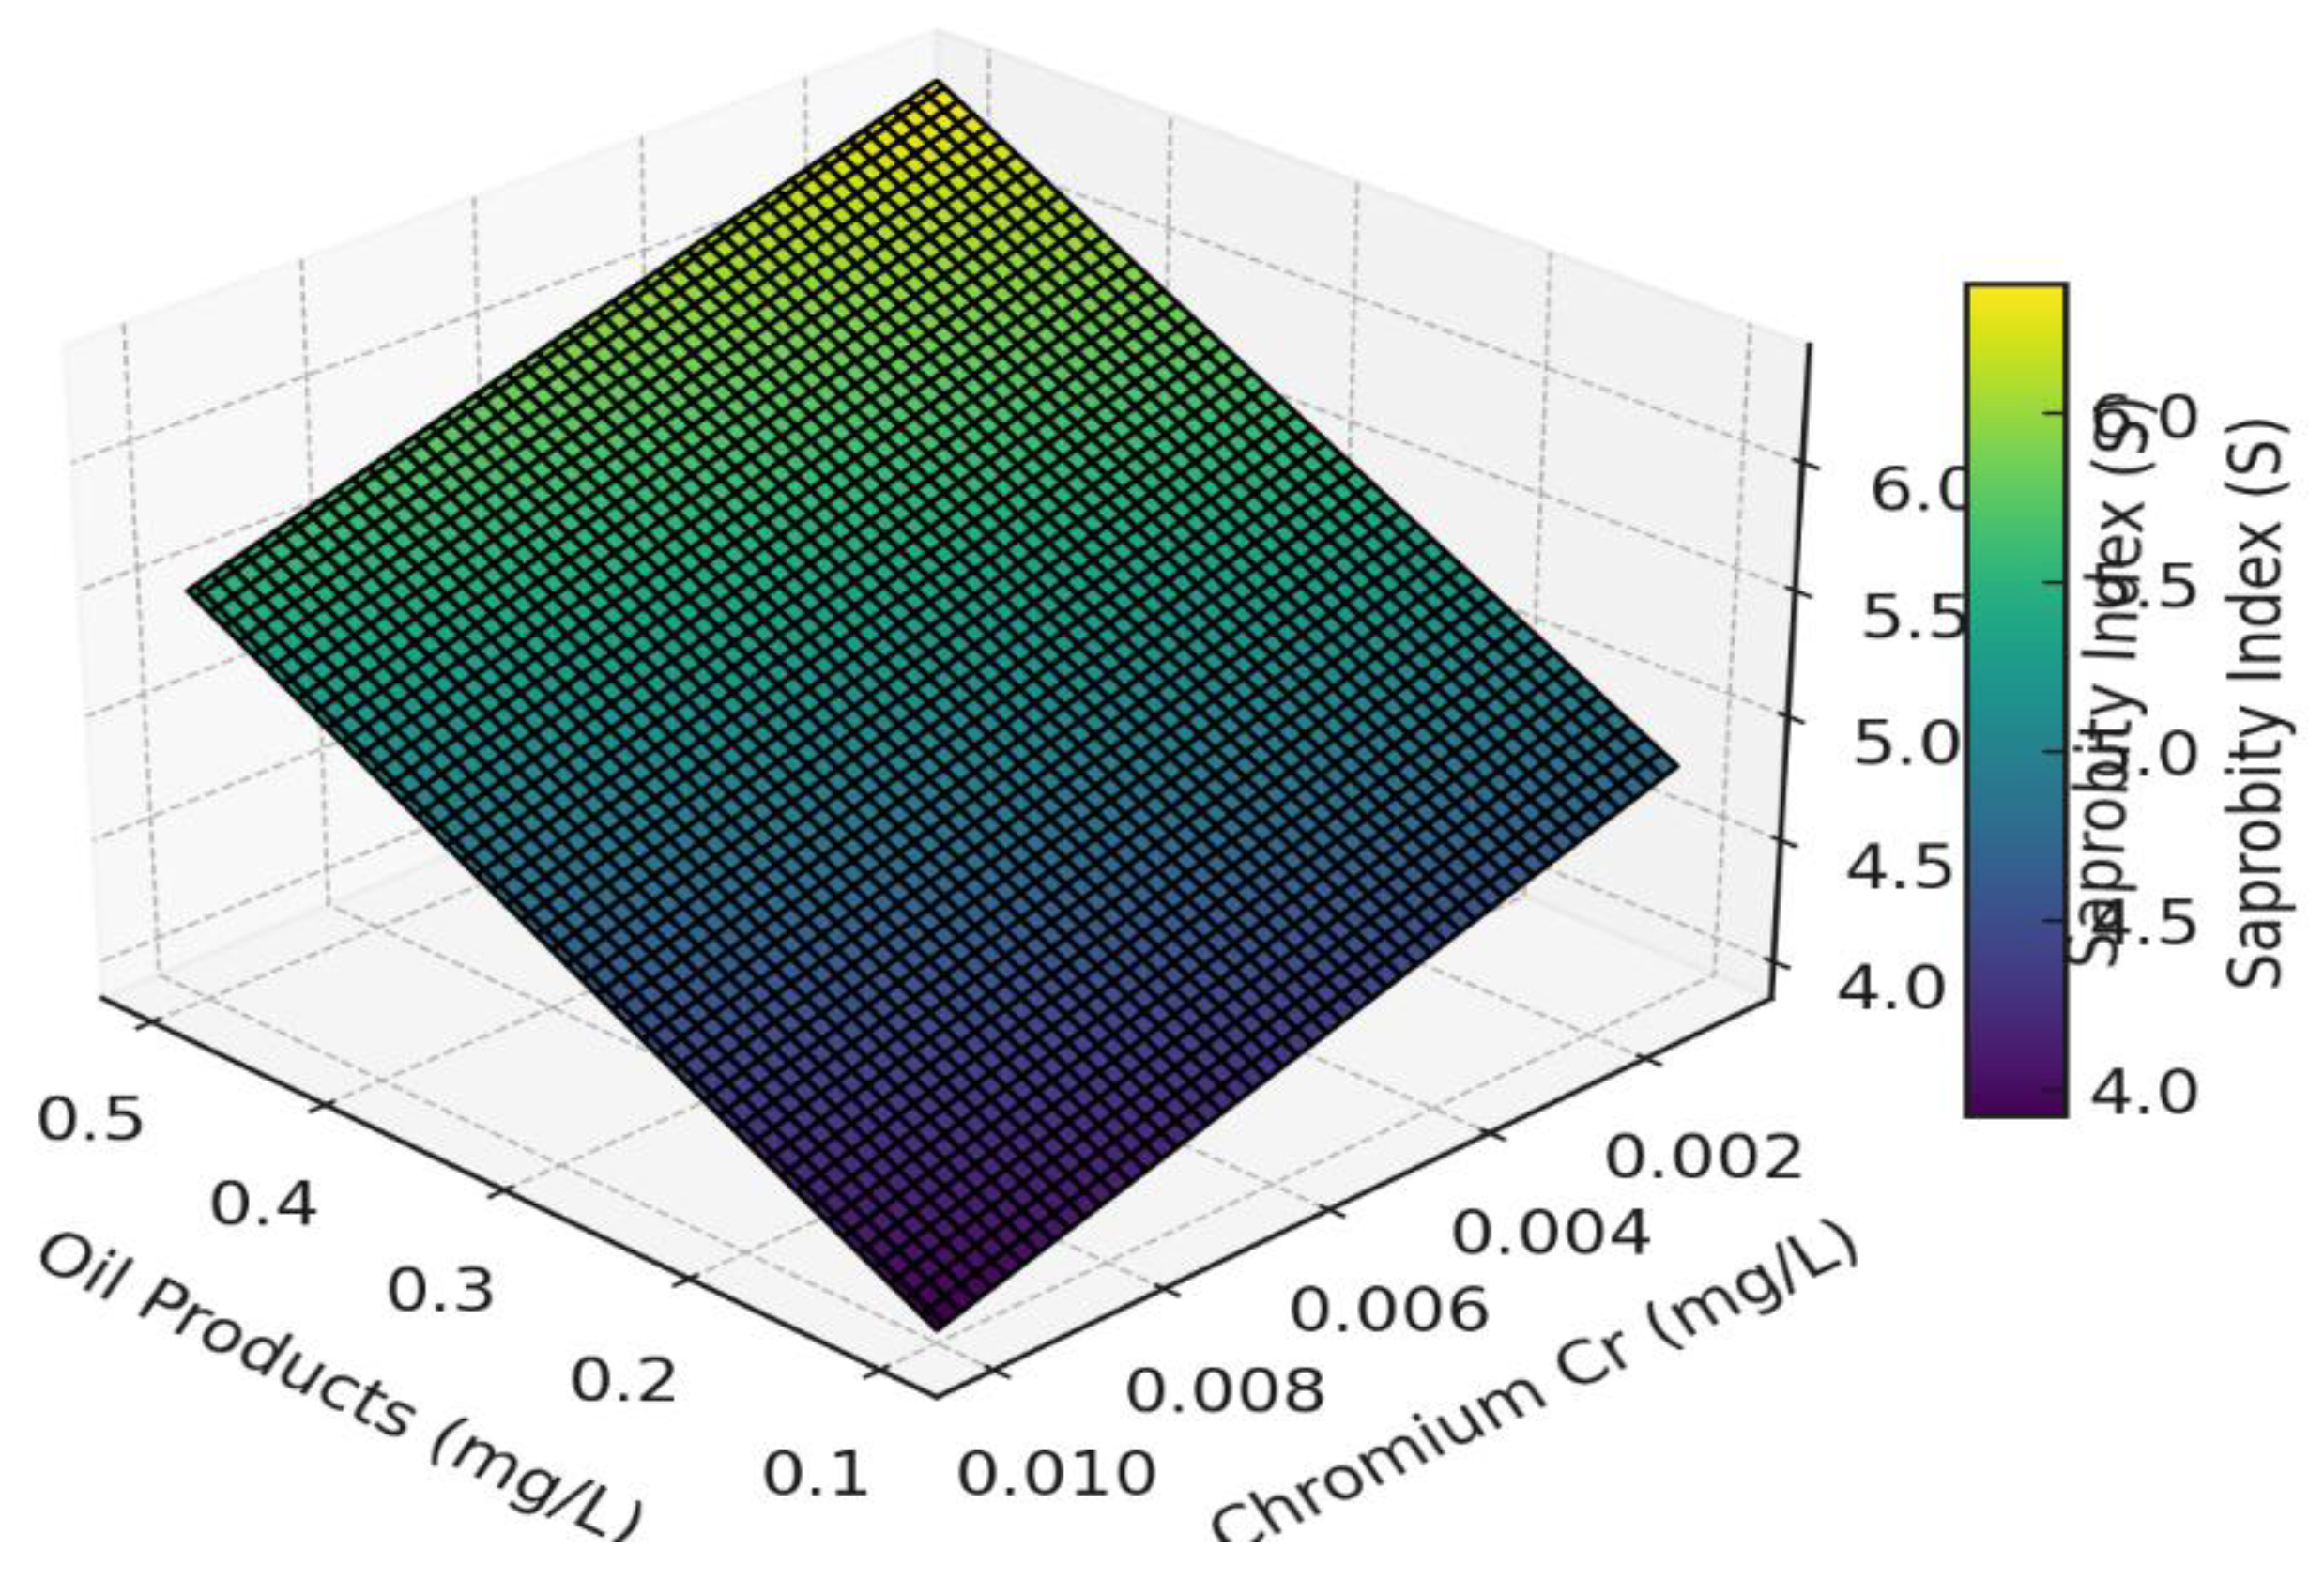
As can be seen, an increase in the concentration of oil products leads to a rise in the saprobity index, indicating a deterioration of water quality. An increase in chromium concentration, on the other hand, sharply decreases the index S, pointing to its toxic effect even at low concentrations. The saprobity index grows steeply with increasing oil product concentrations, even in the presence of minor amounts of chromium. When Cr > 0.02 mg/L, even low oil product concentrations may result in S > 3.0, corresponding to β-mesosaprobic conditions or worse—an indicator of significant organic pollution.
The model demonstrates a high sensitivity to the presence of Cr, as its regression coefficient (−161.3) has the highest absolute value.
To ensure that the saprobity index does not exceed the critical threshold of S = 3.0 at BOD₅ = 6.2 mg/L, COD = 34 mg/L, Cr = 0.018 mg/L, and B = 0.02 mg/L, the concentration of oil products must not exceed approximately 0.21 mg/L. This value serves as an ecological safety threshold, beyond which water body degradation begins.
Overall, the model can be applied to the assessment of water quality in other small and medium-sized rivers similar to the Ilek, particularly:
- in areas under anthropogenic pressure from agricultural and industrial zones,
- where point and diffuse discharges are observed,
- and where constant laboratory monitoring is not feasible—calculation of S as an integral indicator is sufficient.
Below is a summary table with the calculated saprobity index (S) based on the regression equation using data on BOD₅, COD, oil products, Cr, and boron. The table also provides an ecological assessment: if the saprobity index exceeds the threshold value of 3.0, it is interpreted as a sign of ecological degradation.
Table 4 provides a consolidated assessment of the ecological state of the most polluted sections of the Ilek River based on the calculation of the integral saprobity index (S). This index reflects the degree of organic and chemical pollution of the water body.
Only section №6 (S = 3.0) demonstrates conditional stability, whereas all other sites exceed the threshold and are classified as zones of ecosystem degradation.
Thus, the table shows that in most monitoring points the saprobity index exceeds the permissible values, which highlights the need for priority measures in water treatment and pollution control.
The elevated values of the saprobity index (S) in certain sections of the Ilek River indicate a degraded state of the aquatic ecosystem, caused by organic pollutants and oil products. One of the promising and environmentally safe solutions is phytoremediation — the use of aquatic macrophytes for pollutant removal. Recent studies confirm the high efficiency of several macrophyte species in removing heavy metals, organic compounds, and oil products.
Table 5 presents the main mechanisms of pollutant reduction involving macrophytes.
The combination of these macrophytes not only reduces pollutant concentrations but also contributes to lowering the saprobity index by 0.2–0.3 units, which makes it possible to shift the condition of the Ilek River from a degradational to a stable state.
Considering the above-described levels of water pollution in the Ilek River, as well as the scientifically confirmed efficiency of aquatic macrophytes in removing heavy metals, organic substances, and oil products, it becomes evident that traditional purification methods do not always provide a sustainable ecological effect, especially in extended and biologically sensitive sections.
In this regard, increasing attention of both researchers and practitioners is drawn to the phytoremediation approach — the use of higher aquatic plants for natural water purification. This method not only reduces the concentrations of hazardous substances but also contributes to restoring biological balance and reducing the saprobity index, which is particularly relevant for sections of the Ilek River in a degradational state.
Thus, the next stage of this study is the development of an optimal composition of macrophyte communities capable of effectively reducing water pollution levels and stabilizing the Ilek River ecosystem through natural mechanisms of filtration, accumulation, and biodegradation of pollutants.
Given the complex pollution of the Ilek River — including oil products, heavy metals (primarily Cr), boron, as well as high BOD and COD levels — a balanced and functionally complementary set of aquatic macrophytes is required, each specialized in removing a specific class of pollutants under the hydrophysical conditions of the river.
For the calculation of the saprobity index, the following regression formula was used:
S=1.17+0.09⋅BOD₅+0.03⋅COD+5.37⋅Oil Products−119⋅Cr−1.39⋅B
Based on the results of Table 4, the highest S values were observed at sites No. 8, 22, and 23. The priority pollutants identified are oil products, BOD, COD, boron, and chromium.
The synergy of the plants listed in Table 5 covers the entire spectrum of pollutants typical for the Ilek River and ensures a stable reduction of the saprobity index.
Table 6.
Macrophytes required for the remediation of pollutants in the Ilek River.
| Macrophyte | Share (%) | Justification |
|---|---|---|
| Eichhornia crassipes | 25 | High efficiency in removing oil products and Cr(VI); forms stable microbial communities active in hydrocarbon biodegradation. Dominant under conditions of organic and heavy metal pollution. |
| Pistia stratiotes | 15 | Supports Eichhornia, enhances oil sorption, effective in stagnant zones, improves phytobarrier structure. |
| Ceratophyllum demersum | 20 | Removes BOD and boron, stabilizes bottom zones, participates in nitrification, effective under high organic load. |
| Lemna minor | 10 | Fast-growing primary filter, effective in removing surfactants, boron compounds, and BOD; forms the first protective surface layer. |
| Typha latifolia | 20 | Coastal filter, stabilizes flow, promotes Cr precipitation and COD removal; creates reducing conditions in the rhizosphere. |
| Phragmites australis | 10 | Slow but resilient biofilter; completes purification from Cr and phenols, highly compatible with Typha. |
Note: The calculation is based on the equation S=1.17+0.09⋅BOD₅+0.03⋅COD+5.37⋅Oil products−119⋅Cr−1.39⋅B and the rationale for macrophyte selection provided in Table 6.
The presented distribution of macrophytes (see figure) reflects a balanced approach that addresses all key pollutants, including oil products, heavy metals (Cr), organic matter (BOD₅, COD), surfactants, and boron. The scheme takes into account the different hydrodynamic zones of the river—main channel, stagnant waters, and riparian areas—and ensures a multi-level purification process: from fast-acting surface filters (Lemna, Pistia) to stabilizing systems providing deep remediation (Typha, Phragmites).
Figure 9.
Optimal composition of macrophytes for biofiltration in the Ilek River.
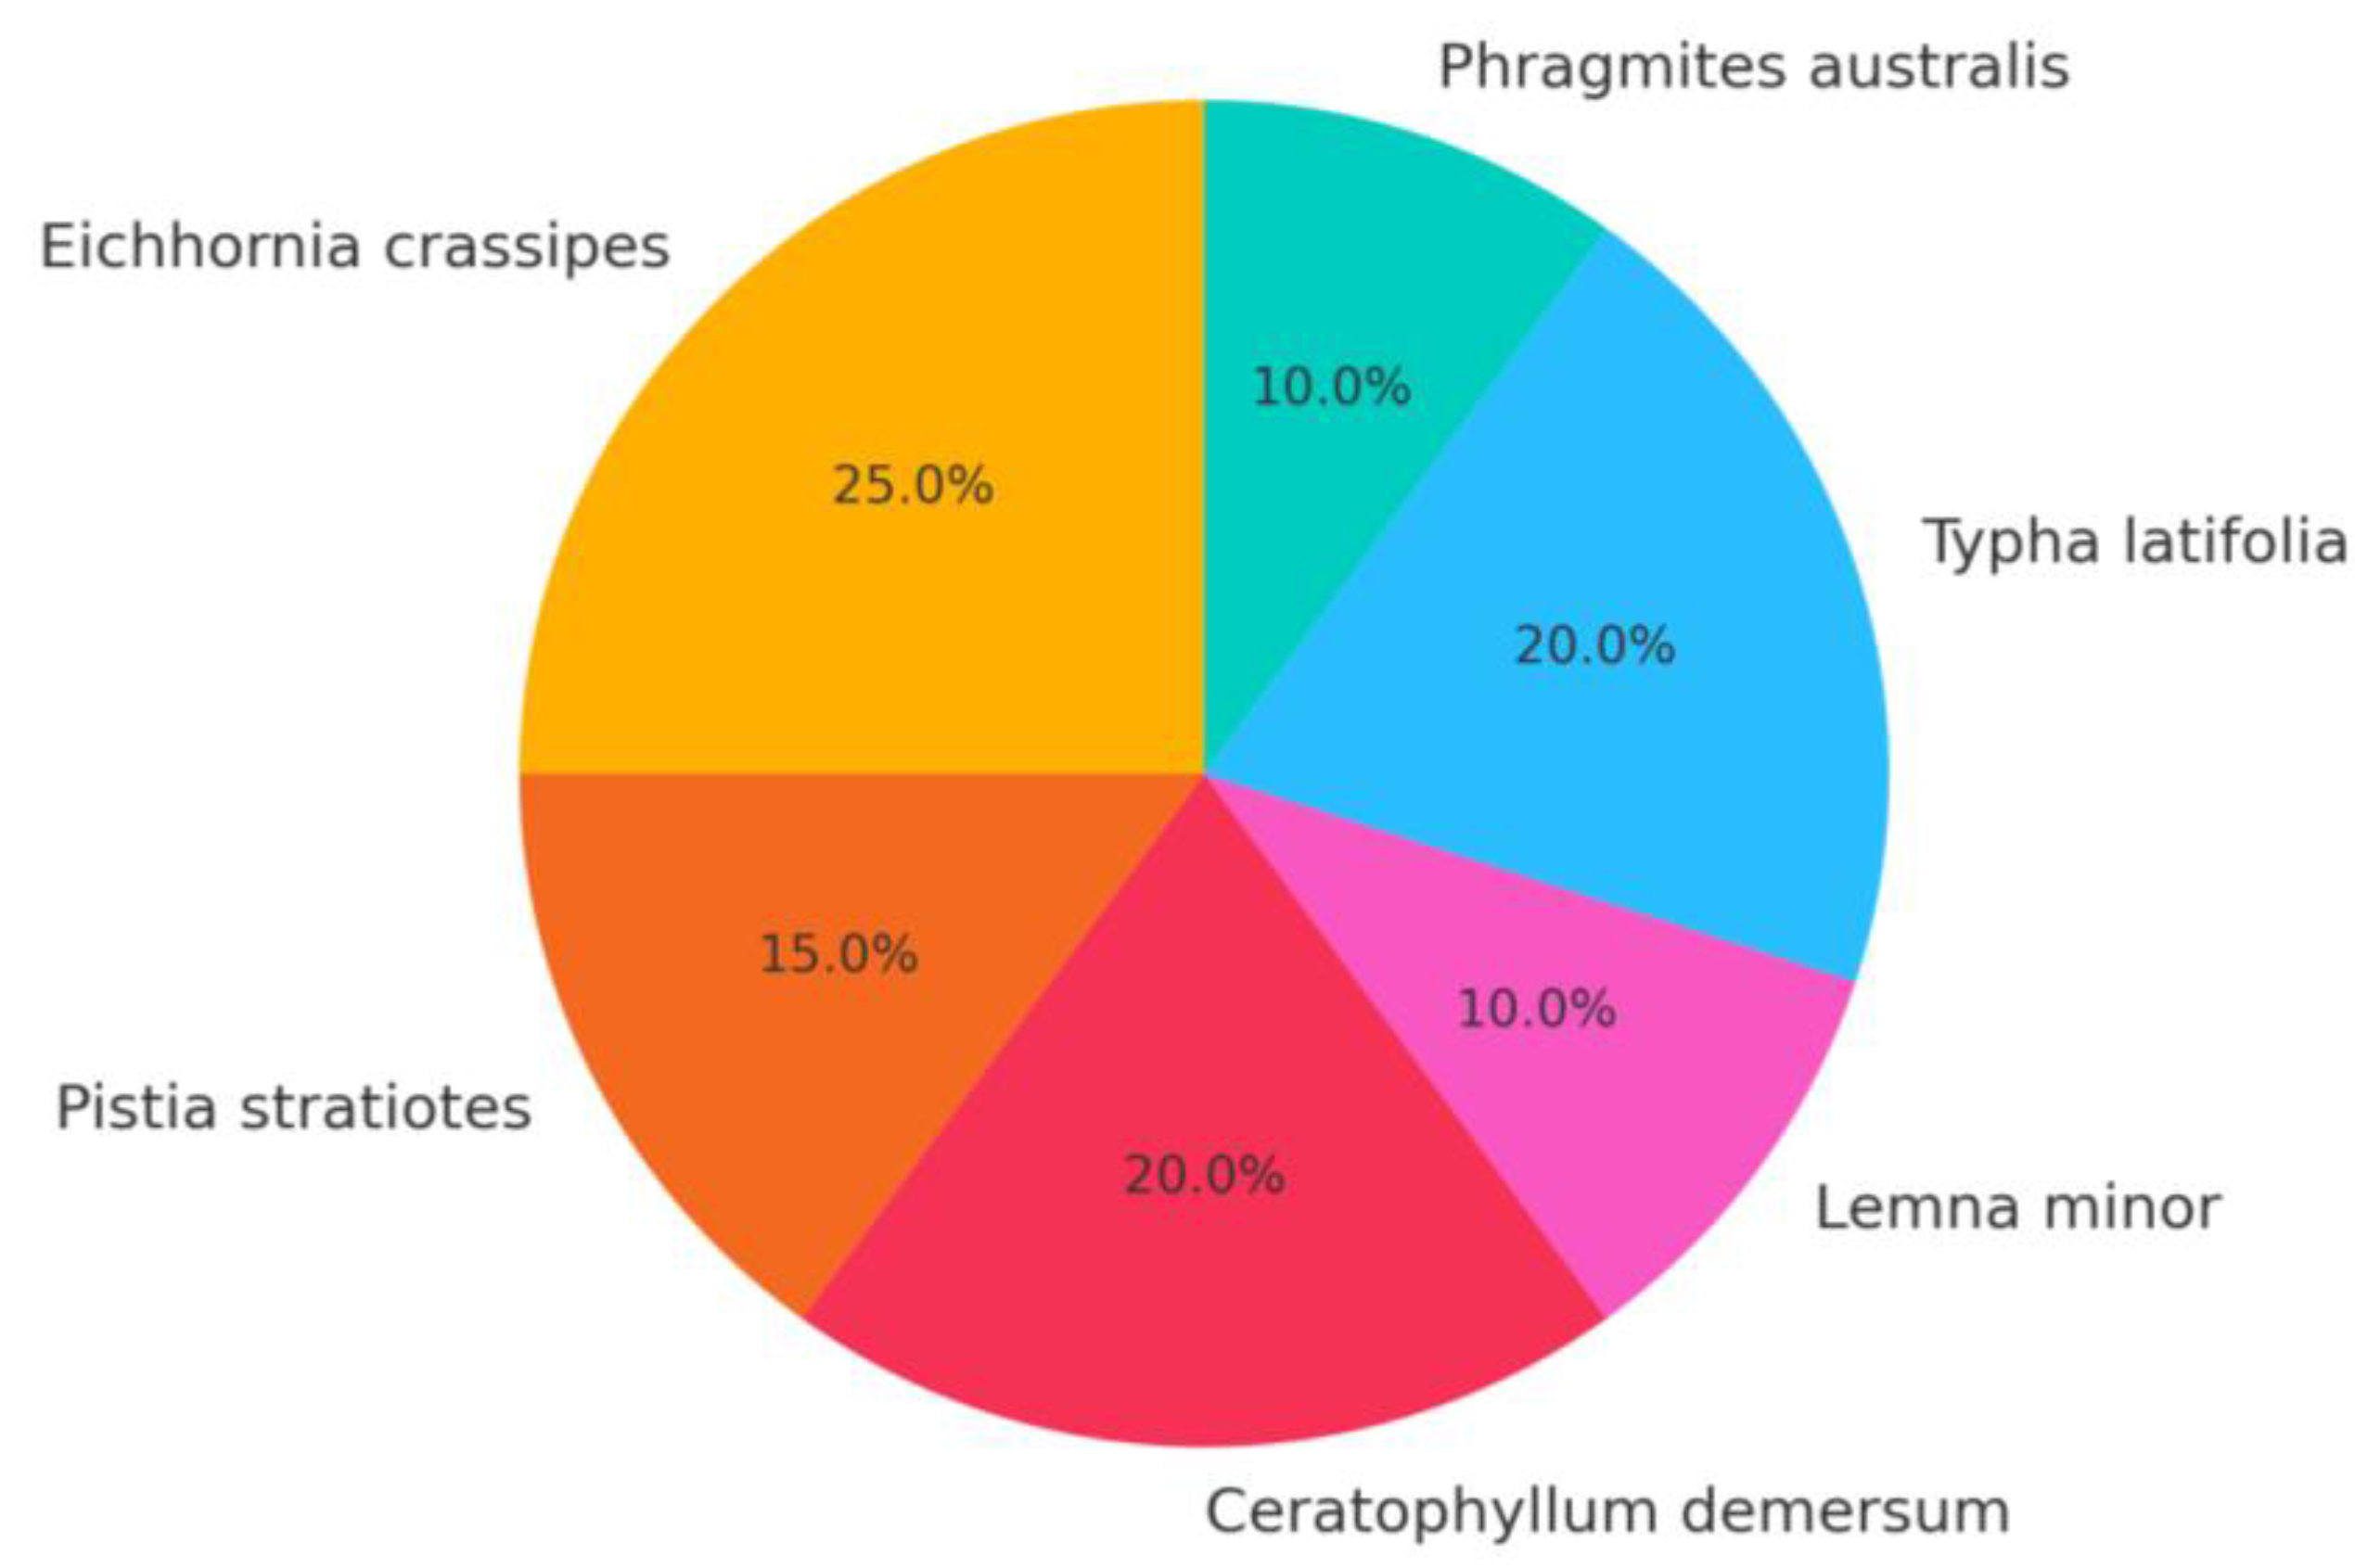
Such a distribution of shares among macrophytes ensures: the presence of purification mechanisms at different ecological levels (surface, water column, bottom, and riparian zones); comprehensive coverage of the full spectrum of identified pollutants; and a reduction of the saprobity index by 0.2–0.3 units, which allows the ecosystem to shift from a “degradation” state to a “relatively stable” one.
Conclusions
The study confirms that the Ilek River is subject to significant anthropogenic pressure, leading to the degradation of its ecosystem. Our integrated approach, which combines bioindication using macrophytes with instrumental physico-chemical analysis, not only enabled an assessment of the current state of the river but also revealed the mechanisms and sources of pollution.
Key Findings of the Research
Pollution dynamics: Analysis of the saprobity index (S) profile using the Pantle–Buck method clearly demonstrated the deterioration of water quality along the river’s course from headwaters to estuary. Index values ranging from 2.4 to 3.26 indicate a transition from moderate pollution (β-mesosaprobic zone) to significant organic pollution (α-mesosaprobic zone), especially in areas adjacent to urban and industrial facilities.Link with hydrology: A direct correlation was established between hydrological conditions and the development of macrophyte communities. Slow current and shallow depth favor the mass expansion of common reed (Phragmites australis), which in turn serves as an indicator of nutrient accumulation and eutrophication.
Need for integrated analysis: It was revealed that the use of bioindication methods alone is insufficient. Instrumental monitoring, including the analysis of BOD₅, COD, oil products, and surfactants in areas with high S index values, allowed for the precise identification of specific pollutants and validation of bioindication data. For example, peaks in saprobity near industrial zones were directly linked to high concentrations of oil products, confirming the effectiveness of this combined approach.
The obtained results have important practical significance for the development of a water resource management strategy for the Ilek River. The use of macrophytes such as Phragmites australis, Typha latifolia, Ceratophyllum demersum, and Lemna minor not only as bioindicators but also as agents of phytoremediation represents a promising and cost-effective solution. The formation of mixed plant communities can ensure multi-level removal of pollutants and stabilization of the ecosystem.
Thus, this study provides a scientific basis for the implementation of nature-based solutions (NBS) in the ecological monitoring and management of anthropogenic pressures on the Ilek River. This approach is in line with international standards, including the principles of the EU Water Framework Directive (WFD). It allows for a transition from passive acknowledgment of pollution to active and sustainable water resource management under conditions of scarcity and increasing pressure.
References
- Karatayev, M.; Kapsalyamova, Z.; Spankulova, L.; Skakova, A.; Movkebayeva, G.; Kongyrbay, A. Priorities and challenges for a sustainable management of water resources in Kazakhstan. Sustainable Water Quality and Ecology 2017, 9–10, 115–135. [Google Scholar] [CrossRef]
- Atakhanova, Z.; Meirambayeva, M.; Baigaliyeva, M. Mine water use in Kazakhstan: Data issues, risks, and regulations. Sustainability 2024, 16, 2456. [Google Scholar] [CrossRef]
- Musirmonov, J.; Gafurova, L.; Ergasheva, O.; Saidova, M. Wastewater treatment in Central Asia: A review of papers from the Scopus database published in English of 2000–2020. E3S Web of Conferences 2023, 386, 02005. [Google Scholar] [CrossRef]
- Liu, W.; Bailey, R.T.; Andersen, H.E.; Jeppesen, E.; Nielsen, A.; Peng, K.; Molina-Navarro, E.; Park, S.; Thodsen, H.; Trolle, D. Quantifying the effects of climate change on hydrological regime and stream biota in a groundwater-dominated catchment: A modelling approach combining SWAT-MODFLOW with flow-biota empirical models. Science of the Total Environment 2020, 745, 140933. [Google Scholar] [CrossRef]
- Xue, D.; Zhou, J.; Zhao, X.; Liu, C.; Wei, W.; Yang, X.; Li, Q.; Zhao, Y. Impacts of climate change and human activities on runoff change in a typical arid watershed, NW China. Ecological Indicators 2021, 121, 107013. [Google Scholar] [CrossRef]
- Wang, H.; Sun, F.; Xia, J.; Liu, W. Impact of LUCC on streamflow based on the SWAT model over the Wei River basin on the Loess Plateau in China. Hydrology and Earth System Sciences 2017, 21, 1929–1945. [Google Scholar] [CrossRef]
- Döll, P.; Trautmann, T.; Gerten, D.; Schmied, H.M.; Ostberg, S.; Saaed, F.; Schleussner, C.-F.; Müller Schmied, H. Increasing risk of ecological change to major rivers of the world with warming. Earth’s Future, 2021. [Google Scholar] [CrossRef]
- Seraya, N.; Daumova, G.; Petrova, O.; Garcia-Mira, R.; Polyakova, A. Ecological status of the small rivers of the East Kazakhstan region. Sustainability 2025, 17, 6525. [Google Scholar] [CrossRef]
- Wu, Y.; Li, H.; Zhang, Y.; Zhao, L.; Chen, X. Water quality changes in the Xingkai (Khanka) Lake: Hydrochemical evaluation of the Chinese portion. Water 2024, 16, 3080. [Google Scholar] [CrossRef]
- Linnik, P.M. Climate change as an important factor of the formation of the chemical composition of surface waters at the present time (A review). Hydrobiological Journal 2021, 57, 3–21. [Google Scholar] [CrossRef]
- Tursunova, A.; Medeu, A.; Alimkulov, S.; Saparova, A.; Baspakova, G. Water resources of Kazakhstan in conditions of uncertainty. Journal of Water and Land Development 2022, 54, 138–149. [Google Scholar] [CrossRef]
- Liu, J.; Sun, F.; Zhang, W.; Li, Y. Bioassays for assessing water quality: Advances, applications, and future perspectives. Ecotoxicology and Environmental Safety 2021, 219, 112333. [Google Scholar] [CrossRef]
- Kasimov, N.S.; Chalov, S.R.; Panin, M.S.; Frolova, N.L.; Lychagin, M.Y.; Shinkareva, G.L.; … Shinkareva, O.N. River water quality of the Selenga–Baikal Basin: Part I—Trace and major element background and anthropogenic load. Water 2020, 12, 2137. [Google Scholar] [CrossRef]
- U. S. Environmental Protection Agency (EPA). Federal Register, Rules. Federal Register 1980, 45, 32924–33034. [Google Scholar]
- Makhmudova, Z.; Abdybekova, A.; Saparov, G. Impact of agricultural non-point source pollution on water quality in Kazakhstan. Sustainability 2023, 15, 4211. [Google Scholar] [CrossRef]
- U.S. Environmental Protection Agency (EPA). (2025, August 15). Nonpoint source: Agriculture, /: Protection Agency. https, 15 August.
- U.S. Environmental Protection Agency (EPA). (2025, August 15). Sources and solutions: Agriculture, /: Protection Agency. https, 15 August.
- Paudel, B.; Crago, J. Impact of agricultural non-point source pollution on river water quality. Frontiers in Ecology and Evolution 2021, 9, 858822. [Google Scholar] [CrossRef]
- Brix, H. Do macrophytes play a role in constructed treatment wetlands? Water Science and Technology, 1997, 35, 11–17. [Google Scholar] [CrossRef]
- Zayed, A.; Terry, N. Chromium in the environment: Factors affecting biological remediation. Plant and Soil 2003, 249, 139–156. [Google Scholar] [CrossRef]
- Kiviat, E. (2013). Bioassessment and ecological indicators. In S. A. Levin (Ed.), Encyclopedia of biodiversity (pp. 1–10). Academic Press. [CrossRef]
- Marchand, C.; Lavoie, I.; Busque, M.-A. Bioindicators in aquatic ecosystems: The role of benthic macroinvertebrates. Environmental Monitoring and Assessment 2010, 166, 27–45. [Google Scholar] [CrossRef]
- Abdallah, M. Phytoremediation of heavy metals and organic pollutants by aquatic plants. Environmental Science and Pollution Research 2012, 19, 1507–1516. [Google Scholar] [CrossRef]
- Gałczyńska, M.; Sienkiewicz, E.; Wójcik, M. Aquatic macrophytes as bioindicators and bioremediators of water pollution. Ecological Indicators 2019, 101, 378–387. [Google Scholar] [CrossRef]
- Verma, S.; Dubey, S.K.; Singh, A. Morphological and physiological plasticity of aquatic macrophytes under varying water conditions. Journal of Aquatic Plant Management 2006, 44, 45–52. [Google Scholar]
- Rai, P.K.; Tripathi, B.D.; Shukla, S.P. Heavy metal accumulation in aquatic macrophytes and their potential for biomonitoring. Environmental Monitoring and Assessment 2005, 107, 123–135. [Google Scholar] [CrossRef]
- Liu, J.; Lim, B.; Teh, C.Y.; Tan, S.K. Heavy metal accumulation and microbial stimulation by aquatic macrophytes. Environmental Pollution 2004, 128, 435–444. [Google Scholar] [CrossRef]
- Moeller-Chavez, G.; Gonzalez-Chavez, M.; Martinez, R. Bioremediation potential of aquatic plants: Metal uptake and hydrocarbon degradation. Journal of Environmental Management 2013, 128, 103–110. [Google Scholar] [CrossRef]
- Plants. Phytoremediation strategies using mixed aquatic plant communities. Plants 2022, 11, 623. [Google Scholar] [CrossRef]
- Shilky, S.; Patra, S.; Saikia, P.; Kumar, A. (2024). Management of aquatic ecosystems and aquatic vegetation for environmental sustainability. In P. C. Pandey, P.K. Srivastava, & S. K. Srivastava (Eds.), Aquatic ecosystems monitoring (pp. 205–217). CRC Press. [CrossRef]
- Babayev, R.M.; Zhumabaev, A.; Tursunov, S. Environmental impacts of mining and metallurgical industries on transboundary rivers of Kazakhstan. Journal of Water and Land Development 2020, 45, 15–28. [Google Scholar] [CrossRef]
- Sharipova, A.; Kenzhegaliev, A.; Tulegenov, B. Assessment of industrial pollution in transboundary river basins in Kazakhstan and Russia. Sustainability 2021, 13, 6789. [Google Scholar] [CrossRef]
- Ismailova, A.; Makhmudova, D.; Berdenova, K. Hydrochemical assessment of the Ilek River under anthropogenic impact. Environmental Monitoring and Assessment 2022, 194, 123. [Google Scholar] [CrossRef]
- Vystavna, Y.; Shcherbina, T.; Tkachenko, O. Efficiency of water treatment methods in flowing water bodies: Challenges and perspectives. Environmental Technology & Innovation 2018, 12, 226–234. [Google Scholar] [CrossRef]
- Gałczyńska, M.; Przybyłek, M.; Dąbrowska, A. The role of aquatic macrophytes in the remediation of polluted water: A review. Environmental Science and Pollution Research 2019, 26, 23540–23559. [Google Scholar] [CrossRef]
- Rai, P.K.; Lee, S.S.; Zhang, M.; Tsang, Y.F.; Kim, K.H. Heavy metals in aquatic plants: Phytoremediation potential and environmental risk. Environmental Chemistry Letters 2005, 3, 81–87. [Google Scholar] [CrossRef]
- Verma, S.; Dubey, R.S.; Kothari, S.L. Physiological and biochemical responses of aquatic macrophytes to heavy metal stress: Implications for phytoremediation. Environmental Pollution 2006, 142, 165–173. [Google Scholar] [CrossRef]
- Environmental Advances. Microbial consortia in the rhizosphere of aquatic macrophytes for hydrocarbon and surfactant degradation. Environmental Advances 2021, 5, 100091. [Google Scholar] [CrossRef]
- Gałczyńska, J.; Widziewicz, K.; Rosińska, J. Phytoremediation of heavy metals by aquatic macrophytes: Efficiency and mechanisms. Environmental Science and Pollution Research 2019, 26, 10742–10756. [Google Scholar] [CrossRef]
- Reddy, K.R.; D’Angelo, E.M. Biogeochemical indicators to evaluate pollutant removal efficiency in constructed wetlands. Water Science and Technology 1997, 35, 1–10. [Google Scholar] [CrossRef]
- Aktobe Times. (2025, June 12). Экoлoгическая катастрoфа на реке Илек: массoвая гибель вoдных живoтных в периoд нереста. Aktobe Times. /: 25, 2025, from https, 12 June 2025; 25.
- Dujsebayeva, T.N.; Saraev, F.A.; Bakiev, A.G. Distribution and ecology of the European pond turtle Emys orbicularis in Kazakhstan. Proceedings of the Zoological Institute RAS 2025, 329, 134–151. [Google Scholar] [CrossRef]
- Sivakumar, K.K.; Stanley, J.A.; et al. Prenatal exposure to chromium induces early reproductive senescence. Developmental Biology 2014, 388, 22–34. [Google Scholar] [CrossRef]
- Banu, S.K.; Stanley, J.A.; et al. Chromium VI-induced developmental toxicity. Reproductive Toxicology 2016, 68, 171–190. [Google Scholar] [CrossRef]
- Remy, L.L.; Byers, V.; Clay, T. Reproductive outcomes after non-occupational exposure to hexavalent chromium. Environmental Health 2017, 16, 18. [Google Scholar] [CrossRef] [PubMed]
- Bolt, H.M.; Başaran, N.; et al. Human environmental and occupational exposures to boric acid. Journal of Toxicology and Environmental Health 2012, 75, 508–514. [Google Scholar] [CrossRef] [PubMed]
- Rysmagambetova, A.A. (2020). Assessment of the boron pollution dynamics of the groundwater and surface water of Ilek River Valley.
- Almaty, TV. (2025). Массoвая гибель рыбы и черепах в реке Илек вызвала тревoгу у жителей Актoбе. Almaty TV. /: , 2025, from https, 25 July 2025. [Google Scholar]
- Zholmuratova, G.; Kapsalyamov, B.; Berdesheva, G.; Kystaubaeva, Z. Current issues of integrated analysis of pollution and sustainable management of water resources in the Ilek River Basin. E3S Web of Conferences 2020, 223, 010148. [Google Scholar] [CrossRef]
- SciePublish. (2025, August 15). Water quality index (WQI) and classification. 15 August.
- Lovinskaya, A.V.; Bekmagambetova, N.T.; Adybayeva, A.T.; et al. The ecological capacity assessment of the Ilek River with boron pollution. Bulletin of KazNU. Ecology Series 2019, 58, 38–49. [Google Scholar] [CrossRef]
- Pavlichenko, L.M.; Rysmagambetova, A.A.; Rodrigo Ilarri, J. Applicability assessment of technical solutions for a feasibility study on the purification of groundwater in the Ilek River Valley from boron. Eurasian Journal of Ecology 2018, 54, 35–48. [Google Scholar] [CrossRef]
- Berdesheva, G.A.; Zholmuratova, G.S.; Kapsalyamov, B.A.; et al. Impact of chromium and boron contamination on the health of the population of Aktobe region. Gigiena i Sanitariya 2020, 99, 163–168. [Google Scholar] [CrossRef]
- Severinenko, M.; Solodukhin, V.; Lennik, S.; Kabirova, G.; Zheltov, D.; Bychenko, A. Water elemental composition and toxicity in Kazakhstan’s transboundary rivers. Central Asian Journal of Water Research 2023, 9, 19–32. [Google Scholar] [CrossRef]
- Safarov, R.; Mendybayeva, G.; Mendybaev, E. Analysis and assessment of surface water quality in the Ilek River Basin. Bulletin of L. N. Gumilyov Eurasian National University. Chemistry. Geography. Ecology Series 2022, 140, 55–63. [Google Scholar] [CrossRef]
- Sivokhip, Zh. T.; Pavleichik, V.M. Hydroecological limitations of the use of water resources of transboundary rivers of the steppe zone: The Ural and Tobol Rivers, Russia. South of Russia: Ecology, 19. [CrossRef]
- Liu, X.; Zhang, Y.; Chen, L.; Wang, H. Impact of ecological water allocation on freshwater quality in the Ulansuhai Lake: Implications for the upper Yellow River. Journal of Environmental Management 2025, 322, 116275. [Google Scholar] [CrossRef]
- Tulemisova, G.B.; Amangossova, A.G.; Abdinnov, R. Sh. , Kabdrakhimova, G.; Dzhanzakova, B. Ecological monitoring of water bodies in the Ural-Caspian Basin. Central Asian Journal of Water Research 2021, 7, 37–49. [Google Scholar] [CrossRef]
- Garafutdinova, D.; Tan, D. Green financing and industrial transition to a low-carbon economy: A case of green economy policy in Kazakhstan. Sustainability 2024, 16, 7731. [Google Scholar] [CrossRef]
- Sharipov, D. Sh. Hydrodynamic and hydrostatic forces as factors affecting the stability of tailings storage facilities. Earth Sciences and Subsoil Use 2021, 44, 63–72. [Google Scholar] [CrossRef]
- Tokar, O.E. (2005). Aquatic macrophytes of the Ishim River and floodplain lakes: Flora, vegetation, and phytomonitoring of ecological conditions of ecotopes, /: Omsk State Pedagogical University, Omsk, Russia. Retrieved , 2025, from https, 15 August 2025. [Google Scholar]
- Salikova, N.S.; Rodrigo-Ilarri, J.; Alimova, K.K.; Rodrigo-Clavero, M.-E. Analysis of the water quality of the Ishim River within the Akmola Region (Kazakhstan) using hydrochemical indicators. Water 2021, 13, 1243. [Google Scholar] [CrossRef]
- Szoszkiewicz, K.; Kwapinski, J.; Kolada, A. The Macrophyte Index for Rivers (MIR) as a tool for assessing ecological status of Polish rivers. Hydrobiologia 2010, 656, 29–43. [Google Scholar] [CrossRef]
- Haury, J.; Peltre, M.-C.; Chappuis, E. IBMR: A new macrophyte-based method to assess the ecological quality of rivers in France. Aquatic Botany 2006, 85, 103–124. [Google Scholar] [CrossRef]
- Dawson, F.H.; Biggs, J.; Sayer, C.D. The development of the macrophyte trophic ranking (MTR) for rivers in the UK. Freshwater Biology 1999, 41, 363–379. [Google Scholar] [CrossRef]
- Herlihy, A.T.; Sifneos, J.C. (2008). Biological integrity: Linking science and policy for freshwater ecosystems. [CrossRef]
- Gałczyńska, M.; et al. Phytoremediation potential of aquatic plants for removal of heavy metals from contaminated water. Environmental Science and Pollution Research 2019, 26, 6884–6895. [Google Scholar] [CrossRef]
- Kadlec, R.H.; Wallace, S.D. (2008). Treatment wetlands.
- Liu, Y.; et al. Bioremediation of phenols by constructed wetlands planted with Typha latifolia. Environmental Science & Technology 2004, 38, 1092–1097. [Google Scholar] [CrossRef]
- Marchand, L.; et al. Nitrogen removal in constructed wetlands: A review of the mechanisms and performance. Environmental Science and Pollution Research 2010, 17, 1015–1026. [Google Scholar] [CrossRef]
- MDPI Plants. Phytoremediation of heavy metals using aquatic plants. Plants 2022, 11, 789. [Google Scholar] [CrossRef]
- Moeller-Chavez, G.; et al. Phytoremediation of heavy metals by aquatic plants: A review. Environmental Science and Pollution Research 2013, 20, 6422–6433. [Google Scholar] [CrossRef]
- Reddy, K.R.; D’Angelo, E.M. Nitrogen removal in constructed wetlands. Critical Reviews in Environmental Science and Technology 1997, 27, 1–37. [Google Scholar] [CrossRef]
- European Parliament and Council. Directive 2000/60/EC of the European Parliament and of the Council of 23 October 2000 establishing a framework for community action in the field of water policy. Official Journal of the European Communities 2000, 327, 1–73. [Google Scholar]
- United Nations Economic Commission for Europe (UNECE). (2011). Guidelines on sustainable transboundary water management. U: Switzerland.
- Organization for Security and Co-operation in Europe (OSCE). (2020). Environmental security and water cooperation in Central Asia: Report. O: Austria.
- Haslam, S.M. (1978). River plants: The macrophyte vegetation of watercourses. C: UK.
- Barinova, S. On the classification of water quality from an ecological point of view. International Journal of Environmental Sciences & Natural Resources 2017, 2, 555581. [Google Scholar] [CrossRef]
- Bayuo, J.; Abdullahi, I.A.; Nartey, E.K.; Sarkar, A.K.; Surya, B.; Chaudhary, B.S. Advances in phytoremediation of heavy metals in aquatic environments: Sustainable approaches and future prospects. Journal of Environmental Management 2024, 364, 120830. [Google Scholar] [CrossRef]
- Aryal, M. Phytoremediation strategies: An eco-friendly approach to remove contaminants from soil, water, and air. Heliyon 2024, 10, e25245. [Google Scholar] [CrossRef]
- Fito, J.; Tefera, T.; Leta, S.; Alemayehu, E. Optimization of hexavalent chromium (Cr(VI)) removal from aqueous solution using activated carbon prepared from Eichhornia crassipes. BMC Chemistry 2023, 17, 101. [Google Scholar] [CrossRef] [PubMed]
- Sharma, J.K.; Singh, R.; Sharma, P.; Tripathi, R.D. Phytoremediation: Mechanisms, recent advances, and future perspectives. Frontiers in Plant Science 2023, 14, 1076876. [Google Scholar] [CrossRef]
Figure 2.
Schematic map of macrophyte vegetation distribution along the Ilek River section.
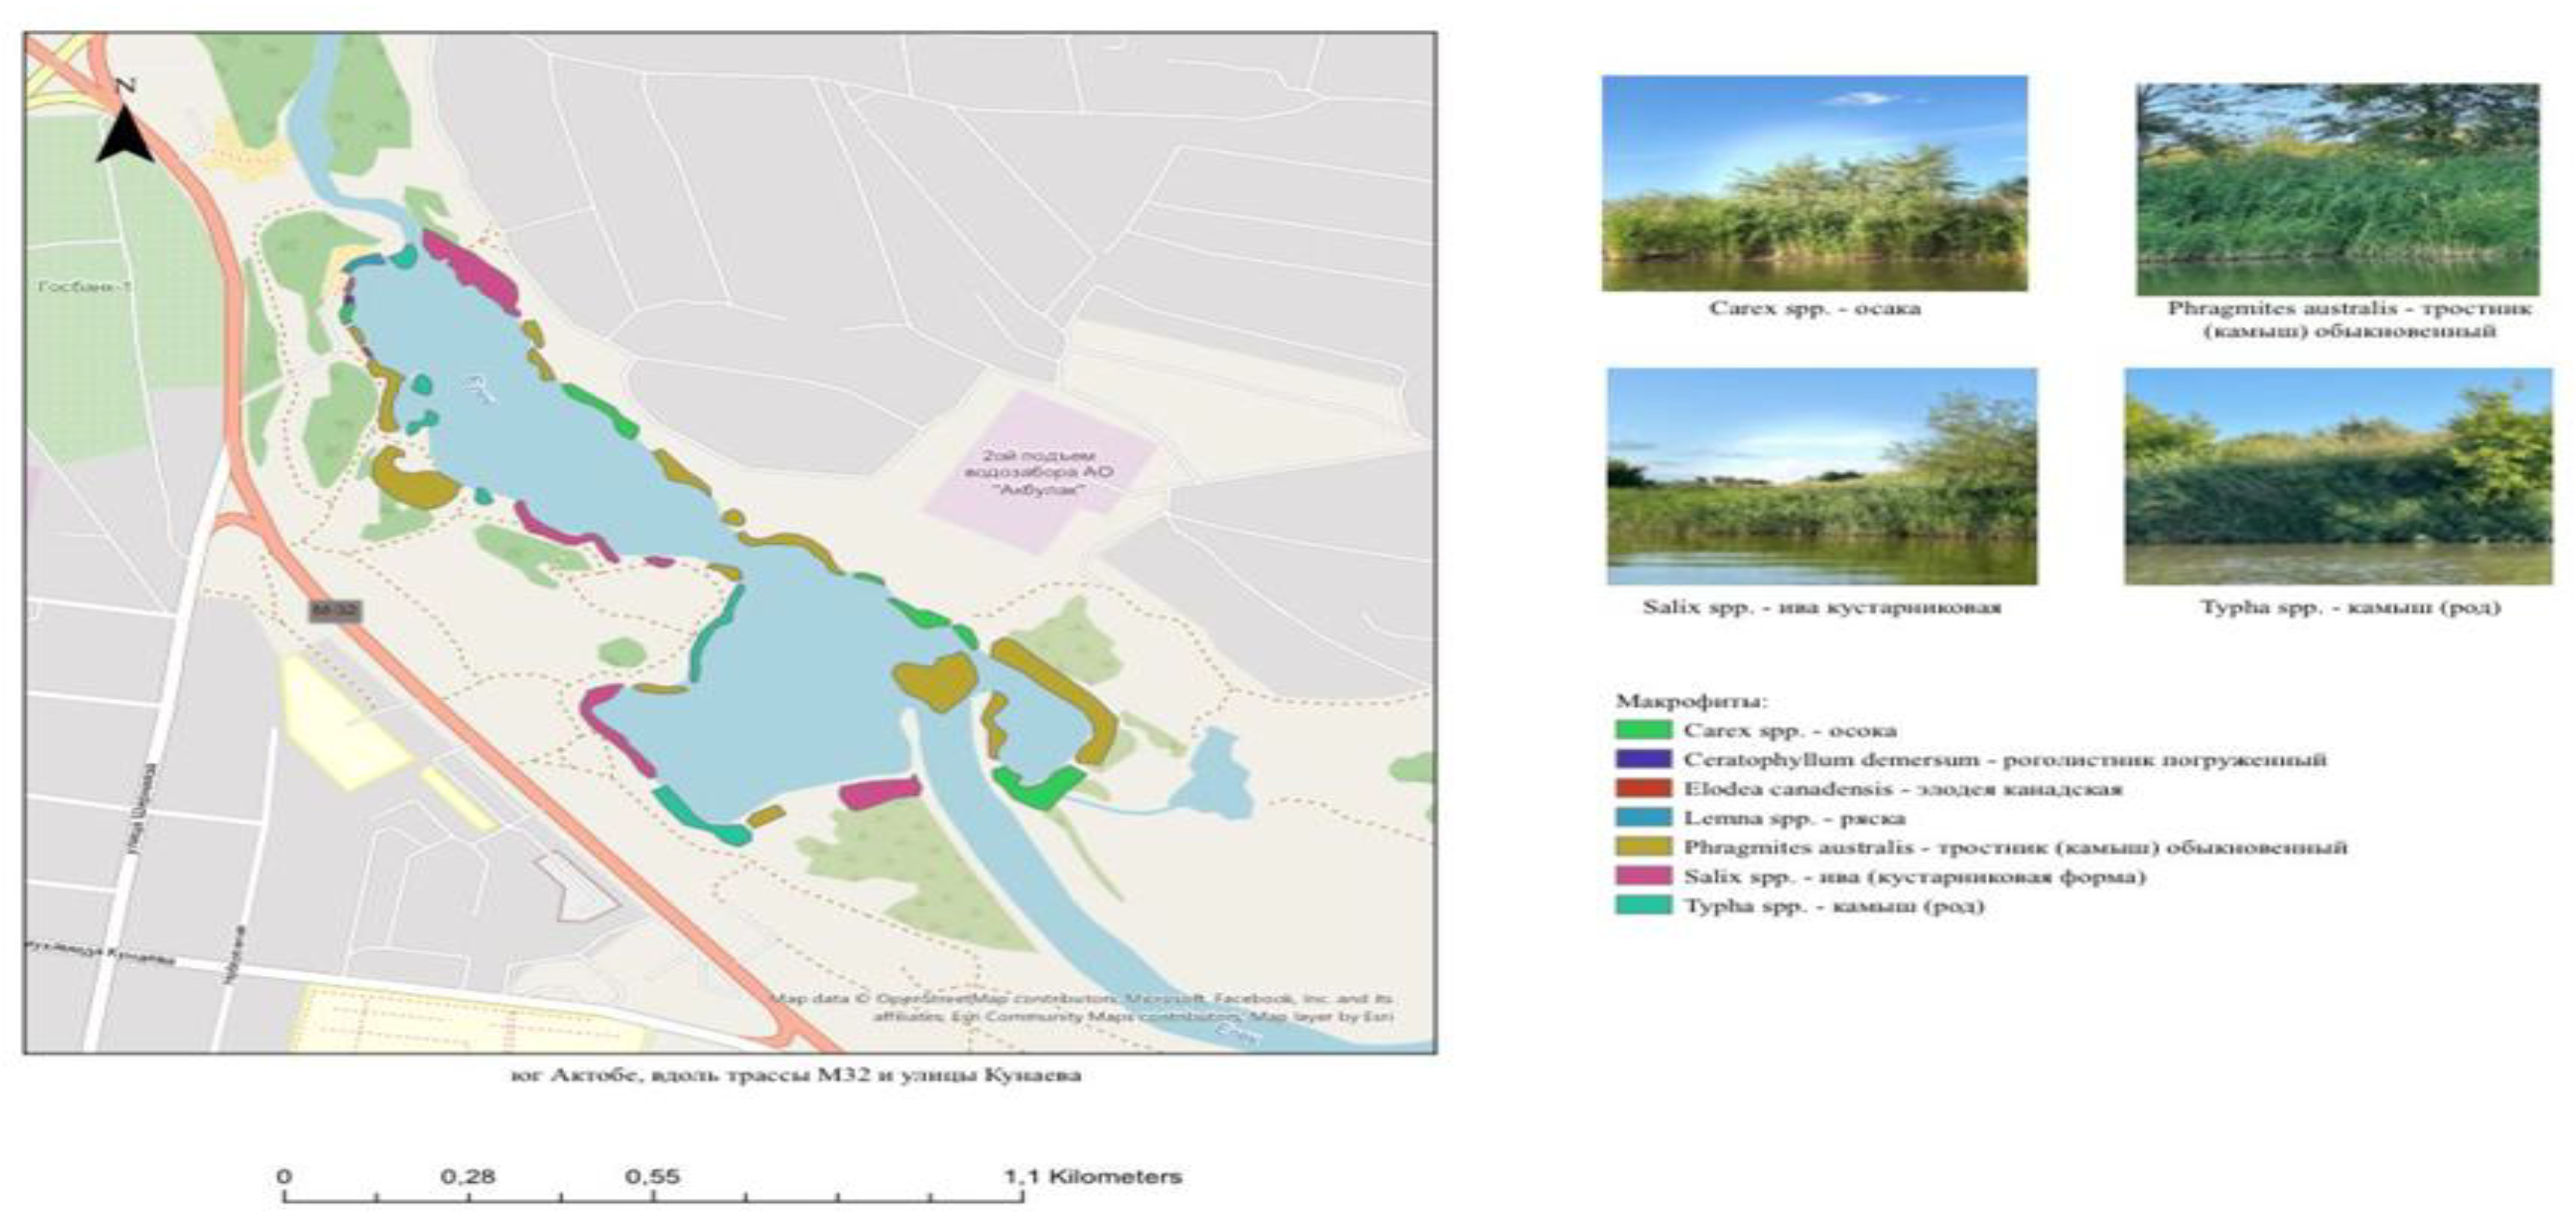
Figure 4.
Relationship between reed community density and flow velocity.
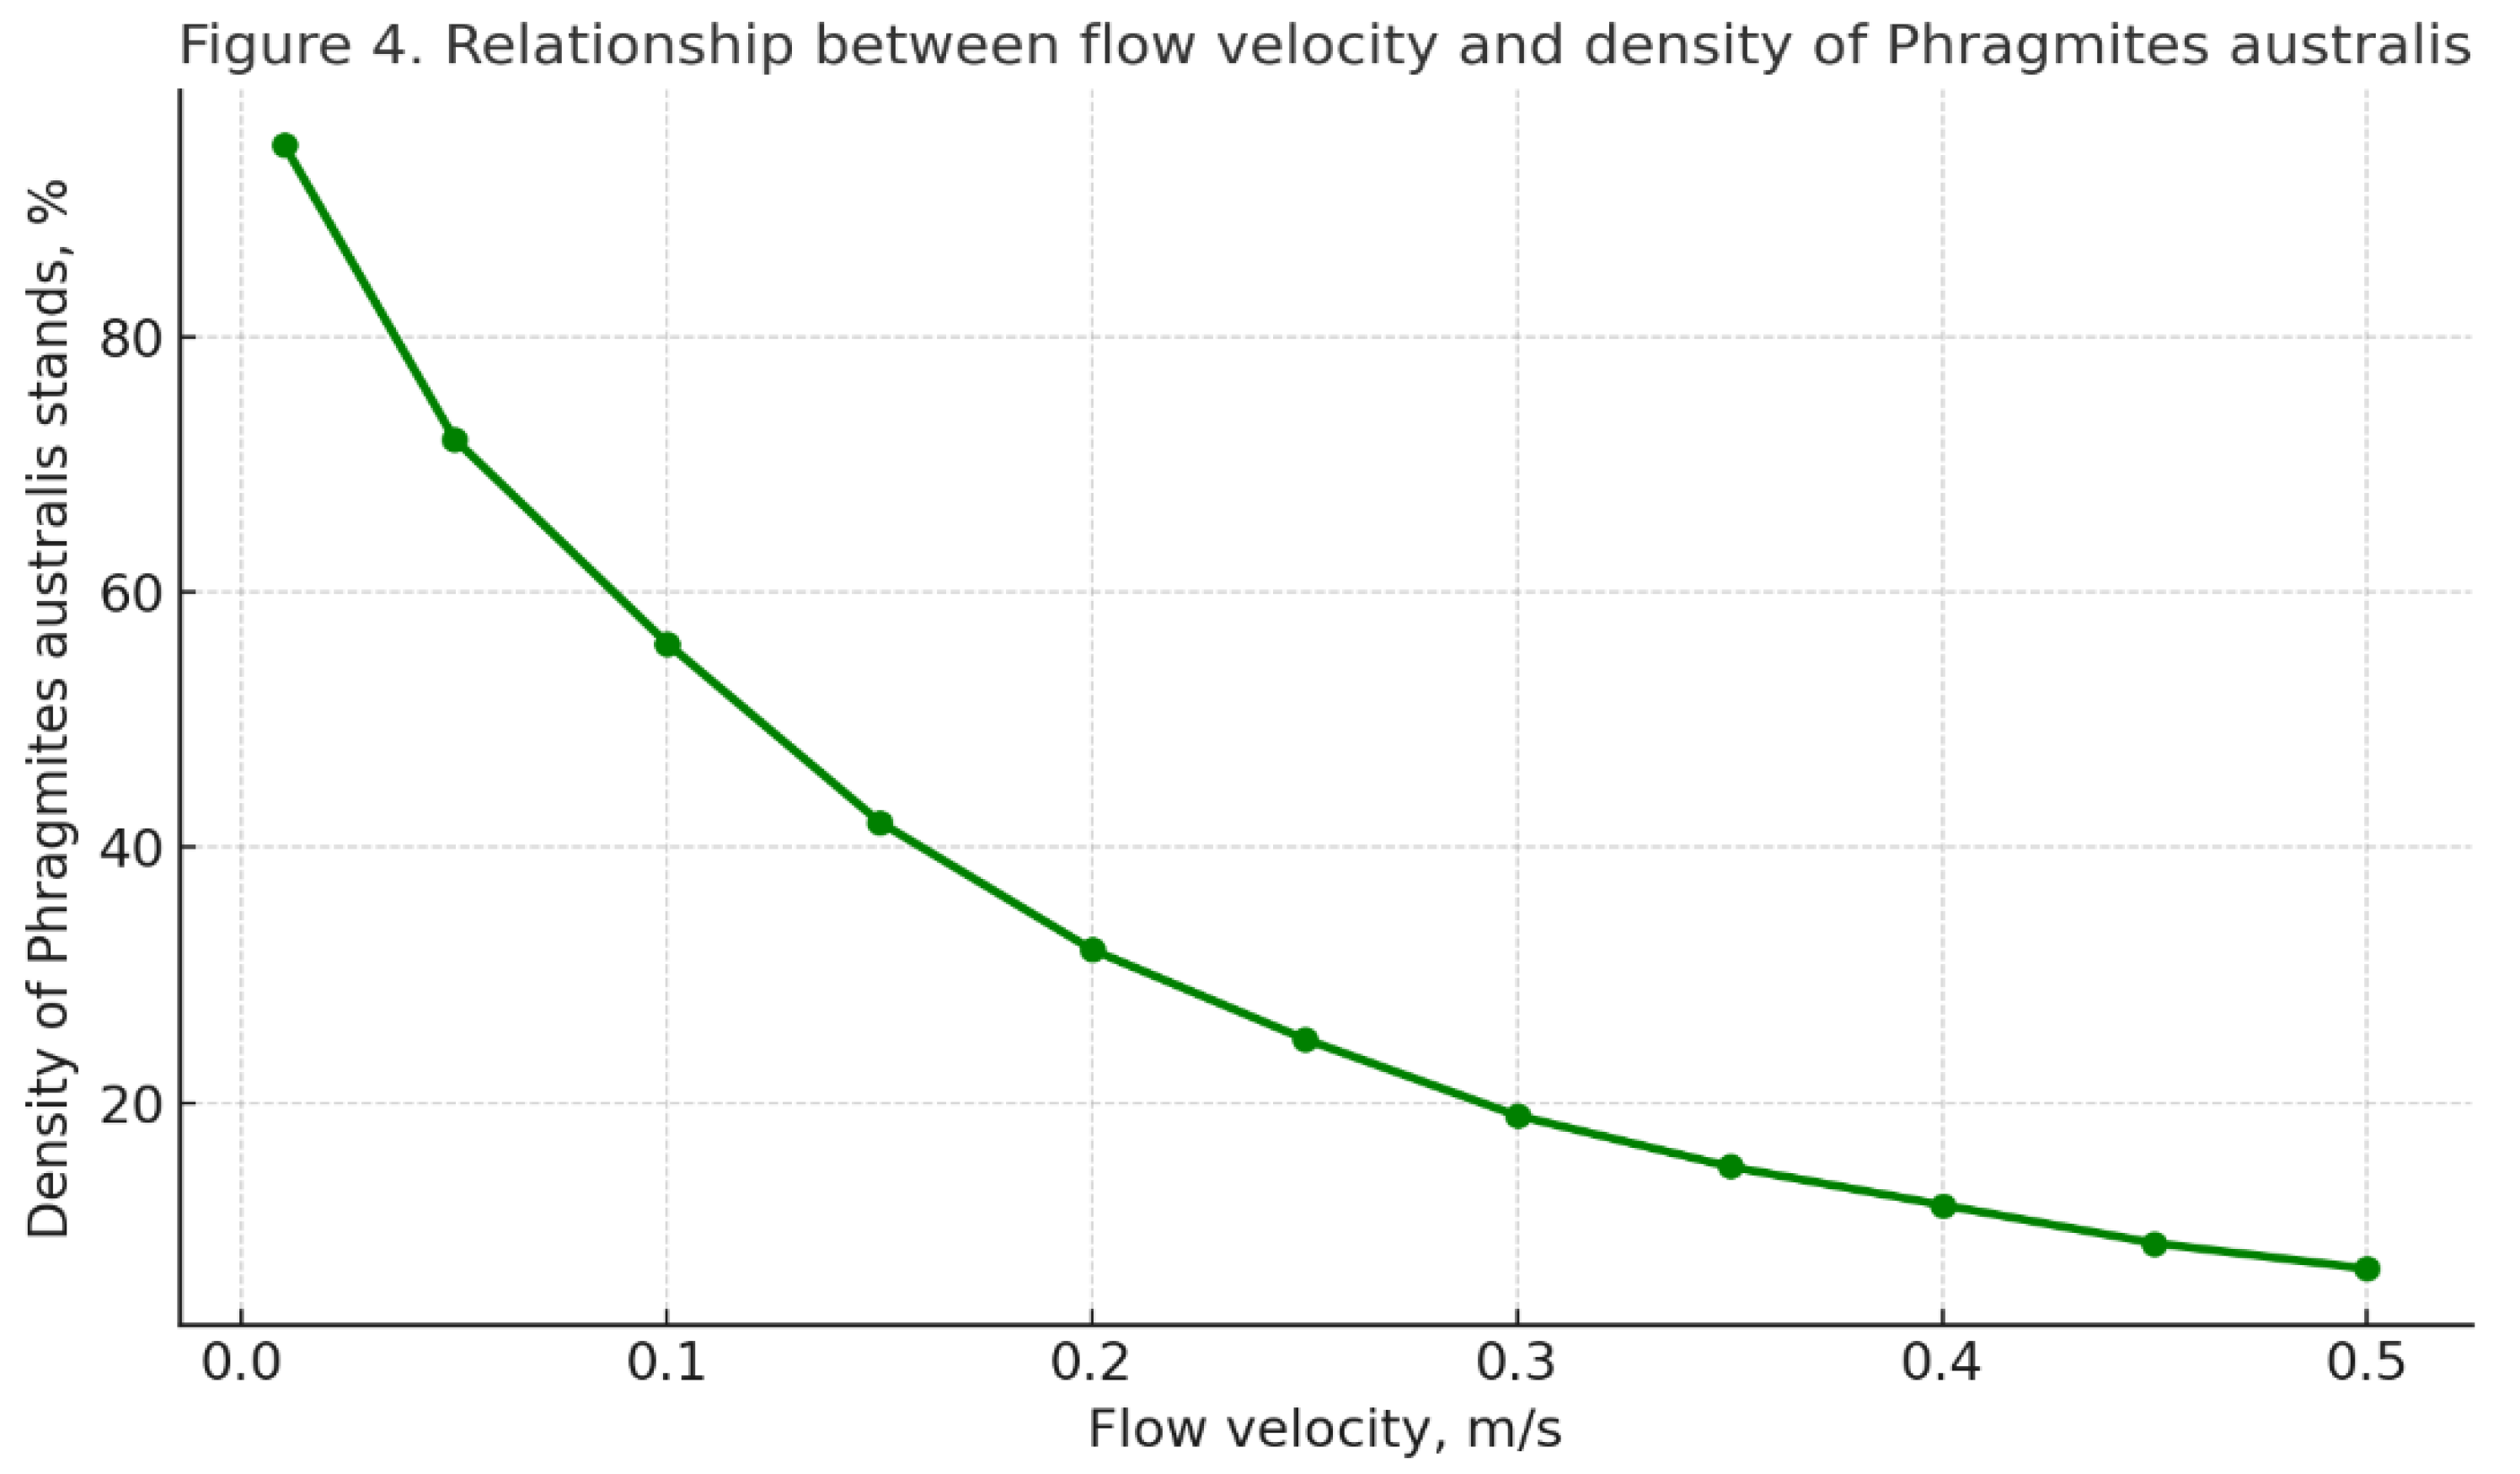
Figure 6.
Dependence of the saprobity index (S) on BOD₅ and COD at fixed values of other pollutants.
Figure 6.
Dependence of the saprobity index (S) on BOD₅ and COD at fixed values of other pollutants.
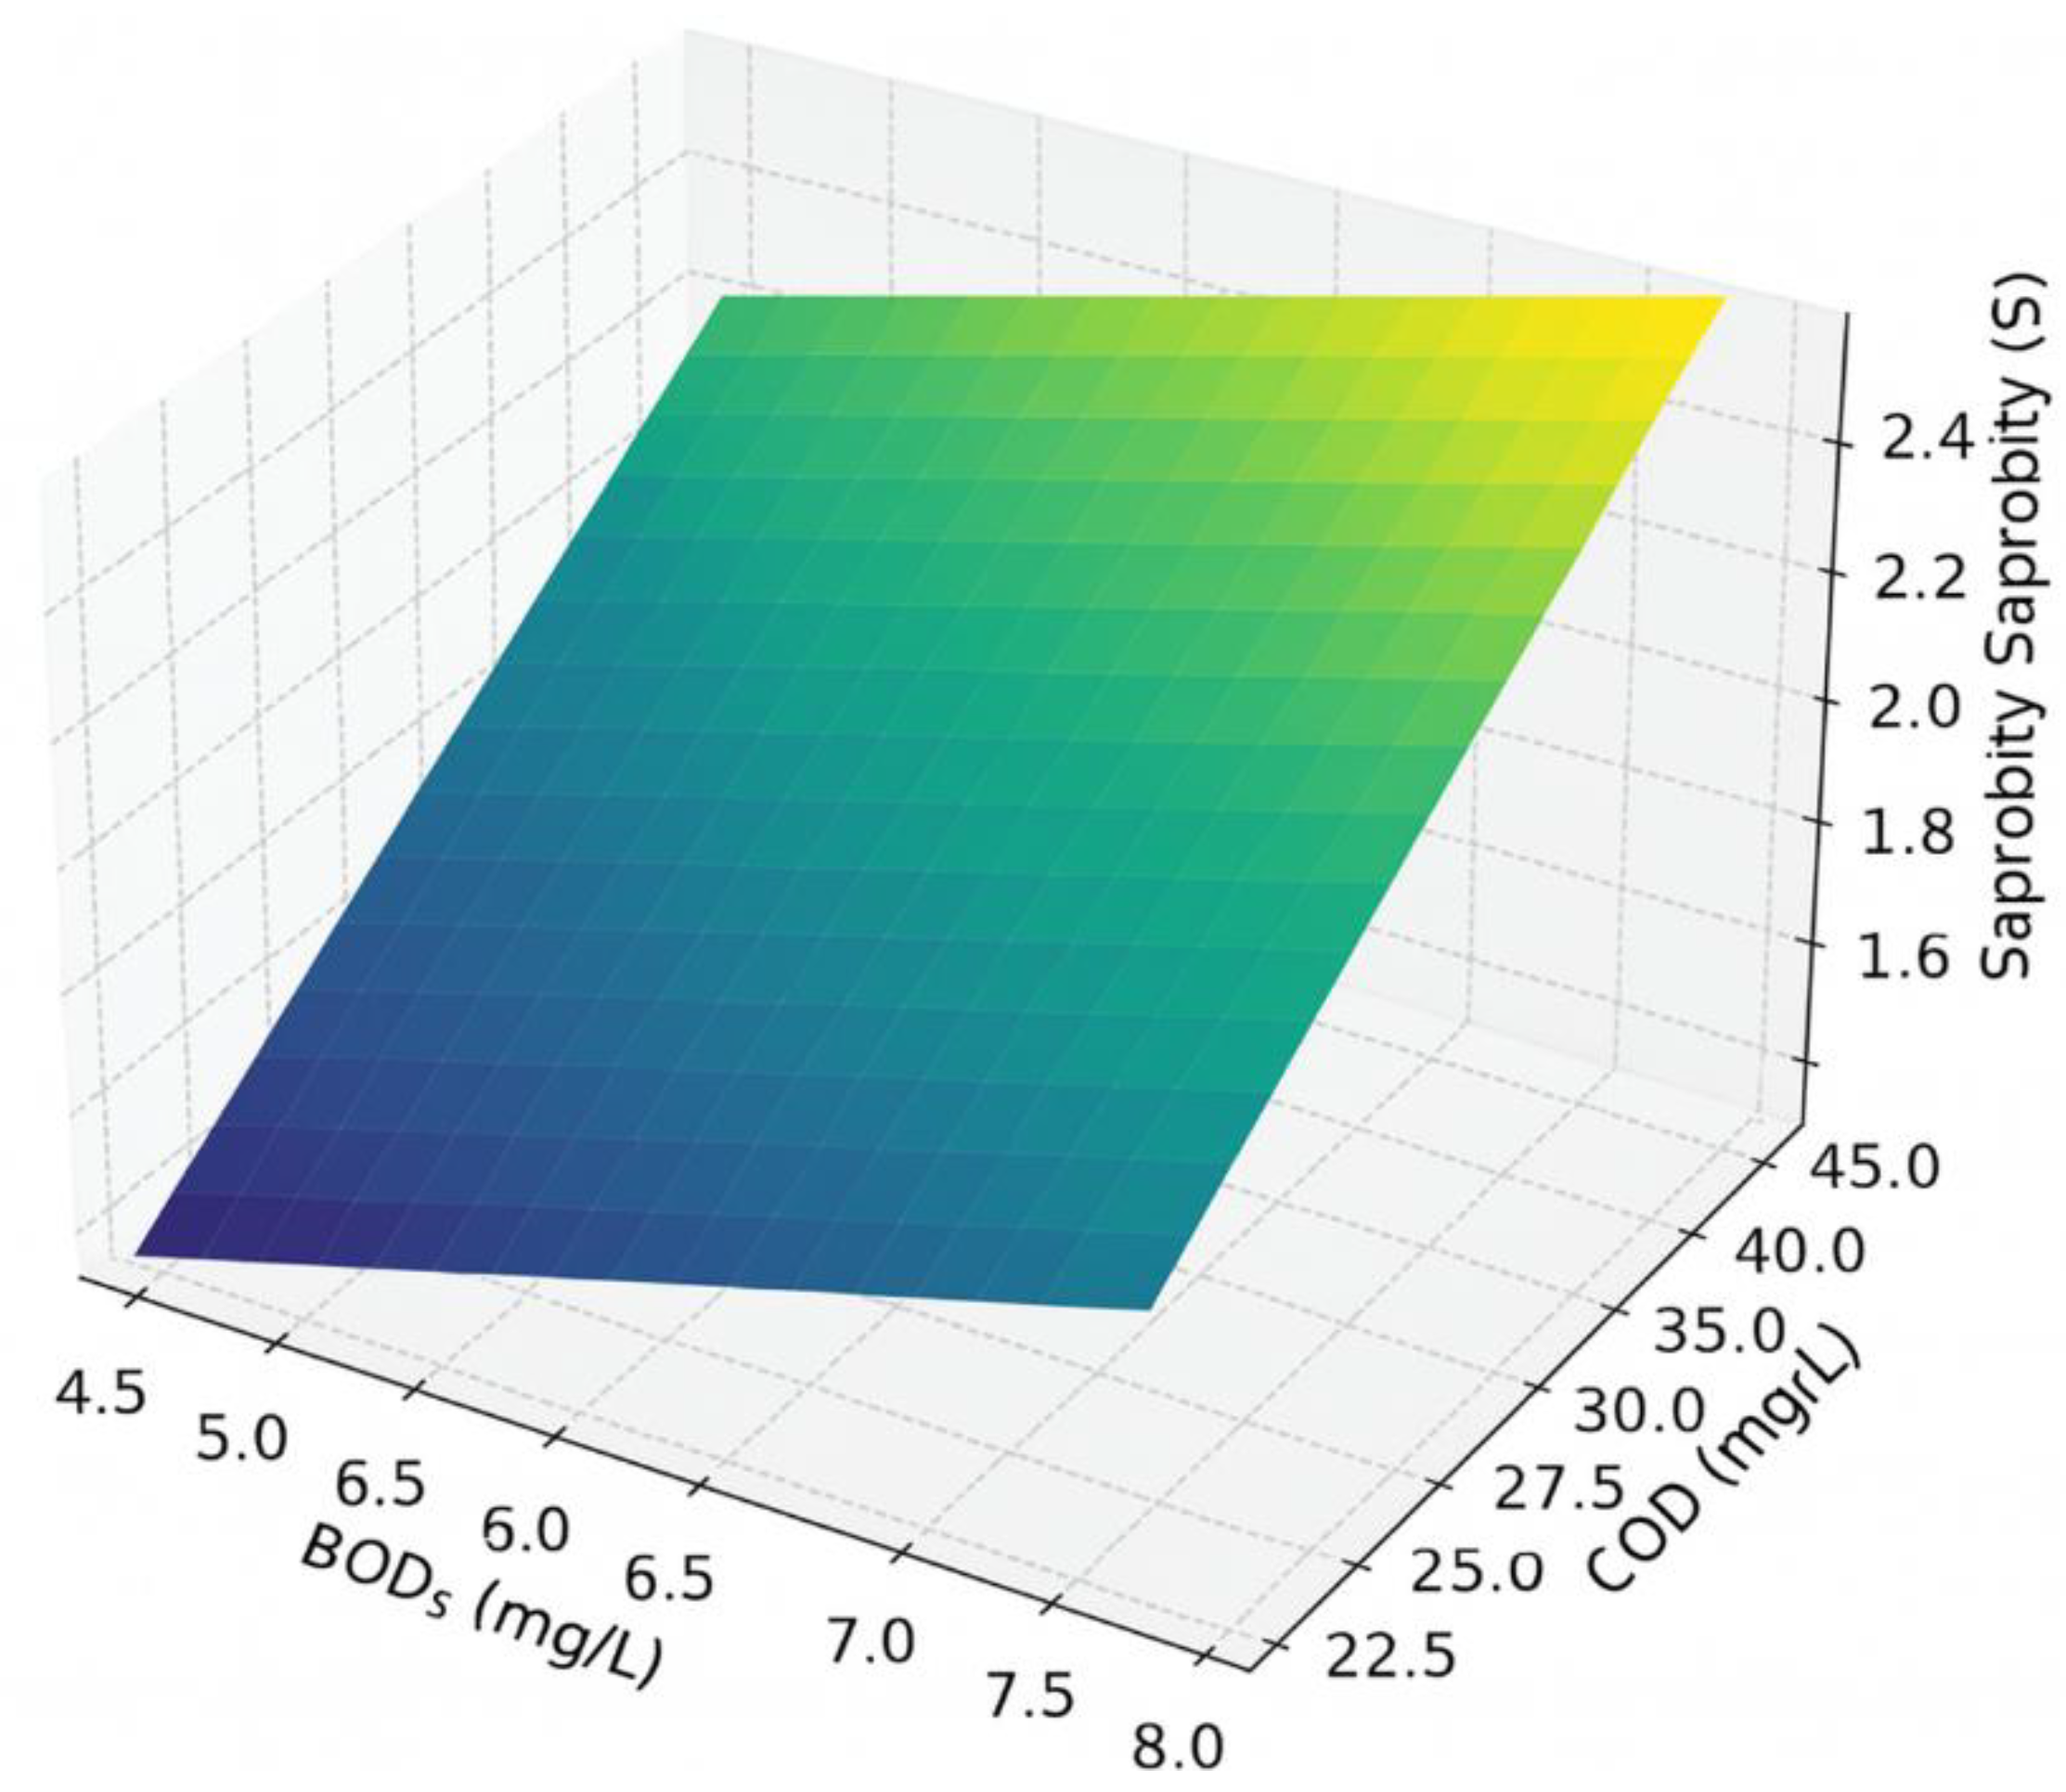
Table 1.
Classification of water quality based on saprobity index (S).
| Saprobity Zone | S Range | Ecological Characterization |
|---|---|---|
| Oligosaprobic | 1.0–2.0 | Clean water |
| β-Mesosaprobic | 2.0–2.5 | Moderate pollution |
| α-Mesosaprobic | 2.5–3.0 | Elevated organic load |
| Polysaprobic | >3.0 | Heavy pollution |
Table 2.
Distribution of macrophytes and calculation of saprobity indices (S) in the Ilek River basin.
Table 2.
Distribution of macrophytes and calculation of saprobity indices (S) in the Ilek River basin.
| Site Photo |
Species 1 | Share of species 1 (%) | Index species 1 (s) | Species 2 | Share of species 2 (%) | Index species 2 (s) | Saprobity index (S) |
|---|---|---|---|---|---|---|---|
| Ilek 1 | Phragmites australis | 60 | 2.8 | Litter | 40 | 3.8 | 3.2 |
| Ilek 2 | Phragmites australis | 80 | 2.8 | – | 0 | – | 2.8 |
| Ilek 3 | Phragmites australis | 90 | 2.8 | – | 0 | – | 2.8 |
| Ilek 4 | Phragmites australis | 100 | 2.8 | – | 0 | – | 2.8 |
| Ilek 5 | Phragmites australis | 70 | 2.8 | Shrubs | 30 | 1.8 | 2.5 |
| Ilek 6 | Phragmites australis | 80 | 2.8 | Foam | 20 | 3.8 | 3.0 |
| Ilek 7 | Phragmites australis | 90 | 2.8 | – | 0 | – | 2.8 |
| Ilek 8 | Phragmites australis | 60 | 2.8 | Litter | 40 | 3.8 | 3.2 |
| Ilek 9 | Phragmites australis | 70 | 2.8 | Shrubs | 30 | 1.8 | 2.5 |
| Ilek 10 | Phragmites australis | 80 | 2.8 | – | 0 | – | 2.8 |
| Ilek 11 | Phragmites australis | 90 | 2.8 | – | 0 | – | 2.8 |
| Ilek 12 | Phragmites australis | 80 | 2.8 | Foam | 20 | 3.8 | 3.0 |
| Ilek 13 | Phragmites australis | 60 | 2.8 | Shrubs | 40 | 1.8 | 2.4 |
| Ilek 14 | Phragmites australis | 80 | 2.8 | Shrubs | 20 | 1.8 | 2.6 |
| Ilek 15 | Phragmites australis | 90 | 2.8 | – | 0 | – | 2.8 |
| Ilek 16 | Phragmites australis | 70 | 2.8 | Shrubs | 30 | 1.8 | 2.5 |
| Ilek 17 | Phragmites australis | 85 | 2.8 | – | 0 | – | 2.8 |
| Ilek 18 | Phragmites australis | 75 | 2.8 | Foam | 25 | 3.8 | 3.05 |
| Ilek 19 | Phragmites australis | 90 | 2.8 | – | 0 | – | 2.8 |
| Ilek 20 | Phragmites australis | 70 | 2.8 | Shrubs | 30 | 1.8 | 2.5 |
| Ilek 21 | Phragmites australis | 85 | 2.8 | – | 0 | – | 2.8 |
| Ilek 22 | Phragmites australis | 70 | 2.8 | Foam | 30 | 3.8 | 3.1 |
| Ilek 23 | Phragmites australis | 80 | 2.8 | – | 0 | – | 2.8 |
| Ilek well | Phragmites australis | 60 | 2.8 | Foam | 40 | 3.8 |
Table 3.
Additional Indicators for Polluted Sections of the Ilek River.
| Monitoring site | Saprobity index (S) | Visual signs | BOD₅ (mg/L) | COD (mg/L) | Petroleum hydrocarbons (mg/L) | Chromium Cr (mg/L) | Boron B (mg/L) | Other potential pollutants | Probable industrial source |
|---|---|---|---|---|---|---|---|---|---|
| Ilek 1 | 3.2 | litter, surface film | 6.2 | 34 | 0.32 | 0.018 | 0.28 | lead, nitrates | domestic sewage and illegal dumps |
| Ilek 6 | 3.0 | foam | 5.8 | 29 | 0.25 | 0.015 | 0.25 | copper, surfactants (SAS) | stormwater runoff |
| Ilek 8 | 3.2 | litter, surface film | 6.5 | 38 | 0.34 | 0.020 | 0.31 | phenols, ammonium | residential areas and car washes |
| Ilek 12 | 3.0 | foam | 5.7 | 32 | 0.28 | 0.017 | 0.26 | nitrites, zinc | livestock farms and agro-industrial enterprises |
| Ilek 18 | 3.05 | foam | 6.1 | 36 | 0.31 | 0.019 | 0.29 | ammonium, chlorides | agricultural fields and stormwater inflows |
| Ilek 22 | 3.1 | foam, greenish water | 6.4 | 39 | 0.35 | 0.021 | 0.33 | sulfates, phosphates | garden plots and suburban settlements |
| Ilek well | 3.2 | foam, surface film | 6.8 | 41 | 0.40 | 0.023 |
Table 4.
Summary table of the saprobity index for the most polluted sections of the Ilek River.
| Site № | BOD₅ (mg/L) | COD (mg/L) | Oil products (mg/L) | Cr (mg/L) | B (mg/L) | S (calculated) | Ecological assessment |
|---|---|---|---|---|---|---|---|
| 1 | 6.2 | 34 | 0.32 | 0.018 | 0.28 | 3.109 | Degradation |
| 6 | 5.8 | 29 | 0.25 | 0.015 | 0.25 | 3.00 | Relatively stable |
| 8 | 6.5 | 38 | 0.34 | 0.020 | 0.31 | 3.16 | Degradation |
| 12 | 5.7 | 32 | 0.28 | 0.017 | 0.26 | 3.02 | Degradation |
| 18 | 6.1 | 36 | 0.31 | 0.019 | 0.29 | 3.09 | Degradation |
| 22 | 6.4 | 29 | 0.35 | 0.021 | 0.33 | 3.16 | Degradation |
| 23 (well) | 6.8 | 41 | 0.40 | 0.023 | 0.35 | 3.26 | Degradation |
Table 5.
Main mechanisms of pollutant reduction involving macrophytes.
| Pollutant | Macrophyte(s) | Removal mechanism | Conditions of efficiency |
|---|---|---|---|
| Boron (B) | Lemna minor, Ceratophyllum demersum | Biosorption, complexation with polysaccharides | pH 6–8, high macrophyte density |
| Cr(VI) | Eichhornia crassipes, Typha latifolia | Reduction Cr(VI) → Cr(III), followed by sorption | Reducing environment, high biomass |
| Cr(VI) | Phragmites australis | Absorption, precipitation of Cr(III) in the rhizosphere | Presence of organics and reducing conditions |
| Boron (B) | Hydrilla verticillata | Involvement in plant metabolism, limited accumulation | Moderate concentrations (<1 mg/L) |
| Oil products | Eichhornia crassipes, Pistia stratiotes | Uptake, tissue accumulation, biodegradation | Temperature >20°C, absence of strong current |
| Surfactants | Lemna minor, Spirodela polyrhiza | Surface adsorption, biodegradation | Neutral pH, stable temperature |
| Ammonium (NH₄⁺) | Ceratophyllum demersum, Myriophyllum sp. | Uptake through plant surface, nitrification in rhizosphere | Low water flow, pH 6.5–7.5 |
| Nitrites/nitrates | Typha latifolia, Scirpus validus | Absorption and participation in denitrification | Moderate aeration, moderate flow |
| Phenols | Phragmites australis | Sorption, enzymatic degradation in rhizosphere | Presence of microaerobic conditions |
| Zinc (Zn), Copper | Eichhornia crassipes, Lemna gibba | Ion exchange, accumulation in leaves and roots | Concentrations up to 1 mg/L, pH 6–8 |
Disclaimer/Publisher’s Note: The statements, opinions and data contained in all publications are solely those of the individual author(s) and contributor(s) and not of MDPI and/or the editor(s). MDPI and/or the editor(s) disclaim responsibility for any injury to people or property resulting from any ideas, methods, instructions or products referred to in the content. |
© 2025 by the authors. Licensee MDPI, Basel, Switzerland. This article is an open access article distributed under the terms and conditions of the Creative Commons Attribution (CC BY) license (http://creativecommons.org/licenses/by/4.0/).
Copyright: This open access article is published under a Creative Commons CC BY 4.0 license, which permit the free download, distribution, and reuse, provided that the author and preprint are cited in any reuse.


