
Submitted:
06 January 2025
Posted:
07 January 2025
You are already at the latest version
Abstract
The Santiago-Guadalajara River Basin has an area of 10,016.46 km2. The Metropolitan Area of Guadalajara, within the basin, is the second largest city in the country, with more than 5 million inhabitants. The growths of the urban population, as well as industrial and agricultural activities with insufficient infrastructure for the sanitation of wastewater and its reuse, have caused environmental deterioration of surface waters and gradual depletion of groundwater resources. To assess the level of contamination in surface waters from the presence of heavy metals in the basin, a monthly monitoring campaign was carried out at 25 sampling stations located in the main and tributary streams from July 2021 to April 2022. The following decreasing sequence was found according to the mean concentration values: Fe>Al>Mn>B >Ba>Zn>As>Cu>Cr>Ni>Cd. The Heavy Metal Pollution Index (HPI) method was applied to assess the level of risk to aquatic life, finding an average global HPI value of = 314.436 for the basin, which classifies it as in the critical contamination range. Regarding human health, results reflect concerning health risks due to presence of As, Cd, and Ni in some stations and require increased monitoring measures, as well as pollution control, to protect aquatic life and human health from heavy metal contamination.
Keywords:
Water quality
; Environmental monitoring
; Arsenic
; Heavy Metal Pollution Index
; Hazard Index
; Total Carcinogenic Risk
1. Introduction
Human activities, driven by population, industrial and agricultural growth have significantly impacted water supplies, leading to overexploitation and contamination [1,2]. Global climate change has further affected the availability and quality of water resources [3]. Cities worldwide face water scarcity issues, such as potable water availability, lack of adequate wastewater treatment, and depletion of ground water [4]. On the other hand, the severity of urban floods has been increasing since at least the 1980s due to climate change, increase of population, poor management of stormwater, land use changes, and inadequate infrastructure [5].
Approximately one-third of the world faces water pollution issues [6,7], with one billion people lacking access to clean drinking water [8] and over 2.2 million people in underdeveloped countries like Bangladesh, Pakistan and India facing life-threatening risks [9]. According to WHO and UNICEF, around 60% of infants are at risk of diseases transmitted through contaminated water [10]. Urban and peri-urban areas frequently pollute water bodies by altering natural flows and by discharging industrial waste, leading to high levels not only of heavy metals and other emerging contaminants which pose significant threats to aquatic life and human populations [11,12].
With regard to heavy metals such as arsenic, chromium, mercury, lead, cadmium, and copper, they naturally occur in soil and water due to weathering and erosion, [13,14,15]. However, industrial emissions of heavy metals have increased in recent decades, threatening aquatic ecosystems and human health [16,17]. As with some organic pollutants, heavy metals persist in the environment, accumulating to toxic levels and disrupting physiological and biochemical functions in organisms [18,19,20].
Pollutants dissolve because of the solvent properties of water [21,22,23]. Heavy metals migrate to water bodies and to sediments via industrial and municipal discharges and by runoff [23]. A primary pollution source is the improper or untreated discharge of industrial wastewater into rivers [24,25,26].
In Mexico over 60% of river systems show signs of contamination, mainly from agricultural runoff and industrial and urban wastewater discharge [27,28]. This issue is evident in the Lerma-Chapala and upper Santiago Hydrological System, including the Santiago-Guadalajara River Basin (SGRB) [26]. In developing countries, untreated or poorly treated industrial wastewater discharges and mining are significant metal pollution sources to freshwater [27]. Heavy metals may also enter water through atmospheric deposition [28,29,30]. Risks associated with dermal contact, inhalation, and ingestion have been evaluated in soils contaminated with heavy metals [31,32,33]. The risks associated to human health could increase if people consumed animal and plant products contaminated with heavy metals [32,33,34].
The Heavy Metal Pollution Index (HPI) plays a crucial role in evaluating the level of metal contamination in river systems, allowing researchers and environmental managers to assess the impact on ecosystems [35,36]. The HPI provides a valuable tool for monitoring the concentration of metals in rivers over time, enabling early identification of pollution issues and allowing for timely corrective actions [37,38].
On the other hand, recent studies have reported the Hazard Index (HI) and the Total Carcinogenic Risk (TCR) as widely used indicators to measure the carcinogenic and non-carcinogenic risks to human health associated with heavy metals in river waters [33,35,36]. The HI is typically used to assess the potential non-carcinogenic health risks, while TCR is used to estimate the cancer risk associated with long-term exposure to these pollutants. Together, these indices offer a thorough evaluation of the health risks posed by heavy metal contamination in aquatic environments, helping to pinpoint areas where public health may be at significant risk [37,38]. The objective of this study was to evaluate spatially the potential toxicity of heavy metals to aquatic life and their risks to human health throughout the SGRB, using the Heavy Metal Pollution Index, the Hazard Index and the Total Carcinogenic Risk.
2. Materials and Methods
2.1. Study Area
The Santiago-Guadalajara River Basin (SGRB) is in the Central Western Meso-Hydrological Region, in the R12 “Lerma-Santiago” Hydrological Region (Figure 1). It belongs to the Santiago River Basin Council, which is part of the Hydrological-Administrative Region VIII named Lerma-Santiago-Pacific, and accounts for 97% of the state of Jalisco. This coincides with the Groundwater Technical Committee of the VIII Hydrological-Administrative Region, named Irapuato-Valle de Santiago. It is made up of 10 tributary sub-basins of the Río Grande de Santiago whose main currents are the Zula (1), Calderón (4), La Laja (Arroyo Grande) (3), Corona (La Cañada) (2), Los Sabinos, El Ahogado, Verde, Blanco, La Soledad, Cuixtla and Chico rivers.; and important natural bodies of water (Lake Chapala, Lake Cajititlán) and dams (Calderón, El Ahogado, La Colonia, El Tule, Dos Cauces, Santa Rosa, La Yesca, El Cajón, Aguamilpa, among others). In the basin there are 41 municipalities, of which four belong to Zacatecas, one to Nayarit and 36 to Jalisco [39].
The total surface area of the SGRB was approximately 10,016.46 km2, with an altitude range from 1,423.8 m to 2,960 m above sea level [39]. The highest elevations in the basin are located at the Tequila Volcano and the mountainous formation known as Cerro Viejo, at 2,920 m and 2,960 m above sea level, respectively [39]. The lowest areas are found at the bottom of the Río Grande de Santiago canyon [39]. The density of the main streams is medium to high, between 2 km and 8 km per square kilometer, covering 75% of the surface [39]. In 2018, the predominant land use type in the basin was agriculture (45.05%), followed by forests (20.9%), deciduous forests (14.8%), grasslands (10.5%), and urban areas (7.5%) [39] (Figure 2).
Owing to increasing pollution in Mexico's rivers, in recent years it has become imperative to implement policies aimed at cleaning and restoring these waterbodies to assure the sustainability of water resources [26,40]. Among the rivers in the country identified as the most contaminated are the Tula River in the state of Hidalgo [41,42], the Atoyac River [43] and the Lerma-Santiago River System [26,44]. The Metropolitan Area of Guadalajara (MAG) has experienced a rapid population growth, and according to the INEGI in 2020, it has a population of 5,268,642 inhabitants, making it the second largest metropolitan area in the country [26,45]. The main river running near the city is the Santiago River, which originates in Lake Chapala and flows approximately 562 km into the Pacific Ocean [46]. The Grande de Santiago River Basin covers approximately 76,400 km2 and has an average flow rate of 320 m3/s [46]. The upper basin of the Santiago river, known as the SGRB extends from the city of Ocotlán, near Lake Chapala, to the Santa Rosa Dam, crossing to the east through the Metropolitan Area of Guadalajara (MAG) [26,39] (Figure 1).
The Zula River stream (sub-basin 1) and the El Ahogado stream (sub-basin 5) are significant tributaries of the SGRB, traversing areas with intense agricultural and urban-industrial activity, respectively [46]. Studies have shown that the El Ahogado stream receives untreated urban wastewater with a significant load of pollutants [46,47]. These are partially collected and treated in the local Wastewater Treatment Plant (WWTP), with a capacity of approximately 2,250 L/s. In the northern area of Guadalajara, the Agua Prieta WWTP with an estimated treatment capacity of 8,500 L/s also discharges into the Santiago River. It is operated below its design capacity because the San Gaspar-Agua Prieta wastewater collection works from the East part of the MAG have not yet been completed [47]. The El Ahogado and Agua Prieta WWTPs are planned to receive about 20% and 80% of the wastewater from the MAG, respectively [47]. Despite the heavy reliance of the more than five million inhabitants of the MAG on surface water from the SGRB to meet their water needs [48], a significant portion of the industrial and urban wastewater generated within the basin is still discharged untreated directly into the Santiago River or indirectly through its tributaries [48].
For the National Statistical Directory of Economic Units (NSDEI, DENUE by its acronym in Spanish), an economic unit is an establishment that combines resources and actions to carry out production activities, purchase and sale of goods or provision of services [49]. The last update carried out in 2021 by the NSDEI reported a total of 27,858 economic units in the SGRB, equivalent to 13.1% of all business activities in the state of Jalisco. Of these, more than 27,000 economic units (85.8%) are located within the MAG (see Figure 3) [49].
Of the total economic units found in the basin, 2.6% are considered large, with more than 250 people working in the establishment, 23.3% corresponded to medium-sized businesses, and 74% were small businesses, that is, with fewer than 50 people working in the firms. The largest number of economic units in the manufacturing industry was related to the food industry (22.9% of the total economic units in the basin), where animal feed, grain and seed milling, slaughter, and processing of livestock and poultry are processed and produced. The textile industry represents 5.2% of the total economic units in the study basin, whereas the industry that produces plastics and rubber is equivalent to 3.0%. The chemical industry represents only 2.1% of the economic units in the basin, but most of them are large economic units, where resins, synthetic rubbers, fertilizers, pesticides, paints, adhesives, among other chemical products, are produced [49]. Figure 3 shows the concentration of the main industrial activities in the basin.
The importance of ensuring the sustainability of watersheds has become increasingly recognized, as it is acknowledged that maintaining their functions is essential for a sustainable future and human security [50,51]. The SGRB is vital for the inhabitants of the MAG and its conservation is a priority today, hence the concern that exists about emerging pollutants that are present in the river and their potential effects on aquatic life and human health [26,46].
2.2. Monitoring Stations
To study the presence of heavy metals in the surface waters of the SGRB, the selection of the monitoring stations was carried out considering the following criteria: accessibility, hydrological regime of the watercourse throughout the year, population in the local watershed, and socioeconomic level of the population. Table A1 (in Appendix A) describes the names and geographical coordinates of each of the selected monitoring stations, and Figure 4 shows their geographic locations.
2.3. Analytical Methods
The water samples were digested using the US EPA 3005A method with some modifications, which involved acid digestion of the water to recover heavy metals and subsequent analysis by inductively coupled argon plasma spectroscopy (ICP) [52]. All samples were acidified with nitric acid (5 mL/L), thoroughly homogenized, and a 100 mL aliquot was taken for digestion. Then, 0.2 mL of concentrated nitric acid and 0.5 mL of concentrated hydrochloric acid were added. The sample was covered with a watch glass and placed on a heating plate at a temperature of 90 to 95°C until the volume was reduced to 3 or 5 mL, avoiding boiling. The sample was removed from the plate and brought to a total volume of 10 mL using deionized water. The determination of total heavy metals (Al, As, B, Ba, Cd, Cr, Cu, Fe, Hg, Mn, Ni, Pb, Sb, Se, Zn) was performed using a modification of the standard NMX-AA-051-SCFI-2001 “Water analysis - Determination of metals by atomic absorption in natural, potable, residual, and treated residual waters” [53]. The technique used for the determination of heavy metals was atomic emission (ICP-OES) using an inductively coupled plasma emission spectrometer, model Optima 8300 DV (Dual View) (Perkin Elmer). The standards used for the preparation of the calibration curves are certified and traceable in accordance to NIST [54]. For each group of processed samples, a reagent blank must be run from sample preparation to the analytical process. The coefficient of variation percentage for the results of these samples must not exceed 3%. The detection limits for the determination of heavy metals are shown in Table 1.
2.4. Assessment Criteria
Since 2009 the Federal Rights Act (FRA, LFD by its acronym in Spanish) considers the Santiago River and its direct and indirect tributaries as type “C” waterbody [55]. A type "C" waterbody means that it must comply with the permissible limits of contaminants for fresh waterbodies where the protection of aquatic life is set as a priority [55]. The strategy to assess the toxicity risk of heavy metals and metalloids measured in the SGRB considers 1) the FRA [55], 2) the maximum permissible thresholds of acute and chronic toxicity for the protection of freshwater vertebrate and invertebrate organisms established by the U.S. Environmental Protection Agency [56], 3) Water Quality Guidelines for the Protection of Aquatic Life established by the Canadian Council of Ministers of the Environment (CCME) [57] and 4) Australian and New Zealand Guidelines for Freshwater and Marine Water Quality (ANZECC & ARMCANZ) [58] (see Table 2).
2.5. The Heavy Metal Pollution Index (HPI)
The Heavy Metal Pollution Index (HPI) is a method originally developed by Mohan and Nithila in 1996 [59]. HPI is a numerical value that measures the overall influence of each heavy metal contributing to contamination in water bodies. It helps to assess and evaluate the combined influence of all heavy metals on overall water quality and uses a weighted arithmetic mean method in the assessment of overall water quality with respect to heavy metal pollution (equation 1) [60].
where Qi is the subindex of the i-th parameter, and the Wi is the unit weight of the i-th parameter and n is the number of parameters considered. The subindex Qi of the HPI described in Equation 1 is defined as:
where Mi (µ/L) is the monitored value of the i-th parameter. Ii is the ideal value of the i-th parameter and Si is the standard value reported by the environment or health agencies. In this study, the standard values are those reported by federal agencies to protect aquatic life, as shown in Table 2.
Equation 2 was adapted from the original equation to follow a criterion similar to that proposed by Caerio et al. in 2005 [61]. The critical value of the HPI, which establishes the acceptable limit for drinking water, is 100 [59]. Therefore, HPI was used to classify the values that we obtained into three categories: "low" when the index value is below 100, "near threshold" at 100, and "high" or "critical" when exceeding 100 [60,62].
2.6. Human Health Risk Assessment
Human Health Risk Assessment (HHRA) is directly related to the nature and severity of the negative health effects that individuals may experience when exposed to environmental contaminants [63]. In the case of heavy metals, consuming drinking water contaminated with them increases the risk of developing both cancerous and non-cancerous diseases in humans [64]. In this study, we considered the carcinogenic and non-carcinogenic risks of the metals identified at the sampling stations using the methods specified by the US EPA [65]. This represents the first study reported in the literature considering these risks from heavy metals in the basin. The health risk assessment was calculated through oral and dermal exposures: non-cancerous (Fe, Zn, As, Cu, Cr, Cd) and cancerous risks from the dissolved metals (As, Cr, Cd) according to [66,67].
The hazard indices for non-cancerous health risks were calculated using Hazard quotients (HQ) from the ingestion and dermal absorption pathways. These indices reflected the overall potential health risks to both children and adults posed by various heavy metals.
2.7. Exposure Assessment
2.8. Non-Cancerous Health Risk
According to Selvam et al. [64], the dose of the contaminant consumed by humans is calculated using the chronic daily intake (CDI) in mg/kg/day, obtained through the ingestion pathway (CDI ingestion) and dermal absorption (CDI dermal) using the equations 3 and 4.
where Cwater is the average concentration of heavy metals in the water (mg/L), IR is the ingestion rate per unit time (0.64 L/day for a child and 2 L/day for an adult); EF is the exposure frequency (365 days/year); ED is the exposure duration (6 years for child and 70 years for adult); SA is the skin area (6600 cm2 for children and 18 000 cm2 for adults): Kp is the permeability coefficient (0.001 cm/h for Cr and 0.001 cm/h for other metals); ET is the exposure time (1 h/day for children and 0.58 h/day for adults); CF is the conversion factor (0.001 L/cm3); BW is body weight (20 kg for child and 70 kg for adult); AT is the averaging exposure time (for cancerous, AT (70×365) is 25 550 days for both children and adults; for non-cancerous, AT (ED×365) is 2 190 days for children and 10 950 days for adults [64,66,67].
The HQ was calculated from CDI (CDI ingestion and CDI dermal) and RfD (RfD ingestion and RfD dermal) using the equation 5:
where RfD is the reference dose in mg/kg/day for ingestion is: 0.3 for arsenic (As), 1.4 for Lead, 0.5 for cadmium (Cd), 40 for copper (Cu), 300 for zinc (Zn), 300 for iron (Fe), 3.0 for chrome (Cr), 2.00 E-02 for nickel (Ni); and for dermal absorption: 0.123 for arsenic (As), 0.42 for lead (Pb), 0.005 for cadmium (Cd), 12 for copper (Cu), 60 for zinc (Zn), 45 for iron (Fe), 0.015 for chrome (Cr) and 5.60 E-03 for nickel (Ni) [70]. Finally, the total potential non-cancerous risks were evaluated by calculating the hazard index (HI) using the equation 6:
Toxic metals with an HI and HQ greater than 1.0 may cause negative effects, while those with values less than 1 are unlikely to have adverse effects on human health [64].
2.9. Cancerous Health Risk
The cancerous risks (CR) were evaluated using the following equations:
where TCR means Total Carcinogenic Risk. The standard values of the cancer slope factor (CSF) oral for assessing risks are: 0.5, 1.5, 6.1, 0.0085 and 1.7 ppb/day for Cr, As, Cd, Pb and Ni respectively [68]. The CSF dermal for assessing risks is: 41, 1.5, 6.3, 0.043 and 2 ppb/day for Cr, As, Cd, Pb and Ni respectively. The acceptable or tolerable range for carcinogenic risk is from 0.000001 to 0.0001. If the CR or TCR of an element exceeds 0.0001 , it could have harmful effects on human health [64].
2.7. Statistical Analyses
All data were processed and analyzed using Excel 2021. Correlation analysis was performed by Pearson’s correlation method using Minitab statistical software version 21.4.2 (Minitab Ltd., Coventry, UK). Additionally, a scatter plot matrix was created to analyze the patterns and relationships between heavy metals, considering the concentrations found in the samples.
3. Results and Discussion
3.1. Heavy Metals in the Monitoring Stations
The concentrations, means and standard deviations of the heavy metals in this study are listed in Table 3. The following sequence (highest to lowest) was found according to the mean concentration values calculated: Fe>Al>Mn >B>Ba>Zn>As>Cu>Cr>Ni>Cd. It was found that Fe, Mn, As, Cu, Cr, Ni, and Cd are below the permissible limits according to the Federal Rights Act in Mexico for the protection of aquatic life in freshwater bodies [55], whereas Al, B, Ba, and Zn exceed the established limits.
The metal with the highest mean concentration was Fe (0.421 mg/L), followed by Al (0.372 mg/L), Mn (0.165 mg/L), and B (0.153 mg/L). Iron concentrations do not represent a risk in the SGRB, as their presence is associated with the natural conditions of rocks and in sediments and the mineralization process [69]. This metal, when found with manganese (Mn), gives rise to the formation of reactive minerals that influence the behavior of organic matter in soil or water. Iron (Fe) forms minerals in different chemical forms, such as oxides (formed by the reaction of iron with oxygen), hydroxides (when combined with water) and oxyhydroxides (when combined with oxygen and water) [70]. Some of these minerals include ferrihydrite, goethite, and lepidocrocite, which are common forms of reactive iron minerals [70]. These minerals do not remain where they were formed but can be transported to other locations through natural processes such as hydric or wind erosion, these minerals then reach soils and sediments in rivers and streams, where they are deposited [71].
Aluminum (Al) was detected in all sampling stations above the maximum permissible limit (0.05 mg/L) (see Table 2). Boron (B) was detected in all stations; however, concentrations of this metal are not regulated in Mexico (see Table 2). Its presence in river systems is associated with mineralization processes but also with wastewater discharges resulting mainly from agriculture activities [72,73]. Barium (Ba) exhibited a similar behavior, with a permissible limit of 0.01 mg/L (see Table 2). However, its presence may be primarily associated with river sediments containing minerals composed of aluminum oxide and silicon dioxide, which are typically derived from igneous and metamorphic rocks [74]. Therefore, the presence of Fe, Al, Mn, B, and Ba metals in all monitored stations is mainly due to the dissolution of minerals that are specific to the regional geology and to various geochemical processes rather than to anthropogenic activities [69].
In the case of Zn, only six of the 25 sampling stations (S1, S10, S16, S18, S19, and S20) showed concentrations above the established limit (0.02 mg/L). These higher values may be associated with an increase in natural processes such as soil/rock leaching and forest fires, as well as anthropogenic activities such as steel production, domestic sanitation systems, disposal of industrial and urban wastewater, mining, leachate from municipal landfills, application of fertilizers, insecticides, fungicides, cosmetics, and/or paints [75].
For As, Cu, Cr, Ni, and Cd a standard deviation slightly higher than the total mean obtained at all sampling stations was observed (Table 3). Natural processes, such as precipitation, erosion, water flow, and biological activity can cause significant fluctuations in the concentrations of heavy metals, contributing to a high standard deviation [76,77]. It could also be associated with the polluted environment of the river basin itself, as heavy metal concentrations can vary widely from one point to another due to water flows and sedimentation processes [78].
On the other hand, the existence of sampling points with extremely high concentrations, as often happens with outliers, can increase the standard deviation. Studies have shown that a significant factor explaining these increases is associated with a small sample size that does not adequately capture the spatial and temporal variability [79].
Conversely, the metal with the lowest average concentrations detected was cadmium (Cd) with a value of 0 mg/L, which had a very small sample size, ranging from 0 to 2 values per station, which could be associated with the higher standard deviation value obtained for the mean. Despite the few samples detected during the study at the different sampling stations, the highest average value for this metal was at station S16 (0.003 mg/L), which is below the permissible limits established for river water according to the Federal Rights Act in Mexico [55]. Therefore, this metal does not pose any danger to aquatic life in the Santiago-Guadalajara River Basin. The few concentrations of cadmium (Cd) detected could be associated with certain phosphate fertilizers that contain it and that infiltrate the soil during their application in crops [80].
3.2. Heavy Metal Pollution Index
The mean concentrations of the 11 heavy metals were considered in the HPI calculation. Table 4 shows the values of the assigned unit weights (Wi), calculated sub-index values (Qi), and HPI. The critical value for HPI is 100, and any value above 100 indicates that the level of heavy metal contamination in the river is significantly high [60]. The heavy metal pollution index was calculated for each sampling site (Table 4). In the study area of the SGRB, the average HPI value obtained was = 314.436, which is an indication of highly polluted water (HPI > 100) and therefore not suitable for drinking.
Critical values above 100 were obtained for the 25 sampling stations, except for S2, corresponding to El Taretán stream (72.238) and S17 in La Soledad River (80.952). The highest values of this index were recorded for three stations: S7 of the Zula River (618.045), S20 corresponding to El Ahogado stream (914.455), and S23 in the La Calera River (790.226). These points indicate high heavy metal contamination and high risk for aquatic life. In the El Ahogado basin, a high degree of environmental degradation has been documented [81,82]. This has caused severe socio-environmental conflicts, leading to collective action by organizations at local, national, and international levels to combat the problem affecting the entire basin [26,83]. Along with the three stations, S1 (Arroyo La Madrastra) = 331.960, S4 (Arroyo Los Morales) = 449.830, S9 (Arroyo Grande) = 430.390, S10 (Río Zapotlanejo) = 419.711, S12 (Río Santiago) = 382.528, S14 (Arroyo Las Pintas) = 378.107 and S25 (Río Los Sabinos) = 358.711 showed values above the average HPI, while the rest were below but still represented highly contaminated sites with heavy metals, with HPI values > 100.
3.3. Correlation Analysis
The correlation index is used to understand the linear relationship between two variables [84], such that high correlation coefficient values show good correspondence between them and vice versa. If the correlation coefficient (r) value is close to zero, there is no correspondence between the variables [85]. However, a value close to one means there is a good relationship, but if it is negative, then it is an inverse correlation. To understand the relationship between the heavy metals analyzed in this study, Pearson correlation coefficients were calculated for the water samples from the SGRB, and the results are summarized in Table 6.
A correlation analysis was performed between the average concentrations of heavy metals in water samples from the basin to evaluate possible similar sources of origin. It was observed that there is an inverse relationship between the metals Cd, Cu, Cr, Fe, Mn, Ni, and Zn with Arsenic, between Cu, Cr, Ni, and Zn with Ba, between Cu, Cr, Fe, and Zn with B, between Cr and Mn with Cd, as well as between Fe, Mn, and Ni with Cr. This means that the appearance of metals in the basin is not related to each other and that they have different sources of origin. In Figure 5, it can be observed that there is a positive correlation between B-Ba (r = 0.492), Fe-Al (r = 0.481), Ni-Al (r = 0.474), Cu-Cd (r = 0.564), Zn-Cu (r = 0.709), and Mn-Fe (r = 0.566). The strong correlations found between B-Ba, Fe-Al, and Mn-Fe demonstrates that these metals are indeed strongly associated with the composition of the lithological structure of the region [69].
The correlations found between Ni-Al, Cu-Cd, and Zn-Cu could be associated with anthropogenic sources of contamination. These correlations suggest that industrial effluents, toxic waste from processing units near the sampling stations in the SGRB, and untreated domestic wastewater discharges are the main sources of contamination, as has already been demonstrated in other river basins by other authors [60]. These results may be relevant for understanding common sources of contamination and indicate the interactions between these pollutants in the environment and their potential effects on health and the ecosystem.
3.4. Human Health Risk Assessment
3.4.1. Non-Cancerous Health Risks
The results presented in Table 7 show the non- cancerous hazard index (HI) for various heavy metals in water samples from different stations in the SGRB. The Hazard Quotient (HQ) and Hazard Index (HI) were used to assess the risk, where an HI greater than 1.000 indicates a potential risk for adverse health effects, and an HI less than 1.000 suggests that the exposure is unlikely to cause harmful effects. These values are calculated for both children and adults, and the metals assessed were As, Cd, Cu, Cr, Fe, Pb and Zn. The average values of the HQ for both children and adults are generally low, with the lowest average value found being 0.001 for copper (Cu) in children and adults, while the highest was 0.176 for Arsenic (As) in children. These values indicate that, in general, the water in the SGRB does not pose an immediate non-carcinogenic health risk related to the metals studied, as values below 1.000 are unlikely to have adverse effects on human health, as reported [86,87]. However, some sampling stations show higher values, suggesting the possibility of localized contamination in these areas.
There is considerable variation in the HI values between the different stations. Stations S5 (Río Calderón), S18 (Arroyo El Ahogado), and S23 (Río La Calera) showed the highest levels, while station S19 displayed the lowest values. Although the HI values obtained at S5 were below 1.000 (0.868 for children and 0.765 for adults) and at station S18 as well (0.827 for children and 0.725 for adults), continuous monitoring should be implemented to study the behavior of these sites over time and prevent potential future impacts on human health. These locations may represent critical points of pollution that require further investigation and action. The highest HI value for children was obtained at station S23, with a value of 1.326, while for adults it was 1.148 (HI >1). Station S23 showed elevated HQ values for both children and adults for arsenic, indicating that heavy metal concentrations here could pose health risks. The metal contributing to this high HI is arsenic (As). The results suggest that long-term exposure at this station could lead to harmful effects such as neurological damage or carcinogenic effects (associated with As), emphasizing the importance of closely monitoring this area.
Similar results have been reported in other recent studies for this heavy metal, indicating a potentially significant risk [86,88]. Since the communities in this basin are primarily engaged in agriculture, small-scale manufacturing, and trade, the sources of arsenic in this basin are likely associated with the presence of this metalloid in groundwater, which may surface during rainfall and flow into the tributary channels of this river.
The values obtained in S5 for arsenic (As) are the highest values for this metal, after those found at S23. Low levels of arsenic exposure can have serious health consequences, particularly over the long term [86,88]. Unlike station S5, station S23 is located at a point where treated and untreated wastewater from the basin converge, making it more representative of the urban, industrial and agricultural pollution generated in the basin.
In general, HI values for children are higher than those for adults, which is expected due to children's increased vulnerability to toxic pollutants. This is because children have a lower body weight and might consume or use more water relative to their size, making them more susceptible to contaminants [87]. Since children are in a critical stage of development and are more likely to experience adverse health effects from waterborne pollutants, their exposure levels must be a key focus in water quality assessments [89].
Arsenic is the primary metal contributing to elevated HI values at several stations. Long-term exposure to arsenic is known to cause skin issues, lung and organ damage, and increase the risk of cancer [90,91,92]. While this study focuses on non-cancer risks, it is still crucial to address arsenic levels. Lead (Pb), another key concern, showed high HI values in places such as S18. Lead (Pb) is a well-known neurotoxin, and its presence in drinking water is particularly dangerous for children, affecting brain development and overall health [93,94,95]. Most of the stations exhibit HI values below critical limits, but the higher readings at stations like S5, S18, and S23 highlight areas that may present more significant risks, particularly for vulnerable groups such as children.
While the overall water quality in the SGRB appears to meet safety standards for non-cancer risks, there are still concerns about point source contamination, particularly from arsenic and lead. Arsenic (As) requires closer monitoring at S23 because, in this study, the concentrations exceeded recommended safety levels. The higher HI values for children emphasize the importance of prioritizing their health in water quality regulations, and child-specific safety standards should be implemented. Ongoing monitoring and public awareness campaigns can help minimize exposure to these harmful pollutants. Additionally, further research into the sources of contamination in these high-risk areas is essential to prevent future problems. SGRB is generally acceptable in terms of non-cancer risks, but certain areas, especially those with high arsenic (As) and lead (Pb) concentrations, require more research, monitoring, regulation focused attention, particularly due to the heightened risks for children.
3.4.2. Cancerous Health Risk
The cancer risk (CR) was calculated for As, Cd, Cr, Ni, and Pb. Table 8 shows the overall carcinogenic risk (TCR), which is the sum of CR from both ingestion and dermal contact exposure, for both children and adults. Our results for the TCR associated with these metals showed a minimum mean value of 0.0E+00 for both children and adults, and a maximum mean value of 1.3E-03 for children only. In some stations such as S3, S5, S7, S16, S17, S23, and S24, the obtained values for CR and TCR were higher than 0.0001, which could indicate potential health problems.
The lowest TCR values at most sampling sites were 0.0E+00, indicating that no detectable carcinogenic risk from metals was found in these areas. This implies that the water in those locations is free of carcinogenic metals or minimally contaminated by them, which is a positive finding for public health [96,97]. At station S5, high concentrations of arsenic (As) for both children and adults with values of 3.6E-04 and 3.2E-04 respectively exceed the critical limit of 0.0001 for cancer risk. This suggests that the arsenic (As) risk at this station may be significant, particularly for children who are more vulnerable to environmental pollutants. Cadmium (Cd) and nickel (Ni) at station S16 showed values exceeding the threshold. For cadmium, a value of 5.3E-04 was obtained, while for nickel it was 1.4E-04 for children. For adults, the obtained value for cadmium was 4.7E-04, and for nickel it was 1.3E-04. This highlights the importance of closely monitoring these metals in areas where industrial pollution may contribute to environmental contamination. Meanwhile, nickel (Ni) at station S20 also shows concerning levels above the established limit, with values of 1.2E-03 for children and 1.1E-03 for adults. This indicates a significant cancer risk, especially from exposure to this metal.
The presence of these metals at low concentrations at some sampling stations in the SGRB could be attributed to agrochemical industries, for example, as their wastewater often contains components of pesticides and fertilizers. Even low levels of heavy metals have been shown to accumulate over time, leading to chronic exposure and long-term health risks, including cancer [98]. Despite the low concentrations observed at some monitoring stations, protecting children from exposure to heavy metals should remain a key focus for future studies and environmental monitoring, as chronic exposure to low levels of these contaminants can have cumulative impacts on children's development, cognitive health, and immune system function [96,97,98,99]. When the CR or TCR exceeds the critical value, there is a heightened concern for carcinogenic health risks. Long-term exposure to these elevated levels of metals like arsenic, cadmium, chromium and nickel can increase the likelihood of cancer, particularly among vulnerable populations such as children [64].
The percentage of samples exceeding the permissible limit varies for different metals. For example, arsenic (As) and nickel (Ni) exceed the threshold in more than 16% and 20% of the samples, respectively, at some stations, indicating that environmental interventions may be necessary to reduce exposure. Nickel (Ni) showed the most concerning pattern, with 20% of the samples exceeding the threshold at some stations (S3, S10, S16, S20, and S24), which represents a serious health issue and is consistent with results obtained by other authors [100,101,102,103]. Some metals fall within an acceptable or tolerable risk category, such as arsenic (As) and total chrome (Cr), with percentages of 44% and 32%, respectively. This suggests that, for the most part, these metals do not pose an immediate health hazard. However, long-term exposure within the tolerable range still needs to be monitored to prevent reaching harmful levels. The results indicate that while many stations have concentrations of heavy metals below the threshold established for TCR, there are several areas where the cancer risk is high due to metals such as As, Cd, Cr, and Ni. The highest risks were observed at stations S5, S16, and S20, particularly for children. Tighter environmental monitoring and public health measures are recommended in these areas to reduce exposure. Continuous monitoring and efforts to reduce industrial emissions and vehicular pollution are essential to ensure public health, especially in sensitive populations like children.
4. Conclusion
This work carried out a comprehensive study of the presence of heavy metals in the main and secondary streams located in the SGRB. Data collected in a monitoring campaign carried out at 25 sampling stations monthly from July 2021 to April 2022 were used. Analysis of the values obtained for heavy metals revealed critical results for the contamination index of these elements. Of the 25 sampling stations, 23 showed HPI results above 100 (critical values), representing 92% of the sampled locations, except for stations S2, stream El Taretán (72.238) and S17, La Soledad River (80.952), whose HPI were below 100. The water quality in the Santiago River basin in Guadalajara did not present immediate non-carcinogenic health risks at most monitoring stations, as the Hazard Index (HI) values remained low, below the established threshold (<1.000). The highest HI value was recorded at Río La Calera, at station S23 (children: 1.326, adults: 1.148) for arsenic (As). These HI values exceeded the established limit, suggesting that heavy metal levels at this location may pose potential health risks. This indicates localized contamination, and frequent periodic monitoring is required as the levels exceed the recommended safety limits.
Cancer risk (CR) and total carcinogenic risk (TCR) were assessed for arsenic, cadmium, total chrome, nickel, and lead. Most sampling sites did not show detectable cancer risk, but certain stations (S3, S5, S7, S16, S17, S23, S24) had values exceeding the established limit (0.0001), indicating potential health risks, particularly from arsenic (As), cadmium (Cd), and nickel (Ni). According to national and international criteria, the surface waters of the river are not suitable to sustain aquatic life and may require advanced treatment processes if the water is to be used for other purposes such as agriculture irrigation or as a drinking water supply. The findings of this research may be valuable to government authorities and stakeholders, enabling them to take necessary actions owing to the considerable risk to human health and the river ecosystem posed by the surface waters of the basin. The application of environmental regulations, as well as the implementation of monitoring and control measures, is necessary to reduce the risks of toxicity to aquatic life and the population exposed to contact with river waters.
Supplementary Materials
The following supporting information can be downloaded at: www.mdpi.com/xxx/s1, Figure S1: title; Table S1: title; Video S1: title.
Author Contributions
Conceptualization, J.A. and H.S.; methodology, J.A. and R.L.G-D.; software, R.L.G-D.; validation, O.Y.L-M.; investigation, J.A. O.Y.L-M.; resources, J.A.; data curation, R.L. G-D., and L.E.P-T.; writing—original draft preparation, J.A. and R.L.G-D.; writing—review and editing, J.A. and H.S.; visualization, J.A., R.L.G-D., and L.A.O-V.; supervision, J.A.; project administration, J.A.; funding acquisition, J.A. All authors have read and agreed to the published version of the manuscript.
Funding
This research was funded by Fundación Gonzalo Río Arronte I. A. P. and Fondo Noroeste, A. C. (FONNOR), and the APC was funded by MDPI as an invitation to Prof. Harvey Shear to publish in a special issue.
Data Availability Statement
The original data presented in the study are openly available in [repository name, e.g., FigShare] at [DOI/URL] or [reference/accession number].
Acknowledgments
The authors acknowledge the analytical work done by specialized experts in analytical chemistry provided by the Center for Research and Assistance in Technology and Design of the State of Jalisco, A.C. (CIATEJ) and the field sampling efforts from the State Water Commission of the State of Jalisco (CEA-Jalisco).
Conflicts of Interest
The authors declare no conflicts of interest. The funders had no role in the design of the study; in the collection, analyses, or interpretation of data; in the writing of the manuscript; or in the decision to publish the results.
Abbreviations
The following abbreviations are used in this manuscript:
| ANZECC & ARMCANZ | Australian and New Zealand Guidelines for Freshwater and Marine Water Quality |
| CCME | Canadian Council of Ministers of the Environment |
| CDI | Chronic Daily Intake |
| CSF | Cancer Slope Factor |
| FRA | Federal Rights Act |
| HI | Hazard Index |
| HHRA | Human Health Risk Assessment |
| HPI | Heavy Metal Pollution Index |
| HQ | Hazard quotients |
| ICO-OES | Inductively Coupled Plasma Optical Emission Spectroscopy |
| ICP | Inductively Coupled Plasma Spectroscopy |
| MAG | Metropolitan Area of Guadalajara |
| NIST | National Institute of Standards and Technology |
| NSDEU | National Statistical Directory of Economic Units |
| RfD | Reference Dose |
| SGRB | Santiago-Guadalajara River Basin |
| STD | Standard Deviation |
| TCR | Total Carcinogenic Risk |
| UNICEF | United Nations International Children's Emergency Fund |
| US EPA | United States Environmental Protection Agency |
| WHO | World Health Organization |
| WWTP | Wastewater Treatment Plant |
| SGRB | Linear dichroism |
Appendix A
Appendix A.1

Table A1.
Description of the geographical coordinates of the sampling points in the Santiago-Guadalajara River Basin.
Table A1.
Description of the geographical coordinates of the sampling points in the Santiago-Guadalajara River Basin.
| Sampling site |
Official Name of the sampling site |
Name of the sampled tributary |
West Longitude |
North Latitude |
| 1 | Arandas | Arroyo La Madrastra | 102° 20' 23'' | 20° 41' 46'' |
| 2 | Atotonilco el Alto | Arroyo El Taretán | 102° 30' 09'' | 20° 32' 43'' |
| 3 | La Ladera | Arroyo Los Morales | 102° 43' 50'' | 20° 35' 50'' |
| 4 | Gaviotas | Río Calderón | 102° 51' 06'' | 20° 42' 06'' |
| 5 | San José de Gracia | Río Calderón | 102° 42' 07'' | 20° 47' 10'' |
| 6 | San Miguel | Arroyo Tierras Coloradas | 102° 47' 18'' | 20° 32' 06'' |
| 7 | Ocotlán Centro | Río Zula | 102° 46' 41'' | 20° 20' 41'' |
| 8 | Los Cerritos | Arroyo Chico | 102° 44' 58'' | 20° 26' 47'' |
| 9 | La Laja | Arroyo Grande | 103° 07' 40'' | 20° 34' 41'' |
| 10 | Río Zapotlanejo | Río Zapotlanejo | 103° 05' 44'' | 20° 37' 23'' |
| 11 | La Azucena | Arroyo El Ahogado | 103° 13' 40'' | 20° 29' 51'' |
| 12 | La Noria | Río Santiago | 103° 13' 35'' | 20° 28' 03'' |
| 13 | Río Santiago1 | Río Santiago | 103° 11' 04'' | 20° 27' 17'' |
| 14 | Carretera Guadalajara – Chapala | Arroyo Las Pintas | 103° 15' 55'' | 20° 28' 41'' |
| 15 | Presa Corona | Río Santiago | 103° 05' 35'' | 20° 24' 01'' |
| 16 | Paso a Guadalupe | Río Santiago | 103° 19' 44'' | 20° 50' 20'' |
| 17 | Rancho La Soledad | Río La Soledad | 103° 22' 15'' | 20° 53' 40'' |
| 18 | Plan de Oriente | Arroyo El Ahogado | 103° 17' 03'' | 20° 35' 19'' |
| 19 | Villa Fontana | Arroyo Las Pintas | 103° 21' 48'' | 20° 33' 46'' |
| 20 | San José del Quince | Arroyo El Ahogado | 103° 17' 48'' | 20° 32' 16'' |
| 21 | El Arenal | Río Arenal | 103° 38' 19'' | 20° 43' 24'' |
| 22 | San Isidro | Río Blanco | 103° 27' 34'' | 20° 47' 47'' |
| 23 | San Cristóbal de la Barranca | Río La Calera | 103° 25' 59'' | 21° 02' 51'' |
| 24 | Tequila | Río Amatitán | 103° 49' 54'' | 20° 53' 54'' |
| 25 | Hostotipaquillo | Río Los Sabinos | 104° 00' 40'' | 21° 01' 56'' |
References
- Ingrao, C.; Strippol,i R.; Lagioia, G.; Huisingh, D. Water scarcity in agriculture: An overview of causes, impacts and approaches for reducing the risks. Heliyon 2023, 9(8), 18507. [CrossRef]
- Vázquez-Tapia, I.; Salazar-Martínez, T.; Acosta-Castro, M.; Meléndez-Castolo, K.A.; Mahlknecht, J.; Cervantes-Avilés, P.; Capparelli, M.V.; Mora, A. Occurrence of emerging organic contaminants and endocrine disruptors in different water compartments in Mexico–A review. Chemosphere 2022, 308, 136285. [CrossRef]
- Ewaid, S.H.; Abed, S.A.; Al-Ansari, N.; Salih, R.M. Development and evaluation of a water quality index for the Iraqi rivers. Hydrology 2020, 7(3), 67. [CrossRef]
- Al-Addous, M.; Bdour, M.; Alnaief, M.; Rabaiah, S.; Schweimanns, N. Water resources in Jordan: a review of current challenges and future opportunities. Water 2023, 15(21), 3729. [CrossRef]
- Qin, Y. Urban flooding mitigation techniques: A systematic review and future studies. Water 2020, 12(12), 3579. [CrossRef]
- Tirgar, A.; Aghalari, Z.; Sillanpää, M.; Dahms, H.U. A glance at one decade of water pollution research in Iranian environmental health journals. International Journal of Food Contamination 2020, 7, 1-8. [CrossRef]
- US EPA. Water Releases by Chemical & Industry. Available online: https://www.epa.gov/trinationalanalysis/water-releases-chemical-industry (accessed 04 Jan 2025).
- Gikas, G.D.; Sylaios, G.K.; Tsihrintzis, V.A; Konstantinou, I.K., Albanis, T.; Boskidis, I. Comparative evaluation of river chemical status based on WFD methodology and CCME water quality index. Science of the Total Environment 2020, 745, 140849. [CrossRef]
- Agarwal, R.; Chaudhary, M.; Singh, J. Waste management initiatives in India for human well being. European Scientific Journal 2015. Available online: https://smartnet.niua.org/sites/default/files/resources/h16.pdf (accessed 04 Jan 2025).
- Chan, E.Y.Y.; Tong, K.H.Y.; Dubois, C.; Mc Donnell, K.; Kim, J.H.; Hung, K.K.C.; Kwok, K.O. Narrative review of primary preventive interventions against water-borne diseases: scientific evidence of health-EDRM in contexts with inadequate safe drinking water. International Journal of Environmental Research and Public Health 2021, 18(23), 12268. [CrossRef]
- Velarde, L.; Nabavi, M.S.; Escalera, E.; Antti, M.L.; Akhtar, F. Adsorption of heavy metals on natural zeolites: A review. Chemosphere 2023, 328, 138508. [CrossRef]
- Zeng, Y.; Lin, Y.; Ma, M.; Chen, H. A review on the removal of heavy metals from water by phosphorus-enriched biochar. Minerals 2024, 14(1), 61. [CrossRef]
- Velayatzadeh, M. Heavy metals in surface soils and crops. In Heavy Metals-Recent Advances 2023. IntechOpen. [CrossRef]
- Wu, J.; Li, P.; Wang, D.; Ren, X.; Wei, M. Statistical and multivariate statistical techniques to trace the sources and affecting factors of groundwater pollution in a rapidly growing city on the Chinese Loess Plateau. Human and Ecological Risk Assessment: An International Journal 2020. [CrossRef]
- Chen, X.; Hossain, M.F.; Duan, C., Lu, J.; Tsang, Y.F.; Islam, M. S.; Zhou, Y. Isotherm models for adsorption of heavy metals from water-a review. Chemosphere 2022, 307, 135545. [CrossRef]
- Chowdhury, S.; Mazumder, M. J.; Al-Attas, O.; Husain, T. Heavy metals in drinking water: occurrences, implications, and future needs in developing countries. Science of the total Environment 2016, 569, 476-488. [CrossRef]
- Coradduzza, D.; Congiargiu, A.; Azara, E.; Mammani, I.M.A.; De Miglio, M.R.; Zinellu, A.; ... Medici, S. Heavy metals in biological samples of cancer patients: a systematic literature review. BioMetals 2024, 1-15. doi.org/10.1007/s10534-024-00583-4.
- Nnaji, N.D.; Onyeaka, H.; Miri, T.; Ugwa, C. Bioaccumulation for heavy metal removal: a review. SN Applied Sciences 2023, 5(5), 125. [CrossRef]
- Zaynab, M.; Al-Yahyai, R.; Ameen, A.; Sharif, Y.; Ali, L.; Fatima, M.; ... Li, S. Health and environmental effects of heavy metals. Journal of King Saud University-Science 2022, 34(1), 101653. [CrossRef]
- Gayathri, S.; Krishnan, K.A.; Krishnakumar, A.; Maya, T. V., Dev, V.V.; Antony, S.; Arun, V. Monitoring of heavy metal contamination in Netravati river basin: overview of pollution indices and risk assessment. Sustainable Water Resources Management 2021, 7(2), 20. [CrossRef]
- Jaskuła, J.; Sojka, M. Assessment of spatial distribution of sediment contamination with heavy metals in the two biggest rivers in Poland. Catena 2022, 211, 105959. [CrossRef]
- Yang, C.; Zeng, Z.; Wang, Y.; He, G.; Hu, Y.; Gao, D.; ... & Zhang, H. Ecological risk assessment and identification of the distinct microbial groups in heavy metal-polluted river sediments. Environmental Geochemistry and Health 2023, 45(5), 1311-1329. [CrossRef]
- Hao, X.; Ouyang, W.; Gu, X.; He, M.; Lin, C. Accelerated export and transportation of heavy metals in watersheds under high geological backgrounds. Journal of Hazardous Materials 2024, 465, 133514. [CrossRef]
- Mora, A.; García-Gamboa, M.; Sánchez-Luna, M.S.; Gloria-García, L.; Cervantes-Avilés, P.; Mahlknecht, J. A review of the current environmental status and human health implications of one of the most polluted rivers of Mexico: The Atoyac River, Puebla. Science of the Total Environment 2021, 782, 146788. [CrossRef]
- Pérez Castresana, G.; Castañeda Roldán, E.; García Suastegui, W.A.;Morán Perales, J.L.; Cruz Montalvo, A.; Handal Silva, A. Evaluation of health risks due to heavy metals in a rural population exposed to Atoyac River pollution in Puebla, Mexico. Water 2019, 11(2), 277. [CrossRef]
- Núñez-Razo, I.; de Anda, J.; Barrios-Piña, H.; Olvera-Vargas, L.A.; García-Ruíz-García, M.; Hernández-Morales, S. Development of a Watershed Sustainability Index for the Santiago River Basin, Mexico. Sustainability 2023, 15(10), 8428. [CrossRef]
- Dutta, D.; Arya, S.; Kumar, S. Industrial wastewater treatment: Current trends, bottlenecks, and best practices. Chemosphere 2021, 285, 131245. [CrossRef]
- Tchounwou, P.B.; Yedjou, C.G.; Patlolla, A.K.; Sutton, D.J. Heavy metal toxicity and the environment. Molecular, clinical and environmental toxicology: volume 3: environmental toxicology 2012, 133-164. [CrossRef]
- Briseño-Bugarín, J.; Araujo-Padilla, X.; Escot-Espinoza, V.M.; Cardoso-Ortiz, J.; Flores de la Torre, J.A.; López-Luna, A. Lead (Pb) Pollution in Soil: A Systematic Review and Meta-Analysis of Contamination Grade and Health Risk in Mexico. Environments 2024, 11(3), 43. [CrossRef]
- Aguilera, A.; Cortés, J.L.; Delgado, C.; Aguilar, Y.; Aguilar, D.; Cejudo, R.; ... Bautista, F. Heavy metal contamination (Cu, Pb, Zn, Fe, and Mn) in urban dust and its possible ecological and human health risk in Mexican cities. Frontiers in Environmental Science 2022, 10, 854460. [CrossRef]
- Singh, B.P.; Gupta, P. Assessment of Heavy Metal Pollution in Groundwater in the Hindon River Basin Using Pollution Index. In E3S Web of Conferences, 2024; Vol. 596, p. 01005. EDP Sciences. Available online: https://www.e3s-conferences.org/articles/e3sconf/pdf/2024/126/e3sconf_iccmes2024_01005.pdf (accessed 04 Jan 2025).
- Ahirvar, B.P.; Das, P.; Srivastava, V.; Kumar, M. Perspectives of heavy metal pollution indices for soil, sediment, and water pollution evaluation: An insight. Total Environment Research Themes 2023, 6, 100039. [CrossRef]
- Sahoo, M.M.; Swain, J.B. Modified heavy metal Pollution index (m-HPI) for surface water Quality in river basins, India. Environmental Science and Pollution Research 2020, 27(13), 15350-15364. [CrossRef]
- Chakraborty, T.K.; Ghosh, G.C.; Hossain, M.R.; Islam, M.S.; Habib, A., Zaman, S.; ... Khan, A.S. Human health risk and receptor model-oriented sources of heavy metal pollution in commonly consume vegetable and fish species of high Ganges river floodplain agro-ecological area, Bangladesh. Heliyon 2022, 8(10). [CrossRef]
- Ferreira, S.L.; Cerda, V.; Cunha, F.A.; Lemos, V.A.; Teixeira, L.S.; dos Santos, W.N.; ... de Jesus, R.F. Application of human health risk indices in assessing contamination from chemical elements in food samples. TrAC Trends in Analytical Chemistry 2023, 117281. [CrossRef]
- Chen, X.; Fu, X.; Li, G.; Zhang, J.; Li, H.; Xie, F. Source-specific probabilistic health risk assessment of heavy metals in surface water of the Yangtze River Basin. Science of the Total Environment 2024, 926, 171923. [CrossRef]
- Chorol, L.; Gupta, S.K. Evaluation of groundwater heavy metal pollution index through analytical hierarchy process and its health risk assessment via Monte Carlo simulation. Process Safety and Environmental Protection 2023, 170, 855-864. [CrossRef]
- Li, J.; Li, X.; Wang, C.; Liu, J.Z.; Gao, Z.D.; Li, K. M.; ... Zang, F. Pollution characteristics and probabilistic risk assessment of heavy metal (loid) s in agricultural soils across the Yellow River Basin, China. Ecological Indicators 2024, 167, 112676. [CrossRef]
- Bollo-Manent, M.; Montaño, R.; Hernández, J.R. Situación ambiental de la cuenca Santiago-Guadalajara., 1st ed. Universidad Nacional Autónoma de México. Centro de Investigaciones en Geografía Ambiental. Morelia, Michoacán, México, 2017. Available online: https://sigat.semadet.jalisco.gob.mx/pofa/index_archivos/libro/Libro%20SACRSG_vf.pdf (accessed 04 Jan 2025).
- Pedrozo-Acuña, A. Restauración de ríos, un paso hacia la sustentabilidad hídrica. PERSPECTIVAS IMTA 2020, 34, 5p. Available online: https://www.imta.gob.mx/gobmx/DOI/perspectivas/2020/b-imta-perspectivas-2020-34.pdf (accessed 04 Jan 2025).
- Díaz-Quiñonez, J.A. Tula Basin, the most polluted region in Mexico. Mexican Journal of Medical Research ICSA 2023, 11(22), I-II. [CrossRef]
- Izquierdo-Vega, J.A.; Sánchez-Gutiérrez, M.; Peña, L.C.S.; Martínez-Acuña, M.I.; Del Razo, L.M. Arsenic and Fluoride in the Drinking Water in Tula City, México: Challenges and Lessons Learned. Water, Air, & Soil Pollution 2022, 233(6), 200. [CrossRef]
- Castresana, G.P.; Flores, V.T.; Reyes, L. L.; Aldana, F.H.,; Vega, R.C.; Perales, J.L.M.; ... Silva, A.H. Atoyac river pollution in the metropolitan area of Puebla, México. Water 2018, 10, 267. [CrossRef]
- Cotler Ávalos, H.; Mazari Hiriart, M.; de Anda Sánchez, J. Atlas de la cuenca Lerma-Chapala, construyendo una visión conjunta. Secretaria de Medio Ambiente y Recursos Naturales, México, 2006. Available on line: https://agua.org.mx/wp-content/uploads/2011/09/AtlasCuencaLermaChapala.pdf (accessed 04 Jan 2025).
- Gobierno del Estado de Jalisco. Área Metropolitana de Guadalajara. Available on line: https://jalisco.gob.mx/jalisco/guadalajara (accessed 04 Jan 2025).
- de Anda, J.; Shear, H.; Lugo-Melchor, O.Y.; Padilla-Tovar, L.E.; Bravo, S. D.; Olvera-Vargas, L.A. Use of the Pesticide Toxicity Index to Determine Potential Ecological Risk in the Santiago-Guadalajara River Basin, Mexico. Water 2024, 16(20), 3008. doi.org/10.3390/w16203008.
- McCulligh, C. Wastewater and wishful thinking: Treatment plants to “revive” the Santiago River in Mexico. Environment and Planning E: Nature and Space 2023, 6(3), 1966-1986. [CrossRef]
- Riera, F.S.; Pulido, V.M.M.; Sánchez, I.L.D.R.; Hoffmeister, M. Integrated solutions to improve wastewater quality in Mendoza and Santiago River Basin. Water International 2024, 49(3-4), 517-531. [CrossRef]
- INEGI-DENUE. Directorio Estadístico Nacional de Unidades Económicas. Instituto Nacional de Estadística y Geografía. Aguascalientes, México. Available online: Available: https://www.inegi.org.mx/app/mapa/denue/default.aspx (accessed 04 Jan 2025).
- Srivastava, A.; Chinnasamy, P. Watershed development interventions for rural water safety, security, and sustainability in semi-arid region of Western-India. Environment, Development and Sustainability 2024, 26(7), 18231-18265. [CrossRef]
- Su, Y.; Dong, X.; Li, Y.; Hong, Q.; Flower, R. Optimizing safe and just operating spaces at sub-watershed scales to guide local environmental management. Journal of Cleaner Production 2023, 398, 136530. [CrossRef]
- US EPA. SW-846 Test Method 3005A: Acid Digestion of Waters for Total Recoverable or Dissolved Metals for Analysis by Flame Atomic Absorption (FLAA) or Inductively Coupled Plasma (ICP) Spectroscopy. United States Environmental Protection Agency, USA. Available on line: https://www.epa.gov/hw-sw846/sw-846-test-method-3005a-acid-digestion-waters-total-recoverable-or-dissolved-metals (accessed 04 Jan 2025).
- NMX-AA-051-SCFI-2001. Water analysis - Determination of metals by atomic absorption in natural, potable, residual, and treated residual waters. Secretaría de Economía, México. Available on line: https://www.gob.mx/cms/uploads/attachment/file/166785/NMX-AA-051-SCFI-2001.pdf (accessed 04 Jan 2025).
- NIST. NIST Policy on Metrological Traceability. National Institute of Standards and Technology, USA. Available on line: https://www.nist.gov/calibrations/traceability (accessed 04Jan 2025).
- LFD. Ley Federal de Derechos. Cámara de Diputados del H. Congreso de la Unión. México. Available on line: https://www.diputados.gob.mx/LeyesBiblio/ref/lfd.htm (accessed 04 Jan 2025).
- US EPA. Justification of Appropriation Estimates for the Committee on Appropriations. United States Environmental Protection Agency, USA. Available online: https://www.epa.gov/system/files/documents/2023-04/fy24-cj-03-goal-objective-overview.pdf (accessed 04 Jan 2025).
- CCME. Water-Aquatic Life. Canadian Water Quality Guidelines for the Protection of Aquatic Life. Canadian Council of Ministers of the Environment. Available online: https://ccme.ca/en/resources/water-aquatic-life (accessed 04 Jan 2025).
- ANZECC & ARMCANZ. Toxicant default guideline values for aquatic ecosystems — technical briefs. Metals and Metalloids. Australian Government Initiative. Available online: https://www.waterquality.gov.au/anz-guidelines/guideline-values/default/water-quality-toxicants/toxicants (accessed 04 Jan 2025).
- Mohan, S.V.; Nithila, P.; Reddy, S.J. Estimation of heavy metals in drinking water and development of heavy metal pollution index. Journal of Environmental Science & Health Part A 1996, 31(2), 283-289. doi.org/10.1080/10934529609376357.
- Asim, M.; Nageswara Rao, K. Assessment of heavy metal pollution in Yamuna River, Delhi-NCR, using heavy metal pollution index and GIS. Environmental Monitoring and Assessment 2021, 193(2), 103. [CrossRef]
- Caeiro, S.; Costa, M. H.; Ramos, T. B.; Fernandes, F.; Silveira, N.; Coimbra, A.; ... Painho, M. Assessing heavy metal contamination in Sado Estuary sediment: an index analysis approach. Ecological indicators 2005, 5(2), 151-169. [CrossRef]
- Hartiningsih, D.; Diana, S.; Yuniarti, M.S.; Ismail, M.R.; Sari, Q.W. Water quality pollution indices to assess the heavy metal contamination: A case study of the estuarine waters in Cirebon City (West Java, Indonesia) Pre-and post-CARE COVID-19. Environmental and Sustainability Indicators 2024, 21, 100318. doi.org/10.1016/j.indic.2023.100318.
- Bamuwamye, M.; Ogwok, P.,; Tumuhairwe, V.; Eragu, R.; Nakisozi, H.; Ogwang, P. E. Human health risk assessment of heavy metals in Kampala (Uganda) drinking water. Journal of Food Research 2017; 6(4), 6-12. [CrossRef]
- Selvam, S.; Jesuraja, K.; Roy, P.D.; Venkatramanan, S.; Khan, R., Shukla, S.; ... Muthukumar, P. Human health risk assessment of heavy metal and pathogenic contamination in surface water of the Punnakayal estuary, South India. Chemosphere 2022, 298, 134027. doi.org/10.1016/j.chemosphere.2022.134027.
- U.S. EPA. Exposure Factors Handbook 2011 Edition (Final Report). U.S. Environmental Protection Agency, Washington, DC, EPA/600/R-09/052F, 2011. Available on line: https://cfpub.epa.gov/ncea/risk/recordisplay.cfm?deid=236252 (accessed 04 Jan 2025).
- US EPA. Risk Assessment Guidance for Superfund. Volume I: Human Health Evaluation Manual (Part E, Supplemental Guidance for Dermal Risk Assessment). U.S. Environmental Protection Agency, Washington, DC. EPA/540/R/99. 2011. Available on line: https://www.epa.gov/risk/risk-assessment-guidance-superfund-rags-part-e (accessed 04 Jan 2025).
- US EPA. Guidelines for ecological risk assessment. Environmental Protection Agency. Washington, DC, USA. 1998. Avaiable on line: https://www.epa.gov/risk/guidelines-ecological-risk-assessment (accessed 04 Jan 2025).
- Tokatli, C.; Ustaoğlu, F. Health risk assessment of toxicants in Meriç river delta wetland, thrace region, Turkey. Environmental earth sciences 2020, 79(18), 426. [CrossRef]
- de Anda, J.; Olvera-Vargas, L.A.; Lugo-Melchor, O.Y.; Shear, H. Ecological Risk Assessment to Aquatic Life from Metals in the Surface Sediments of the Santiago-Guadalajara River Basin, Mexico. Soil and Sediment Contamination: An International Journal 2024, 1-19. [CrossRef]
- Ghaisas, N.A.; Maiti, K.; Roy, A. Iron-Mediated Organic Matter Preservation in the Mississippi River-Influenced Shelf Sediments. Journal of Geophysical Research: Biogeosciences 2021, 126(4), e2020JG006089. [CrossRef]
- Rodríguez-Hernández, A.; Lázaro, I.; Razo, I.; Briones-Gallardo, R. Geochemical and mineralogical characterization of stream sediments impacted by mine wastes containing arsenic, cadmium and lead in North-Central Mexico. Journal of Geochemical Exploration 2021, 221, 106707. [CrossRef]
- Valladares, L.D.L.S.,; Vargas-Luque, A.; Borja-Castro, L.; Valencia-Bedregal, R.; de Jesús Velazquez-Garcia, J.; Barnes, E.P.; ... Barnes, C.H.W. Physical and chemical techniques for a comprehensive characterization of river sediment: A case of study, the Moquegua River, Peru. International Journal of Sediment Research 2024, 39(3), 478-494. [CrossRef]
- Salcedo Sánchez, E.R.; Martínez, J.M.E.; Morales, M.M.; Talavera Mendoza, O.; Alberich, M.V.E. Ecological and health risk assessment of potential toxic elements from a mining area (water and sediments): the San Juan-Taxco River system, Guerrero, Mexico. Water 2022, 14(4), 518. [CrossRef]
- Ramos, E.; Bux, R.K., Medina, D.I.; Barrios-Piña, H.; Mahlknecht, J. Spatial and multivariate statistical analyses of human health risk associated with the consumption of heavy metals in groundwater of Monterrey Metropolitan Area, Mexico. Water 2023, 15(6), 1243. [CrossRef]
- A Biasi, L.; de las Mercedes, A.; Messina, D.G.A.; Gómez, D.; Noemi, N. Determinación de Zinc en muestras de agua de ríos y red de la provincia de San Luis y aguas envasadas. Diaeta 2020, 38(173), 38-48. Available on line: https://www.scielo.org.ar/pdf/diaeta/v38n173/1852-7337-diaeta-38-173-38.pdf (accessed 04 Jan 2025).
- Y. Wang et al., “Assessment of heavy metals in surface water, sediment and macrozoobenthos in inland rivers: a case study of the Heihe River, Northwest China,” Environ. Sci. Pollut. Res., vol. 29, no. 23, pp. 35253–35268, 2022. [CrossRef]
- Yin, S.; Feng, C.; Li, Y.; Yin, L.; Shen, Z. Heavy metal pollution in the surface water of the Yangtze Estuary: a 5-year follow-up study. Chemosphere 2015, 138, 718-725. [CrossRef]
- Qiao, P.; Wang, S.; Li, J.; Zhao, Q.; Wei, Y.; Lei, M.; ... Zhang, Z. Process, influencing factors, and simulation of the lateral transport of heavy metals in surface runoff in a mining area driven by rainfall: A review. Science of the Total Environment 2023, 857, 159119. [CrossRef]
- Zhang, Y.; Wang, S.; Gao, Z.; Zhang, H.; Zhu, Z.; Jiang, B.; ... Dong, H. Contamination characteristics, source analysis and health risk assessment of heavy metals in the soil in Shi River Basin in China based on high density sampling. Ecotoxicology and Environmental Safety 2021, 227, 112926. [CrossRef]
- Montalvo, C.; Aguilar, C.; Argaes, J.; Cerón, R.M.; Cerón, J.G.; Amador L.E.; Ramírez, M.A. Cuantificación de los niveles de metales pesados en el río Palizada. In Análisis del Espacio Urbano y sus Consecuencias Ambientales en la Región de la Laguna de Términos, Villegas Sierra, J., Cerón Bretón R.M. (Coord.). Universidad Autónoma de Campeche, México, 2018, ch. 9, pp. 181–213. Avaiabe on line: https://www.researchgate.net/publication/326812827_Cuantificacion_de_los_niveles_de_metales_pesados_en_el_rio_Palizada (accessed 04 Jan 2025).
- Figueroa, E.C. La población en riesgo y la calidad del agua al sur de la Zona Metropolitana de Guadalajara (Jalisco, México). Agua y territorio= Water and Landscape 2021, (17), 55-76. [CrossRef]
- McCulligh, C.; Arellano-García, L.; Casas-Beltrán, D. Unsafe waters: the hydrosocial cycle of drinking water in Western Mexico. Local Environment 2020, 25(8), 576-596. [CrossRef]
- McCulligh, C.; Vega Fregoso, G. Defiance from Down River: deflection and dispute in the urban-industrial metabolism of pollution in Guadalajara. Sustainability 2019, 11(22), 6294. [CrossRef]
- Graffelman, J.; De Leeuw, J. Improved approximation and visualization of the correlation matrix. The American Statistician 2023, 77(4), 432-442. [CrossRef]
- Biondi, G.; Franzoni, V. Discovering correlation indices for link prediction using differential evolution. Mathematics 2020, 8(11), 2097. [CrossRef]
- Ozturk, M.; Metin, M.; Altay, V.; Bhat, R. A.; Ejaz, M., Gul, A.; ... Kawano, T. Arsenic and human health: genotoxicity, epigenomic effects, and cancer signaling. Biological Trace Element Research 2022, 1-14. [CrossRef]
- Garkal, A.; Sarode, L.; Bangar, P.; Mehta, T.; Singh, D. P.; Rawal, R. Understanding arsenic toxicity: Implications for environmental exposure and human health. Journal of Hazardous Materials Letters 2024, 5, 100090. [CrossRef]
- Arshad, I.; Umar, R. Status of heavy metals and metalloid concentrations in water resources and associated health risks in parts of Indo-Gangetic plain, India. Groundwater for Sustainable Development 2023, 23, 101047. [CrossRef]
- Yao, M.; Zeng, Q.; Luo, P.; Yang, G.; Li, J.; Sun, B.; ... Zhang, A. Assessing the health risks of coal-burning arsenic-induced skin damage: A 22-year follow-up study in Guizhou, China. Science of The Total Environment 2023, 905, 167236. [CrossRef]
- Althobaiti, N.A. Heavy metals exposure and Alzheimer’s disease: Underlying mechanisms and advancing therapeutic approaches. Behavioural Brain Research 2024, 115212. [CrossRef]
- Z Wang, Z.; Zhao, H.; Xu, Y.; Zhao, J.; Song, Z.; Bi, Y.; ... Zhang, S. Early-life lead exposure induces long-term toxicity in the central nervous system: From zebrafish larvae to juveniles and adults. Science of the Total Environment 2022, 804, 150185. [CrossRef]
- Dike, C.; Antia, M.; Bababtunde, B.; Sikoki, F.; Ezejiofor, A. Cognitive, Sensory, and Motor Impairments Associated with Aluminium, Manganese, Mercury and Lead Exposures in the Onset of Neurodegeneration. IPS Journal of Public Health 2023, 2(1), 1-17. [CrossRef]
- Jolaosho, T.L.; Elegbede, I.O.; Ndimele, P.E.; Mekuleyi, G.O.; Oladipupo, I.O; Mustapha, A.A. Comprehensive geochemical assessment, probable ecological and human health risks of heavy metals in water and sediments from dredged and non-dredged Rivers in Lagos, Nigeria. Journal of Hazardous Materials Advances 2023, 12, 100379. [CrossRef]
- Ugbede, F.O.; Aduo, B.C.; Ogbonna, O.N.; Ekoh, O.C. Natural radionuclides, heavy metals and health risk assessment in surface water of Nkalagu river dam with statistical analysis. Scientific African 2020, 8, e00439. [CrossRef]
- Thakkar, D.; Valand, M.; Vachhrajani, K. Assessment of seasonal variations in soil heavy metal concentrations and potential health risks in Gujarat, India. Environmental geochemistry and health 2024, 46(10), 391. [CrossRef]
- Anyanwu, E. D.; Nwachukwu, E.D. Heavy metal content and health risk assessment of a South-eastern Nigeria River. Applied Water Science 2020, 10(9), 210. [CrossRef]
- Lipy, E.P.; Mohanta, L.C.; Islam, D.; Lyzu, C., Akhter, S.; Hakim, M. The impact of feeding pattern on heavy metal accumulation and associated health risks in fishes from the Dhaleshwari River Bangladesh. Heliyon 2024, 10(23). [CrossRef]
- Teschke, R. Copper, Iron, Cadmium, and Arsenic, All Generated in the Universe: Elucidating Their Environmental Impact Risk on Human Health Including Clinical Liver Injury. International Journal of Molecular Sciences 2024, 25(12), 6662. [CrossRef]
- Cui, L.; Wang, X.; Li, J.; Gao, X.; Zhang, J.; Liu, Z. Ecological and health risk assessments and water quality criteria of heavy metals in the Haihe River. Environmental Pollution 2021, 290, 117971. [CrossRef]
- Temesgen, M.; Alemu, T.; Shasho, E. Heavy Metals Pollution and Potential Health Risks: The Case of the Koche River, Tatek Industrial Zone, Burayu, Ethiopia. Journal of Toxicology 2024, 2024(1), 9425206. [CrossRef]
- Akhtar, M. N.; Anees, M. T.; Ansari, E.; Ja’afar, J. B.; Danish, M.; Bakar, E. A. Baseline Assessment of Heavy Metal Pollution during COVID-19 near River Mouth of Kerian River, Malaysia. Sustainability 2022, 14(7), 3976. [CrossRef]
- Bmh, A.T. Preliminary Assessment of Several Heavy Metal Ions (Fe, Cu, Ni, Zn, Cr, Pb, and Cd) in Water, Sediment, Ceratophyllum demersum, and Potamogeton pectinatus Plants from Marsh Al-Hawizeh, Iraq. Journal of Water and Environment Technology 2021, 19(4), 185-197. [CrossRef]
- Usman, M.M.; Abdulkareem, M.N.; Muhammad, A.; Hamza, K. Environmental Impact Assessment Of Heavy Metals Effluient (Chromium & Nickel) Released Into Romi River, Kaduna State: A Case Study. Fudma Journal of Sciences 2020, 4(3), 704-707. Available on line: https://fjs.fudutsinma.edu.ng/index.php/fjs/article/view/283.
Figure 1.
Geographic location of the Santiago-Guadalajara River Basin.
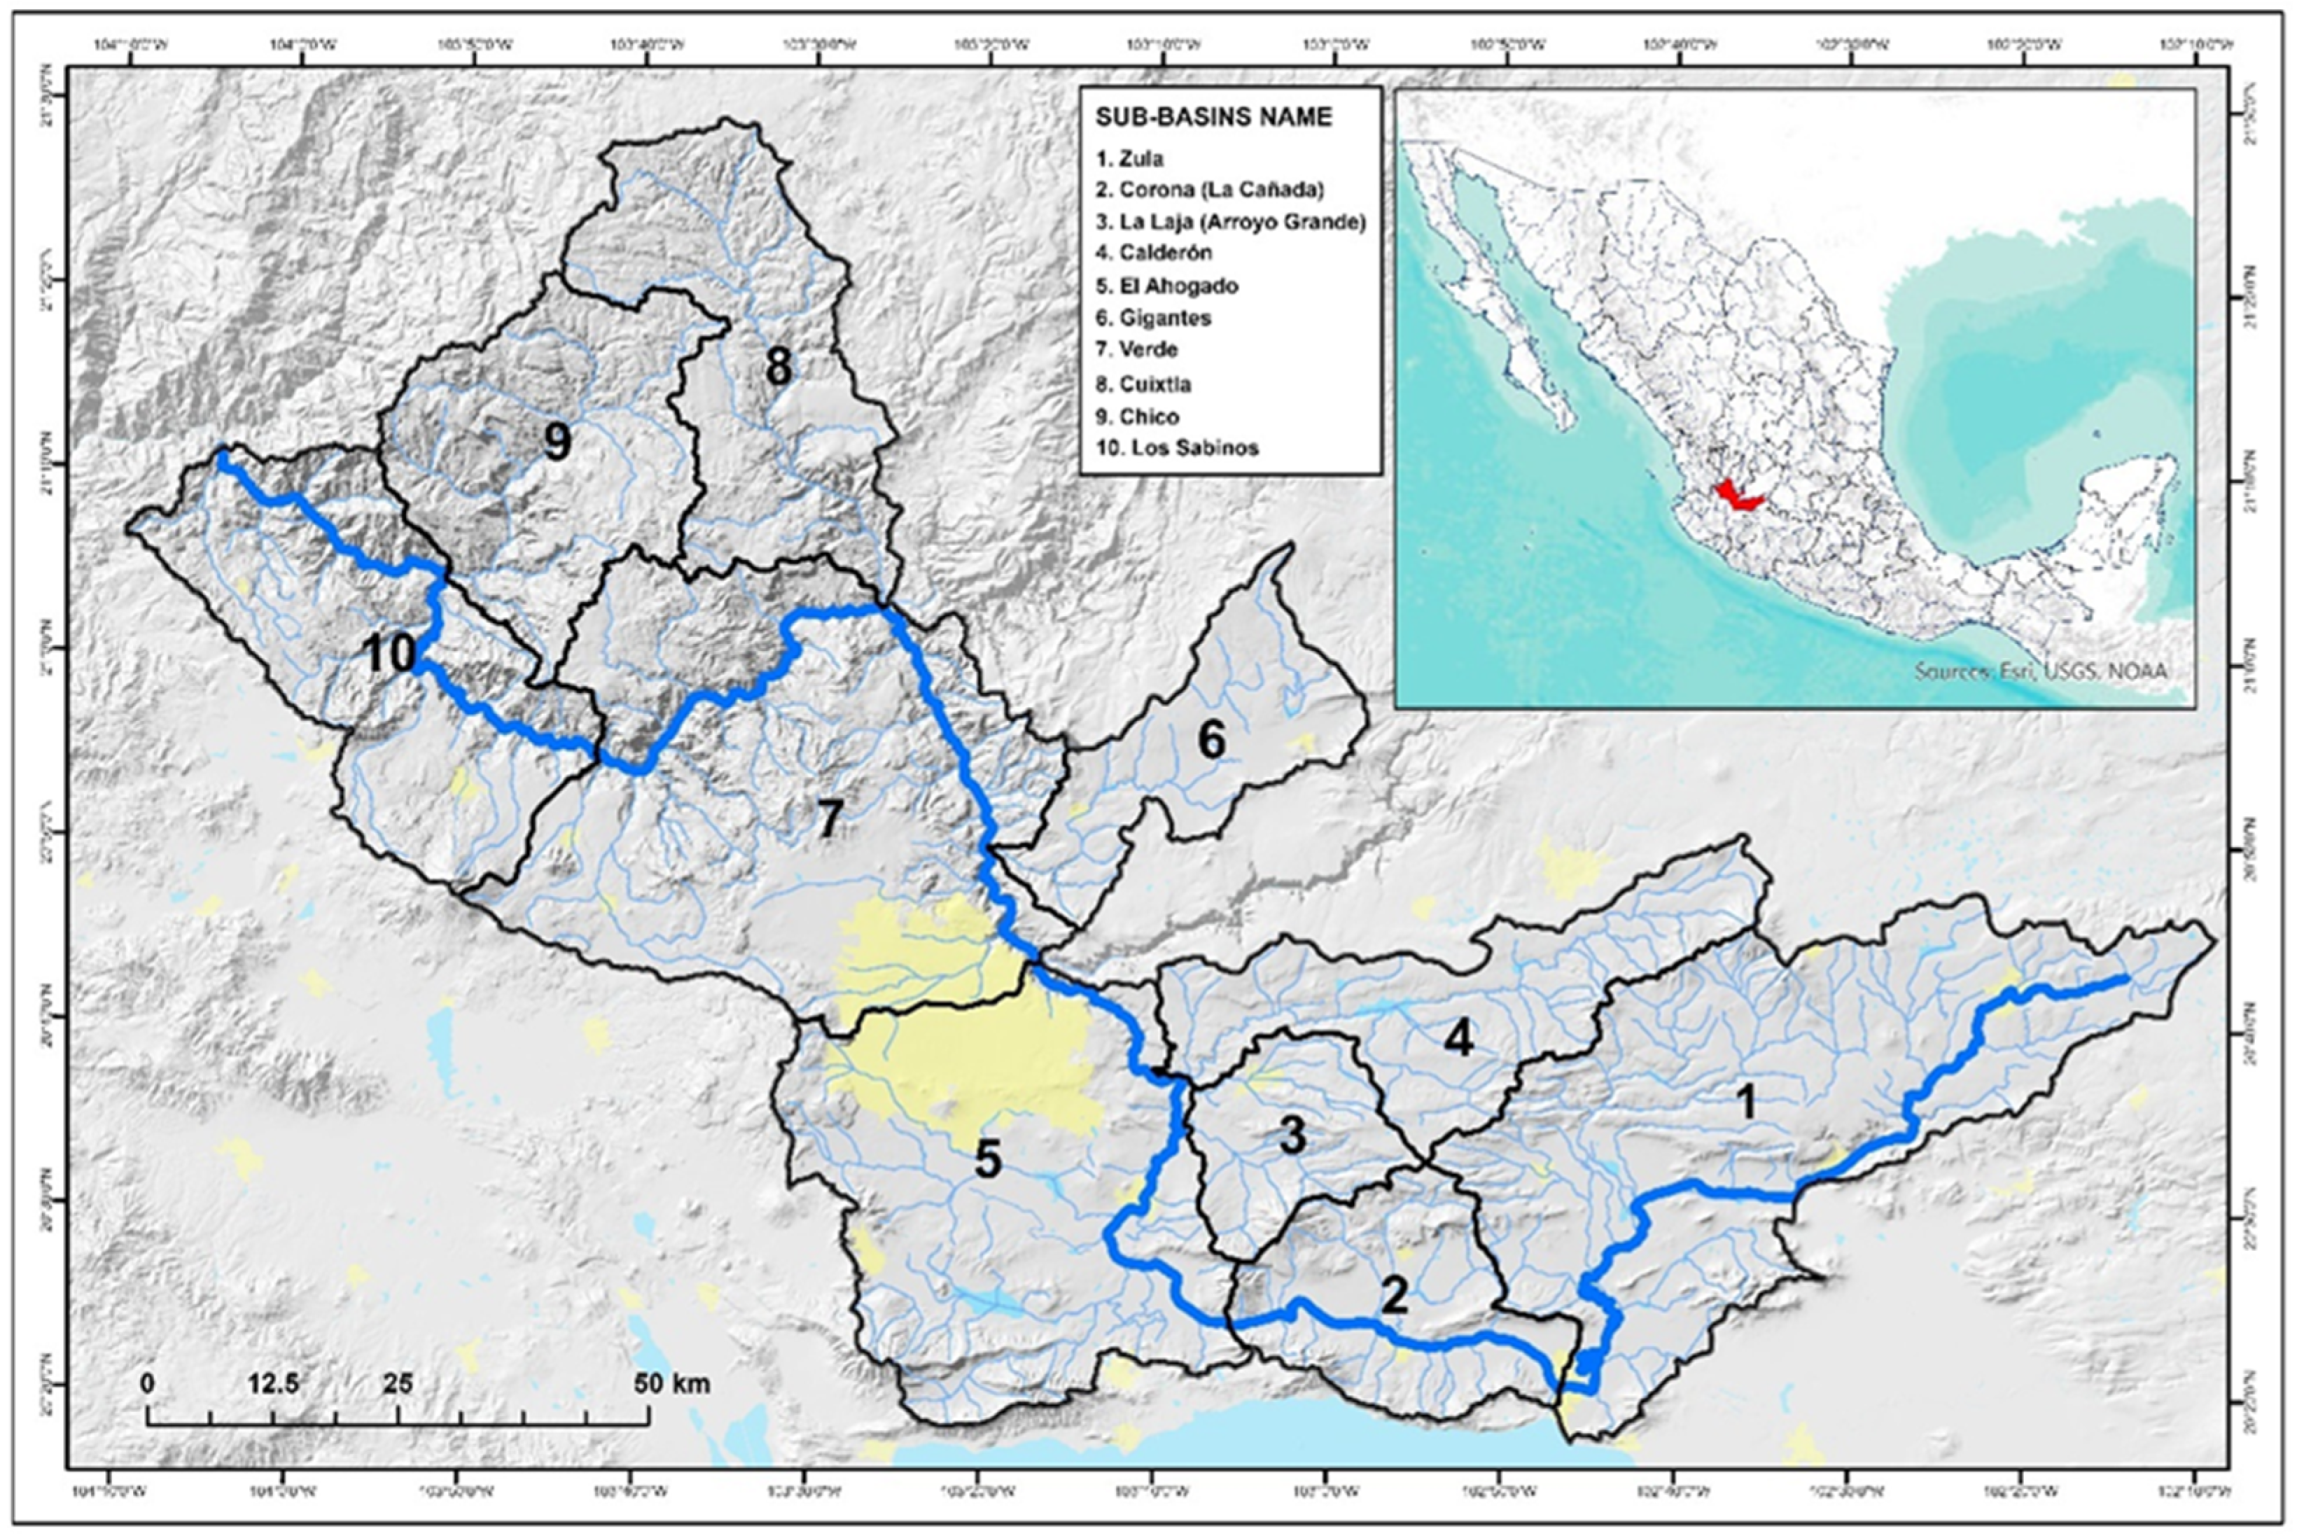
Figure 2.
Land use and vegetation type in the study area.
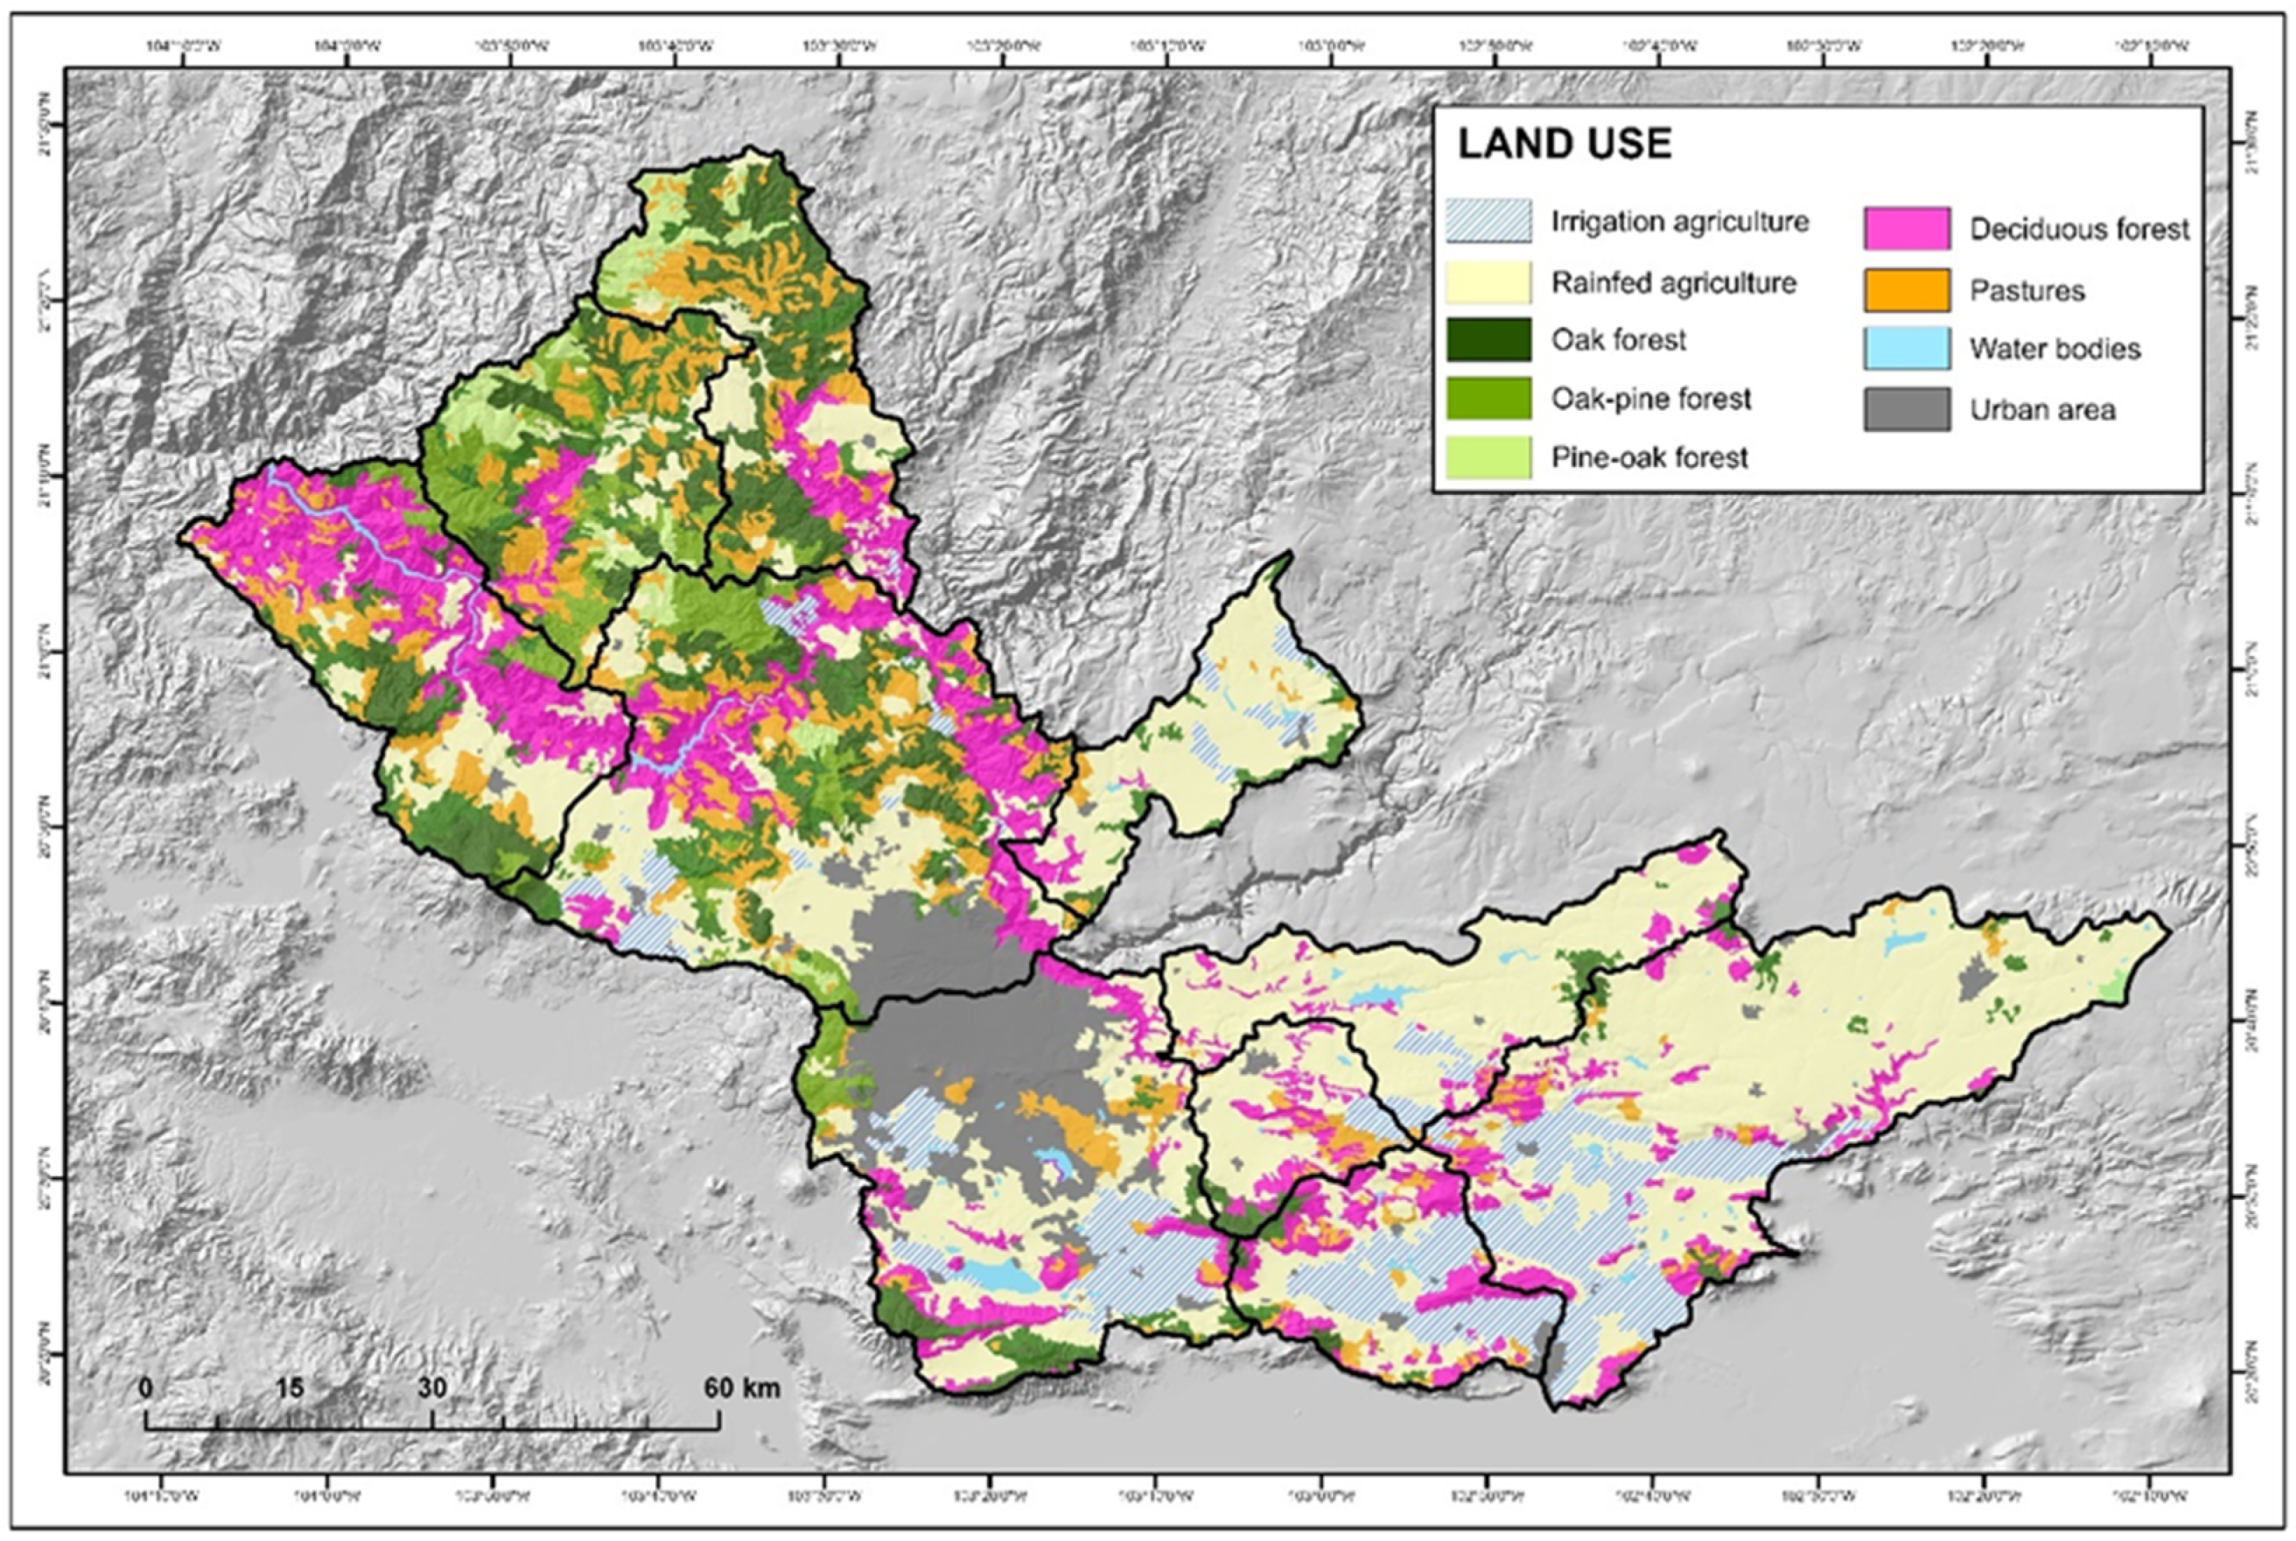
Figure 3.
Location of the main industrial sectors in the Santiago-Guadalajara River Basin.
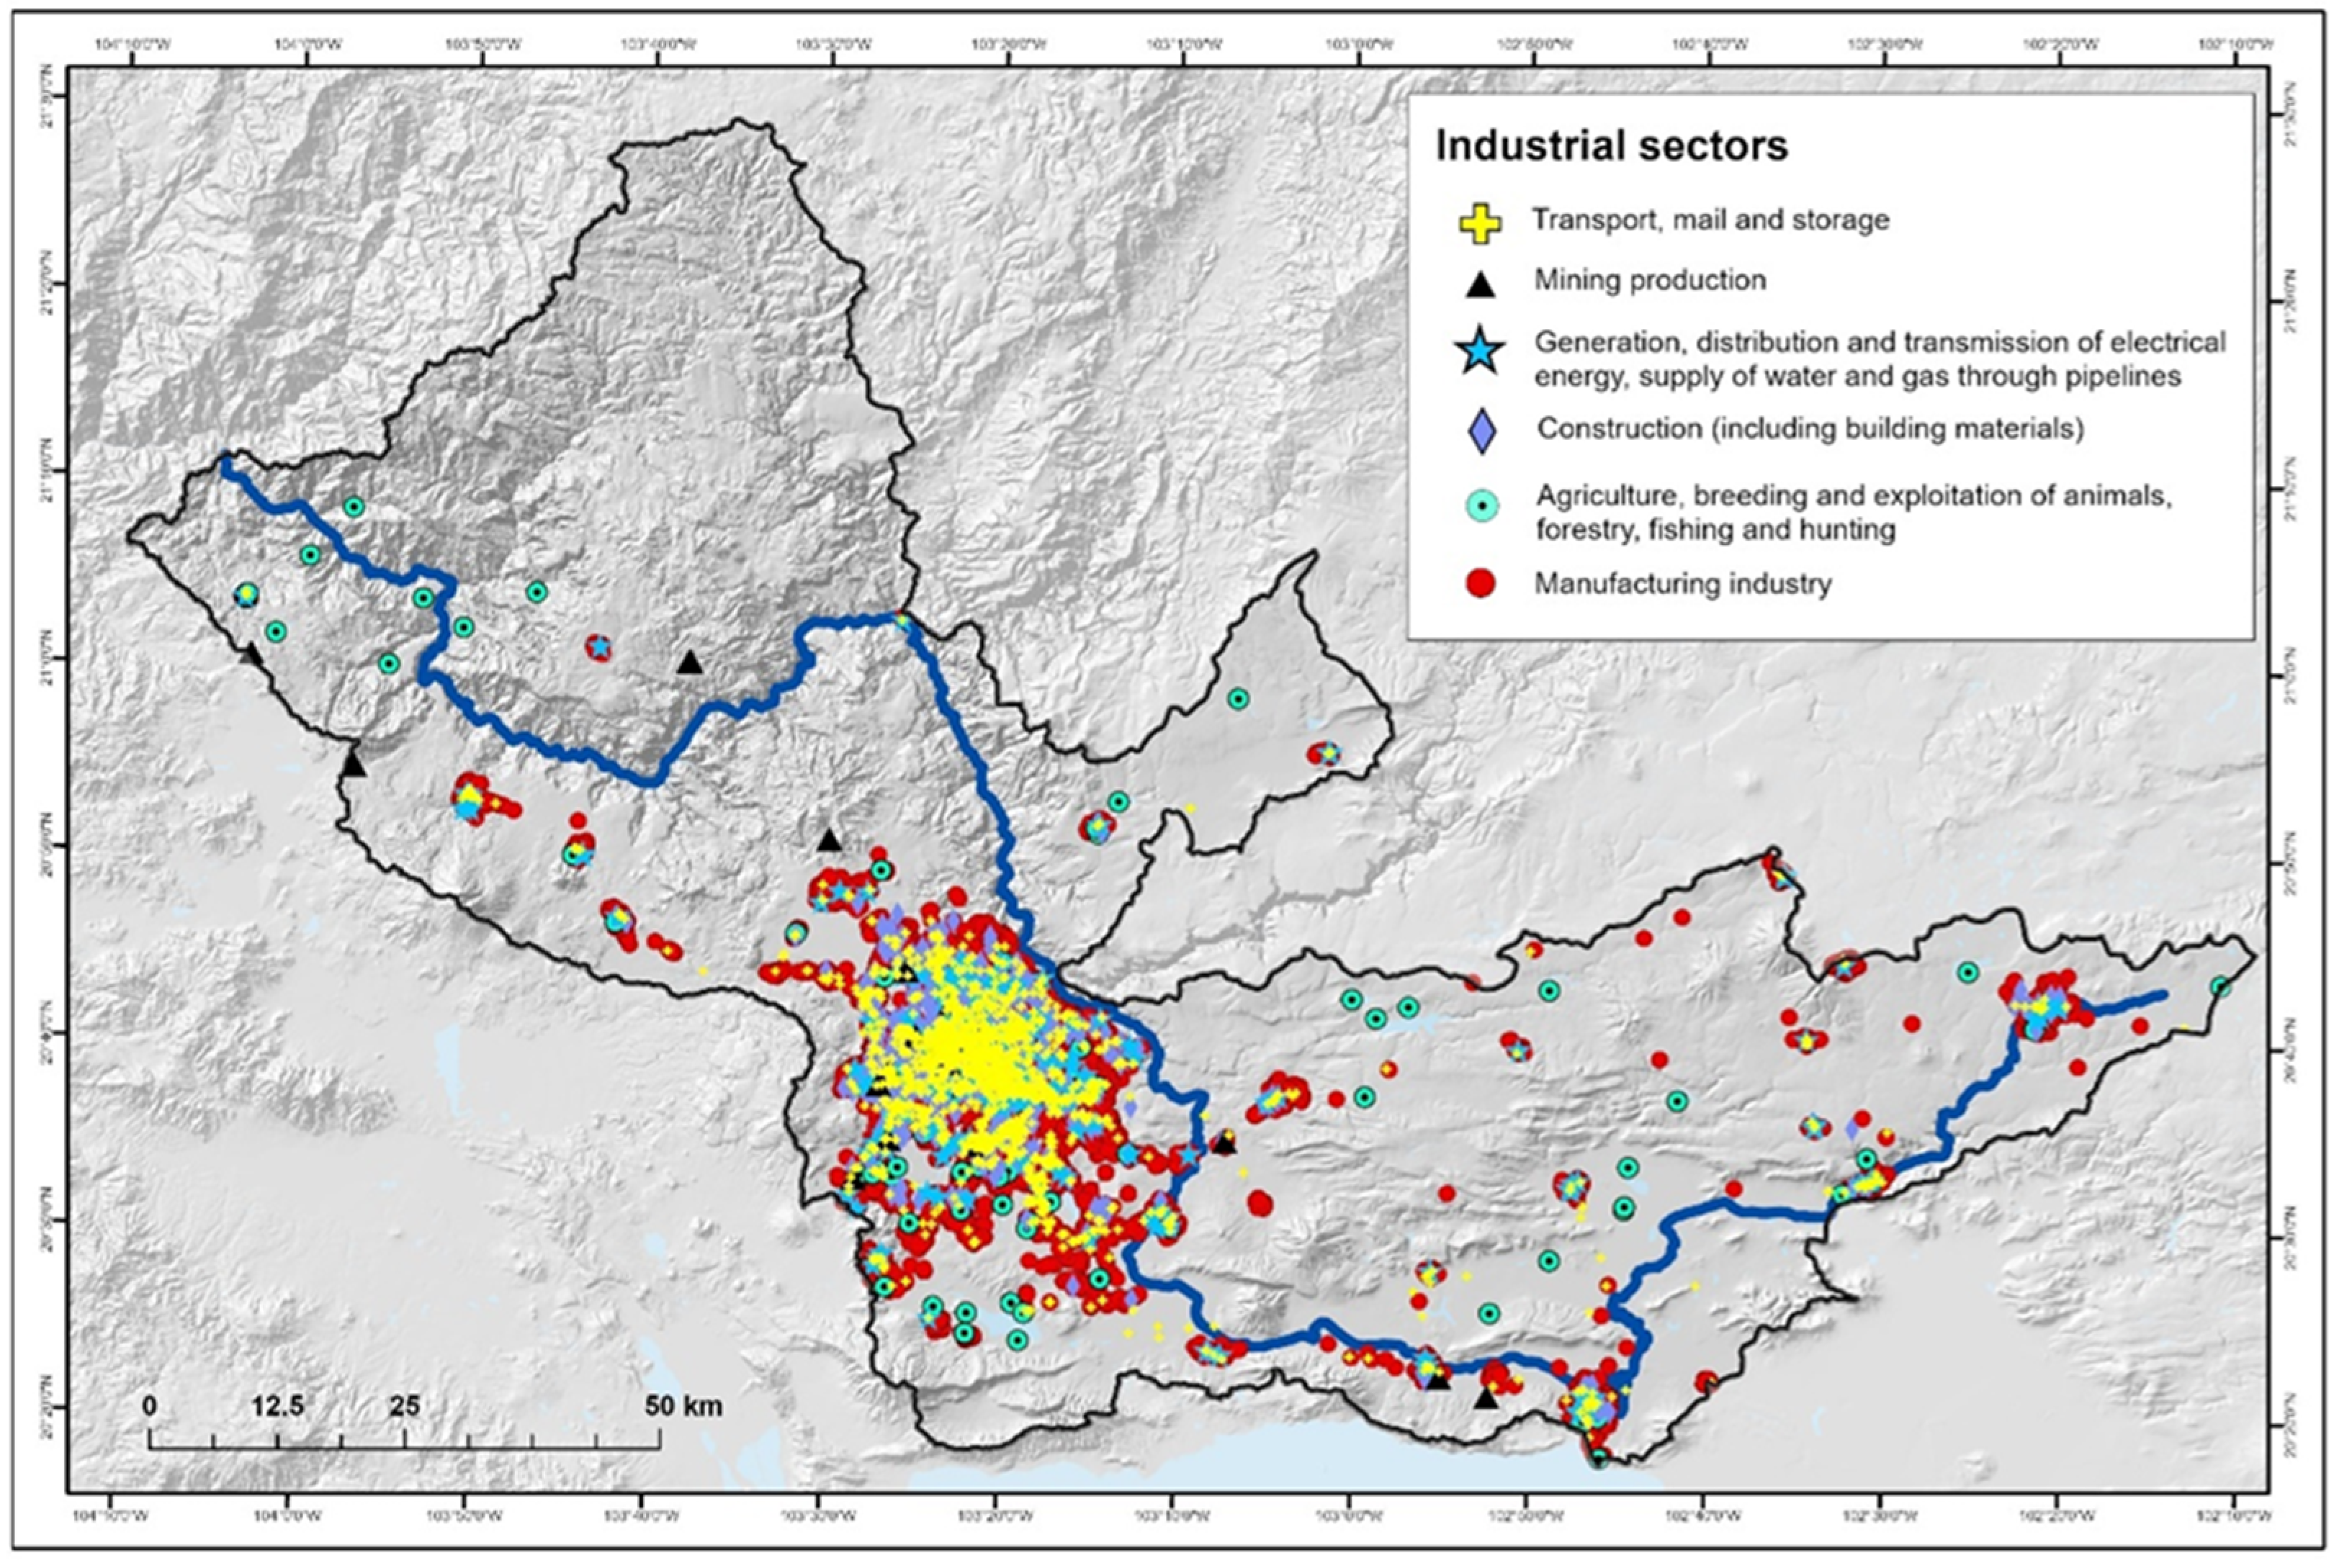
Figure 4.
Location of the 25 monitoring stations located in the main and secondary streams of the Santiago-Guadalajara River Basin.
Figure 4.
Location of the 25 monitoring stations located in the main and secondary streams of the Santiago-Guadalajara River Basin.
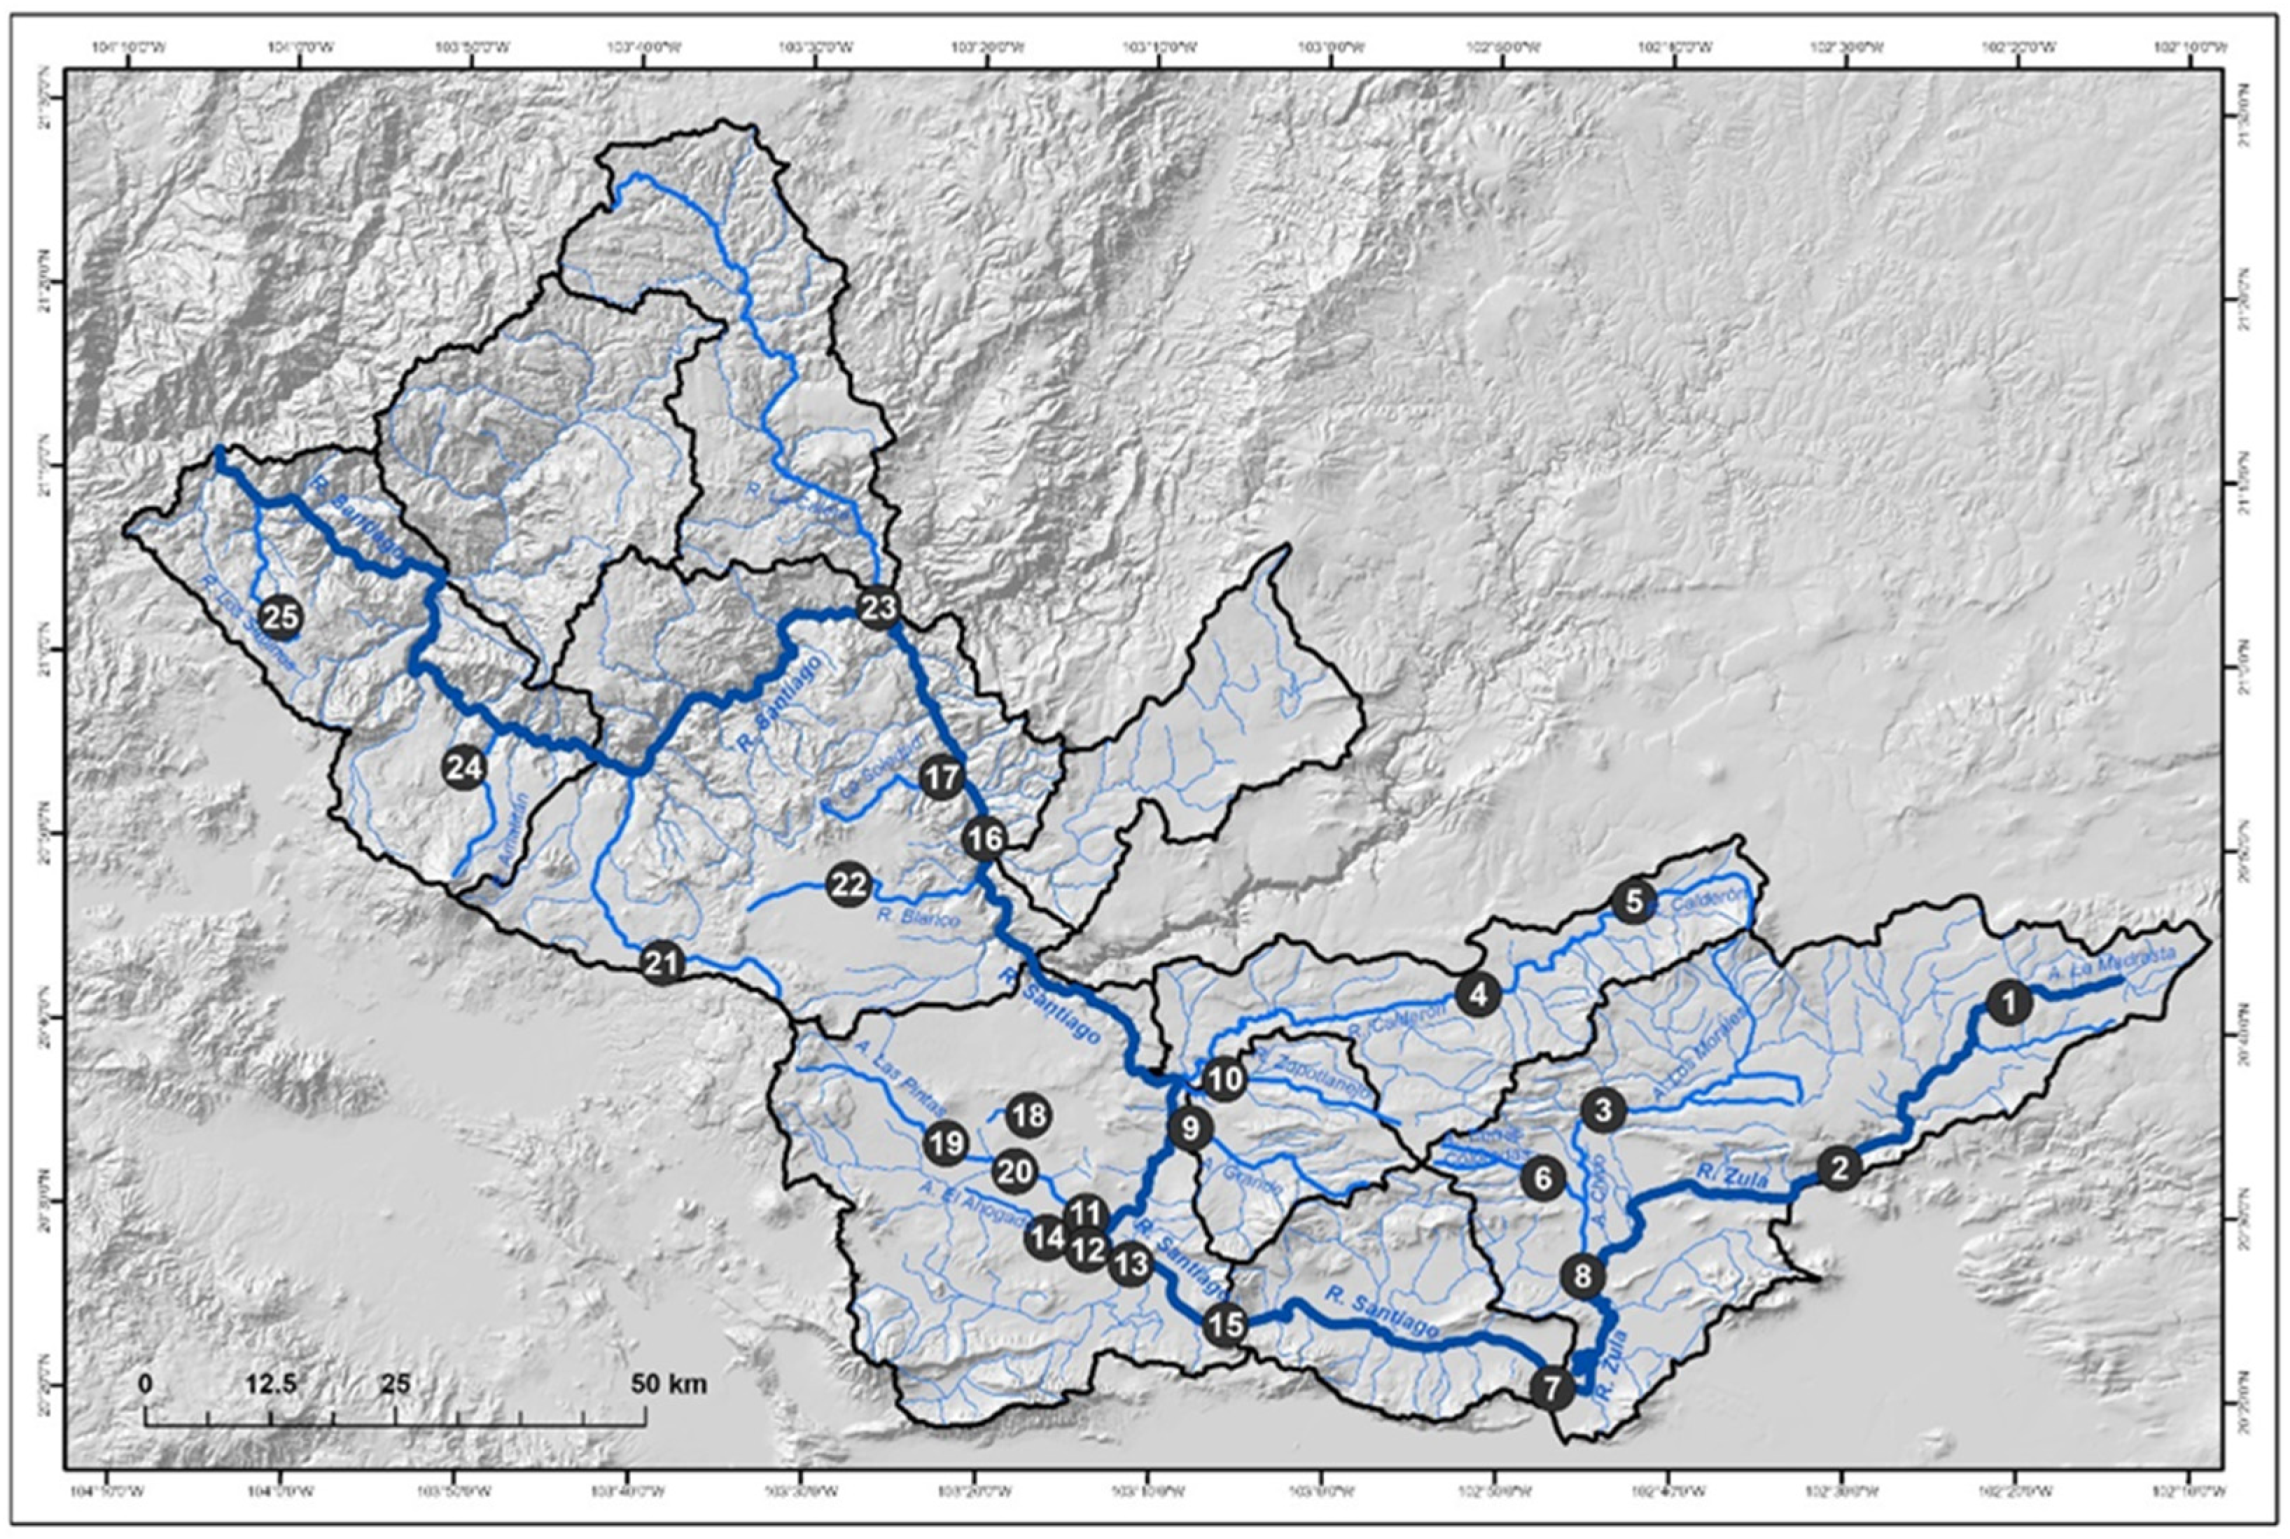
Figure 5.
Plot matrix showing relationships of heavy metals in water samples from the SGRB.
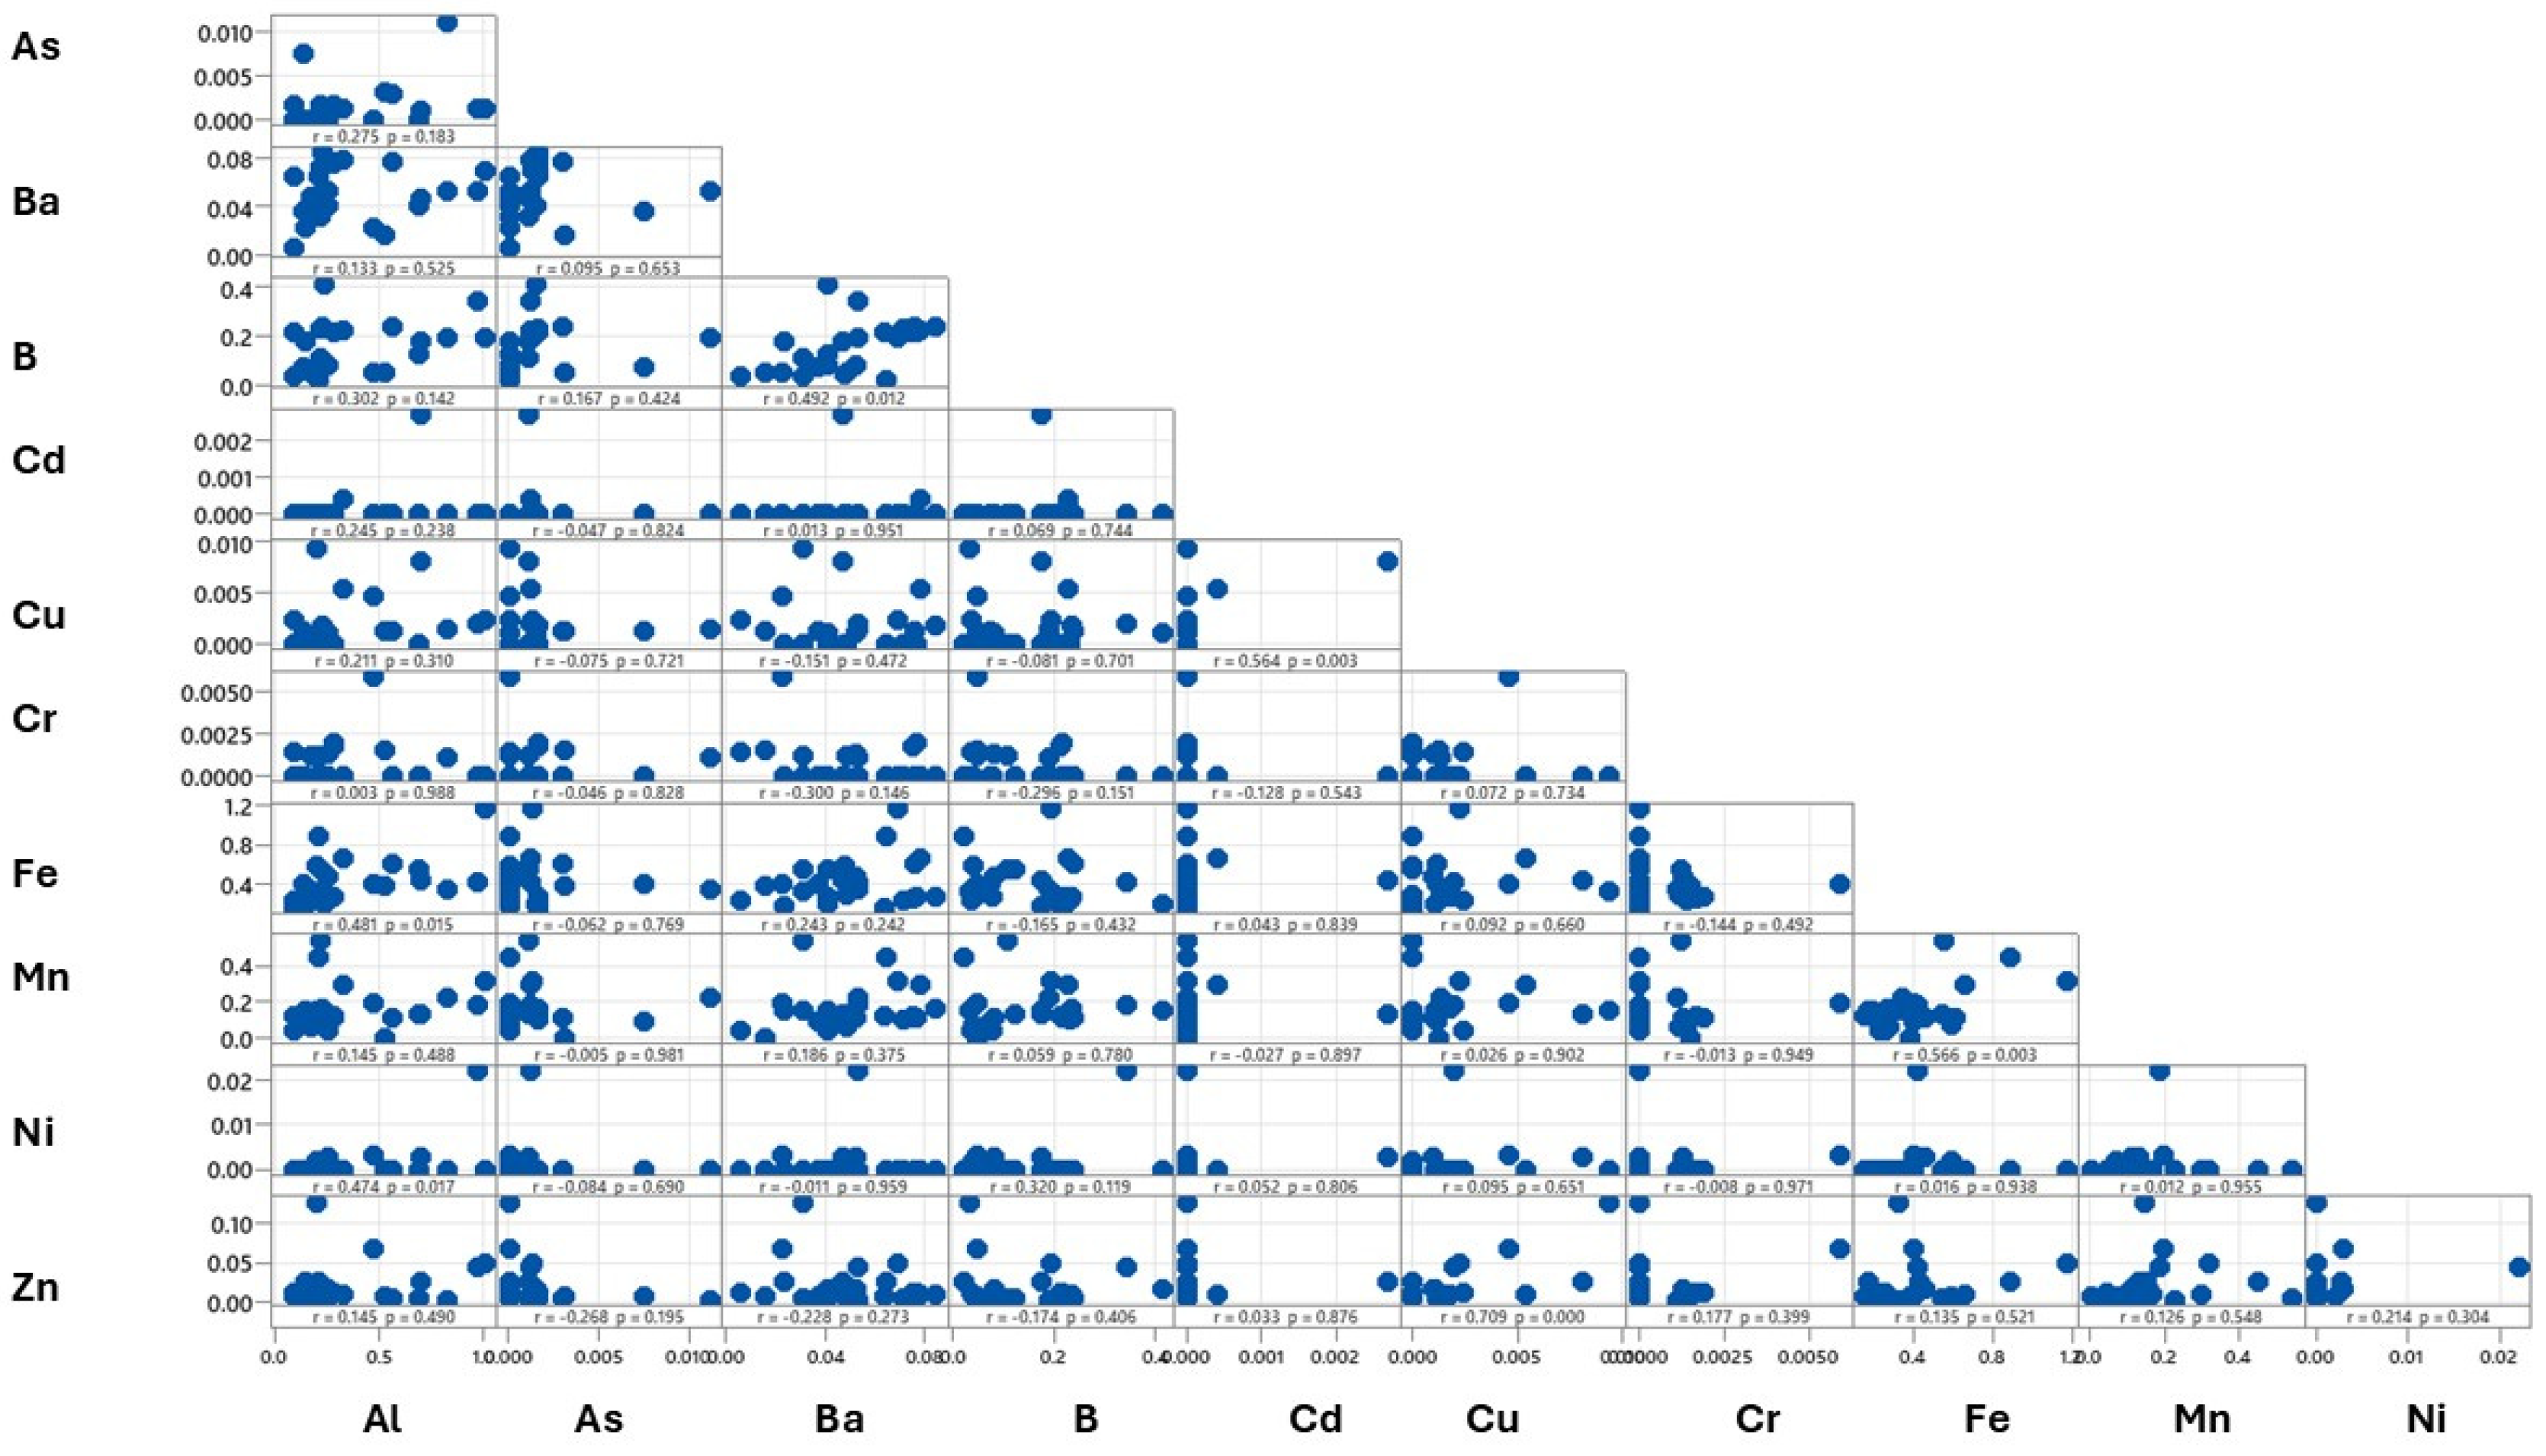
Table 1.
Detection limits of heavy metals that were analyzed.
| Heavy metal | Symbol | Detection limit (mg/L) |
| Aluminum | Al | < 0.05 |
| Arsenic | As | < 0.01 |
| Boron | B | < 0.001 |
| Barium | Ba | < 0.01 |
| Cadmium | Cd | < 0.002 |
| Total Chromium | Cr | < 0.01 |
| Copper | Cu | < 0.01 |
| Iron | Fe | < 0.01 |
| Mercury | Hg | < 0.001 |
| Manganese | Mn | < 0.01 |
| Nickel | Ni | < 0.01 |
| Lead | Pb | < 0.01 |
| Antimony | Sb | < 0.005 |
| Selenium | Se | < 0.002 |
| Zinc | Zn | < 0.01 |
1/ CMC: Criterion Maximum Concentration; 2/ CCC: Criterion Continuous Concentration; N.D. No limits available.
Table 2.
Permissible limits of heavy metals and metalloids for the protection of aquatic life according to four different guidelines.
Table 2.
Permissible limits of heavy metals and metalloids for the protection of aquatic life according to four different guidelines.
| Heavy metal | Symbol | Federal Rights Act | Fresh-water CMC1 (acute) | Fresh-water CCC2 (chronic) | Long-term exposure | Short-term exposure | Guidelines for fresh and marine water quality |
| FRA [55] | US EPA [56] | US EPA [56] | CCME [57] | CCME [57] | ANZECC & ARMCANZ [58] | ||
| µg/L | µg/L | µg/L | µg/L | µg/L | µg/L | ||
| Aluminum | Al | 50.000 | N.D. | N.D. | N.D. | N.D. | 55.000 |
| Antimony | Sb | 90.000 | N.D. | N.D. | N.D. | N.D. | 9.000 |
| Arsenic | As | 200.000 | 340.000 | 150.000 | 5.000 | 5.000 | 24.000 |
| Barium | Ba | 10.000 | N.D. | N.D. | N.D. | N.D. | N.D. |
| Boron | B | N.D. | N.D. | N.D. | 1,500.000 | 29,000.000 | 940.000 |
| Cadmium | Cd | 4.000 | 1.800 | N.D. | 0.090 | 1.000 | 0.200 |
| Copper | Cu | 50.000 | N.D. | N.D. | N.D. | N.D. | 0.470 |
| Total Chrome | Cr | 50.000 | N.D. | N.D. | N.D. | N.D. | N.D. |
| Cr (III) | Cr+3 | N.D. | 570.000 | 74.000 | 8.900 | 8.900 | 3.300 |
| Cr (VI) | Cr+6 | N.D. | 16.000 | 11.000 | 1.000 | 1.000 | 1.000 |
| Iron | Fe | 1,000.000 | N.D. | 1,000.000 | N.D. | N.D. | 300.000 |
| Manganese | Mn | N.D. | N.D. | N.D. | 430.000 | 3,600.000 | 1,900.000 |
| Mercury | Hg | 0.500 | 1.400 | 0.770 | 0.026 | 0.026 | 0.600 |
| Nickel | Ni | 600.000 | 470.000 | 52.000 | 87.000 | 87.000 | 11.000 |
| Lead | Pb | 30.000 | 65.000 | 2.500 | N.D. | N.D. | 3.400 |
| Selenium | Se | 8.000 | N.D. | N.D. | N.D. | N.D. | 11.000 |
| Zinc | Zn | 20.000 | 120.000 | 120.000 | 7.000 | 37.000 | 8.000 |
Table 3.
Mean concentrations of heavy metals at 25 sampling stations in the SGRB from July 2021 to April 2022.
Table 3.
Mean concentrations of heavy metals at 25 sampling stations in the SGRB from July 2021 to April 2022.
| Monitoring Stations | Al | As | Ba | B | Cd | Cu | Cr | Fe | Mn | Ni | Zn |
| S1 | 0.208 | 0.000 | 0.064 | 0.023 | 0.000 | 0.000 | 0.000 | 0.885 | 0.452 | 0.000 | 0.026 |
| S2 | 0.094 | 0.000 | 0.006 | 0.039 | 0.000 | 0.002 | 0.001 | 0.232 | 0.041 | 0.000 | 0.012 |
| S3 | 0.205 | 0.000 | 0.048 | 0.041 | 0.000 | 0.000 | 0.000 | 0.591 | 0.069 | 0.002 | 0.007 |
| S4 | 0.178 | 0.000 | 0.049 | 0.050 | 0.000 | 0.000 | 0.001 | 0.285 | 0.063 | 0.000 | 0.005 |
| S5 | 0.138 | 0.008 | 0.037 | 0.074 | 0.000 | 0.001 | 0.000 | 0.405 | 0.093 | 0.000 | 0.006 |
| S6 | 0.260 | 0.000 | 0.041 | 0.078 | 0.000 | 0.000 | 0.000 | 0.263 | 0.044 | 0.000 | 0.004 |
| S7 | 0.558 | 0.003 | 0.076 | 0.240 | 0.000 | 0.001 | 0.000 | 0.611 | 0.109 | 0.000 | 0.004 |
| S8 | 0.687 | 0.000 | 0.041 | 0.125 | 0.000 | 0.000 | 0.000 | 0.545 | 0.132 | 0.000 | 0.005 |
| S9 | 0.328 | 0.001 | 0.078 | 0.228 | 0.000 | 0.005 | 0.000 | 0.658 | 0.300 | 0.000 | 0.009 |
| S10 | 0.474 | 0.000 | 0.023 | 0.049 | 0.000 | 0.005 | 0.006 | 0.401 | 0.195 | 0.003 | 0.067 |
| S11 | 0.235 | 0.002 | 0.041 | 0.415 | 0.000 | 0.001 | 0.000 | 0.193 | 0.155 | 0.000 | 0.016 |
| S12 | 0.282 | 0.002 | 0.077 | 0.215 | 0.000 | 0.000 | 0.002 | 0.261 | 0.116 | 0.000 | 0.011 |
| S13 | 0.218 | 0.002 | 0.072 | 0.234 | 0.000 | 0.000 | 0.000 | 0.222 | 0.104 | 0.000 | 0.003 |
| S14 | 0.281 | 0.002 | 0.076 | 0.214 | 0.000 | 0.000 | 0.002 | 0.254 | 0.125 | 0.000 | 0.010 |
| S15 | 0.099 | 0.002 | 0.064 | 0.217 | 0.000 | 0.000 | 0.000 | 0.158 | 0.126 | 0.000 | 0.006 |
| S16 | 0.697 | 0.001 | 0.047 | 0.177 | 0.003 | 0.008 | 0.000 | 0.434 | 0.128 | 0.003 | 0.026 |
| S17 | 0.522 | 0.003 | 0.016 | 0.050 | 0.000 | 0.001 | 0.002 | 0.387 | 0.002 | 0.000 | 0.007 |
| S18 | 1.007 | 0.001 | 0.070 | 0.193 | 0.000 | 0.002 | 0.000 | 1.174 | 0.320 | 0.000 | 0.048 |
| S19 | 0.146 | 0.000 | 0.023 | 0.178 | 0.000 | 0.000 | 0.000 | 0.173 | 0.153 | 0.000 | 0.025 |
| S20 | 0.966 | 0.001 | 0.053 | 0.343 | 0.000 | 0.002 | 0.000 | 0.420 | 0.187 | 0.022 | 0.043 |
| S21 | 0.222 | 0.001 | 0.031 | 0.110 | 0.000 | 0.000 | 0.001 | 0.553 | 0.544 | 0.000 | 0.004 |
| S22 | 0.200 | 0.000 | 0.031 | 0.035 | 0.000 | 0.009 | 0.000 | 0.331 | 0.148 | 0.000 | 0.128 |
| S23 | 0.822 | 0.011 | 0.053 | 0.191 | 0.000 | 0.001 | 0.001 | 0.347 | 0.228 | 0.000 | 0.002 |
| S24 | 0.253 | 0.000 | 0.053 | 0.082 | 0.000 | 0.001 | 0.001 | 0.464 | 0.112 | 0.003 | 0.016 |
| S25 | 0.233 | 0.002 | 0.085 | 0.236 | 0.000 | 0.002 | 0.000 | 0.272 | 0.168 | 0.000 | 0.010 |
| Min | 0.094 | 0.000 | 0.006 | 0.023 | 0.000 | 0.000 | 0.000 | 0.158 | 0.002 | 0.000 | 0.002 |
| Max | 1.007 | 0.011 | 0.085 | 0.415 | 0.003 | 0.009 | 0.006 | 1.174 | 0.544 | 0.022 | 0.128 |
| Mean | 0.372 | 0.002 | 0.050 | 0.153 | 0.000 | 0.002 | 0.001 | 0.421 | 0.165 | 0.001 | 0.020 |
| SD | 0.269 | 0.003 | 0.022 | 0.103 | 0.001 | 0.003 | 0.001 | 0.236 | 0.125 | 0.004 | 0.028 |
Table 4.
Values of HPI based on mean concentrations of heavy metals for all sampling stations in the SGRB.
Table 4.
Values of HPI based on mean concentrations of heavy metals for all sampling stations in the SGRB.
| Heavy metal | Mean Concentration (mg/L) | (Si) | (Ii) | (Wi) | (Qi) | WiQi | HPI |
| Al | 0.372 | 0.055 | 0.050 | 18.182 | 6,449.096 | 117,256.283 | 277.572 |
| As | 0.002 | 0.340 | 0.005 | 2.941 | 0.896 | 2.634 | 0.006 |
| Ba | 0.050 | 0.010 | 0.000 | 100.000 | 501.360 | 50,136.000 | 118.683 |
| B | 0.153 | 29.000 | 0.940 | 0.034 | 2.794 | 0.096 | 0.000 |
| Cd | 0.000 | 0.004 | 0.000 | 250.000 | 0.870 | 217.391 | 0.515 |
| Cu | 0.002 | 0.050 | 0.000 | 20.000 | 2.532 | 50.636 | 0.120 |
| Cr | 0.001 | 0.050 | 0.000 | 20.000 | 1.378 | 27.556 | 0.065 |
| Fe | 0.421 | 1.000 | 0.300 | 1.000 | 17.255 | 17.255 | 0.041 |
| Mn | 0.165 | 3.600 | 0.430 | 0.278 | 8.360 | 2.322 | 0.005 |
| Ni | 0.001 | 0.600 | 0.011 | 1.667 | 1.698 | 2.830 | 0.007 |
| Zn | 0.020 | 0.120 | 0.007 | 8.333 | 11.504 | 95.870 | 0.227 |
Table 5.
Heavy metal pollution index estimated for each sampling station in the Santiago-Guadalajara River Basin.
Table 5.
Heavy metal pollution index estimated for each sampling station in the Santiago-Guadalajara River Basin.
|
Sampling station |
HPI | STD |
Sampling station |
HPI | STD |
| S1 | 331.960 | ± 67.307 | S14 | 378.107 | ± 76.531 |
| S2 | 72.238 | ± 17.685 | S15 | 193.424 | ± 46.154 |
| S3 | 156.798 | ± 35.396 | S16 | 195.640 | ± 35.315 |
| S4 | 449.830 | ± 73.230 | S17 | 80.952 | ± 16.351 |
| S5 | 163.180 | ± 33.064 | S18 | 209.048 | ± 50.104 |
| S6 | 140.513 | ± 30.860 | S19 | 137.450 | ± 28.418 |
| S7 | 618.045 | ± 137.569 | S20 | 914.455 | ± 236.881 |
| S8 | 139.547 | ± 30.602 | S21 | 221.258 | ± 47.736 |
| S9 | 430.390 | ± 86.589 | S22 | 205.968 | ± 42.750 |
| S10 | 419.711 | ± 109.551 | S23 | 790.226 | ± 200.020 |
| S11 | 256.725 | ± 53.726 | S24 | 299.991 | ± 61.602 |
| S12 | 382.528 | ± 77.401 | S25 | 358.711 | ± 73.150 |
| S13 | 314.205 | ± 63.775 | Mean | 314.436 |
Table 6.
Pearson´s correlation matrix of heavy metals in water samples of SGRB.
| Heavy metal | Al | As | Ba | B | Cd | Cu | Cr | Fe | Mn | Ni | Zn |
| Al | 1.000 | ||||||||||
| As | 0.275 | 1.000 | |||||||||
| Ba | 0.133 | 0.095 | 1.000 | ||||||||
| B | 0.302 | 0.167 | 0.492* | 1.000 | |||||||
| Cd | 0.245 | -0.047 | 0.013 | 0.069 | 1.000 | ||||||
| Cu | 0.211 | -0.075 | -0.151 | -0.081 | 0.564* | 1.000 | |||||
| Total Cr | 0.003 | -0.046 | -0.3 | -0.296 | -0.128 | 0.072 | 1.000 | ||||
| Fe | 0.481* | -0.062 | 0.243 | -0.165 | 0.043 | 0.092 | -0.144 | 1.000 | |||
| Mn | 0.145 | -0.005 | 0.186 | 0.059 | -0.027 | 0.026 | -0.013 | 0.566* | 1.000 | ||
| Ni | 0.474* | -0.084 | -0.011 | 0.32 | 0.052 | 0.095 | -0.008 | 0.016 | 0.012 | 1.000 | |
| Zn | 0.145 | -0.268 | -0.228 | -0.174 | 0.033 | 0.709* | 0.177 | 0.135 | 0.126 | 0.214 | 1.000 |
*Correlation is significant at the 0.05 level (2-tailed).
Table 7.
The hazard index (HI) of non-carcinogenic risk (HQ) among children and adults in the water of the SGRB.
Table 7.
The hazard index (HI) of non-carcinogenic risk (HQ) among children and adults in the water of the SGRB.
|
Monitoring Stations |
HQChildren | HI | HQAdults | HI | ||||||||||||||
| As | Cd | Cu | Cr | Fe | Ni | Pb | Zn | As | Cd | Cu | Cr | Fe | Ni | Pb | Zn | |||
| S1 | 0.000 | 0.000 | 0.000 | 0.000 | 0.101 | 0.000 | 0.000 | 0.003 | 0.104 | 0.000 | 0.000 | 0.000 | 0.000 | 0.087 | 0.000 | 0.000 | 0.003 | 0.090 |
| S2 | 0.000 | 0.000 | 0.002 | 0.077 | 0.026 | 0.000 | 0.000 | 0.001 | 0.106 | 0.000 | 0.000 | 0.002 | 0.041 | 0.023 | 0.000 | 0.000 | 0.001 | 0.067 |
| S3 | 0.000 | 0.000 | 0.000 | 0.000 | 0.067 | 0.003 | 0.000 | 0.001 | 0.072 | 0.000 | 0.000 | 0.000 | 0.000 | 0.058 | 0.003 | 0.000 | 0.001 | 0.062 |
| S4 | 0.000 | 0.000 | 0.000 | 0.066 | 0.032 | 0.000 | 0.000 | 0.001 | 0.099 | 0.000 | 0.000 | 0.000 | 0.035 | 0.028 | 0.000 | 0.000 | 0.000 | 0.064 |
| S5 | 0.820 | 0.000 | 0.001 | 0.000 | 0.046 | 0.000 | 0.000 | 0.001 | 0.868 | 0.723 | 0.000 | 0.001 | 0.000 | 0.040 | 0.000 | 0.000 | 0.001 | 0.765 |
| S6 | 0.000 | 0.000 | 0.000 | 0.000 | 0.030 | 0.000 | 0.000 | 0.000 | 0.030 | 0.000 | 0.000 | 0.000 | 0.000 | 0.026 | 0.000 | 0.000 | 0.000 | 0.026 |
| S7 | 0.328 | 0.000 | 0.001 | 0.000 | 0.070 | 0.000 | 0.000 | 0.000 | 0.399 | 0.289 | 0.000 | 0.001 | 0.000 | 0.060 | 0.000 | 0.000 | 0.000 | 0.351 |
| S8 | 0.000 | 0.000 | 0.000 | 0.000 | 0.062 | 0.000 | 0.000 | 0.001 | 0.063 | 0.000 | 0.000 | 0.000 | 0.000 | 0.054 | 0.000 | 0.000 | 0.000 | 0.054 |
| S9 | 0.131 | 0.052 | 0.004 | 0.000 | 0.075 | 0.000 | 0.000 | 0.001 | 0.264 | 0.116 | 0.035 | 0.004 | 0.000 | 0.065 | 0.000 | 0.000 | 0.001 | 0.220 |
| S10 | 0.000 | 0.000 | 0.004 | 0.323 | 0.046 | 0.005 | 0.000 | 0.007 | 0.385 | 0.000 | 0.000 | 0.003 | 0.174 | 0.040 | 0.004 | 0.000 | 0.007 | 0.227 |
| S11 | 0.164 | 0.000 | 0.001 | 0.000 | 0.022 | 0.000 | 0.000 | 0.002 | 0.189 | 0.145 | 0.000 | 0.001 | 0.000 | 0.019 | 0.000 | 0.000 | 0.002 | 0.166 |
| S12 | 0.175 | 0.000 | 0.000 | 0.104 | 0.030 | 0.000 | 0.000 | 0.001 | 0.310 | 0.154 | 0.000 | 0.000 | 0.056 | 0.026 | 0.000 | 0.000 | 0.001 | 0.237 |
| S13 | 0.175 | 0.000 | 0.000 | 0.000 | 0.025 | 0.000 | 0.000 | 0.000 | 0.201 | 0.154 | 0.000 | 0.000 | 0.000 | 0.022 | 0.000 | 0.000 | 0.000 | 0.177 |
| S14 | 0.175 | 0.000 | 0.000 | 0.093 | 0.029 | 0.000 | 0.000 | 0.001 | 0.298 | 0.154 | 0.000 | 0.000 | 0.050 | 0.025 | 0.000 | 0.000 | 0.001 | 0.230 |
| S15 | 0.175 | 0.000 | 0.000 | 0.000 | 0.018 | 0.000 | 0.000 | 0.001 | 0.194 | 0.154 | 0.000 | 0.000 | 0.000 | 0.016 | 0.000 | 0.000 | 0.001 | 0.170 |
| S16 | 0.119 | 0.351 | 0.007 | 0.000 | 0.050 | 0.004 | 0.000 | 0.003 | 0.534 | 0.105 | 0.235 | 0.006 | 0.000 | 0.043 | 0.004 | 0.000 | 0.003 | 0.395 |
| S17 | 0.339 | 0.000 | 0.001 | 0.082 | 0.044 | 0.000 | 0.000 | 0.001 | 0.467 | 0.299 | 0.000 | 0.001 | 0.044 | 0.038 | 0.000 | 0.000 | 0.001 | 0.383 |
| S18 | 0.142 | 0.000 | 0.002 | 0.000 | 0.134 | 0.000 | 0.544 | 0.005 | 0.827 | 0.125 | 0.000 | 0.002 | 0.000 | 0.116 | 0.000 | 0.478 | 0.005 | 0.725 |
| S19 | 0.000 | 0.000 | 0.000 | 0.000 | 0.020 | 0.000 | 0.000 | 0.003 | 0.022 | 0.000 | 0.000 | 0.000 | 0.000 | 0.017 | 0.000 | 0.000 | 0.002 | 0.019 |
| S20 | 0.131 | 0.000 | 0.002 | 0.000 | 0.048 | 0.037 | 0.000 | 0.005 | 0.222 | 0.116 | 0.000 | 0.001 | 0.000 | 0.041 | 0.032 | 0.000 | 0.004 | 0.195 |
| S21 | 0.121 | 0.000 | 0.000 | 0.067 | 0.063 | 0.000 | 0.000 | 0.000 | 0.252 | 0.107 | 0.000 | 0.000 | 0.036 | 0.055 | 0.000 | 0.000 | 0.000 | 0.198 |
| S22 | 0.000 | 0.000 | 0.008 | 0.000 | 0.038 | 0.000 | 0.000 | 0.014 | 0.060 | 0.000 | 0.000 | 0.007 | 0.000 | 0.033 | 0.000 | 0.000 | 0.012 | 0.052 |
| S23 | 1.225 | 0.000 | 0.001 | 0.060 | 0.040 | 0.000 | 0.000 | 0.000 | 1.326 | 1.080 | 0.000 | 0.001 | 0.032 | 0.034 | 0.000 | 0.000 | 0.000 | 1.148 |
| S24 | 0.000 | 0.000 | 0.001 | 0.071 | 0.053 | 0.005 | 0.000 | 0.002 | 0.131 | 0.000 | 0.000 | 0.001 | 0.038 | 0.046 | 0.004 | 0.000 | 0.002 | 0.090 |
| S25 | 0.175 | 0.000 | 0.001 | 0.000 | 0.031 | 0.000 | 0.000 | 0.001 | 0.209 | 0.154 | 0.000 | 0.001 | 0.000 | 0.027 | 0.000 | 0.000 | 0.001 | 0.183 |
| Min | 0.000 | 0.000 | 0.000 | 0.000 | 0.018 | 0.000 | 0.000 | 0.000 | 0.000 | 0.000 | 0.000 | 0.000 | 0.000 | 0.016 | 0.000 | 0.000 | 0.000 | 0.019 |
| Max | 1.225 | 0.351 | 0.008 | 0.323 | 0.134 | 0.037 | 0.544 | 0.014 | 1.326 | 1.080 | 0.235 | 0.007 | 0.174 | 0.116 | 0.032 | 0.478 | 0.012 | 1.148 |
| Mean | 0.176 | 0.016 | 0.001 | 0.038 | 0.048 | 0.002 | 0.022 | 0.002 | 0.305 | 0.155 | 0.011 | 0.001 | 0.020 | 0.041 | 0.002 | 0.019 | 0.002 | 0.252 |
| Samples exceeding the limit |
1.000 | 0.000 | 0.000 | 0.000 | 0.000 | 0.000 | 0.000 | 0.000 | 1.000 | 1.000 | 0.000 | 0.000 | 0.000 | 0.000 | 0.000 | 0.000 | 0.000 | 1.000 |
| % of samples exceeding the limit |
4.0 | 0.0 | 0.0 | 0.0 | 0.0 | 0.0 | 0.0 | 0.0 | 4.0 | 4.0 | 0.0 | 0.0 | 0.0 | 0.0 | 0.0 | 0.0 | 0.0 | 4.0 |
Table 8.
The overall carcinogenic risk (TCR) for both children and adults in water in the SGRB.
| Monitoring | CR in Children | TCR | CR in Adults | TCR | ||||||||
| Stations | As | Cd | Cr | Ni | Pb | As | Cd | Cr | Ni | Pb | ||
| S1 | 0.0E+00 | 0.0E+00 | 0.0E+00 | 0.0E+00 | 0.0E+00 | 0.0E+00 | 0.0E+00 | 0.0E+00 | 0.0E+00 | 0.0E+00 | 0.0E+00 | 0.0E+00 |
| S2 | 0.0E+00 | 0.0E+00 | 6.0E-05 | 0.0E+00 | 0.0E+00 | 6.0E-05 | 0.0E+00 | 0.0E+00 | 3.7E-05 | 0.0E+00 | 0.0E+00 | 3.7E-05 |
| S3 | 0.0E+00 | 0.0E+00 | 0.0E+00 | 1.1E-04 | 0.0E+00 | 1.1E-04 | 0.0E+00 | 0.0E+00 | 0.0E+00 | 9.8E-05 | 0.0E+00 | 9.8E-05 |
| S4 | 0.0E+00 | 0.0E+00 | 5.2E-05 | 0.0E+00 | 0.0E+00 | 5.2E-05 | 0.0E+00 | 0.0E+00 | 3.2E-05 | 0.0E+00 | 0.0E+00 | 3.2E-05 |
| S5 | 3.6E-04 | 0.0E+00 | 0.0E+00 | 0.0E+00 | 0.0E+00 | 3.6E-04 | 3.2E-04 | 0.0E+00 | 0.0E+00 | 0.0E+00 | 0.0E+00 | 3.2E-04 |
| S6 | 0.0E+00 | 0.0E+00 | 0.0E+00 | 0.0E+00 | 0.0E+00 | 0.0E+00 | 0.0E+00 | 0.0E+00 | 0.0E+00 | 0.0E+00 | 0.0E+00 | 0.0E+00 |
| S7 | 1.5E-04 | 0.0E+00 | 0.0E+00 | 0.0E+00 | 0.0E+00 | 1.5E-04 | 1.3E-04 | 0.0E+00 | 0.0E+00 | 0.0E+00 | 0.0E+00 | 1.3E-04 |
| S8 | 0.0E+00 | 0.0E+00 | 0.0E+00 | 0.0E+00 | 0.0E+00 | 0.0E+00 | 0.0E+00 | 0.0E+00 | 0.0E+00 | 0.0E+00 | 0.0E+00 | 0.0E+00 |
| S9 | 5.8E-05 | 7.9E-05 | 0.0E+00 | 0.0E+00 | 0.0E+00 | 1.4E-04 | 5.2E-05 | 7.0E-05 | 0.0E+00 | 0.0E+00 | 0.0E+00 | 1.2E-04 |
| S10 | 0.0E+00 | 0.0E+00 | 2.5E-04 | 1.7E-04 | 0.0E+00 | 4.2E-04 | 0.0E+00 | 0.0E+00 | 1.6E-04 | 1.5E-04 | 0.0E+00 | 3.0E-04 |
| S11 | 7.3E-05 | 0.0E+00 | 0.0E+00 | 0.0E+00 | 0.0E+00 | 7.3E-05 | 6.5E-05 | 0.0E+00 | 0.0E+00 | 0.0E+00 | 0.0E+00 | 6.5E-05 |
| S12 | 7.8E-05 | 0.0E+00 | 8.2E-05 | 0.0E+00 | 0.0E+00 | 1.6E-04 | 6.9E-05 | 0.0E+00 | 5.0E-05 | 0.0E+00 | 0.0E+00 | 1.2E-04 |
| S13 | 7.8E-05 | 0.0E+00 | 0.0E+00 | 0.0E+00 | 0.0E+00 | 7.8E-05 | 6.9E-05 | 0.0E+00 | 0.0E+00 | 0.0E+00 | 0.0E+00 | 6.9E-05 |
| S14 | 7.8E-05 | 0.0E+00 | 7.3E-05 | 0.0E+00 | 0.0E+00 | 1.5E-04 | 6.9E-05 | 0.0E+00 | 4.5E-05 | 0.0E+00 | 0.0E+00 | 1.1E-04 |
| S15 | 7.8E-05 | 0.0E+00 | 0.0E+00 | 0.0E+00 | 0.0E+00 | 7.8E-05 | 6.9E-05 | 0.0E+00 | 0.0E+00 | 0.0E+00 | 0.0E+00 | 6.9E-05 |
| S16 | 5.3E-05 | 5.3E-04 | 0.0E+00 | 1.4E-04 | 0.0E+00 | 7.3E-04 | 4.7E-05 | 4.7E-04 | 0.0E+00 | 1.3E-04 | 0.0E+00 | 6.5E-04 |
| S17 | 1.5E-04 | 0.0E+00 | 6.5E-05 | 0.0E+00 | 0.0E+00 | 2.1E-04 | 1.3E-04 | 0.0E+00 | 4.0E-05 | 0.0E+00 | 0.0E+00 | 1.7E-04 |
| S18 | 6.3E-05 | 0.0E+00 | 0.0E+00 | 0.0E+00 | 6.6E-06 | 7.0E-05 | 5.6E-05 | 0.0E+00 | 0.0E+00 | 0.0E+00 | 5.7E-06 | 6.2E-05 |
| S19 | 0.0E+00 | 0.0E+00 | 0.0E+00 | 0.0E+00 | 0.0E+00 | 0.0E+00 | 0.0E+00 | 0.0E+00 | 0.0E+00 | 0.0E+00 | 0.0E+00 | 0.0E+00 |
| S20 | 5.8E-05 | 0.0E+00 | 0.0E+00 | 1.2E-03 | 0.0E+00 | 1.3E-03 | 5.2E-05 | 0.0E+00 | 0.0E+00 | 1.1E-03 | 0.0E+00 | 1.1E-03 |
| S21 | 5.4E-05 | 0.0E+00 | 5.3E-05 | 0.0E+00 | 0.0E+00 | 1.1E-04 | 4.8E-05 | 0.0E+00 | 3.2E-05 | 0.0E+00 | 0.0E+00 | 8.0E-05 |
| S22 | 0.0E+00 | 0.0E+00 | 0.0E+00 | 0.0E+00 | 0.0E+00 | 0.0E+00 | 0.0E+00 | 0.0E+00 | 0.0E+00 | 0.0E+00 | 0.0E+00 | 0.0E+00 |
| S23 | 5.4E-04 | 0.0E+00 | 4.7E-05 | 0.0E+00 | 0.0E+00 | 5.9E-04 | 4.8E-04 | 0.0E+00 | 2.9E-05 | 0.0E+00 | 0.0E+00 | 5.1E-04 |
| S24 | 0.0E+00 | 0.0E+00 | 5.6E-05 | 1.5E-04 | 0.0E+00 | 2.1E-04 | 0.0E+00 | 0.0E+00 | 3.4E-05 | 1.4E-04 | 0.0E+00 | 1.7E-04 |
| S25 | 7.8E-05 | 0.0E+00 | 0.0E+00 | 0.0E+00 | 0.0E+00 | 7.8E-05 | 6.9E-05 | 0.0E+00 | 0.0E+00 | 0.0E+00 | 0.0E+00 | 6.9E-05 |
| Min | 0.0E+00 | 0.0E+00 | 0.0E+00 | 0.0E+00 | 0.0E+00 | 0.0E+00 | 0.0E+00 | 0.0E+00 | 0.0E+00 | 0.0E+00 | 0.0E+00 | 0.0E+00 |
| Max | 5.4E-04 | 5.3E-04 | 2.5E-04 | 1.2E-03 | 6.6E-06 | 1.3E-03 | 4.8E-04 | 4.7E-04 | 1.6E-04 | 1.1E-03 | 5.7E-06 | 1.1E-03 |
| Mean | 7.8E-05 | 2.4E-05 | 3.0E-05 | 7.2E-05 | 2.6E-07 | 2.0E-04 | 6.9E-05 | 2.2E-05 | 1.8E-05 | 6.4E-05 | 2.3E-07 | 1.7E-04 |
Disclaimer/Publisher’s Note: The statements, opinions and data contained in all publications are solely those of the individual author(s) and contributor(s) and not of MDPI and/or the editor(s). MDPI and/or the editor(s) disclaim responsibility for any injury to people or property resulting from any ideas, methods, instructions or products referred to in the content. |
© 2025 by the authors. Licensee MDPI, Basel, Switzerland. This article is an open access article distributed under the terms and conditions of the Creative Commons Attribution (CC BY) license (http://creativecommons.org/licenses/by/4.0/).
Copyright: This open access article is published under a Creative Commons CC BY 4.0 license, which permit the free download, distribution, and reuse, provided that the author and preprint are cited in any reuse.


