
Submitted:
24 February 2025
Posted:
27 February 2025
You are already at the latest version
Abstract
This study evaluates water quality of the Tamiš River, left tributary of Danube in Serbia, at the Jaša Tomić and Pančevo hydrological stations from 2011 to 2016 and 2018 to 2022 applying the Water Pollution Index (WPI) to identify key pollutants and their sources. The analysis revealed that both stations exhibit increased levels of nitrites and orthophosphates. Pančevo hydrological station recorded particularly high orthophosphate concentrations and significantly higher levels of total coliforms, notably in 2015, indicating severe microbial contamination likely from urban runoff, inadequate wastewater treatment, and agricultural activities. At the Jaša Tomić hydrological station, notable deviations were observed in suspended solids and heavy metals, including iron, manganese, and nickel. These increased levels suggest contributions from soil erosion, industrial discharges, and agricultural runoff. WPI indicated moderate to high pollution levels, with the most drastic example at the Pančevo hydrological station, classified as extremely poor in 2015. Taking into account that water quality assessment of the Tamiš River in Serbia has not been conducted since 2009, this study provides new results of water quality status. The Tamiš River, has been affected by various anthropogenic influences, necessitating regular monitoring and assessment. The findings underscore the need for integrated water management strategies to mitigate pollution and protect aquatic ecosystems.
Keywords:
Tamiš River
; Water Pollution Index
; anthropogenic pollution
; surface water quality assessment
; physico-chemical parameters
1. Introduction
Water quality is a critical factor in assessing the sustainability of aquatic ecosystems and is essential not only for drinking water supply but also for tourism, transportation, and various other uses. Surface water quality is highly sensitive to both natural processes and human activities. Natural factors such as geological formations, soil types, climatic conditions, and hydrological characteristics inherently influence water quality parameters. However, anthropogenic activities—including urbanization, industrialization, mining, agriculture, and increased water consumption—significantly exacerbate the degradation of surface waters.
Numerous studies have documented the impact of petrochemical industry on the quality and pollution of surface and ground waters, highlighting the release of nitrates, chlorides, sulphates and petroleum products into aquatic systems [1,2,3,4]. Agricultural practices, particularly intensive farming, contribute substantial amounts of nitrogen and phosphorus to water bodies through runoff, making agricultural nutrients a significant component of diffuse water pollution [5,6,7]. These factors often act as continuous pollution sources, severely degrading aquatic ecosystems and diminishing the usability of water for various activities.
Monitoring water quality and identifying sanitary risks are essential for protecting populations from waterborne diseases and developing appropriate preventive measures. Global water contamination poses a severe threat to public health, with the impact and seriousness of health issues depending on factors such as the chemical makeup of contaminants, exposure duration, and pollutant concentration levels [8,9,10].
Water quality indices serve as valuable tools for assessing and communicating water quality status. Their primary purpose is to condense numerous physical, chemical, and biological measurements into a single value that reflects the ecological condition of a specific water body. These indices facilitate the comparison of water quality across different regions and time periods, forming the basis for extensive scientific research [11,12,13,14,15,16,17,18,19,20,21,22,23,24,25,26,27,28,29].
One such index, the Water Pollution Index (WPI), is employed to measure the extent of water pollution caused by various contaminants. The WPI helps in understanding the pollution load, identifying primary pollution sources, and assessing the effectiveness of pollution control measures. This index is applied in water pollution assessment worldwide: rivers in China [30]; Lake Ulansuhai in China [31]; Grenjeng River in Indonesia [32]; Nambul River in Manipur and groundwater in West Bengal in India [33,34]; Mekong River in Vietnam [35]. WPI is also widely used in various studies in Serbia: Danube River in National Park Djerdap and downstream until the Serbian-Romanian border [36,37]; Sava River [38]; Timok River [39]; Porečka River [40]; Hydro-system Danube-Tisa-Danube [41]; Vlasina Lake [42].
The Tamiš River is a significant watercourse originating in the western part of Romania and flowing through the Banat region before joining the Danube near Pančevo in northern Serbia. The river holds substantial cultural and economic importance, supporting activities such as transportation, recreation, and tourism. However, its water quality faces challenges due to various pollution sources. In Romania, the Tamiš is polluted starting from Caransebeș due to wastewater discharges containing chlorides, fats, detergents, and petroleum products, as well as industrial activities and agricultural runoff [43]. In Serbia, previous assessments have indicated that pollutants enter the river through agricultural runoff and industrial and municipal sewage systems located along its course [44]. Beside this pollution, Lujić et al. [45] addressed inadequate maintenance of irrigation channels, as well as effluents from fish and livestock farms as a main pollution sources.
In 2023, the establishment of the protected area within the Tamiš basin (Potamišje Region of Exceptional Characteristics) emphasized the ecological significance of the region. The designation of this area underscores the need for continuous monitoring and effective management of the river’s water quality to preserve its ecological integrity [46].
Serbian section of the Tamiš River has not been a subject of water quality research since 2009 [44]. This study aims to provide new insight in the water quality status of the Tamiš River in Serbia by calculating the Water Pollution Index (WPI) at two hydrological stations: Jaša Tomić and Pančevo, for the periods 2011–2015 and 2018–2022. Due to the cessation of operations at the Pančevo hydrological station in 2015, the WPI for this station was calculated only for the first period. By evaluating key physico-chemical parameters, this research aims to provide valuable insights into pollution levels, identify the main sources of contamination, and contribute to a comprehensive understanding of the river’s ecological status. The findings can contribute to future water management strategies and support efforts to protect and restore the Tamiš River basin.
2. Materials and Methods
2.1. Study Area
The Tamiš River, a tributary of the Danube in Serbia, originates in Romania under the highest peak of the Semenic Mountain. It flows for 340 km, of which 118 km are in Serbia, before joining the Danube near Pančevo. The river’s catchment area covers approximately 7,319 km², with 1,529 km² within Serbia [47].
Due to frequent meandering caused by the flat terrain and gentle river gradient, the Tamiš has a slow water flow, which historically led to significant flooding. To mitigate this, regulatory works began in the first half of the 18th century, cutting through numerous meanders to control flooding and improve navigation. Significant changes to the Tamiš water regime occurred in 1967 with the diversion of water from the Brzava River basin into the Danube and the construction of three sluice gates on the Tamiš River in Serbia [47].
The river exhibits its highest average monthly flows in April and March, while the lowest flows occur in September and October, which is characteristic of rivers with a Central European rain-snow regime. The average annual flow of the Tamiš at Jaša Tomić is 39.1 m3/s [48].
A systematic analysis of river water quality was conducted at two hydrological stations (Figure 1): Jaša Tomić Hydrological Station (UTM coordinates 5031950 m N and 7489150 m E, zone 34N), and Pančevo Hydrological Station (UTM coordinates 4969525 m N and 7471325 m E, zone 34N) [49]. The Jaša Tomić Hydrological Station, located in northern Serbia near the border with Romania, primarily reflects pollution originating from upstream Romanian sources. Key contributors include industrial facilities, agricultural runoff, and urban wastewater. In contrast, the Pančevo Hydrological Station, situated near the confluence of the Tamiš with the Danube, integrates both upstream pollution from Romania and additional contributions from urban, industrial, and agricultural sources within Serbia. This dual influence highlights the complexity of managing pollution in transboundary rivers like the Tamiš river.
The geographic distribution of these stations underscores the necessity for collaborative transboundary water management between Romania and Serbia. Effective measures require not only addressing local pollution sources but also implementing upstream interventions to mitigate the overall impact on the river’s ecological health.
An Integrated Polluters Cadastre of the Tamiš River was created as part of the “Eco-status of the Tamiš River” Project, funded by the EU IPA funds under the Neighbourhood Programme Romania-Serbia. This project identified pollutants—including both natural and artificial substances—that disrupt the natural composition and properties of the environment when released into water, air, and soil. The concentrated pollution sources for the Tamiš River include industrial facilities, farms, public utility landfills, sewage discharges, and fishponds. Additionally, diffuse pollution sources encompass the use of artificial fertilizers and agrochemicals in agriculture, transportation (as diffuse sources), septic tanks, and forest resource utilization [51].
Water quality monitoring of the Tamiš River is of great importance, particularly due to the establishment of Potamišje Region of Exceptional Characteristics. Covering 22,633,18 ha, this first-category natural asset of international, national, and exceptional significance boasts a unique mosaic of ecosystems, including alluvial forests, wet meadows and pastures, ancient river sections, marshes, and both mesophilic and saline meadows. It is celebrated for its rich biodiversity, being a hotspot with 606 taxa of higher plants, 42 species of fish, 11 species of amphibians and nine species of reptiles, 49 species of invertebrates of national and international importance, 257 species of birds, and 58 species of mammals. Additionally, it encompasses two internationally significant bird areas (Important Bird Areas – IBA) and an internationally significant plant area (Important Plant Area – IPA). The created values of this area are no less important. There are 17 villages evenly distributed around the perimeter of the protected area. All are known for their traditional use of resources, indigenous culture and preserved rural architecture [52]. The protected area holds immense value not only for the local community but also for the broader scientific community, offering a unique opportunity to study ecological processes and interactions within preserved natural habitats.
2.2. Data and Methods
This study systematically evaluated river water quality at the Jaša Tomić and Pančevo hydrological stations using data from the Serbian Environmental Protection Agency (2011-2015 and 2018-2022) [49]. Eighteen physico-chemical parameters were analyzed, including: dissolved oxygen (DO), Oxygen Saturation (OS), pH, Suspended Solids (SS), Biochemical Oxygen Demand (BOD), Chemical Oxygen Demand (CODMn), Nitrites (NO2-), Ammonium (NH4+), Orthophosphates (PO43-), Sulphates (SO42-), dissolved metals (Fe, Mn, Ni, Hg Cu, Pb, Cd), and Total Coliforms (TC).
Based on water sampling, Serbian Environmental Protection Agency (SEPA) under the Ministry of Environmental Protection of the Republic of Serbia, applied the following methods for these analyses: SRPS ISO 5813:1994 (for Dissolved Oxygen); SEV:1977 (for Oxygen aturation); SRPS H.Z1.111:1987 (for pH); SRPS H.Z1.160:1987 (for Suspended Solids); JUS ISO 5815 (for Biochemical Oxygen Demand); determination using potassium permanganate: Kubel - Tiemann method (for Chemical Oxygen Demand); HACH Method 8507 - EPA 353.2 (for Nitrites); HACH Method 8155 (for Ammonium); HACH Method 8048 - EPA 365.1 (for Orthophosphates); HACH Method 8051 (for Sulphates); EPA 6020 А :2014 (for Iron (Fe) – dissolved, Manganese (Mn) – dissolved, Nickel (Ni) – dissolved Copper (Cu) – dissolved and Cadmium (Cd) – dissolved); EPA 6020 А:2007 (for Lead (Pb) – dissolved); ЕРА Method 245.7 (for Mercury (Hg) – dissolved); SRPS EN ISO 9308-1:2010 (for Total Coliform) [49].
2.3. Water Pollution Index (WPI)
The Water Pollution Index (WPI) is calculated as the sum of the ratios between the observed parameters and their regulated standard values:
In this formula, Ci represents the average annual concentration of the analyzed parameters based on river water quality data [53]. SFQS denotes the standard values (Table 1) for the first class of water quality in Serbia, while n stands for the number of parameters analyzed in the study. In Serbia, the SFQS values correspond to class I of surface water according to national legislation [54,55,56,57]. Surface waters belonging to this class, based on the boundary values of quality elements, provide conditions for ecosystem functioning, fish life and protection, and can be used for the following purposes: drinking water supply with prior treatment by filtration and disinfection, bathing and recreation, irrigation, industrial use (process and cooling water).
One of the advantages of the WPI index is its flexibility to incorporate various parameters. It is not restricted by the quantity or types of parameters utilized.
Understanding the deviations from class I water quality standards conributes in identification of pollution levels and sources affecting the river ecosystem. By analyzing the ratio of mean annual concentrations, the parameters that exceed acceptable limits are addressed, providing a comprehensive assessment of the river’s water quality over the studied periods.
3. Results and Discussion
3.1. Parameters Deviation from Class I
Table 3 presents the deviations from Class I Water Quality Standards at the Pančevo for the period 2011–2015 and Jaša Tomić hydrological stations on the Tamiš River for the periods 2011–2016 and 2018–2022, highlighting the key parameters that exceeded acceptable limits. It is important to note that data of dissolved metals for the year 2013 are missing and therefore are not included in this analysis.
The results at the Pančevo hydrological station for the period 2011–2015 show that the dissolved oxygen ratios ranged from 1.013 to 1.175. These values are slightly above the standard, indicating a state of supersaturation in the water. This slight supersaturation could be attributed to algal activity or increased photosynthesis during this period. The dissolved oxygen ratios at the Jaša Tomić hydrological station ranged from 1.175 to 2.088 relative to the standard for Class I water quality. These increased levels suggest a state of supersaturation in the water. Supersaturation is generally not harmful for water quality and aquatic organisms.
The oxygen saturation ratios ranged from 0.891 to 1.022 at the Pančevo hydrological station and from 0.981 to 1.071 at the Jaša Tomić hydrological station. These values are generally within acceptable limits, with minor deviations slightly exceeding the standard in some years. Such slight variations are unlikely to significantly impact aquatic life, suggesting that oxygen levels remained mostly conducive for aquatic organisms during this period.
The pH ratios were consistently from 0.929 to 0.941 at the Pančevo hydrological station and from 0.902 to 0.941 at the Jaša Tomić hydrological station throughout the examined years, indicating that the acidity levels of the water remained stable and well within the class I water quality standards. This stability suggests a balanced aquatic environment without significant acidic or alkaline fluctuations, which is essential for the health of diverse aquatic species.
Suspended solids ratios at the Pančevo hydrological station varied between 0.604 and 1.300, with notable deviations in 2014 (1.128) and 2015 (1.300) exceeding the class I standards. The increased levels during these years may have reduced water clarity, affecting photosynthesis by limiting light penetration and potentially degrading habitat quality for aquatic organisms by smothering benthic habitats [58]. Similarly, Suspended solids ratios at the Jaša Tomić hydrological station varied between 0.808 and 2.107, with notable deviations in 2013 (1.953), 2014 (2.107), and 2018 (1.852). Increased loads during these years may result from soil erosion, increased runoff, or human activities upstream.
The ratios for Biological Oxygen Demand (BOD) ranged from 0.820 to 1.055 at the Pančevo hydrological station. A slight increase was observed in 2015, where the ratio peaked at 1.055, slightly surpassing the Class I standard. This increase signifies a higher concentration of organic matter in the water, which could be attributed to factors such as sewage discharge or agricultural runoff. BOD ratios at the Jaša Tomić hydrological station ranged from 0.625 to 0.922, remaining within the Class I water quality standards throughout the period. These values indicated that the amount of biodegradable organic matter in the water was not sufficient to cause significant oxygen depletion.
Chemical Oxygen Demand (CODMn) values ranged from 0.800 to 1.300 at the Pančevo hydrological station, with some years surpassing the Class I thresholds. Elevated CODMn levels are indicative of the presence of oxidizable organic and inorganic substances, indicating potential sources like industrial effluents or urban runoff. The CODMn ratios were between 0.328 and 0.575 at the Jaša Tomić hydrological station, which is compliant with the Class I standards. This indicates that levels of oxidizable organic and inorganic substances were low, and chemical pollutants were not a significant concern during the analyzed period.
Nitrite ratios were consistently high, ranging from 1.600 to 1.900 at the Pančevo hydrological station and from 1.000 to 2.000 at the Jaša Tomić hydrological station, significantly exceeding the Class I standards every year. These elevated nitrite levels signal substantial nitrogen pollution, which is concerning as nitrites can be toxic to aquatic life even at low concentrations. The likely sources include agricultural runoff rich in fertilizers and inadequate sewage treatment [59], emphasizing the need for improved nutrient management in the region. According to the Ministry of Agriculture, Forestry and Water Management of the Republic of Serbia [60], there is currently no organized collection of important data on pesticide use, nor an appropriate database that records the quantities of chemical agents used on different crops in agricultural production. Water bodies that are at potentially significant risk of pesticide pollution are predominantly located in Vojvodina, the northern part of Serbia. Therefore, further research and improvements in monitoring and analysis regarding the types and quantities of chemicals used are necessary to accurately assess the actual pressure of hazardous substances from agriculture.
Ammonium ratios fluctuated between 0.890 and 1.330 at the Pančevo hydrological station. Notably, in 2011 (1.330), 2013 (1.180), 2014 (1.250), and 2015 (1.140), the ratios exceeded the Class I standard. Ammonium ratios varied between 0.400 and 2.800, with significant deviations in 2012 (2.800) and 2022 (2.000) at the Jaša Tomić hydrological station. Increased ammonium concentrations can be detrimental, as ammonium is toxic to fish and invertebrates at higher levels, affecting their growth, reproduction, and survival. These findings highlight potential issues with wastewater discharge and agricultural practices leading to ammonia pollution [61]. Decomposition of organic matter could also cause increased ammonium concentrations.
Orthophosphate ratios were significantly above the Class I standards during the entire period, ranging from 3.800 to 5.300 at the Pančevo hydrological station and from 1.000 to 2.500 at the Jaša Tomić hydrological station. Such high concentrations indicate considerable phosphorus pollution, likely from agricultural fertilizers, detergents, and sewage effluent. According to Biliani et al. [62] increased orthophosphates promote excessive algal growth, leading to eutrophication, which degrades water quality by causing oxygen depletion and harming aquatic life.
Sulphate ratios were mostly within the standards, except in 2011 at the Pančevo hydrological station, when the ratio peaked at 1.326, surpassing the Class I limit. This peak suggests a possible influx of sulphate-rich effluents during that year, necessitating investigation into industrial discharges, agricultural runoff, or natural sources. Sulphate ratios ranged from 0.715 to 1.442 at the Jaša Tomić hydrological station, with a deviation in 2012 (1.442) exceeding the standard.
The analysis of metal concentrations at the Pančevo hydrological station from 2011 to 2015 reveals that metal pollution was not a significant concern during this period, with all measured metals remaining within Class I water quality standards. However, the absence of data for 2013 underscores the need for continuous monitoring. Slight increases in certain metals, such as nickel, lead, and cadmium, highlight the importance of ongoing attention to maintain the river’s health and prevent future contamination. Unlike Pančevo hydrological station, metal concentrations at the Jaša Tomić hydrological station, notable deviations from Class I standards were recorded. Iron ratios ranged from 0.177 to 2.000, with a notable deviation in 2018 (2.000) exceeding the Class I standard. Possible sources include natural geological leaching, industrial discharges, or mining activities upstream. Manganese ratios were between 0.420 and 1.680, with deviations in 2011 (1.680) exceeding the standards. Nickel ratios were notably elevated in 2019 (1.745), exceeding the class I standard. The elevated levels suggest possible industrial influence or contamination from urban runoff.
Total coliform ratios at Pančevo hydrological station ranged from 1.340 to an alarming 149.500 in 2015. The mean annual concentration of total coliforms in 2015 was 747,500 n/L, vastly exceeding Class I standards. This substantial increase indicates severe fecal contamination, posing significant health risks for human contact and signalling potential outbreaks of pathogenic organisms. Contamination can stem from untreated sewage discharge, septic system failures, or runoff from livestock areas. The extraordinarily high level of coliforms necessitates urgent attention and remediation efforts. Total coliform ratios at the Jaša Tomić hydrological station varied from 0.250 to 13.333, with elevated levels in 2014 (13.333) and 2021 (3.895) exceeding the Class I standards.
The data from the Pančevo Hydrological Station between 2011 and 2015 highlight several concerning deviations from Class I water quality standards. Parameters like nitrites, ammonium, orthophosphates, suspended sediments, BOD₅, sulphates, and total coliforms exceeded acceptable levels in various years, suggesting significant pollution from agricultural runoff, inadequate wastewater treatment, and possibly industrial activities.
Based on the comparative analysis of the results from both hydrological stations, we can conclude that both stations exhibit high levels of nitrites and orthophosphates, with Pančevo showing higher concentrations of orthophosphates. Pančevo also displays significantly higher levels of total coliforms, particularly in 2015. Regarding heavy metals, Jaša Tomić has noticeable deviations in iron, manganese, and nickel. Analyses have shown that Pančevo has fewer deviations concerning heavy metals. Suspended solids are higher at the Jaša Tomić station, which indicates upstream erosion or construction activities.
The data reveal that both hydrological stations deviate from Class I water quality standards, albeit with different predominant pollutants. Pančevo has high pollution levels of nutrients and microbes. Likely sources include urban runoff, inadequate wastewater treatment, and agricultural activities. Jaša Tomić has elevated levels of suspended sediments, heavy metals, and nutrients. Probable sources are soil erosion, industrial discharges, and agricultural practices.
3.2. Water Pollution Index (WPI) Analysis
Table 4 shows the WPI values for the analyzed profiles. According to these values, the water quality at the Jaša Tomić hydrological station shows slight variations in WPI classes. Most years have a Class II rating, indicating moderate pollution, while 2013 and 2014 have a Class III rating, suggesting increased pollution during those years. From 2015 to 2022, the water quality stabilized with a consistent Class II rating.
Data for the Pančevo hydrological station are available only for the period from 2011 to 2015. Notably, in 2015, the highest water pollution class (Class VI) was recorded, indicating extremely high pollution. During the other years, the WPI classes varied between Class III and Class IV, indicating changes in pollution levels.
The comparative analysis shows that the Pančevo hydrological station generally records higher levels of water pollution compared to the Jaša Tomić hydrological station. After 2015, data for Pančevo are not available due to the cessation of water quality monitoring, which further complicates the analysis of long-term trends for this station.
The stabilization of water quality from 2015 to 2022 at Jaša Tomić Hydrological Station suggests that pollution control measures may have been effective in this area.
4. Conclusions
The consistent monitoring and analysis of water quality in the Tamiš River have highlighted significant challenges related to anthropogenic pressures, particularly urban runoff, agricultural practices, and inadequate wastewater treatment. Key findings include elevated levels of nitrites and orthophosphates at both hydrological stations, with Pančevo showing extreme microbial contamination in 2015. In contrast, Jaša Tomić station exhibited higher levels of heavy metals and suspended sediments, emphasizing diverse pollution sources along the river’s course.
This study underscores the critical importance of implementing integrated water management strategies to address these issues. Upgrading wastewater treatment facilities, enforcing stricter industrial discharge regulations, and promoting sustainable agricultural practices are essential steps to mitigate pollution. Furthermore, restoring monitoring at the Pančevo station is imperative for comprehensive long-term assessments. Taking into account that Tamiš River is an international river and location of Jaša Tomić Hydrological Station near Serbian-Romanian border, joint measures of Serbia and Romania should be implemented to improve water quality.
Protecting the Tamiš River is vital for maintaining its ecological integrity, supporting local biodiversity, and safeguarding public health. Future research should focus on identifying the impacts of specific pollution sources and evaluating the effectiveness of implemented mitigation measures. By adopting a multi-faceted approach, it is possible to ensure the sustainable use of this crucial water resource and contribute to broader ecological stability.
Author Contributions
For research articles with several authors, a short paragraph specifying their individual contributions must be provided. The following statements should be used “Conceptualization, D.M.J., D.J. and T.J.G..; methodology, D.M.J.; software, D.M.J.; validation, D.M.J., D.J. and T.J.G.; formal analysis, D.M.J.; investigation, D.M.J, D.J. and T.J.G.; resources, D.M.J., D.J. and T.J.G.; data curation, D.M.J.; writing—original draft preparation, D.M.J.; writing—review and editing, D.M.J., D.J. and T.J.G.; visualization, D.M.J., D.J. and T.J.G.; supervision, D.M.J.; project administration, D.J.; funding acquisition, D.M.J., D.J. and T.J.G.
Funding
“This research was funded by the Ministry of Science, Technological Development and Innovation of the Republic of Serbia, grant number 451-03-66/2024-03/200172 and the APC was funded by Geographical Institute “Jovan Cvijić” SASA.
Data Availability Statement
Data is contained within the article.
Conflicts of Interest
The authors declare no conflicts of interest.”
References
- Sun, D.; Shao, S.; Zhang, Y.; Yang, Q.; Hou, H.; Quan, X. Integrated analysis of the water–energy–environmental pollutant nexus in the petrochemical industry. Environ. Sci. Technol. 2020, 54, 14830–14842. [Google Scholar] [CrossRef] [PubMed]
- Valeev, T.K.; Rakhmanin, Y.A.; Suleimanov, R.A.; Malysheva, A.G.; Bakirov, A.B.; Rakhmatullin, N.R.; Rakhmatullina, L.R.; Daukaev, R.A.; Baktybaeva, Z.B. Experience on the environmental and hygienic assessment of water pollution in the territories referred to oil refining and petrochemical complexes. Hygiene and Sanitation 2020, 99, 886–893. [Google Scholar] [CrossRef]
- Radelyuk, I.; Tussupova, K.; Klemeš, J.J.; Persson, K.M. Oil refinery and water pollution in the context of sustainable development: Developing and developed countries. J. Clean. Prod. 2021, 302, 126987. [Google Scholar] [CrossRef]
- Alzboon, K.; Abu Salem, Z.; Alshboul, Z.; Al-Tabbal, J.; Al Tarazi, E.; Alrawashdeh, K. Impacts of the petrochemical industries on groundwater quality. J. Ecol. Eng. 2024, 25, 286–299. [Google Scholar] [CrossRef]
- Kostadinov, S.; Zlatic, M.; Dragicevic, S.; Novkovic, I.; Kosanin, O.; Borisavljevic, A.; Lakicevic, M.; Mladjan, D. Anthropogenic influence on erosion intensity changes in the Rasina river watershed-Central Serbia. Fresenius Environ. Bull. 2014, 23, 254–263. [Google Scholar]
- Yu, G.; Wang, J.; Liu, L.; Li, Y.; Zhang, Y.; Wang, S. The analysis of groundwater nitrate pollution and health risk assessment in rural areas of Yantai, China. BMC Public Health 2020, 20, 437. [Google Scholar] [CrossRef]
- Rey-Romero, D.C.; Domínguez, I.; Oviedo-Ocaña, E.R. Effect of agricultural activities on surface water quality from páramo ecosystems. Environ. Sci. Pollut. Res. 2022, 29, 83169–83190. [Google Scholar] [CrossRef]
- Mukate, S.; Wagh, V.; Panaskar, D.; Jacobs, J.A.; Sawant, A. Development of new integrated water quality index (IWQI) model to evaluate the drinking suitability of water. Ecol. Ind. 2019, 101, 348–354. [Google Scholar] [CrossRef]
- Njuguna, S.M.; Onyango, J.A.; Githaiga, K.B.; Gituru, R.W.; Yan, X. Application of multivariate statistical analysis and water quality index in health risk assessment by domestic use of river water. Case study of Tana River in Kenya. Process. Saf. Environ. Prot. 2020, 133, 149–158. [Google Scholar] [CrossRef]
- Babuji, P.; Thirumalaisamy, S.; Duraisamy, K.; Periyasamy, G. Human health risks due to exposure to water pollution: a review. Water 2023, 15, 2532. [Google Scholar] [CrossRef]
- Jakovljević, D. Serbian and Canadian water quality index of Danube river in Serbia in 2010. J. Geogr. Inst. Jovan Cvijić SASA 2012, 62, 1–18. [Google Scholar] [CrossRef]
- Li, R.; Zou, Z.; Yan, A. Water quality assessment in Qu River based on fuzzy water pollution index method. Acta Sci. Circumst. 2016, 50, 87–92. [Google Scholar] [CrossRef] [PubMed]
- Milijašević Joksimović, D.; Gavrilović, B.; Obradović Lović, S. Application of the water quality index in the Timok River basin (Serbia). J. Geogr. Inst. Jovan Cvijić SASA 2018, 68, 333–344. [Google Scholar] [CrossRef]
- Mladenović-Ranisavljević, I.I.; Žerajić, S.A. Comparison of different models of water quality index in the assessment of surface water quality. Int. J. Environ. Sci. Technol. 2018, 15, 665–674. [Google Scholar] [CrossRef]
- Ismail, A.H.; Robescu, D. Assessment of water quality of the Danube River using water quality indices technique. Environ. Eng. Manag. J. 2019, 18, 1727–1737. [Google Scholar] [CrossRef]
- Kachroud, M.; Trolard, F.; Kefi, M.; Jebari, S.; Bourrié, G. Water quality indices: challenges and application limits in the literature. Water 2019, 11, 361. [Google Scholar] [CrossRef]
- Banda, T.D.; Kumarasamy, V.M. Development of water quality indices (WQIs): a review. Pol. J. Environ. Stud. 2020, 29, 2011–2021. [Google Scholar] [CrossRef] [PubMed]
- Calmuc, M.; Calmuc, V.; Arseni, M.; Topa, C.; Timofti, M.; Georgescu, L.P.; Iticescu, C. A comparative approach to a series of physico-chemical quality indices used in assessing water quality in the Lower Danube. Water 2020, 12, 3239. [Google Scholar] [CrossRef]
- Milanović Pešić, A.; Brankov, J.; Milijašević Joksimović, D. Water quality assessment and populations’ perceptions in the National park Djerdap (Serbia): key factors affecting the environment. Environ. Dev. Sustain. 2020, 22, 2365–2383. [Google Scholar] [CrossRef]
- Khanday, S.A.; Bhat, S.U.; Islam, S.T.; Sabha, I. Identifying lithogenic and anthropogenic factors responsible for spatio-seasonal patterns and quality evaluation of snow melt waters of the River Jhelum Basin in Kashmir Himalaya. Catena 2021, 196, 104853. [Google Scholar] [CrossRef]
- Bouimouass, H.; Fakir, Y.; Tweed, S.; Sahraoui, H.; Leblanc, M.; Chehbouni, A. Traditional irrigation practices sustain groundwater quality in a semiarid piedmont. Catena 2022, 210, 105923. [Google Scholar] [CrossRef]
- Qi, J.; Yang, L.; Liu, E. A holistic framework of water quality evaluation using water quality index (wqi) in the Yihe river (China). Environ. Sci. Pollut. 2022, 29, 80937–80951. [Google Scholar] [CrossRef] [PubMed]
- Khan, M.H.R.B.; Ahsan, A.; Imteaz, M.; Shafiquzzaman, M.; Al-Ansari, N. Evaluation of the surface water quality using global water quality index (WQI) models: perspective of river water pollution. Sci. Rep. 2023, 13, 20454. [Google Scholar] [CrossRef] [PubMed]
- Lukhabi, D.K.; Mensah, P.K.; Asare, N.K.; Pulumuka-Kamanga, T.; Ouma, K.O. Adapted water quality indices: limitations and potential for water quality monitoring in Africa. Water 2023, 15, 1736. [Google Scholar] [CrossRef]
- Patel, P.S.; Pandya, D.M.; Shah, M. A systematic and comparative study of Water Quality Index (WQI) for groundwater quality analysis and assessment. Environ. Sci. Pollut. Res. 2023, 30, 54303–54323. [Google Scholar] [CrossRef] [PubMed]
- Dippong, T.; Mihali, C.; Avram, A. Evaluating Groundwater Metal and Arsenic Content in Piatra, North-West of Romania. Water 2024, 16, 539. [Google Scholar] [CrossRef]
- Khazheeva, Z.I.; Plyusnin, A.M.; Dampilova, B.V. Changes in water quality in the Modonkul River assessed by combinatory pollution index. Water Resour. 2024, 51, 513–524. [Google Scholar] [CrossRef]
- Dass, B.; Rao, M.S.; Sen, S. Hydrogeochemical characterization and water quality assessment of mountain springs: insights for strategizing water management in the lesser Indian Himalayas. J. Hydrol. Reg. Stud. 2025, 57, 102126. [Google Scholar] [CrossRef]
- Xiao, W.; Ren, B.; Wu, B.; Deng, X. Spatiotemporal dynamics and optimization of water quality assessment in the Nantong section of the Yangtze River Basin: A WQImin approach. J. Hydrol. Reg. Stud. 2025, 57, 102106. [Google Scholar] [CrossRef]
- Li, J.; Meng, X.; Zhang, Y.; Li, J.; Xia, L.; Zheng, H. Analysis of the temporal and spatial distribution of water quality in China’s major river basins, and trends between 2005 and 2010. Front. Earth Sci. 2015, 9, 463–472. [Google Scholar] [CrossRef]
- Zhang, Q.; Yu, R.; Jin, Y.; Zhang, Z.; Liu, X.; Xue, H.; Hao, Y.; Wang, L. Temporal and Spatial Variation Trends in Water Quality Based on the WPI Index in the Shallow Lake of an Arid Area: A Case Study of Lake Ulansuhai, China. Water 2019, 11, 1410. [Google Scholar] [CrossRef]
- Widodo, T.; Budiastuti, M.T.S.; Komariah, K. Water Quality and Pollution Index in the Grenjeng River, Boyolali Regency, Indonesia. Caraka Tani: Journal of Sustainable Agriculture 2019, 34, 150–161. [Google Scholar] [CrossRef]
- Hossain, M.; Patra, P.K. Water pollution index – a new integrated approach to rank water quality. Ecol. Indic. 2020, 117, 106668. [Google Scholar] [CrossRef]
- Singh, K.K.K.M.B.; Singh, L.C.; Singh, N.D. Analysis of Seasonal Variation in Water Pollution Index of Nambul River, Manipur, North-East, India. International Journal of Lakes and Rivers, 2023, 16, 141–158. [Google Scholar] [CrossRef]
- Tran, T.T.; Liem, N.D.; Hieu, H.H.; Tam, H.T.; Mong, N.V.; Yen, N.T.M.; Yen, T.T.H.; Quang, N.X.; Luu, P.T. Assessment of long-term surface water quality in Mekong River estuaries using a comprehensive water pollution index. Environ. Nat. Resour. J. 2023, 21, 524–533. [Google Scholar] [CrossRef]
- Milanović Pešić, A.; Brankov, J.; Milijašević Joksimović, D. Water quality assessment and populations’ perceptions in the National park Djerdap (Serbia): key factors affecting the environment. Environ. Dev. Sustain. 2020, 22, 2365–2383. [Google Scholar] [CrossRef]
- Jakovljević, D.; Milanović Pešić, A.; Miljanović, D. Human impacts on water resources in the Lower Danube River Basin in Serbia. In The Lower Danube River: Hydro-environmental Issues and Sustainability; Negm, A., Zaharia, L., Ioana-Toroimac, G., Eds.; Springer: Cham, Switzerland; pp. 195–251. [CrossRef]
- Popović, N.; Đuknić, J.; Čanak Atlagić, J.; Raković, M.; Marinković, N.; Tubić, B.; Paunović, M. Application of the Water Pollution Index in the Assessment of the Ecological Status of Rivers: a Case Study of the Sava River, Serbia. Acta Zool. Bulg. 2016, 68, 97–102. [Google Scholar]
- Brankov, J.; Milijašević, D.; Milanović, A. The assessment of the surface water quality using the water pollution index: a case study of the Timok river (The Danube River basin), Serbia. Arch. Environ. Prot. 2012, 38, 49–61. [Google Scholar] [CrossRef]
- Milijašević Joksimović, D.; Vuletić, M. 2024. Assessing surface water quality of the Porečka River. In Zbornik radova – VI Kongres geografa Srbije sa medunarodnim ucešcem, Zlatibor, Serbia, 29–31 August 2024. [CrossRef]
- Milanović, A.; Milijašević, D.; Brankov, J. Assessment of polluting effects and surface water quality using water pollution index: A case study of hydro-system Danube-Tisa-Danube, Serbia. Carpath. J. Earth Environ. Sci. 2011, 6, 269–277. [Google Scholar]
- Milanović Pešić, A.; Jojić Glavonjić, T.; Denda, S.; Jakovljević, D. Sustainable Tourism Development and Ramsar Sites in Serbia: Exploring Residents’ Attitudes and Water Quality Assessment in the Vlasina Protected Area. Sustainability 2023, 15, 15391. [Google Scholar] [CrossRef]
- Filimon, M.N.; Gotia, S.R.; Gotia, S.L.; Borozan, A.; Popescu, R.; Gherman, V.D. Bacteriological studies on river Timis with a role in evaluating pollution. Ann. Rom. Soc. Cell Biol. 2009, 14, 284–288. [Google Scholar]
- Babović, N.; Marković, D.; Dimitrijević, V.; Marković, D. Some indicators of water quality of the Tamiš river. Chem. Ind. Chem. Eng. Q. 2011, 17, 107–115. [Google Scholar] [CrossRef]
- Lujić, J.; Matavulj, M.; Poleksić, V.; Rašković, B.; Marinović, Z.; Kostić, D.; Miljanović, B. Gill reaction to pollutants from the Tamiš River in three freshwater fish species, Esox lucius L. 1758, Sander lucioperca (L. 1758) and Silurus glanis L. 1758: a comparative study. Anat. Histol. Embryol. 2015, 44, 128–137. [Google Scholar] [CrossRef] [PubMed]
- Institute for Nature Conservation of Serbia. Pregled zaštićenih područja, 2024. https://zzps.rs/wp-content/uploads/2024/10/11-12-2023-Pregled-zasticenih-podrucja-RS.docx (accessed on 3 December 2024) (in Serbian).
- Gavrilović, Lj.; Dukić, D. Reke Srbije. Belgrade: Zavod za udžbenike, Serbia, 2002 (in Serbian).
- Republic Hydrometeorological Service of Serbia. Hidrološki godišnjaci – 1. Površinske vode, 2003–2022. https://www.hidmet.gov.rs/latin/hidrologija/povrsinske_godisnjaci.php (accessed on 3 December 2024) (in Serbian).
- Serbian Environmental Protection Agency. Rezultati ispitivanja kvaliteta površinskih i podzemnih voda, 2011–2015, 2018–2022. https://sepa.gov.rs/publikacije/ (accessed on 3 December 2024) (in Serbian).
- Vode Vojvodine. Available online: https://gis.vodevojvodine.com/smartPortal/vodeVojvodineEksterna (accessed on 3 December 2024).
- Marković, D.; Dražić, M.; Mitić, M.; Babović, N.; Jakovljev, Z.; Marković, D.; Dimitrijević, V.; Aranđelović, M.; Đorđević, S.; Aleksić, D.; Cvetković, D. Integralni katastar zagađivača reke Tamiš. Faculty of Applied Ecology Futura, Singidunum University, Belgrade, 2010.
- Official Gazette of the Republic of Serbia, No. 93/2023. Uredba o proglašenju predela izuzetnih odlika „Potamišje”. https://pravno-informacioni-sistem.rs/eli/rep/sgrs/vlada/uredba/2023/93/5 (accessed on 3 December 2024) (in Serbian).
- Lyulko, I., Ambalova, T., Vasiljeva, T. To integrated water quality assessment in Latvia. In MTM (Monitoring Tailor-Made) III, Proceedings of International Workshop on Information for Sustainable Water Management; Institute for Inland Water Management and Waste Water Treatment (RIZA), Netherlands, 2000.
- Official Gazette of the RS, No 24/2014. Uredba o graničnim vrednostima prioritetnih i prioritetnih hazardnih supstanci koje zagađuju površinske vode i rokovima za njihovo dostizanje. https://pravno-informacioni-sistem.rs/eli/rep/sgrs/vlada/uredba/2014/24/3/reg (accessed on 3 December 2024) (in Serbian).
- Official Gazette of the RS, No 50/2012. Uredba o graničnim vrednostima zagađujućih materija u površinskim i podzemnim vodama i sedimentu i rokovima za njihovo dostizanje. https://pravno-informacioni-sistem.rs/eli/rep/sgrs/vlada/uredba/2012/50/1/reg (accessed on 3 December 2024) (in Serbian).
- Official Gazette of the RS, No. 74/2011 Pravilnik o parametrima ekološkog i hemijskog statusa površinskih voda i parametrima hemijskog i kvantitativnog statusa podzemnih voda. https://pravno-informacioni-sistem.rs/eli/rep/sgrs/ministarstva/pravilnik/2011/74/4/reg (accessed on 3 December 2024) (in Serbian).
- Official Gazete of the SRS, No 31/1982. Pravilnik o opasnim materijama u vodama. https://pravno-informacioni-sistem.rs/eli/rep/sgsrs/ministarstva/pravilnik/1982/31/1 (accessed on 3 December 2024) (in Serbian).
- Bilotta, G.S.; Brazier, R.E. Understanding the influence of suspended solids on water quality and aquatic biota. Water Res. 2008, 42, 2849–2861. [Google Scholar] [CrossRef]
- Wang, J.; Tang, H.; Zhang, X.; Xue, X.; Zhu, X.; Chen, Y.; Yang, Z. Mitigation of nitrite toxicity by increased salinity is associated with multiple physiological responses: a case study using an economically important model species, the juvenile obscure puffer (Takifugu obscurus). Environ. Pollut. 2018, 232, 137–145. [Google Scholar] [CrossRef]
- Ministry of Agriculture, Forestry and Water Management of the Republic of Serbia. Plan vodoprivrede na teritoriji Republike Srbije za period 2021. do 2027. godine, 2021. http://www.minpolj.gov.rs/download/Plan_upravljanja_-vodama_do_2027-FINAL.pdf?script=lat (accessed on 3 December 2024) (in Serbian).
- Ding, T.T.; Du, S.L.; Huang, Z.Y.; Wang, Z.J.; Zhang, J.; Zhang, Y.H.; Liu, S.S.; He, L.S. Water quality criteria and ecological risk assessment for ammonia in the Shaying River Basin, China. Ecotox. Environ Safe. 2021, 215, 112141. [Google Scholar] [CrossRef]
- Biliani, I.; Tsavatopoulou, V.; Zacharias, I. Comparative Study of Ammonium and Orthophosphate Removal Efficiency with Natural and Modified Clay-Based Materials, for Sustainable Management of Eutrophic Water Bodies. Sustainability 2024, 16, 10214. [Google Scholar] [CrossRef]
Figure 1.
Map of the study area. Source of data: [50].
Figure 1.
Map of the study area. Source of data: [50].
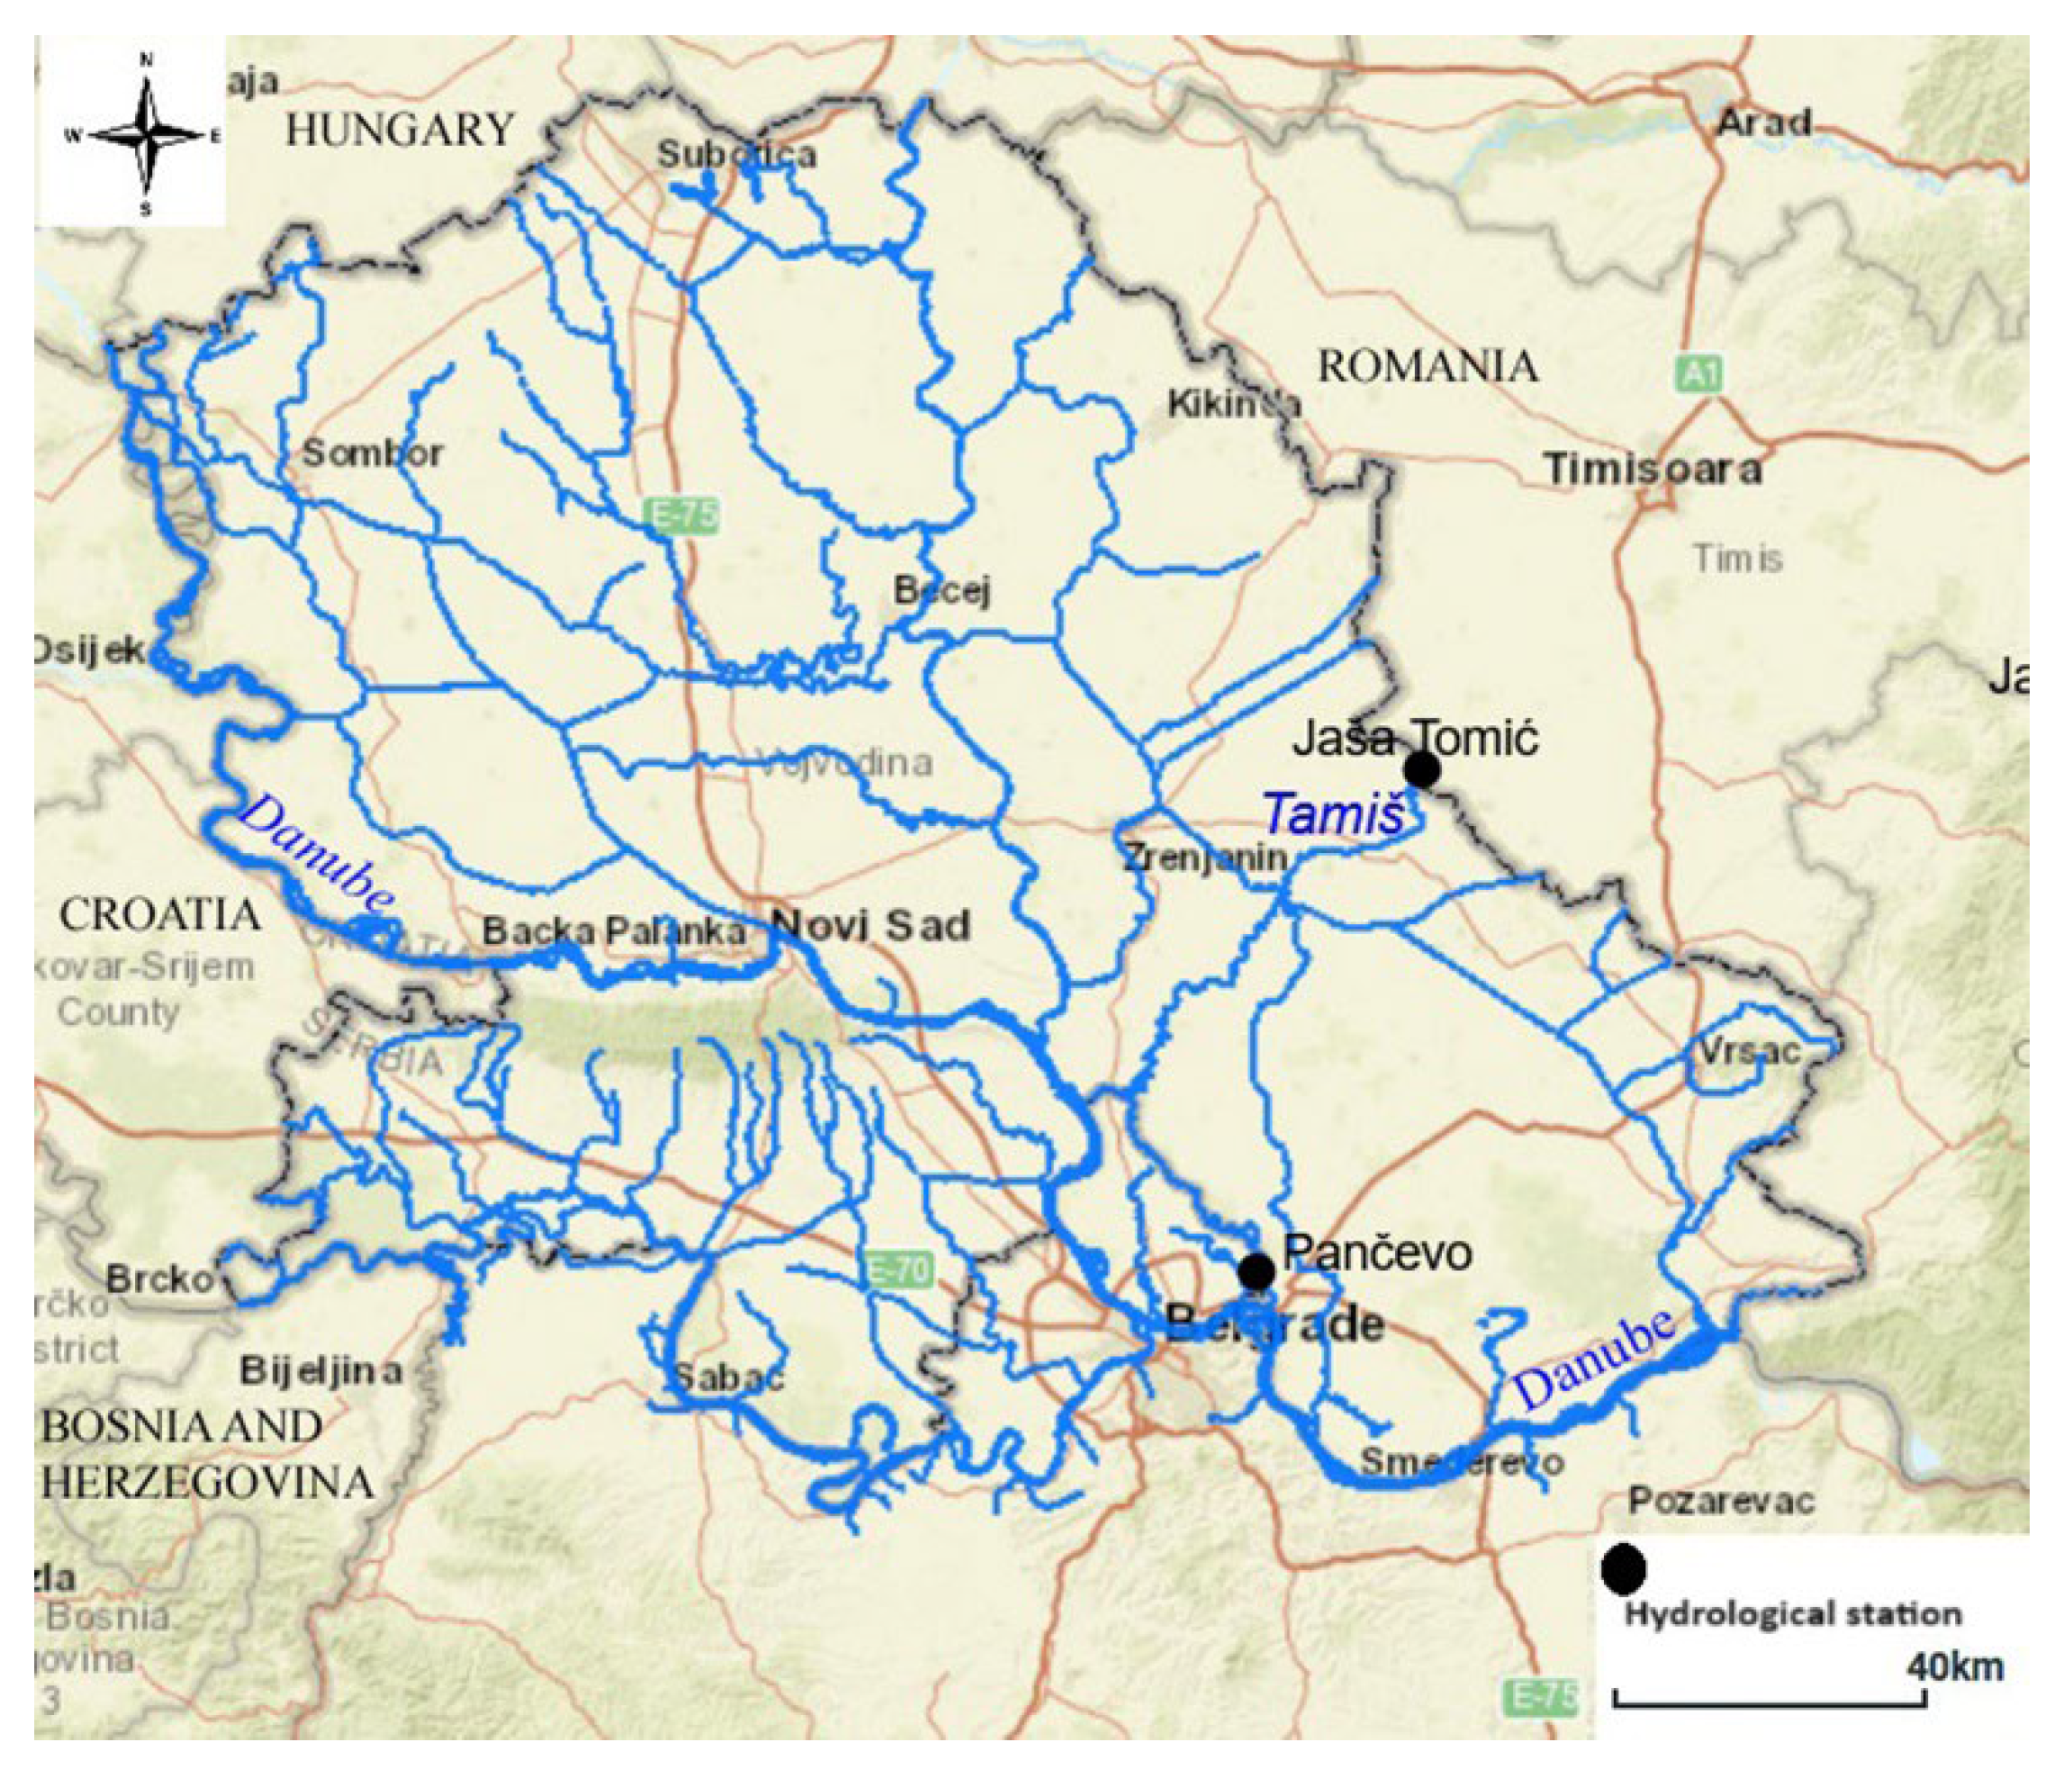

Table 1.
Parameter standard values for Class I.
| Parameter | Unit | Class I |
| Dissolved Oxygen (DO) | mg /l | 8.5 |
| Oxygen Saturation (OS) | % | 90 |
| pH | 6.5–8.5 | |
| Suspended solids (SS) | mg /l | 25 |
| Biochemical Oxygen Demand (BOD) | mg/l | 2 |
| Chemical Oxygen Demand (CODMn) | mg/l | 10 |
| Nitrites (NO2-), | mg/l | 0.01 |
| Ammonium (NH4+) | mg/l | 0.1 |
| Orthophosphates (PO43-) | mg/l | 0.02 |
| Sulphates (SO42-) | mg/l | 50 |
| Iron (Fe) | mg/l | 0.3 |
| Manganese (Mn) | mg/l | 0.05 |
| Nickel (Ni) | µg/l | 20 |
| Mercury (Hg) | µg/l | 1 |
| Copper (Cu) | µg/l | 2000 |
| Lead (Pb) | µg/l | 50 |
| Cadmium (Cd) | µg/l | 5 |
| Total Coliforms (TC) | N/100 ml | 500 |
Table 2.
Classification of surface water using the WPI index.
| Class | Characteristics | WPI |
| I | Very pure | ≤0.3 |
| II | Pure | 0.3-1 |
| III | Moderately polluted | 1-2 |
| IV | Polluted | 2-4 |
| V | Impure | 4-6 |
| VI | Heavily impure | >6 |
* Source: [53].
Table 3.
Ratio of mean annual concentration and standards of the Class I of water quality for analyzed parameters.
Table 3.
Ratio of mean annual concentration and standards of the Class I of water quality for analyzed parameters.
| Pančevo | ||||||||||||||||||
| Year | DO | OS | pH | SS | BOD | CODMn | NO2- | NH4+ | PO43- | SO42- | Fe | Mn | Ni | Hg | Cu | Pb | Cd | TC |
| 2011 | 1.138 | 0.943 | 0.929 | 0.732 | 0.895 | 0.48 | 1.9 | 1.33 | 5.3 | 1.326 | 0.347 | 0.6 | 0.168 | 0.1 | 0.002 | 0.01 | 0.005 | 21.067 |
| 2012 | 1.175 | 1.022 | 0.941 | 0.648 | 0.885 | 0.488 | 1.7 | 0.8 | 4.1 | 0.72 | 0.17 | 0.28 | 0.511 | 0.1 | 0.002 | 0.01 | 0.004 | 6.3 |
| 2013 | 1.15 | 0.959 | 0.929 | 0.604 | 0.82 | 0.53 | 1.8 | 1.18 | 4.9 | 0.748 | 1.34 | |||||||
| 2014 | 201.013 | 0.891 | 0.929 | 1.128 | 0.845 | 0.605 | 1.6 | 1.25 | 4.35 | 0.75 | 0.353 | 0.56 | 0.511 | 0.1 | 0.005 | 0.014 | 0.006 | 39.8 |
| 2015 | 1.125 | 0.942 | 0.929 | 1.3 | 1.055 | 0.513 | 1.8 | 1.14 | 3.8 | 0.948 | 0.29 | 0.48 | 0.171 | 0.1 | 0.003 | 0.014 | 0.006 | 149.5 |
| Jaša Tomić | ||||||||||||||||||
| Year | DO | OS | pH | SS | BOD | CODMn | NO2- | NH4+ | PO43- | SO42- | Fe | Mn | Ni | Hg | Cu | Pb | Cd | TC |
| 2011 | 2.088 | 1.022 | 0.929 | 1.456 | 0.922 | 0.41 | 1.3 | 0.84 | 1.95 | 1.062 | 0.247 | 1.68 | 0.59 | 0.046 | 0.002 | 0.01 | 0.005 | 2.096 |
| 2012 | 1.175 | 1.03 | 0.918 | 1.064 | 0.841 | 0.36 | 1.6 | 2.8 | 1.15 | 1.442 | 0.177 | 0.82 | 0.26 | 0.114 | 0.001 | 0.01 | 0.004 | 0.25 |
| 2013 | 1.254 | 1.071 | 0.926 | 1.953 | 0.795 | 0.456 | 1.7 | 1.1 | 2.35 | 0.757 | 7.55 | |||||||
| 2014 | 1.203 | 1.011 | 0.935 | 2.107 | 0.763 | 0.575 | 1.4 | 0.6 | 2.5 | 0.715 | 0.41 | 0.64 | 0.495 | 0.1 | 0.004 | 0.013 | 0.005 | 13.333 |
| 2015 | 1.188 | 1.036 | 0.941 | 1.272 | 0.704 | 0.415 | 1.5 | 0.69 | 1.75 | 0.884 | 0.28 | 0.42 | 0.206 | 0.1 | 0.002 | 0.014 | 0.005 | 3.69 |
| 2018 | 1.2 | 1.009 | 0.918 | 1.852 | 0.625 | 0.498 | 1.6 | 0.89 | 1.7 | 0.845 | 2 | 1 | 0.26 | 0.07 | 0.007 | 0.015 | 0.005 | 1.823 |
| 2019 | 1.200 | 0.981 | 0.906 | 0.828 | 0.692 | 0.449 | 1.3 | 1.25 | 1.85 | 1.035 | 0.697 | 1.14 | 1.745 | 0.07 | 0.01 | 0.016 | 0.005 | 1.488 |
| 2020 | 1.225 | 1.028 | 0.918 | 0.808 | 0.823 | 0.328 | 1.9 | 1.9 | 1 | 0.855 | 0.613 | 0.82 | 0.494 | 0.07 | 0.003 | 0.014 | 0.005 | 1.84 |
| 2021 | 1.249 | 1.061 | 0.908 | 1.252 | 0.775 | 0.435 | 1 | 0.4 | 1 | 0.953 | 0.183 | 0.48 | 0.246 | 0.07 | 0.003 | 0.01 | 0.015 | 3.895 |
| 2022 | 1.231 | 1.025 | 0.902 | 1.340 | 0.84 | 0.498 | 2 | 2 | 1 | 0.8 | 0.367 | 0.8 | 0.34 | 0.07 | 0.005 | 0.013 | 0.022 | 1.584 |
Table 4.
Mean Annual WPI Values and Water Classifications in the Tamiš River.
| Hydrological Station | 2011 | 2012 | 2013 | 2014 | 2015 | 2018 | 2019 | 2020 | 2021 | 2022 |
| Pančevo | 2.1 | 1.1 | 1.4 | 3 | 9.1 | - | - | - | - | - |
| IV | III | III | IV | VI | ||||||
| Jaša Tomić | 0.93 | 0.78 | 1.81 | 1.49 | 0.83 | 0.91 | 0.87 | 0.81 | 0.77 | 0.82 |
| II | II | III | III | II | II | II | II | II | II |
Note: “—” indicates data not available due to cessation of monitoring.
Disclaimer/Publisher’s Note: The statements, opinions and data contained in all publications are solely those of the individual author(s) and contributor(s) and not of MDPI and/or the editor(s). MDPI and/or the editor(s) disclaim responsibility for any injury to people or property resulting from any ideas, methods, instructions or products referred to in the content. |
© 2025 by the authors. Licensee MDPI, Basel, Switzerland. This article is an open access article distributed under the terms and conditions of the Creative Commons Attribution (CC BY) license (http://creativecommons.org/licenses/by/4.0/).
Copyright: This open access article is published under a Creative Commons CC BY 4.0 license, which permit the free download, distribution, and reuse, provided that the author and preprint are cited in any reuse.


