
Submitted:
06 May 2025
Posted:
07 May 2025
You are already at the latest version
Abstract
River water quality is highly sensitive to human activities such as urbanization, industrialization, and agriculture. It is even more susceptible to significant and prolonged changes, such as those caused by wars, which degrade surface waters and impair their use for drinking, industrial, agricultural, recreational, and other purposes. To assess the impact of the war in Mosul on the quality of the Tigris River’s water, the Canadian Council of Ministers of the Environment Water Quality Index (CCME WQI) was used. A total of 120 water samples were collected along the river in four series during 2022 and 2023. The study revealed that in most riparian sites the Tigris River had higher levels of heavy metals (Cd, Pb, Cr, Ni) than permitted by WHO standards (2004), with exception of Zn. Zone 3 exhibited the highest level of pollution. Significant seasonal and annual variations were observed in most parameters, except pH and sulfate (SO₄²⁻), due to geological and debris-related factors. Based on CCME WQI, water quality dropped from 85.8 in 2014 (pre-war) to 68.8 in 2022, then slightly improved to 73.25 in 2023, classifying the river as “Fair.” HPI values indicated good quality at sites S1–S3, while sites S4–S10 were unsuitable. The pollution ranking by metal was: Cd > Pb > Ni > Cr > Zn. Cd and Pb pose a very high ecological risk due to their high bio accumulative potential in the Tigris river.
Keywords:
CCME WQI
; heavy metals values in river
; HPI
; Tigris river
; Mosul
; water quality
1. Introduction
1.1. Water as Weapons
For strategic reasons, water frequently plays a significant role in violent conflicts and wars. Sensitive components of the water infrastructure, such as treatment plants, piping systems, pumping stations or reservoirs, can become targets of military violence and be destroyed (Stiftung Wissenschaft Und Politik (SWP) , 2016).
For example, ISIS flooded some areas in order to disrupt the movement of enemy ground forces and cut off the water supplies to others. As they retreated, they blew up bridges blocking canals and destroyed pumping stations. They also focused on minor parts of the network such as wells and pipelines, disrupting and destroying agricultural livelihoods and endangering entire communities by depriving them of water and the electricity generated by the dams. ISIS not only damaged water infrastructure, but also directly polluted water sources by using the Tigris as a mass grave (Pax for Pease, 2017; UNEO&OCHA, 2016). Water quality was further negatively impacted by setting fire to18 oil wells in the Qarrayah region and a ~50,000 tons stockpile of pure sulphur at the Mishraq Complex. In both regions, the fires caused dense, white cloud of toxic sulphur oxides that reached Baghdad and neighboring districts and let to the destruction of 9518 buildings. The estimated quantity of conflict based debris in Mosul only was estimated at 11 million tons (UNEP, 2017).
In addition to the war-related pollution of the Tigris described above, one of the main sources of contamination in the river is the lack of or incomplete sewage catchment in the Mosul conurbation. The city therefoe relies on septic tanks in local homes for treating domestic wastewater (Al-Masri & Alfadhl, 2014; Alfadhl, 2015). However, the number and availability of them is too low or too poor for the total population of 3,750,000, resulting in a significant discharge of untreated gray water from domestic, industrial or military sources in the urban area and the 20 natural valley with tributaries into the Tigris in the metropolitan area. The deterioration of water quality of the Tigris River is considered one of the most important problems in the city of Mosul in the post-war phase, as the war of liberation severely damaged the environment in Mosul, especially the quality of the rivers as central lifelines. The destroyed urban infrastructure and the widespread distribution of highly toxic substances, both from combat operations and from military equipment left behind, lead to heavy metal emissions that often end up in water and groundwater sources, causing serious health issues for both humans and the surrounding flora and fauna (Altahaan and Dobslaw 2024a; Altahaan and Dobslaw 2024b). As this heavy metal contaminations spread, they will contaminate the entire environment, including soil, river water, air and groundwater (UNEP, 2017; Paulo, 2017).
Ammunition, explosives and other military materials contain a range of potentially hazardous elements and compounds. Common heavy metal constituents in small-caliber and light weapons ammunition include lead (Pb), copper (Cu), mercury (Hg), antimony (Sb) and tungsten (W). For example, Pb makes up 95 – 97 % of the metallic components of military ammunitions and grenades (Lima et al., 2011).
In recent years, the Tigris received many pollutants by passing the urban agglomeration, as the river serves as a sink for waste from agriculture, industry and other human activities due to its flow and ecological nature (Alsaffawi, 2018a; Alsaffawi, 2018b). In addition to the pollution caused by the infiltration of polluted surface water from the conflict area as well as the infiltration of polluted groundwater into the river (Altahaan & Dobslaw, 2024a; Altahaan & Dobslaw, 2024b; Altahaan & Dobslaw, 2025a), the demand for water in Mosul is increasing due to population growth, environmental considerations, and economic development (Danboos et al., 2017). The damage caused by conflicts in environmental governance can affect environmental protection for years to come. This can set back progress in areas as diverse as pollution control, resource and protected area management, climate change adaptation and biodiversity protection (UNDP, 2023).
Therefore, the objective of this research was to assess the physico-chemical quality of the Tigris water using the Canadian Council of Ministers of the Environment Water Quality Index (CCME WQI) and to evaluate its heavy metal content using the Heavy Metal Pollution Index (HPI). Additionally, the study aimed to identify seasonal and annual variations in pollutant levels in the river during the study period in the post-war period in Mosul.
1.2. The Main Use of Heavy Metals in Military Operations
Cadmium(Cd):
Cadmium is used in military operations primarily in the production of batteries, particularly in rechargeable nickel-cadmium (Ni-Cd) batteries, which are used in various types of military equipment and vehicles (U.S. Department of Defense , 2017; NATO, 2020).
Lead(Pb):
Lead is extensively used in military applications, especially in the production of bullets and other ammunition (U.S. Environmental Protection Agency [EPA], 2006). It is also used in shielding materials to protect against radiation (International Atomic Energy Agency [IAEA], 2005) and in the construction of military vehicles and aircraft (Department for Environment, Food and Rural Affairs [DEFRA], 2002).
Zinc(Zn):
Zinc is used in military operations for galvanizing metals to prevent corrosion, which is crucial for maintaining the integrity of military equipment and infrastructure (ASTM International, 2018). It is also used in the production of brass and other alloys for various military components (National Defense Industrial Association [NDIA], 2019).
Chromium(Cr):
Chromium is used in military operations for its corrosion-resistant properties. It is often used in the production of stainless steel and other alloys for military vehicles, aircraft, and naval vessels (Military Handbook, MIL-HDBK-5H, 2003). Chromium compounds are also used in paints and coatings to provide a durable finish (Society for Protective Coatings (Society for Protective Coatings, 2015).
Nickel(Ni):
Nickel is used in military operations for its high strength and resistance to corrosion. It is used in the production of stainless steel and other alloys for military equipment, as well as in batteries, such as nickel-metal hydride (Ni-MH) batteries, which are used in various military devices (U.S. Army Materiel Command, 2016; Defense Logistics Agency [DLA], 2021).
2. Materials and Methods
2.1. Investigation Area
Within the urban area of Mosul, the 375,000 km² catchment area of the Tigris extends upstream in the northwest to Al Kuba and in the southeast to Hammam alil. The total flow length of the Tigris in this area is approx. 214 km with a river width of 50-200 m and a depth of approx. 50 m. The river gradient is 1:2000 and the average annual discharge of the Tigris is 250 - 400 m³*s-1 (Almeshhadani, 2012). The hyporheic interstitial consists of two layers, an upper layer of gravel with an average grain size of 32 mm and a lower layer of gravel and sand with an average grain size of 13 mm. The gravel morphology is dominated by the disk shape, followed by flat and spherical shapes (Othman et al., 2012). Sampling sites within the catchment area were defined according to Table 1.
2.2. Sampling Procedure
120 water samples were taken from ten locations in the Tigris (see Table 1, Figure 1), each in triplicate over a period of two years (series 1: January to April 2022, series 2: July to October 2022, series 3: January to April 2023, series 4 : July to October 2023) in clean polyethylene bottles with a capacity of 250 ml, which corresponds to a total of 30 different samples per series. The temperature of the samples during sampling were 0 - 45 °C. Each sample was directly stored in a refrigerated container at -4 °C after sampling, transported directly to the laboratory, and further analyzed for the following 13 parameters: pH, electric conductivity (E.C.), % salinity, total dissolved solids (TDS), chemical oxygen demand (COD), , , , Pb, Zn, Cd, Cr, and Ni. The collection and analysis of the samples in the environmental laboratory was carried out according to standard methods (APHA, AWWA and WPCE, 1998). The water flow rate during the period of the study was about 250-300 m3*s-1 in series 1 and 2 and about 350-400 m³*s-1 in series 3 and 4. Due to the lack of rainwater in 2023, the gates of the Mosul Dam were opened to meet the water requirements for agricultural use in southern Iraq.
Water samples were taken according to DIN EN ISO 5667-6. During sampling from the riverbank, special attention was paid to ensure that sampling was performed from the homogeneous layer of the water body without picking up surface films, dead water, or swirling bottom sediments. Sampling was performed at mid-height between the river bed and the water surface, i.e., at a depth of approx.25 m.
2.3. Field Measurement Parameters
Temperature, pH value, E.C., TDS, and % salinity of water samples were directly analyzed on-site using an Oumefar 5- in-1 digital water quality monitor analyzer of type UPC 886108495111.
2.4. Laboratory Measurement Parameters
Phosphate (in mg/L) was photometrically analyzed without digestion, and therefore as ortho-phosphate,at 690 nm as phosphorus molybdenum blue using ammonium molybdate solution according to DIN EN 1189.
Nitrate (in mg/L) was also photometrically analyzed at 324 nm after acidification with HCl of the pre-diluted samples using a colorimetric reaction of nitrate with 2,6-dimethylphenole to 4-nitro-2,6-dimethylphenole according to DIN 38405-D9-2.
Sulfate (in mg/L) was quantified through precipitation from acetic acid solution with barium chloride crystals as barium sulfate according to DIN 38405-D5. The intensity of the turbidity of the final suspension was measured at 420 nm using a turbidity meter.
The COD (in mg O2/L) was determined according to DIN 38409-H41. Abundant potassium dichromate was titrated with ammoniairon(II) sulfate and ferroin as an indicator until the color changed from blue-green to red-brown.
Heavy metals (Cd, Pb, Cr, Ni, Zn) were analyzed after acidic digestion and using a Phoenix-986AAS atomic absorption spectrometer. Detected absorbance levels were converted into concentrations (in µg*L-1) using calibration curves prepared in accordance with the APHA standard (APHA, 1985). Analysis was performed in two stages. Firstly, samples were analyzed without filtration before acidic digestion as pre-treatment to calculate the total heavy metal content of the samples. Secondly, analysis was repeated after filtration through a membrane filter (0.25 µm) as pre-treatment to restrict detection to dissolved heavy metals for calculation of the HPI, as explained later. The analysis of dissolved heavy metals was achieved according to procedures described previously (Prasad and Kumari, 2008; Reza and Singh, 2010; Mohan and Nithila, 1996).
2.6. Assessment of Water Quality and Heavy Metals Consents
2.6.1. Calculation of the CCME WQI
The Canadian Consulate Module for Water Quality Index can assess the water quality against the conditions defined by the water quality objectives, provide insight into the impact of water quality on human activity, and places a special focus on key environmental factors. The index is a useful tool to describe water column condition, sediment and aquatic life to arrange the suitability of water for use by humans, aquatic life, wildlife, etc. (Canadian Water Quality Guidelines, 2007; Phadatare, 2016).
Water quality index (WQIs) are developed to (i) provide a single value that can be used to compare different water bodies; (ii) allow analysis of spatio-temporal water quality trends and prioritization of water resource sustainability; (iii) define and describe water resources that are “good” and “bad” for the different process; and (iv) provide a particular rating that the public, water quality professionals and politival decision-makers can understand and apply to describe water quality status (Canadian Council of Ministers of the Environment , 2001 & 2017).
The CWQI equation is computed using three factors as follows (Canadian Council of Ministers of the Environment, 2001; Lumb, 2006)
Factor 1 (F1): Scope: The percentage of the variables that exceed the guideline:
Factor 2 (F2): Frequency: This factor represented the percentage of individual tests that do not meet the guidelines (failed tests):
Factor 3 (F3): Amplitude: Represents the number of readings that exceeded the standards and according to the following steps:
1-Calculation of excursion:If the values are higher than the values of the standards, the criteria are calculated using the following equation:
2-The sum of the standard deviations (nse) and the sum of the readings not meeting the standards is calculated by the sum of the deviations divided by the total sum of the tests:
F3 is then computed from the following equation:
CCME WQI categorization was presented in Table 2.
2.6.2. Heavy Metal Pollution INDEX (HPI)
The HPI is defined as a rating reflecting the composite influence of dissolved heavy metals. It is calculated from the point of view of the suitability of water for human consumption with respect to heavy metal contaminations.
Heavy metal pollution index (HPI) is a technique of rating that provides the composite influence of individual heavy metal on the overall quality of water. Reflecting the relative importance of individual quality considerations and inversely proportional to the recommended standard (Si) for each parameter. Water quality and its suitability for drinking purpose can be examined by determining its quality index. The calculation of HPI involves the following steps (Mohan, 1996; Milivojević et al., 2016; Chiamsathit et al., 2020):
Based on a weightage Wi of the individual parameters (Eq. 1) and a heavy metal-specific quality factor Qi, which is calculated from the monitoring value Mi, ideal value Ii and standard value Si (Eq. 2), the HPI can be determined using both auxiliary parameters according to Equation 3.
The calculation of weightage of the parameter,
Wi =K/Si ……………….Q1
The quality rating for each of the heavy metal Qi .
Wi : is the unit weightage for the parameter
K: constant =1
Mi : Monitoring value of heavy metal parameters
Ii : Ideal value of heavy metal parameters
Si: Standard value of heavy metal parameters
N : is the number of parameters considered
The categorization was presented in Table 3
The study used the mathematical methods of CCME WQI and HPI for evaluation of the water quality for drinking and domestic use, based on standard limits (WHO, 2004).
3. Results and Discussions
The pollution of the Tigris can be divided into a total of four zones (with localised sites in brackets) along its flow length in the urban area. Zone 1 (S1) as a reference upstream of the confluence with the city and thus as a slightly contaminated water body, as essentially only discharges of agricultural wastewater occur here. The zone is otherwise characterised by recreational areas, which means that the influence of municipal drainage is still low here. In zone 2 (S2-S4), on the other hand, the Al Khosr valley drains into the Tigris. The river of the same name carries a heavy pollutant load on its course from the north-eastern valleys through this densely populated area and therefore has a high pollutant load (Al-saffawi, 2007). Zone 3 (S5-S7) is characterised by the old town of Mosul, where the military operations to liberate Mosul were concentrated. Finally, Zone 4 (S8-S10) is characterised by an area with intensive agricultural use and residential development outside the direct conflict zone. Details can be found in Figure 1 and Table 1.
The following sections therefore focus on the presentation of the analytical data as a function of these four zones and their comparison of zone associated concentrations on the basis of statistical methods.
3.1. Physico-Chemical Characteristics of All Parameters
3.1.1. pH Value
The pH values of all river sites consistently met the index criteria and WHO guidelines (WHO, 2004). However, values along the Tigris River flow decreased from 7.5 to 6.8 within the city passage (conflict zone) within the 2022 series (series 1 & series 2) and from 7.4 to 6.8 during the 2023 series (series 3 & 4). This is due to the uncontrolled discharge of organic pollutants from destroyed sewers, wild dumping of waste, as well as non-controlled input from contaminated surface runoffs. The biological degradation of these pollutants leads to partial acidification and thus a drop in pH due to the existing oxygen limitation. As can be seen from Table 4 and Table 5, the pH value dropped less during the rainy season (winter, spring) in the associated measurement series (No. 1 and 3) than in the measurement series (No. 2 and 4) associated with the dry season (summer, autumn). This effect is due to the higher turbulence caused by the higher discharge and thus a better oxygen input into the water body, as well as a lower water temperature in the cold period and thus a higher general oxygen concentration in the water phase. Furthermore, biodegradation is slowed down in the cool season, which also inhibits potential acidification reactions. Due to the existing carbonate hardness of the river water and the resulting buffering in the lime-carbonic acid equilibrium, the pH drop did not rise above 0.67 pH units (Al-saffawi, 2018; Altahaan & Dobslaw, 2024a).
3.1.2. E.C., TDS, Salinity
The conductivity of the Tigris water was below the WHO target values within all series and at all sites (2022: 431-740 µS/cm; 2023: 336-602 µS/cm), so that this parameter represents no exclusion criterion for the use of the water. However, over the river length an increase in conductivity from originally 431 and 336 µS/cm in 2022 and 2023 to 740 and 602 µS/cm at measuring point 6 and a subsequent gradually decrease to 604 and 562 µS/cm at S10 can be observed. Due to the parameter-related correlation between conductivity and TDS, the latter parameter also follows this course. In detail, it increased between measuring points S1 to S5 from 348.7 to 602.2 mg/L (2022) and from 233.5 to 583.6 mg/L (2023). In the further course of the river, the measured values increased by a further 12 % up to S10 (corresponding to 680 mg/L and 533 mg/L). Despite high TDS values, the detected concentrations remained below the WHO guidelines. In the two measurement years, the salt content increased to values between 0.40-0.70 % (2022) and 0.21-0.55 % within the urban area, with the lowest value always observed at S1 and the highest levels at S5. However, all samples were below the WHO limits, so that no restrictions for drinking or domestic use can be derived (Al-saffawi, 2021; Altahaan & Dobslaw, 2024a).
3.1.3. COD
COD values ranged between 26.8-91 mg/L (2022) and 11.5-53 mg/L (2023) at all sites. In detail, starting at lowest levels at S1 (2022: 11.5 mg/L; 2023: 26.8 mg/L) levels increased over the length of the river, culminated at S5 (91 and 53 mg/L, respectively) and declined smoothly to 73.5 mg/L (2022) and 29.5 mg/L (2023) at S10 due to biodegradation activity.
3.1.4. , , as Anions,
Accordingly, the anions phosphate (building metabolism, ATP formation as cell-internal short-term energy storage), nitrate (electron acceptor under anoxic conditions) and sulphate (electron acceptor under anaerobic conditions), which are relevant for biological processes, show that the same ions are subject to a comparable concentration curve as the parameters described above. In detail, the concentrations of phosphate were between 0.3-0.95 mg/L (2022) and 0.28-0.77 mg/L (2023) over the watercourse and exceeded the WHO limits by a factor of 2-2.5 from S2 onwards and subsequent sites. In addition to conflict-related emissions from phosphorus bomb residues, the main sources of phosphate emissions are the use and release of detergents, industrial sources, phosphate-containing fertilisers and the infiltration of untreated wastewater. The latter contains phosphate levels of 4-15 mg P/L above human excreta (Butlers, 2024). As phosphate levels rose sharply at S4 directly after the Al-Mur Valley river confluence and phosphate levels generally rose via the urban passage to S7, which is located at the end of the densely built-up area, domestic wastewater and in particular faecal wastewater can be seen as the main source of phosphate. In his study on the eutrophication potential of wastewater discharged into the Tigris in the urban area of Mosul, Fadhel (2020) identified a total of 24 infiltration points through which more than 80 tonnes per year of nitrate and phosphate are discharged into the river. In addition, various sources of contamination outside the urban area were also identified, such as municipal wastewater discharges from the rapidly growing city of Zakho (via Al-Khabour river) and Dohouk city, general drainage of a large number of valleys to Mosul lake and the discharge of 300 m³/h of sulfur springs effluents from the Badoosh dam project, to name just a few sources (Fadhel, 2020).
In contrast to phosphate, natural sources also play an important role for sulphate, particularly in the Mosul conurbation, as the geological zones in the Mosul area are rich in sulphur. For example, the dissolution of the gypsum rock due to the damming of the Tigris water in Mosul Lake also leads to increasing concentrations (Alfadehl, 2020; Altahaan & Dobslaw, 2024a). In addition to municipal wastewater infiltration, other sources include the cement industry, the aforementioned sulphur springs, various heavily polluted inflows to Mosul Lake and illegal practices such as in-house slaughtering (Al-Rawi, 2005). The detected sulphate values in the range of 74.0-336.5 mg sulphate/L (2022) and 62.5-307.0 mg sulphate/L (2023) and the almost constant concentration level over the entire city passage starting with the discharges from the Al Mur Valley at S4 therefore appear unsurprising. At some sites, the WHO limit value of 250 mg/L was thus exceeded by up to 1.4 times.
Similar to phosphate, nitrate is also primarily introduced into the river in the urban area via infiltration of municipal wastewater. Accordingly, concentrations of 2.1 and 1.3 mg nitrate/L occurred in 2022 and 2023 at S1, but rose to 2.7 and 2.5 mg nitrate/L at S9 through the city passage. The limited increase in nitrate is an indication of nitrate respiration occurring under anoxic conditions over the flow length.
3.1.5. Heavy Metals
The levels of Cd, Pb, Cr, and Ni exceeded WHO limits even before entering the city at S1. In all test series these levels increased further, particularly through the Old City passage, which was a direct conflict zone (S5 - S7).
Cd: In detail, average values of 4.5-25.9 µg/l were measured for cadmium (Cd) in 2022 and 2.6-18.9 µg/l in 2023. The levels rose during the urban passage from 4.5 µg/l (S1 in 2022) and 2.1 µg/l (S1 in 2023) to S5/S6 to 25.9 µg/l (2022) and 18.9 µg/L (2023) and decreased only moderately up to S10 (2022: 16.1 µg/L; 2023: 11.3 µg/L) over the course of the river, as cadmium only tends to precipitate at a pH value > 8.3 (Hu et al., 2019). This corresponds to an increase by a factor of 5 (2022) or 9 (2023) due to existing discharges in the urban area. The WHO limits were therefore exceeded at all measuring points in 2022 and in 2023 at all measuring points with the exception of S1.
Pb: In the case of lead, the detected concentrations exceeded the WHO limits at all locations in all four series with concentrations of 23-165 µg/L (2022) and 12.9-120 µg/L (2023) and thus by a factor of 16.5 and 11, respectively. The increase in concentration correlates in turn with an increasing population density and stabilises at a similar level from S3 to S8. In the suburban regions in the south-east of the city of Mosul, the lead content decreases moderately. The course of the lead concentration over the course of the river is consistent with other studies from the recent past, which also showed a significant exceedance of the limit value in the post-war years compared to older pre-war studies, which were unable to detect any significant lead contamination in the river. For example, pre-war studies on the water quality of the Tigris showed lead concentrations of imperceptible - 0.403 mg/L (Al-Sarraj, 2013) in the urban area of Mosul. In further studies of the Tigris in other urban centres such as Baghdad and the Maysan Governorate, lead concentrations were significantly below the WHO limits or were only detectable in irrelevant concentrations (Ahmed, 2013; Shukri et al., 2011). In contrast, the most recent study by Kannah and Shihab (2022) showed average lead concentrations in long-term sampling of 1.785-2.60 mg/L, which is even 10-22 times higher than in the present study (Kannah and Shihab, 2022). As lead and other heavy metals have a strong bioaccumulative effect, they tend to accumulate significantly in human tissue and aquatic life, which in turn can lead to increased accumulation in humans via the food chain (Al-Rawi, 2005). Main lead sources emitting into the Tigris are the direct discharge of untreated wastewater (Al-Yazji and Mahmoud, 2008), but also agricultural wastewater resulting from the use of pesticides, and industrial wastewater (e.g., mineral extraction, production of batteries and paints) (Malakootian, 2011) leading to considerable lead pollution levels. In light of the recent conflict and the high intensity of fighting in the urban area of Mosul, however, infiltration of lead-containing surface water into the Tigris must also be considered as a source of emissions, as modern armour-piercing ammunition and lead hollow point bullets are made of lead in order to maximise the harmful effect by deforming the outer body (McTee et al., 2023; Chen et al., 2020; Kumar et al., 2011).
Zn: According to the site, the detected zinc concentration levels varied between 146.5 - 1544.5 µg/L (2022) and 262.5-1100.5 µg/L (2023) and also increased during the passage through the conflict area between sites S1-S5. The detected concentrations at all sites were well above the levels presented in other pre-conflict studies (10-192 µg/L) (Rasheed, 2017; Khudhair, 2018; Gümgüm, 2001), while post-conflict studies confirmed the detected concentration level (443-1163 µg/L) (Kannah, 2022).
Despite the significant increase in concentrations, all detected values were within the WHO guidelines. The main sources of zinc emissions are industrial and municipal wastewater, but also agricultural sludge infiltrates. As lead, antimony, copper, arsenic, tungsten and zinc are the main metals in production of munition (Barker et al., 2021), high deposits of these compounds can be expected in soil or sediment samples of conflict zones. This increase in zinc reflected in the water is due to heavy soil contamination caused by the war (Al-Sheraety et al. ,2023) were able to show in numerous samples from the right bank of Mosul city that the Zn concentrations in the soil in the old city reached levels of 726-3880 ppm, while the concentrations in the surrounding area of Mosul were 31.1-167 ppm and therefore around a factor of 20 lower.
Cr: The measured values for chromium exceeded the permitted limits in all test series and at all sites, reaching 22.2-73.1 µg/L (2022) and 17.0-66.0 µg/L (2023). Again, the concentrations increased during the city passage, which excludes natural or direct geological sources such as chromium-containing ores in the soil due to the small scale of the study area. The main emissions are therefore caused by human, industrial and also agricultural activities via contaminated fertilisers, especially in case of sewage sludge as fertilizer (Al-Sheraety et al., 2023). The energy supply structure is also of great importance as a source of chromium (Al-Heety et al., 2021: 360.9 mg Cr/kg soil in the vicinity of generators). Furthermore, gaseous chromium emissions can occur via combustion processes, which can lead to accumulation in the earth’s surface through dry or wet deposition. In Mosul in particular, the residues of weapons and explosives naturally represent a significant source of emissions (Skalny et al., 2021; Al-Sheraety et al., 2023). Chromium concentrations of 59.4-135.5 ppm have been observed in urban soil samples (Al-Sheraety et al., 2023), while chromium concentrations in non-conflict areas are up to 2 decades lower (e.g., 0.897-1.428 µg/g in sediment soil in Basra Governorate, Al-Tamimi et al., 2022).
Ni: As nickel is another important metal for military equipment (Skalny et al., 2021), following the previous elements, a strong contamination of nickel can also be detected in the combat area, and infiltrating surface runoff is the main source of emissions alongside human activities, industrial and energy infrastructure emissions. For the latter source, soil analyses showed contamination levels of 283.65 mg/kg in the immediate vicinity of a generator plant (Al-Heety et al., 20212). Accordingly, the nickel concentration in the Tigris rose from 20.8 µg/L to 90.5 µg/L (S5) during the city passage in 2022 and fell moderately to 75.4 µg/L over the course of the river. A comparable trend was seen in 2023 with an initial concentration of 15.5 µg/L, a maximum of 70.0 µg/L at S5 and a drop to 47 µg/L at site S10. Once the denser colonisation structure was reached, the WHO recommended values were always clearly exceeded (see Table 4 and Table 5).
3.2. Statistic Analysis
3.2.1. Test Values for Seasonal and Annual Variations
The T-test values show that there is a significant seasonal variation in pH values between series 1 and 2 (P<0.05), but this is not significant for 2023 series 3 and 4 (P>0.05). There are no significant annual variations between 2022 and 2023, which is due to the carbonate hardness of the river water, which only allows slight variations in pH due to the resulting buffering capacity (Alsaffawi, 2018a; Alsaffawi, 2021; Koushali et al., 2023).
For EC, TDS and salinity, however, the T-test values show a significant seasonal variation (P<0.05) between series 1 and 2 in 2022 and series 3 and 4 in 2023. A significant annual variation in these parameters is also recognisable in the annual comparison 2022 vs 2023. However, the values of EC, TDS and salinity generally increased at all sites in the wet season (winter, spring; series 1, series 3) compared to the dry season (summer, autumn; series 2, series 4), as Figure 2 illustrates.
The aspect of the rainy season and thus of increased surface inflows is also particularly evident for and , where the concentrations increased at all sites compared to the dry weather flows and a significant deviation was observed in the respective comparison of series. This phenomenon was also described by Lazaridou-Dimitridou (Lazaridou-Dimitriadou, 2002). The comparison of both test years also showed a significant annual fluctuation for phosphate and nitrate (Saiful Islam, 2015; Birgetta, 2008, Kingdom, 1999). For sulphate, on the other hand, there was neither a significant seasonal variation nor a variation in the two years of comparison. The reason for this appears to be the lithology of the existing rock strata, which consists primarily of gypsum in the Mosul area and along the banks of the Tigris. Accordingly, there is a high re-dissolution potential for sulphate deposits in this area (Al-Dabbas, 2021; Alsaffawi, 2018b).
In the case of the COD value, the T-test shows that significant seasonal variations can also be observed between series pairs 1 & 2 and 3 & 4, as previously found (Iqbal et al., 2022; Lazaridou-Dimitriadou, 2002). There is also a significant annual variation between 2022 and 2023, as illustrated by the statistical data in Table 6 and Table 7.
The influence of the rainy season is also reflected in the seasonal variations in heavy metal concentrations. The values of Cd, Pb, Zn, Cr and Ni also increased during the rainy season (winter, spring) in both years of the study and decreased during the dry season (summer, autumn). Thus, a significant seasonal as well as annual variation occurred as the data in Table 6 and Table 7 emphasise.
The significance of the seasonal variation in the parameters EC, TDS, COD, and all heavy metals (Cd, Pb, Zn, Cr, Ni) is due to the dominant infiltrating hydrogeology of the Tigris catchment during the rainy season, where rainwater absorbs salts and other pollutants as direct surface runoff or as near-surface runoff after penetration through a contaminated soil passage and carries them into the river (Altahaan & Dobslaw, 2024a; Altahaan & Dobslaw,2024b; Razaghi et al. , 2018; Edokpayi et al., 2017; Ewaid, 2016).
With the exception of the detected sulphate concentrations, there is a less pronounced annual fluctuation in the parameters EC, TDS, salinity, and all heavy metals in 2023 compared to 2022 (see Figure 2), which can be attributed to the increase in river water discharge to 350-400 m3/sec in 2023 compared to 250-300 m³/s in 2022 due to the opening of the upstream dam in context of low precipitation levels, as well as to municipal cleaning measures and the completion of debris removal in the conflict area. The latter measures included the removal of heavily contaminated debris, so that if rainfall returns in the following years, less pollutants can be expected to enter the river. In addition to urban planning aspects, this remediation completion is also becoming increasingly important against the backdrop of increased climate change, as in a direct comparison of 2023 vs. 2022, the year 2023 was characterised by significantly lower precipitation (24.4 mm vs. 40.4 mm) (AccuWeather, 2024; water scarcity Index, 2022; Action contre la faim, 2024; Altahaan & Dobslaw,2025b). Although these may still be short-term variations, the trend of decreasing precipitation is clearly recognisable (ClimeChart, 2024). Although this trend will lead to reduced pollution of the Tigris in the short term due to reduced infiltration volumes, in the long term, with decreasing plant density, increasing salinity due to rising evapotranspiration, and even boosted by continuous population growth, surface pollution will increase again and lead to increased impact pollution in the river when precipitation begins. In detail, in a long-term comparison of the measurement period from 1940-1950 with the measurement period 2013-2023, the monthly average temperature in Mosul rose by 0.81 °C, more so in the summer months of July (36.15 °C vs. 35.31 °C; + 0.84 °C), August (35.83 °C vs. 34.37 °C; + 1.45 °C) and September (30.84 °C vs. 29.74 °C; + 1.10 °C), which again significantly increases the evaporation rate and adds even more heat stress to the existing sparse vegetation. This is exacerbated by the clearing of around 80 % of the green areas close to the city during the ISIS occupation (The National News, 2022). However, the problem was recognised by the city administration and extensive reforestation programmes were launched with around 21,000 trees planted each year (The National News, 2022). As tree roots have bioaccumulation factors (BCF) of 10-10,000 for heavy metals (Kahle, 1993), this reforestation can also represent a bioremediation measure and improve the water quality of the Tigris in the long term.
3.2.2. Comparison of Heavy Metal Concentration with Previous Study
In order to be able to clearly address the fighting as the cause of the considerable pollution of the Tigris, it is necessary to compare the concentrations detected in this study with the results from various post-war and pre-war studies. The study by Aj-Sarraj et al. (2013) describes the heavy metal concentrations in the Tigris in the years 2011-2012. The direct comparison with the current measurement campaign from 2022 and 2023 shows that the Cd values of the sampling sites defined as Zone 1 according to Table 5 increased by a factor of 4 (2022) and 2.07 (2023), in Zone 3 by a factor of 6.25 (2022) and 4.44 (2023) and in Zone 4 by a factor of 3.69 (2022) and 2.57 (2023). A comparable increase can be detected for lead by a factor of 4.75 and 3.23 (Zone 1), 6.14 and 3.32 (Zone 3) and by a factor of 3.17 and 2.66 (Zone 4). The concentrations of zinc increased less markedly, as zinc is also used in many civilian applications and therefore enters the environment via a variety of pathways. The detected increases here are factors of 1.45 and 1.38 (zone 1), 1.15 and 1.28 (zone 2) and 1.23 and 1.55 (zone 4). Details, in particular on the absolute concentrations in the pre-war study, can be found in Table 8.
In terms of quality assurance, the detected concentrations should also be evaluated against other current post-war studies. For example, Aljanabi et al. (2022) showed heavy metal concentrations of 144.8-246.9 µg Pb/L, 14.9-121.4 µg Ni/L, 9.4-19.4 µg Zn/L and 20.0-71.7 µg Cr/L for the Tigris in the urban area of Baghdad, and thus outside the direct conflict zone. For Mosul in 2020 / 2021, Kannah et al. (2022) were able to detect concentrations of 443-1163 µg /L of zinc and 962-3770 µg/L of lead. The direct comparison with the current concentrations of 258.4-1509.9 µg Zn/L and 12.9-165.1 µg Pb/L shows that the previous studies in the case of lead in Aljanabi et al. (2022) show comparable concentrations, but in the case of the more relevant study by Kannah et al. (2022), concentrations up to a factor of 23 higher were observed. In the case of zinc, the concentrations of the two studies in Mosul are comparable, while the concentrations in Baghdad are 2 decades lower. Although only comparable to a limited extent, it is clear that the detected levels can be confirmed in their magnitude by other studies and therefore a significant increase in concentrations was recorded in comparison with measurement data from the pre-war period, particularly in relation to cadmium and lead. Thus, both heavy metals were released to a significant extent as a result of the war and introduced into the water body, while the diverse emission pathways for zinc make it at least difficult to clearly address combat operations as the dominant entry pathway.
3.3. Water Quality Evaluation
3.3.1. CCME WQI in River’s Water Samples
For this study, the CCME WQI was selected to assess the water quality at all sites of the Tigris in 2022 and 2023. For these indices, 13 parameters were analysed, namely pH, electrical conductivity (E.C.), percentage salinity, total dissolved solids (TDS), chemical oxygen demand (COD), , , , Pb, Zn, Cd, Cr and Ni were applied to test the quality of the Tigris River at all sites. The summary of CCME and the values of water samples were presented in Table 1. Regarding the temporal trend, Table 9 showed that S1 resulted in a CCME WQI of ‘good’ with a value of 83.97 (2022) and 90.06 (2023), while S2 was initially classified as ‘fair’ with 74.40 (2022) and 82.65 (2023) due to increasing discharges according to this index, but reached the quality class ‘good’ in the following year. Due to increasing discharges, the water quality deteriorated along the urban watercourse. For example, S3 and S4 fell into the ‘fair’ category in 2022 and 2023, while S5-S7 only fell into the ‘marginal’ category in 2022 (CCME WQI). The water quality of S5 and S7 improved in the following year, so that they were categorised as ‘fair’. S8-S10 remained in the ‘fair’ category in both years (CCME WQI). Please also refer to Table 9 for details.
If all individual sites are combined to form an urban global indicator, the water quality of the Tigris in 2022 and 2023 was in quality class 3 (‘fair’) at 63.83 and 73.25 respectively, with an improvement in water quality already apparent in 2023. This improvement is due in particular to the increased discharge of the river, which dilutes the pollutants, and the cleaning of the riverbanks and debris from the conflict areas. Nevertheless, the water quality remains poor compared to the pre-war study of 2014 (Al-Ahmady et al.,2020), in which the water quality was classified as ‘good’ with a value of 85.8 in class 4.
The CCME WQI values have decreased by a factor of 1.18 in 2022 and by a factor of 1.12 in 2023 compared to the pre-war study from 2014 (Al-Ahmady et al.,2020); see also Table 10).
The current water quality of the Tigris River, as described by the CCME WQI, is categorised as water quality that is generally protected but occasionally threatened or impaired; conditions sometimes deviate from natural or desirable values.
3.3.2. Heavy Metal Pollution Index HPI in River’s Water Samples
The HPI values were calculated based on the average values of dissolved heavy metal concentration in the study period 2022 and 2023 according to Table 11 and Table 12. The results showed that S1, S2, S3 could be classified as good and suitable for drinking and domestic use in terms of heavy metal content in 2022 and 2023, while S4-S10 had to be classified as unsuitable for both applications in the same period. An exception is S4, where the water quality improved from ‘unsuitable’ to ‘very poor’ due to an improvement in water quality (see Table 13).
The HPI values of the individual elements showed that the HPI of Cd was the highest compared to the other values, whereby the values of the heavy metal pollution index at the individual sites were ranked as follows: Cd>Pb>Ni>Cr>Zn. The results show that the heavy metal cadmium (Cd) has the greatest impact on river water quality, followed by lead (Pb). Particular attention should be paid to these two components in order to improve water quality. Details can be found in Table 14 and Table 15.
4. Conclusions
The present study shows that, with the exception of zinc, the existing heavy metal concentrations (Cd, Pb, Cr, Ni) in the Tigris exceeded the international and regional water quality standards at most sites and that considerable efforts need to be made to capture infiltrating wastewater streams, remove highly contaminated topsoil layers and reforestation as an approach to heavy metal fixation and bioremediation.
The seasonal and annual fluctuations between the values were significant in both measurement years for all parameters, with the exception of pH and sulphate content for the year 2023. This was due to the buffering effect of the lime-carbonic acid equilibrium, which prevents increased pH fluctuations, as well as the naturally occurring high concentrations of sulphur in the river basin, where a distortion of seasonal or annual profiles occurs due to redissolution, especially from gypsum rocks along the river bank.
The CCME WQI values showed that S1 could be categorised as ‘good’, S2, S3, S4, S7, S8, S9 as “moderate”, S5, S6 as ‘borderline’ for drinking and domestic use in 2022. In the following year, an improved classification for S2 (category “good”) and S5 (category “fair”) was achieved by improving the water quality. The general assessment of the water quality of the Tigris River was in the “moderate” category (class 3) within the study period. Accordingly, the use of the water is possible, but not fully suitable. However, the calculated values decreased by a factor of 1.18 in 2022 and 1.12 in 2023 compared to the previous study in 2014, i.e., there was a further improvement in water quality. The values of the heavy metal pollution index HPI showed that S1, S2 and S3 could be categorised as ‘good’ and are suitable for use, while S4 to S10 had to be categorised as ‘unsuitable’ for both analysis years. One exception is S4, which was upgraded to the “very poor” category in 2023. The main reasons for this were the intensive municipal activities and the increase in the river’s water flow rate. The HPI values at the individual sites were ranked as follows Cd>Pb>Ni>Cr>Zn. The study shows that the war had a significant impact on the deterioration of the water quality of the Tigris and the increase in heavy metal levels. The current water quality of the Tigris is generally categorised as protected but is occasionally threatened or impaired; conditions sometimes deviate from natural or desirable levels. Zone 3 is considered the most polluted zone compared to other sites. Cd and Pb in particular pose a very high ecological risk to the Tigris and should be carefully monitored and remediated.
Author Contributions
Zena Fakhri Altahaan: Sampling, material preparation, data collection and analysis, literature research, writing. Daniel Dobslaw: Study conception, sampling plan, literature screening, writing.
Institutional Review Board Statement
Not applicable.
Informed Consent Statement
All authors approved this article for publication. All authors reviewed and approved the final manuscript.
Acknowledgement
We are very grateful for the support of consulting office for laboratory tests in College of Agriculture and Forestry/Mosul University for the analytical support. There was no public funding for this work.
Conflicts of Interest
The authors have no relevant financial or non-financial interests to disclose.
References
- AccuWeather. (2024). Mosul - Current Air Quality. Pennsylvania. https://www.accuweather.com.
- Al-Ahmady, K Amina F. Farhan, Nawfal Abd-Aljabbar Al-Masry (2020). Assessment of Tigris River Water Quality in Mosul for Drinking and Domestic Use by Applying CCME Water Quality Index. IOP Conference Series: Materials Science and Engineering, 737. [CrossRef]
- Al-Dabbas, M. (2021). Hydrochemical Evaluation of the Tigris River from Mosul to South of Baghdad Cities, Iraq. International Journal of Environment and Climate Change. https://www.researchgate.net/publication/353486819.
- Alfadehl, M., & Sultan, F. (2019). Evaluation of the East Mosul Old Water Treatment Plant. International Journal of Environment & Water.
- Alfadhl, M. (2015). Descending of Tigris River Water Quality: Causes and Impacts. International Journal of Environment and Water, 4(4). https://www.researchgate.net/publication/317402132.
- Alfadhl, M. (2020). Pollution Investigation on Tigris River within Mosul Area, Iraq. Plant Archives, 20(S2), 1273–1277. http://www.plantarchives.org/SPL%20ISSUE%2020-2/202__1273-1277_. Aljanabi, Z. Z., Al-Obaidy, A. M. J., & Fikrat, M. (2021). A Brief Review of Water Quality Indices and Their Applications. IOP Conference Series: Earth and Environmental Science.
- Al-Masri, M., & Alfadhel, M. (2014). Pollutant Variation through Tigris River in Mosul City. International Journal of Interdisciplinary Research and Innovations, 2(4), 38–58. https://www.researchgate.net/publication/317402047_Pollutant_Variation_through_Tigris_River_in_Mosul_City.
- Al-Meshhadani. (2012). Study of Some Characteristics of Tigris River Between Mosul City and Hamam Al-Aleel Province. Iraq Academic Scientific Journal, 23(8), 56–67. https://www.iraqjournals.com/article_64524_0.
- Al-Sarraj, E., Jankeer, M., & Al-Rawi, S. (2019). Estimation of the Concentrations of Some Heavy Metals in Water and Sediments of Tigris River in Mosul City. Environmental Science, 28(1), 1–10. [CrossRef]
- Al-Sheraety, R. M., Al-Mallah, A. Y., & Hussien, A. K. (2023). Spatial Distribution of Heavy Metals in Soil. Iraqi Geological Journal, 56(1C). [CrossRef]
- Al-Saffawi, A. Y. (2018b). Application of CCME WQI to Assess the Environmental Status of Tigris River Water for Aquatic Life within Nineveh Governorate, North Iraq. Al-Utroha Journal, (5), 13–25.
- Al-Saffawi, A., et al. (2021). Application of Weight Mathematical Model (WQI) to Assess Water Quality for Irrigation: A Case Study of Tigris River in Nineveh Governorate. IOP Conference Series: Earth and Environmental Science, 735.
- Altahaan, Z., & Dobslaw, D. (2024a). Assessment of the Impact of War on Concentrations of Pollutants and Heavy Metals and Their Seasonal Variations in Water and Sediments of the Tigris River in Mosul/Iraq. Environments, 11(1). [CrossRef]
- Altahaan, Z. F., & Dobslaw, D. (2024b). Assessment of Post-War Groundwater Quality in Urban Areas of Mosul City/Iraq. World Journal of Advanced Research and Reviews, 21(03), 2461–2481. [CrossRef]
- Altahaan, Z., & Dobslaw, D. (2025). Post-War Air Quality Index in Mosul City, Iraq. Atmosphere, 16(2), 135. [CrossRef]
- APHA, AWWA, & WEF. (1998). Standard Methods for the Examination of Water and Wastewater (23rd ed.). American Public Health Association. https://www.pdfdrive.com/standard-methods-for-the-examination-of-water-and-wastewater-e11311928.html.
- Canadian Council of Ministers of the Environment. (2001). Canadian Water Quality Guidelines for the Protection of Aquatic Life: CCME Water Quality Index 1.0, User’s Manual. https://www.scirp.org/reference/referencespapers?referenceid=1165076.
- Canadian Council of Ministers of the Environment. (2017). CCME Water Quality Index: User’s Manual—2017 Update. https://ccme.ca/en/res/wqimanualen.pdf.
- Chiamsathit, C., Supunnika, A., & Thammarakcharoen, S. (2020). Heavy Metal Pollution Index for Assessment of Seasonal Groundwater Supply Quality in Hillside Area, Kalasin. Applied Water Science, 10, 142. [CrossRef]
- DIN EN ISO. (2016). Water Quality — Sampling — Part 6: Guidance on Sampling of Rivers and Streams. International Organization for Standardization.
- Danboos, A., Jaafar, O., & El-Shafie, A. (2017). Water Scarcity Analysis, Assessment and Alleviation: New Approach for Arid Environment. International Journal of Applied Engineering Research, 12(18), 7536–7545. https://www.ripublication.com/ijaer17/ijaerv12n18_59.
- Edokpayi, J. N., Odiyo, J. O., Popoola, E. O., & Msagati, T. A. M. (2017). Evaluation of Temporary Seasonal Variation of Heavy Metals and Their Potential Ecological Risk in Nzhelele River, South Africa. Open Chemistry, 15, 272–282. https://www.degruyter.com/document/doi/10.1515/chem-2017-0033/html.
- Ewaid, S. (2016). Water Quality Assessment of Al-Gharraf River, South of Iraq by the Canadian Water Quality Index (CCME WQI). Iraqi Journal of Science, 57(2A), 878–885. https://www.researchgate.net/publication/305511602_.
- Iqbal, M., Iqbal, M. M., Li, L., Hussain, S., Lee, J. L., Mumtaz, F., ... & Dilawar, A. (2022). Analysis of Seasonal Variations in Surface Water Quality over Wet and Dry Regions. Water, 14, 1058. [CrossRef]
- Magri, P. (2017). After Mosul, Re-Inventing Iraq. Report study submitted for ISPI Executive. https://web.archive.org/web/20180421160433id_/http://www.ledizioni.it/stag/wp-content/uploads/2017/10/Iraq_web_DEFDEF.pdf.
- Jo, C. D., & Kwon, H. G. (2023). Temporal and Spatial Evaluation of the Effect of River Environment Changes Caused by Climate Change on Water Quality. Environmental Technology & Innovation, 30, 103066. [CrossRef]
- Kingdon, M. J., Bootsma, J., & Mwita, B. M. (1999). River Discharge and Water Quality. Environment Canada, National Water Research Institute.
- Koushali, H., Mastouri, R., & Khaledian, M. R. (2023). Impact of Precipitation and Flow Rate Changes on the Water Quality of a Coastal River. Shock and Vibration, 2021, Article ID 6557689. [CrossRef]
- Lazaridou-Dimitriadou, M. (2002). Seasonal Variation of the Water Quality of Rivers and Streams of Eastern Mediterranea. Web Ecology, 3, 20–32.
- calculation of its pollution index for Uglješnica River, Serbia. Bulletin of Environmental Contamination and Toxicology, 97(5), 737–774. https://www.researchgate.net/publication/308215236.
- Mohan, S. V., Nithila, P., & Reddy, S. J. (1996). Estimation of heavy metals in drinking water and development of heavy metal pollution index. Journal of Environmental Science and Health, Part A, 31, 283–289. [CrossRef]
- Ojok, W., Wasswa, J., & Ntambi, E. (2017). Assessment of seasonal variation in water quality in River Rwizi using multivariate statistical techniques, Mbarara Municipality, Uganda. Journal of Water Resource and Protection, 9, 83–97. http://www.scirp.org/journal/jwarp.
- Othman, K., Bilal, A. A., & Sulaman, Y. I. (2012). Morphologic characteristics of Tigris River with at Mosul City. Tikrit Journal of Engineering Sciences, 19(3), 36–54. [CrossRef]
- Pax for Peace. (2017). Living under a black sky: Conflict pollution and environmental health concerns in Iraq. https://paxforpeace.nl/publications/living-under-a-black-sky/.
- Phadatare, S., & Gawande, S. (n.d.). Review paper on development of water quality index. International Journal of Engineering Research.
- Prasad, B., & Kumari, S. (2008). Heavy metal pollution index of groundwater of an abandoned open cast mine filled with fly ash: A case study. Mine Water and the Environment, 27(4), 265–267. [CrossRef]
- Razaghi, M., Taherizadh, M. R., & Mashjoor, S. (2018). Seasonal variation in heavy metal concentrations in sediment from Khalasi Estuary, Hormozgan, Iran. Indian Journal of Fisheries, 65(3), 130–134. https://www.researchgate.net/publication/330686305.
- Reza, R., & Singh, G. (2010). Assessment of heavy metal contamination and its indexing approach for river water. International Journal of Environmental Science and Technology, 7(4). [CrossRef]
- Islam, S., Uddin, K., Tareq, S. M., Shammi, M., Kamal, A. K. I., Sugano, T., Tanaka, S., & Kuramitz, H. (2015). Alteration of water pollution level with the seasonal changes in mean daily discharge in three main rivers around Dhaka City, Bangladesh. Environments, 2(3), 280–294. [CrossRef]
- Stiftung Wissenschaft Und Politik (SWP). (2016). Water as weapon: IS on the Euphrates and Tigris. https://www.swp-berlin.org/en/publication/water-as-weapon-is-euphrates-tigris.
- United Nations Environment Programme (UNEP). (2017). Environmental issues in areas retaken from ISIS in Mosul, Iraq: Rapid scoping mission (July - August). https://reliefweb.int/report/iraq/technical-note-environmental-issues-areas-retaken-isil-mosul-iraq-rapid-scopying-mission¶.
- UN-Habitat. (2016). City profile of Mosul, Iraq: Multi-sector assessment of a city under siege. https://unhabitat.org/city-profile-of-mosul-iraq-multi-sector-assessment-of-a-city-under-siege.
- United Nations Development Programme (UNDP). (2023). Climate change, environmental degradation, conflict, and displacement in the Arab States region. https://www.undp.org/sites/g/files/zskgke326/files/2023-06.
- UNEP & OCHA. (2016). A rapid overview of environmental and health risks related to chemical hazards in the Mosul humanitarian response. https://reliefweb.int/report/iraq/rapid-overview-environmental-and-health-risks-related-chemical-hazards-mosul.
- UNEP. (2018). Mosul debris management assessment. https://www.unep.org/resources/publication/mosul-debris-management-assessment.
- Water Quality Australia. (2013). Characterising the relationship between water quality and water quantity. https://www.waterquality.gov.au/sites/default/files/documents/characterising.pdf.
- Action Against Hunger Iraq. (2022/2023). Water scarcity index for Ninewa Governorate, Iraq. https://www.actioncontrelafaim.org/wp-content/uploads/2022/09/Drought-Prediction-Tool-2022-ACF-Iraq.pdf.
- World Health Organization (WHO). (2004). Guidelines for drinking-water quality (2nd ed., pp. 133–415). https://apps.who.int/iris/handle/10665/38551.
- Al-Rawi, S. M. (2005). Contribution of man-made activities to the pollution of the Tigris within Mosul area, Iraq. International Journal of Environmental Research and Public Health, 2(2), 245–250. [CrossRef]
- https://butlerms.com/education-blog/sewage-parameters-4-part-1-phosphorus-p.
- Fadhel, M. N. (2020). Pollution investigation on Tigris River within Mosul area, Iraq. Plant Archives, 20(2), 1273–1277.
- Hu, S., Lian, F., & Wang, J. (2019). Effect of pH to the surface precipitation mechanisms of arsenate and cadmium on TiO₂. Science of the Total Environment, 666, 956–963. [CrossRef]
- Al-Sarraj, E. S. J. H. (2013). Study of the pollution of the Tigris River with various wastes within the city of Mosul and their impact on a number of local fish (PhD thesis, University of Mosul, Iraq).
- Ahmed, W. A. (2013). Study of the potential pollution with heavy metals and some environmental factors in the water of the Tigris River and some main branches in Maysan Governorate, southern Iraq. Basra Journal of Agricultural Sciences, 26(1), 401–409.
- Shukry, H. M., Rahim, A., Jassem, G. H., Hassan, A. A., Asaad, J. I., & Ahmed, N. A. N. (2011). Study of the pollution of the Tigris River in Baghdad governorate with some heavy metals (zinc and lead) and evaluation of its chemical and biological quality. Journal of Biotechnology Research Center, 5(2), 5–14.
- Kannah, A. M. A., & Shihab, H. F. A. (2022). Heavy metals levels in the water of the Tigris River in the city of Mosul, Iraq. Egyptian Journal of Aquatic Biology & Fisheries, 26(6), 1007–1020.
- Al-Yazji, Y. M., & Mahmoud, H. J. (2008). Study of the qualitative characteristics and archaeological elements of the water of the Tigris River in the city of Mosul. Iraqi Journal of Earth Sciences, 8, 33–49.
- Malakootian, M., Jaafarzadeh, N. A., & Hossaini, H. (2011). Efficiency of perlite as a low-cost adsorbent applied to removal of Pb and Cd from paint industry effluent. Desalination and Water Treatment, 26, 243–249. [CrossRef]
- McTee, M., Parish, C. N., Jourdonnais, C., & Ramsey, P. (2023). Weight retention and expansion of popular lead-based and lead-free hunting bullets. Science of the Total Environment, 904, 166288. [CrossRef]
- Chen, Z., Song, J., Soons, J. A., Thompson, R. M., & Zhao, X. (2020). Pilot study on deformed bullet correlation. Forensic Science International, 306, 110098. [CrossRef]
- Kumar, M. K., Prabhakar, N. G., Chandrika, G., Mohan, B. M., & Nagendrappa, G. (2011). Microscopic and spectrometric characterizations of trace evidence materials present on the discharged lead bullet and shot – A case report. Journal of the Saudi Chemical Society, 15, 11–18. [CrossRef]
- Gümgüm, B., Ünlü, E., Akba, O., Yildiz, A., & Namli, O. (2001). Copper and zinc contamination of the Tigris River (Turkey) and its wetlands. Archives of Nature Conservation and Landscape, 40(3), 233–239.
- Khudhair, M. F., Ahmed, F., Dawod, A., & Abd, W. M. (2018). Evaluation of irrigation water quality index for Tigris River and pollution levels of heavy metals in Baghdad. Research Journal of Pharmaceutical, Biological and Chemical Sciences, 9(6), 993–1000.
- Rasheed, K. A., Flayyh, H. A., & Dawood, A. T. (2017). Study the concentrations of Ni, Zn, Cd, and Pb in the Tigris River in the city of Baghdad. International Journal of Environment, Agriculture and Biotechnology, 2(1), 196–201. [CrossRef]
- Barker, A. J., Clausen, J. L., Douglas, T. A., Bednar, A. J., Griggs, C. S., & Martin, W. A. (2021). Environmental impact of metals resulting from military training activities: A review. Chemosphere, 265, 129110. [CrossRef]
- Al-Tamimi, M. H., Kadhim, H. H., & Al-Hello, A. Z. A. (2022). Assessment of environmental pollution by heavy elements in the sedimentary at Abu Al-Kahsib River in Basrah province-southern Iraq. Marsh Bulletin, 17(2), 114.
- Al-Heety, L. F. D., Hasan, O. M., & Al-Heety, E. A. M. S. (2021). Heavy metal pollution and ecological risk assessment in soils adjacent to electrical generators in Ramadi City, Iraq. Iraqi Journal of Science, 62(4), 1077–1087. [CrossRef]
- Skalny, A. V., Aschner, M., Bobrovnitsky, I. P., Chen, P., Tsatsakis, A., Paoliello, M. M., Buha, D. A., & Tinkov, A. A. (2021). Environmental and health hazards of military metal pollution. Environmental Research, 201, 111568. [CrossRef]
- Kahle, H. (1993). Response of roots of trees to heavy metals. Environmental and Experimental Botany, 33(1), 99–119. https://doi.org/10.1016/0098-8472(93)90059-OThe National News (2022). Mosul’s island of tranquility: the forst still recovering from ISIS war. Published 2022/03/03. https://www.thenationalnews.com/mena/2022/03/03/mosuls-island-of-tranquillity-the-forest-still-recovering-from-isis-war/.
- ClimeChart. (2024). Climate change chart of Mossul, Iraq. Retrieved from https://www.climechart.com/en/climate-change/mossul/iraq.
- Aljanabi, Z. Z., Hassan, F. M., & Al-Obaidy, A. H. M. J. (2022). Heavy metals pollution profiles in Tigris River within Baghdad city. IOP Conference Series: Earth and Environmental Science, 1088, 012008. [CrossRef]
- ASTM International. (2018). Standard specification for zinc coating (hot-dip galvanized) on iron and steel products (ASTM A123/A123M).
- Defense Logistics Agency (DLA). (2021). Nickel-based alloys in defense applications. Retrieved from https://www.dla.mil/.
- Department for Environment, Food and Rural Affairs (DEFRA). (2002). Lead in military applications. London: DEFRA Publications.
- International Atomic Energy Agency (IAEA). (2005). Radiation protection and safety in military environments (IAEA Safety Reports Series No. 40).
- Military Handbook (MIL-HDBK-5H). (2003). Metallic materials and elements for aerospace vehicle structures. U.S. Department of Defense.
- National Defense Industrial Association (NDIA). (2019). Advanced materials for defense systems. NDIA Technical Report.
- NATO. (2020). Energy storage solutions for military operations (STO Technical Report TR-AVT-323).
- Society for Protective Coatings (SSPC). (2015). Chromium-based coatings for military infrastructure (SSPC-Paint 20).
- U.S. Army Materiel Command. (2016). High-performance materials for combat systems (AMC Pamphlet 750-3).
- U.S. Department of Defense (DoD). (2017). Battery technologies for military use (DoD Directive 4270.5).
- U.S. Environmental Protection Agency (EPA). (2006). Lead in ammunition: Environmental and health impacts (EPA/600/R-06/042).
Figure 1.
Map of Mosul with highlighted locations of sampling.
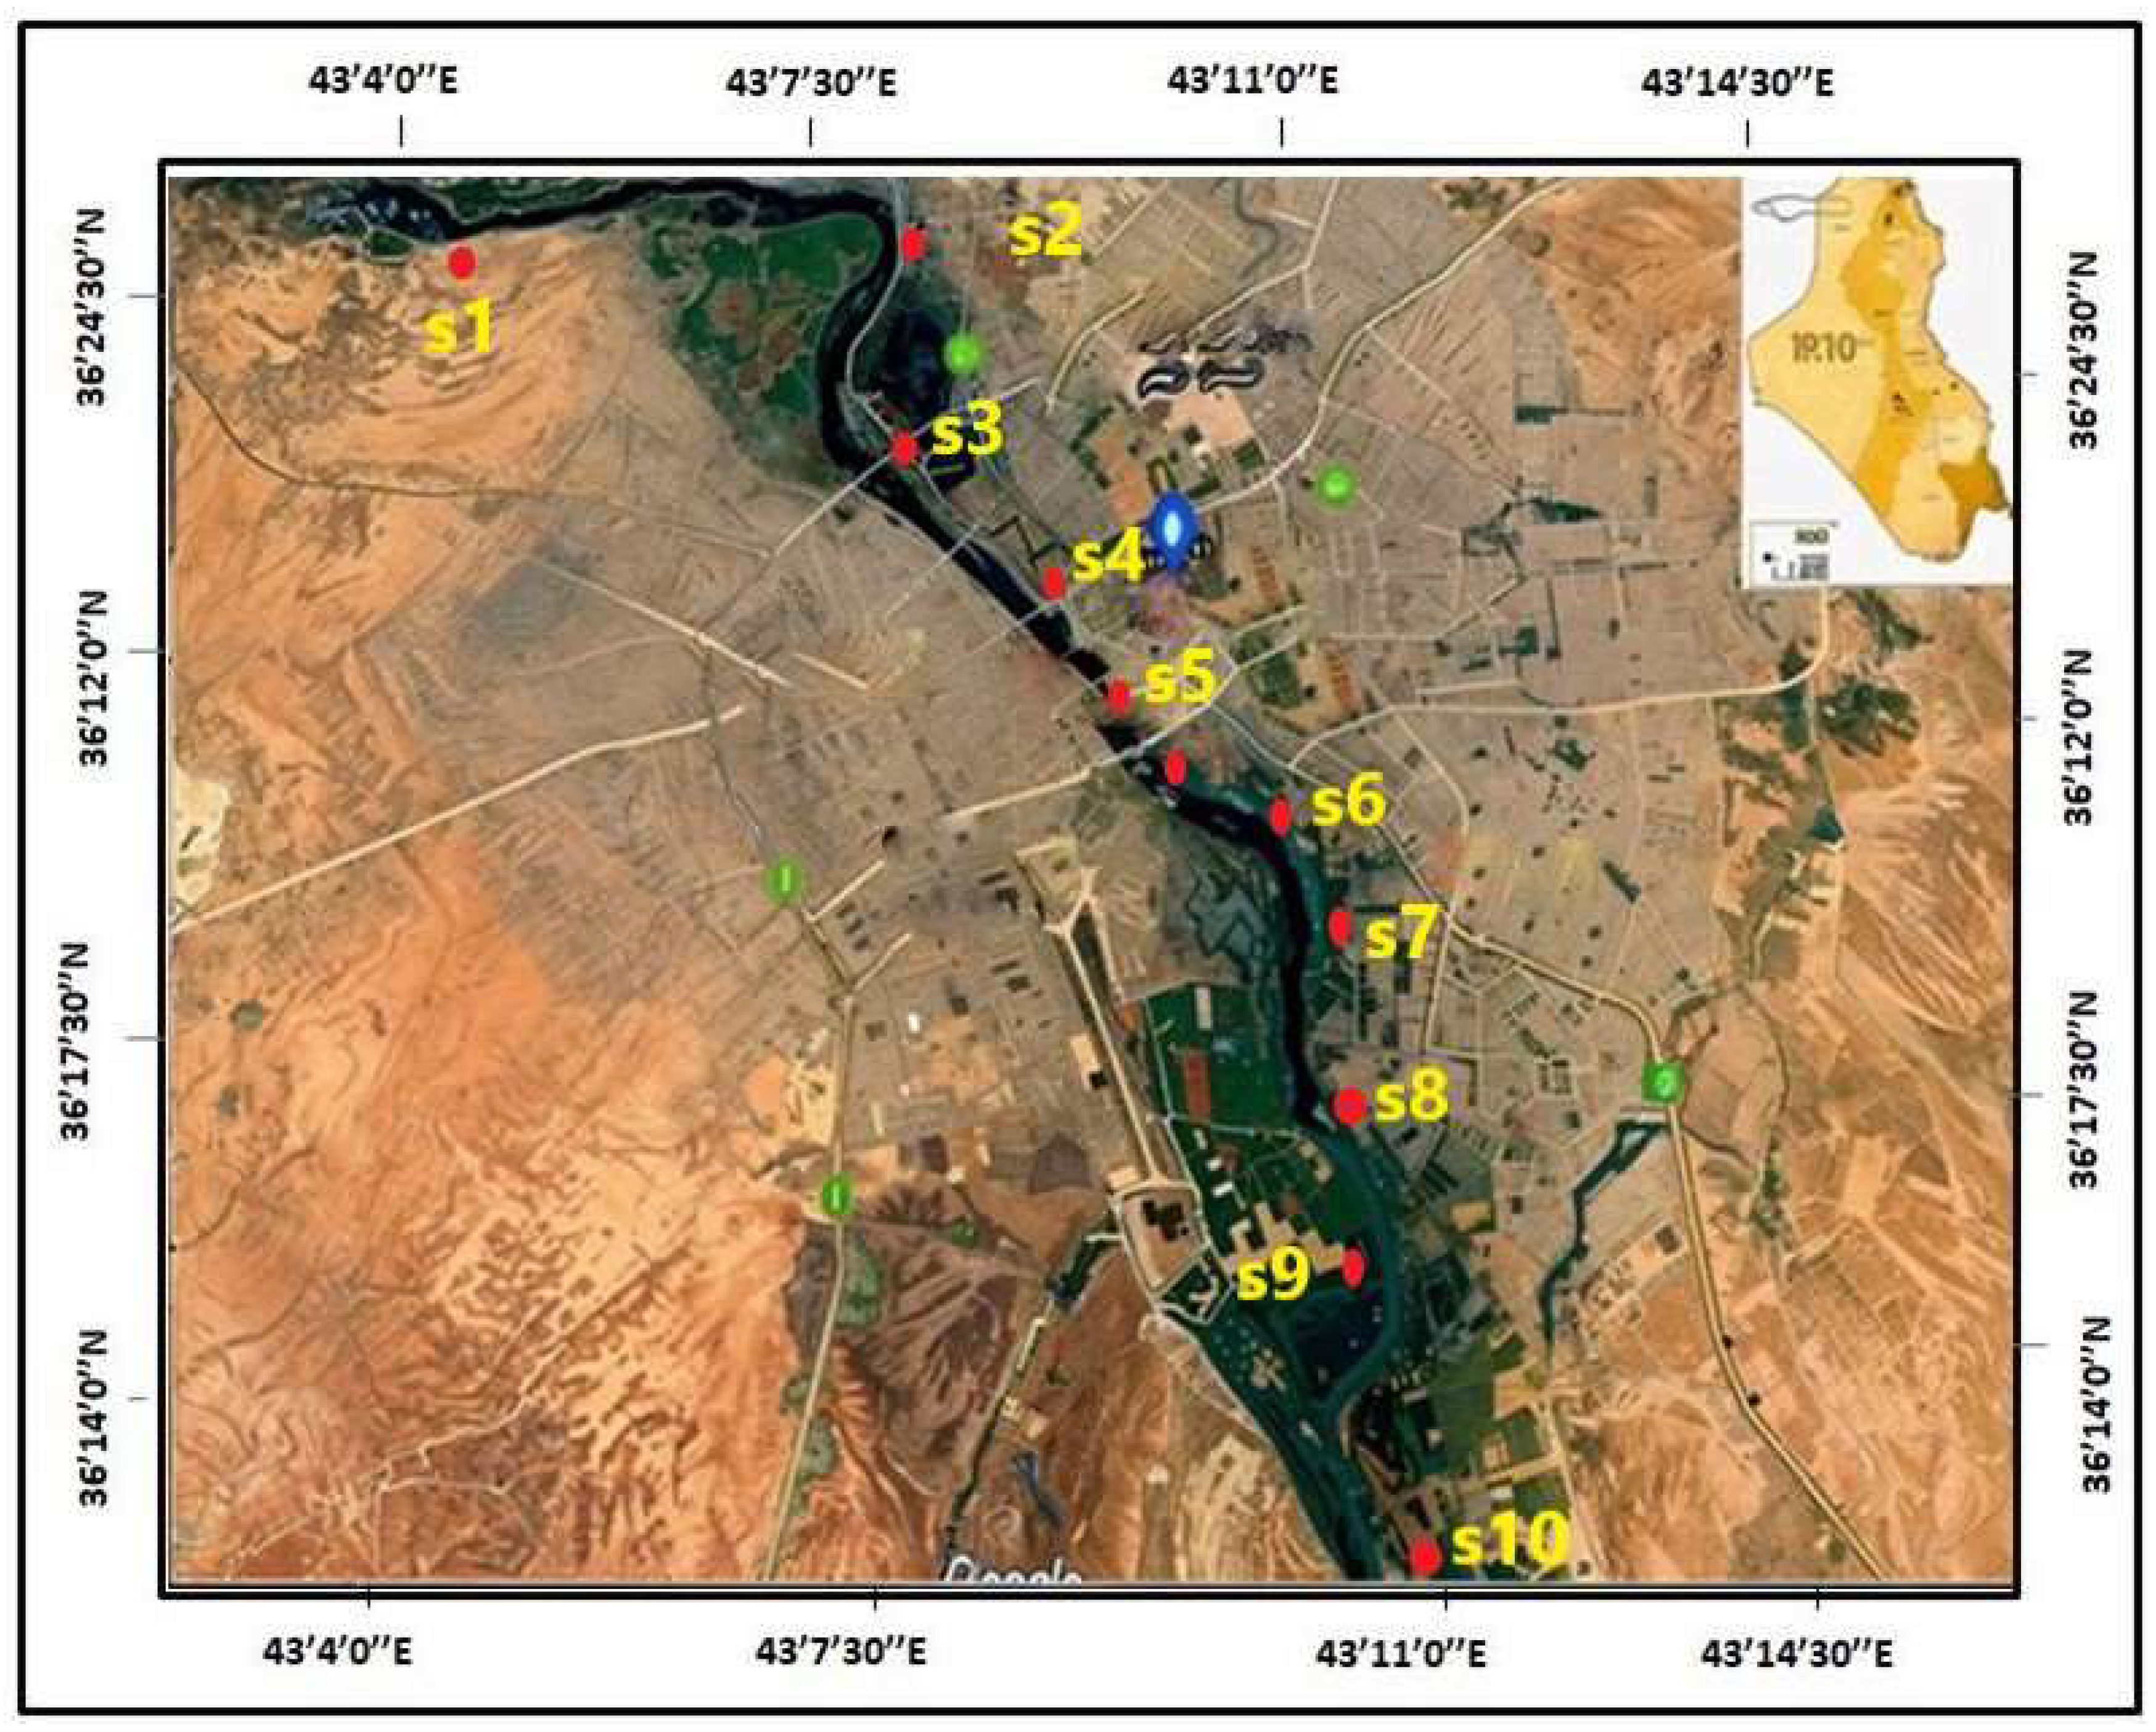
Figure 2.
Inter-series variation of concentration levels of all sites.
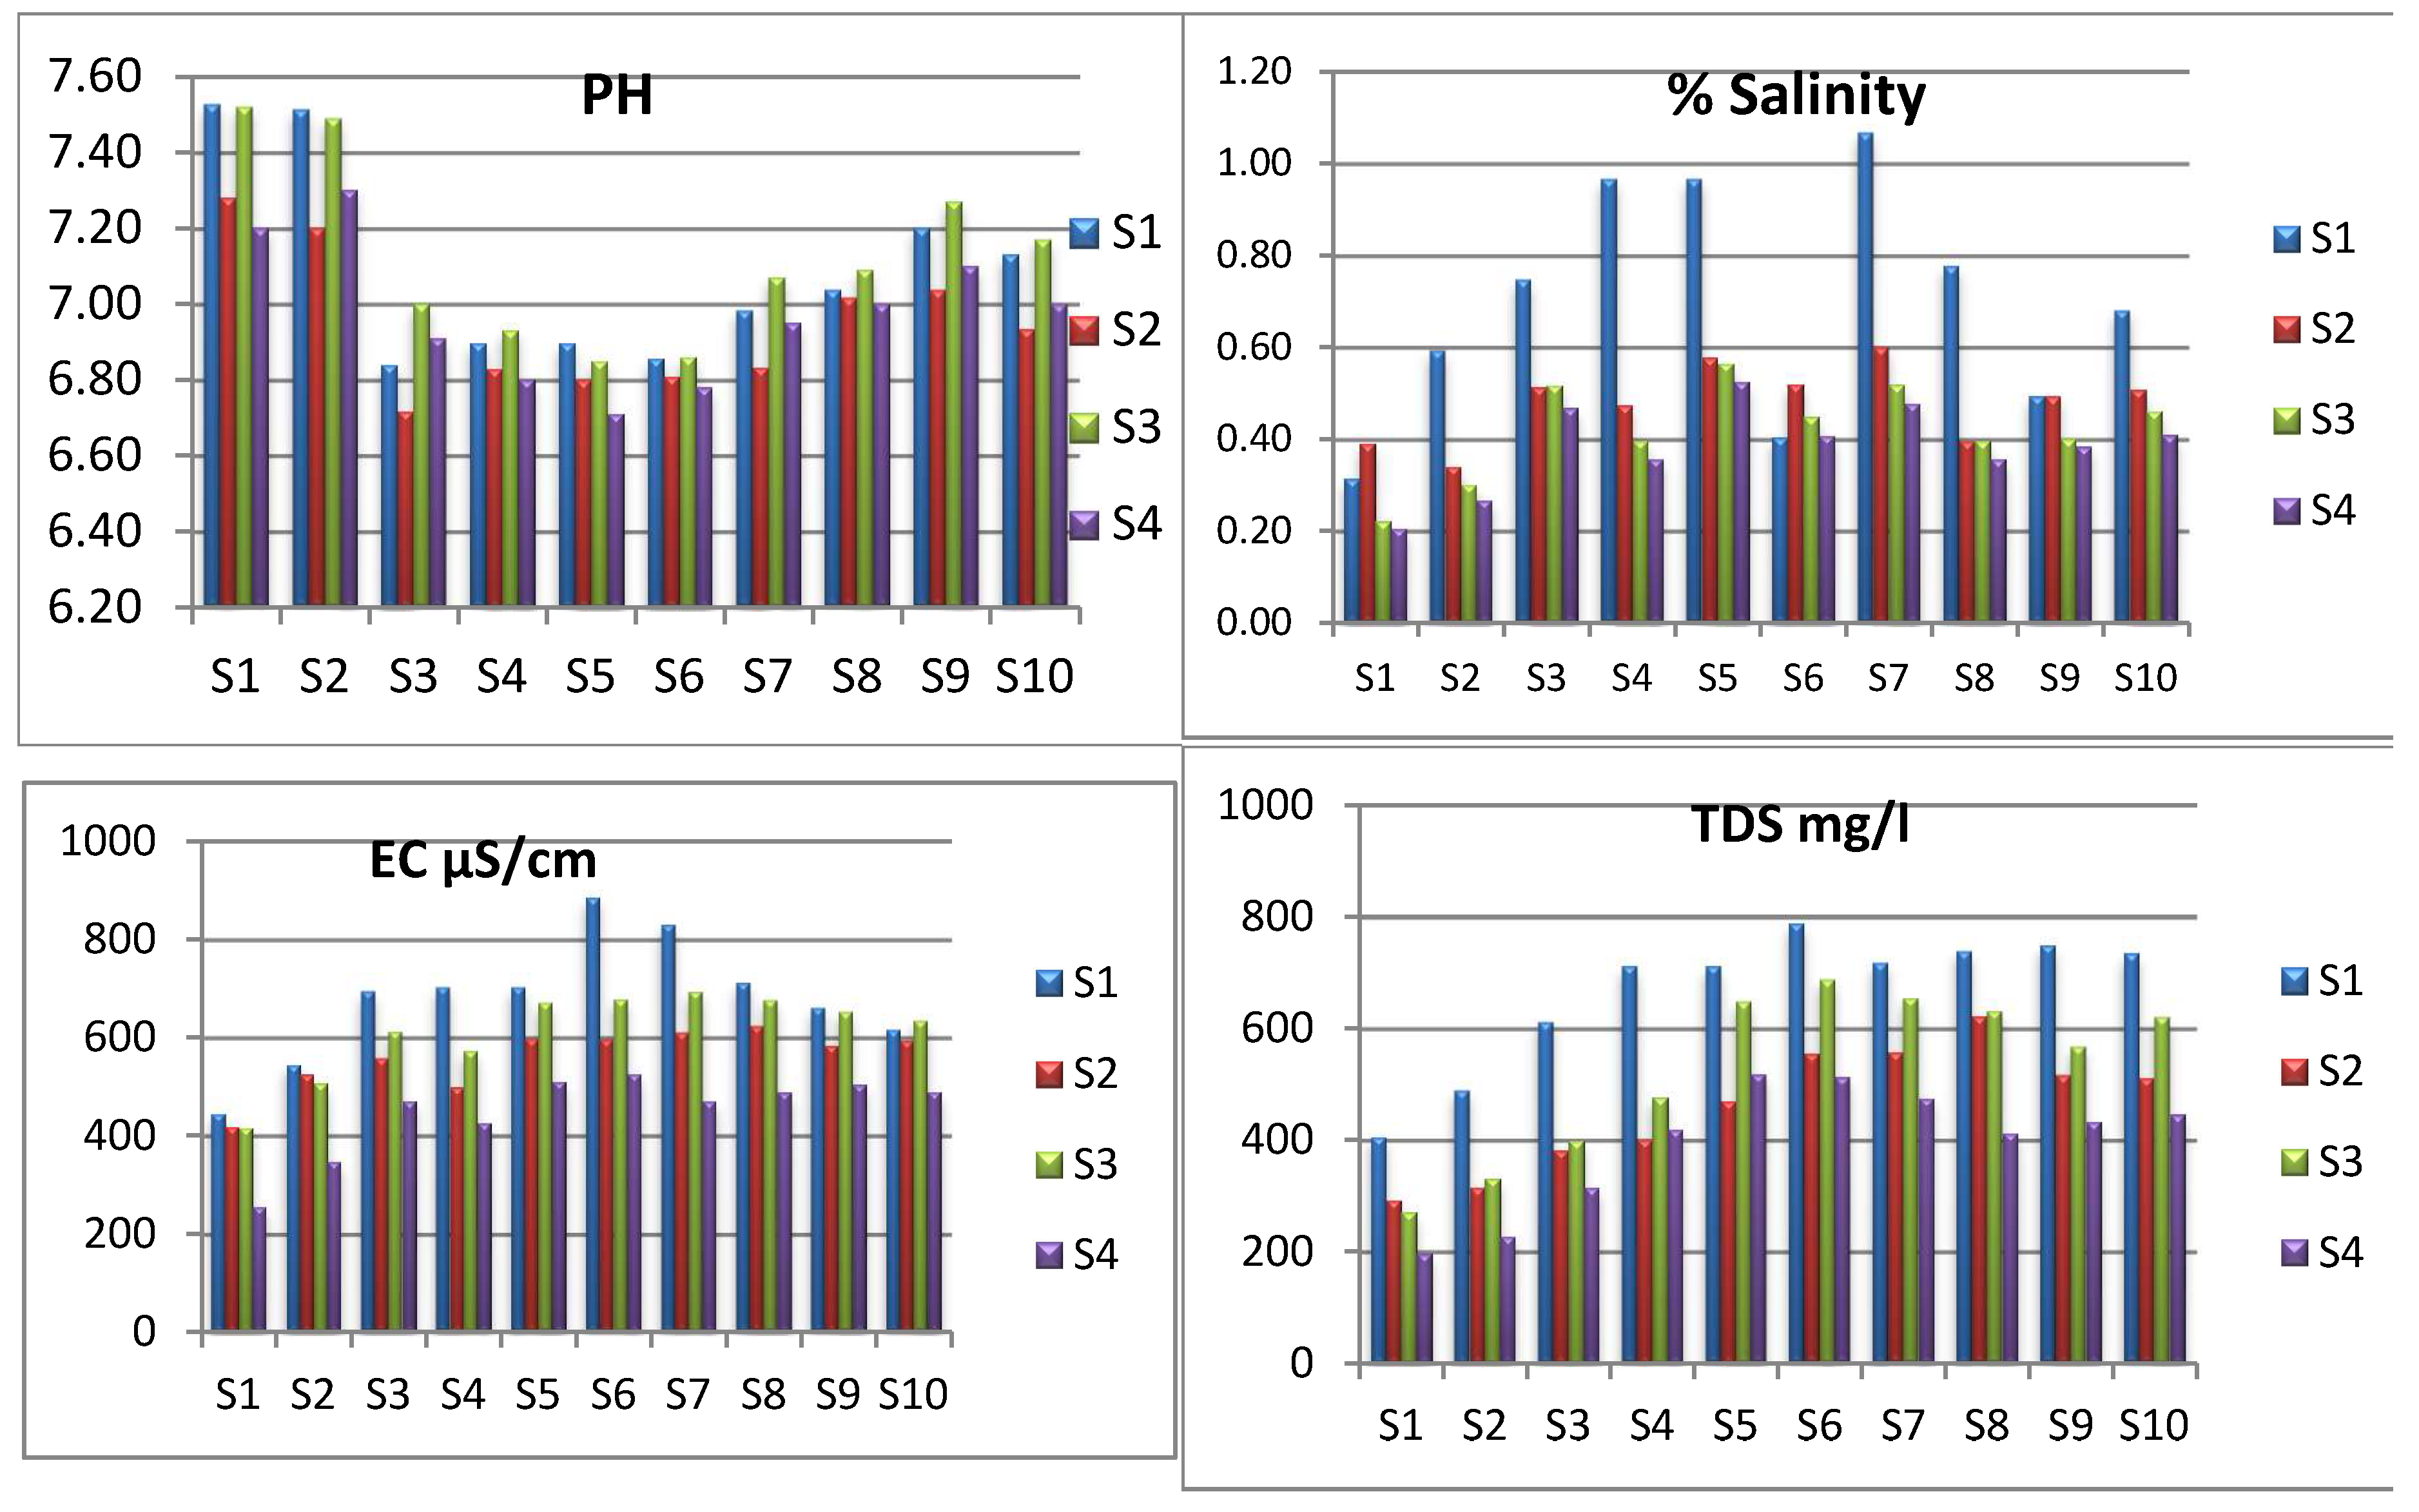
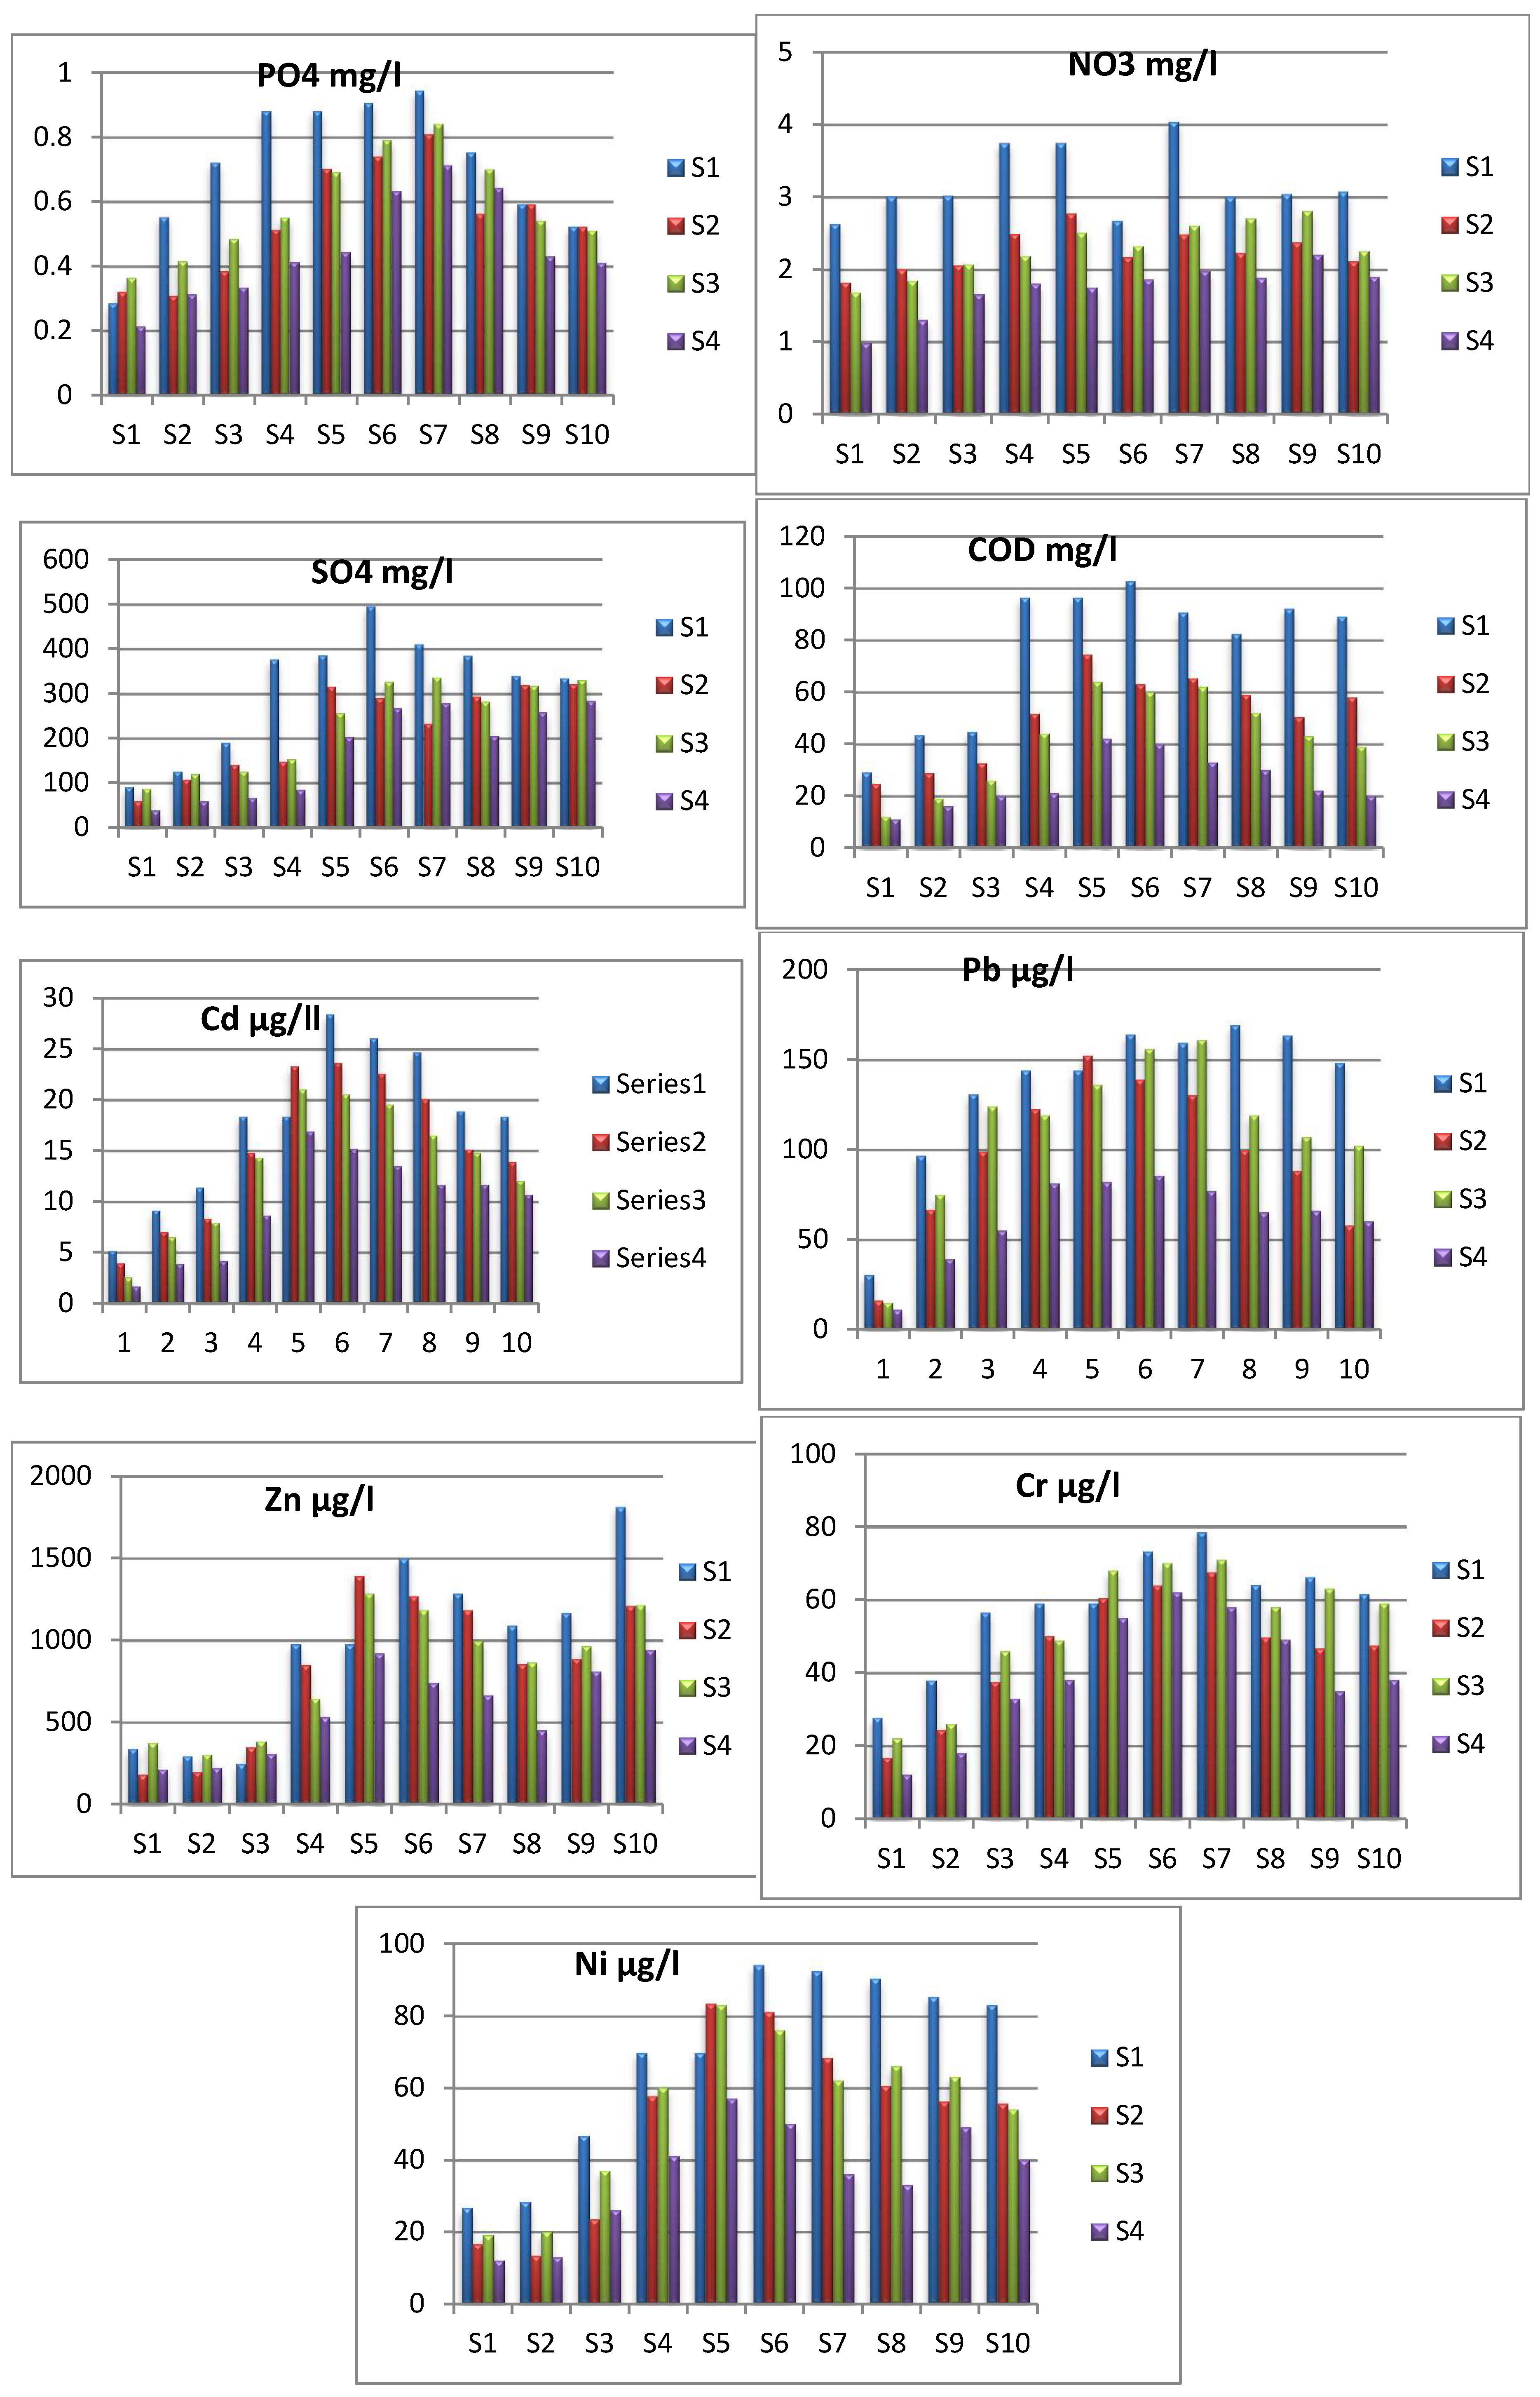

Table 1.
Coordinates and description of all study sites on the Tigris river in Mosul.
| Site No. | Location names | Latitude N |
Longitude E |
Describtion |
|---|---|---|---|---|
| S1 | Al Kuba | 36.398501 | 43.074622 | Residential area |
| S2 | Alrashidia | 36.39606 | 43.114278 | Agricultural area |
| S3 | Third bridge | 36.363435 | 43.114976 | Recreation area |
| S4 | Fifth bridge | 36.35485 | 43.12616 | Recreation area |
| S5 | Old bridge | 36.345667 | 43.136953 | Commercial +residential |
| S6 | Aljumhoria bridge | 36.340904 | 43.145025 | Residential area |
| S7 | Fourth bridge | 36.332283 | 43.152415 | Residential area |
| S8 | Jarimjah | 36.298735 | 43.176358 | Agricultural area |
| S9 | Albosaef | 36.277681 | 43.163921 | Agricultural area |
| S10 | Hammam Al aleel | 36.160292 | 43.263505 | Residential area |
Table 2.
CCME WQI water classification and suitability for use.
| Suitability | class | CCME WQI Value | Water quality description |
| Excellent | 1 | 95-100 |
water quality is protected with a virtual absence of threat or impairment, conditions very close to natural or pristine levels. |
| Good | 2 | 94-80 |
water quality is protected with only a minor degree of threat or impairment; conditions rarely depart from natural or desirable levels. |
| Fair | 3 | 79-65 |
water quality is usually protected, but occasionally threatened or impaired; conditions sometimes depart from natural or desirable levels. |
| Marginal | 4 | 64-50 |
water quality is frequently threatened or impaired; conditions often depart from natural or desirable levels. |
| Poor | 5 | 49-0 |
water quality is almost always threatened or impaired; conditions usually depart from natural or desirable levels. |
Table 3.
Heavy metal pollution index suitability classifications.
| HPI | Classification |
| <25 | Excellent |
| 26-50 | Good |
| 51-75 | Poor |
| 76-100 | Very poor |
| >100 | Unsuitable |
Table 4.
Characteristics of Tigris river water of all sites in 2022’s tests (series1 & 2) with additional standard limits for drinking water (WHO, 2004).
Table 4.
Characteristics of Tigris river water of all sites in 2022’s tests (series1 & 2) with additional standard limits for drinking water (WHO, 2004).
| 2022 | PH | E.c µS/cm | TDS mg/l | Sal. % |
COD mg/l | PO4 mg/l | NO3 mg/l | SO4 mg/l | Cd µg/l |
Pb µg/l |
Zn µg/l |
Cr µg/l |
Ni µg/l |
|
| WHO std. | 6.5-8.5 | 1400 | 1000 | 1% | 100 | 0.4 | 50 | 250 | 5 | 10 | 5000 | 50 | 20 | |
| S1 | Mean | 7.5 | 431.3 | 348.7 | 0.4 | 26.8 | 0.3 | 2.2 | 74.0 | 4.5 | 23.0 | 258.4 | 22.2 | 21.7 |
| ±Sd | 0.69 | 89.9 | 39.9 | 0.34 | 5.96 | 0.114 | 1.06 | 55.11 | 3.82 | 4.98 | 91.78 | 5.78 | 6.58 | |
| S2 | Mean | 7.4 | 534.3 | 402.0 | 0.5 | 36.0 | 0.4 | 2.5 | 115.8 | 8.1 | 81.6 | 159.3 | 31.2 | 20.8 |
| ±Sd | 0.57 | 83.65 | 98.49 | 0.33 | 6.41 | 0.104 | 0.57 | 29.96 | 4.58 | 6.18 | 100.78 | 5.48 | 5.18 | |
| S3 | Mean | 7.0 | 625.8 | 496.5 | 0.6 | 38.7 | 0.6 | 2.5 | 164.8 | 9.8 | 114.6 | 146.5 | 47.0 | 35.0 |
| ±Sd | 0.77 | 107.01 | 73.25 | 0.33 | 6.41 | 0.104 | 0.57 | 29.96 | 4.8 | 6.59 | 137.66 | 5.8 | 5.47 | |
| S4 | Mean | 7.0 | 600.2 | 556.2 | 0.7 | 74.0 | 0.7 | 3.1 | 190.0 | 16.5 | 133.1 | 910.7 | 54.5 | 63.7 |
| ±Sd | 0.79 | 151.88 | 51.88 | 0.32 | 4.62 | 0.074 | 0.44 | 22 | 4.28 | 5.24 | 96.46 | 22.94 | 7.04 | |
| S5 | Mean | 6.9 | 706.3 | 602.2 | 0.6 | 91.0 | 1.0 | 3.1 | 344.7 | 25.0 | 165.1 | 1544.5 | 62.2 | 90.5 |
| ±Sd | 0.9 | 187.9 | 92.97 | 0.4 | 13.88 | 0.104 | 0.57 | 76.13 | 7.51 | 3.36 | 226.79 | 14.33 | 12.02 | |
| S6 | Mean | 6.8 | 740.2 | 670.8 | 0.5 | 82.8 | 0.8 | 2.4 | 336.5 | 26.0 | 151.3 | 1381.6 | 68.5 | 87.5 |
| ±Sd | 0.78 | 173.25 | 20 | 0.33 | 6.41 | 0.104 | 0.57 | 29.96 | 4.55 | 5.68 | 120.26 | 26.54 | 7.8 | |
| S7 | Mean | 7.0 | 719.8 | 637.0 | 0.8 | 78.0 | 0.9 | 3.3 | 277.8 | 24.3 | 144.7 | 1233.7 | 73.1 | 80.3 |
| ±Sd | 0.72 | 124 | 73.25 | 0.33 | 6.41 | 0.104 | 0.57 | 30.28 | 4.73 | 5.78 | 111.68 | 25.06 | 7.74 | |
| S8 | Mean | 7.0 | 667.0 | 679.3 | 0.6 | 70.7 | 0.7 | 2.6 | 313.3 | 22.3 | 134.2 | 970.3 | 56.9 | 75.4 |
| ±Sd | 0.79 | 110.1 | 20.1 | 0.32 | 3.13 | 0.064 | 0.65 | 29.26 | 4.75 | 5.81 | 112.57 | 25.24 | 7.77 | |
| S9 | Mean | 7.1 | 621.8 | 632.3 | 0.5 | 71.2 | 0.6 | 2.7 | 328.8 | 17.0 | 125.8 | 1025.5 | 56.4 | 70.7 |
| ±Sd | 0.69 | 98.16 | 265.58 | 0.34 | 8.94 | 0.144 | 0.76 | 41.54 | 4.61 | 5.59 | 103.67 | 23.44 | 7.39 | |
| S10 | Mean | 7.0 | 604.5 | 680.2 | 0.6 | 73.5 | 0.5 | 2.6 | 327.5 | 16.1 | 102.9 | 1509.9 | 54.5 | 69.3 |
| ±Sd | 0.55 | 10.2 | 10.2 | 0.31 | 1.71 | 0.034 | 0.38 | 16.18 | 4.75 | 5.81 | 122.57 | 25.24 | 7.77 | |
| Zone 1 | Zone 2 | Zone 3 | Zone 4 | |||||||||||
Table 5.
Characteristics of Tigris river water of all sites in 2023’s tests (series3 & 4) with additional standard limits for drinking water (WHO, 2004).
Table 5.
Characteristics of Tigris river water of all sites in 2023’s tests (series3 & 4) with additional standard limits for drinking water (WHO, 2004).
| 2023 | PH | E.c µS/cm | TDS mg/l | Sal. % |
COD mg/l | PO4 mg/l | NO3 mg/l | SO4 mg/l | Cd µg/l |
Pb µg/l |
Zn µg/l |
Cr µg/l |
Ni µg/l |
|
| WHO std. | 6.5-8.5 | 1400 | 1000 | 1% | 100 | 0.4 | 50 | 250 | 5 | 10 | 5000 | 50 | 20 | |
| S1 | Mean | 7.36 | 336 | 233.5 | 0.213 | 11.5 | 0.3 | 1.3 | 62.5 | 2.065 | 12.9 | 292.5 | 17 | 15.5 |
| ±Sd | 0.39 | 89.60 | 39.60 | 0.04 | 5.66 | 0.10 | 0.95 | 52.33 | 1.04 | 2.20 | 89.00 | 3.00 | 3.80 | |
| S2 | Mean | 7.40 | 428 | 279.5 | 0.283 | 17.5 | 0.4 | 1.6 | 88.5 | 5.175 | 56.9 | 262.5 | 22 | 16.5 |
| ±Sd | 0.27 | 83.35 | 98.19 | 0.03 | 6.11 | 0.09 | 0.46 | 27.18 | 1.80 | 3.40 | 98.00 | 2.70 | 2.40 | |
| S3 | Mean | 6.96 | 542 | 357.0 | 0.492 | 23.0 | 0.4 | 1.9 | 95.5 | 6.025 | 89.4 | 344.5 | 39.5 | 31.5 |
| ±Sd | 0.47 | 106.71 | 72.95 | 0.03 | 6.11 | 0.09 | 0.46 | 27.18 | 2.02 | 3.81 | 134.88 | 3.02 | 2.69 | |
| S4 | Mean | 6.87 | 499 | 447.5 | 0.377 | 32.5 | 0.5 | 2.0 | 118.0 | 11.475 | 99.9 | 586.5 | 43.4 | 50.5 |
| ±Sd | 0.49 | 151.58 | 51.58 | 0.02 | 4.32 | 0.06 | 0.33 | 19.22 | 1.50 | 2.46 | 93.68 | 20.16 | 4.26 | |
| S5 | Mean | 6.86 | 590 | 583.0 | 0.545 | 53.0 | 0.6 | 2.1 | 229.0 | 18.925 | 108.9 | 1100.5 | 61.5 | 70 |
| ±Sd | 0.60 | 187.60 | 92.67 | 0.10 | 13.58 | 0.09 | 0.46 | 73.35 | 4.73 | 0.58 | 224.01 | 11.55 | 9.24 | |
| S6 | Mean | 6.82 | 602 | 600.0 | 0.428 | 50.0 | 0.7 | 2.1 | 296.5 | 17.825 | 120.55 | 961.5 | 66 | 63 |
| ±Sd | 0.70 | 172.95 | 19.70 | 0.03 | 6.11 | 0.09 | 0.46 | 27.18 | 1.77 | 2.90 | 117.48 | 23.76 | 5.02 | |
| S7 | Mean | 7.01 | 582 | 564.5 | 0.498 | 47.5 | 0.8 | 2.3 | 307 | 16.475 | 118.9 | 829 | 64.5 | 49 |
| ±Sd | 0.42 | 123.70 | 72.95 | 0.03 | 6.11 | 0.09 | 0.46 | 27.18 | 1.63 | 2.68 | 108.58 | 21.96 | 4.64 | |
| S8 | Mean | 7.05 | 582 | 521.5 | 0.377 | 41.0 | 0.7 | 2.3 | 243.0 | 14.075 | 91.9 | 656.5 | 53.5 | 49.5 |
| ±Sd | 0.49 | 109.80 | 19.80 | 0.02 | 2.83 | 0.05 | 0.54 | 26.16 | 1.65 | 2.71 | 109.47 | 22.14 | 4.67 | |
| S9 | Mean | 7.19 | 578 | 500.0 | 0.392 | 32.5 | 0.5 | 2.5 | 287.5 | 13.2 | 86.4 | 886.5 | 49 | 56 |
| ±Sd | 0.39 | 97.86 | 265.28 | 0.04 | 8.64 | 0.13 | 0.65 | 38.44 | 1.51 | 2.49 | 100.57 | 20.34 | 4.29 | |
| S10 | Mean | 7.09 | 562 | 533.0 | 0.435 | 29.5 | 0.5 | 2.1 | 306.5 | 11.325 | 66.3 | 1076.5 | 48.5 | 47 |
| ±Sd | 0.25 | 9.90 | 9.90 | 0.01 | 1.41 | 0.02 | 0.27 | 13.08 | 1.65 | 2.71 | 119.47 | 22.14 | 4.67 | |
| Zone 1 | Zone 2 | Zone 3 | Zone 4 | |||||||||||
Table 6.
Comparative T test values of all parameters for series1 vs. series2 (2022) and series3 vs. series4, (2023) to indicate seasonal variation.
Table 6.
Comparative T test values of all parameters for series1 vs. series2 (2022) and series3 vs. series4, (2023) to indicate seasonal variation.
| T test between S1(wet) & S2(dry) 2022 | T test between S3(wet) & S4(dry) 2023 | |||||||
| Parameters | T-test | *DF | P | **Status p<0.05 | T-test | *DF | **P | Status p<0.05 |
| pH | 1.745881 | 18 | 0.048938 | 1 | 1.447636 | 0.082456 | 18 | 0 |
| EC | 2.648184 | 18 | 0.008176 | 1 | 4.165857 | 0.00029 | 18 | 1 |
| TDS | 3.868649 | 18 | 0.000563 | 1 | 2.244035 | 0.018822 | 18 | 1 |
| Salinity% | 2.669917 | 18 | 0.007808 | 1 | 2.244035 | 0.018822 | 18 | 1 |
| COD | 2.586038 | 18 | 0.009319 | 1 | 2.502734 | 0.011091 | 18 | 1 |
| 1.826824 | 18 | 0.042179 | 1 | 1.878644 | 0.038294 | 18 | 1 | |
| 5.394127 | 18 | 1.99E-05 | 1 | 3.51537 | 0.001235 | 18 | 1 | |
| 1.813528 | 18 | 0.021327 | 1 | 1.312887 | 0.102857 | 18 | 0 | |
| Cd | 1.798236 | 18 | 0.021757 | 1 | 1.474367 | 0.078829 | 18 | 1 |
| Pb | 2.008098 | 18 | 0.029941 | 1 | 2.944581 | 0.004334 | 18 | 1 |
| Zn | 1.668797 | 18 | 0.025606 | 1 | 1.643754 | 0.05879 | 18 | 1 |
| Cr | 1.6898 | 18 | 0.054156 | 1 | 3.256256 | 0.002192 | 18 | 1 |
| Ni | 1.484068 | 18 | 0.077546 | 1 | 2.173495 | 0.021667 | 18 | 1 |
*DF: degree of freedom ,** p < 0.05: significant, p > 0.05: non-significant; 0 = not significant, 1 = significant.
Table 7.
T test values of annual variation of all parameters between series 1 & series2 vs. series3 & series4.
Table 7.
T test values of annual variation of all parameters between series 1 & series2 vs. series3 & series4.
| Parameters | T | P | *DF | **Status value(P<0.05) |
| pH | -0.71769 | 0.238669 | 38 | 0 |
| E.C | 2.425631 | 0.01007 | 38 | 1 |
| TDS | 2.137765 | 0.019515 | 38 | 1 |
| Salinity % | 3.525425 | 0.000561 | 38 | 1 |
| COD | 4.382003 | 4.48E-05 | 38 | 1 |
| 1.723515 | 0.046462 | 38 | 1 | |
| 4.139127 | 9.32E-05 | 38 | 1 | |
| 1.783523 | 0.41245 | 38 | 0 | |
| Cd | 2.3375 | 0.01239 | 38 | 1 |
| Pb | 2.235142 | 0.015682 | 38 | 1 |
| Zn | 1.420289 | 0.081838 | 38 | 1 |
| Cr | 1.858237 | 0.035448 | 38 | 1 |
| Ni | 2.035252 | 0.024422 | 38 | 1 |
*DF: degree of freedom ,** p < 0.05: significant, p > 0.05: non-significant; 0 = not significant, 1 = significant,.
Table 8.
Comparison of heavy metal concentration of the Tigris River in µg/L with previous years. 2013 data taken from )Al-Sarraj et al., 2019(.
Table 8.
Comparison of heavy metal concentration of the Tigris River in µg/L with previous years. 2013 data taken from )Al-Sarraj et al., 2019(.
| Zone | Element | 2013 | 2022 | 2023 | Factor1 | Factor 2 |
| Zone 1 | Cd | 1 | 4.0 | 2.065 | 4.00 | 2.07 |
| Pb | 4 | 19.0 | 12.9 | 4.75 | 3.23 | |
| Zn | 469 | 258.4 | 292.5 | -1.45 | -1.38 | |
| Cr | ND | 22.2 | 17 | ND | ND | |
| Ni | ND | 21.7 | 15.5 | ND | ND | |
| Zone 3 | Cd | 4 | 25.0 | 17.7 | 6.25 | 4.44 |
| Pb | 27 | 165.1 | 116.1 | 6.14 | 4.32 | |
| Zn | 1339 | 1544.5 | 963.6 | 1.15 | -1.28 | |
| Cr | ND | 62.2 | 64 | ND | ND | |
| Ni | ND | 90.5 | 60.6 | ND | ND | |
| Zone 4 | Cd | 5 | 18.5 | 12.87 | 3.69 | 2.57 |
| Pb | 32.5 | 102.9 | 86.43 | 3.17 | 2.66 | |
| Zn | 1961 | 1509.9 | 873.17 | -1.23 | -1.55 | |
| Cr | ND | 54.5 | 50.33 | ND | ND | |
| Ni | ND | 69.3 | 50.83 | ND | ND |
Table 9.
CCME WQI classification and suitability of all sites for drinking (WHO, 2004).
| 2022 | 2023 | ||||||
| sites | value | class | suitability | sites | value | class | suitability |
| S1 | 83.97 | 4 | Good | S1 | 90.06 | 4 | Good |
| S2 | 74.40 | 3 | Fair | S2 | 82.65 | 4 | Good |
| S3 | 71.53 | 3 | Fair | S3 | 77.79 | 3 | Fair |
| S4 | 66.95 | 3 | Fair | S4 | 70.12 | 3 | Fair |
| S5 | 62.27 | 3 | Marginal | S5 | 65.31 | 3 | Fair |
| S6 | 61.60 | 2 | Marginal | S6 | 63.85 | 2 | Marginal |
| S7 | 62.27 | 3 | Marginal | S7 | 68.59 | 3 | Fair |
| S8 | 67.89 | 3 | Fair | S8 | 71.56 | 3 | Fair |
| S9 | 68.56 | 3 | Fair | S9 | 71.02 | 3 | Fair |
| S10 | 68.93 | 3 | Fair | S10 | 71.56 | 3 | Fair |
| Mean | 68.83 | 3 | Fair | Mean | 73.25 | 3 | Fair |
Table 10.
CCME WQI values, classification and suitability of Tigris river during the present study and previous study(Al-Ahmady et al. ,2020).
Table 10.
CCME WQI values, classification and suitability of Tigris river during the present study and previous study(Al-Ahmady et al. ,2020).
| Year | values | class | suitability |
| 2009 | 82.848 | 4 | Good |
| 2010 | 88.65 | 4 | Good |
| 2011 | 90.045 | 4 | Good |
| 2012 | 89.852 | 4 | Good |
| 2013 | 80.448 | 4 | Good |
| 2014 | 85.885 | 4 | Good |
| 2022 | 68.83639 | 3 | Fair |
| 2023 | 73.25168 | 3 | Fair |
Table 11.
Average values of dissolved heavy metals in (µg/l) in all sites in 2022.
| sites | Cd | Pb | Zn | Cr | Ni |
| S1 | 1.4 | 3.9 | 41.5 | 9.3 | 6.9 |
| S2 | 2.6 | 9.0 | 41.7 | 13.1 | 6.7 |
| S3 | 3.1 | 12.6 | 38.4 | 19.7 | 11.2 |
| S4 | 5.3 | 14.6 | 238.6 | 22.9 | 19.7 |
| S5 | 8.0 | 18.2 | 404.7 | 26.1 | 28.1 |
| S6 | 8.3 | 16.6 | 362.0 | 28.8 | 27.1 |
| S7 | 7.8 | 15.9 | 323.2 | 30.7 | 24.9 |
| S8 | 7.1 | 14.8 | 254.2 | 23.9 | 23.4 |
| S9 | 5.4 | 13.8 | 268.7 | 23.7 | 21.9 |
| S10 | 5.1 | 11.3 | 395.6 | 22.9 | 21.5 |
Table 12.
Average values of dissolved heavy metals in (µg/l) in all sites 2023.
| sites | Cd | Pb | Zn | Cr | Ni |
| S1 | 0.7 | 2.2 | 76.6 | 7.1 | 5.0 |
| S2 | 1.7 | 6.3 | 68.8 | 9.2 | 5.3 |
| S3 | 1.9 | 9.8 | 90.3 | 16.6 | 10.1 |
| S4 | 3.7 | 11.0 | 153.7 | 18.2 | 15.7 |
| S5 | 6.1 | 12.0 | 288.3 | 25.8 | 21.7 |
| S6 | 5.7 | 13.3 | 251.9 | 27.7 | 19.5 |
| S7 | 5.3 | 13.1 | 217.2 | 27.1 | 15.2 |
| S8 | 5.0 | 10.0 | 172.0 | 22.5 | 15.3 |
| S9 | 5.0 | 9.2 | 295.3 | 21.2 | 19.2 |
| S10 | 5.2 | 8.2 | 382.0 | 22.1 | 18.4 |
Table 13.
HPI classification suitability of all sites for drinking (WHO, 2004).
| 2022 | 2023 | ||||
| sites | HPI | Classification | sites | HPI | Classification |
| S1 | 38 | good | S1 | 33 | good |
| S2 | 42 | good | S2 | 37 | good |
| S3 | 48 | good | S3 | 44 | good |
| S4 | 117 | unsuitable | S4 | 87 | very poor |
| S5 | 206 | unsuitable | S5 | 132 | unsuitable |
| S6 | 210 | unsuitable | S6 | 125 | unsuitable |
| S7 | 192 | unsuitable | S7 | 110 | unsuitable |
| S8 | 130 | unsuitable | S8 | 107 | unsuitable |
| S9 | 120 | unsuitable | S9 | 95 | unsuitable |
| S10 | 106 | unsuitable | S10 | 96 | unsuitable |
Table 14.
HPI values of each element at all sites in 2022.
| S1 | S2 | S3 | S4 | S5 | S6 | S7 | S8 | S9 | S10 | |
| Cd | 41.97 | 21.40 | 39.43 | 61.98 | 134.70 | 143.56 | 128.72 | 112.05 | 65.62 | 58.05 |
| Pb | 10.58 | 24.24 | 34.06 | 39.54 | 49.047 | 44.95 | 43.00 | 39.88 | 37.38 | 30.57 |
| Zn | 0.08 | 0.08 | 0.080 | 0.07 | 0.070 | 0.071 | 0.07 | 0.07 | 0.07 | 0.07 |
| Cr | 1.01 | 1.42 | 2.130 | 2.47 | 2.824 | 3.110 | 3.32 | 2.58 | 2.56 | 2.47 |
| Ni | 4.68 | 4.50 | 7.563 | 13.33 | 18.94 | 18.324 | 16.82 | 15.78 | 14.80 | 14.51 |
Table 15.
HPI values of each elements at all sites in 2023.
| S1 | S2 | S3 | S4 | S5 | S6 | S7 | S8 | S9 | S10 | |
| Cd | 33.19 | 16.30 | 28.96 | 48.15 | 82.55 | 73.04 | 61.37 | 67.64 | 55.11 | 49.43 |
| Pb | 5.92 | 16.91 | 26.56 | 29.68 | 32.36 | 35.82 | 35.33 | 27.31 | 24.74 | 22.13 |
| Zn | 0.08 | 0.08 | 0.08 | 0.08 | 0.07 | 0.07 | 0.08 | 0.08 | 0.07 | 0.07 |
| Cr | 0.77 | 1.00 | 1.79 | 1.97 | 2.79 | 3.00 | 2.93 | 2.43 | 2.29 | 2.39 |
| Ni | 3.35 | 3.57 | 6.81 | 10.57 | 14.65 | 13.19 | 10.26 | 10.36 | 12.99 | 12.40 |
Disclaimer/Publisher’s Note: The statements, opinions and data contained in all publications are solely those of the individual author(s) and contributor(s) and not of MDPI and/or the editor(s). MDPI and/or the editor(s) disclaim responsibility for any injury to people or property resulting from any ideas, methods, instructions or products referred to in the content. |
© 2025 by the authors. Licensee MDPI, Basel, Switzerland. This article is an open access article distributed under the terms and conditions of the Creative Commons Attribution (CC BY) license (http://creativecommons.org/licenses/by/4.0/).
Copyright: This open access article is published under a Creative Commons CC BY 4.0 license, which permit the free download, distribution, and reuse, provided that the author and preprint are cited in any reuse.


