
Submitted:
24 February 2025
Posted:
25 February 2025
You are already at the latest version
Abstract
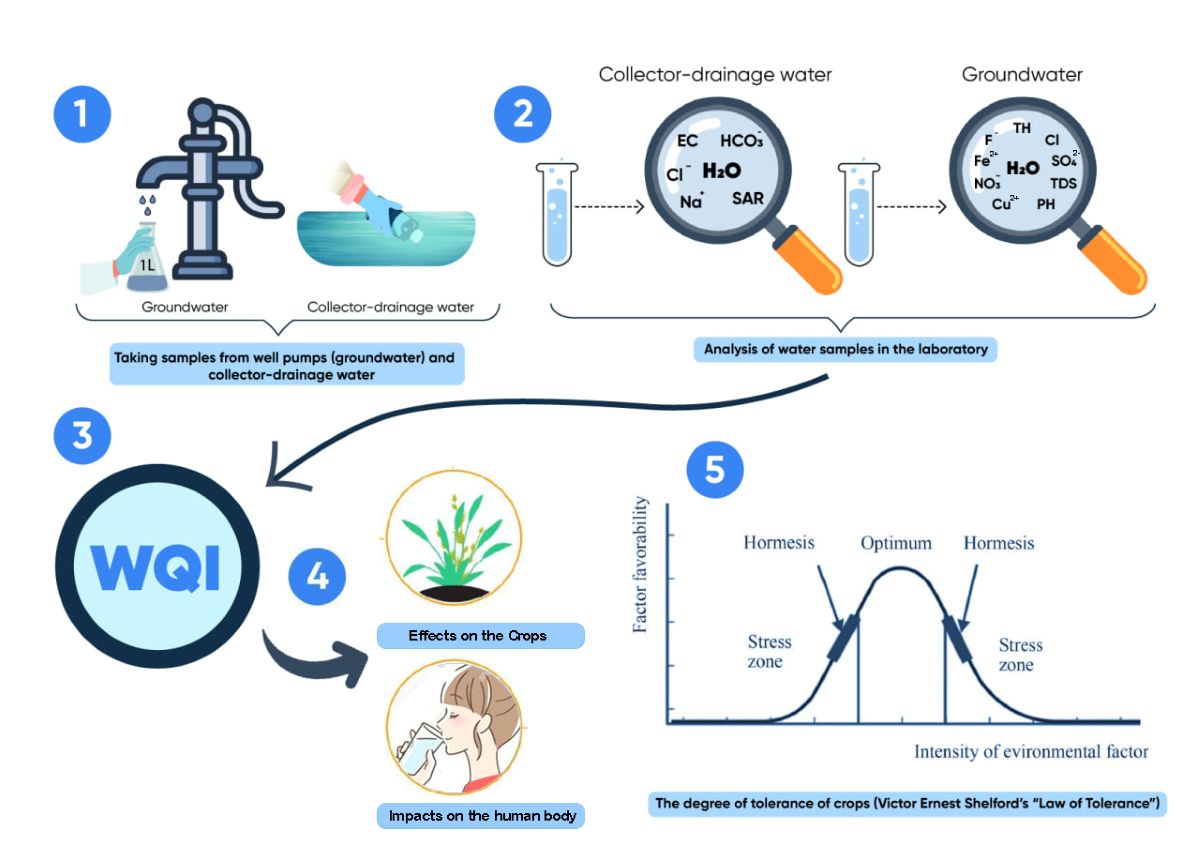
According to Victor Ernest Shelford’s “Law of Tolerance”, organisms within ecosystems thrive optimally when environmental conditions are favorable. Applying this principle to agroecosystems experiencing water scarcity or environmental challenges can enhance their productivity. In such ecosystems, phytocoenoses regulate their optimal conditions by utilizing water of varying concentrations. Additionally, optimal drinking water conditions for human populations within a given ecosystem can be established, mitigating the risks of future negative succession processes.
This study focuses on assessing the quality of two distinct water sources in the Amu Darya district of the Republic of Karakalpakstan, Uzbekistan: collector-drainage water and groundwater at depths ranging between 10 and 20 meters. To evaluate water quality, the Canadian Council of Ministers of the Environment (CCME) Water Quality Index (WQI) was employed, adapted to the specific conditions of Uzbekistan.
The relevance of this research lies in its examination of climate change impacts. Without optimizing the salinity of collector-drainage water, its use may exacerbate soil salinization and lead to a decline in drinking water quality.
The findings, covering the period from 2021 to 2023, reveal that the overall water quality index for collector-drainage water was classified as “Poor” for sensitive crops, primarily due to six indicators failing to meet FAO guidelines, which resulted in an 8.33% increase in salinity by 2023. In contrast, groundwater quality showed a “Fair” rating in 2021, with a slight deterioration observed by 2023.
The study underscores the necessity of utilizing organic fertilizers in agriculture to safeguard drinking water quality, enhance crop yields, and improve soil health, while minimizing the use of chemical inputs. Additionally, adopting WQI models under changing climatic conditions offers potential for improving agricultural productivity, enhancing groundwater quality, and enabling more robust environmental monitoring systems.
Keywords:
Collector-drainage water
; groundwater
; ecological factors
; “Sensitive and insensitive crops”
; CCME WQI model
1. Introduction
The quality of water resources in Central Asian countries is primarily influenced by geological, abiotic factors such as rainfall, and anthropogenic activities, particularly agriculture. In several regions within this vast ecosystem, the scarcity of water resources necessitates continuous monitoring and protection of surface and groundwater. Groundwater, often found at depths of 10-20 meters in arid ecosystems, plays a critical role in supporting the adaptation of living organisms [1,2,3,4,5,6,7,8,11]. Given that Central Asia is predominantly an agricultural region, the rational use and improved condition of water and soil resources demand constant observation. For instance, approximately 70% of irrigated land in Uzbekistan is affected by salinity, which poses a significant challenge for sustainable agricultural practices [18,19,20,21,22,23,24,25,26]. Previous research highlights that soil salinity has escalated, partly due to the use of groundwater for irrigation in agricultural lands [15,17,21,29,33]. In 2008, 17.4% of a total of 743.5 thousand hectares of land, and 27.5% of 1,182.9 thousand hectares in 2010, were affected by high groundwater levels, with the water table rising to within 1-2 meters of the soil surface. This issue is often exacerbated when groundwater seepage occurs near the surface [7,8,9,10,11,12,13,14,15,16,17,18,19,20,21,22,23,24,25,26,27,28,29,30,31,32,33,34].
In 2023, the State Committee for Land Resources, Geodesy, Cartography, and State Cadastres of Uzbekistan reported that 46.6% of irrigated land was saline, with 2.5% classified as strongly saline, 13.3% as moderately saline, and 30% as slightly saline. The salinity and mineral content of the water bodies studied - collector-drainage waters and underground waters at depths of 10-20 meters - are increasing at an alarming rate, primarily due to subsurface seepage and anthropogenic agricultural activities [6,18,19,20,21,22,23,24,25].
The Ministry of Water Management of Uzbekistan (MoWR) also reported that in 2023, the Amudarya district of the Republic of Karakalpakstan had a total of 39,515 hectares of irrigated land, with 70.6% classified as saline. This area included 2.5% highly saline land, 35% moderately saline cropland, and 33.1% slightly saline land [6,18,19,20,21,22,23,24,25]. In this ecosystem, the proximity of groundwater, Quaternary deposits, and agricultural practices are key factors influencing the mineralization of underground drinking water. Significant amounts of salt accumulate in the upper soil layers due to evaporation caused by seepage waters, resulting in severe salinization of soil resources. This process is further aggravated by the crystallization of salts on the soil surface, primarily driven by sodium (Na⁺) ions, which impede water infiltration [10,17,18,19,20,21,22,23,24,25,26,27]. The Quaternary deposits in the Amudarya delta, consisting of sand and soil, allow for easy surface water transfer, further contributing to the salinization problem [19,20,21,22,23,24].
Improper management of open drains in agricultural landscapes can raise groundwater levels, leading to secondary salinization of cultivated areas. Groundwater resources in Uzbekistan have decreased by 40% between 1965 and 2002 due to overuse, and in the arid western and southern regions, groundwater consumption has exceeded sustainable limits. This overexploitation has exacerbated water scarcity in these regions, a problem that persists today [18,19,20,21,22,23,24]. Additionally, the discharge of collector-drainage waters into river ecosystems, combined with the misuse of chemicals in agriculture, has further degraded groundwater quality [13,26]. Consequently, clean underground water used for drinking purposes in regions such as Bukhara, Khorezm, and the Republic of Karakalpakstan no longer meets GOST standards for potable water [15,16,17,18,19,20,21,22,23,24].
According to Victor Ernest Shelford’s law of tolerance, water scarcity and increased salinity can act as limiting factors, adversely affecting the optimal living conditions of organisms. Increased soil salinity severely degrades soil quality and reduces crop productivity. The rise in salinity, particularly during the crop growing season, delays yields and decreases agricultural output [1,2,3,4,19].
Soil salinity has thus emerged as a critical environmental issue in Central Asia. According to the 2015 FAO report, the area of saline soils in Central Asia reached 91.5 million hectares. This problem is particularly prevalent in the southern regions of Central Asia, including Kazakhstan, Uzbekistan, and Turkmenistan, where the drying up of the Aral Sea and unsustainable agricultural water use have exacerbated the salinity of soil resources [1,2,3]. On a global scale, soil salinity has rendered 20% of irrigated land across more than 100 countries unusable, with this figure continuing to rise due to climate change [24].
2. Materials and Methods
2.1. Studying Area
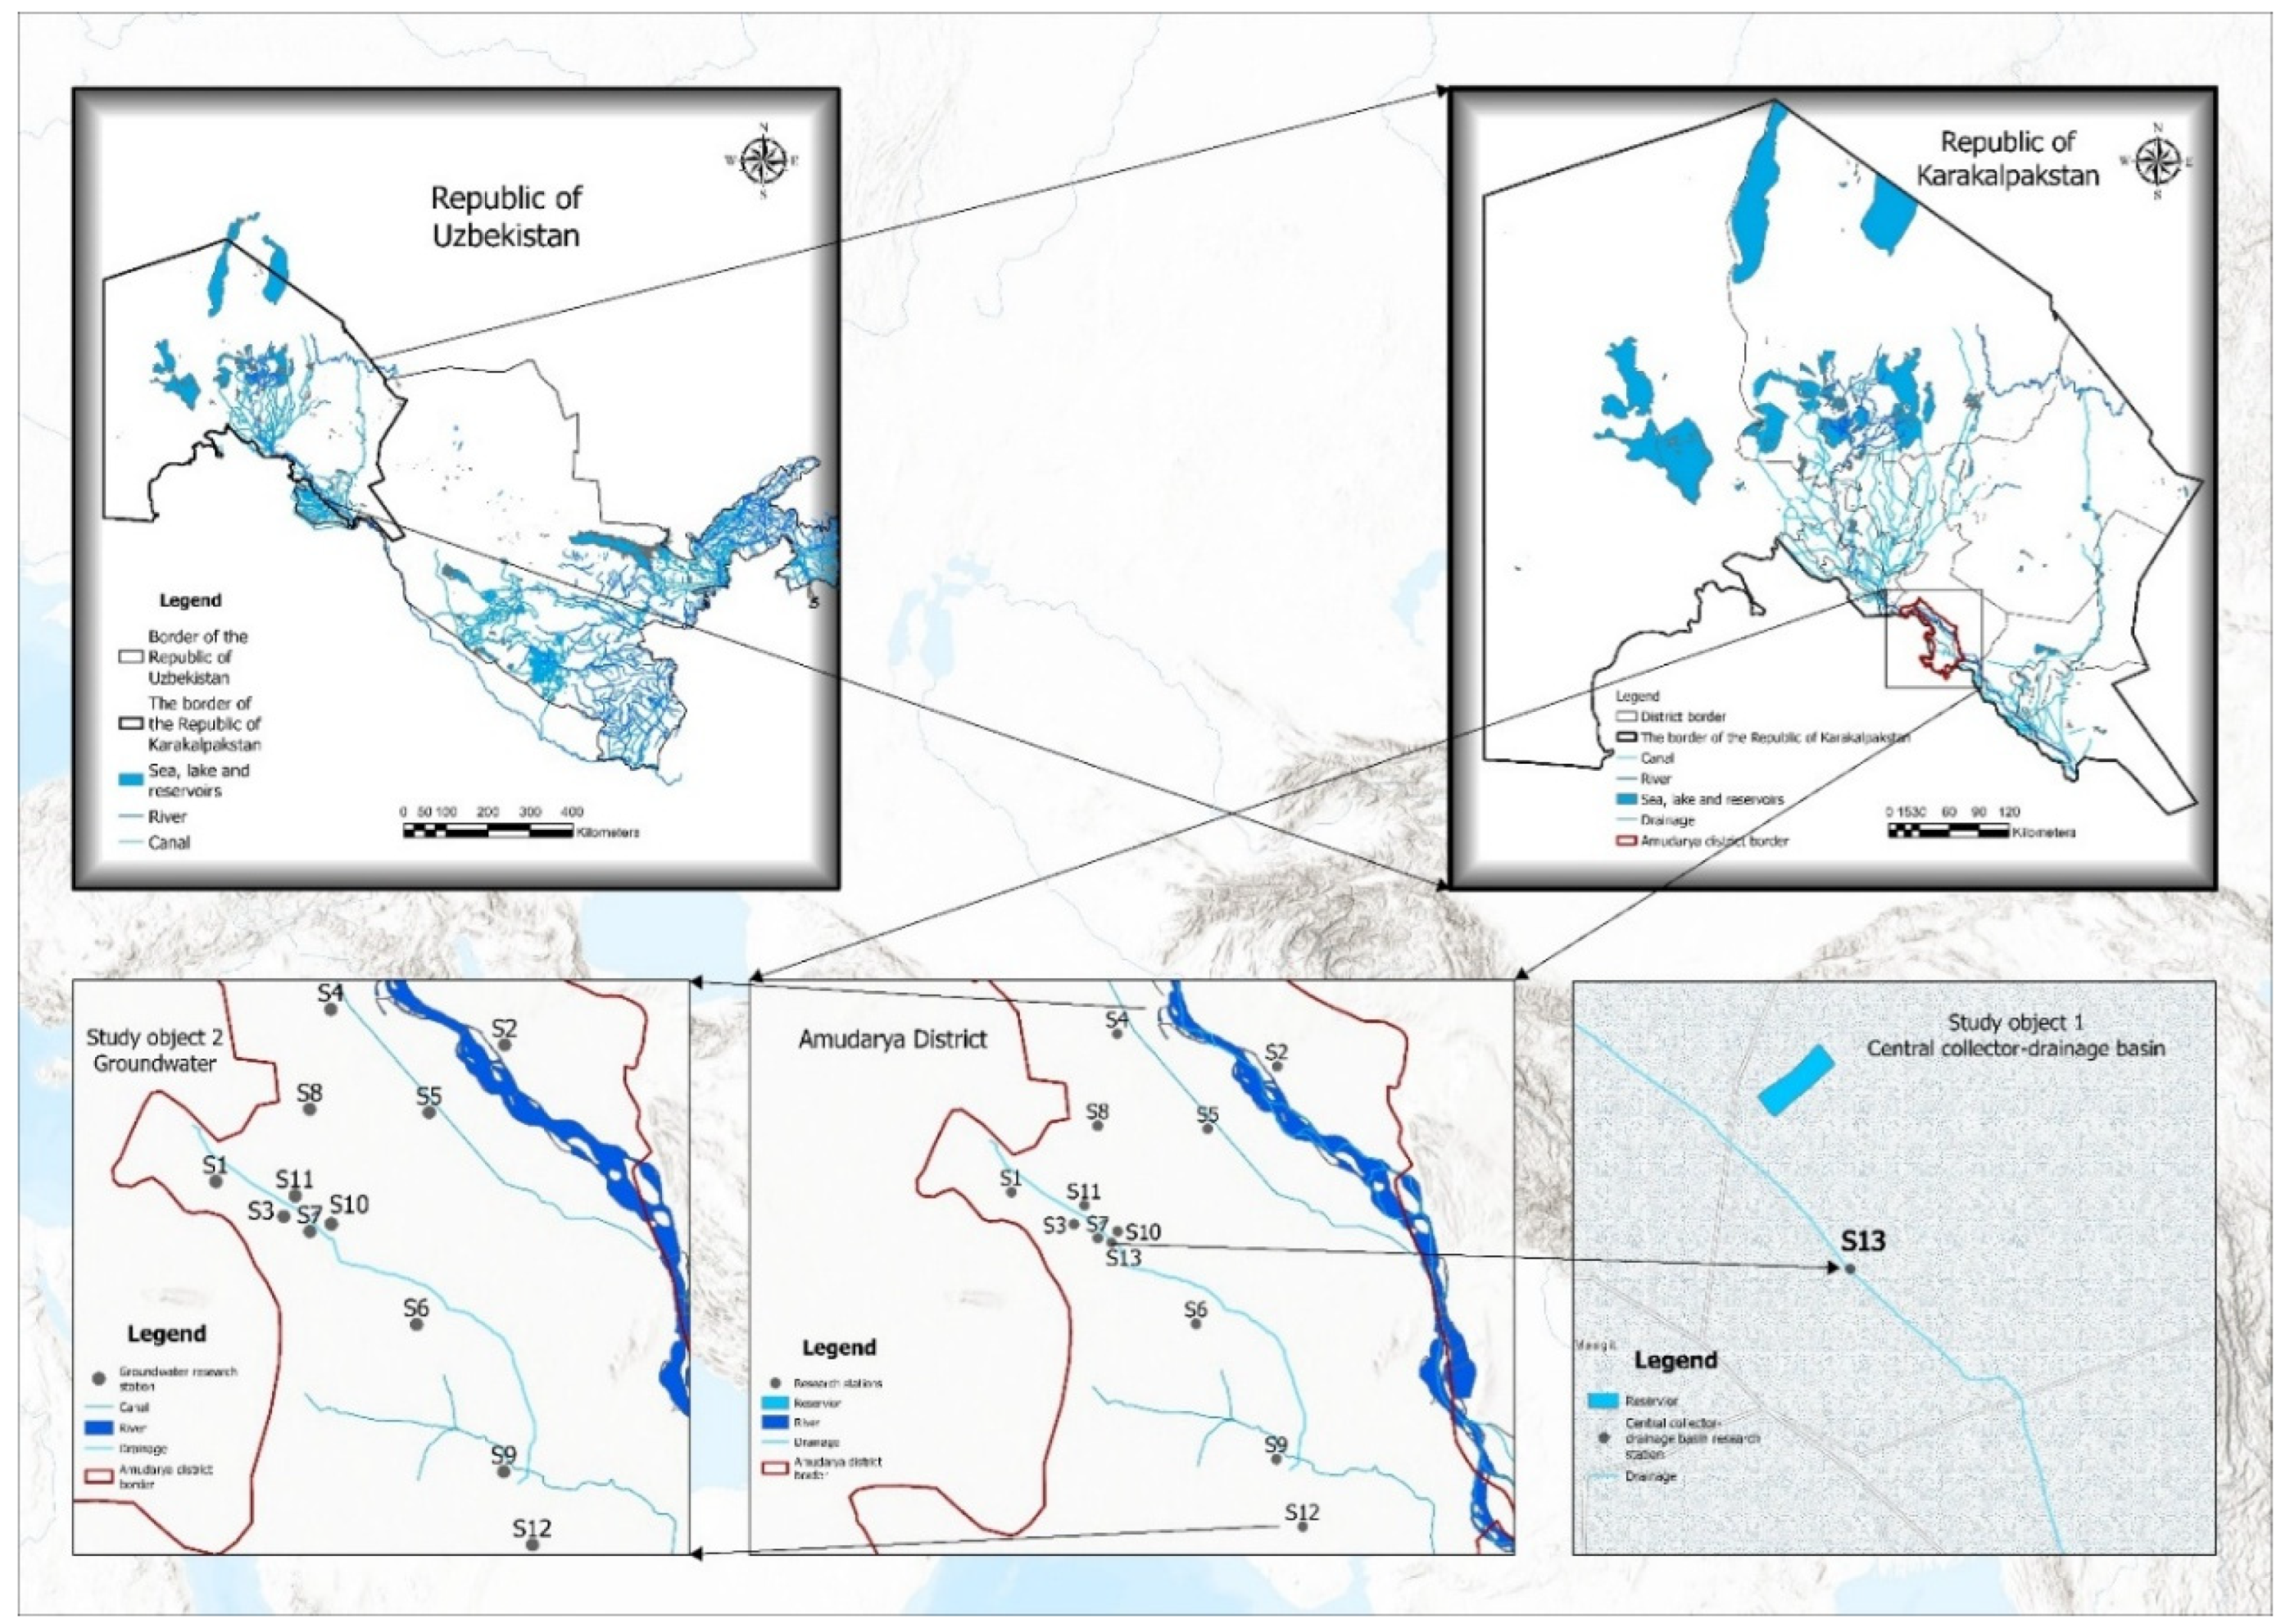
The study focused on collector-drainage waters and underground drinking water affected by salt-washing practices in agricultural fields within the agrocenoses of the Republic of Karakalpakstan. Two primary study sites, referred to as Object 1 and Object 2, were located in the Amudarya region in the southern part of Karakalpakstan. Water samples were taken from the designated central collector drainage pond during the year. Site 2 groundwater sampling 12 locations of the district were marked and water samples were taken. Object 1 demonstrated increased salinity concentrations, particularly during the autumn and winter months, with notable reverse fluctuations in groundwater mineralization during this period. In contrast, the salinity of Object 2 was observed to increase mainly during the phenological phases of agrocenoses.
Given that the region is heavily reliant on cotton and wheat cultivation, there is a continuous need to wash salts that accumulate in the upper soil layers. To analyze the water quality, samples were collected using standard procedures. One-liter glass containers were employed for sampling collector-drainage waters from the identified ponds. For Object 1, specific indicators were assessed, including electrical conductivity EC, НСО3⁻, Cl⁻, SO42⁻, Ca2+, Mg2+, Na⁺, and sodium adsorption ratio (SAR).
Figure 1 below shows a map of the Amudarya district, showing the location of the first and second research sites.
The Amudaryo district is located in the southwestern part of Uzbekistan, covering an area of 1,020 square kilometers. The climate is sharply continental, characterized by significant temperature variations between winter and summer. In January, the average temperature drops to between -16°C and −20°C, while in July, it rises to between 27°C and 32°C. The annual precipitation is very low and averages 100-110 mm. This causes the formation of dry climatic conditions in this
region. Geographically, the district is situated at 39°13′30″ north latitude and 64°41′02″ east longitude1.

Table 1.
Average amounts of Central collector-drainage water in Amudarya district according to nine quality indicators.
Table 1.
Average amounts of Central collector-drainage water in Amudarya district according to nine quality indicators.
| Data | EC | НСО₃⁻ | Cl⁻ | SO₄²⁻ | Ca²⁺ | Mg²⁺ | Na⁺ | SAR | SAR (EC) |
|---|---|---|---|---|---|---|---|---|---|
| 2021-01 | 5.01 | 8.73 | 19.06 | 20.04 | 18.33 | 13 | 16.74 | 4.23 | 4.23 |
| 2021-02 | 5.45 | 6.23 | 16.73 | 29.5 | 17.67 | 16.33 | 18.74 | 4.54 | 4.54 |
| 2021-03 | 5.38 | 6.37 | 21.85 | 24.6 | 15.67 | 18.33 | 19.12 | 4.64 | 4.64 |
| 2021-04 | 4.81 | 4.7 | 18.59 | 23.46 | 16.33 | 9.333 | 21.27 | 5.94 | 5.94 |
| 2021-05 | 4.19 | 5.9 | 14.87 | 19.7 | 15.33 | 12.67 | 12.7 | 3.39 | 3.39 |
| 2021-06 | 8.75 | 4.23 | 32.07 | 48.52 | 14.33 | 14 | 56.74 | 15.08 | 15.07 |
| 2021-07 | 6.49 | 4.4 | 23.24 | 35.42 | 13.67 | 14 | 35.64 | 9.58 | 9.58 |
| 2021-08 | 5.92 | 4.27 | 20.92 | 32.12 | 18 | 11.67 | 27.85 | 7.23 | 7.23 |
| 2021-09 | 4.46 | 3.17 | 16.27 | 23.92 | 11.67 | 12.33 | 19.56 | 5.65 | 5.65 |
| 2021-10 | 6.59 | 6.07 | 22.77 | 35.08 | 14.67 | 13.33 | 36.16 | 9.66 | 9.66 |
| 2021-11 | 5.34 | 5.27 | 20.45 | 25.63 | 17 | 9.333 | 25.19 | 6.94 | 6.94 |
| 2021-12 | 4.46 | 3.17 | 16.27 | 26.38 | 14.67 | 13.33 | 26.38 | 7.05 | 7.05 |
| 2023-01 | 5.073 | 5.1 | 18.13 | 27.78 | 13.67 | 5.58 | 15.36 | 4.95 | 4.95 |
| 2023-02 | 5.568 | 7.07 | 20.92 | 26.92 | 18.33 | 4.75 | 17.89 | 5.27 | 5.27 |
| 2023-03 | 4.859 | 5.27 | 18.13 | 25.35 | 17.67 | 4.58 | 13.05 | 3.91 | 3.91 |
| 2023-04 | 5.807 | 6.1 | 23.7 | 30.36 | 19.33 | 8.33 | 8.021 | 2.16 | 2.16 |
| 2023-05 | 6.693 | 5.67 | 29.75 | 31.91 | 17.33 | 5.75 | 27.37 | 8.06 | 8.06 |
| 2023-06 | 6.078 | 5.37 | 25.1 | 30.66 | 15.67 | 5.33 | 24.48 | 7.55 | 7.55 |
| 2023-07 | 6.536 | 5.07 | 22.77 | 35.97 | 12 | 4.58 | 33.77 | 11.7 | 11.73 |
| 2023-08 | 5.714 | 5.67 | 21.38 | 29.8 | 16 | 4.58 | 22.83 | 7.12 | 7.11 |
| 2023-09 | 5.359 | 4.77 | 20.45 | 28.67 | 20.67 | 4.75 | 14.54 | 4.08 | 4.08 |
| 2023-10 | 5.693 | 5.53 | 23.24 | 29.78 | 19.33 | 7.25 | 10.68 | 2.93 | 2.93 |
| 2023-11 | 5.375 | 8.95 | 30.68 | 40.49 | 31.5 | 6 | 25.04 | 5.78 | 5.78 |
| 2023-12 | 5 | 6.93 | 18.13 | 25.47 | 21.67 | 5.75 | 6.238 | 1.68 | 1.68 |
| Units | dS/m | mEq/l | |||||||
The laboratory analyses were conducted with the assistance of the Karakalpakstan Meliorative Expedition Department, which provided essential support for this research. We extend our sincere appreciation to this department for their invaluable contribution to the successful completion of this study.
2.2. Calculation of SAR
The sodium adsorption ratio (SAR) is a key parameter for evaluating the potential impact of irrigation water on soil structure. High SAR levels lead to increased sodium accumulation in the soil, which adversely affects soil infiltration and percolation, thereby causing soil compaction and reduced aeration, both of which are detrimental to plant health. In addition, electrical conductivity (ECw) and total dissolved solids (TDS) are critical for assessing salt-related risks in water2. While a high ECw can help mitigate the adverse effects of sodium, it simultaneously deteriorates overall water quality [1,2,3].
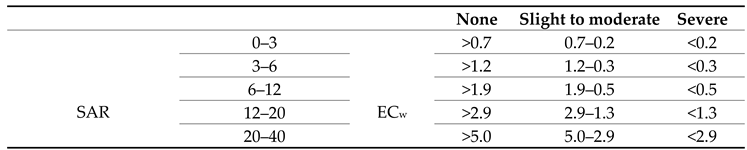
The formula for calculating SAR is based on the ratio of sodium to calcium and magnesium concentrations. Prior to SAR calculation, the masses of Na⁺, Ca⁺², and Mg⁺² ions, originally measured in mg/L, are converted to milliequivalents per liter (mEq/L) for consistency with international standards. This conversion facilitates the accurate analysis of water quality parameters. For example, according to the FAO standards, the limits for SAR in irrigation water-categorized as low, medium, and high for “Sensitive and Insensitive Crops” - are expressed in mEq/L3. The table below outlines the conversions from mg/L to mEq/L for several key parameters [1,2,3,4,5].
This standardized approach ensures that SAR and related parameters are interpreted accurately, contributing to effective management of soil and water resources in agricultural systems.
Table 2.
Atomic and molecular weights of the common cations and anions and their valencies.
| Ion | Atomic Weight (AW) | Valence (V) | Laboratory analysis results (mg/l) |
| НСО3⁻ | 61.02 | 1 | 311.1 |
| Cl⁻ | 35.45 | 1 | 643.5 |
| SO₄²⁻ | 96.06 | 2 | 1333.32 |
| Ca²⁺ | 40.08 | 2 | 273.33 |
| Mg²⁺ | 24.31 | 2 | 268 |
| Na⁺ | 22.99 | 1 | 353.22 |
When converting ion concentrations from mg/L to milliequivalents per liter (mEq/L), the process involves using the atomic masses4 and valence of each ion, as listed in Dmitry Mendeleev’s periodic table. The calculation method entails dividing the ion’s concentration (in mg/L) by its atomic mass and valence, which allows for standardized comparison with laboratory results.
This procedure can be outlined as follows:
1.Determine the atomic mass and valence of each ion based on Mendeleev’s periodic table.
2.Divide the ion concentration (mg/L) by its corresponding atomic mass to obtain the value in equivalents.
3.Adjust for valence by dividing by the ion’s valence to convert the result to mEq/L.
This method ensures accurate comparison with laboratory-derived values and aligns the results with international standards for water quality analysis [1,2,3,4,5].
НСО3⁻ (mEq/L) = (1/61.02) × 311.1 = 5.10
Cl⁻ (mEq/L) = (1/35.45) × 643.5 = 18.15
SO₄²⁻ (mEq/L) = (2/96.06) × 1333.32 = 27.76
Ca²⁺ (mEq/L) = (2/40.08) × 273.33 = 13.64
Mg²⁺ (mEq/L) = (2/24.31) × 268 = 22.05
Na⁺ (mEq/L) = (1/22.99) × 353.22 = 15.36
2.3. Adaptation of the CCME WQI Model to the Food and Agriculture Organization Standard for Crop Irrigation
To draw comprehensive conclusions from complex monthly and annual statistical data on the studied water bodies, “The Water Quality Index of the Canadian Council of Ministers of the Environment (CCME WQI)”5 was adapted to suit the specific environmental and hydrological conditions of Uzbekistan. This model is recognized as an effective tool for assessing water quality67.
The CCME WQI integrates three key components: Scope (F1), Frequency (F2), and Amplitude (F3). These elements are crucial in quantifying the extent of water quality deviations. Specifically, the model allows for the expression of negative water quality changes by evaluating these factors, thereby providing a structured and standardized approach to water quality assessment [27,28].
Calculate the index
Step 1. Calculating the scope value (F1).
Step 2. F2
Step 3.1. F3
Step 3.2.
Step 3.3.
Calculation of total water quality based on F1, F2 and F3
Using The CCME-WQI values, water quality classification is divided into 5 classes as follows8
1. 95-100 (Excellent): Water quality is protected with a virtual absence of threat or impairment; conditions very close to natural or pristine levels.
2. 80-94 (Good): Water quality is protected with only a minor degree of threat or impairment; conditions rarely depart from natural or desirable levels.
3. 65-79 (Fair): Water quality is usually protected but occasionally threatened or impaired; conditions sometimes depart from natural or desirable levels.
4. 45-64 (Marginal): Water quality is frequently threatened or impaired; conditions often depart from natural or desirable levels.
5. 0-44 (Poor): Water quality is almost always threatened or impaired; conditions usually depart from natural or desirable levels.
The Water Quality Index (WQI) for Object 1 was specifically formulated to assess the suitability of water for “sensitive and insensitive crops” cultivated within agricultural systems, while Object 2 was tailored to evaluate water quality for human consumption. This differentiation arises from the declining water levels in the Amu Darya River, which necessitates the utilization of collector-drainage water as a supplementary irrigation source in agriculture.
Utilizing the CCME WQI model to ascertain the overall quality of Object 1 facilitates the application of natural treatment methods, thereby enabling its use as secondary water and aiding in the normalization of salinity concentrations. The categorization established through the CCME WQI provides a framework for determining the feasibility of utilizing these waters for crop irrigation within agrocenoses. Notably, saline water can be effectively employed for irrigating certain crops that are capable of thriving in saline environments. The appropriate management of saline conditions creates optimal growing conditions for salt-tolerant plants, thereby enhancing agricultural productivity in areas developed based on the CCME WQI model [29,30,31,32,33,34].
Table 3.
Assessment of the quality of collector-drainage waters (object 1) formed in Amudarya district according to the guidelines of the World Food and Agriculture Organization (FAO)910.
| Parameter | Units | Degree of restriction on use | ||
| None | Slight to moderate | Severe | ||
| EC | dS/m | <0.7 | 0.7–3.0 | >3.0 |
| НСО₃⁻ | mEq/l | <1.5 | 1.5–8.5 | >8.5 |
| Cl⁻ | mEq/l | <4 | 4–10 | >10 |
| Na⁺ | mEq/l | <3 | 3–9 | >9 |
| SAR | mEq/l | <3 | 3–9 | >9 |
Table 4.
Evaluation of collector-drainage water quality using ECw and SAR (FAO).
3. Results and Discussion
3.1. The Results Obtained from the Calculation of the Reservoir - Drainage Water Using the CCME WQI Model
The annual Water Quality Index (WQI) values for the years 2021 to 2023 were calculated for Object 1, encompassing “Sensitive” and “Insensitive crops”, in accordance with FAO standards. The outcomes of these calculations are summarized in Table 4, where values that fall outside of the FAO guidelines are highlighted in red. The formulation of the CCME WQI model, as described in the methodology section above, was utilized for this analysis. To enhance efficiency in developing the water quality indices and ensure precision in the results, the Excel program was employed for automation of the calculation process. Leveraging the capabilities of this software facilitated the execution of the subsequent computational tasks.
Table 5.
WQI calculation table of nine physico-chemical indicators of “Central” collector-drainage water (study object 1) in The Amudarya district in relation to “sensitive crops”.
Table 5.
WQI calculation table of nine physico-chemical indicators of “Central” collector-drainage water (study object 1) in The Amudarya district in relation to “sensitive crops”.
| Data | EC | НСО₃⁻ | Cl⁻ | Na+ | SAR | SAR (EC) |
| 2021-01 | 5.07 | 5.1 | 18.13 | 15.36 | 4.95 | 4.95 |
| 2021-02 | 5.57 | 7.07 | 20.91 | 17.89 | 5.27 | 5.27 |
| 2021-03 | 4.86 | 5.27 | 18.13 | 13.05 | 3.91 | 3.91 |
| 2021-04 | 5.81 | 6.1 | 23.7 | 8.02 | 2.16 | 2.16 |
| 2021-05 | 6.69 | 5.67 | 29.75 | 27.37 | 8.06 | 8.06 |
| 2021-06 | 6.08 | 5.37 | 25.09 | 24.47 | 7.55 | 7.55 |
| 2021-07 | 6.55 | 5.07 | 22.77 | 33.77 | 11.73 | 11.73 |
| 2021-08 | 5.71 | 5.67 | 21.38 | 22.82 | 7.11 | 7.11 |
| 2021-09 | 5.36 | 4.77 | 20.45 | 14.54 | 4.08 | 4.08 |
| 2021-10 | 5.69 | 5.53 | 23.24 | 10.68 | 2.93 | 2.93 |
| 2021-11 | 5.37 | 8.95 | 30.68 | 25.04 | 5.78 | 5.78 |
| 2021-12 | 5 | 6.93 | 18.13 | 6.24 | 1.68 | 1.68 |
| 2023-01 | 5.01 | 8.73 | 19.06 | 16.74 | 4.23 | 4.23 |
| 2023-02 | 5.45 | 6.23 | 16.73 | 18.74 | 4.54 | 4.54 |
| 2023-03 | 5.38 | 6.37 | 21.84 | 19.12 | 4.64 | 4.64 |
| 2023-04 | 4.81 | 4.7 | 18.59 | 21.27 | 5.94 | 5.94 |
| 2023-05 | 4.19 | 5.9 | 14.87 | 12.69 | 3.39 | 3.39 |
| 2023-06 | 8.75 | 4.23 | 32.07 | 56.74 | 15.07 | 15.07 |
| 2023-07 | 6.49 | 4.4 | 23.24 | 35.64 | 9.58 | 9.58 |
| 2023-08 | 5.92 | 4.27 | 20.91 | 27.85 | 7.23 | 7.23 |
| 2023-09 | 4.46 | 3.17 | 16.27 | 19.57 | 5.65 | 5.65 |
| 2023-10 | 6.59 | 6.07 | 22.77 | 36.16 | 9.66 | 9.66 |
| 2023-11 | 5.34 | 5.27 | 20.45 | 25.19 | 6.94 | 6.94 |
| 2023-12 | 4.46 | 3.17 | 16.27 | 26.38 | 7.05 | 7.05 |
| FAO standard for Sensitive and Insensitive crops | 0.7 | 1.5 | 4 | 3 | 3 | 3 |
| Units | dS/m | mEq/l | ||||
Note: Values of indicators that do not comply with the FAO guidelines are marked in red.
The data presented in Table 4 indicate that, during the year 2021, a total of six indicators failed to comply with the FAO guidelines. Thus, the values can be summarized as follows: X = 6, Y = 6,
Z = 72, E = 66.
Step 1. F1= 100
Step 2. F2= 91.666667
Step 3.1. C = excursioni = 258.6
Step 3.2.
nse = 3.5917
Step 3.3. The value of F3.
| nse value | 0.01 * nse | 0.01 * nse + 0.01 | F3 |
| 3.591666667 | 0.035916667 | 0.045916667 | 78.22141561 |
Table 6.
WQI Calculation Using Common Parameters.
| Component of CCME WQI | Value | Square value |
| F1 | 100 | 10000 |
| F2 | 91.66666667 | 8402.777778 |
| F3 | 78.22141561 | 6118.58986 |
| SUM | 24521.36764 | |
| Suquare Root Value | 156.593 | |
| Divide by 1.732 | 1.732 | |
| D | 90.4116628 | |
| 100 | ||
| CCME WQI (study object 1) | 9.588337204 | |
The calculations of the Water Quality Indices (WQIs) conducted using the Excel program yielded the following findings for the years 2021 to 2023.
Table 7.
The results of CCME WQI model.
| Years | Parametrlar | WQI | Sinflanishi | ||
| F1 | F2 | F3 | |||
| 2021 | 100 | 91.666667 | 78.22141561 | 9.588337204 | Poor |
| 2023 | 100 | 100 | 79.95829284 | 6.200786974 | Poor |
3.2. Analysis of the Results Obtained from CCME WQI Model for the Second Object
Object 2 was evaluated in accordance with the drinking water quality standards outlined in the National Standard of Uzbekistan No. 133:2024. The analysis revealed that the underground drinking water fails to meet both the National Standard and World Health Organization (WHO) guidelines. During the sampling process from the wells associated with Object 2, interviews conducted with local residents indicated a significant reliance on this underground water source for drinking purposes. However, projections suggest that within the next five years, the quality of this water source may deteriorate to an unusable level. Utilizing the CCME WQI model, the groundwater quality index was established based on nine parameters: (Cl-, SO42-, TDS, F-, Fe+2, NO3-, Cu+2 and pH). Table X below presents the analytical results of groundwater samples collected in 2021 and 2023 across these nine indicators.
Table 8.
Calculation of WQI using the average amount of nine quality indicators (object 2).
| Data | Parameters | ||||||||
|---|---|---|---|---|---|---|---|---|---|
| TH | Cl⁻ | SO₄²⁻ | TDS | F⁻ | Fe²⁺ | NO₃⁻ | Cu²⁺ | pH | |
| 2021-01 | 650 | 275 | 271 | 1260 | 0.18 | 0.16 | 9.7 | 0.13 | 7.8 |
| 2021-02 | 1105 | 308 | 364.2 | 1443 | 0.12 | 0.08 | 9.8 | 0.15 | 7.7 |
| 2021-03 | 600 | 221 | 271 | 1200 | 0.16 | 0.18 | 10.2 | 0.2 | 7.7 |
| 2021-04 | 1100 | 380 | 334 | 1700 | 0.15 | 0.17 | 10.7 | 0.14 | 7.7 |
| 2021-05 | 690 | 308.6 | 163.2 | 1280 | 0.19 | 0.13 | 9.9 | 0.18 | 8 |
| 2021-06 | 1500 | 525 | 143.2 | 1900 | 0.18 | 0.22 | 11 | 0.18 | 7.9 |
| 2021-07 | 1450 | 535 | 258 | 1650 | 0.19 | 0.3 | 10.8 | 0.21 | 8.03 |
| 2021-08 | 855 | 357.2 | 143.2 | 1650 | 0.17 | 0.22 | 11.3 | 0.13 | 8.1 |
| 2021-09 | 550 | 218 | 234.7 | 1095 | 0.12 | 0.07 | 9.1 | 0.13 | 7.9 |
| 2021-10 | 645 | 240 | 179 | 1206 | 0.14 | 0.08 | 10.1 | 0.12 | 7.9 |
| 2021-11 | 635 | 273 | 268 | 1190 | 0.08 | 0.13 | 9.4 | 0.07 | 7.9 |
| 2021-12 | 420 | 262 | 220 | 610 | 0.12 | 0.04 | 8.6 | 0.05 | 6.9 |
| 2023-01 | 1130 | 521 | 321.6 | 1530 | 0.19 | 0.18 | 12.4 | 0.24 | 7.9 |
| 2023-02 | 1095 | 350 | 259.2 | 1320 | 0.18 | 0.24 | 8.9 | 0.17 | 7.8 |
| 2023-03 | 1500 | 430.5 | 187.5 | 2740 | 0.16 | 0.13 | 11.1 | 0.17 | 7.8 |
| 2023-04 | 1040 | 304.5 | 240 | 1530 | 0.13 | 0.14 | 9.1 | 0.14 | 7.9 |
| 2023-05 | 1600 | 651 | 196.8 | 2540,0 | 0.17 | 0.1 | 10.8 | 0.24 | 7.8 |
| 2023-06 | 1100 | 420 | 321.6 | 1940 | 0.2 | 0.3 | 12 | 0.26 | 7.9 |
| 2023-07 | 1205 | 350 | 169 | 1690 | 0.13 | 0.08 | 12 | 0.15 | 7.8 |
| 2023-08 | 675 | 232.5 | 168 | 1100 | 0.23 | 0.08 | 8.9 | 0.14 | 7.9 |
| 2023-09 | 1050 | 378.5 | 187.5 | 1712 | 0.13 | 0.09 | 10.3 | 0.13 | 7.8 |
| 2023-10 | 685 | 304.5 | 196.8 | 1520 | 0.12 | 0.18 | 11.5 | 0.14 | 7.8 |
| 2023-11 | 695 | 395.5 | 321.6 | 1100 | 0.22 | 0.22 | 13.7 | 0.2 | 7.9 |
| 2023-12 | 570 | 245 | 196 | 1060 | 0.14 | 0.16 | 9.1 | 0.12 | 7.9 |
| WHO Standard | 300 | 250 | 250 | 1000 | 1.5 | 0.3 | 50 | 2 | 8.5 |
| Units | mg/l | pH | |||||||
| UzSSt: 133:2024 | 10 * 50 = 500 | 350 | 500 | 1500 | 0.7 | 0.3 | 45 | 1 | 9 |
| Units | mg-eq/l | mg/l | pH | ||||||
Note: Amounts that do not meet the National Standard of Uzbekistan are painted in red.
In 2021, a total of three indicators associated with Object 2 were found to be non-compliant with the national standard. Therefore, the values are defined as follows: X = 3, Y = 9, Z = 108, and
E = 19.
Step 1. F1 = 33.3333333
Step 2. F2 = 17.59259259
Step 3.1. C = excursioni = 10.29485714
Step 3.2.
nse = 0.095322751
Step 3.3. Calculation of F3
| nse value | 0.01*nse | 0.01*nse + 0.01 | F3 |
| 0.095322751 | 0.000953228 | 0.010953228 | 8.702708969 |
Table 9.
Total calculation of WQI.
| Component of CCME WQI | Value | Square value |
|---|---|---|
| F1 | 33.33333333 | 1111.111111 |
| F2 | 17.59259259 | 309.4993141 |
| F3 | 8.702708969 | 75.73714341 |
| SUM | 1496.347569 | |
| Suquare Root Value | 38.68265204 | |
| Divide by 1.732 | 1.732 | |
| D | 22.33409471 | |
| 100 | ||
| CCME WQI (object 2) | 77.66590529 | |
Table 10.
General quality indices of underground drinking water obtained using the CCME WQI model.
| Years | Parametrs | WQI | Classification | ||
| F1 | F2 | F3 | |||
| 2021 | 33.33333333 | 17.59259259 | 8.702708969 | 77.66590529 | Fair |
| 2023 | 33.33333333 | 24.07407407 | 13.47170738 | 75.01821401 | Fair |
3.3. Discussion
During the years 2021 and 2023, the overall water quality index (WQI) for Object 1 categorized it within the fifth tier of the CCME WQI model, denoting a “Poor” status in relation to sensitive crops. This classification was primarily influenced by the non-compliance of nearly all six quality indicators with the standards established by the FAO guidelines. Specifically, in 2021, the total number of indicators failing to meet the required standards over a twelve-month period was 66, representing 91.67% of the total (as indicated by the values highlighted in red in Table X). In 2023, this figure rose to 72, indicating a full 100% non-compliance. A comparative analysis of these two years reveals an increase in salinity levels for Object 1, with a rise of 8.33% observed in 2023 compared to 2021. Furthermore, when evaluating the WQI concerning insensitive crops per FAO-established ranges, the classification remains at the “Poor” level for both years. The total WQI values for these crops are in the ratio of 1.117:1 (30.73879678 in 2021 compared to 27.52755761 in 2023), reflecting a reduction in salinity of 3.21123917 for insensitive crops. However, this difference is not substantial when considering random fluctuations within the dataset.
These findings suggest that inadequate irrigation practices, characterized by the use of collector-drainage water with elevated salinity levels without proper treatment, exacerbate soil salinity. As a result, this “secondary water” undergoes filtration through Quaternary deposits, adversely affecting the quality of groundwater originating from depths of 10 meters.
In examining the results for Object 2, which pertains to underground drinking water, the CCME WQI model indicates that the overall quality index in 2021 placed it within category three, classified as “Fair”. The non-compliance of three specific indicators - Total Hardness (TH), Total Dissolved Solids (TDS), and Chloride (Cl⁻) - with the National Standard primarily contributed to this classification. This pattern persisted in 2023, and a comparative analysis of the two years reveals a ratio of 1.035:1 (77.66590529 in 2021 compared to 75.01821401 in 2023), indicating a slight decline in the quality of Object 2 over this period. The persistent non-compliance of the three indicators in 2023 reinforces the challenges facing underground drinking water quality. Trends for both objects are further illustrated in Diagrams 1 and 2 below.
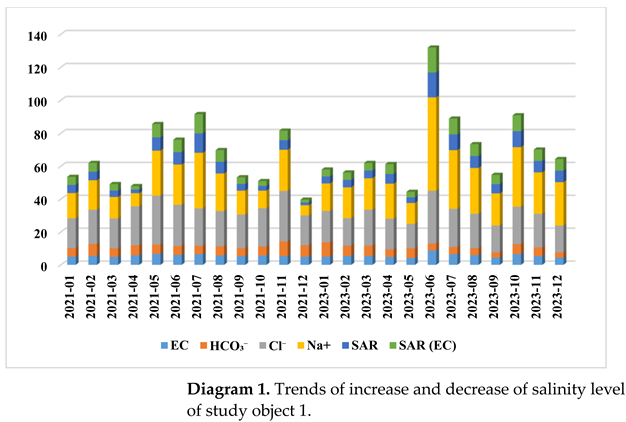
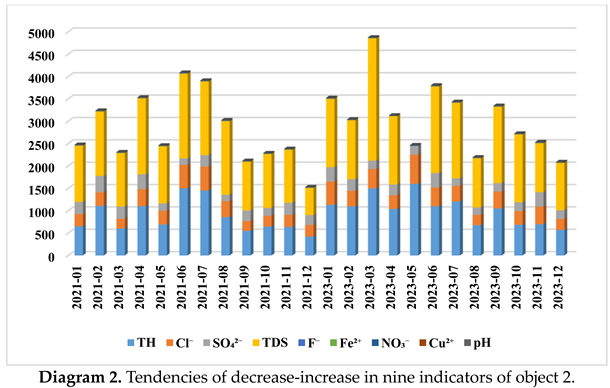
The X-diagram illustrates that the concentration of Na+ cations in Object 1 presents a greater risk compared to the other analyzed indicators. Additionally, among the nine indicators assessed, only Total Dissolved Solids (TDS) and Total Hardness (TH) exhibited the most significant increasing trends during the periods of 2021 and 2023.
3.4. Correlation Coefficients
The Amudarya district is geographically situated in the lower region of Uzbekistan, resulting in a high level of underground seepage water near the soil surface. This proximity contributes to widespread soil salinity. Consequently, the practice of salt washing to mitigate excess surface salt accumulation is routinely employed in this area. Here, “underground seepage water” emerges as a critical factor adversely affecting both study objects. Typically, an increase in salinity within collector-drainage waters would correspond to a decrease in salinity in Object 2. However, a decrease in salinity levels of the collector-drainage water, coupled with an increase in salinity levels of the underground groundwater, indicates a problematic scenario. The correlation coefficients for Objects 1 and 2 are presented in the accompanying correlation matrix tables 10 - 11.
Table 11.
Correlation coefficients of six quality indicators in the collector - drainage water.
| Variables | EC | НСО3- | Cl⁻ | Na+ | SAR | SAR (EC) |
| EC | 1.000 | |||||
| НСO₃⁻ | -0.092 | 1.000 | ||||
| Cl⁻ | 0.795 | 0.206 | 1.000 | |||
| Na+ | 0.777 | -0.312 | 0.571 | 1.000 | ||
| SAR | 0.775 | -0.365 | 0.538 | 0.974 | 1.000 | |
| SAR (EC) | 0.775 | -0.365 | 0.538 | 0.974 | 1.000 | 1.000 |
Table 12.
Correlation coefficients of nine groundwater quality indicators.
| Variables | TH | Cl⁻ | SO42- | TDS | F- | Fe2+ | NO3- | Cu2+ | pH |
| TH | 1.000 | ||||||||
| Cl⁻ | 0.856 | 1.000 | |||||||
| SO42- | -0.008 | 0.043 | 1.000 | ||||||
| TDS | 0.861 | 0.727 | -0.136 | 1.000 | |||||
| F- | 0.216 | 0.367 | 0.030 | 0.137 | 1.000 | ||||
| Fe2+ | 0.303 | 0.409 | 0.270 | 0.213 | 0.501 | 1.000 | |||
| NO3- | 0.367 | 0.550 | 0.184 | 0.420 | 0.373 | 0.447 | 1.000 | ||
| Cu2+ | 0.577 | 0.674 | 0.266 | 0.534 | 0.653 | 0.570 | 0.601 | 1.000 | |
| pH | 0.243 | 0.201 | -0.136 | 0.304 | 0.330 | 0.441 | 0.306 | 0.415 | 1.000 |
Figure 2.
Spatial structure of collector drainage water and groundwater.
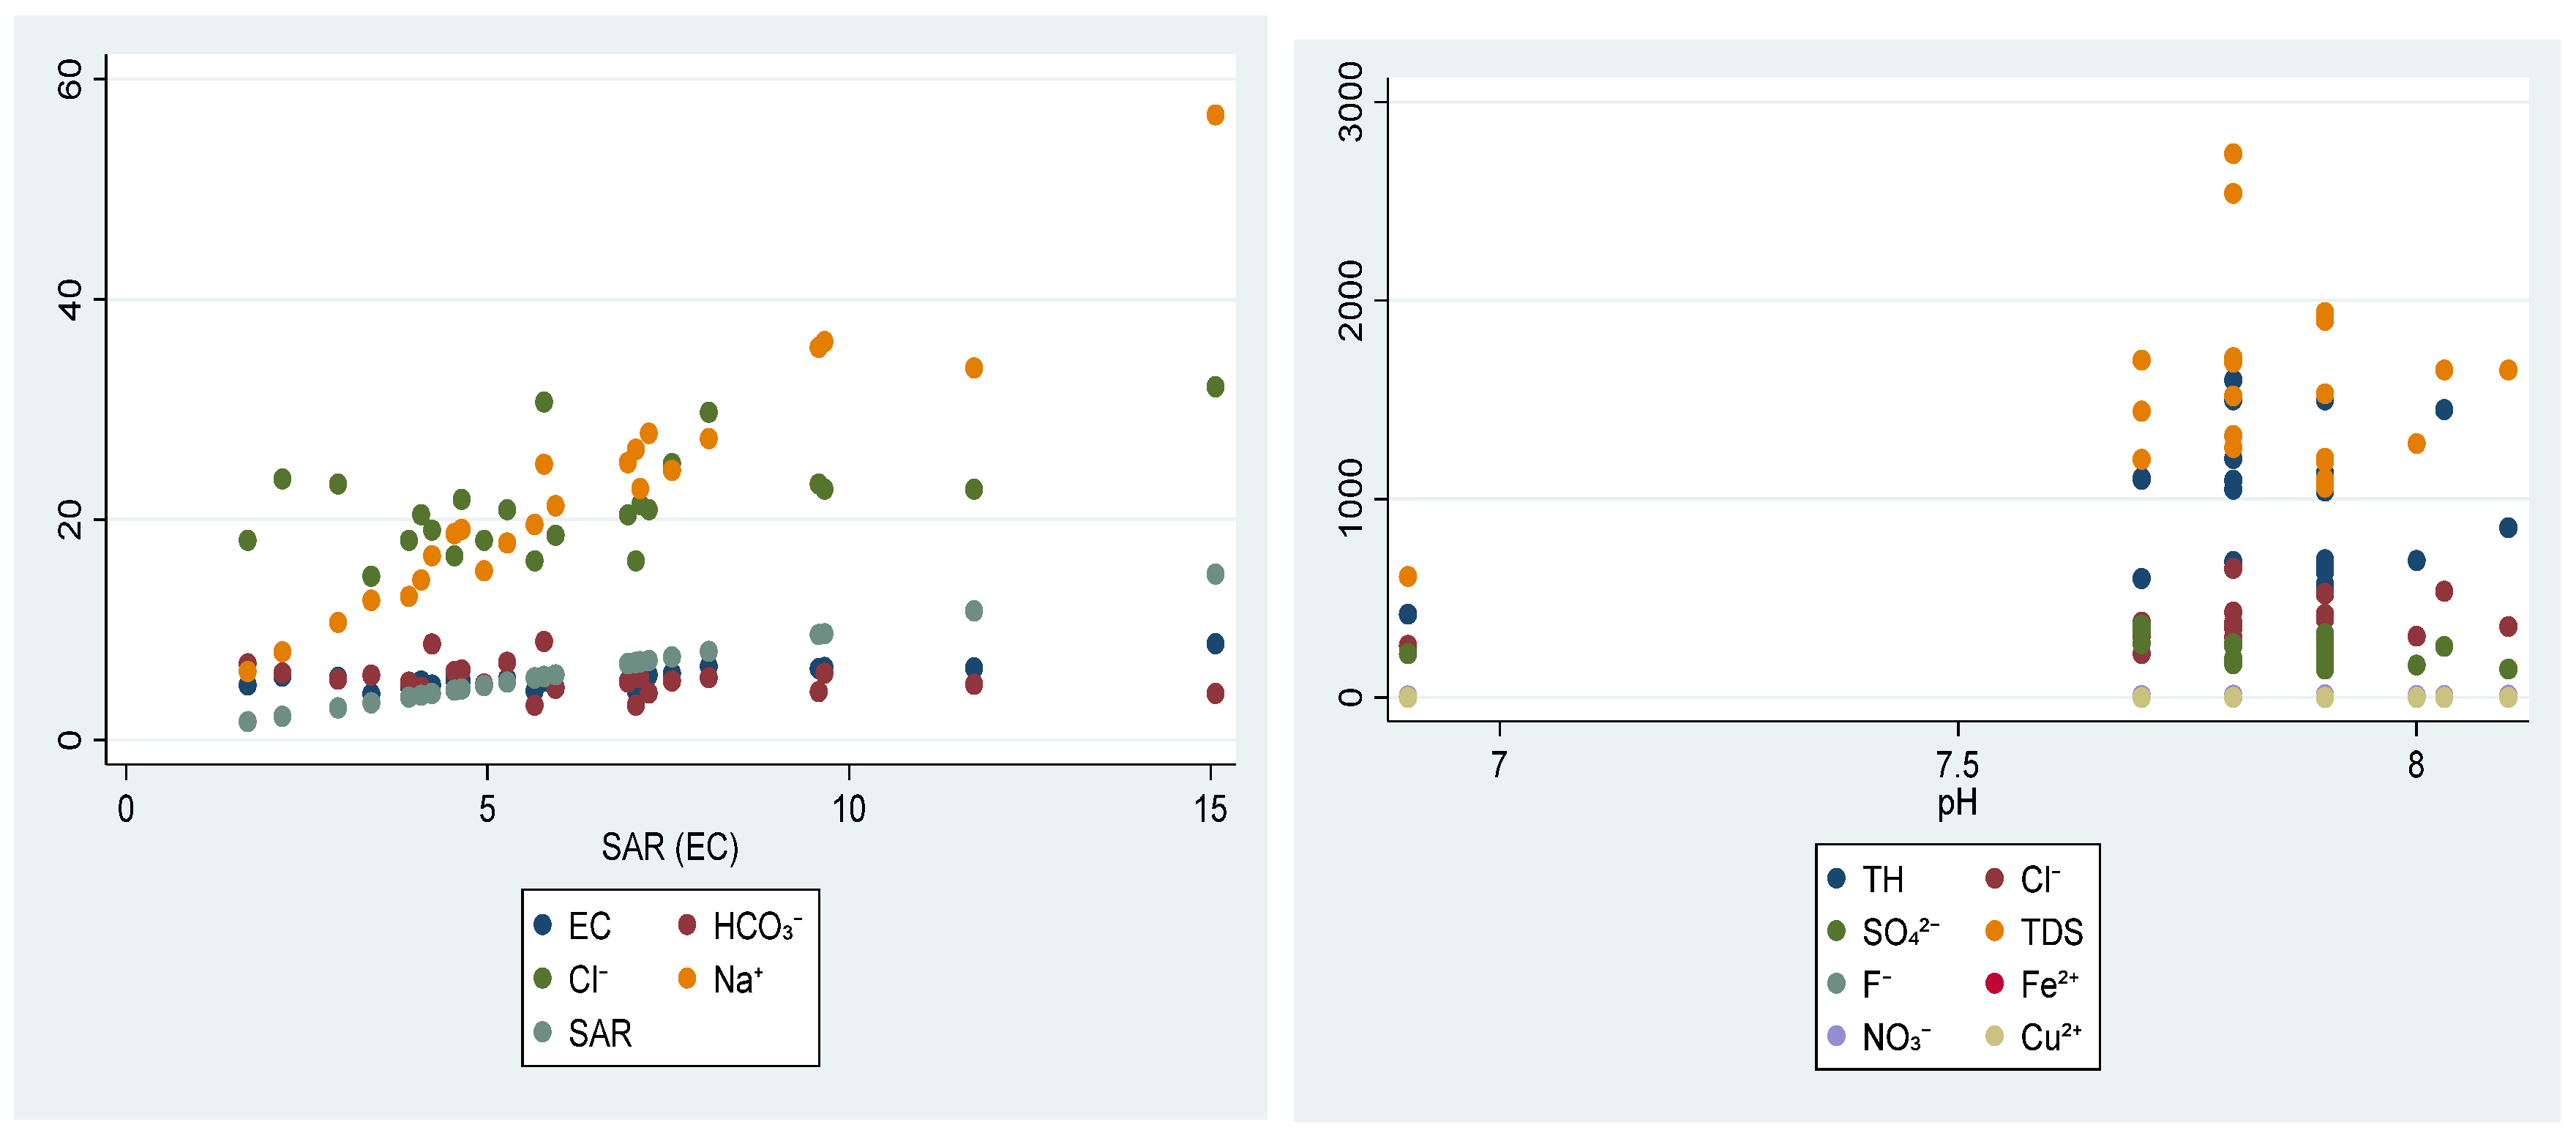
An analysis of the correlation coefficients presented in the 10-11 tables indicates a strong positive correlation among several indicators in Object 1, including electrical conductivity (EC), chloride (Cl⁻), sodium (Na⁺), and sodium adsorption ratio (SAR). Conversely, most relationships involving bicarbonate (HCO₃⁻) exhibited an inverse correlation, with the exception of a correlation coefficient of 0.206 between HCO₃⁻ and Cl⁻. In Object 2, robust positive correlations were observed among total hardness (TH), chloride (Cl⁻), and total dissolved solids (TDS). The sulfate (SO₄²⁻) anion showed negligible correlation with other indicators, while a weak negative correlation was identified between TDS and pH. Furthermore, a positive neutral correlation was noted for the fluoride (F⁻) anion, particularly between ferrous (Fe²⁺) and cupric (Cu²⁺) ions, with other parameters exhibiting weak positive correlations. The spatial distribution of these correlation coefficients for both objects is illustrated in the accompanying graph 1.
The left graph illustrates the spatial distribution of indicators within Object 1, specifically the collector-drainage water. This visualization highlights the correlation levels among the various indicators, allowing for an assessment of their spatial interrelationships.
4. Conclusion
The application of Victor Ernest Shelford’s “Law of Tolerance” has proven instrumental in assessing the ecological impact of groundwater and collector-drainage water quality on local flora within the Amudarya district. The study’s findings demonstrate that the physicochemical characteristics of collector-drainage water are categorized as “Poor” according to the Water Quality Index (WQI), presenting substantial barriers to creating a viable growth environment for both “Sensitive” and “Insensitive” crops. The groundwater quality index, evaluated through the Canadian Council of Ministers of the Environment Water Quality Index (CCME WQI) model, is classified as “Fair,” denoting unsuitability for potable use. Elevated levels of total hardness (TH), total dissolved solids (TDS), and chloride (Cl⁻) concentrations are significant limiting factors, in alignment with the Law of Tolerance, which consequently hinders the local population’s ability to utilize this water resource for daily consumption.
To enhance the ecological sustainability of the study sites, prioritizing the use of organic fertilizers over chemical inputs is recommended in agricultural practices. This study provides critical insights into optimizing environmental monitoring methodologies for evaluating both surface and groundwater ecological conditions and for implementing salinity management strategies. These findings contribute to advancing agro-ecological stability and promoting improved ecological health within the affected ecosystems, which are essential for ensuring long-term agricultural productivity and environmental resilience.
Recommendations: The following recommendations are proposed based on the study’s findings, aimed at enhancing water quality, ecological stability, and agricultural sustainability:.
1. The WQI categorization of Object 1 as “Poor” underscores the need for reducing salinity concentrations, facilitating irrigation for specific salt-tolerant crops. This measure would improve local water quality, as Object 2 attains a “Fair” WQI rating, and promote water reutilization under conditions of scarcity.
2. Introducing crops classified as “insensitive” to high salinity levels could improve water and soil quality by managing salt accumulation. Implementation of sequestration ponds for salts associated with Object 1 and agricultural zones (agrocenoses) would help prevent excessive soil salinization.
3. Long-term monitoring is essential to evaluate the impact of salt-insensitive crops on water quality and to mitigate potential environmental consequences. Such an approach will contribute to water conservation and sustainable agricultural practices.
4. Recognizing that surface water pollution significantly affects groundwater quality, addressing elevated levels of certain anions (Cl⁻) and cations (Ca²⁺, Mg²⁺) in groundwater is critical to maintaining water availability and reducing reliance on potable water.
5. To support both the quality of potable water in agricultural regions and crop yields, the increased application of organic fertilizers is essential, alongside minimizing the reliance on chemical inputs where feasible. This approach will contribute to improved soil health and long-term agricultural sustainability.
References
- Abukila, A. F. (2015). Assessing the drain estuaries’ water quality in response to pollution abatement. Water Science, 29(1), 1-18. [CrossRef]
- Ahn, Y. J., & Juraev, Z. . (2023). Green spaces in Uzbekistan: Historical heritage and challenges for urban environment. Nature-Based Solutions, 4, 100077. [CrossRef]
- Akıncı, H., Özalp, A. Y., & Turgut, B. (2013). Agricultural land use suitability analysis using GIS and AHP technique. Computers and electronics in agriculture, 97, 71-82. [CrossRef]
- Akpoti, K., Kabo-bah, A. T., & Zwart, S. J. (2019). Agricultural land suitability analysis: State-of-the-art and outlooks for integration of climate change analysis. Agricultural systems,, 173, 172-208. [CrossRef]
- Alikhanova, S., & Bull, J. W. . (2023). Review of nature-based solutions in dryland ecosystems: The Aral Sea case study. Environmental Management, 72(3), 457-472.
- Ayana, D., Yermekkul, Z., Issakov, Y., Mirobit, M., Ainura, A., Yerbolat, K., ... & Dávid, L. D. (2024). The possibility of using groundwater and collector-drainage water to increase water availability in the Maktaaral district of the Turkestan region of Kazakhstan. Agricultural Water Management. [CrossRef]
- Azzam, A., Zhang, W., Xu, C., & Khan, Z. (2023). Calibration and evaluation of Hargreaves-Samani equation for estimating reference evapotranspiration: A case study in the Amu Darya River Basin, Central Asia. Journal of Hydrology: Regional Studies, 45, 101298. [CrossRef]
- Chen, X., Cui, X., Sun, L., Yu, Y., Zhang, H., Liu, T., ... & Yu, R. (2024). Dryland Social-Ecological Systems in Central Asia. [CrossRef]
- Christou, A., Agathokleous, E., & Fotopoulos, V. . (2022). Safeguarding food security: hormesis-based plant priming to the rescue. Current Opinion in Environmental Science & Health, 28, 100374. [CrossRef]
- Conrad, C., Usman, M., Morper-Busch, L., & Schönbrodt-Stitt, S. (2020). Remote sensing-based assessments of land use, soil and vegetation status, crop production and water use in irrigation systems of the Aral Sea Basin. A review. Water Security, 11, 100078. [CrossRef]
- Correa, L., Razi, F., Hewage, K., & Sadiq, R. (2024). Environmental and social life cycle analysis of hydrogen-powered railway locomotives in Canadian context. International Journal of Hydrogen Energy, 198-209. [CrossRef]
- Daví, J. G. (n.d.). Documentos CIDOB Asia.
- Desta, L. (2000). Land degradation and strategies for sustainable development in the Ethiopian highlands: Amhara Region. Retrieved from.
- Elsokkary, I. H., & Abukila, A. F. . (2014). Risk assessment of irrigated lacustrine & calcareous soils by treated wastewater. Water Science, 28(1), 1-17. [CrossRef]
- Kannazarova, Z., Juliev, M., Muratov, A., & Abuduwaili, J. (2024). Groundwater in the commonwealth of independent states: A bibliometric analysis of scopus-based papers from 1972 to 2023, emphasizing the significance of drainage. Groundwater for Sustainable Development. doi:https://doi.org/10.1016/j.gsd.2024.101083Karthe, D., Chalov, S., & Borchardt, D. (2015). Water resources and their management in central Asia in the early twenty first century: status, challenges and future prospects. Environmental Earth Sciences,, 73, , 487-499. [CrossRef]
- Khan, M. S., & Paul, S. K. (2023). Groundwater quality assessment and health issues in coastal zone of Bangladesh. Journal of Hazardous Materials Advances, 10, 100278. [CrossRef]
- Khasanov, S., Kulmatov, R., Li, F., van Amstel, A., Bartholomeus, H., Aslanov, I., ... & Chen, G. (2023). Impact assessment of soil salinity on crop production in Uzbekistan and its global significance. Agriculture, Ecosystems & Environment, 342, 108262. [CrossRef]
- Khasanov, S., Kulmatov, R., Li, F., van Amstel, A., Bartholomeus, H., Aslanov, I., ... & Chen, G. (2023). Impact assessment of soil salinity on crop production in Uzbekistan and its global significance. Agriculture, Ecosystems & Environment,, 342. [CrossRef]
- Kulmatov, R., Odilov, S., Khasanov, S., & Allaberdiev, R. ((2021)). Quantity and quality of groundwater resources distribution along Sirdarya province, Uzbekistan. In E3S web of conferences (pp. 284,). EDP Sciences. [CrossRef]
- Kulmatov, R., Odilov, S., Khasanov, S., & Allaberdiev, R. (2021). Quantity and quality of groundwater resources distribution along Sirdarya province, Uzbekistan. In E3S web of conferences (pp. 284,). EDP Sciences. [CrossRef]
- Kamran, M., Parveen, A., Ahmar, S., Malik, Z., Hussain, S., Chattha, M. S., ... & Chen, J. T. (2019). An overview of hazardous impacts of soil salinity in crops, tolerance mechanisms, and amelioration through selenium supplementation. International journal of molecular sciences, 21(1), 148.
- Lan, F. N., Zhao, Y., Li, J., & Zhu, X. Q. . (2024). Health risk assessment of heavy metal pollution in groundwater of a karst basin, SW China. Journal of Groundwater Science and Engineering, 12(1). [CrossRef]
- Liu, Y., Wang, P., Gojenko, B., Yu, J., Wei, L., Luo, D., & Xiao, T. (2021). A review of water pollution arising from agriculture and mining activities in Central Asia: Facts, causes and effects. Environmental Pollution,, 291, 118209.
- Montgomery, D. R., Rabinowitz, P., Sipos, Y., & Wheat, E. E. . (2024). Soil health: A common focus for one health and planetary health interventions. One Health, 18, 100673. [CrossRef]
- Ramazanova, E., Bahetnur, Y., Yessenbayeva, K., Lee, S. H., & Lee, W. (2022). Spatiotemporal evaluation of water quality and risk assessment of heavy metals in the northern Caspian Sea bounded by Kazakhstan. Marine Pollution Bulletin, 181, 113879. [CrossRef]
- Silva, T. P., Bressiani, D., Ebling, É. D., & Reichert, J. M. . (2024). Best management practices to reduce soil erosion and change water balance components in watersheds under grain and dairy production. International soil and water conservation research, 12(1), 121-136. [CrossRef]
- Uddin, M. G. et al., 2022. (2022). A comprehensive method for improvement of water quality index (WQI) models for coastal water quality assessment. Water Research, 219, 118532.
- Uddin, M. G., Jackson, A., Nash, S., Rahman, A., & Olbert, A. I. (2023). Comparison between the WFD approaches and newly developed water quality model for monitoring transitional and coastal water quality in Northern Ireland. Science of the Total Environment, 901, 165960.
- Uddin, M. G., Nash, S., & Olbert, A. I. . (2021). A review of water quality index models and their use for assessing surface water quality. . Ecological Indicators, 122, 107218. [CrossRef]
- Uddin, M. G., Nash, S., Rahman, A., & Olbert, A. I. (2023). A sophisticated model for rating water quality. Science of the Total Environment, 868, 161614.
- Wang, X., Chen, Y., Fang, G., Li, Z., & Liu, Y. (2022). The growing water crisis in Central Asia and the driving forces behind it. Journal of Cleaner Production, 378, 134574. [CrossRef]
- Zhan, S., Wu, J., & Jin, M. (2022). Hydrochemical characteristics, trace element sources, and health risk assessment of surface waters in the Amu Darya Basin of Uzbekistan, arid Central Asia. Environmental Science and Pollution Research,, 29(4), 5269-5281. [CrossRef]
- Zhang, Q., Qian, H., Xu, P., Hou, K., & Yang, F. (2021). Groundwater quality assessment using a new integrated-weight water quality index (IWQI) and driver analysis in the Jiaokou Irrigation District, China. Ecotoxicology and environmental safety(212), 111992.
- Zhang, X., Shu, C., Fujii, M., Wu, Y., Ye, P., & Bao, Y. ((2023).). Numerical and experimental study on water-heat-salt transport patterns in shallow bare soil with varying salt contents under evaporative conditions: A comparative investigation. Journal of Hydrology,, 621, 129564. [CrossRef]
Figure 1.
Sampling locations of Study Area (Uzbekistan, Republic of Karakalpakstan, Amudarya District).
Figure 1.
Sampling locations of Study Area (Uzbekistan, Republic of Karakalpakstan, Amudarya District).
Disclaimer/Publisher’s Note: The statements, opinions and data contained in all publications are solely those of the individual author(s) and contributor(s) and not of MDPI and/or the editor(s). MDPI and/or the editor(s) disclaim responsibility for any injury to people or property resulting from any ideas, methods, instructions or products referred to in the content. |
© 2025 by the authors. Licensee MDPI, Basel, Switzerland. This article is an open access article distributed under the terms and conditions of the Creative Commons Attribution (CC BY) license (http://creativecommons.org/licenses/by/4.0/).
Copyright: This open access article is published under a Creative Commons CC BY 4.0 license, which permit the free download, distribution, and reuse, provided that the author and preprint are cited in any reuse.


