
Submitted:
23 July 2025
Posted:
25 July 2025
You are already at the latest version
Abstract
The presence of pathogens, toxic substances, and excess nutrients in rivers is due to the combination of industrial, agricultural, and livestock farming activities, as well as the absence of wastewater treatment plants and sewerage networks. River degradation is the result of these factors. The results from four water quality monitoring, carried out between November 2023 and August 2024, in the rivers of northern Urabá are pre-sented in this paper, and the relationships between physicochemical and microbiolog-ical parameters are assessed. Water samples from 16 sites, upstream, downstream and within urban centers, as well as at the mouths of the Hobo, Zapata, and Damaquiel rivers, and two water bodies flowing into the coastal lagoon of Bahía El Uno are pre-sented. The results revealed elevated content coliforms exceeding permissible Colom-bian standards and indicate that urban discharges increase microbial loads and induce degradation of conditions in the study area.
Keywords:
water quality
; coliforms
; physicochemical parameters
; wet and dry seasons
; wastewater
1. Introduction
Rivers are dynamic ecosystems whose physicochemical and biological composition is determined by their interaction with the atmosphere, soil and biota. However, the combination of industrial, agricultural and livestock activities, mining and deforestation among many others, exert increasing pressure on these systems, affecting their quality and availability [1,2,3].
The environmental state of a region is often reflected in its rivers, as they carry, or are depositories of, large amounts of waste generated by anthropogenic activities, which may cause varying degrees of alteration [4]. However, natural events such as hurricanes, volcanic eruptions and earthquakes, floods, and erosion also contribute materials and substances to rivers that, together with runoff, are transported and eventually deposited in the marine environment [5,6,7]. Globally, about 80% of all industrial and domestic wastewater is discharged with no prior treatment, bringing detrimental effects to the water bodies receiving it [8]. This is due to a lack of adequate wastewater treatment plants and sewage networks, and means pathogens, toxic substances and excess nutrients enter rivers. Wastewater discharges are among the main drivers of impacts associated with aquatic ecosystem degradation, increasing the risk of disease and diminishing the water quality [8,9,10]. The resulting ecological imbalances, lead to a significant reduction in global biodiversity and negative effects on socio-economic growth [10], as aquatic ecosystems provide a wide variety of goods and services, many of which are irreplaceable [11,12].
When wastewater enters an aquatic environment, biotic and abiotic parameters are affected; the concentration of dissolved oxygen (DO) can be reduced by the presence of organic and microbiological pollutants [13]. This parameter provides information related to biological and biochemical reactions in the aquatic environment and is therefore important in determining the quality of water [14].
Water quality can also be analyzed by assessing the presence of organisms; thermotolerant coliforms being a reference, as they are indicators of faecal contamination, and their presence is associated with risks to aquatic life and human health [15]. A high load of coliforms in a water body can represent a health risk, as it not only alters the balance of the ecosystem, but also affects the uses to which that water can be put, making it unviable for human consumption, recreation and other activities, such as agriculture and domestic use [16]. In the Urabá region, wastewater treatment is often lacking, and microorganisms of faecal origin are commonplace meaning that water quality is compromised.
Studies aimed at assessing water quality in the rivers of this region are practically non-existent, except the one carried out by [17], which did not include the rivers in the northern area. The present study thus examined the relationship between physicochemical and microbiological parameters in water bodies in the municipalities of San Juan de Urabá, Arboletes, Necoclí and Turbo, in the north of Urabá, Antioquia, in order to identify patterns of environmental deterioration associated with urban discharges, and their variation according to meteorological conditions.
2. Materials and Methods
2.1. Study Area
The study area lies close to the Gulf of Urabá, in the state of Antioquia, northern Colombia. It has a tropical climate, with marked seasonal variations, determined by the movements of the Intertropical Convergence Zone, giving two main seasons: a dry season, with lower rainfall and higher temperatures, and a wet season, with higher rainfall and runoff [18]. The dry season typically runs from December to April, while the rainy season lasts from May to November [19].
In the Gulf of Urabá, the temperature ranges from 19 to 40 °C, with a mean annual of 27 °C, while rainfall is between 40 and 100 mm/month [20], and the relative humidity is approximately 85.9 %; climatic characteristics of a tropical rainforest [21]. The seasonal variations of various parameters in surface waters were analyzed.
Four sampling campaigns were carried out: the first in November 2023 (dry season-DS), the others in January (DS), April and August 2024 (wet season-WS).
Sixteen sampling sites were selected, four each on the Zapata, Damaquiel, and Hobo rivers, and in the streams of Bahía el Uno (Figure 1), including sites influenced by the villages of Zapata, Damaquiel, Hobo River, and Bahía el Uno respectively (Table 1).
These sites were chosen so as to evaluate the possible influence of urban discharges, considering areas before, within and after the settlements on each tributary, as well as at its mouth.
In the case of Bahía el Uno, two streams, running into the lagoon were sampled, uptream and downstream of the village; the Coastal Lagoon registers a change in the location of its natural entrance, currently located in the northern area, with greater influence from the mouth of the Turbo River.
2.2. Sampling
Physicochemical parameters were measured in situ and surface water samples were collected for laboratory analysis, following the methodology of the Standard Methods [22]. Dissolved oxygen (DO), temperature, pH, and total dissolved solids (TDS) were recorded using a multi-parameter probe. Water samples were also taken at each sampling site, using Winkler bottles for laboratory determination of DO (Winkler method), fixing the samples in situ.
For the evaluation of microbiological quality (total coliforms and thermotolerant coliforms), water samples were taken using previously sterilized Schott glass containers of 250 mL capacity, which were submerged and opened under water, filling them partially.
Each sample was properly labelled, sealed and stored for transport to the analytical laboratory at a temperature of approximately 4 °C. The method used for the determination of total coliforms (TC) and thermotolerant coliforms (TTC) was the most probable number (MPN).
2.3. Data Analysis
An analysis of the data was carried out using the Lilliefors test (Kolmogórov-Smirnov, p < 0.05), establishing that the data were not distributed normally. Therefore, Spearman’s non-parametric correlation tests were used to evaluate the relationship between DO, temperature and coliforms. Correlation analysis determines whether the relationship between two variables is present or absent, and that two variables are associated to a degree, and the significance was based on a p-value of less than 0.05.
Statistical analyses and graphs representing the distribution of the data were performed using IBM SPSS Statistics 26.
The results obtained were compared with the values established in the Colombian environmental and health regulations (Resolutions 2115/2007, 0631/2015 and Decree 1076/2015), in order to determine the extent to which they adhere to the standards, and the possible risks associated with use of this water.
3. Results
Table 2 shows the values recorded in physico-chemical and microbiological variables at the sampling sites, and the reference values given in Colombian regulations.
The highest surface temperature recorded was at the river mouth Bahía el Uno (B4) (33.7 °C), in the last sampling, corresponding to wet season (August), while the lowest record (26.9 °C) was obtained in Hobo River, in the first sampling, in the dry season (November). The temperature variation was lowest in April (29.8–32.8 °C) and highest in August (29.0–33.7 °C), both periods correspond to the wet season
There was greatest variability in the second and fourth sampling, both of which are related to changes in weather conditions between seasons. Sites in Bahía El Uno had the highest temperatures (Figure 2a); in contrast, sites on the Damaquiel River (D1–D4) had low temperatures and less variability.
There was significant variability between sampling points in the concentration of dissolved oxygen (DO); 0.25 mg/L to 9.11 mg/L, in Bahía el Uno during the January sampling and in the Zapata River respectively, with both data corresponding to dry season (DS1). In Bahía el Uno, sites B2 and B3 had the lowest values, 3.3 mg/L and 3.11 mg/L respectively. In contrast, sites on the Hobo River (H2) and Zapata River (Z2 and Z3) had the highest concentrations, 9.02 mg/L and 9.11 mg/L (Figure 2b).
Regarding the pH of the water, relatively stable values were seen for all the sampling sites, varying between 6.69 and 8.40 (Figure 2c), values within the acceptable range according to environmental regulations in Colombia (4.0–9.0). The values recorded in November (DS1) were the most extreme, with a minimum and maximum of 6.69 and 8.4 respectively. In the last sampling corresponding to WS2 there was less variation (7.31–7.87) (Figure 2c).
The values for Total dissolved solids (TDS) varied greatly, with a minimum concentration of 3.73 mg/L and a maximum of over 15000 mg/L (Figure 2d). In the first sampling the recorded concentrations were 79.7–15000 mg/L; in the second from 125.8 to 12470 mg/L, in the third 3.73–699 mg/L, and in the fourth sampling values ranged from 98.8 to >15000 mg/L. TDS values were particularly high at sites established at the river mouths and in the village centers. A wide variability was presented in TDS concentration, with levels over 14,000 mg/L at sites B4 and Z4. In contrast, sites such as D1, H1, H2, Z1, Z2, and to a lesser extent B1, had low and stable concentrations (Figure 2d).
The concentrations of thermotolerant coliforms (TEC) ranged from 20 to 8400000 NMP/100 mL (Figure 3a), recorded in the DS1 (H2) and WS1 (B2), respectively. The highest concentrations and most variability were in Bahía el Uno, while in the Hobo River, especially, the concentrations were substantially lower.
With respect to total coliforms (TC) values, expressed in NMP/100 mL, it is seen that the sites in Bahía el Uno (B1, B2 and B4) had highest concentrations, especially the site at the river mouth (B4), the one with greatest variability.
Of the parameters evaluated, only the temperature values had a normal distribution (p > 0.05), which is why Spearman’s correlation coefficient was used to evaluate the relationships between the variables. The results obtained from this analysis are presented in Table 3.
A moderate negative correlation was identified between DO and thermotolerant coliforms (r = -0.495. p < 0.05), as well as with total coliforms (r = -0.484. p < 0.05). Negative and significant correlations were also identified between coliforms and TDS (r = -0.277; r = -0.307; p < 0.05), and with temperature (r = -0.294; r = -0.270; p < 0.05); however, no significant correlation was observed between temperature and DO (r = 0.017; p = 0.892).
4. Discussion
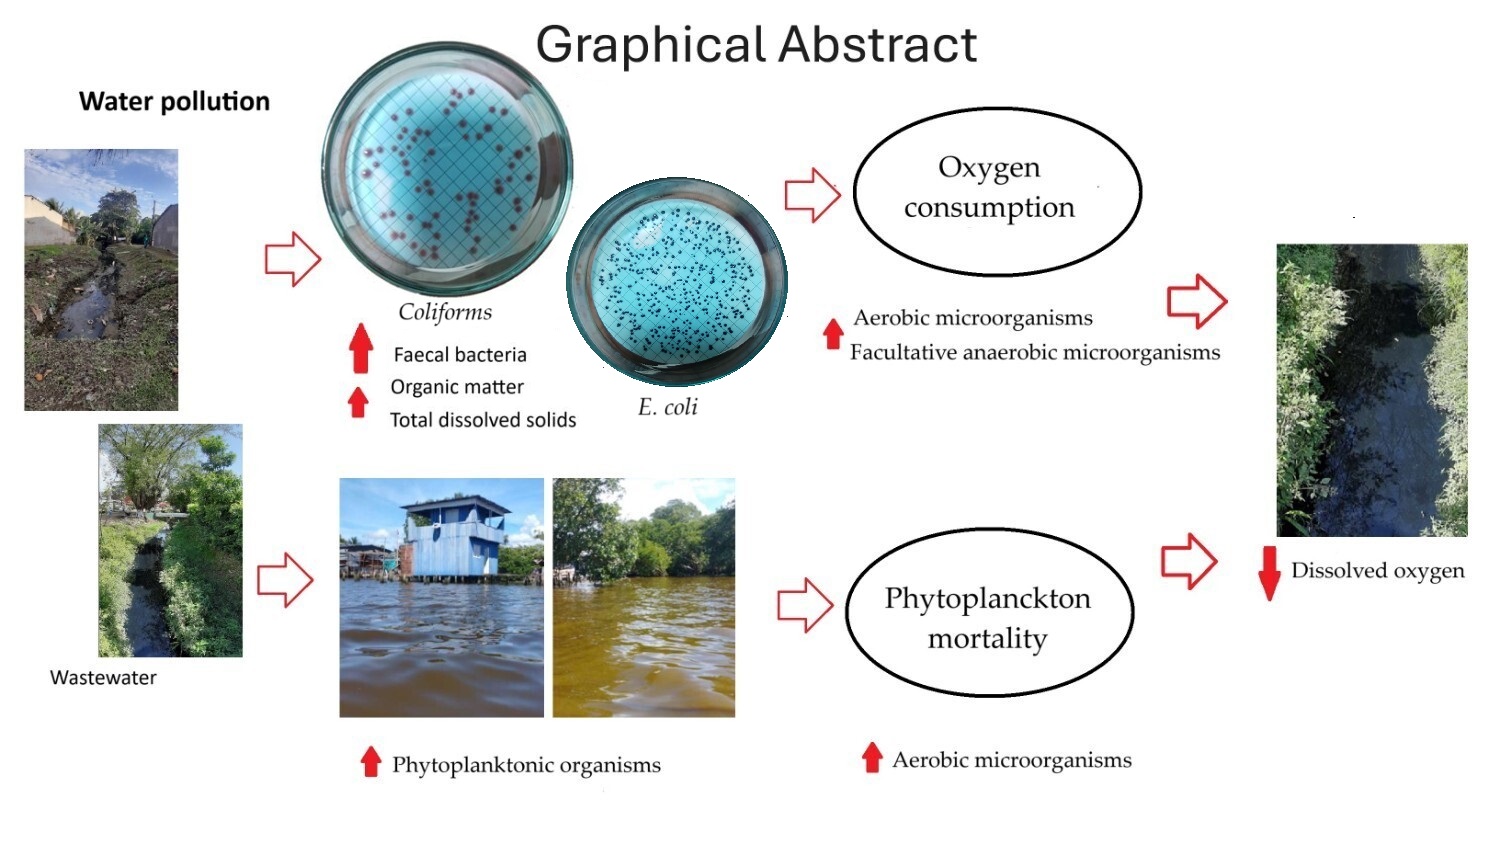
The release of raw and improperly treated wastewater onto watercourses has both short- and long-term effects on the environment and human health [23] because the inadequate disposal of human and animal excreta can contaminate water resources, causing high nutrients, decreased oxygen levels, and an increase in the number of pathogens in the water body [24,25].
The discharge of wastewater may have different effects on the microscopic species that comprise the foundation of water ecosystems [26]. These changes are directly reflected in the environment and, consequently, in water quality. This is particularly true in many developing countries, where sewage is often discharged directly into watercourses. due to the total, or partial, lack of sewage networks and treatment plants in many urban centres, as is the case in the coastal municipalities of Urabá, where the discharge of wastewater to natural watercourses deteriorates the water resource quality.
For the water bodies evaluated, the variation of physico-chemical and microbiological parameters showed differences between sites and between climatic periods, with the greatest variations seen in the data from the sampling sites in Bahía el Uno, except for pH, which varied more at sites in the Hobo River, and in the Zapata River mouth.
The pH data were stable within the normative range (4.0–9.0), with values between 6.69 and 8.1; neutral and slightly alkaline, as described for other rivers in Urabá, where values recorded were 7.1 and 8.2 [17]. There was little variability between the sampling sites, suggesting that this variable is not a critical risk factor in the water bodies evaluated.
In rivers, the temperature is largely controlled by incoming solar radiation [27,28]. The temperature data ranged from 26.9 to 33.7 °C, reflecting the climatic conditions of the region, and variations that occur in lotic systems, where this parameter fluctuates on daily, seasonal [29,30] interannual time scales, and along the longitudinal axis of the channel [30], and is also influenced by latitude and tends to correlate with air temperature [29,31,32].
The highest temperatures were recorded in August 2024 (WS2), reaching values from 29.0 to 33.7 °C. Such temperatures generate favorable conditions for microbial proliferation, increasing bacterial activity. According to [33], the environmental conditions of high temperatures and high concentrations of nutrients in tropical aquatic ecosystems could favor the proliferation of E. coli.
The lowest variability in temperatures were seen in the DS2 (3.0 °C), followed by the WS1 (3.3 °C).
Temperature behavior was influenced by the El Niño event, starting in the second half of 2023. According to the [34], the phenomenon reached its peak between November 2023 and January 2024 before dissipating and extending its influence until March [35]. In all periods evaluated during the present study, a precipitation deficit was recorded in the Colombian southern Caribbean [36,37,38,39] according to the reference values for this region [40].
Temperature has a direct or indirect effect on various physical and chemical processes, which are determinant in the distribution of organisms [41,42,43]. Its effect on the saturation constants of dissolved gases means that high temperatures reduce the concentration of these gases, which can intensify the effects of pollution [44]. In this way, DO responds to temperature variations, but also to oxygenation processes that include wind action, interaction with the atmosphere, and the activity of photosynthetic organisms.
Throughout the samplings, the average DO was 5.32 ± 2.05 mg/L, indicating that in general terms the concentrations remained at acceptable levels for aquatic life (≥ 4.0 mg/L). The greatest variations, and the lowest concentrations, were found in the water bodies of Bahía el Uno. However, DO was not significantly correlated with temperature, despite the fact that Bahía el Uno recorded high temperatures and low DO concentrations, contrary to the behavior reported by [45], who reported a significant negative correlation between temperature and dissolved oxygen (DO) in Mexican water bodies.
This difference could be attributed to the high loads of organic matter derived from untreated wastewater in the systems evaluated here, which alter the typical physico-chemical dynamics. In these water bodies, the DO seems to be conditioned by factors such as microbial activity associated with pollution, rather than by thermal variations.
The lowest variability in DO was seen in April (WS), followed by November (DS), with the lowest records equivalent to 0.25 mg/L, determined during January (DS) and August (WS) at various sampling sites. DO results were relatively stable, except for the sampling sites in Bahía el Uno (Figure 3), where the low concentrations recorded could compromise aquatic life, and therefore the equilibrium of these water bodies.
In Bahía el Uno, there is a significant contribution of wastewater, which alters the oxygen balance of the water, with B2 being the most critical site, recording very low DO levels (0.25 mg/L). These conditions also limit the possible use of water due to the presence of bacteria, including coliform groups. These bacteria increase dissolved oxygen consumption, which is also affected by the presence of decomposer microorganisms. Both situations increase anaerobic conditions, leading to increased survival of bacteria, such as coliforms in water contaminated with faecal matter [46].
In a riverbed, oxygen consumption is relevant to biological and chemical processes, and very important in the decomposition of organic matter and with the sediments present in the bottom of a river [47]. Oxygen consumption also varies due to the presence of microorganisms, which influences the availability of oxygen, therefore its study, as it allows understanding the relationship between the physical and microbiological parameters of water.
Microorganisms constitute the fundamental compartments of aquatic ecosystems because of their high concentration and activities [48]. However, pathogenic contamination of water contains significant health risks to aquatic environments and human beings. The microbiological results gave the highest concentrations of thermotolerant coliforms (8400000 NMP/100 mL) and total coliforms (24000000 NMP/100 mL) in January (DS2), and November (DS1) respectively, with an average of 399812 ± 1405339 NMP/100 mL for thermotolerant coliforms and 1542043 ± 4097424 NMP/100 mL for total coliforms. These values far exceed the maximums allowed in Colombian regulations (200 and 1000 NMP/100 mL, respectively), evidencing high faecal contamination in the water bodies evaluated.
The high concentrations of coliforms in Bahía El Uno (especially at B2 and B3) indicate the considerable load of faecal contamination associated with direct discharge of untreated domestic wastewater. The high coliform concentrations in Bahía El Uno (especially in B2 and B3) indicate the considerable burden of faecal contamination associated with the direct discharge of untreated domestic wastewater.
Similar findings were shown in studies by [15,49,50,51], who identified urban areas as the main sources of microbiological deterioration in tropical rivers. In Colombia, the relationship between water pollution and the proliferation of waterborne diseases mainly affects infants under one year of age and children from 1 to 4 years of age [52], a problem related to the inappropriate use of water resources affected by the discharge of effluents receiving faecal matter, which increase the bacterial load in the water bodies.
Coliforms can grow in natural surface waters due to the large amount of organic matter and high temperatures [53,54]. Bahía el Uno receives a significant amount of wastewater discharges, not only from homes in this area, but also from a sector of the municipality of Turbo, through a natural drain that receives wastewater and was channeled to this sector, causing further deterioration.
For the remaining sites, the highest coliform concentrations occurred in April (WS1). This behavior is related to the carryover of stagnant water in some sectors due to the low rainfall recorded from the second half of 2023 to March 2024. These waters are carried away by rainfall, increasing the concentration of microorganisms in the receiving water bodies.
Wastewater and other waste discharges generate excessive organic matter, and also promote eutrophication processes, that bring an increase in the concentration of nutrients and thereby, of phytoplanktonic organisms. This leads to mortality, and growth of aerobic microorganisms that consume oxygen, and reduce the availability of this gas in the ecosystem [55,56]. In Bahía el Uno, OD concentrations of far less than 2.0 mg/L were recorded, these conditions hinder the survival of many species.
The increase in eutrophication and associated hypoxia/anoxia (hypoxia < 2.0 mg/L, anoxia < 0.5 mg/L), influenced by rising temperatures combined with the acidification of susceptible waterbodies, are detrimental to ecosystem functioning [57,58]. The results indicate that among the study sites, Bahía el Uno was the only sector that recorded anoxic (B2) and hypoxic conditions, except during the sampling carried out in the WS corresponding to April, demonstrating the repercussions of inadequate wastewater management on the trophic state of the water bodies in this sector.
Sampling sites in Bahía el Uno feature shallow waters with low circulation, this causes changes in the trophic status of water bodies, resulting in greater deterioration in this sector compared to sites established on rivers. It is worth noting that the contribution of organic matter is significant after prolonged periods of little or no rainfall since when it occurs, much of the accumulated material is removed and transported to these bodies of water.
This material is primarily composed of domestic waste. The pollutant load is represented by high percentages of organic matter and microorganisms of faecal origin. The ability of faecal bacteria to survive in water indicates that their presence in this environment is associated with recent infections or with the presence of suitable conditions (pH, temperature, humidity, and organic matter) [59].
The organic load generated by household waste contains organic carbon, nitrogen, and pathogens attached to particles such as sand [60]. The entry of this contaminant load requires oxygen for decomposition and respiration processes, which explains the moderate negative correlation determined between DO and coliform concentrations. Faecal contamination favors microbial activity and reduces DO availability, as has been recorded in other water bodies by [13,61].
On the other hand, the differences in TDS concentration among the sampling sites suggest that their sources may respond to specific local conditions, such as the presence of sites with a higher degree of urbanization, the amount of wastewater discharged, and the self-purification capacity of each water body.
TDS data shows a positive, significant correlation with temperature, coinciding with results reported by [62], who attributed this relationship to evaporation processes that increase the concentration of solutes in the water. This suggests that the higher ionic concentration generated during warmer periods could favour eutrophication processes or alter microbial dynamics. This parameter is highly variable (19.85–>15000 mg/L), with an average of 2777 ± 3964 mg/L. The highest levels were recorded in the DS (November) and WS (August), suggesting a significant contribution of organic load and pollutants of anthropogenic origin in both periods.
The high concentrations of TDS determined directly affect the availability of oxygen present in water bodies. This is related to the fact that the highest TDS records were found at sites with the highest incidence of urbanization.
The relationship between the variables evaluated shows a pattern with high temperatures, coliform concentrations and TDS, and a tendency toward low DO levels, favoring bacterial growth processes that accentuate deoxygenation and negatively affect water quality.
The interaction between these variables underlines the need for monitoring that generates information on the ecological status of water bodies, and an integrated approach that simultaneously considers microbiological, physicochemical, pollutant and climatic factors.
Overall, the results seen here reflect deterioration and contamination in most of the water bodies analyzed. Data from few sites meets the criteria established in Colombian regulations, representing risks to the health of the ecosystem and to public health. Unfortunately, this situation is also seen in other water bodies across the country, as reported by [63].
6. Conclusions
This study analyzed the relationship between physicochemical and microbiological water parameters and their impact on resource quality. Fecal contamination was identified in the assessed water bodies due to the discharge of untreated wastewater. The parameters analyzed showed deterioration, particularly dissolved oxygen (DO) concentration. Bahía el Uno was the sector’s greatest impact by wastewater influence. The study area suffers from inadequate wastewater management, which compromises the quality of these aquatic environments, alters the system’s balance, and limits the ecosystem services associated with the resource. The results highlight the need to implement adequate wastewater management and treatment measures in these sectors.
Acknowledgments
For resources for the development of this research, the authors would like to thank the following projects, financed by the General System of Royalties (SGR): “Implementation of a rural citizen network to monitor environmental and biological variables associated with high prevalence diseases in coastal communities of Turbo, Necoclí, Arboletes and San Juan de Urabá—Red COCO, Department of Antioquia” (BPIN-2021000100254) and “Urabá biodiversa. Dissemination and social appropriation of knowledge on biodiversity in Urabá Antioquia” (BPIN-2020000100304). Additionally, the authors would also like to thank microbiologist María Alejandra Carrillo for her contributions.
Conflicts of Interest
The authors declare no conflict of interest.
Abbreviations
| TC | Total coliforms |
| TTC | Thermotolerant coliforms |
| °C | Centigrade degrees |
| SD | Standard deviation |
| GISMAC | Marine and coastal systems research group |
| IDEAM | Colombian Institute of Hydrology, Meteorology and Environmental Studies (Instituto de hidrología, meteorología y estudios ambientales de Colombia). |
| mL | Milliliter |
| mm/month | Millimeters per month |
| mg/L | Milligrams per liter |
| MPN | Most Probable Number |
| MPN/100mL | Most Probable Number per 100 milliliters |
| DO | Dissolved oxygen |
| TDS | Total dissolved solids |
References
- Peters. N. E., Meybeck. M., & Chapman. D. V. Effects of Human Activities on Water Quality. In M. G. Anderson & J. J. McDonnell (Eds.). Encyclopedia of Hydrological Sciences (1st ed.). Wiley. 2005. [CrossRef]
- Hale, R.L., Grimm, N.B., Vörösmarty, C.J., & Fekete, B. (2015). Nitrogen and phosphorus fluxes from wátersheds of the northern U.S. from 1930 to 2000: Role of anthropogenic nutrient inputs, infrastructure, and runoff. Global Biochemical Cycles. 2015. 29 (3): 341-356. [CrossRef]
- Derfoufi, H., Legssyer, M., Belbachir, C., & C., & Legssyer, B. Effect of physicochemical and microbiological parameters on the water quality of wadi Zegzel. Materials Today: Proceedings, 2019, 13, 730-738. [CrossRef]
- Camara, M., Jamil, N. R., & Abdullah, A.F.B. Impact of land uses on water quality in Malaysia: a review. Ecol Process, 2019, 8, 10. [CrossRef]
- Chester, R. (1990). The transport of material to the oceans: the river pathway. Marine Geochemistry. Springer, Dordrecht, 1990. [CrossRef]
- Umaña. G. Characterization of some Golfo Dulce drainage basin rivers (Costa Rica). Rev. Biol. Trop, 1998, 46, 125-135.
- Calvo. G., & Mora. J. Preliminary evaluation and classification of water quality in the Tárcoles and Reventazón river basins. Part IV: Statistical analysis of variables related to water quality. Tecnología en Marcha, 2009, 22, 57-64.
- du Plessis, A. Persistent degradation: Global water quality challenges and required actions. One Earth, 2022, 5 (2): 129-131. [CrossRef]
- Ciobotaru, A. Influence of human activities on water quality of rivers and groundwaters from Brǎila Country. Annals of the University of Oradea, Geography Series, 2015, 5-13.
- Gianoli, A., Hung, A., & Shiva, C. Relationship between total and thermotolerant coliforms with water physicochemical factors in six beaches of Sechura-Piura bay 2016-2017. Salud y Tecnología Veterinaria, 2018, 2: 62-71. [CrossRef]
- Covich, A.P., Austen, M.C., Bärlocher, F., Chauvet, E., Cardinale, B.J., Biles, C.L., Inchausti, P., Dangles, O., Solan, M., Gessner, M.O., Statzner, B., & Moss, B. The role of biodiversity in the functioning of freshwater and marine benthic ecosystems. BioScience, 2004, 54(8), 767-775. [CrossRef]
- Faghihinia, M., Xu, Y., Liu, D., & Wu, N. Freshwater biodiversity at different habitats: Research hotspots with persistent and emerging themes. Ecological Indicators, 2021, 129, 107926. [CrossRef]
- Banerjee, A., Chakrabarty. M., Rakshit, N., Bhowmick, A. R., & Ray, S. Environmental factors as indicators of dissolved oxygen concentration and zooplankton abundance: Deep learning versus traditional regression approach. Ecological Indicators, 2019, 100. 99-117. [CrossRef]
- Jadhav, D.A., Chendake, A.D., Ghosal, D., Mathuriya, A.S., Kumar, S.S., & S. Pandit. Chapter 6—Advanced microbial fuel cell for biosensor applications to detect quality parameters of pollutants. Bioremedation, Nutrient, and Other Valuable Produc Recovery, Elsevier, 2021, 125-139. [CrossRef]
- Braga, F.H.R., Dutra, M.L.S., Lima, N.S., Silva, G.M., Miranda, R.C.M., Firmo, W.C.A., Moura, A.R.L., Monteiro, A.S., Silva, L.C.N., Silva, D.F., & Silva, M.R.C. Study of the Influence of Physicochemical Parameters on the Water Quality Index (WQI) in the Maranhão Amazon. Brazil. Water, 2022, 14(10). 1546. [CrossRef]
- Vazquez Zapata. G., Herrera. L., Cantera. J., Galvis. A., Cardona. D., & Hurtado. I. METHODOLOGY TO DETERMINE EUTROPHICATION LEVELS IN AQUATIC ECOSYSTEMS. Journal of the Colombian Association of Biological Sciences, 2012, 24. 112-128. https://www.revistaaccb.org/r/index.php/accb/article/view/81/81.
- Aristizabal-Tique, V.H., Gomez-Gallego, D.D., Ramos-Hernandez, I.T., Arcos-Arango, Y., Polanco-Echeverry, D.N., & Velez-Hoyos, F.J. Assessing the Physicochemical and Microbiological Condition of Surface Waters in Urabá-Colombia: Impact of Human Activities and Agro-Industry. Water Air Soil Pollut, 2024, 235:260. [CrossRef]
- Ricaurte-Villota. C., & Bastidas. M. Oceanographic regionalisation: A dynamic vision of the Caribbean. Marine and Coastal Research Institute José Benito Vives De Andréis (INVEMAR). INVEMAR Special Publications Series#14. Santa Marta, Colombia, 2017, 180. https://www.invemar.org.co/en/publicaciones.
- Toro-Valencia, V. G., Mosquera, W., Barrientos, N., & Bedoya, Y. (2019). Circulación oceánica del golfo de Urabá usando campos de viento de alta resolución temporal. Boletín científico CIOH, 38(2), 41-56. [CrossRef]
- Roldan. P., Gómez. E., & Toro. F. Mean circulation pattern in Colombia Bay in the two extreme climatic epochs. XXIII Latin American Hydraulics Congress. Postgraduate thesis. School of Geosciences and Environment. National University of Colombia. September 2008, 12. https://repositorio.unal.edu.co/bitstream/handle/unal/8096/Roldan.Toro.pdf?sequence=1&isAllowed=y.
- Campillo, A., Taupin, J. D., Betancur, T., Patris, N., Vergnaud,V., Paredes, V., & Villegas, P. (2021). A multi-tracer approach for understanding the functioning of heterogeneous phreatic coastal aquifers in humid tropical zones. Hydrological Sciences Journal, 2021, 66(4), 600-621. [CrossRef]
- American Public Health Association (APHA) (2005) Standard Methods for the Examination of Water and Wastewater Analysis. American Water Works Association/Water Environment Federation. Washington DC. 289.
- Masindi, T. K., Gyedu-Ababio, T., & Mpenyana-Monyatsi, L. Pollution of Sand River by Wastewater Treatment Works in the Bushbuckridge Local Municipality, South Africa. Pollutants. 2022, 2(4):510-530. [CrossRef]
- Ríos-Tobón, S., Agudelo-Cadavid, R.M., & Gutiérrez-Builes, L.A. Pathogens and microbiological indicators of water quality for human consumption. Revista Facultad Nacional de Salud Pública, 2017, 35(2). 236-247. [CrossRef]
- Griffin, N.J.; Palmer, C.G.; Scherman, P.A. Critical Analysis of Environmental Water Quality in South Africa: Historic and Current Trends Report to the Water Research Commission; Water Research Commission: Pretoria, South Africa, 2014.
- Bienfang, P. K., Defelice, S. V., Laws, E. A., Brand, L. E., Bidigare, R. R., Christensen, S., Trapido-Rosenthal, H., Hemscheidt, T. K., McGillicuddy, D. J., Anderson, D. M., Solo-Gabriele, H. M., Boehm, A. B., & Backer, L.C. Prominent human health impacts from several marine microbes: history, ecology, and public health implications. International Journal of Microbiology. 2011, 20111-115. htpps://doi: 10.1155/2011/15281.
- Caissie, D. The thermal regime of rivers: A review. Freshwater Biology, 2006, 51, 1389-1406.
- Evans, E. C., Mcgregor, G. R., & Petts, G. E. (1998). River energy budgets with special reference to river bed processes. Hydrological Processes, 1998. 12, 575-595.
- Johnson, M. F., Albertson, L. K., Algar, A. C., Dugdale, S. J., Edwards, P., England, J., Gibbins, C., Kazama, S., Komori, D., MacColl, A. D. C., Scholl, E. A., Wilby, R. L., de Oliveira Roque, F., & Wood, P. J. Rising water temperature in rivers: Ecological impacts and future resilience. WIREs Water, 2024, 11(4), e1724. [CrossRef]
- Webb, B.W., Hannah, D.M., Moore, R.D., Brown, L.E., & Nobilis, F. Recent advances in stream and river temperature research. Hydrological Processes, 2008, 22(7), 902-918. [CrossRef]
- Webb, B. W.; Clack, P. D.; Walling, D. E. Water-air temperature relationships in a Devon River system and the role of flow. Hydrological Process. 2003, 17, 3069-3084.
- Mohseni, O.; Stefan, H.G. Stream temperature/air temperature relationship: A physical interpretation. Journal or Hydrology. 1999, 218, 128-141.
- Larrea-Murrell, J. A., Rojas-Badía, M. M., Romeu-Álvarez, B., Rojas-Hernández, N. M., & Heydrich-Pérez, M. Bacterias indicadoras de contaminación fecal en la evaluación de la calidad de las aguas: revisión de la literatura. Revista CENIC. Ciencias Biológicas, 2013, 44(3), 24-34.
- World Metrological Organization—WMO. Update predicts 60% chance of La Niña. Press Release. 11 september 2024. https://wmo.int/news/media-centre/wmo-update-predicts-60-chance-of-la-nina.
- Ruiz, J.F., & Melo, J.Y. Informe de Predicción Climática a corto, mediano y largo plazo en Colombia. Grupo de Modelamiento de Tiempo y Clima, Subdirección de Meteorología—IDEAM. Mayo de 2024. 12 pp.
- Ortiz Trujillo, J., Ramos De La Hoz, I., & Garavito Mahecha, J. D. (2023). Boletín Meteomarino Mensual del Caribe Colombiano No.131 / Noviembre de 2023. Cartagena de Indias D.T. y C., Colombia: Dirección General Marítima. https://cecoldodigital.dimar.mil.co//3369/3/dimarcioh_2339-4099_2023_bol_meteomarino_caribe_131.pdf.
- Ortiz Trujillo, Jonnatan and Llorente Valderrama, Alder De Jesús. (2024). Boletín Meteomarino Mensual del Caribe Colombiano No.133 / Enero de 2024. Cartagena de Indias D.T. y C., Colombia: Dirección General Marítima. https://cecoldodigital.dimar.mil.co//3425/1/dimarcioh_2339-4099_2023_bol_meteomarino_caribe_133.pdf.
- Llorente Valderrama, Alder de Jesús and Ramos De La Hoz, Isabel and Garavito Mahecha, José David. (2024). Boletín Meteomarino Mensual del Caribe Colombiano No.136 / Abril de 2024. Cartagena de Indias D.T. y C., Colombia: Dirección General Marítima. https://cecoldodigital.dimar.mil.co//3527/1/dimarcioh_2339-4099_2024_bol_meteomarino_caribe_136.pdf.
- Ortiz Trujillo, J. A., Ramos De La Hoz, I., & Garavito Mahecha, J. D. (2024). Boletín Meteomarino Mensual del Caribe Colombiano No.140 / Agosto de 2024. Cartagena de Indias D.T. y C., Colombia: Dirección General Marítima. https://cecoldodigital.dimar.mil.co//3557/1/dimarcioh_2339-4099_2024_bol_meteomarino_caribe_140.pdf.
- Centro de Investigaciones Oceanográficas e Hidrográficas del Caribe -CIOH. Derrotero de las costas y áreas insulares del Caribe colombiano. 2020. Tomo 1. Cartagena—Colombia.
- Poole. G.C., & Berman. C.H. An Ecological Perspective on In-Stream Temperature: Natural Heat Dynamics and Mechanisms of Human-CausedThermal Degradation. Environmental Management, 2001, 27(6). 787-802. [CrossRef]
- Pérez-Castillo, A.C., & Rodríguez, A. Physicochemical index of water quality for the management of tropical flooded lagoons. Revista de Biología Tropical, 2008, 56 (4): 1905-1918.
- Shrestha, A. K., & Basnet, N. B. The correlation and regression analysis of physicochemical parameters of river water for the evaluation of percentage contribution to electrical conductivity. Journal of Chemistry. 2018:9, 8369613.
- Fusi, M., Daffonchio, D., Booth, J., & Giomi, F. Dissolved Oxygen in Heterogeneous Environments Dictates the Metabolic Rate and Thermal Sensitivity of Tropical Aquatic Crab. Frontiers in Marine Science. 2021, 8. [CrossRef]
- Muñoz. H., Orozco. S., Vera. A., Suárez. J., García. E., Mercedes. N., & Jiménez, J. Relationship between dissolved oxygen, rainfall and temperature: Zahuapan river. Tlaxcala. Mexico. Tecnología y ciencias del agua, 2015, 6(5). 59-74.
- Roslev. P., Bjergbaek. L. A., & Hesselsoe, M. Effect of oxygen on survival of faecal pollution indicators in drinking water. Journal of Applied Microbiology. 2004, 96(5). 938-45. [CrossRef]
- McFeters, G. A. (Ed.). Drinking Water Microbiology, Springer, New York, NY. 1990, 3-31.
- Benjumea Hoyos, C. A., & Álvarez Montes, G. Oxygen demand by sediments in different stretches of the Negro Rionegro River. Antioquia. Colombia. Producción + Limpia, 2017, 12(2). 131-146.
- Martínez. S. A., & Pardo, G. A. S. S. Evaluation of the impact of domestic wastewater discharges. Through the application of the contamination index (ICOMO) in Caño Grande. Located in Villavicencio-Meta. Undergraduate. Faculty of Environmental Engineering. Santo Tomas. 2018. Colombia. http://hdl.handle.net/11634/14218.
- 49 Olds, H.T.; Corsi, S.R.; Dila, D.K.; Halmo, K.M.; Bootsma, M.J.; McLellan, S.L. High levels of sewage contamination released from urban areas after storm events: A quantitative survey with sewage specific bacterial indicators. PLoS Med. 2018, 15, e1002614.
- Onifade, O.; Lawal, Z.K.; Shamsuddin, N.; Abas, P.E.; Lai, D.T.C.; Gӧdeke, S.H. Impact of Seasonal Variation and Population Growth on Coliform Bacteria Concentrations in the Brunei River: A Temporal Analysis with Future Projection. Water 2025, 17, 1069. [CrossRef]
- National Institute of Health. Public health surveillance protocol. Morbidity due to acute diarrhoeal disease. National Institute of Health. 2024. [CrossRef]
- Kadlec RH, Wallace SD. 2009. Treatment Wetlands. In: Ahumada-Santos, Y. P., Báez-Flores, M. E., Díaz-Camacho, S. P., Uribe-Beltrán, M. J., López-Angulo, G., Vega-Aviña, R., Chávez-Duran, F. A., Montes-Avila, J., Carranza-Díaz, O., Möder, M., Kuschk, P., & Delgado-Vargas, F. Distribución espaciotemporal de la contaminación bacteriana del agua residual agrícola y doméstica descargada a un canal de drenaje (Sinaloa, México). Ciencias marinas, 2014, 40(4), 277-289. [CrossRef]
- Kulkarni. S. A Review on Research and Studies on Dissolved Oxygen and Its Affecting Parameters. International Journal of Research and Review, 2016, 3. 18-22. https://www.ijrrjournal.com/IJRR_Vol.3_Issue.8_Aug2016/IJRR004.pdf.
- Kitsiou, D., & Karydis, M. Coastal marine eutrophication assessment: A review on data analysis. Environment International, 2011, 37 (4). 778–801. [CrossRef]
- Tao, Y., Yu, J., Lei, G., Xue, B., Zhang, F., & Yao, S. Indirect influence of eutrophication on air—water exchange fluxes, sinking fluxes, and occurrence of polycyclic aromatic hydrocarbons. Water Research., 2017, 122, 512-525. [CrossRef]
- Testa, J. M., Carstensen, J., Laurent, A., & Li, M. (2023) Hypoxia and Climate Change in Estuaries. In: Kennish, M.J., Eutrophication of Estuarine and Coastal Marine Environments: An Emerging Climatic-Driven Paradigm Shift. Open Journal of Ecology, 2025, 15(4), 289-324. [CrossRef]
- Rabalais, N. N., Cai, W. J., Carstensen, J., Conley, D. J., Fry, B., Hu, X., Quiñones-Rivera, Z., Rosenberg, R., Slomp, C. P., Turner, R. E., Voss, M., Wissel, B., & Zhang, J. Eutrophication-driven deoxygenation in the coastal ocean. Oceanography., 2014, 27(1):172–183. [CrossRef]
- Arcos Pulido, M. P., Ávila de Navia, S. L., Estupiñán Torres, S. M., & Gómez Prieto, A. C. Indicadores microbiológicos de contaminación de las fuentes de agua. Nova- Publicación Científica, 2005; 3 (4): 69–79. http://www.unicolmayor.edu.co/invest_nova/NOVA/ARTREVIS2_4.pdf.
- Rivera Gutiérrez, J. V. Determinación de las tasas de oxidación, nitrifícación y sedimentación en el proceso de autopurificación de un río de montaña. Ingeniare. Revista chilena de ingeniería, 2016, 24(2): 314-326. [CrossRef]
- Pauta-Calle, G., Velazco, M., Gutiérrez, D., Vázquez, G., Rivera, S., Morales, O., & Abril, A. Water quality assessment of rivers in the city of Cuenca in Ecuador. Maskana, 2019, 10 (2). 76-88. http://doi: 10.18537/mskn.10.02.08.
- Salinas, N., Briones, N., Quiroz, S., Peña, D., & Ortiz, Y. Characterization and Analysis of Water Quality in Urban Environments through the implementation of an Embedded System with IoT Technology. Revista Tecnológica ESPOL—RTE, 2024, 36(1). [CrossRef]
- Sánchez, A., Vásquez, M., & Velandia, G. Evaluation of the microbiological quality of water for human consumption in the villages of El Alto del Águila and El Tunal in the municipality of Zipaquirá. Cundinamarca. Undergraduate thesis. Repositorio Universidad Colegio Mayor de Cundinamarca. Colombia. https://repositorio.universidadmayor.edu.co/bitstream/handle/unicolmayor/5719/Documento%20Proyecto%20de%20Grado.pdf?sequence=14&isAllowed=y.
Figure 1.
Location of the study area, and sampling sites in the water bodies in Urabá.
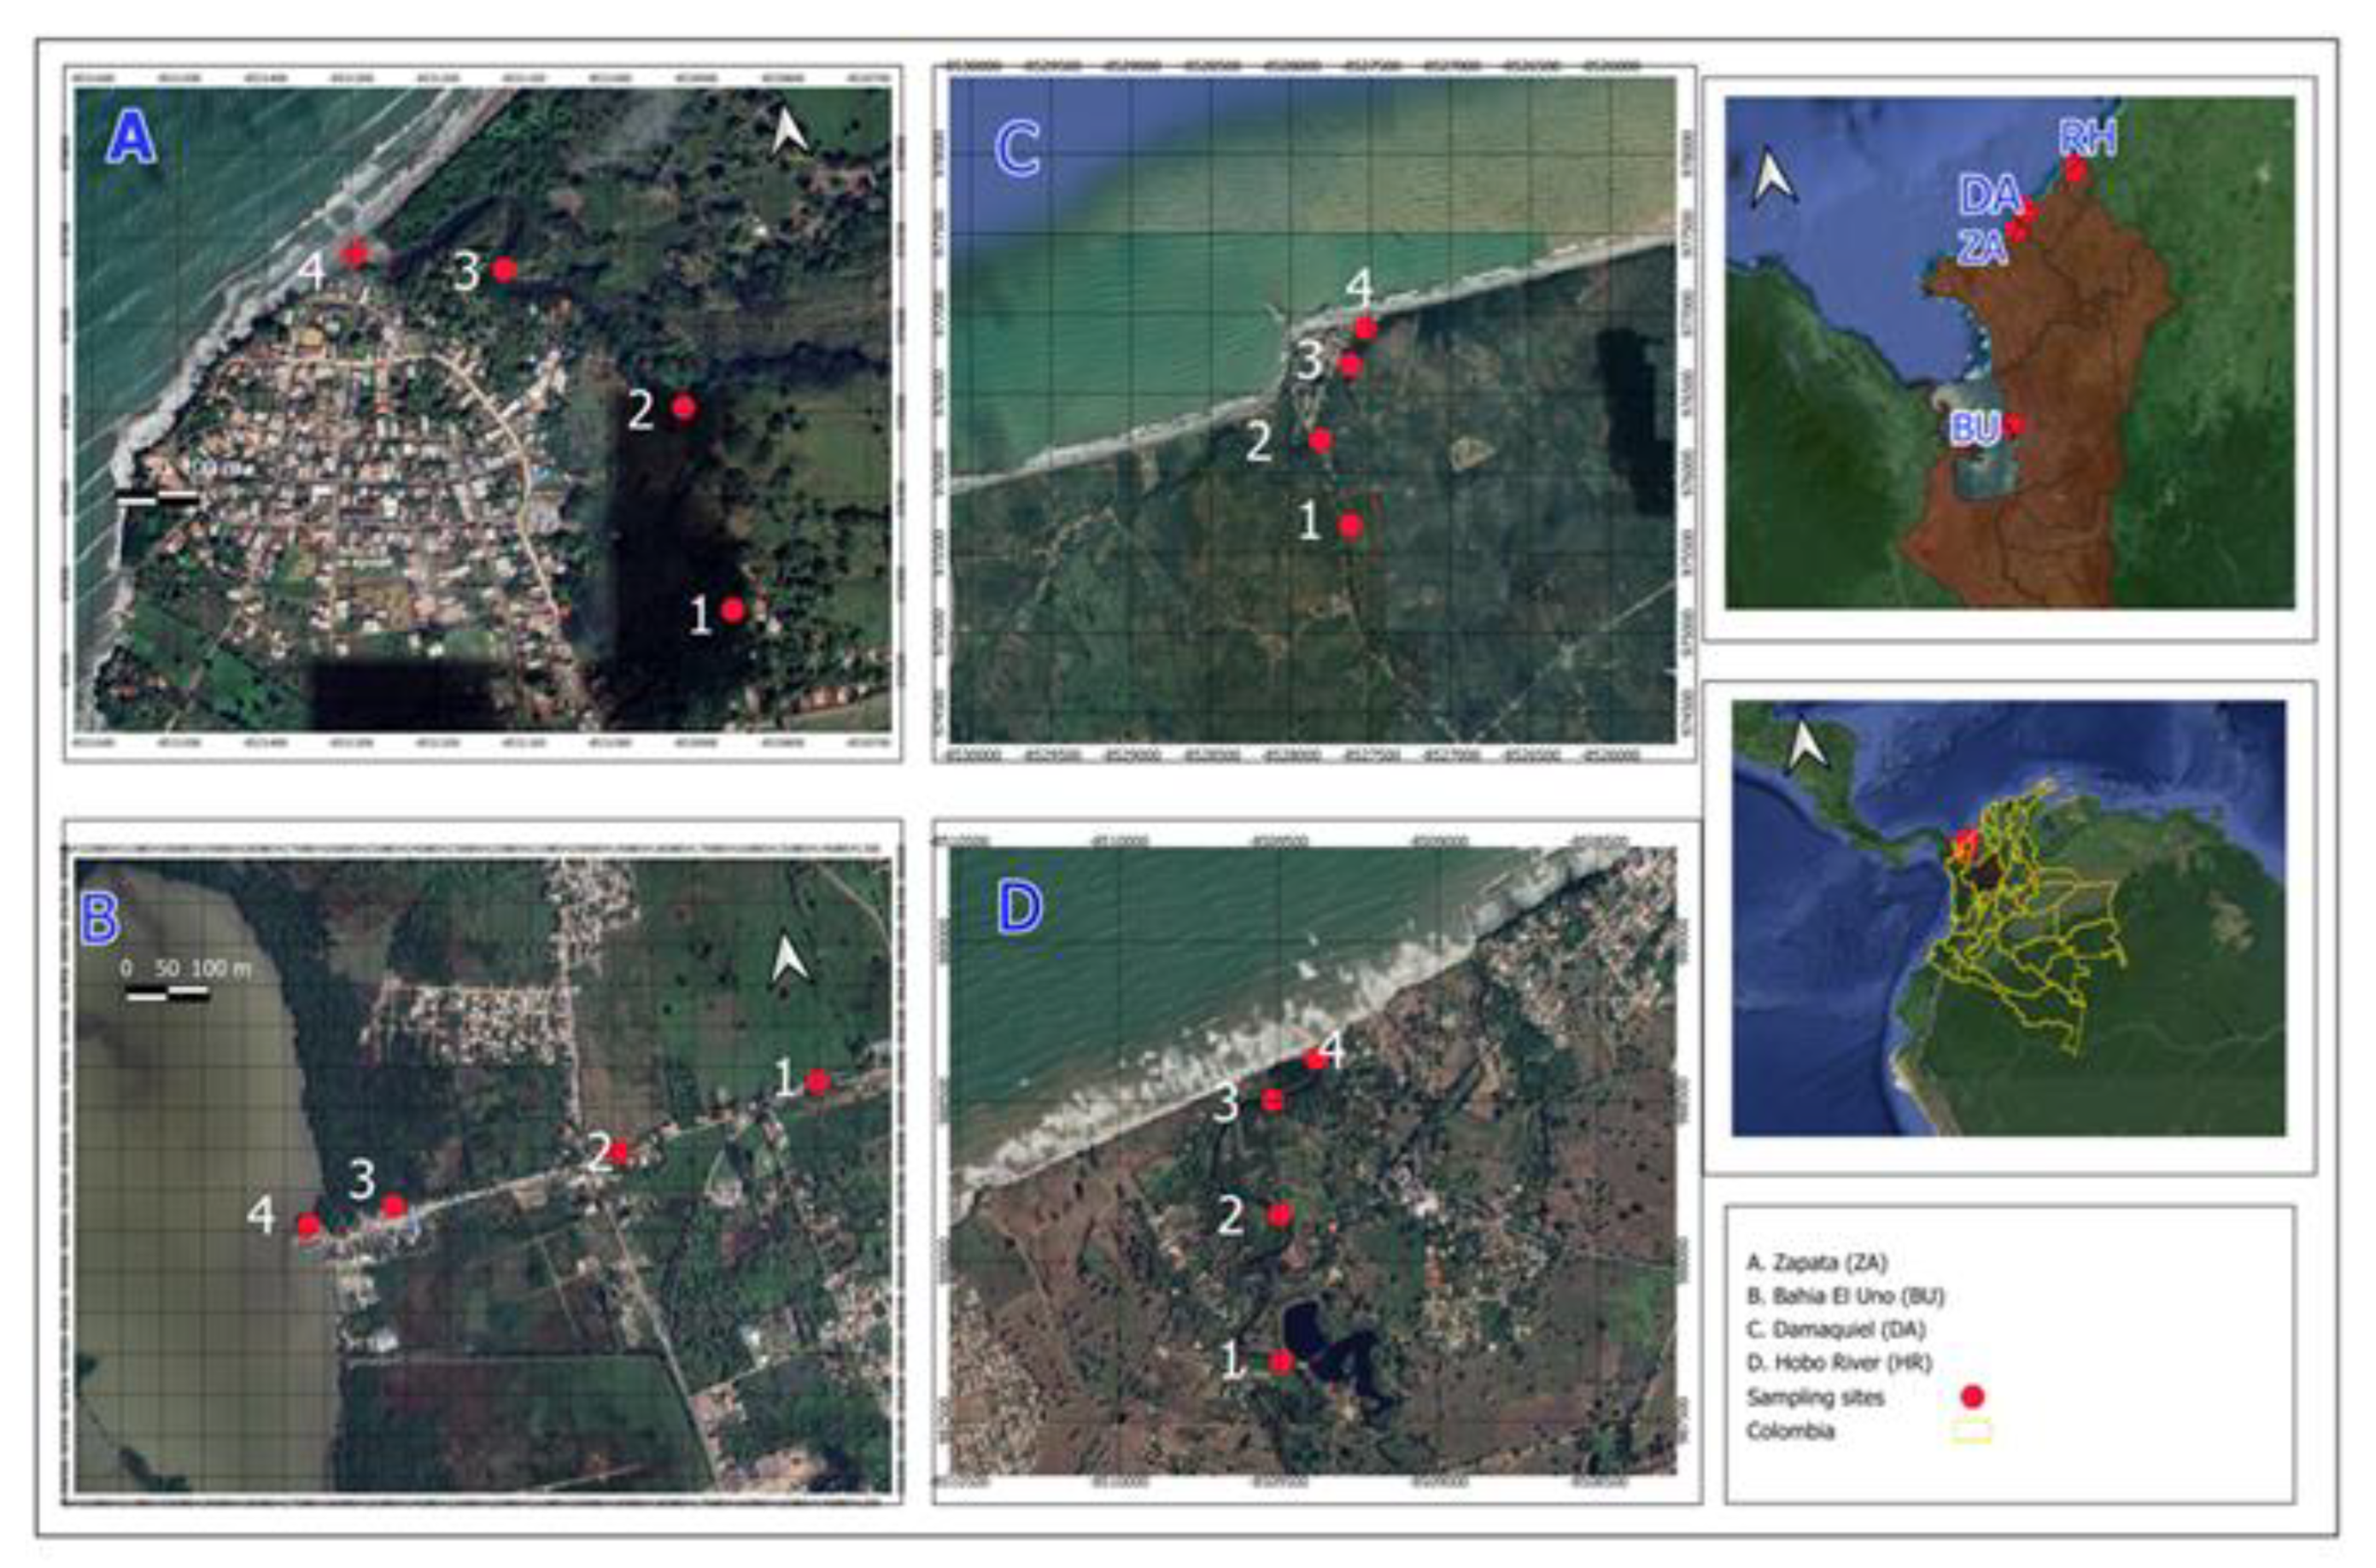
Figure 2.
Distribution of physicochemical parameters recorded at the sampling sites. a) temperature (°C), b) dissolved oxygen (mg/L), c) pH, d) total dissolved solids (mg/L).
Figure 2.
Distribution of physicochemical parameters recorded at the sampling sites. a) temperature (°C), b) dissolved oxygen (mg/L), c) pH, d) total dissolved solids (mg/L).
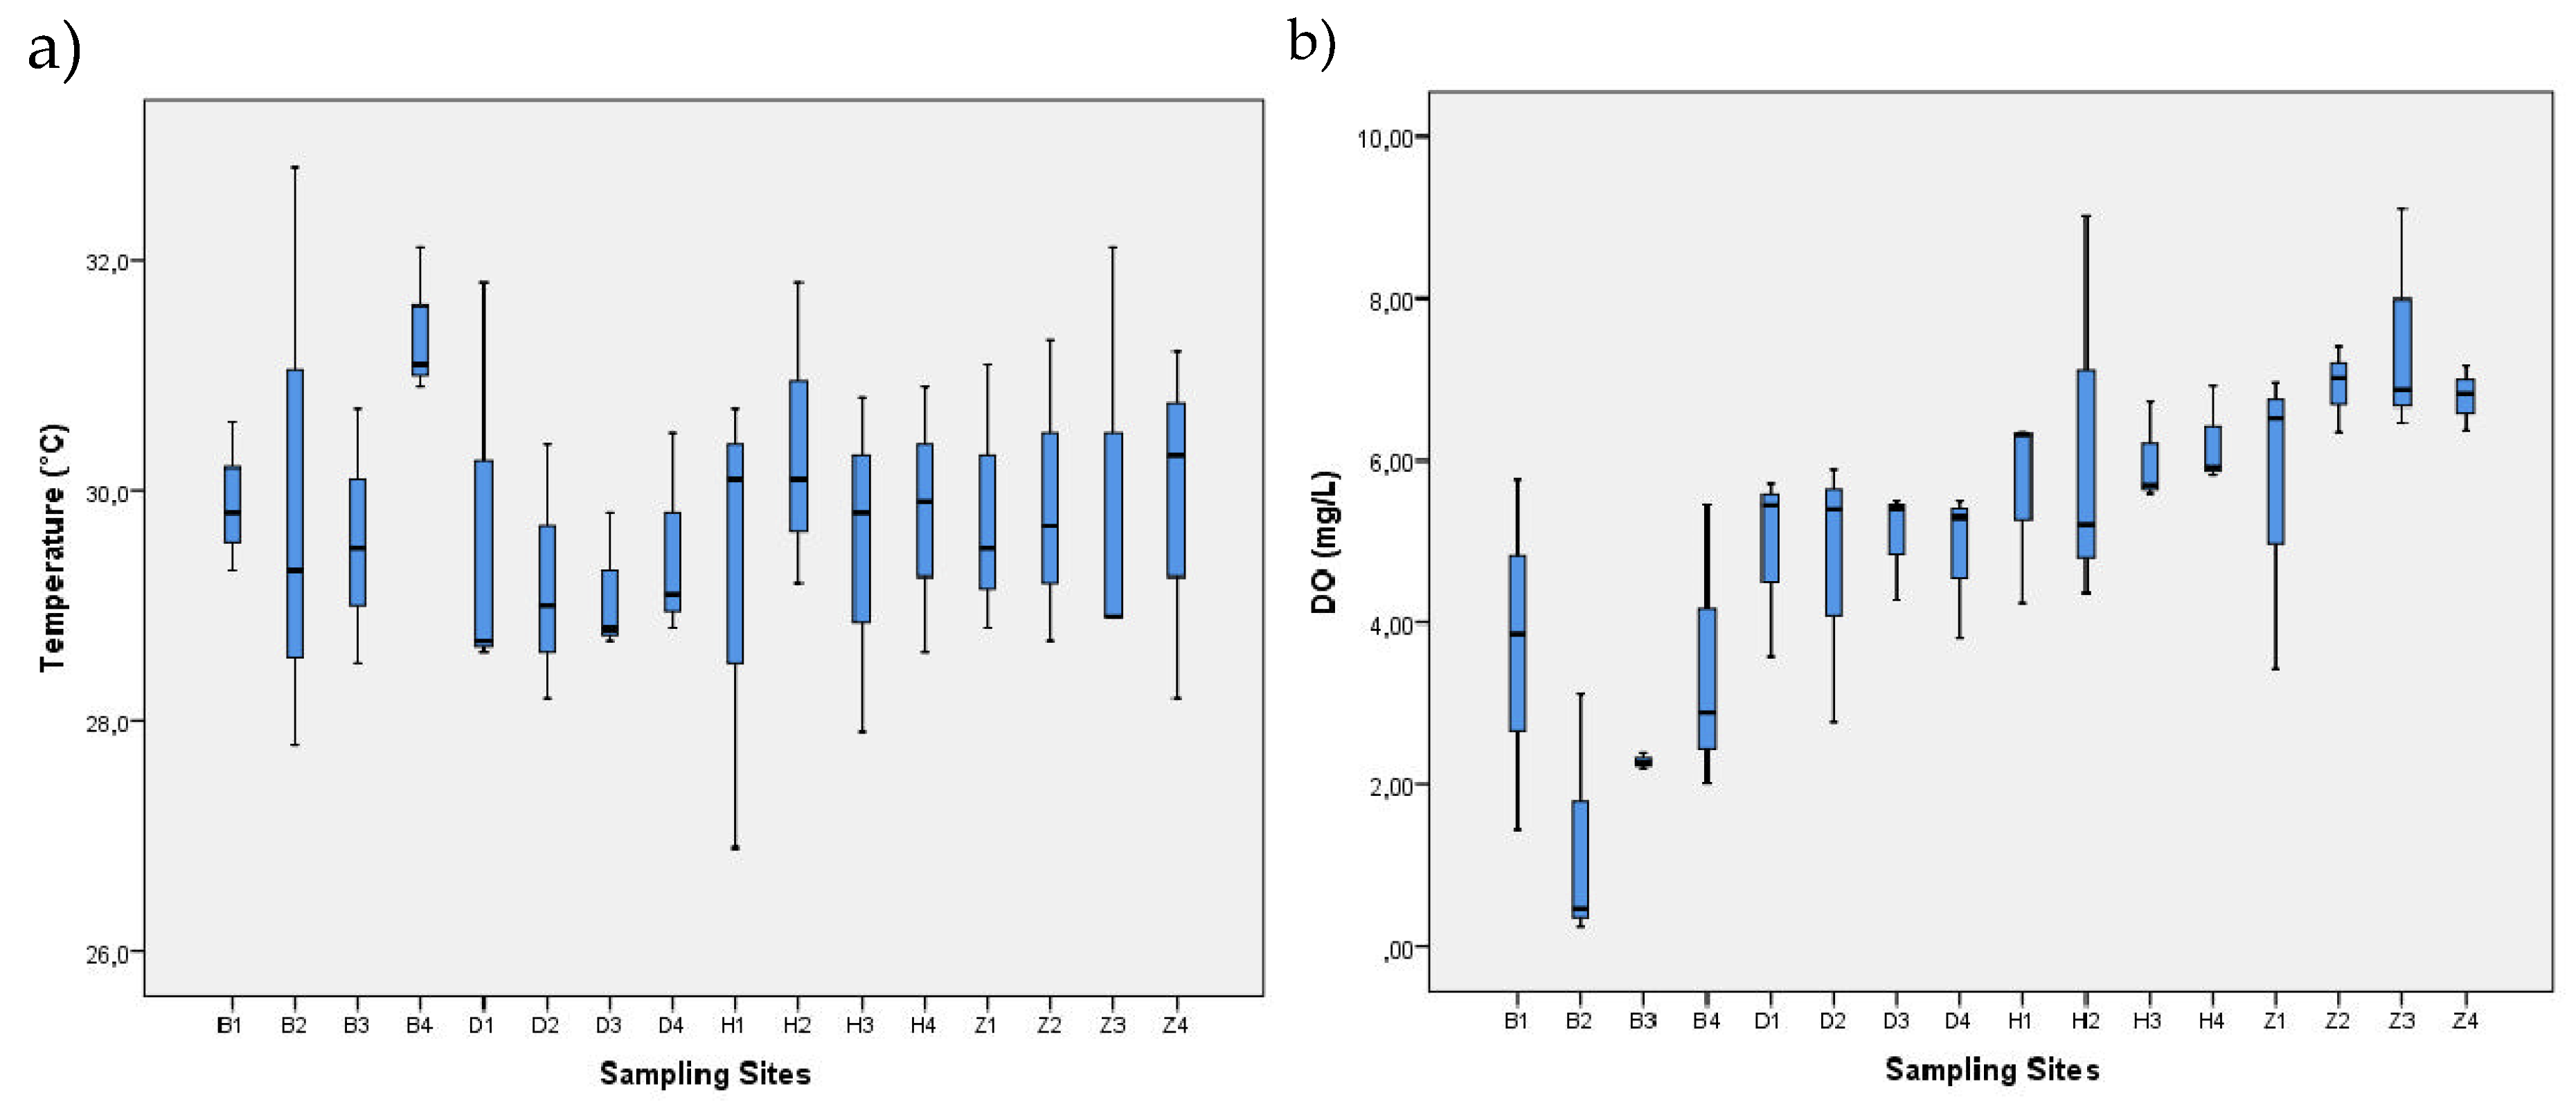
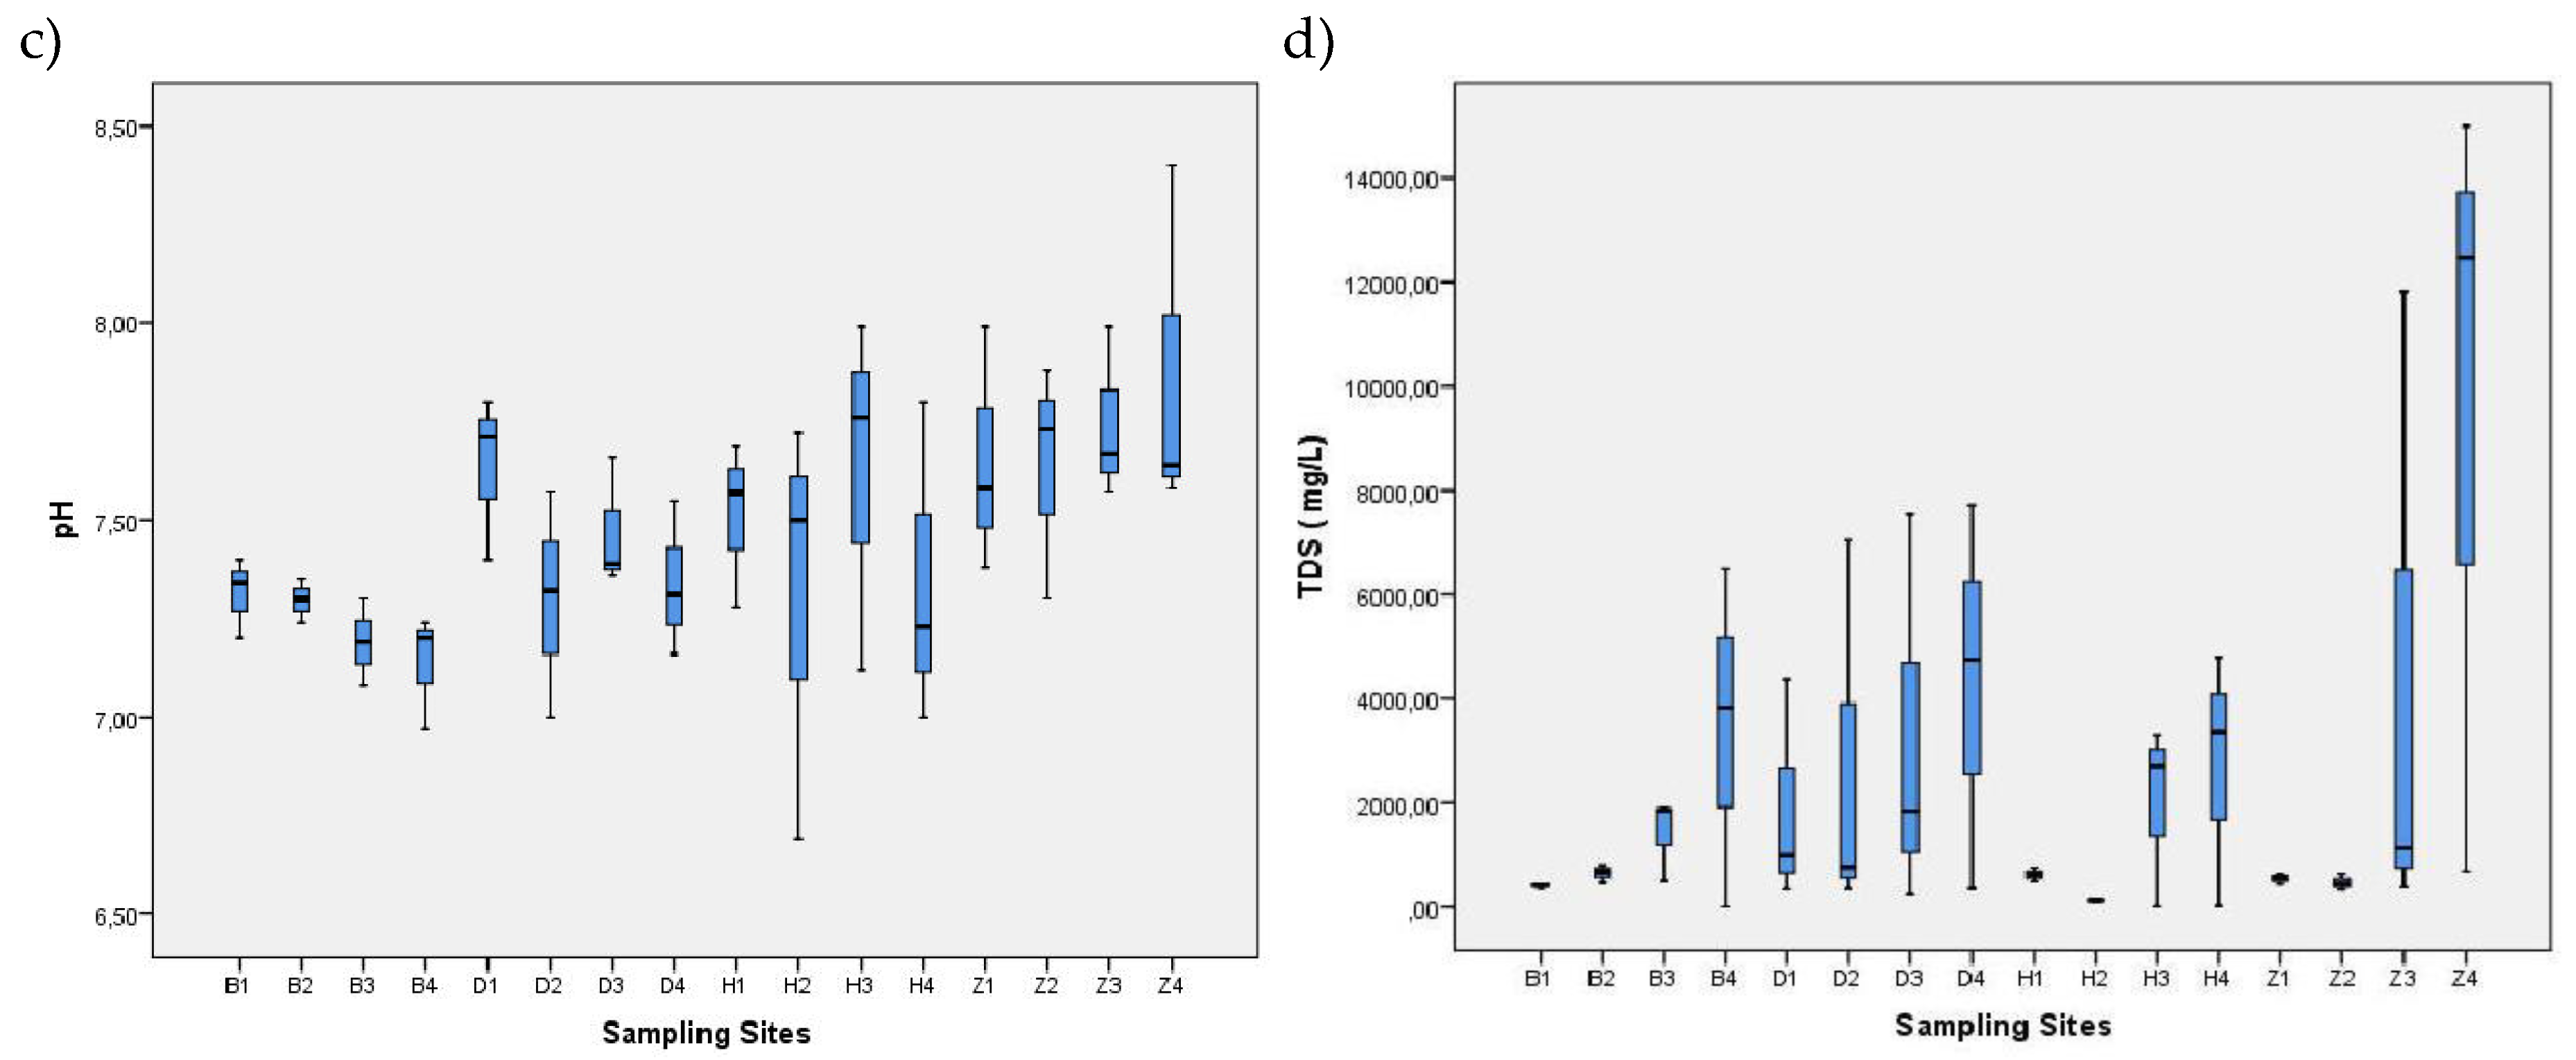
Figure 3.
Distribution of coliforms recorded at the sampling sites. a) thermotolerant coliforms (MPN/100 mL), b) total coliforms (MPN/100 mL).
Figure 3.
Distribution of coliforms recorded at the sampling sites. a) thermotolerant coliforms (MPN/100 mL), b) total coliforms (MPN/100 mL).
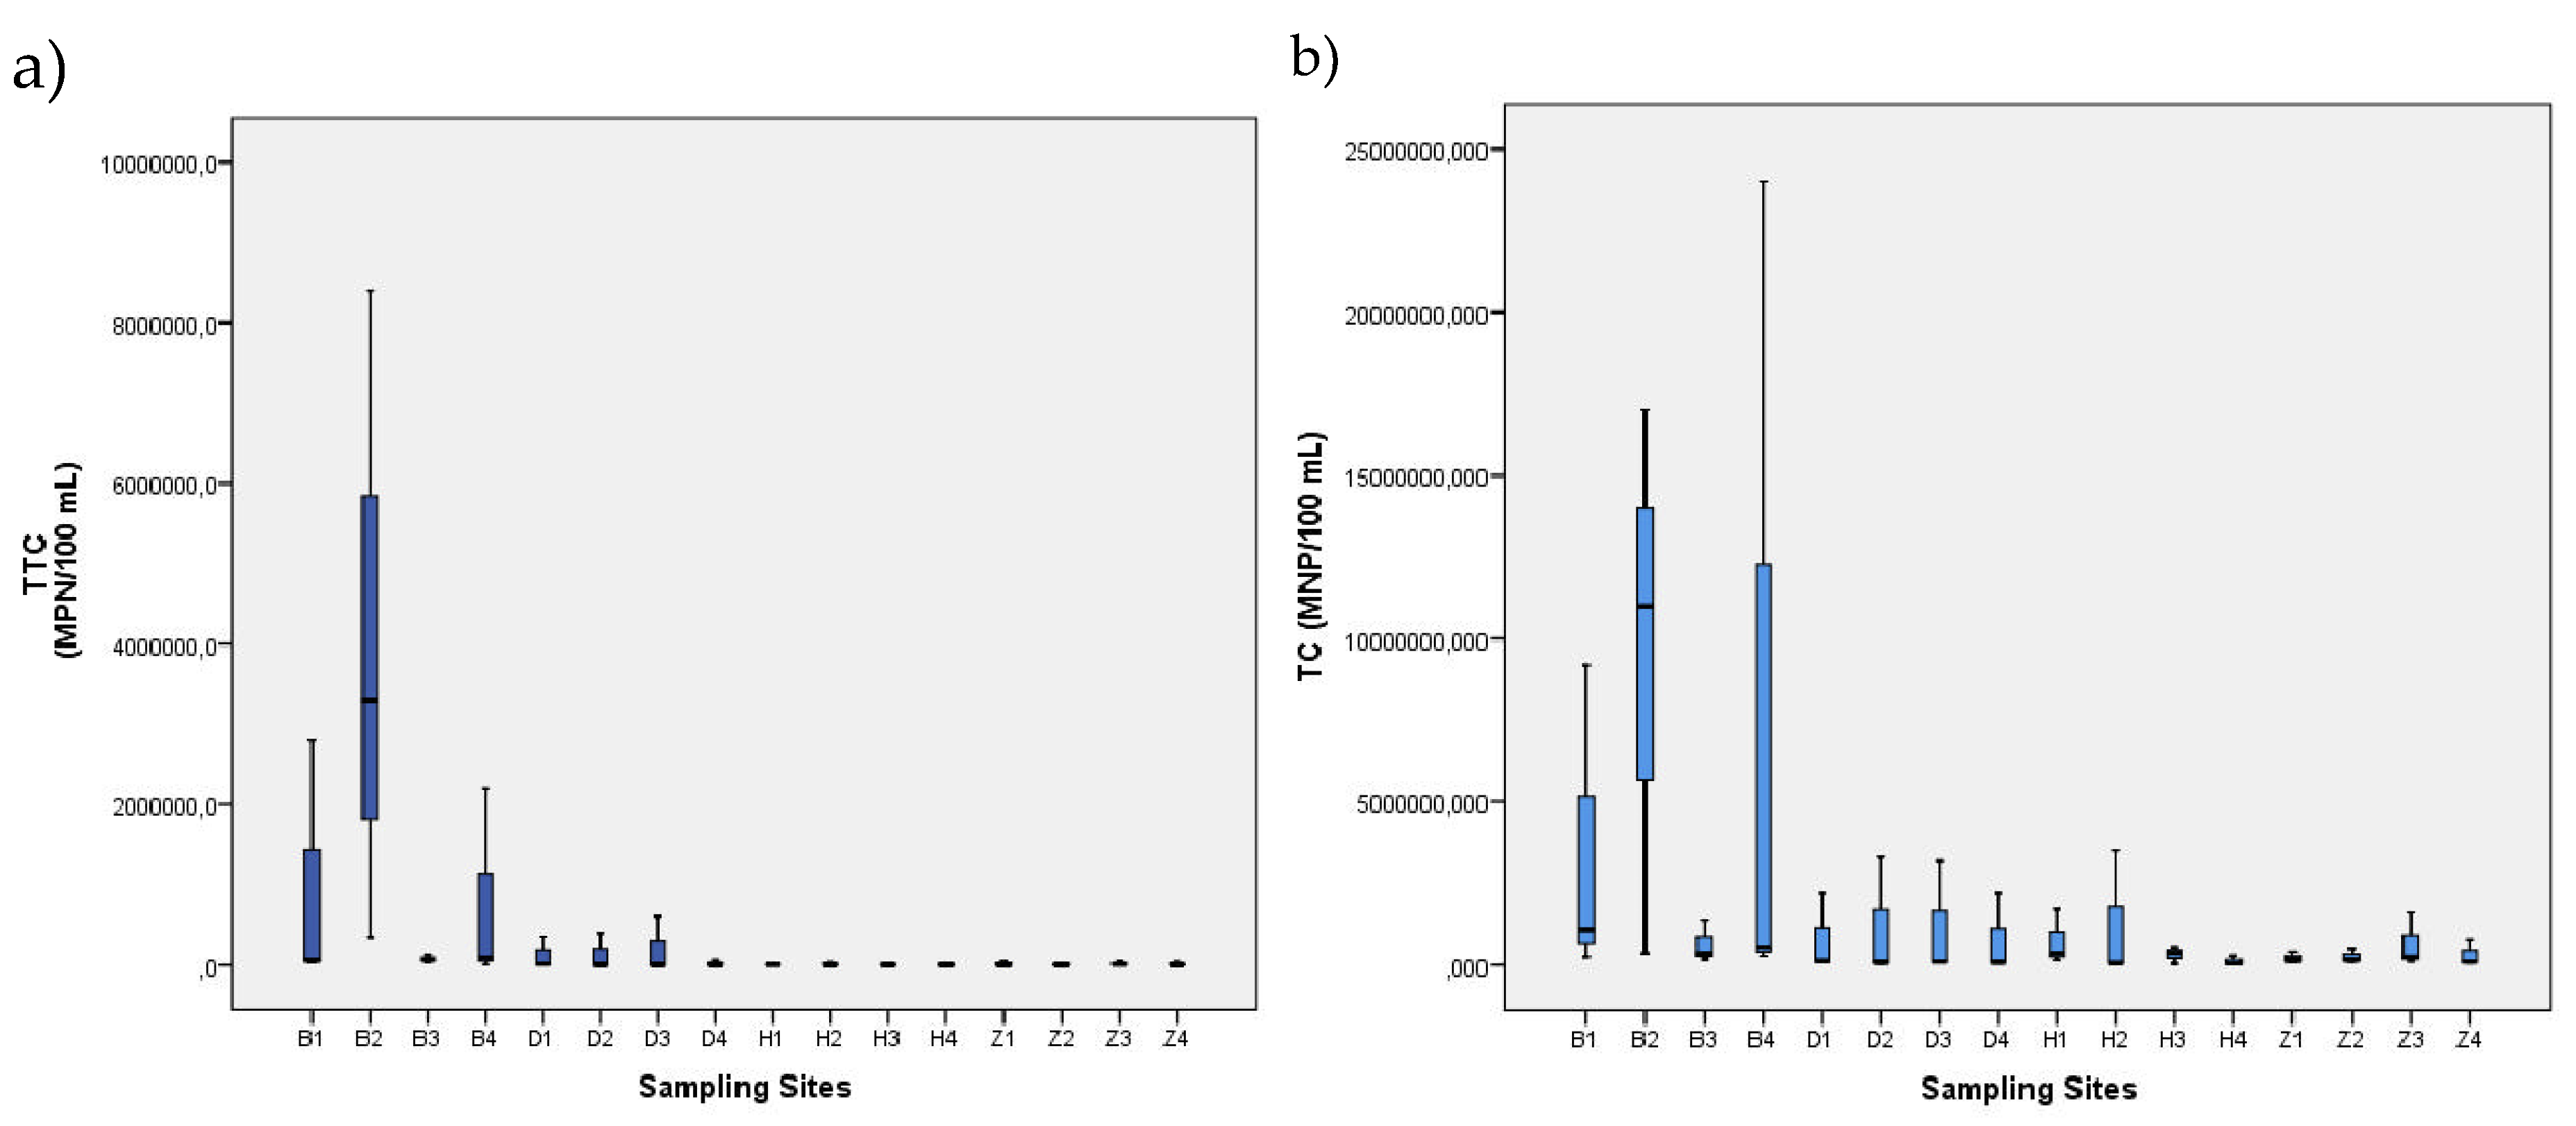

Table 1.
Location of sampling sites.
| Water body | Site location | Coordinates | |
|---|---|---|---|
| Bahia el Uno | B1 | Before the entrance to Bahia el Uno | 8°06′46”- 76° 43′22” |
| B2 | New canal—before the entrance to Bahía el Uno | 8°06′8.276”-76°43′38.5” | |
| B3 | Caño el Uno* | 8°06′31”- 76° 44′11” | |
| B4 | River mouth | 8°06′18”- 76° 44′20” | |
| Zapata River | Z1 | Upstream, away from the entrance to Zapata | 8°40′328”- 76° 37′59” |
| Z2 | Before entering to Zapata | 8°40′36”- 76° 38′42” | |
| Z3 | Zapata* | 8°40′33”- 76° 38′02” | |
| Z4 | River mouth | 8°44′10.0”-76°38′15” | |
| Hobo River | H1 | Upstream before the entrance to Hobo River | 8°49′09.7”-76° 26′30.9” |
| H2 | Pond | 8°59′48.6”- 76° 26′17.8” | |
| H3 | Hobo river* | 8°50′44.3”- 76° 26′27.7” | |
| H4 | River mouth | 8°50′45.9”- 76° 26′27.3” | |
| Damaquiel River | D1 | Last stream flowing into the river—Before Damaquiel. | 8°44′10.0”- 76° 36′23.3” |
| D2 | Entrance to the river | 8°44′08.2”- 76° 36′24” | |
| D3 | Damaquiel* | 8°44′22.5”- 76° 36′18.1” | |
| D4 | River mouth | 8°44′30.8”- 76° 36′14.3” | |
*Village centre.
Table 2.
Variation of the physico-chemical parameters assessed at the sampling sites.
| Sampling / Month | Season | Water Temperature (°C) |
Dissolved Oxygen (mg/L) | pH | Total dissolved solids (mg/L) |
Thermotolerant coliforms (MPN/100 mL) | Total coliforms (MPN/100 mL) |
|---|---|---|---|---|---|---|---|
| 1—November | Dry (DS1) | 26.9–30.9 | 0.48–6.53 | 6.69–8.4 | 79.7- 15000 | 780–2200000 | 54000-24000000 |
| 2—January | Dry (DS2) | 29.8–32.8 | 0.25–9.11 | 6.97–7.8 | 125.8–12470 | 360–8400000 | 35000-11000000 |
| 3—April | Wet (WS1) | 27.8–31.1 | 2.27–7.02 | 7.00–7.99 | 3.73–699 | 4000–3300000 | 40000-17000000 |
| 4—August | Wet (WS2) | 29.0–33.7 | 0.26–8.17 | 7.31–7.87 | 98.8–>15000 | 20–6300000 | 78- 9200000 |
| Range | 26.9–33.7 | 0.25–9.11 | 6.69–8.4 | 19.85–>15000 | 78–8400000 | 78- 24000000 | |
| Mean ± SD | 30.0 ± 1.329 | 5.32 ± 2.05 | 7.51 ± 0.30 | 2777 ± 3964 | 399812 ± 1405339 | 1542043 ± 4097424 | |
| Reference | -—- | ˃3.0+ 4.0++ | 4.5–9.0▫ | -—- | ˂200* | 1000** | |
+ Institute of Hydrology, Meteorology and Environmental Studies-IDEAM (2019). ++Criteria for the preservation of Fauna and Flora. (Ministry of Environment and Sustainable Development, Decree 703 of 2018). ▫Water quality criteria for primary contact (Decree 1076 of 2015, Ministry of Environment). *Admissible quality criteria for the end use of the water, for human and domestic consumption (Ministry of Environment and Sustainable Development, Decree 703 of 2018). **Admissible quality criteria for the end use of water, for human and domestic consumption.
Table 3.
Spearman Correlation Analysis for the parameters evaluated.
| Spearman’s Rho | ||||||
|---|---|---|---|---|---|---|
| TTC | TC | OD | TDS | Water Temperature |
||
|
TEC |
Correlation coefficient | 1.000 | .906 | -.495 | -.307 | -.270 |
| Sig. (bilateral) | . | .000 | .000 | .014 | .031 | |
| N | 64 | 64 | 64 | 64 | 64 | |
|
TTC |
Correlation coefficient | .906 | 1.000 | -.484 | -.277 | -.294 |
| Sig. (bilateral) | .000 | . | .000 | .026 | .018 | |
| N | 64 | 64 | 64 | 64 | 64 | |
|
DO |
Correlation coefficient | -.495 | -.484 | 1.000 | -.066 | .017 |
| Sig. (bilateral) | .000 | .000 | . | .607 | .892 | |
| N | 64 | 64 | 64 | 64 | 64 | |
|
SDT |
Correlation coefficient | -.307 | -.277 | -.066 | 1.000 | .365 |
| Sig. (bilateral) | .014 | .026 | .607 | . | .003 | |
| N | 64 | 64 | 64 | 64 | 64 | |
|
Water Temperature |
Correlation coefficient | -.270 | -.294 | .017 | .365 | 1.000 |
| Sig. (bilateral) | .031 | .018 | .892 | .003 | . | |
| N | 64 | 64 | 64 | 64 | 64 | |
Disclaimer/Publisher’s Note: The statements, opinions and data contained in all publications are solely those of the individual author(s) and contributor(s) and not of MDPI and/or the editor(s). MDPI and/or the editor(s) disclaim responsibility for any injury to people or property resulting from any ideas, methods, instructions or products referred to in the content. |
© 2025 by the authors. Licensee MDPI, Basel, Switzerland. This article is an open access article distributed under the terms and conditions of the Creative Commons Attribution (CC BY) license (http://creativecommons.org/licenses/by/4.0/).
Copyright: This open access article is published under a Creative Commons CC BY 4.0 license, which permit the free download, distribution, and reuse, provided that the author and preprint are cited in any reuse.


