
Submitted:
17 June 2025
Posted:
19 June 2025
You are already at the latest version
Abstract
Background/Objectives: This study investigates how seasonality, pollution, and sample type (water and se
diment) influence the presence and distribution of antibiotic resistance genes (ARGs), with a focus on plas
mid-associated resistance in a tropical urban river, a topic still underexplored in these ecosystems.
Methods: Samples were collected from three sites along a pollution gradient in the Virilla River, Costa Rica,
during three seasonal campaigns (wet 2021, dry 2022, and wet 2022). ARGs in water and sediment samples
were quantified using qPCR, and metagenomic sequencing was used to analyze chromosomal and plasmid-
associated resistance profiles in sediments. Tobit and linear regression models, along with multivariate or
dination, evaluated spatial and seasonal trends.
Results: During the wet season 2021, the abundance of sul-1, intl-1, and tetA in water samples decreased sig
nificantly, likely due to dilution, while intl-1 and tetQ increased in sediments, suggesting particle-bound
accumulation. In the wet season 2022, intl-1 remained low in water, qnrS increased, and sediments showed
significant increases in tetQ, tetA, and qnrS, along with decreases in sul-1 and sul-2. Metagenomic analysis
revealed that chromosomal ARGs exhibited strong spatial variation, particularly elevated at the most pol
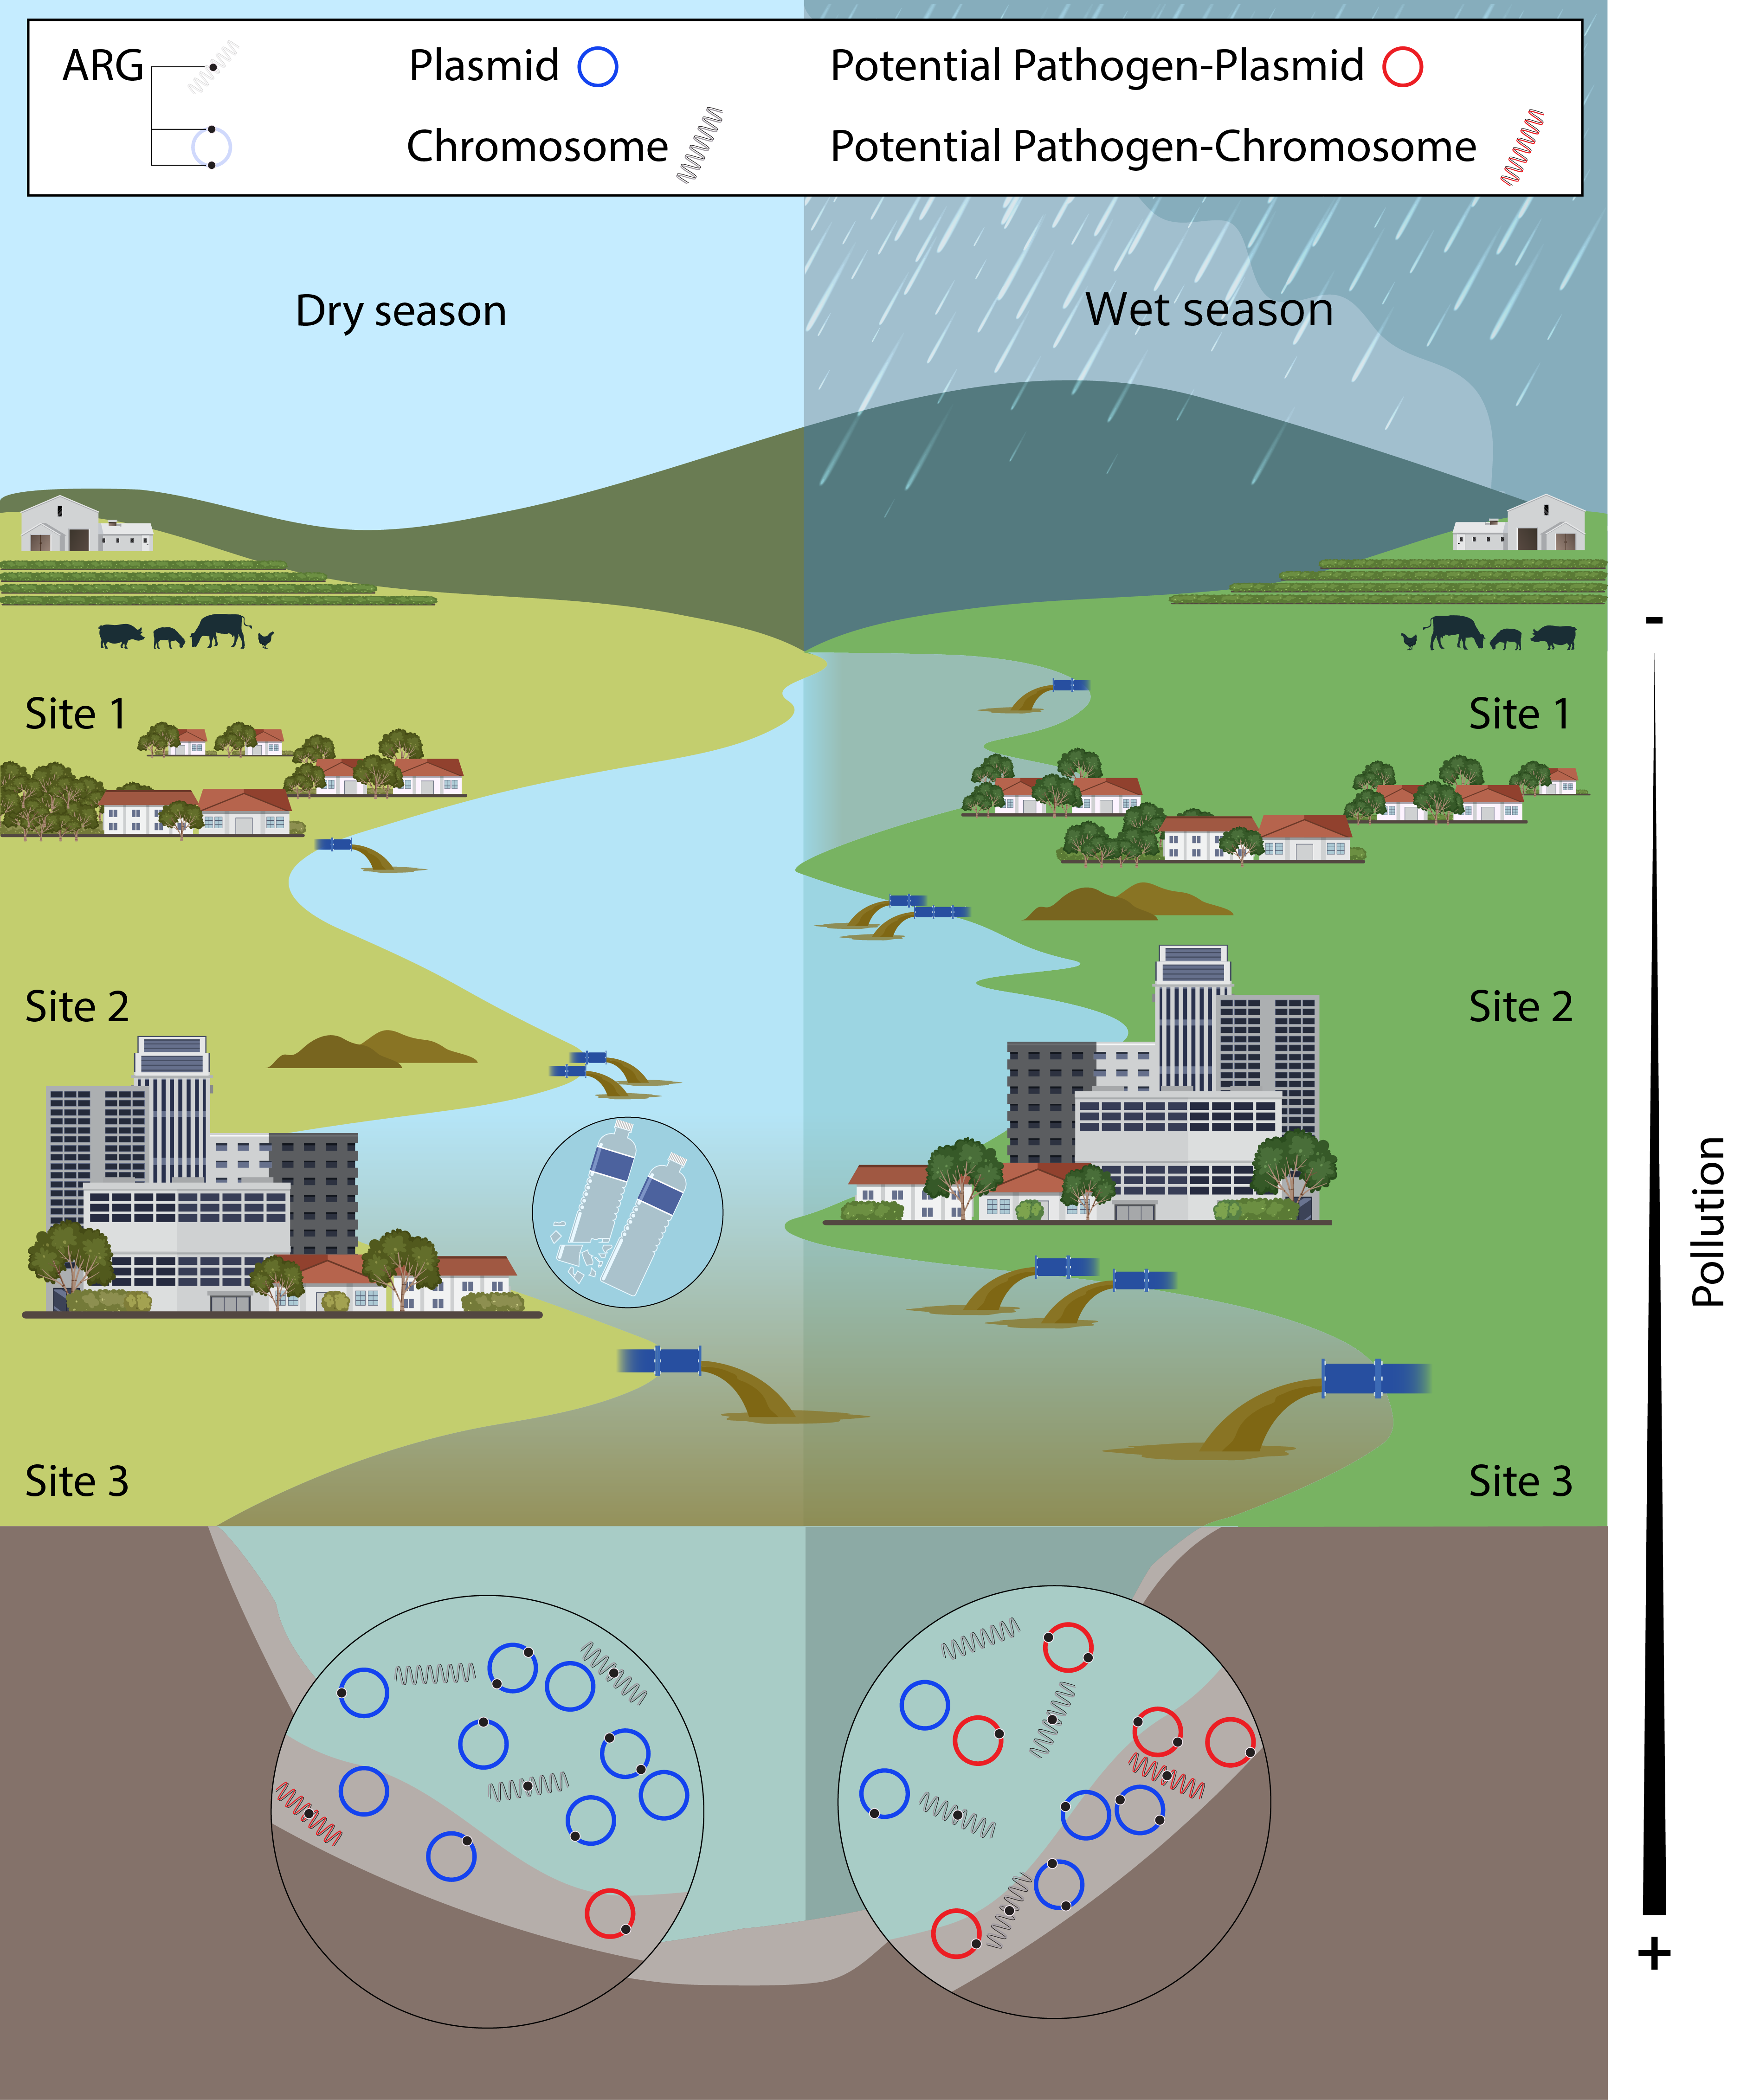
luted site (Site 3). In contrast, plasmid-associated ARGs showed seasonal fluctuations, with increases
during the wet seasons. Potential pathogenic taxa also varied spatially, with greater plasmid-associated diversity and
potential pathogens found in the most contaminated sediments.
Conclusions: Seasonality and pollution gradients jointly shape ARG dynamics in this tropical river. Plasmid-
mediated resistance responds rapidly to environmental changes and is enriched at polluted sites, while sed
iments act as long-term ARG reservoirs. These findings support plasmid-based monitoring as a
sensitive tool for antimicrobial resistance surveillance in aquatic systems.
Keywords:
antibiotic resistance genes
; plasmids
; seasonality
; tropical river
; metagenomics
; pollution gradient
; Virilla River
1. Introduction
Urban aquatic environments, particularly in tropical regions, are subject to intense anthropogenic pressures that alter the composition and diversity of microbial communities [1,2,3]. These communities include potentially pathogenic microorganisms, as well as mobile genetic elements (MGEs), such as plasmids, which facilitate horizontal gene transfer (HGT) among bacteria [4]. Among the transferred genes, those associated with antibiotic resistance (ARGs) are of global concern, as their dissemination in contaminated aquatic environments can contribute to the emergence and spread of resistant bacteria, posing a risk to public, animal, and environmental health and undermining the effectiveness of antimicrobial treatments [5,6,7,8].
The impact of human-derived pollution on riverine resistomes (the collection of all ARGs present within a microbial community) is particularly concerning, as urban and agricultural areas consistently exhibit a higher abundance and diversity of ARGs than upstream locations [9,10]. In urban rivers, the resistome composition closely resembles wastewater’s, indicating substantial influence from untreated or insufficiently treated effluents. These anthropogenic discharges not only introduce resistant bacteria and ARGs into aquatic environments but also drive shifts in microbial community composition [10].
During the rainy season, increased water flow and surface runoff intensify the input of contaminants and microorganisms from urban soils, wastewater, and diffuse pollution sources, promoting the mixing and dispersal of bacteria and MGEs [11,12]. This process can lead to significant fluctuations in ARG abundances, as observed in various freshwater systems. The mobilization of ARGs during rainfall has been associated with elevated bacterial aggregation, a process that can enhance HGT and facilitate the spread of resistance determinants within microbial communities [13]. Studies have demonstrated that rainfall events can cause rapid increases in the presence of ARGs due to the mobilization of sediment-associated bacteria and nutrient influxes that enhance bacterial growth and gene transfer processes [13,14].
In contrast, the dry season is typically associated with reduced water flow and dilution capacity, leading to higher concentrations of pollutants and hydrological stability [15,16]. These conditions may promote the selection of more resistant microorganisms to environmental stress and prolonged exposure to antibiotics and other chemical compounds [17]. Furthermore, the limited water exchange during the dry season can facilitate the persistence of ARGs within microbial communities, potentially increasing the risk of HGT among bacterial populations [13].
Sediments in these river systems are particularly important, as they can retain contaminants and microbial communities over time, creating hot spots for gene exchange and facilitating the persistence of ARGs in the environment, even when pollutant levels fluctuate in the overlying water [18,19,20]. Acting as long-term reservoirs, they can also function as secondary sources of ARGs, releasing bacteria and resistance determinants back into the water column during disturbances such as heavy rainfall or resuspension events [14,21,22,23]. This interaction between water and sediment compartments is critical in tropical urban rivers, where hydrological variability can amplify the mobilization of ARGs across environmental matrices.
Plasmids are fundamental to bacterial evolution, enabling the spread of genes that provide adaptive benefits [24,25]. Unlike chromosomal genes, plasmid-encoded genes follow distinct evolutionary trajectories, indicating that plasmids perform functions beyond facilitating HGT. Notably, plasmidomes (the group of plasmids in a bacterial community) tend to be more conserved than their corresponding chromosomal microbiomes, highlighting their ecological significance in preserving latent genetic potential across diverse environments [26]. Furthermore, plasmid diversity has been recognized as a potential biomarker for health and disease states, reinforcing the need to distinguish plasmids in metagenomic studies to better understand their functional roles [27]. In this context, understanding how anthropogenic contamination, seasonal variability, and sediment dynamics shape the composition of the plasmidome is essential for assessing the environmental and public health risks associated with water body pollution.
This study assessed bacterial taxa and ARGs’ spatial and temporal variability along a contamination gradient in a tropical urban river. We quantified ARGs in both water and sediment samples, while metagenomic analyses of taxonomic composition and diversity shifts, focused on potential pathogens, were conducted exclusively on sediment samples. Multivariate analyses showed significant variation in pathogenic species across sites and sampling periods. Unlike chromosomal profiles, plasmid profiles displayed seasonal variation, with the least contaminated site more clearly differentiated from the more polluted ones. Furthermore, contrasting patterns were observed between the water and sediment compartments: specific ARGs showed an increased abundance in sediments during the wet season, suggesting that seasonal hydrological dynamics drive both accumulation and mobilization. Together, these findings highlight the combined influence of anthropogenic pollution, seasonal fluctuations, and likely sediment-associated processes on microbial communities and their mobile genetic elements, reinforcing the role of these ecosystems as reservoirs and hotspots for ARG dissemination in the environment.
2. Results
2.1. Physicochemical and Microbiological Parameters
A pollution gradient in the Virilla River watershed was determined using microbiological and physicochemical parameters (Table 1).
Significant differences in physicochemical parameters and fecal indicators among sampling sites were observed only during the 2022 campaigns, both in the dry season (Sampling 2) and the wet season (Sampling 3). In contrast, no significant spatial differences were detected during the first campaign in the wet season 2021 (Sampling 1) for any of the evaluated parameters (Kruskal-Wallis H test, p > 0.05). In general during 2022, fecal contamination indicators as well as other physical parameters were significantly higher in site 2, but even more in site 3 when compared to site 1.
During the dry season 2022 (Sampling 2), significant differences were found across sites for all parameters analyzed. Site 3 showed higher concentrations of fecal coliforms (H = 7.3, p = 0.02) and E. coli (H = 6.9, p = 0.03) compared to Site 1. Site 3 also exhibited greater turbidity (H = 7.2, p = 0.02), elevated temperature (H = 8.0, p = 0.02), and reduced dissolved oxygen levels (H = 8.0, p = 0.01) relative to other sites. These spatial trends were consistently observed during Sampling 3. In the third campaign (wet season 2022), Site 2 showed elevated levels of fecal contamination: fecal coliforms (Kruskal-Wallis H test: statistic = 8.0, p = 0.01), E. coli (Kruskal-Wallis H test: statistic = 8.0, p = 0.01), and E. faecalis (Kruskal-Wallis H test: statistic = 8.0, p = 0.01); compared to Site 1, while Site 3 displayed higher turbidity (Kruskal-Wallis H test: statistic = 7.2, p = 0.02), and temperature values (Kruskal-Wallis H test: statistic = 8.0, p = 0.01), than Site 1.
Overall, Site 1 maintained better water quality conditions throughout the study period. In contrast, Site 3 was more severely affected by fecal contamination and physicochemical parameter deterioration during the dry and wet seasons of 2022. This reflects on the surface water quality index (NSFQI), indicating poor water quality in the three sampling sites, particularly at Site 3 (Table 1). Only Site 1 achieved a fair water quality rating during the second sampling campaign (dry season).
These findings suggest that seasonal variability and localized pollution sources contribute to decreased water quality, particularly at Site 3, compared to the other sampling sites. Site 3 is in a lower-altitude area of the Virilla River compared to Sites 1 and 2. This zone has previously been identified as the most polluted, based on BMWP-CR index scores ranging from 17 to 26 (classified as “very polluted”) and a Dutch Water Quality Index value of 11 (classified as “severe”) [28]. Site 3 also has the lowest NSFWQI values recorded in this study compared to Sites 1 and 2 (Table 1).
These measurements indicate that, although there is a gradient of decreasing water quality in this system, its magnitude can vary according to the season and is likely influenced by localized pollution sources.
2.2. Seasonality Influences ARGs Distribution Along the Virilla River Watershed
Seasonal variations in ARG abundance were assessed using Tobit and linear regression models. Tobit models were selected to account for censored data, such as gene abundances falling below detection limits. The dry season 2022 (Sampling 2) was the reference category. The gene blaTEM was excluded from the regression analyses due to a high proportion of non-detectable values (>80%), while blaOXA and blaCTX-M were not detected in any samples. Relative abundances are shown in Figure 1 as geometric means by sampling campaign and site, illustrating both seasonal and spatial variation across sample matrices.
Several ARGs showed strong evidence of seasonal variation in water samples. During the wet season of 2021 (Sampling 1), sul-1 (BF = 20.51), intl-1 (BF = 34.06), and tetA (BF = 7.74) were detected at significantly lower concentrations. These findings are consistent with the patterns observed in Figure 1, particularly at Sites 1 and 3. For instance, intl-1 and sul-1 were visually less abundant at these sites in Sampling 1 compared to Sampling 2. The gene ermB showed a moderately high Bayes Factor (BF = 8.11), but its confidence interval included zero, and the p-value was not significant (Table S1).
During the wet season of 2022 (Sampling 3), intl-1 levels in water samples remained comparatively low (BF = 34.06), while qnrS was detected at notably higher levels (BF = 1,370). As illustrated in Figure 1, intl-1 exhibited visibly lower abundance at Sites 2 and 3 relative to the dry season. No significant seasonal variation was observed for sul-1, tetA, tetQ, sul-2, or dfrA12 during Sampling 3. Although ermB appeared more abundant in Figure 1, particularly at Site 3, with a moderate Bayes Factor (8.11), its wide confidence intervals and corresponding p-values suggest insufficient statistical support for a true difference (Table S1).
In sediment samples, seasonal patterns were also evident. The intl-1 gene showed significantly higher levels during Sampling 1 (BF = 69.07), particularly at Site 3, but was detected at lower concentrations during Sampling 3 (p = 0.025). The tetQ gene presented elevated levels in both campaigns (BF = 37.56), especially during Sampling 3 and across all sites. In contrast, sul-1 exhibited notably lower levels in Sampling 3 (BF = 1,090), particularly at Sites 2 and 3, while tetA was detected at higher concentrations (BF = 474.57), mainly at Site 2. The sul-2 gene appeared at reduced levels (BF = 78.36), whereas qnrS showed relatively elevated values (BF = 3.14). These site-specific differences are illustrated in Figure 1.
2.3. Bacteria Diversity Analysis
In the chromosomic dataset, we identified 11,477 taxa representing 1,966 bacterial genera, of which 251 genera (4,044 taxa or 35%) were classified as potential human pathogens. In contrast, the plasmidic dataset revealed 472 taxa representing 233 genera, of which 70 genera (207 taxa or 44%) were associated with potential pathogens.
Based on Figure 2, sediment samples from the Virilla River exhibit increased richness of potential pathogenic species with rising contamination levels. The Shannon diversity index also shows that the plasmid-derived dataset from Site 3 consistently presented the highest diversity values across all sampling dates. This suggests that the plasmid diversity of the most abundant potential pathogens in our dataset, considering richness and evenness, tends to increase under more contaminated conditions. In contrast, chromosomal bacterial diversity within these pathogenic groups appears less affected by pollution, as indicated by comparatively stable values in Figure 2.
Regarding beta diversity, the chromosomic dataset clustered samples by site and sampling date in the PCoA plot (Figure 3).
The PERMANOVA test revealed significant differences in bacteria composition across sites (R² = 0.30, F = 5.10, p = 0.001) and sampling campaigns (R² = 0.17, F = 2.42, p = 0.001). In contrast, the plasmid dataset displayed lower variability between samples; however, Site 1 (the least contaminated) showed a more pronounced distinction from Sites 2 and 3 (Figure 3B). It also detected significant differences in the plasmid dataset by site (R² = 0.33, F = 6.04, p = 0.001) and sampling campaigns (R² = 0.14, F = 1.93, p = 0.02). Notably, samples collected during the wet season (Sampling 1 and Sampling 3) were more similar to each other in both datasets (chromosomal and plasmid) compared to samples from the dry season (Sampling 2).
Concerning potential pathogen abundance, our results show that spatial variation exerts a stronger influence than seasonal changes on the distribution of potentially pathogenic bacterial species in both chromosomal and plasmid datasets.
In the chromosomal fraction, several pathogenic species were consistently more abundant at Site 3. During the dry season 2022, Acinetobacter johnsonii showed increased abundance (H = 7.73, p = 0.021), along with Acinetobacter parvus (H = 17.41, p < 0.001). In the wet season 2022, Aeromonas caviae was more prominent (H = 19.20, p < 0.001), as were Moraxella osloensis (H = 16.71, p = 0.0002) and Pseudomonas alcaligenes (H = 18.11, p < 0.001), while Cutibacterium acnes (H = 13.78, p = 0.0010) and Enterobacter cloacae (H = 23.29, p < 0.001) were consistently enriched at Site 3 across all sampling campaigns.
In the plasmid fraction, species such as Leclercia adecarboxylata (H = 16.06, p < 0.001), Pseudomonas putida (H = 15.76, p = 0.0004), and Moraxella osloensis (H = 17.02, p = 0.0002) were also enriched at Site 3, particularly during the wet season 2022. Additional species, including Escherichia fergusonii (H = 15.75, p = 0.0004), Microbacterium paraoxydans (H = 13.20, p = 0.0014), Proteus vulgaris (H = 11.66, p = 0.0029), and Providencia rettgeri (H = 17.69, p < 0.001), also exhibited significantly higher abundances at Site 3 based on overall Kruskal–Wallis tests. However, significant post hoc tests did not consistently support these trends.
Our results suggest that multiple pathogenic bacterial species (and their potential plasmids) are enriched at the site with higher contamination levels across different seasons. This underscores the impact of anthropogenic pollution and seasonality on the transmission of potentially pathogenic bacteria in urban rivers.
2.4. Abundance of Distinctive ARGs in Metagenomic Data
Sixty-five ARGs were identified across the contigs in all samples, grouped into 16 resistance categories based on their associated drug classes as defined by the CARD database. Figure 4 illustrates each ARG category’s normalized abundance (RPKM), organized by site and sampling campaign, providing insights into distribution patterns.
The analysis revealed distinct spatial and temporal trends between chromosomal and plasmid-associated ARGs. Chromosomal ARGs exhibited significant spatial variation across sites (Figure 4A). In contrast, plasmid-associated ARGs displayed more temporal fluctuations (Figure 4B).
Aminoglycoside resistance showed significant spatial differences across sites (H = 18.5, p = 9.60 × 10⁻⁵). Post hoc analyses revealed significantly lower resistance levels at Site 1 compared to Site 3 (Z = -4.02, p.adj = 0.00017) and Site 2 compared to Site 3 (Z = -3.33, p.adj = 0.0026).Similarly, beta-lactam resistance also varied significantly by site (H = 13.1, p = 4.20 × 10⁻⁴), with significantly lower levels observed at Site 1 vs. Site 3 (Z = -3.38, p.adj = 0.0021) and Site 2 vs. Site 3 (Z = -3.44, p.adj = 0.0017). Macrolide resistance exhibited strong spatial differences (H = 15.8, p = 7.25 × 10⁻⁵), with lower levels in Site 1 (Z = -3.67, p.adj = 0.00073) and Site 2 (Z = -3.89, p.adj = 0.00031) compared to Site 3. Plasmid-associated ARGs for these categories showed no significant differences between sites.
Temporal variation was more evident from ARGS-associated plasmid contigs, while chromosomal ARGs showed limited but detectable fluctuations. Kruskal-Wallis tests revealed significant differences in chromosomal ARGs to colistin, diaminopyrimidine, fluoroquinolone, rifamycin, lincosamide, and phenicol (H = 6.51–6.52, p = 0.039 for each). Although none of the pairwise contrasts remained significant after Bonferroni correction (all p.adj > 0.05), unadjusted p-values indicated trends in chromosomal-ARGs levels between campaigns: for example, higher in Sampling 1 compared to 2 and 3 for colistin, fluoroquinolone, and phenicol; and lower levels in Sampling 2 for diaminopyrimidine and rifamycin.
In contrast, plasmid-associated beta-lactam (H = 10.23, p = 0.0159), macrolide (H = 10.09, p = 0.0159), macrolide-streptogramin (H = 9.74, p = 0.0159), and MLS (H = 9.88, p = 0.0159) resistance showed significant spatial variation, as these resistance categories were exclusively detected at Site 3 across all sampling campaigns. A significantly higher abundance of ARGs in plasmidic contigs was observed in Sampling 3 compared to Sampling 1 (H = 8.79, p.adj = 0.0251) and in Sampling 2 compared to Sampling 1 (H = 7.62, p.adj = 0.0483), with no significant differences between Sampling 2 and Sampling 3.
Table S3 provides a comprehensive list of ARGs, including mapped reads per sample, reference accession numbers, associated resistance phenotypes, coverage identity, and contig taxonomy.
3. Discussion
We provide evidence that, although antibiotic resistance and potential pathogenic bacteria vary significantly across a pollution gradient in a tropical urban river, distinct patterns are observed depending on whether the sequences are chromosomal or plasmid-associated. Chromosomal ARGs exhibited marked spatial differences, with significantly higher abundance at the most contaminated site (Site 3), particularly for resistance genes against aminoglycosides, beta-lactams, and macrolide antibiotics. In contrast, plasmid-associated ARGs exhibited significant temporal variation, with higher abundance detected during the middle of the 2022 wet season (Sampling 3) compared to the end of the 2021 wet season (Sampling 1). These findings underscore the importance of distinguishing between chromosomal and plasmid-derived sequences when evaluating environmental resistomes. Our recent work [29] has emphasized it in demonstrating contrasting diversity patterns between chromosomal and plasmid profiles in this polluted tropical river. Moreover, our results underscore how methodological choices, such as the type of matrix analyzed (water, sediment), sequencing strategy (qPCR or metagenomics), genomic compartment (chromosome or mobile genetic elements), and sampling timing, can influence resistance surveillance outcomes and interpretations.
3.1. Impacts of Pollution on the Surface Water of the Virilla River Watershed
During the three sampling campaigns, a pollution gradient was identified in the surface waters of the Virilla River. Fecal coliform and E. coli levels were highest in areas most affected by human activities and wastewater discharges, particularly at Site 3. This pattern aligns with trends in urban rivers globally, where untreated or insufficiently treated wastewater is frequently discharged due to aging infrastructure or rapid urbanization [30]. For example, in Latin America, less than 60% of wastewater undergoes treatment before release into water bodies, exacerbating contamination in densely populated watersheds [30].
In Costa Rica, urbanization significantly influences water quality in the Virilla River. Wastewater discharges from urbanized areas are associated with a high concentration of pollutants, including biochemical oxygen demand (BOD), chemical oxygen demand (COD), ammonium, and nitrites. These pollutants increase in rivers as urbanization intensifies, contrasting with more pristine areas where agricultural and forested land use predominates [31]. Additionally, microbial pollution poses a severe risk, as high levels of fecal contamination and E. coli virulence and resistance genes have been documented in the Virilla River, particularly in areas with significant human influence [3].
Surface water quality in the Virilla River exhibited spatial and seasonal variability, with more pronounced contamination detected during the dry and wet seasons 2022, particularly at downstream sites affected by urban pollution. Reduced runoff during the dry season likely resulted in a decrease in several pollution indicators. In contrast, intensified precipitation after the wet season most likely mobilized pollutants from informal settlements, landfills, and impervious surfaces, leading to further water quality degradation. A previous study [3] conducted in this watershed reported similar seasonal patterns, with significantly higher E. coli levels during the wet season compared to the dry season, a trend also documented in other tropical watersheds [3,32]. In this area, seasonal fluctuations also influenced the prevalence of E.coli virulence determinants and ARGs, which were more frequently detected during the wet season [3]. This increase is likely driven by enhanced microbial transport and pollution loading associated with greater runoff [3]. These dynamics may become more pronounced with climate change, as projected increases in rainfall variability could further exacerbate pollutant transport during extreme weather events [33].
3.2. Seasonal Dynamics of ARGs Quantification
The distribution of ARGs in aquatic ecosystems is increasingly recognized as a dynamic process influenced by seasonal hydrological, anthropogenic, and microbial factors [34]. The reduced abundance of waterborne ARGs (sul-1, intl-1, tet(A)) detected by qPCR during the wet season 2021 (Sampling 1) likely reflects dilution effects from increased water input from rainfall, increased flow (caudal), discharges, and runoff, which lowers pollutant concentrations [3,34]. Conversely, sediment-associated ARGs (intl-1, tet(Q)) increased during the same period, suggesting particle-bound ARG deposition from agricultural or urban runoff. Similar patterns have been documented where sediments act as reservoirs for ARGs during high-flow events [35]. Hydrological dynamics, such as flow velocity and sediment resuspension, are critical in redistributing ARGs between water and benthic environments [36].
The dominance of sul and tet genes aligns with sulfonamide and tetracycline use in agriculture, animal husbandry, and public health [9,37]. Seasonal manure application during the wet season may explain the rise of tet(Q) in sediments, as observed in farming-intensive watersheds [38,39]. Hospital wastewater and other healthcare facility effluents can also contribute to the presence of sul genes in the environment. These genes may be transported through treated effluents containing antibiotic-resistant bacteria [40,41]. Site-specific trends, such as the elevated presence of ARGs at the most contaminated sites, during dry seasons, likely reflect localized pollution inputs, including wastewater treatment plant (WWTP) discharges, domestic wastewater, and hospital effluents, which become more concentrated under low-flow conditions.
In Costa Rica, antimicrobial consumption in human healthcare was reported at 14.32 defined daily doses per 1000 inhabitants per day (DDD/1000 inh. /day) in 2019, with a higher proportion used in the public sector [42]. In agriculture, antibiotic use is also prevalent, particularly in tomato farming, where 71.8% of farmers apply bactericides or antibiotics to control bacterial infections [43]. Furthermore, oxytetracycline is widely used in livestock and aquaculture, with studies detecting antibiotic residues in soils and water bodies in intensive farming areas [44]. The use of tetracyclines, including oxytetracycline, chlortetracycline, and doxycycline, has been directly linked to the emergence of antimicrobial resistance in food and feed environments [45]. While Costa Rica’s National Action Plan Against Antimicrobial Resistance (2018–2025) aims to strengthen surveillance and control measures, more stringent regulations are needed, particularly in private healthcare and agricultural sectors, to mitigate the spread of ARGs [46]. A better understanding of ARG in the environment is needed locally.
Water and sediment harbor distinct microbial communities, influencing the distribution of ARGs. During rainy periods, sediment conditions may promote the persistence of tetracycline resistance genes (tetM, tetQ, tetW), which have been widely detected in environments impacted by agricultural activities [47]. In contrast, warmer temperatures in dry seasons could enhance HGT in water via increased microbial activity [48]. The contrasting behavior of intl-1, decreasing in water but increasing in sediment, underscores the role of biofilms and particle adhesion in stabilizing integrons during flow disturbances [47]. The wet season 2021 surge of intl-1 in sediments indicates the role of mobile genetic elements in ARG dissemination. Integrons thrive in biofilms and can capture ARGs under environmental stressors, such as nutrient influx from runoff [49,50]. This aligns with the observed increase in intl-1 at Site 3, a potential hotspot for HGT due to organic matter accumulation.
The seasonal dynamics of ARGs in the Virilla River watershed have significant implications for public health and antimicrobial resistance (AMR) surveillance. The higher abundance of ARGs during the dry season suggests that low-flow conditions may increase the risk of ARG exposure for downstream communities. Sediments, acting as long-term ARG reservoirs, pose additional risks during resuspension events, potentially reintroducing ARGs into the water column. In contrast, the wet season may facilitate ARG movilization by sediments, influencing their long-term persistence and potential mobilization under changing hydrological conditions.
3.3. Spatial Patterns Drive Microbial Community Composition and ARG Distribution More than Temporal Variability
This study reveals contrasting responses between chromosomal and plasmid fractions to environmental contamination and clear spatial patterns that exert a stronger influence than temporal variability, particularly at the plasmidic contigs level.
At the most contaminated site (Site 3), we observed an increased of plasmid richness. Specifically, while plasmid-associated diversity increased with contamination, chromosomal diversity remained stable. This pattern suggests that plasmids act as “first responders” to environmental stress, enabling the proliferation of bacteria or the exchange of adaptive traits. The relative stability of chromosomal diversity compared to plasmid-based analysis, even under highly polluted conditions, may reflect a baseline resilience of core microbial communities, a phenomenon previously documented in heavily impacted coastal environments [51].
We also detected strong spatial patterns in microbial composition, with marked spatial clustering of chromosomal communities. This spatial structure is consistent with findings from urban rivers, where point-source pollution from industrial or agricultural activities shapes distinct microbial assemblages [35,52]. In contrast, plasmid-associated communities exhibited lower spatial variability, except at Site 1 (the least contaminated), which diverged significantly from Sites 2 and 3. Interestingly, a similar pattern has been described for plasmid-associated resistance genes and mobile genetic elements in polluted European rivers, such as the Ter River in Catalonia, where downstream sites exposed to wastewater discharges show increased enrichment and homogenization of these elements, likely due to horizontal gene transfer [53]. This suggests that contamination may exert a comparable homogenizing effect on the plasmidome, reducing spatial differentiation.
Several opportunistic pathogens were consistently enriched at the most contaminated site, highlighting the potential health risks of polluted urban rivers. Acinetobacter johnsonii and A. parvus are known for their environmental persistence and involvement in healthcare-associated infections, particularly in patients with indwelling devices [54,55]. Aeromonas caviae, a common aquatic bacterium, has been associated with gastrointestinal and bloodstream infections, especially in immunocompromised individuals [56]. Cutibacterium acnes, although a skin commensal, is increasingly implicated in biofilm-associated infections on medical implants [57].
Enterobacter cloacae, Escherichia fergusonii, and Proteus vulgaris are members of the Enterobacteriaceae family that are frequently associated with urinary and bloodstream infections. These species are also known to harbor multidrug resistance mechanisms and have been isolated from environmental sources, including water [58]. Leclercia adecarboxylata, though rare, has emerged as a cause of polymicrobial infections, including urinary and respiratory tract infections, even in immunocompetent hosts [59]. Microbacterium paraoxzayetydans have been reported in catheter-related bloodstream infections, primarily affecting chronically ill patients [60].
Other enriched taxa include Moraxella osloensis, which has been associated with respiratory infections in individuals with underlying conditions [61], and Pseudomonas putida, a ubiquitous environmental bacterium that can act as a pathogen in both aquaculture and clinical settings, and that carries virulence genes and antibiotic resistance traits [62].
These findings demonstrate that urban rivers under anthropogenic pressure can act as reservoirs for emerging and opportunistic pathogens with clinical relevance, underscoring the need for environmental monitoring as part of public health strategies.
Contig analysis revealed clear spatial patterns in chromosomal ARGs, with significantly higher resistance levels at Site 3, particularly for aminoglycosides, beta-lactams, and macrolides. This suggests that chronic pollution and environmental selection contribute to the persistence of chromosomal resistance. In contrast, plasmid-associated ARGs showed more marked temporal fluctuations, with significantly higher abundance during the rainy season (Samplings 1 and 3). Antibiotic-resistance categories such as beta-lactam, macrolide, and MLS were particularly enriched during these periods, consistent with increased inputs of antibiotics and other selective agents through runoff and wastewater discharge.
In addition to spatial and seasonal dynamics, the distribution of ARGs is influenced by physicochemical parameters such as temperature, pH, and dissolved oxygen (DO). These factors may modulate microbial community composition and the abundance of mobile genetic elements, indirectly contributing to resistance dynamics [63,64,65]. However, while these patterns align with previous research highlighting the role of environmental conditions in ARG persistence and dissemination, our previous work emphasizes that anthropogenic pollution is the principal driver shaping these dynamics in the Virilla River, acting as a selective force that accelerates the evolution and spread of antibiotic resistance [29].
In the present study, the role of pollution becomes particularly evident when comparing chromosomal and plasmid-associated ARGs. The latter showed more pronounced fluctuations, likely reflecting the dynamic nature of plasmids, which can be rapidly gained or lost in response to changing environmental pressures. Episodic selection events, such as rainfall-driven influxes of contaminants, may trigger surges in plasmid-mediated resistance. In contrast, chromosomal resistance tends to persist more stably, even without immediate selective pressure.
These findings underline the need for site-specific interventions, particularly at urban discharge points (Site 3) and agricultural runoff zones (Site 2), to help reduce the introduction and control the spread of ARGs. Implementing monitoring programs within a One-Health framework would support early detection and more effective management of antimicrobial resistance in urban aquatic systems.
Finally, the consistent enrichment of plasmid-associated ARGs and potentially pathogenic taxa at Site 3, underscores the value of plasmids as sensitive biomarkers of urban contamination, particularly for ARGs. Their ability to rapidly respond to environmental pressures and carry multiple resistance genes makes them effective indicators of pollution-driven microbial shifts. Plasmid profiling in metagenomic studies thus represents a valuable early-warning tool for detecting anthropogenic impacts in freshwater ecosystems exposed to wastewater discharge and urban runoff.
4. Materials and Methods
4.1. Study Area
Water column and sediment samples were collected from three sites along the main course of the Virilla River watershed, located in the western Central Valley of Costa Rica (Figure 5). This watershed is part of the larger Grande de Tárcoles River Watershed, which drains into the Pacific Ocean. Urbanization and land-use changes within the watershed have led to increased pollution levels, primarily due to untreated sewage and industrial effluents [31,32].
Site 1, the highest elevation site, is located at 2,020 meters above sea level (9°59′9″N, 83°56′35″W). The predominant land uses in this area are cattle farming and plant cultivation. Site 2, the mid-elevation site, is situated at 1,185 meters (9°57′47″N, 84°5′51″W) and is characterized by residential, commercial, industrial, and urban land uses. Site 3, the lowest elevation site, is at 720 meters (9°56′46″N, 84°13′22″W) and is primarily influenced by urban and industrial activities. This site is located downstream of the San José Wastewater Treatment Plant (SJ-WWTP), the largest facility in Costa Rica, serving over one million people in the Greater Metropolitan Area of San José. The SJ-WWTP primarily employs physical and chemical treatment processes to reduce pollutants such as total suspended solids (TSS), biological oxygen demand (BOD), and oils in wastewater before it is discharged into the María Aguilar, Tiribí, and Torres rivers, all of which are part of the Virilla River watershed [66].
Sampling was conducted during three distinct campaigns: the wet season in November 2021 (Sampling 1 or wet season 2021), the dry season in April 2022 (Sampling 2 or dry season 2022), and the wet season in August 2022 (Sampling 3 or wet season 2022). At each site, triplicate samples were collected, totaling nine samples per sample type and 18 samples per sampling campaign, resulting in 54 samples (27 water column samples and 27 sediment samples). It is worth noting that during the studied period, Costa Rica experienced a cold period of the ENSO phenomenon (known as “La Niña”), with Sampling 3 or wet season 2022 having slightly more rainfall than Sampling 1 or wet season 2021. However, both wet seasons had significantly more rainfall than the studied dry season in 2022. Daily precipitation data for the sampling periods are presented in Table S4.
4.2. Microbiological and Physical-Chemical Analysis
Water column samples were collected in sterile 1-liter containers, while sediment samples were gathered from the river shore at a depth of approximately 30 cm using a sterile spoon and placed in sterile plastic bags. Each sample was double-bagged in sterile bags for secure transport. All water and sediment samples were kept cold during transport and analyzed within 20 hours.
Microbiological and chemical indicators were measured only in water column samples. Fecal coliforms, Escherichia coli (E. coli), and Enterococcus faecalis (E.faecalis) were quantified using the most probable number technique (standard methods 9221E, 9221F, and 9230B) (35). Oxygen saturation, conductivity, pH, and temperature were analyzed using a multiparameter probe (YSI, model 85 A, Yellow Springs, OH, USA). Turbidity analysis was conducted in the Health Research Institute (INISA) laboratory using the standard method 2510B (35).
The National Sanitation Foundation Water Quality Index (NSFQI) was also determined following the methodology described by Brown et al. (1972) [67], Marselina et al. (2022) [68], and Srivastava G, & Kumar P. (2021) [69]. The index calculation incorporated five key parameters: fecal coliforms, pH, temperature, turbidity, and oxygen saturation. By integrating these variables, the NSFQI offers a holistic assessment of water quality, facilitating the detection of potential anthropogenic contamination. It further classifies surface waters into five distinct quality categories: very good (90.1-100), good (70.1-90), fair (50.1-70), poor (25.1-50), and very poor (0-25) [68,70,71].
4.3. DNA Extraction and Quantification
Water samples were prefiltered via a filtration device (Sartorius®, Göttingen, Germany) equipped with an 80-µm glass fiber prefilter (13,400–47-Q, Sartorious®, Germany) to remove larger particles. The prefiltered samples were then filtered onto a 0.22-μm cellulose nitrate filter (47-mm diameter;11,327–47–N, Sartorius®, Germany).
According to the kit’s directions, DNA from filters and sediments was extracted with the DNeasy PowerSoil Pro (Qiagen, Venlo, The Netherlands). Two hundred fifty milligrams of the sample were used for sediments, and one filter (equivalent to 250 ml filtration volume) was extracted for the water sample. The DNA concentration and purity of the extracts were measured using a NanoDrop 2000 spectrophotometer (ThermoFisher Scientific, USA). It ranged between 7.5 and 50 ng/µl for the water samples (A260/280 values: 1.6-2.1) and between 7.0 and 59 ng/µl (A260/280 values: 1.6-1.9) for the sediment samples. These extracts were aliquoted and stored at -80°C before ARG quantification and sequencing.
4.4. Quantification of Antimicrobial Resistance Genes
Quantitative PCR (qPCR) was used to assess the abundance of selected antibiotic resistance genes (ARGs) in water and sediment samples. The analysis targeted genes conferring resistance to multiple antibiotic classes, including sulfonamides, tetracyclines, beta-lactams, macrolides, quinolones, and trimethoprim. The relative abundance of each ARG was normalized against 16S rRNA gene copies to account for differences in bacterial biomass. It is important to note that data from the April 2022 sampling campaign have already been published in Barrantes-Jiménez et al., 2025 [29], where full methodological details are provided (see Section 2.4 and Supplementary Tables S2–S5). In the present study, those previously published data are integrated with two additional sampling campaigns to provide a broader temporal and spatial perspective on ARG dynamics.
4.5. Shotgun Metagenomic Sequencing and Quality Control
DNA sample extracts were frozen and shipped to Novogene Inc. (Sacramento, CA, USA) for metagenomic library preparation and paired-end 150 sequencing on an Illumina NovaSeq 6000 instrument, obtaining approximately 2 × 2 GB of data per sample. Metagenome library preparation was conducted using the ABclonal Rapid Plus DNA Library Kit (ABClonal, Woburn, MA, USA). Each library was evaluated using a Qubit 2.0 fluorometer (Invitrogen, Carlsbad, CA, USA) for preliminary concentration assessment and an Agilent 2100 Bioanalyzer (Agilent, Santa Clara, CA, USA) to determine the insert size..
Adapter detection, trimming, and quality filtering of raw reads were performed with fastp v0.20.1 [72], using default parameters except for -e value settled to 25. Then, reads associated with the human genome were removed using Bowtie2 v2.5.0 [73], applying the pre-built human genome index (hg19) in very-sensitive-local mode.
4.6. Taxonomic Assignment and Diversity Analysis
Taxonomic classifications of filtered reads were assigned to the species level using Kraken2 v 2.1.2 [74] with two previously indexed custom databases, applying a classification value of 0.5. One database contained chromosomal sequences from the GTDB r207 v2 [75], while the other comprised only plasmid sequences from the same dataset. This approach allowed the preparation of two distinct datasets: chromosomic reads and plasmidic reads for downstream analyses [29]. Taxonomic reports generated by Kraken2 were processed using Bracken v2.8 [76] to calculate read counts for each taxon. The resulting matrix was imported into R as a phyloseq object using the bracken to phyloseq (b2p) in-house package [77]. Full taxonomy paths (from phylum to species) were assigned based on the NCBI taxonomy identifiers provided by Kraken2, utilizing the taxonomizr package in R. Detailed instructions for this step can be found in the repository: https://github.com/braddmg/b2p. For microbial diversity analyses, chromosomal and plasmidic read datasets were processed separately. Samples were rarefied to the minimum read count observed across all samples within each dataset. Subsequently, a subset of data was generated by retaining only bacterial genera containing species previously reported as human pathogens, according to Bartlett et al. [78]. Taxa assigned to non-pathogenic genera, including Archaea, were removed. The 20 most abundant species were identified separately for this filtered subset’s chromosomal and plasmidic datasets. Statistical analyses were then conducted using Kruskal-Wallis tests followed by Dunn’s post hoc tests to detect species with significantly higher abundance by site and/or season. Only those species reported as human pathogens and showing statistically supported differential abundance were retained. This two-step filtering and statistical selection process identified 13 potential pathogenic species, which were used to explore spatio-temporal trends in both chromosomal and plasmid-associated communities
We calculated observed richness and the Shannon diversity index for alpha diversity comparisons for each sample. For beta diversity analyses, the data were transformed into a centered log-ratio (CLR) matrix and visualized using a Principal Coordinates Analysis (PCoA), with samples grouped by sampling type, date, and site of origin. Additionally, we performed a Permutational Analysis of Variance (PERMANOVA) to assess differences in potential pathogenic taxa composition across sites.
4.7. Antibiotic Resistance Genes Detection from Sediment Samples
Filtered reads from sediment samples originating from the same site and sampling event were co-assembled using MEGAHIT [79] with k-mer values of 33, 55, 77, 99, and 127. The resulting contigs were mapped to their respective FASTQ files using Bowtie2 v2.5.0 [74]. Contigs shorter than 500 bp were removed, and assembly quality statistics were calculated with MetaQUAST v2.2 [80].
The assembled contigs from each co-assembly were analyzed using the PlasX pipeline [81]. Contigs were first imported into Anvio v8.0 [82], where coding sequences (CDS) were identified using Prodigal [83]. These CDS were annotated using the COG v14 and Pfam v33.1 databases [84,85] to generate de novo protein families. The annotations were compared against a pre-trained plasmid database, and PlasX scored contigs based on their annotations. Contigs with scores above 0.5 were classified as plasmidic, while those below this threshold were classified as chromosomic.
ARGs were annotated in the contigs using Abricate v1.0.1 (https://github.com/tseemann/abricate) with the CARD database [86], applying an identity threshold of 80% and a minimum coverage of 80%. The coordinates of each identified ARG within the contigs were mapped to the corresponding FASTQ files using pysam and Samtools [87]. The number of reads aligning to each ARG region was counted. Read counts were normalized by calculating RPKM (reads per kilobase per million mapped reads) values, dividing the raw counts by the region length in kilobases and the total number of mapped reads. These normalized values were used for subsequent statistical analyses.
Contigs containing ARGs were assigned taxonomic classifications using Kaiju with the Swiss-Prot protein database [88]. This classification provided insights into the taxonomic origins of ARGs within the samples (all scripts are available at https://gitlab.com/legema.inisa/Metagenomics)
4.8. Precipitation Data
Meteorological data (precipitation) for the three sampling sites across the three campaigns were obtained from the ERA5-Land reanalysis dataset, developed by the European Centre for Medium-Range Weather Forecasts (ECMWF) as part of the Copernicus Climate Change Service (C3S). ERA5-Land provides high-resolution (11.132 km per pixel) terrestrial climate variables based on observational data and model assimilation. Data distribution was first evaluated using the Shapiro-Wilk test, which indicated non-normality. Therefore, a non-parametric Kruskal-Wallis test was applied to assess statistically significant differences in precipitation between seasons and sampling sites (p < 0.001), followed by Dunn’s post hoc comparisons with Holm correction for multiple testing. These analyses revealed significantly lower precipitation levels during the dry season than both wet seasons.
4.9. Data Analysis and Visualization
Data normality was first evaluated using the Shapiro-Wilk test for each variable, at each site, and for each sampling campaign to compare differences in physicochemical and microbiological parameters, ARGs values, and the abundance of the bacteria among sampling sites and across sampling campaigns. Due to inconsistencies in the normality results, the non-parametric Kruskal-Wallis test was employed to assess significant differences in all the variables. When significant differences were detected (p < 0.05), Dunn’s post hoc test with Bonferroni adjustment for multiple comparisons was applied to identify the specific sites that differed.
Heatmaps were generated to visualize the geometric mean of ARGs relative abundance detected by qPCR, across sites and sampling periods in water and sediment matrices. Relative abundances of ARGs were log-transformed to account for non-normal distributions, and the geometric mean was calculated to reduce the influence of extreme values. A logarithmic color scale ranging from 0.00001 to 10 copies/L was applied for visualization.
For hypothesis testing, Tobit regression models were used to evaluate the effect of sampling on ARGs values detected by qPCR in each matrix (water and sediment). Tobit models were selected for their ability to handle censored data in the response variable [89], enabling robust inference by accounting for values below detection limits. To control potential confounders, both unadjusted and site-adjusted models were constructed.
Additionally, Bayes factors were calculated for each model to strengthen the evaluation of evidence supporting the null and alternative hypotheses. A Bayes factor greater than one supported the null hypothesis, whereas values below one indicated evidence against it [90]. For all models, β coefficients, 95% confidence intervals (CIs), t-values, p-values, and Bayes factors were reported to assess the magnitude, precision, and significance of observed relationships.
This comprehensive dual-model approach allowed for evaluating site, sampling campaign, and matrix effects on the relative abundance of ARGs and diversity indices within chromosomal and plasmid-associated potential pathogens.
All statistical analyses were conducted in R (version 4.3.0, www.r-project.org). Kruskal Wallis and Dunn’s post hoc test with Bonferroni adjustment for multiple comparisons was performed using FSA, dplyr, and rstatix packages. Tobit regression models were fitted using the VGAM package, linear models were implemented with the lm() function, and Bayesian inference was performed using the bayestestR package. Additional libraries, including tidyverse, parameters, MASS, and scales, were employed for data processing, model diagnostics, and visualization.
5. Conclusions
Urban wastewater discharges are a main source of microbial and chemical pollution in the Virilla River, with more pronounced impacts observed during the wet seasons of 2021 and 2022, especially in the first.
Seasonal rainfall causes ARGs to decrease in surface water but accumulate in sediments, indicating that water is a transient vector and sediments are long-term reservoirs.
Sediment samples from polluted sites showed enrichment of several potential pathogenic genera in both chromosomal and plasmid fractions, including Burkholderia, Escherichia, Klebsiella, Proteus, Moraxella, and Paracoccus, indicating that sediments act as reservoirs for clinically relevant bacteria and hotspots for potential horizontal gene transfer
Pollution substantially affects microbial communities and chromosomal ARG profiles more than seasonality.
Plasmid contigs-associated ARGs are more responsive to environmental changes and may serve as sensitive indicators of urban contamination and resistance spread.
Supplementary Materials
The following supporting information can be downloaded at the website of this paper posted on Preprints.org. Table S1:Tobit models using water samples; Table S2: Tobit models using sediment samples; Table S3: Mapped Reads per Sample, Reference Accessions, Resistance Phenotypes, Coverage, Identity, and Contig Taxonomy; Table S4: Daily Precipitation Data.
Author Contributions
Kenia Barrantes: Visualization, Investigation, Methodology, Data Analysis, Funding acquisition, Writing– original draft, Writing – review & editing. Bradd Mendoza-Guido: Visualization, Methodology, Data Analysis, Writing– original draft, Writing– review & editing. Eric Morales-Montero: Methodology, Data Analysis, Writing– original draft, Writing-review, editing. Luis Rivera-Montero: Investigation. Methodology. Jose Montiel-Mora: Investigation. Luz Chacón-Jiménez: Investigation, Writing-review & editing. Keilor Rojas-Jiménez: Conceptualization, Visualization, Investigation, Supervision, Funding acquisition, Writing– review & editing. María Arias-Andrés: Conceptualization, Visualization, Investigation, Supervision, Funding acquisition, Writing– review & editing.
Funding
This study was funded by the National Institutes of Health Fogarty International Center (grant number D43TW011403) for the project entitled ‘International Training Program in Environmental Health over the Lifespan’ (Claudio L & van Wendel de Joode B, PIs), a grant awarded to the Icahn School of Medicine at Mount Sinai and Universidad Nacional, Costa Rica; and the Consejo Nacional de Rectores (CONARE), Costa Rica, the Vicerrectoría de Investigación of the Universidad de Costa Rica (projects C1455 and C2650; Rojas-Jiménez K, PI) and Universidad Nacional (project 0522-21, Arias-Andrés M, PI).
Institutional Review Board Statement
Not applicable.
Informed Consent Statement
Not applicable.
Data Availability Statement
The original contributions presented in the study are included in the article/Supplementary Material. Metagenomic data were uploaded to the repository (National Center for Biotechnology Information, NCBI) that can be found at http://www.ncbi.nlm.nih.gov/bioproject/PRJNA1240286 (Bioproject accession no. PRJNA1240286).
Acknowledgments
The authors also thank Eddy Gómez from the Research Center for Marine and Limnological Sciences (CIMAR), UCR, for supporting field sampling and physicochemical analyses.
Conflicts of Interest
The authors declare no conflicts of interest.
References
- D. Numberger et al., “Urbanization promotes specific bacteria in freshwater microbiomes including potential pathogens,” Science of the Total Environment, vol. 845, Nov. 2022. [CrossRef]
- L. Zhu, R. Li, Y. Yan, and L. Cui, “Urbanization drives the succession of antibiotic resistome and microbiome in a river watershed,” Chemosphere, vol. 301, Aug. 2022. [CrossRef]
- E. Morales-Mora, L. Rivera-Montero, J. R. Montiel-Mora, K. Barrantes-Jiménez, and L. Chacón-Jiménez, “Assessing microbial risks of Escherichia coli: A spatial and temporal study of virulence and resistance genes in surface water in resource-limited regions,” Science of The Total Environment, vol. 958, p. 178044, Jan. 2025. [CrossRef]
- L. Zhang et al., “Antibiotic resistance genes and mobile genetic elements in different rivers: The link with antibiotics, microbial communities, and human activities,” Science of the Total Environment, vol. 919, Apr. 2024. [CrossRef]
- S. M. Laperriere, R. H. Hilderbrand, S. R. Keller, R. Trott, and A. E. Santoro, “Headwater stream microbial diversity and function across agricultural and urban land use gradients,” Appl Environ Microbiol, vol. 86, no. 11, Jun. 2020. [CrossRef]
- S. Castañeda-Barba, E. M. Top, and T. Stalder, “Plasmids, a molecular cornerstone of antimicrobial resistance in the One Health era,” Jan. 01, 2024, Nature Research. [CrossRef]
- H. Huang et al., “Diverse and abundant antibiotics and antibiotic resistance genes in an urban water system,” J Environ Manage, vol. 231, pp. 494–503, Feb. 2019. [CrossRef]
- N. A. Sabri et al., “Prevalence of antibiotics and antibiotic resistance genes in a wastewater effluent-receiving river in the Netherlands,” J Environ Chem Eng, vol. 8, no. 1, 2020. [CrossRef]
- T. M. Nolan et al., “Agricultural and urban practices are correlated to changes in the resistome of riverine systems,” Science of the Total Environment, vol. 927, Jun. 2024. [CrossRef]
- N. P. Marathe, C. Pal, S. S. Gaikwad, V. Jonsson, E. Kristiansson, and D. G. J. Larsson, “Untreated urban waste contaminates Indian river sediments with resistance genes to last resort antibiotics,” Water Res, vol. 124, pp. 388–397, 2017. [CrossRef]
- B. Mendoza-Guido, K. Barrantes, C. Rodríguez, K. Rojas-Jimenez, and M. Arias-Andres, “The Impact of Urban Pollution on Plasmid-Mediated Resistance Acquisition in Enterobacteria from a Tropical River,” Antibiotics, vol. 13, no. 11, Nov. 2024. [CrossRef]
- R. T. Botts et al., “Characterization of four multidrug resistance plasmids captured from the sediments of an urban coastal wetland,” Front Microbiol, vol. 8, no. OCT, Oct. 2017. [CrossRef]
- A. Di Cesare, E. M. Eckert, M. Rogora, and G. Corno, “Rainfall increases the abundance of antibiotic resistance genes within a riverine microbial community,” Environmental Pollution, vol. 226, pp. 473–478, 2017. [CrossRef]
- G. Reichert et al., “Determination of antibiotic resistance genes in a WWTP-impacted river in surface water, sediment, and biofilm: Influence of seasonality and water quality,” Science of the Total Environment, vol. 768, 2021. [CrossRef]
- A. Zoppini, N. Ademollo, S. Amalfitano, P. Casella, L. Patrolecco, and S. Polesello, “Organic priority substances and microbial processes in river sediments subject to contrasting hydrological conditions,” Science of the Total Environment, vol. 484, no. 1, pp. 74–83, Jun. 2014. [CrossRef]
- C. Pan, Y. Bao, and B. Xu, “Seasonal variation of antibiotics in surface water of Pudong New Area of Shanghai, China and the occurrence in typical wastewater sources,” Chemosphere, vol. 239, Jan. 2020. [CrossRef]
- V. Nessner Kavamura, R. G. Taketani, M. D. Lançoni, F. D. Andreote, R. Mendes, and I. Soares de Melo, “Water Regime Influences Bulk Soil and Rhizosphere of Cereus jamacaru Bacterial Communities in the Brazilian Caatinga Biome,” PLoS One, vol. 8, no. 9, Sep. 2013. [CrossRef]
- M. Arias-Andres, F. Mena, and M. Pinnock, “Ecotoxicological evaluation of aquaculture and agriculture sediments with biochemical biomarkers and bioassays: Antimicrobial potential exposure,” J Environ Biol, vol. 35, no. January, pp. 107–117, 2014.
- M. J. Fernandes et al., “Antibiotics and antidepressants occurrence in surface waters and sediments collected in the north of Portugal,” Chemosphere, vol. 239, Jan. 2020. [CrossRef]
- B. Yitayew et al., “Antimicrobial resistance genes in microbiota associated with sediments and water from the Akaki river in Ethiopia,” Environmental Science and Pollution Research, vol. 29, no. 46, pp. 70040–70055, 2022. [CrossRef]
- S. Heim and J. Schwarzbauer, “Pollution history revealed by sedimentary records: A review,” Environ Chem Lett, vol. 11, no. 3, pp. 255–270, 2013. [CrossRef]
- Z. Maghsodian et al., “Occurrence and Distribution of Antibiotics in the Water, Sediment, and Biota of Freshwater and Marine Environments: A Review,” Nov. 01, 2022, MDPI. [CrossRef]
- H. Zhang et al., “Pollution gradients shape the co-occurrence networks and interactions of sedimentary bacterial communities in Taihu Lake, a shallow eutrophic lake,” J Environ Manage, vol. 305, Mar. 2022. [CrossRef]
- J. Rodríguez-Beltrán, J. DelaFuente, R. León-Sampedro, R. C. MacLean, and Á. San Millán, “Beyond horizontal gene transfer: the role of plasmids in bacterial evolution,” Jun. 01, 2021, Nature Research. [CrossRef]
- S. R. Partridge, S. M. Kwong, N. Firth, and S. O. Jensen, “Mobile Genetic Elements Associated with Antimicrobial Resistance,” Clin Microbiol Rev, vol. 31, no. 4, Oct. 2018. [CrossRef]
- A. Kothari et al., “Large circular plasmids from groundwater plasmidomes span multiple incompatibility groups and are enriched in multimetal resistance genes,” mBio, vol. 10, no. 1, Jan. 2019. [CrossRef]
- S. R. Stockdale et al., “Metagenomic assembled plasmids of the human microbiome vary across disease cohorts,” Sci Rep, vol. 12, no. 1, Dec. 2022. [CrossRef]
- SINIGIRH, “Sistema Nacional de Información Para La Gestión Integrada Del Recurso Hídrico.,” https://mapas.da.go.cr/mapnew.php. [Online]. Available: http://mapas.da.go.cr/.
- K. Barrantes-Jiménez et al., “Anthropogenic imprint on riverine plasmidome diversity and proliferation of antibiotic resistance genes following pollution and urbanization,” Water Res, vol. 281, Aug. 2025. [CrossRef]
- UNESCO, “Partnerships and cooperation for water The United Nations World Water Development Report 2023,” Paris, 2023. [Online]. Available: www.unwater.org.
- J. Herrera-Murillo, D. Anchía-Leitón, J. F. Rojas-Marín, D. Mora-Campos, A. Gamboa-Jiménez, and M. Chaves-Villalobos, “Influencia de los patrones de uso de la tierra en la calidad de las aguas superfciales de la subcuenca del río Virilla, Costa Rica,” Revista Geográfica de América Central, vol. 4, no. 61E, p. 11, May 2019. [CrossRef]
- L. Mena-Rivera, O. Vásquez-Bolaños, C. Gómez-Castro, A. Fonseca-Sánchez, A. Rodríguez-Rodríguez, and R. Sánchez-Gutiérrez, “Ecosystemic assessment of surface water quality in the Virilla River: Towards sanitation processes in Costa Rica,” Water (Switzerland), vol. 10, no. 7, pp. 1–16, 2018. [CrossRef]
- Intergovernmental Panel on Climate Change (IPCC), “Climate Change 2021: The Physical Science Basis. Technical Summary,” Cambridge University Press, Jul. 2023. [CrossRef]
- B. Adyari et al., “Seasonal hydrological dynamics govern lifestyle preference of aquatic antibiotic resistome,” Environmental Science and Ecotechnology, vol. 13, Jan. 2023. [CrossRef]
- X. Jiang et al., “Antibiotic resistance genes and mobile genetic elements in a rural river in Southeast China: Occurrence, seasonal variation and association with the antibiotics,” Science of the Total Environment, vol. 778, Jul. 2021. [CrossRef]
- J. Bengtsson-Palme, E. Kristiansson, and D. G. J. Larsson, “Environmental factors influencing the development and spread of antibiotic resistance,” FEMS Microbiol Rev, vol. 42, no. 1, pp. 68–80, 2018. [CrossRef]
- M. Amarasiri, D. Sano, and S. Suzuki, “Understanding human health risks caused by antibiotic resistant bacteria (ARB) and antibiotic resistance genes (ARG) in water environments: Current knowledge and questions to be answered,” Crit Rev Environ Sci Technol, vol. 50, no. 19, pp. 2016–2059, Oct. 2020. [CrossRef]
- T. P. Neher, L. Ma, T. B. Moorman, A. Howe, and M. L. Soupir, “Seasonal variations in export of antibiotic resistance genes and bacteria in runoff from an agricultural watershed in Iowa,” Science of the Total Environment, vol. 738, Oct. 2020. [CrossRef]
- M. Zalewska, A. Błażejewska, A. Czapko, and M. Popowska, “Antibiotics and Antibiotic Resistance Genes in Animal Manure – Consequences of Its Application in Agriculture,” Mar. 29, 2021, Frontiers Media S.A. [CrossRef]
- S. Suhartono, M. Savin, and E. E. Gbur, “Genetic redundancy and persistence of plasmid-mediated trimethoprim/sulfamethoxazole resistant effluent and stream water Escherichia coli,” Water Res, vol. 103, pp. 197–204, Oct. 2016. [CrossRef]
- T. H. Le et al., “Occurrences and characterization of antibiotic-resistant bacteria and genetic determinants of hospital wastewater in a tropical country,” Antimicrob Agents Chemother, vol. 60, no. 12, pp. 7449–7456, Dec. 2016. [CrossRef]
- J. P. Díaz-Madriz et al., “Assessing antimicrobial consumption in public and private sectors within the Costa Rican health system: current status and future directions,” BMC Public Health, vol. 24, no. 1, Dec. 2024. [CrossRef]
- M. Blanco-Meneses, O. Castro-Zúñiga, and A. Calderón-Abarca, “Diagnóstico del uso de antibióticos en regiones productoras de tomate en Costa Rica,” Agronomía Costarricense, vol. 1, no. 47, pp. 87–99, 2023, Accessed: Mar. 10, 2025. [Online]. Available: www.mag.go.cr/rev_agr/index.html.
- E. D. La Cruz, F. Garcia, and A. Molina, “Hazard prioritization and risk characterization of antibiotics in an irrigated Costa Rican region used for intensive crop, livestock and aquaculture farming,” J Environ Biol, vol. 35, no. Special issue, pp. 85–98, 2014.
- F. Granados-Chinchilla and C. Rodríguez, “Tetracyclines in Food and Feedingstuffs: From Regulation to Analytical Methods, Bacterial Resistance, and Environmental and Health Implications,” 2017, Hindawi Limited. [CrossRef]
- Costa Rica Gobierno del Bicentenario, “Plan de acción nacional de lucha contra la Resistencia a los antimicrobianos Costa Rica 2018-2025,” 2018. Accessed: Mar. 03, 2024. [Online]. Available: https://www.ministeriodesalud.go.cr/index.php/biblioteca-de-archivos-left/documentos-ministerio-de-salud/vigilancia-de-la-salud/normas-protocolos-guias-y-lineamientos/resistencia-a-los-antimicrobianos/1861-plan-de-accion-nacional-de-lucha-contra-la-resistencia-a-los-antimicrobianos-costa-rica-2018-2025/file.
- A. Li et al., “Occurrence and distribution of antibiotic resistance genes in the sediments of drinking water sources, urban rivers, and coastal areas in Zhuhai, China,” Environmental Science and Pollution Research, vol. 25, no. 26, pp. 26209–26217, Sep. 2018. [CrossRef]
- S. Zhang, G. Yang, Y. Zhang, and C. Yang, “High-throughput profiling of antibiotic resistance genes in the Yellow River of Henan Province, China,” Sci Rep, vol. 14, no. 1, Dec. 2024. [CrossRef]
- S. Haenelt, H. H. Richnow, J. A. Müller, and N. Musat, “Antibiotic resistance indicator genes in biofilm and planktonic microbial communities after wastewater discharge,” Front Microbiol, vol. 14, 2023. [CrossRef]
- E. Strugeon, V. Tilloy, M. C. Ploy, and S. Da Re, “The stringent response promotes antibiotic resistance dissemination by regulating integron integrase expression in biofilms,” mBio, vol. 7, no. 4, Jul. 2016. [CrossRef]
- L. Philippot, B. S. Griffiths, and S. Langenheder, “Microbial Community Resilience across Ecosystems and Multiple Disturbances,” Microbiology and Molecular Biology Reviews, vol. 85, no. 2, May 2021. [CrossRef]
- S. Liu, P. Wang, C. Wang, X. Wang, and J. Chen, “Anthropogenic disturbances on antibiotic resistome along the Yarlung Tsangpo River on the Tibetan Plateau: Ecological dissemination mechanisms of antibiotic resistance genes to bacterial pathogens,” Water Res, vol. 202, Sep. 2021. [CrossRef]
- I. Lekunberri, J. L. Balcázar, and C. M. Borrego, “Metagenomic exploration reveals a marked change in the river resistome and mobilome after treated wastewater discharges,” Environmental Pollution, vol. 234, pp. 538–542, Mar. 2018. [CrossRef]
- P. Kämpfer, “Acinetobacter,” in Encyclopedia of Food Microbiology: Second Edition, Elsevier Inc., 2014, pp. 11–17. [CrossRef]
- K. Towner, “The Genus Acinetobacter,” pp. 746–758, 2006. [CrossRef]
- Y. Dai, J. Gao, and M. Jiang, “Case Report: A rare infection of multidrug-resistant Aeromonas caviae in a pediatric case with acute lymphoblastic leukemia and review of the literature,” Front Pediatr, vol. 12, 2024. [CrossRef]
- C. Mayslich, P. A. Grange, N. Dupin, and H. Brüggemann, “microorganisms Cutibacterium acnes as an Opportunistic Pathogen: An Update of Its Virulence-Associated Factors,” 2021. [CrossRef]
- T. Nakamura et al., “Epidemiology of Escherichia coli, Klebsiella Species, and Proteus mirabilis strains producing extended-spectrum -βlactamases from clinical samples in the Kinki region of Japan,” Am J Clin Pathol, vol. 137, no. 4, pp. 620–626, Apr. 2012. [CrossRef]
- S. Zayet et al., “Leclercia adecarboxylata as emerging pathogen in human infections: Clinical features and antimicrobial susceptibility testing,” Pathogens, vol. 10, no. 11, Nov. 2021. [CrossRef]
- M. S. Chorost et al., “Bacteraemia due to Microbacterium paraoxydans in a patient with chronic kidney disease, refractory hypertension and sarcoidosis,” JMM Case Rep, vol. 5, no. 11, Nov. 2018. [CrossRef]
- K. Yao and D. Liu, “Moraxella catarrhalis,” in Molecular Medical Microbiology, Third Edition, Elsevier, 2023, pp. 1503–1517. [CrossRef]
- O. M. Alzahrani et al., “Pseudomonas putida: Sensitivity to Various Antibiotics, Genetic Diversity, Virulence, and Role of Formic Acid to Modulate the Immune-Antioxidant Status of the Challenged Nile tilapia Compared to Carvacrol Oil,” Fishes, vol. 8, no. 1, Jan. 2023. [CrossRef]
- C. Niu, B. Wang, Z. Wang, and H. Zhang, “Effect of pH on antibiotic resistance genes removal and bacterial nucleotides metabolism function in the wastewater by the combined ferrate and sulfite treatment,” Chemical Engineering Journal, vol. 480, Jan. 2024. [CrossRef]
- Q. Yu et al., “Metagenomics reveals the response of antibiotic resistance genes to elevated temperature in the Yellow River,” Science of the Total Environment, vol. 859, Feb. 2023. [CrossRef]
- Z. Huang, W. Zhao, T. Xu, B. Zheng, and D. Yin, “Occurrence and distribution of antibiotic resistance genes in the water and sediments of Qingcaosha Reservoir, Shanghai, China,” Environ Sci Eur, vol. 31, no. 1, Dec. 2019. [CrossRef]
- C. Mora-Aparicio, C. Alfaro-Chinchilla, J. P. Pérez-Molina, and I. Vega-Guzmán, “Environmental contribution of Los Tajos wastewater treatment plant in the removal of physicochemical and microbiological pollutants,” Uniciencia, vol. 36, no. 1, pp. 1–17, 2022. [CrossRef]
- R. M. Brown, N. I. McClelland, R. A. Deininger, and M. F. O’Connor, “A water quality index-crashing the psychological barrier,” 1972.
- M. Marselina, F. Wibowo, and A. Mushfiroh, “Water quality index assessment methods for surface water: A case study of the Citarum River in Indonesia,” Heliyon, vol. 8, no. 7, Jul. 2022. [CrossRef]
- G. Srivastava and P. Kumar, “Water Quality Index with Missing Parameters,” IJRET: International Journal of Research in Engineering and Technology, vol. 2, no. 4, Apr. 2013, [Online]. Available: http://www.ijret.org.
- I. Ichwana, S. Syahrul, and W. Nelly, “Water Quality Index by Using National Sanitation Foundation-Water Quality Index (NSF-WQI) Method at Krueng Tamiang Aceh,” in Proceeding of the First International Conference on Technology, Innovation and Society, ITP Press, Jul. 2016, pp. 110–117. [CrossRef]
- M. G. Uddin, S. Nash, and A. I. Olbert, “A review of water quality index models and their use for assessing surface water quality,” Mar. 01, 2021, Elsevier B.V. [CrossRef]
- S. Chen, Y. Zhou, Y. Chen, and J. Gu, “Fastp: An ultra-fast all-in-one FASTQ preprocessor,” in Bioinformatics, Oxford University Press, Sep. 2018, pp. i884–i890. [CrossRef]
- B. Langmead and S. L. Salzberg, “Fast gapped-read alignment with Bowtie 2,” Nat Methods, vol. 9, no. 4, pp. 357–359, Apr. 2012. [CrossRef]
- D. E. Wood, J. Lu, and B. Langmead, “Improved metagenomic analysis with Kraken 2,” Genome Biol, vol. 20, no. 1, Nov. 2019. [CrossRef]
- P. A. Chaumeil, A. J. Mussig, P. Hugenholtz, and D. H. Parks, “GTDB-Tk: A toolkit to classify genomes with the genome taxonomy database,” Bioinformatics, vol. 36, no. 6, pp. 1925–1927, 2020. [CrossRef]
- J. Lu, F. P. Breitwieser, P. Thielen, and S. L. Salzberg, “Bracken: Estimating species abundance in metagenomics data,” PeerJ Comput Sci, vol. 2017, no. 1, 2017. [CrossRef]
- P. J. McMurdie and S. Holmes, “Shiny-phyloseq: Web application for interactive microbiome analysis with provenance tracking,” Bioinformatics, vol. 31, no. 2, pp. 282–283, Jan. 2015. [CrossRef]
- A. Bartlett, D. Padfield, L. Lear, R. Bendall, and M. Vos, “A comprehensive list of bacterial pathogens infecting humans,” Microbiology (United Kingdom), vol. 168, no. 12, 2022. [CrossRef]
- D. Li, C. M. Liu, R. Luo, K. Sadakane, and T. W. Lam, “MEGAHIT: An ultra-fast single-node solution for large and complex metagenomics assembly via succinct de Bruijn graph,” Bioinformatics, vol. 31, no. 10, pp. 1674–1676, May 2015. [CrossRef]
- A. Mikheenko, V. Saveliev, and A. Gurevich, “MetaQUAST: Evaluation of metagenome assemblies,” Bioinformatics, vol. 32, no. 7, pp. 1088–1090, Apr. 2016. [CrossRef]
- M. K. Yu, E. C. Fogarty, and A. M. Eren, “Diverse plasmid systems and their ecology across human gut metagenomes revealed by PlasX and MobMess,” Nat Microbiol, vol. 9, no. 3, pp. 830–847, Mar. 2024. [CrossRef]
- A. M. Eren et al., “Community-led, integrated, reproducible multi-omics with anvi’o,” Jan. 01, 2021, Nature Research. [CrossRef]
- D. Hyatt, G.-L. Chen, P. F. Locascio, M. L. Land, F. W. Larimer, and L. J. Hauser, “Prodigal: prokaryotic gene recognition and translation initiation site identification,” 2010. [Online]. Available: http://www.biomedcentral.com/1471-2105/11/119.
- M. Y. Galperin et al., “COG database update 2024,” Nucleic Acids Res, vol. 53, no. D1, pp. D356–D363, Jan. 2025. [CrossRef]
- J. Mistry et al., “Pfam: The protein families database in 2021,” Nucleic Acids Res, vol. 49, no. D1, pp. D412–D419, Jan. 2021. [CrossRef]
- B. Jia et al., “CARD 2017: Expansion and model-centric curation of the comprehensive antibiotic resistance database,” Nucleic Acids Res, vol. 45, no. D1, pp. D566–D573, Jan. 2017. [CrossRef]
- H. Li et al., “The Sequence Alignment/Map format and SAMtools,” Bioinformatics, vol. 25, no. 16, pp. 2078–2079, Aug. 2009. [CrossRef]
- A. Bairoch and R. Apweiler, “The SWISS-PROT protein sequence database and its supplement TrEMBL in 2000,” 2000. [Online]. Available: http://www.expasy.
- W. Wang and M. E. Griswold, “Natural interpretations in Tobit regression models using marginal estimation methods,” Stat Methods Med Res, vol. 26, no. 6, pp. 2622–2632, Dec. 2017. [CrossRef]
- L. G. Halsey, “The reign of the p-value is over: What alternative analyses could we employ to fill the power vacuum?,” May 01, 2019, Royal Society Publishing. [CrossRef]
Figure 1.
Relative abundance of ARGs in water and sediment samples from the Virilla River by qPCR during the three sampling campaigns.
Figure 1.
Relative abundance of ARGs in water and sediment samples from the Virilla River by qPCR during the three sampling campaigns.
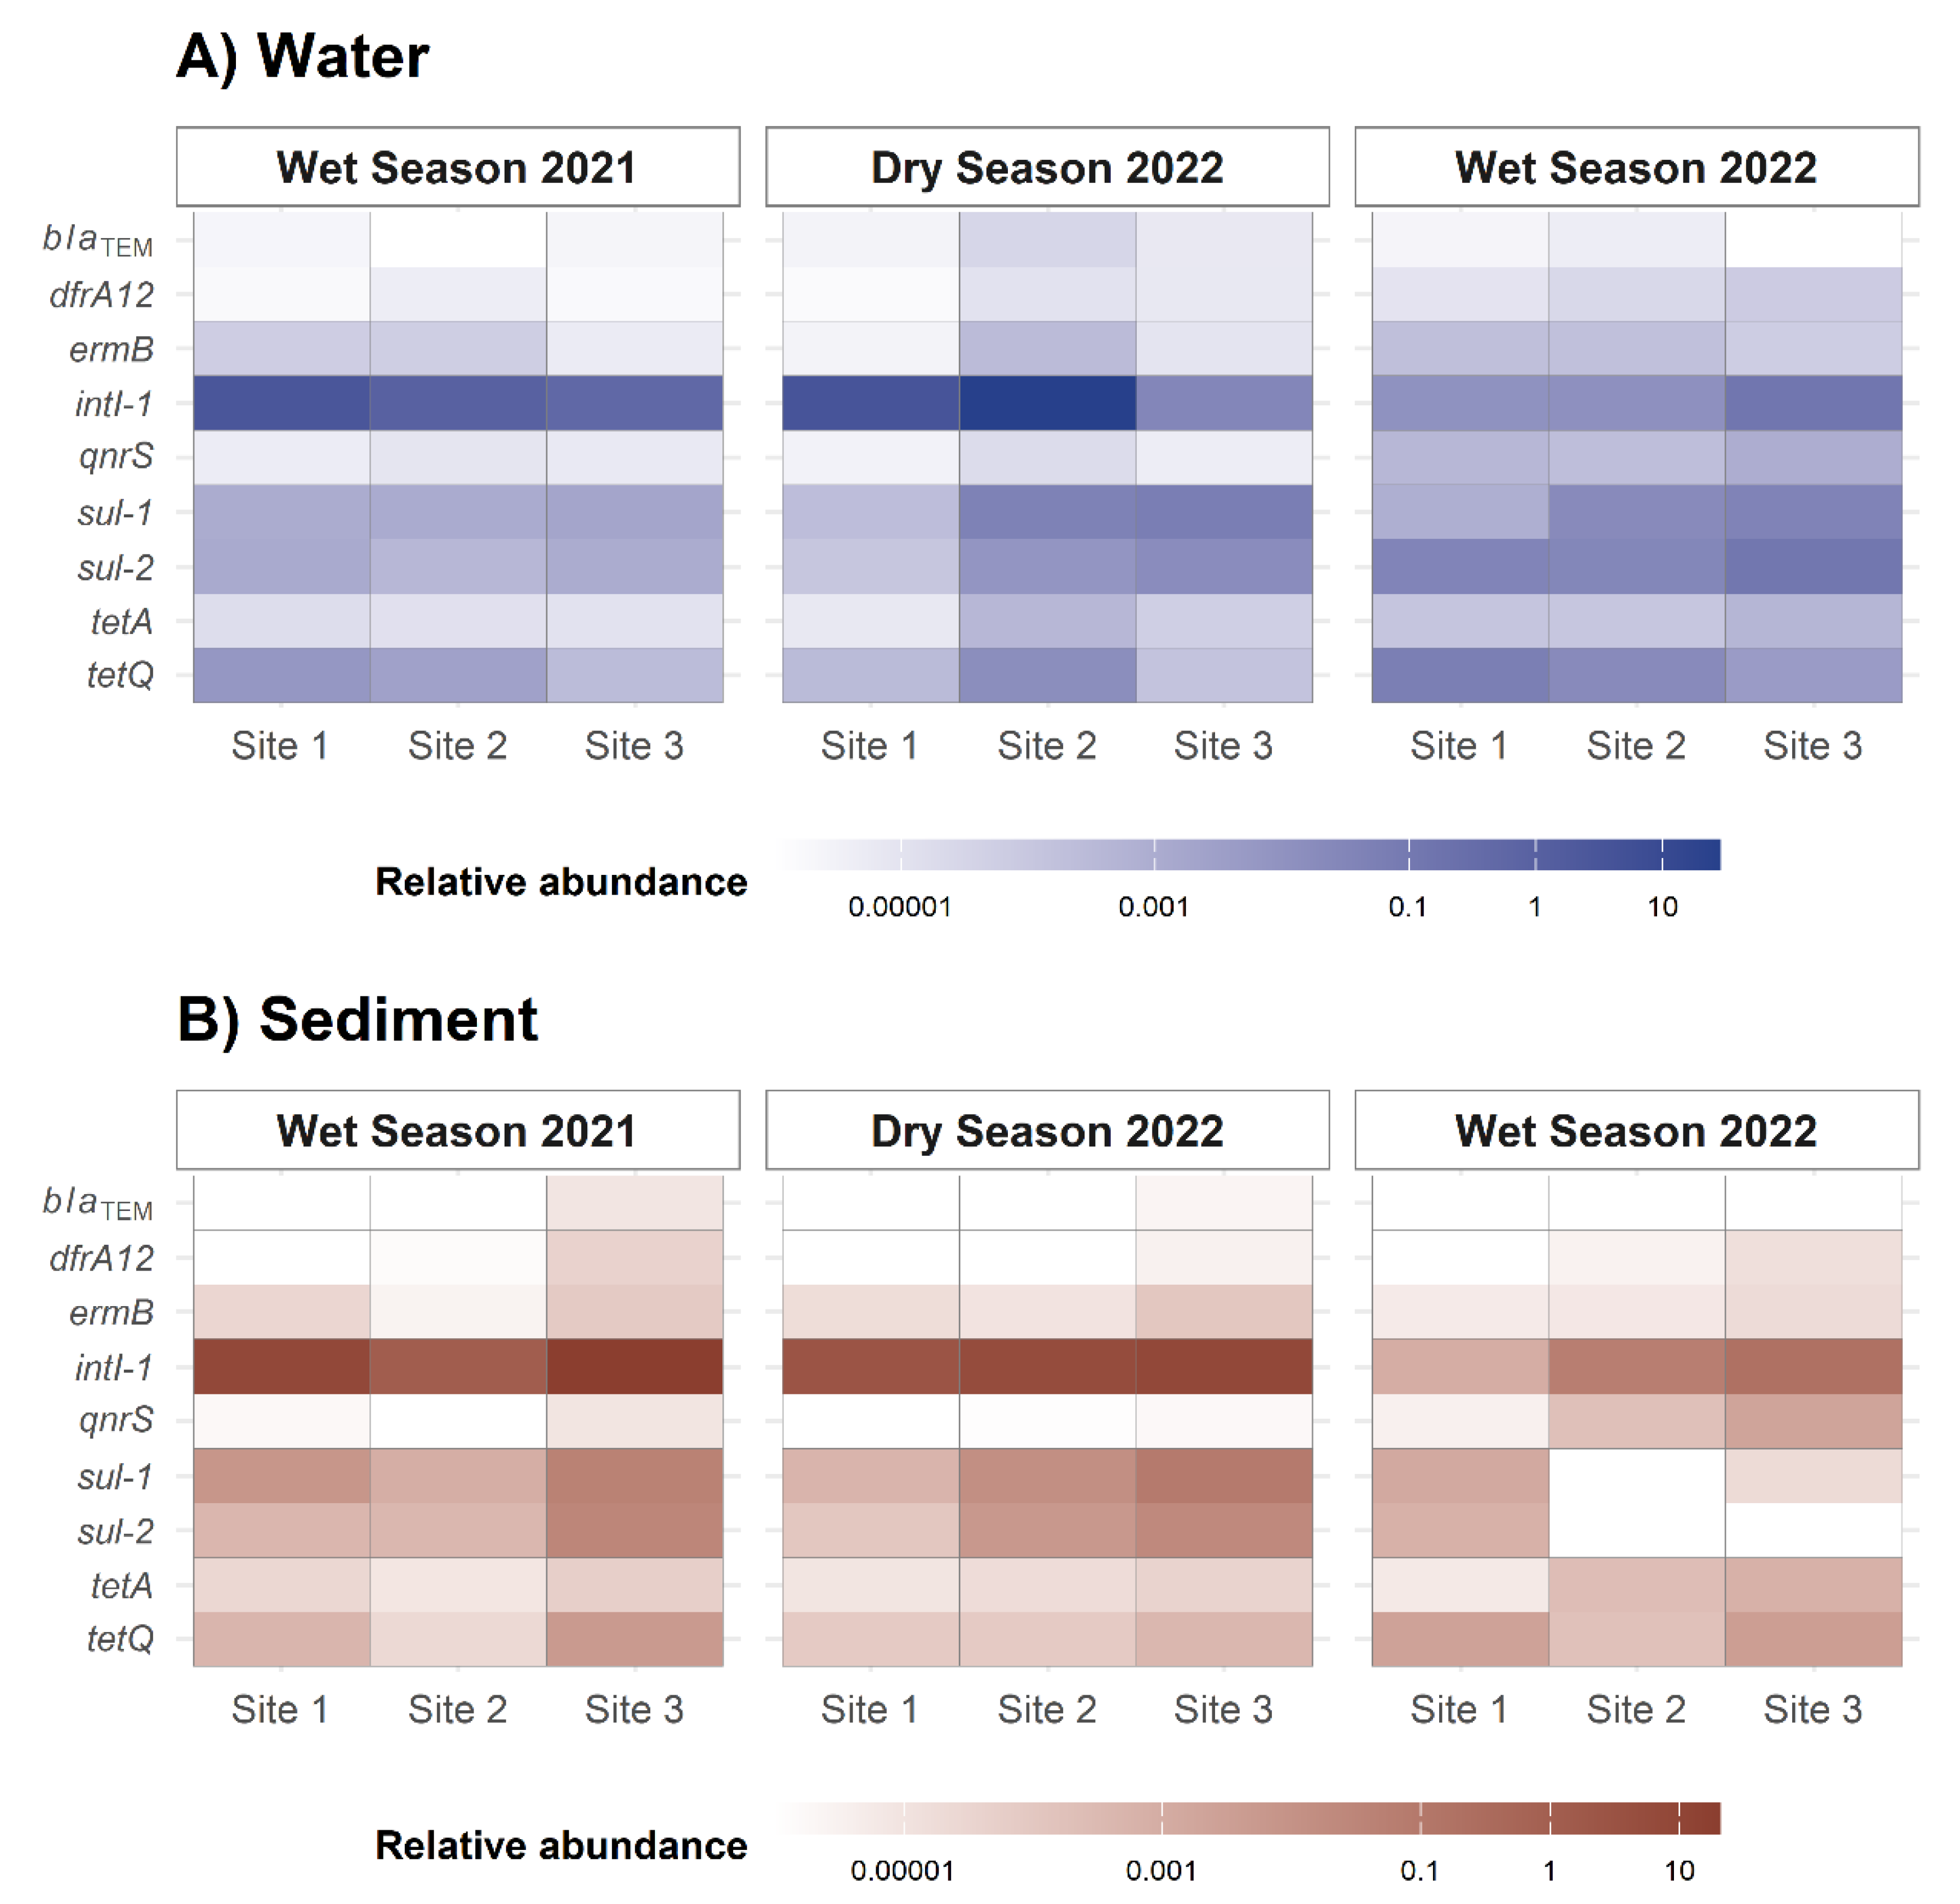
Figure 2.
Alpha diversity plots show the number of taxa (Richness) and the Shannon diversity index derived from A) chromosomal and B) plasmidic datasets of potential pathogenic genera of the sediment samples. Data is presented by sampling campaigns and site.
Figure 2.
Alpha diversity plots show the number of taxa (Richness) and the Shannon diversity index derived from A) chromosomal and B) plasmidic datasets of potential pathogenic genera of the sediment samples. Data is presented by sampling campaigns and site.
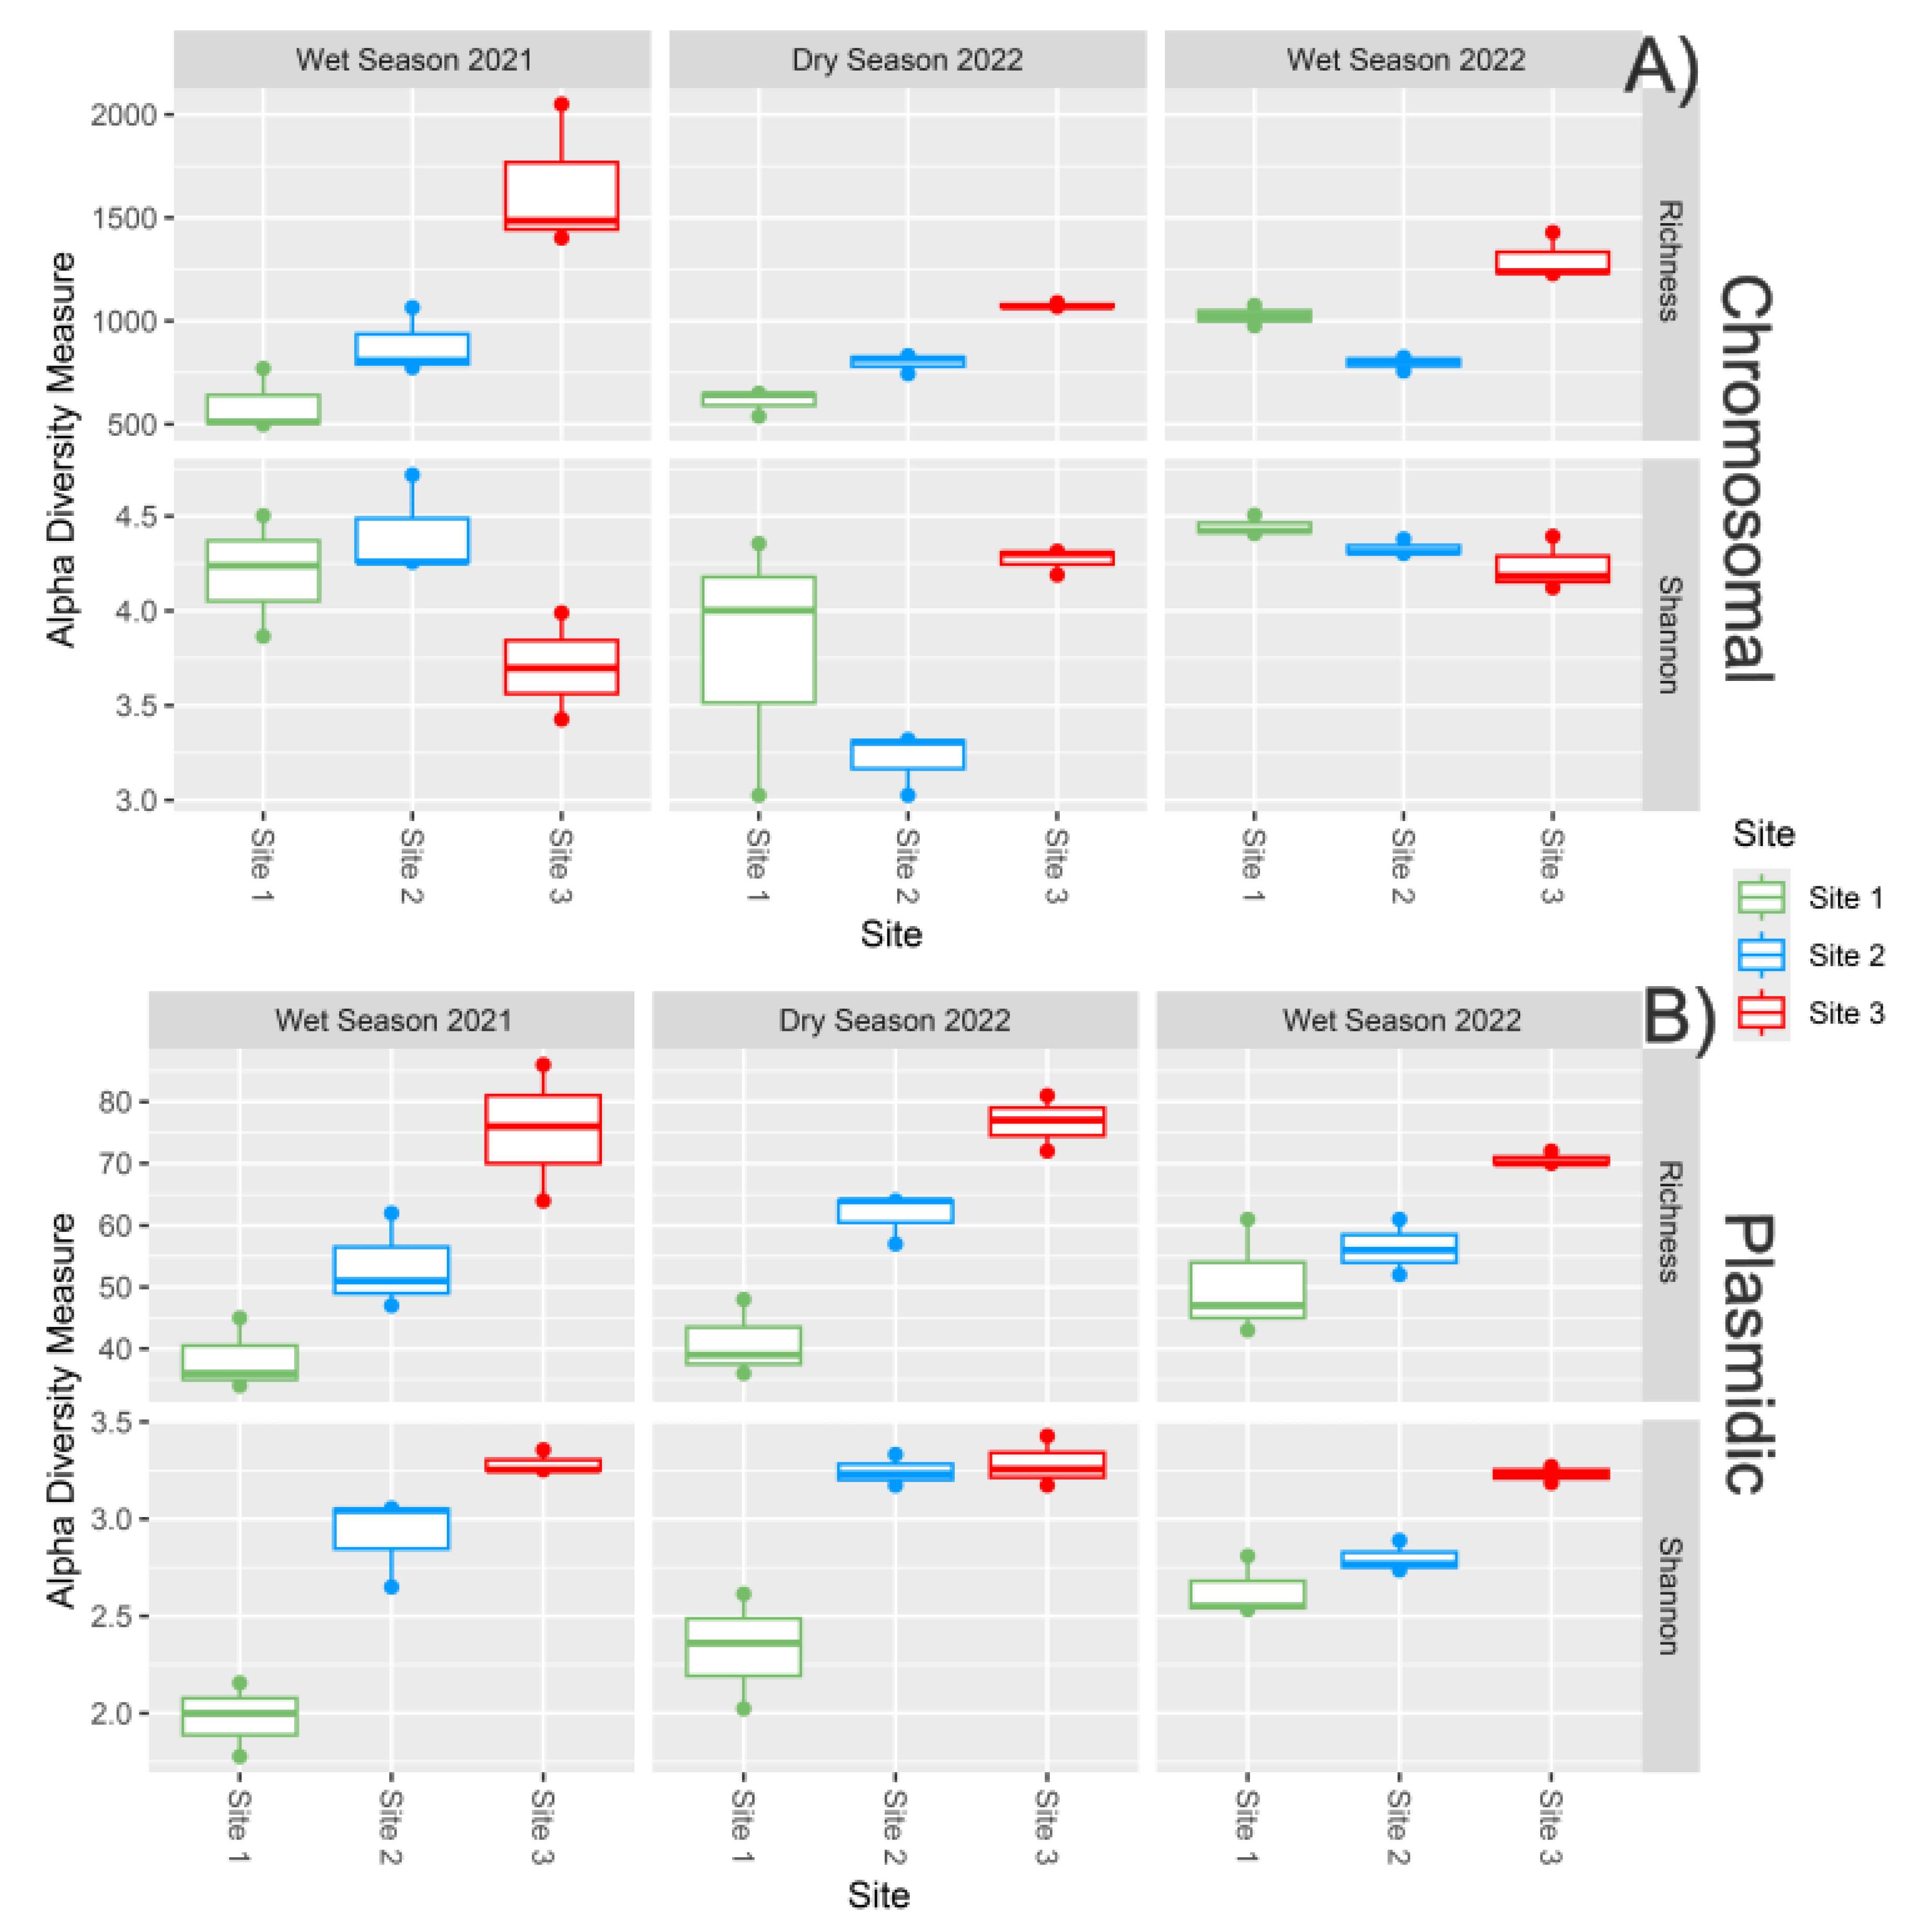
Figure 3.
Principal Coordinates Analysis (PCoA) based on Bray-Curtis dissimilarity matrices computed from centered log-ratio (CLR) transformed taxonomic abundance profiles of potential pathogens in sediment samples. Panel A shows chromosomal profiles; Panel B shows plasmidic profiles. Colors indicate sampling campaigns (green = Wet Season 2021, blue = Dry Season 2022, red = Wet Season 2022), while shapes represent sampling sites. Ellipses denote sample variability within each site.
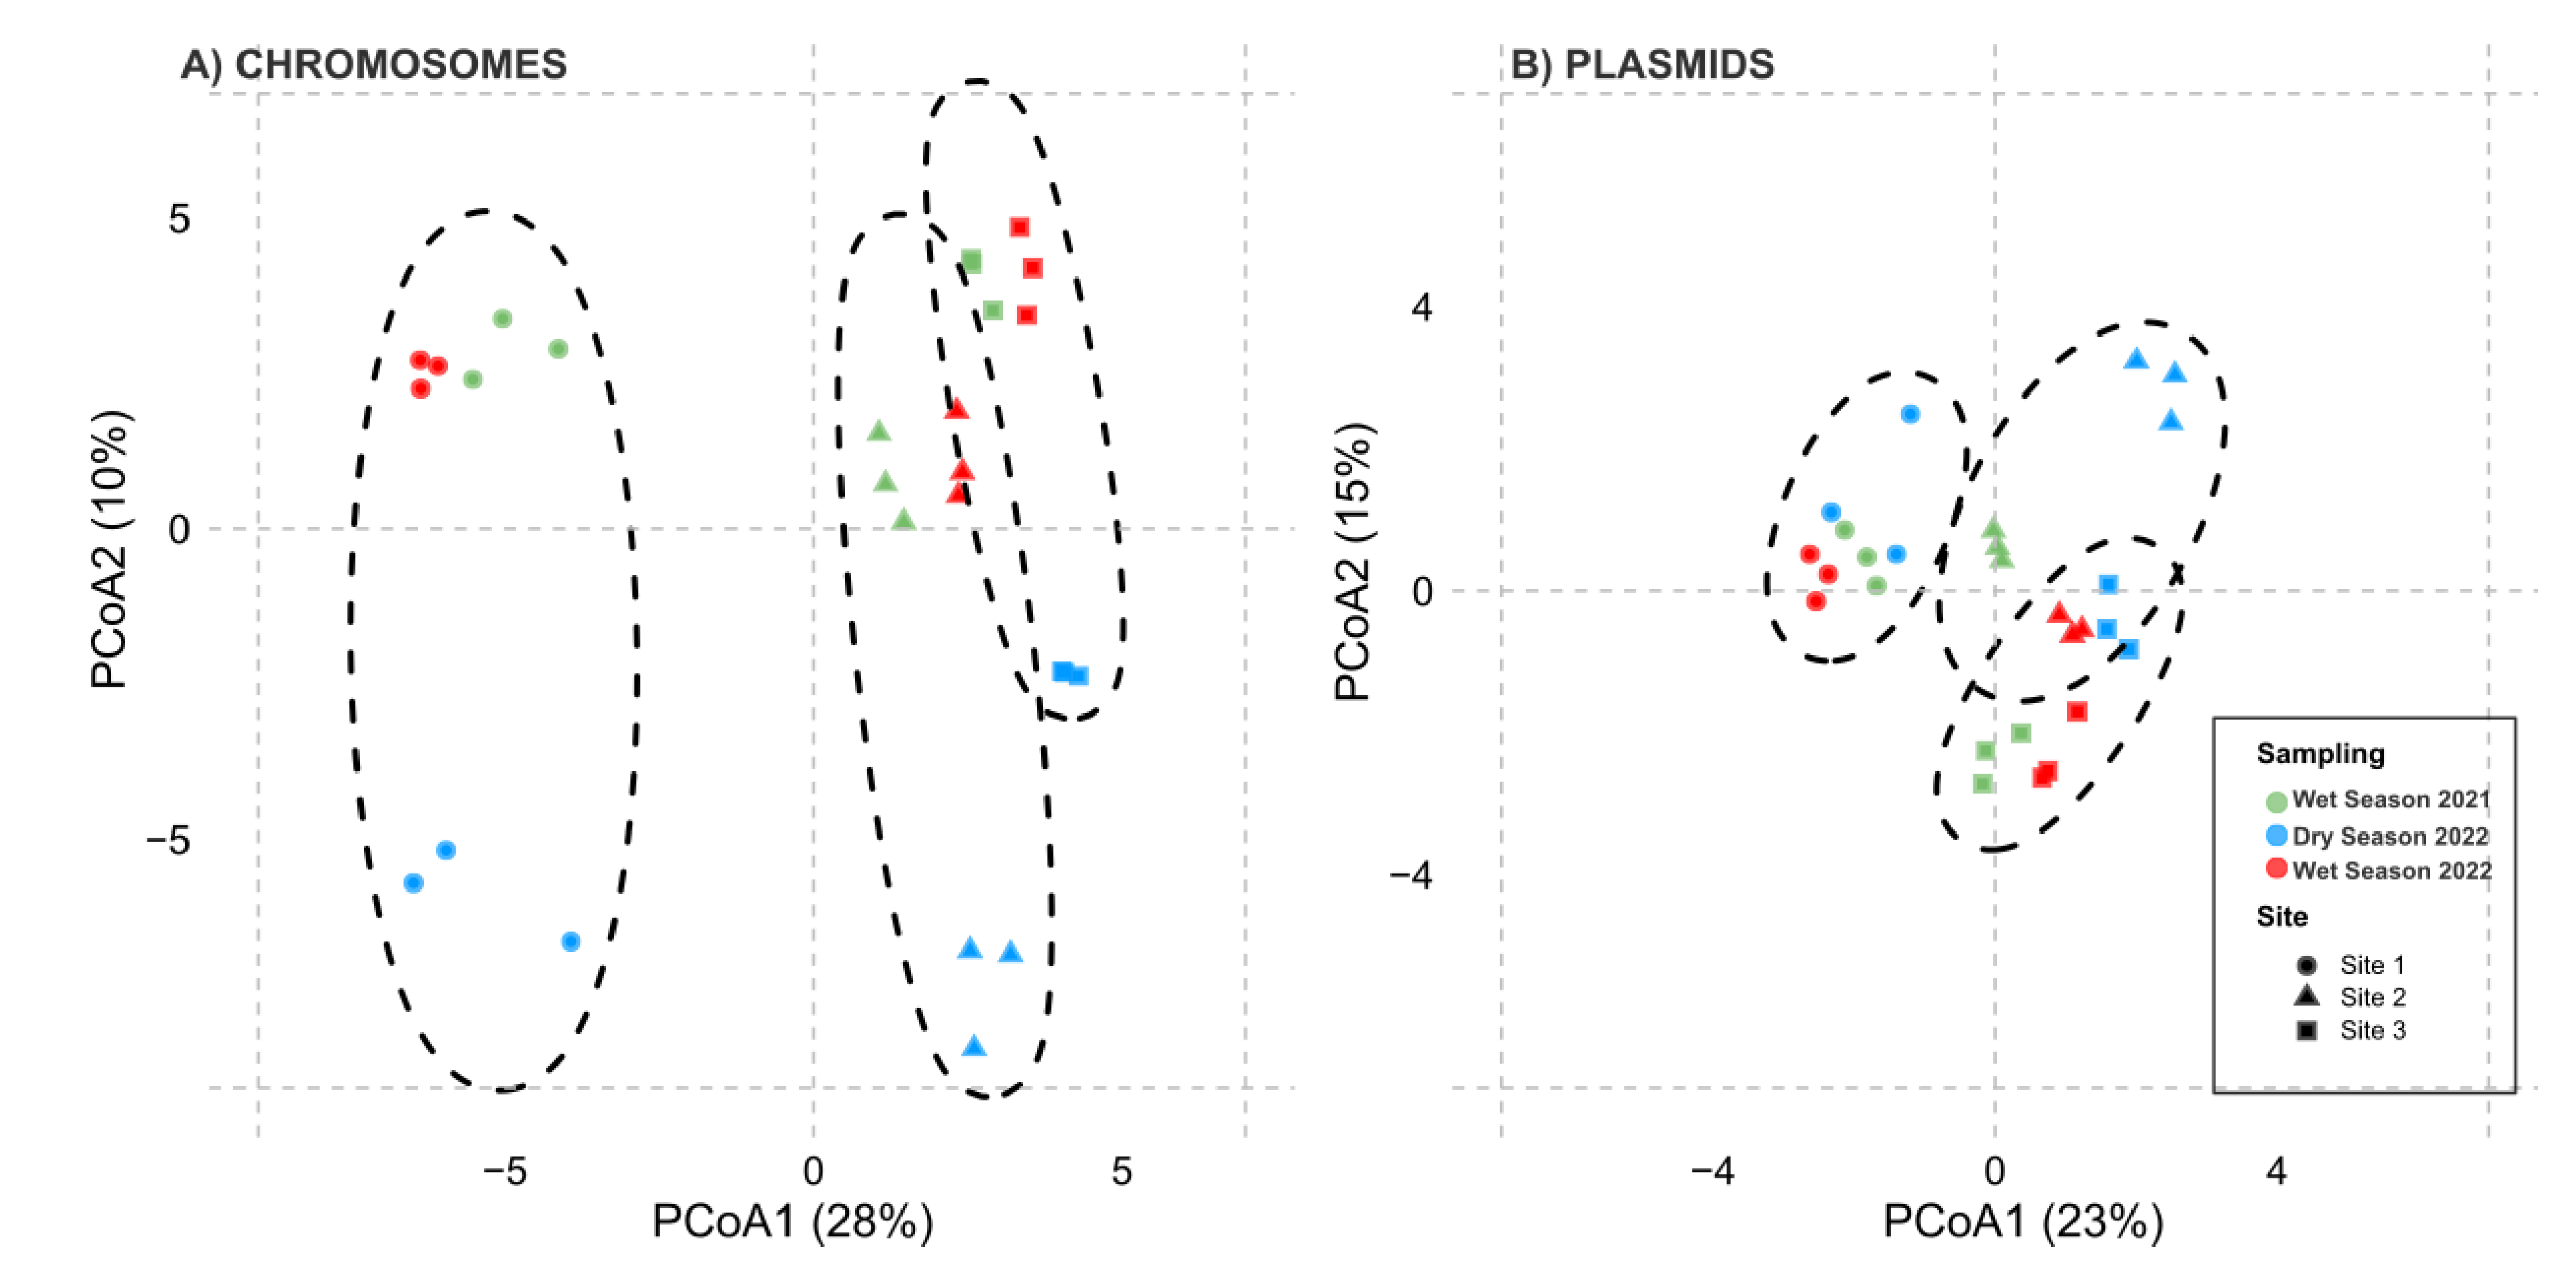
Figure 4.
The abundance of antibiotic resistance genes (ARGs) in samples from the Virilla River. Panels A (Chromosomes) and B (Plasmids) present the abundance of ARGs in Reads Per Kilobase Million (RPKM) values. ARGs are grouped by categories based on their potential resistance phenotypes. Rows are reordered using a hierarchical clustering method, with bars on the right indicating the prevalence of ARGs across all samples. Only sampling sites where ARGs were detected are shown.
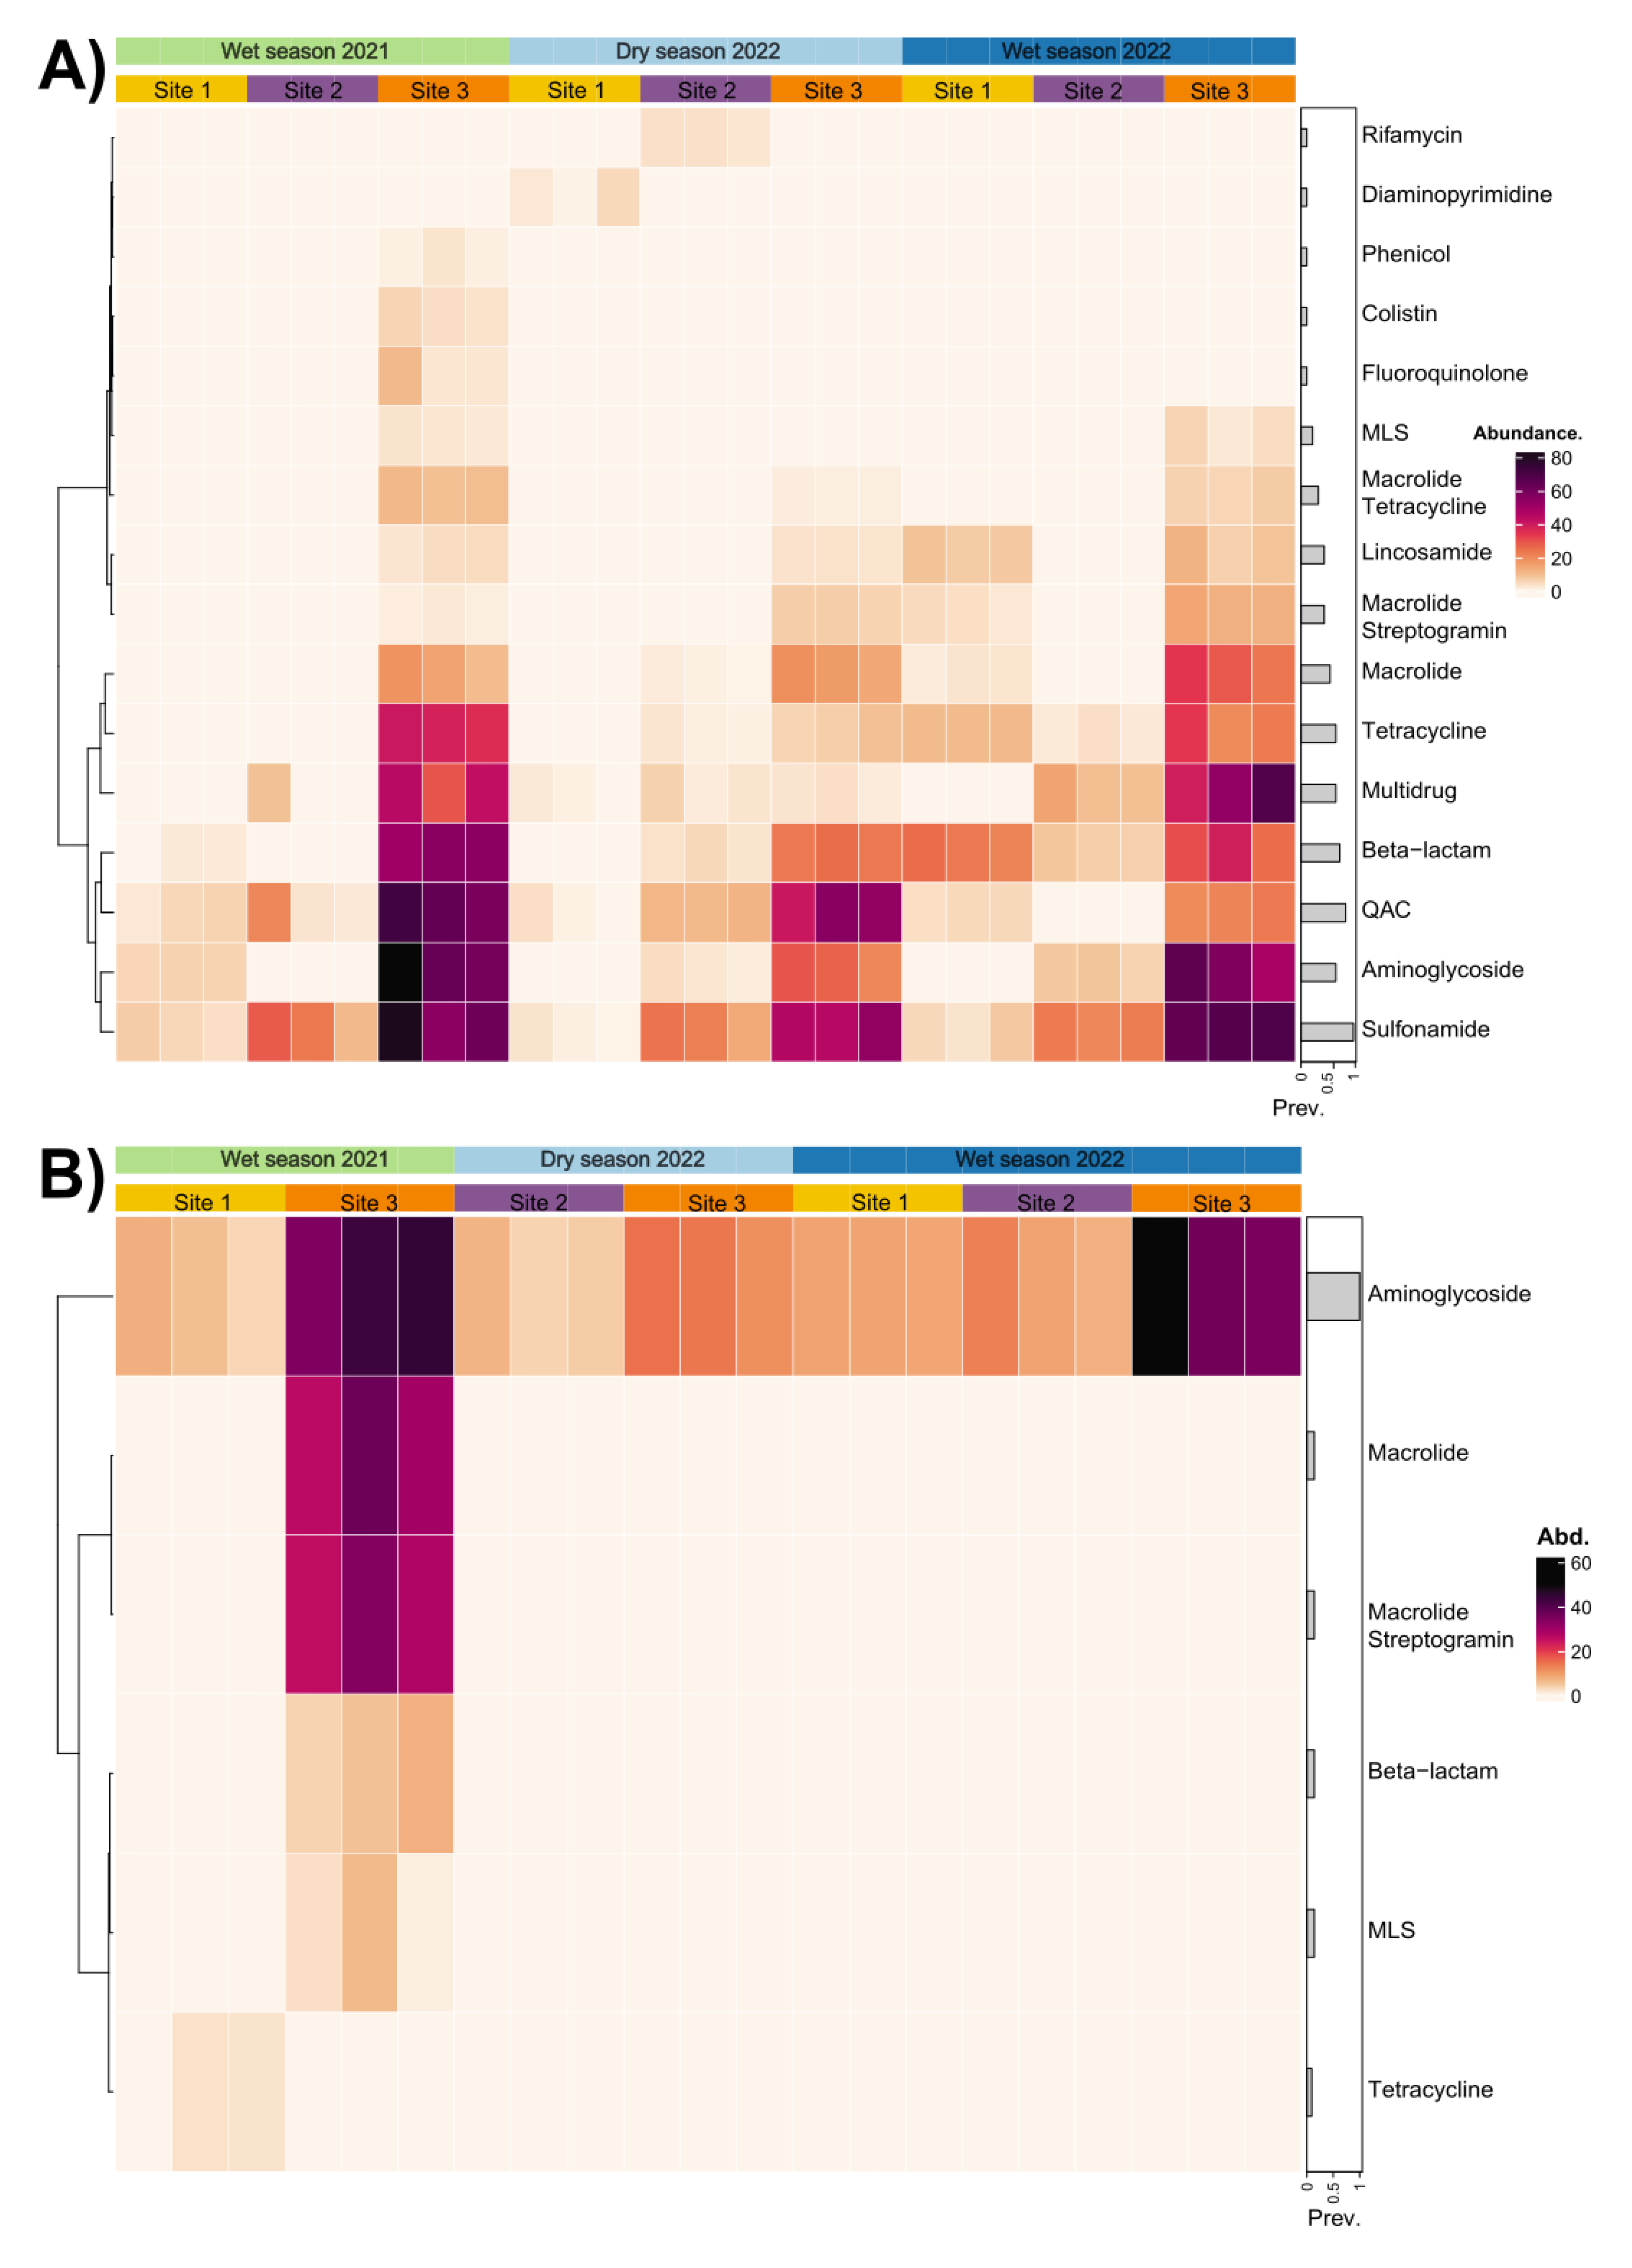
Figure 5.
Virilla River watershed map. Locations of the sampling sites and the SJ-WWTP within the main course of the Virilla River.
Figure 5.
Virilla River watershed map. Locations of the sampling sites and the SJ-WWTP within the main course of the Virilla River.
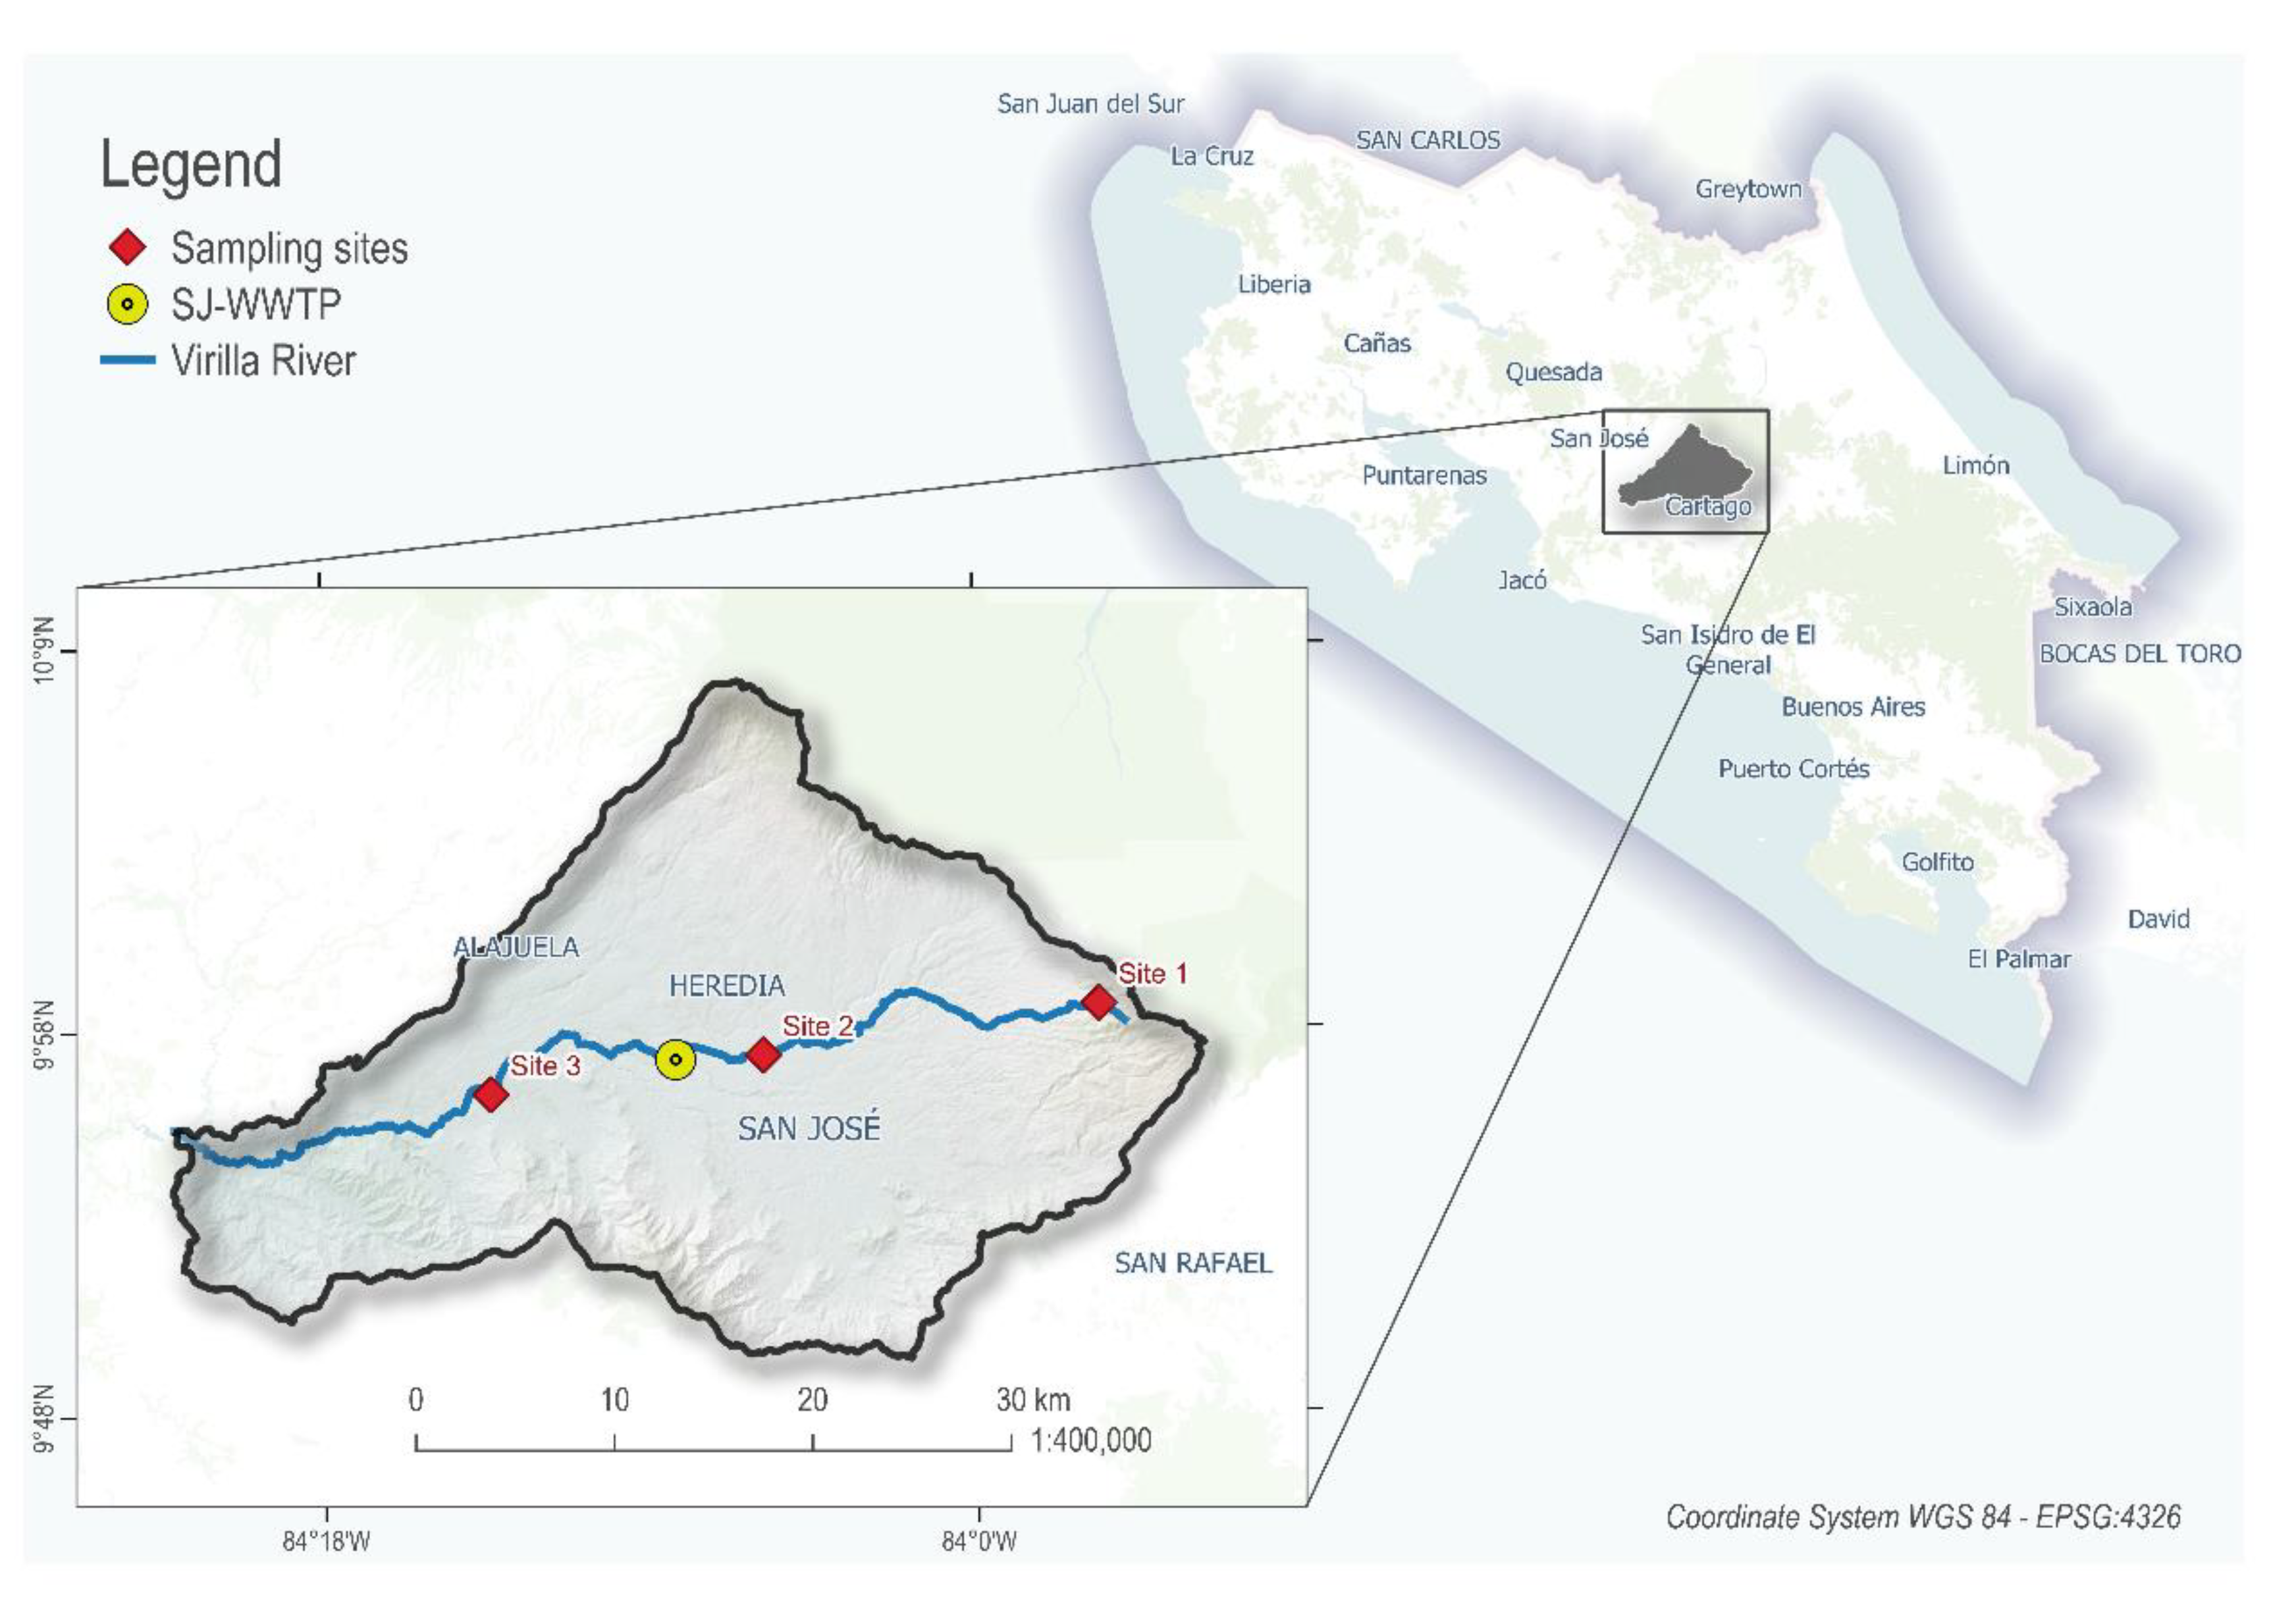

Table 1.
Physical-chemical and microbiological parameters of water samples in the Virilla River Watershed.
Table 1.
Physical-chemical and microbiological parameters of water samples in the Virilla River Watershed.
| Sampling sites | Fecal coliforms (mean ± standard deviation) MPN/100 ml |
E.coli (mean ± standard deviation) MPN/100 ml | E.faecalis (mean ± standard deviation) MPN/100 ml | O2 sat % (mean ± standard deviation) |
Temperature (mean ± standard deviation) °C |
pH (mean ± standard deviation | Turbidity (mean ± standard deviation) UNT | NSFQI |
|---|---|---|---|---|---|---|---|---|
| Sampling campaign 1 (wet season 2021) | ||||||||
| Site 1 | (4.33 ± 7.76) × 10^4 | (2.99 ± 4.34) × 10^4 | (3.12 ± 1.90) × 10^4 | 71.4 ± 3.7 | 18.7 ± 3.2 | 7.94 ± 2.30e-01 | 142.0 ± 95.4 | 44 |
| Site 2 | (6.79 ± 10.50) × 10^4 | (6.79 ± 10.50) × 10^4 | (1.10 ± 1.65) × 10^5 | 61.1 ± 33.0 | 19.5 ± 3.5 | 7.90 ± 2.23e-01 | 33.0 ± 9.3 | 41 |
| Site 3 | (1.48 ± 1.49) × 10^5 | (1.35 ± 1.54) × 10^5 | (1.92 ± 12.30) × 10^4 | 51.9 ± 6.4 | 19.2 ± 3.4 | 7.93 ± 9.50e-02 | 13.1 ± 15.1 | 28 |
| Sampling campaign 2 (dry season 2022) | ||||||||
| Site 1 | (2.88 ± 0.64) × 10^2 | (2.11 ± 1.00) × 10^2 | (6.67 ± 3.29) × 10^2 | 78.1 ± 0.0 | 15.8 ± 0.0 | 7.51 ± 1.09e-15 | 9.8 ± 0.0 | 66 |
| Site 2 | (9.64 ± 7.22) × 10^4 | (6.71 ± 6.74) × 10^4 | (1.87 ± 0.44) × 10^4 | 71.8 ± 0.0 | 23.4 ± 0.0 | 7.85 ± 1.09e-15 | 8.7 ± 0.0 | 49 |
| Site 3 | (3.38 ± 1.10) × 10^5 | (2.59 ± 1.00) × 10^5 | (5.58 ± 2.90) × 10^3 | 47.7 ± 0.0 | 28.0 ± 0.0 | 7.90 ± 1.09e-15 | 21.9 ± 0.3 | 35 |
| Sampling campaign 3 (wet season 2022) | ||||||||
| Site 1 | (4.60 ± 0.00) × 10^3 | (4.60 ± 0.00) × 10^3 | (3.50 ± 0.00) × 10^3 | 86.2 ± 0.0 | 15.9 ± 0.0 | 7.72 ± 0.00e+00 | 38.0 ± 3.0 | 49 |
| Site 2 | (9.20 ± 0.00) × 10^4 | (5.40 ± 0.00) × 10^4 | (3.50 ± 0.00) × 10^4 | 80.0 ± 0.0 | 20.7 ± 0.0 | 8.10 ± 0.00e+00 | 167.0 ± 2.0 | 41 |
| Site 3 | (7.00 ± 0.00) × 10^4 | (3.10 ± 0.00) × 10^4 | (9.20 ± 0.00) × 10^3 | 77.0 ± 0.0 | 25.6 ± 0.0 | 7.76 ± 1.09e-15 | 215.0 ± 5.0 | 42 |
Disclaimer/Publisher’s Note: The statements, opinions and data contained in all publications are solely those of the individual author(s) and contributor(s) and not of MDPI and/or the editor(s). MDPI and/or the editor(s) disclaim responsibility for any injury to people or property resulting from any ideas, methods, instructions or products referred to in the content. |
© 2025 by the authors. Licensee MDPI, Basel, Switzerland. This article is an open access article distributed under the terms and conditions of the Creative Commons Attribution (CC BY) license (http://creativecommons.org/licenses/by/4.0/).
Copyright: This open access article is published under a Creative Commons CC BY 4.0 license, which permit the free download, distribution, and reuse, provided that the author and preprint are cited in any reuse.


