
Submitted:
03 September 2025
Posted:
04 September 2025
You are already at the latest version
Abstract
To combat the growing issue of petroleum plastic waste, alternative bio-based polymers are being developed. Many of these biopolymers are made from bio-derived materials, or are biodegradable, but the most promising polymers fall in both categories. Polyhy-droxyalkanoates (PHAs) are one such class of polymers, and poly-3-hydroxybutyrate (P3HB), the most popular PHA, has shown great potential. A large drawback to large scale use of P3HB is the cost of its production. Production from local waste carbon sources, in largescale bioprocessing equipment, and using less chemically intensive extraction, drastically reduces P3HB’s cost. In America, the cotton industry offers millions of tons of cellulosic waste each year that can be transformed into a glucose solution. This study utilized two types of cotton-derived glucose, alongside commercial glucose, as a feedstock for the biosynthesis of P3HB by Ralstonia eutropha. The fermentation took place in a 2-L bioreactor, showing potential for scale-up, and a single-solvent extraction method was used, reducing chemical consumption. The resulting P3HB samples were compared to each other and to the literature based on polymer yield and thermal characteristics. First, while all samples averaged a smaller yield than seen in literature, the cotton-derived glucose was shown to yield more P3HB than commercial glucose. Further, cotton-derived P3HB had very similar thermal properties to the commercial glucose-derived P3HB. Lastly, all samples were shown to have a similar percent crystallinity, though slightly lower than that seen in literature. P3HB made from cotton-derived glucose was shown to have potential as a scalable, sustainable alternative process.
Keywords:
biopolymer
; bioreactor
; P3HB
; thermal analysis
1. Introduction
Petroleum plastics litter the environment because of their improper use. Many products today utilize these materials because of their low cost and availability, but not for their long lifespans [1]. In 2018, the U.S. collected over 35 million tons of plastic municipal solid waste [2]; clearly plastics are not being properly recycled or reused. There are some instances, as in the medical field during the COVID-19 pandemic, where long lasting, stable plastics are required for sterility and safety of single use products, but there is no reason such materials must be everywhere [3]. Making short- or single-use products from petroleum plastics that consume precious petroleum and take thousands of years to degrade only creates litter, pollution, and excessive waste [1,4,5,6]. Even more, petroleum plastics in outdoor applications create microplastics as UV and weather begin to degrade them [4]. Then, these microplastics contaminate the air, soil, and water, and later, living organisms [7]. As a result, material developers have been working to create bioplastics as alternatives to mitigate the issue of petroleum plastic waste.
Bioplastics are polymers that are bio-based using bio-derived raw materials or are bio-degradable or compostable in a timely manner into non-harmful materials. Bioplastics of most interest fall into both categories, some even utilizing biowaste as a raw material [8]. One high-value group of bioplastics, polyhydroxyalkanoates (PHAs), are being developed from waste biomass through microbial fermentation [4,8,9,10,11,12,13]. For example, from 2010-12 the European Commissions “ANIMPOL” project converted 500,000 tons per year of slaughterhouse waste (animal lipids) into 35,000 tons per year of PHA [9]. Instead of burning waste, valuable polymer was made.
The benefit of using waste biomass as opposed to raw biomass is the reduction of the final polymer cost. Raw material cost accounts for over 40% of total PHA production costs, making it the primary limiting factor of large-scale PHA production [8]. In 2023, the PHA market was expected to grow from $95 million to $195 million by 2028 [14]. For economically sustainable growth, every opportunity to reduce production costs must be taken so that PHAs may compete with the price-point of petroleum polymers.
As such, additional waste carbon sources have been explored. PHAs can be created from solid waste such as animal lipids, palm and olive oil effluent, and solids and wastewater from other agricultural products [9]. Plant-based agricultural waste can be used after it’s transformed into glucose, as done with hemp hurd [10]. Agricultural waste, given its constant production, appears a good carbon source for PHA, and potentially more economical sources of glucose exist besides hemp. Further cost reduction can occur by taking advantage of local biomass to limit transportation costs [8].
In the one-year period of August 2018 to July 2019, it is estimated that 1.3 million tons of crude fiber waste from carding, 7.8 million tons of cotton fiber waste from yarn production, and 3.8 million tons of cotton fabric waste from fabric production were generated by the global cotton and garment supply chain [15]. Combined, that is 12.9 million tons of global pre-garment cotton waste to create a final 14.6 million tons of cotton garments from 76.3 million tons of grown cotton globally [15]. According to the 2024 Monthly Economic Letter released by Cotton Incorporated, the leaders of cotton research and marketing in America, it is estimated that the U.S. produced 14.3 million 480-pound bales of cotton out of the 116.2 million produced worldwide in 2024 [16]; this puts the U.S. at 12.3% of global annual cotton grown and harvested in this past crop year. While not reported in the same year span, this percentage could be applied to the approximation of total cotton grown.
If 12.3% of 76.3 million tons of cotton grown annually world-wide was produced in the U.S., then 1.59 million tons of pre-garment cotton waste is created in the U.S. each year. That leaves a great supply of waste biomass to produce biopolymer. Enzymatic hydrolysis has been used to create glucose from pre-consumer cotton waste [15,17]. This glucose could be used to produce the most popular PHA, poly-3-hydroxybutyrate (P3HB).
P3HB is often produced from the fermentation of sugars using bacteria in growing conditions lacking specific nutrients, with a surplus of carbon [13]. This specific environment stresses the bacteria and causes them to store P3HB intracellularly as energy stores, much like animals' store fat [12]. Ralstonia eutropha, a common soil bacterium, is one of the best explored PHA producers [8]. Moreover, R. eutropha, also known by Cupriavidus necator, has been found to produce P3HB using glucose as the carbon feedstock [10].
Once a cost-effective carbon feedstock for P3HB production is chosen, other factors impacting expense of production can be addressed. The complexity of the production process, including growth medium, growing conditions, and the demand of sterility, increases the manufacturing cost of PHA [11]. To reduce this cost, the scalability of P3HB production can be modeled after current practices in the pharmaceutical industry that utilize large-scale bioreactors for bacterial growth [18]. These established, sterile systems can be modified to fit P3HB production, as opposed to creating entirely new facilities or machines. This idea has been explored using small-scale, 2 L bioreactors and models of large-scale production [10,11]. Nonetheless, the conditions must be optimized given the specific carbon source, as the mechanisms used to convert the carbon into P3HB will vary [19].
The cost of current downstream polymer extraction methods also limits the industrial adoption of PHA production [8]. Polymer extraction requires the lysing of the cells to recover the intracellular biopolymer. Previous work has presented numerous methods for P3HB extraction [19]. While chloroform extraction has been explored extensively, it is typically used along with other chemicals [10,20]. This project uses a single-solvent extraction method with chloroform, where polymer is precipitated from chloroform via rotary evaporator. Rotary evaporation, a well-known and scalable method, allows the chloroform to be collected and reused. To the authors’ knowledge, chloroform as a single solvent has yet to be applied in this setting.
A manufacturing process using a waste feedstock, efficient bioreactor system, and recycled lysing solvent could produce P3HB at an attractive price point for an eco-friendly plastic. P3HB is sometimes preferred over the most widely used bioplastic, poly-lactic acid (PLA). P3HB is bio-based, compostable, and biodegradable in soil, water, and commercial environments, whereas PLA only degrades in commercial composting [9]. Further, because of its strength, hydrophobicity, inertness, relatively high melting point, optical purity, and processability, P3HB could replace many single-use plastic products [10]. Particularly, P3HB could replace polypropylene in many instances, as they share similar performance properties [13]. Also, polypropylene, as a petroleum-based thermoplastic, requires a chemically intensive synthesis. P3HB uses bacteria, and R. eutropha is a nontoxic, common soil bacterium, making the production process safer than that of petroleum plastics [10]. In use, P3HB shows promise as medical implants (sutures, scaffolds) and disposable food packaging [21].
This work aims to apply the three cost-reduction techniques described above to the production of P3HB with R. eutropha, using cotton-derived glucose as the carbon feedstock. P3HB production using two versions of pre-consumer cotton waste derived glucose solutions provided by Cotton Incorporated will be compared to production using commercial glucose. The fermentation will be carried out in a scalable, 2-L cylindrical stirred tank reactor (STR) and lysed using chloroform and a roto-evaporation technique designed to capture and recycle the chloroform. The final P3HB from the different glucose sources will be compared based on polymer yield, as well as thermal properties.
2. Materials and Methods
2.1. Bacteria Preparation
R. eutropha, also known as Cupriavidus necator, was obtained from the American Type Culture Collection (ATCC) (ATCC17699). The lyophilized cell pellet from ATCC was resuspended following the ATCC published handling procedure. The liquid culture was incubated for 48 hours at 26°C and 200 RPM. Then, the liquid culture was used for glycerol stocks. To make the glycerol stock, a 1:1 ratio of liquid culture and glycerol were resuspended and stored at -80°C. A sample from the glycerol stock was sent to GENEWIZ (Azenta Life Sciences) for 16S rRNA gene sequencing [22].
Agar plates were poured from a solution consisting of 0.75 g beef extract, 1.25 g peptone, 3.75 g of agar, and diH2O to make a total volume of 250 mL [13]. The agar plates were inoculated with 2-4 drops of the previously prepared liquid culture prior to its incubation, and were incubated for 48 hours at 26°C. After incubation, agar plates were stored at 4°C and used to inoculate starter cultures for the bioreactor runs.
2.2. Media Preparation
A variety of different growth mediums were prepared and used during the growing procedure including nutrient broth, trace salt solution, mineral salt medium (MSM) kept as two parts (MSM1 and MSM2), commercial glucose (G), control cotton-derived glucose solution (CCG), and cutting waste cotton-derived glucose solution (CWG).
The nutrient broth was made with 0.75 g beef extract, 1.25 g peptone, and finished with diH2O to make a total volume of 250 mL [10].
The trace salt solution was made in a 100x concentration with 100 mg/L ZnSO4-7H2O, 30 mg/L MnCl2-4H2O, 300 mg/L H3BO3, 200 mg/L CoCl2-6H2O, 10 mg/L CuCl2-6H2O, 20 mg/L NiCl2-6H2O and 30 mg/L NaMoO4-2H2O and finished with diH2O for a total volume of 100 mL [13].
The mineral salt medium (MSM) was made in a 5x concentration in two parts to prevent phosphate precipitation. Part one (MSM1) consisted of 1.25 g NH4Cl, 0.25 g MgSO4, 3 mg (NH4) Fe(SO4)2 – 12H2O for a total volume of 250 mL [13]. Part two (MSM2) consisted of 7.5 g Na2HPO4, 1.25 g KH2PO4 for a total volume of 250 mL [13]. The two MSM formulations were maintained at a neutral pH using NaOH (1 M). All solutions, along with 1 L of diH2O, were autoclaved at 121°C for 30 minutes. Once cool, MSM1 and MSM2 both received 0.125 mL of the trace salt solution, making each solution 0.05% v/v trace salts [13].
The commercial glucose solution (G) was prepared according to Khattab [10]. In short, 80 g granulated D-glucose (ThermoScientific) was dissolved in 1 L diH2O, and the resultant solution was sterile filtered through a 0.2 um PTFE membrane. The cotton-derived glucose solutions were received from Cotton Incorporated. Control cotton glucose solution (CCG) was produced from Cotton Incorporated's own preproduction cotton waste, while cutting waste cotton glucose solution (CWG) was made from a major textile brand’s cotton fabric scrap. All solutions were made by Cotton Incorporated using enzymatic hydrolysis and were heated to 130°C after hydrolysis to denature the enzyme [17]. Upon receiving the solution, a sterile filter with a 0.2 um PTFE membrane was used to remove contaminants and remaining enzymes. The sterile solutions were kept at 4°C to reduce the risk of microbial contamination. The weight percent concentration of glucose for each solution was determined to find the correct dilutions necessary for the growth media.
2.3. Starter Culture Preparation
All procedures were completed within a sterile field. Starter cultures, containing a total of 5 mL of a 50/50 solution of nutrient broth and MSMs with various glucose sources, were prepared according to Table 1. Each inoculum tube then received a swipe of the R. eutropha bacterial lawn from the previously prepared agar plates and was incubated in a shaking incubator at 30°C and 200 RPM for 72 hours. This pre-fermentation inoculum growth was essential to acclimate the bacteria to using glucose as the carbon source for metabolism; it has been found that R. eutropha takes approximately 72 hours to get through the lag phase of growth while using glucose [10]. The inoculum media was 50% nutrient broth, as seen in Table 1, to encourage growth and establishment as the bacteria adjusted to the glucose carbon source.
2.4. Bioreactor Procedure
A 2-L stirred tank bioreactor (Sartorius Stedim Biostat A, Germany) was used for cell fermentation. All parts of the reactor were autoclaved at 121°C for 30 minutes in preparation for use. The set-up was carried out according to an SOP designed and verified by Jefferson’s Institute of Bioprocessing [23]. The starter culture, as described above, was used to inoculate the bioreactor according to Table 2. Roughly 15 mL of Antifoam B Emulsion, aqueous s-silicone emulsion (Sigma Aldrich) was deposited into the solution prior to the start of fermentation to prevent the foaming caused by agitation in the bioreactor. Batch fermentation was carried out for 72 hours, at 30°C, with agitation at 400 RPM and an airflow at 300 ccm. The air used to provide the system with oxygen was Breathing Grade Air (AirGas), which has 76.5 - 80.5% nitrogen and 19.5 - 23.5% oxygen.
2.5. Polymer Extraction
After 72 hours, the solutions were collected and centrifuged at 3000 RPM and 5°C for 10 minutes. The supernatant was poured off and the cell pellets of identical growing conditions were combined into a 500 mL round bottom, multi-neck glass vessel. This glass vessel was placed in an oven at 50°C to completely dry for 48-96 hours. This dry weight was recorded.
The volume of the required amount of chloroform was chosen based on Khattab’s methods as a 1:4 w/v ratio [10]. Under a fume hood, the chloroform was measured and poured into the glass vessel with the cell pellet. If the pellet appeared stuck to the bottom of the vessel, it was scraped up to expose as much of the cells as possible to the chloroform. The solution was ultrasonicated for 10 minutes on low power. After sonication, the flask was placed on a heating mantle that was set to 62°C to boil the solution for two hours. Next, the chloroform-cell solution was poured through a ceramic filter and filtered via vacuum with coarse P8 creped filter paper into an Erlenmeyer flask. The filter paper was set aside to dry for weight of the collected cell biomass. If there were cell particles stuck in it, the round bottom flask was also left to dry and weighed. The filtered chloroform solution was then poured into a single neck round bottom and placed on a Rotary Evaporator with a water bath set to 40°C until all the chloroform evaporated, and the polymer left as a film on the walls of the flask.
2.6. Solvent Cast Film Production
The biopolymer was peeled from the walls of the round bottom and collected into a small flat bottom glass evaporation dish, 7 cm in diameter. Small amounts of chloroform were dropped onto the polymer flakes until the polymer was mostly redissolved. The dish was then placed on a hot plate set to 100°C, and a slightly larger flat bottom evaporation dish was placed overtop to create an oven-like environment with dispersed heat. The solution was allowed to boil until most of the chloroform has evaporated. The temperature was then reduced to 50°C and left to completely dry. Once all the chloroform evaporated off, the solvent cast film was removed and stored in an airtight container.
2.7. Thermal Analysis
Thermogravimetric analysis (TGA) (TA Instruments Q50 TGA) and differential scanning calorimetry (DSC) (TA Instruments Q200 DSC) tests were performed on the produced polymer, as well as synthetic P3HB purchased from Sigma-Aldrich, to confirm the material made and assess future processing parameters. Specimens weighing approximately 5 mg were cut from solvent-casted films and used for all thermal analysis testing. All TGA ramp tests were run from 0°C to 350°C at 10°C/min with a 30 mL/min nitrogen gas flow rate. All DSC heat-cool-heat tests were run from -20°C to 200°C at 10°C/min with a 30 mL/min nitrogen gas flow rate.
Onset and end temperatures, peak temperatures, and enthalpy values were derived from the resulting graphs using TRIOS software (TA Instruments Waters). Reported values were rounded to the nearest whole number for ease of understanding, while calculations were conducted using exact values. Percent crystallization was calculated according to De Sousa Junior using the following formula:
where ΔH is the melting or crystallization enthalpy of the sample, and J/g, the melting enthalpy of 100% crystalline P3HB [24].
3. Results
3.1. Confirmation of R. eutropha in Culture
To confirm sterile growth conditions and the presence of R. eutropha, samples from the starter culture were sent out for analysis (Azenta Life Sciences). 16S rRNA gene sequencing confirmed that R. eutropha was the only species present in the sample.
3.2. P3HB Yields
3.3. Extraction and Film Casting
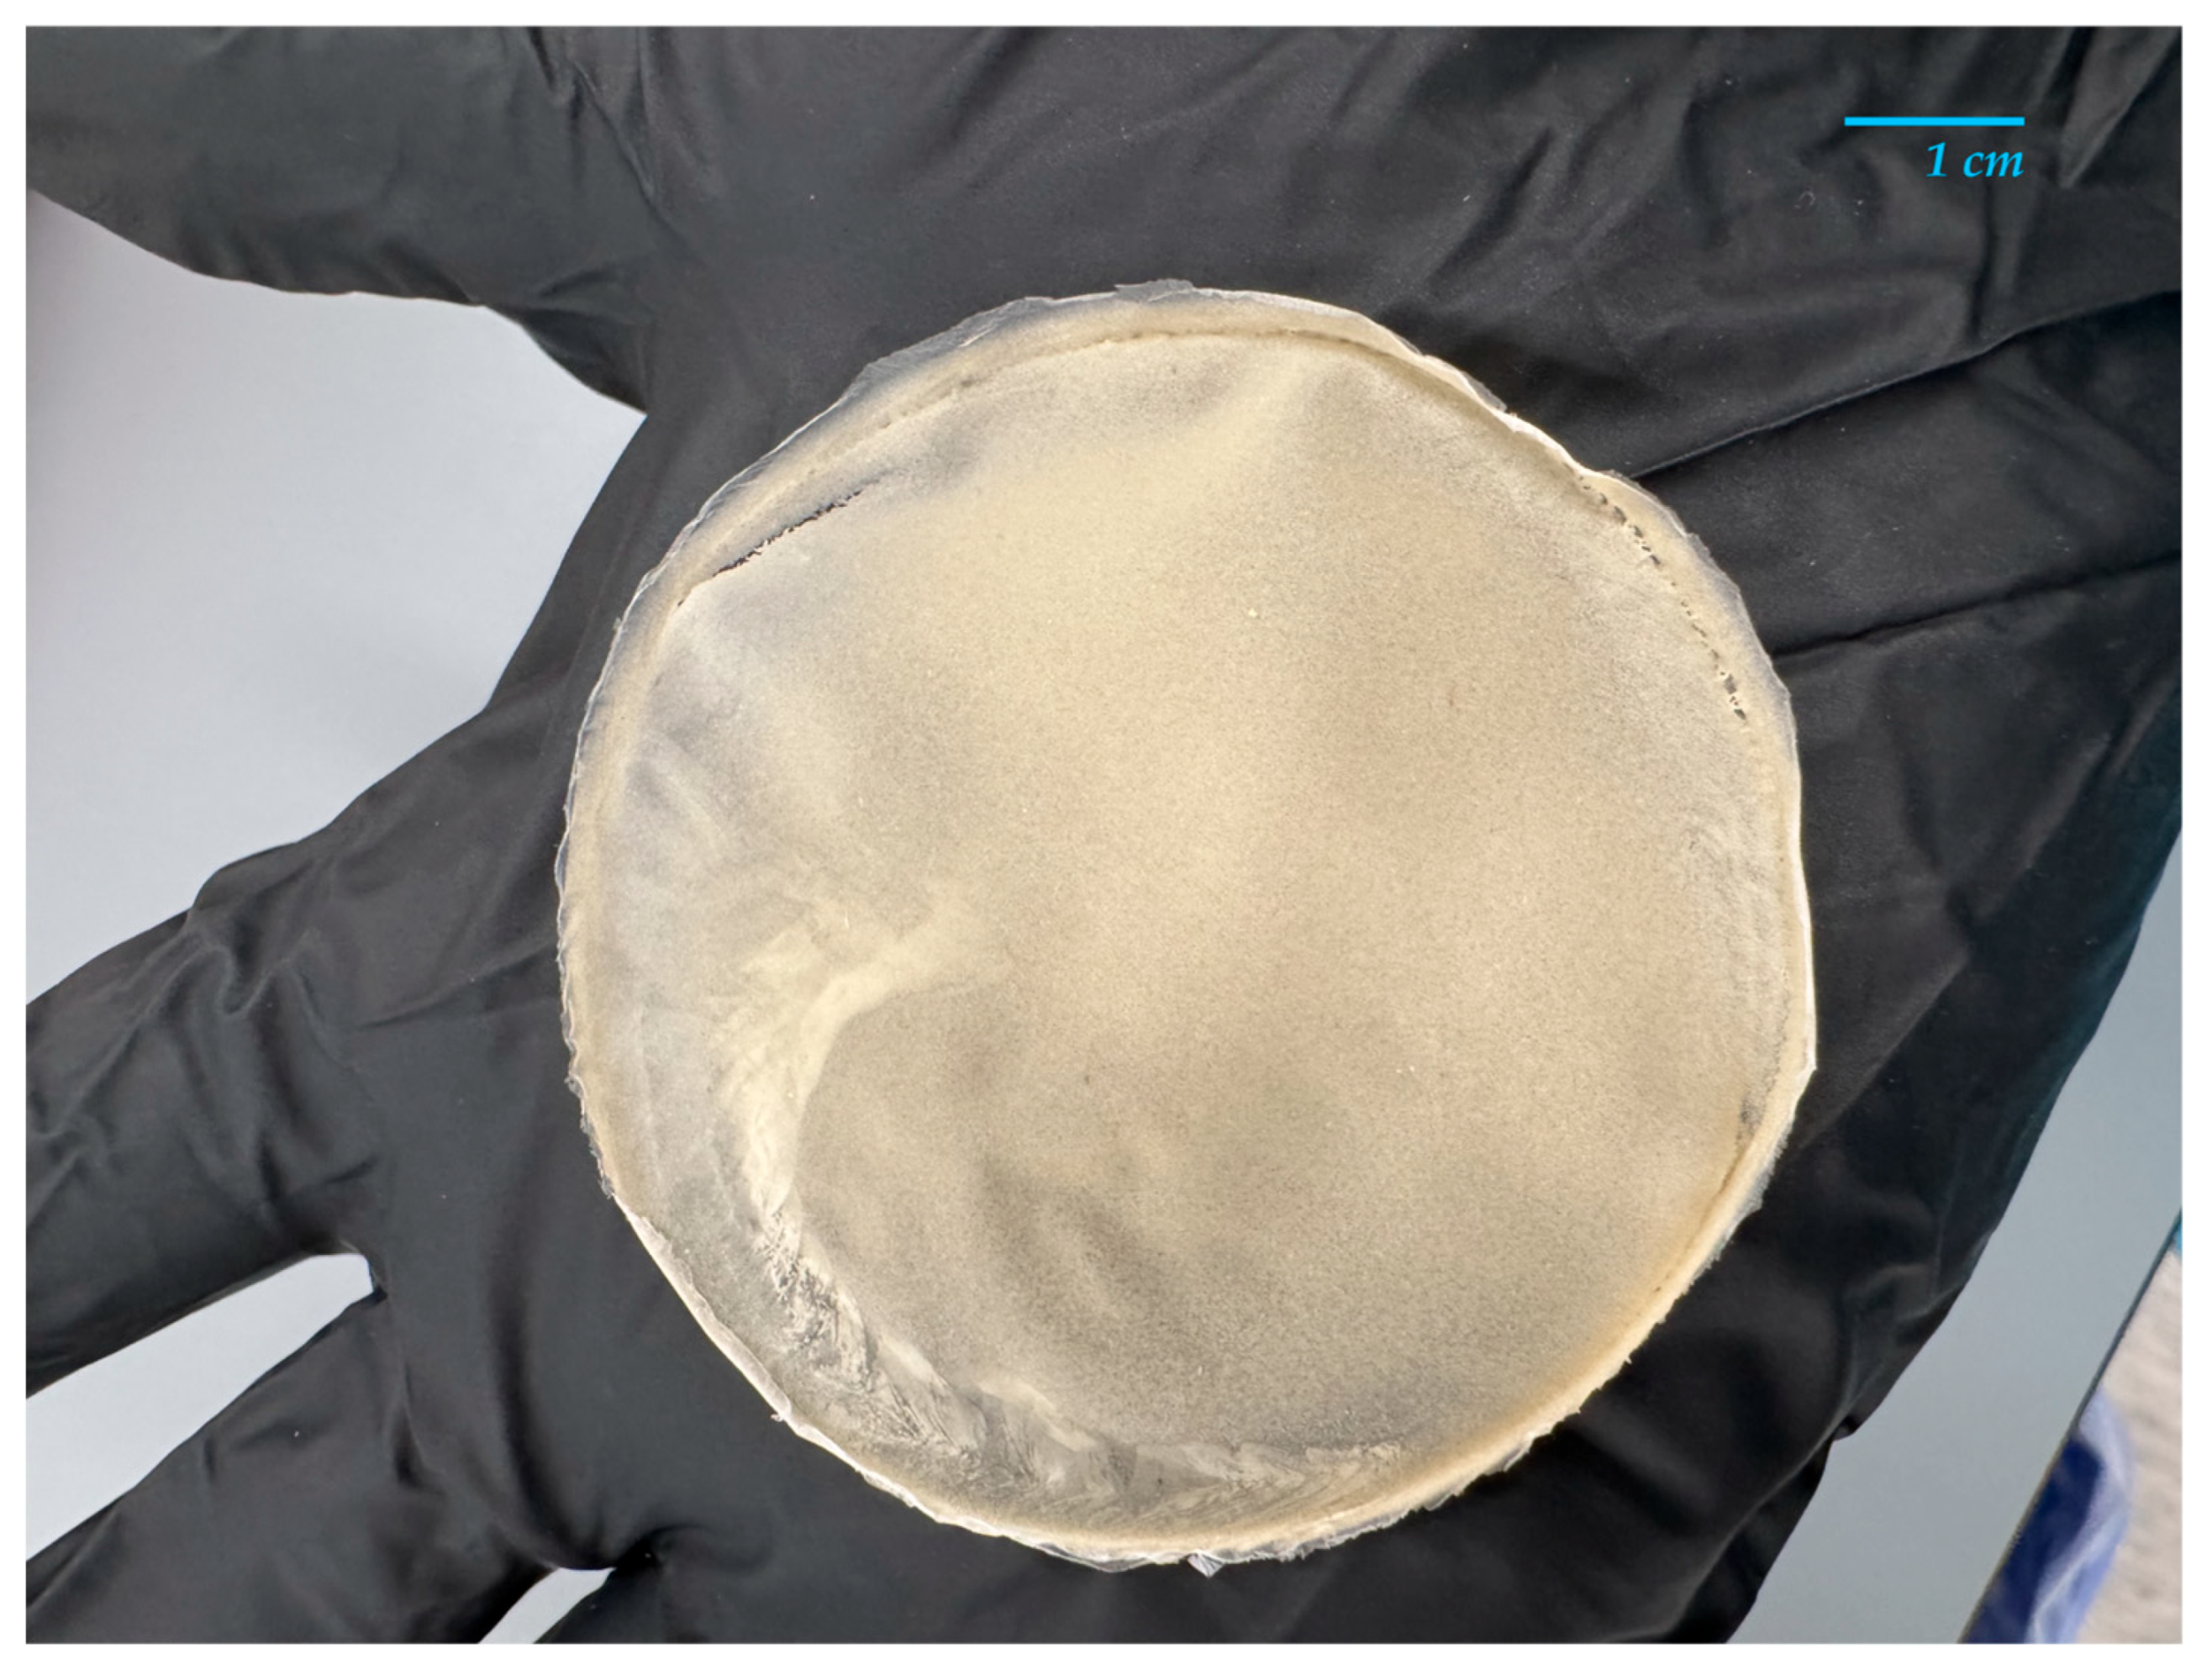
Figure 1.
One P3HB film created using chloroform-only extraction and solvent casting methods described above.
Figure 1.
One P3HB film created using chloroform-only extraction and solvent casting methods described above.
3.4. Thermal Analysis
4. Discussion
4.1. Methodology Success
After fermentation of R. eutropha and polymer extraction using the single-solvent method, P3HB was successfully recovered from both G-fueled growth and cotton glucose-fueled growth. This finding was confirmed with thermal analysis and is the first time P3HB in a bioreactor has been grown with this carbon source. The chloroform-only extraction method separated the P3HB from the R. eutropha, showing the polymer could be recovered with a solvent that is easily collected and reused.
4.2. P3HB Yields
The literature presents a vast array of yield percentages of P3HB from R. eutropha. Khattab, using a growth method much like this study, but an alternate glucose source and extraction process, found a P3HB yield of 56.5% [10]. Kovalick noted yields from many different carbon sources including sugars and oils ranging from 46.3% to 77.1% [11].
In comparison to the literature, the P3HB yields from this study are much lower, but do show some value within. As displayed in Table 3, the polymer yields from cotton-derived glucoses are much greater than those of the P3HB from commercial glucose. The CCG allowed the bacteria to create the most P3HB, with an average yield of 27.8 ± 15.2%, and from CWG was an average yield of 16.6 ± 10.2%. Given the commercial glucose created only an average polymer yield of 1.30 ± 0.86%, it is reasonable to assume that the glucose source had an effect. The maximum G-derived P3HB yield of 2.62%, does not even fall within the standard deviation of either cotton-derived P3HB yields, thus the glucose source likely affected how the R. eutropha were able to produce the P3HB. It is interesting to note though that the cotton-derived polymer yields gave a much higher standard deviation, thus a much larger range; more replications with the cotton-derived glucose and deeper statistical analysis would help determine why this is so.
4.3. Thermal Analysis
4.3.1. Experimental Samples Compared to Literature
The initial goal of thermal analysis was to confirm the production of P3HB, as opposed to another PHA polymer. While the R. eutropha, growth environment, and glucose carbon source have all been shown by Khattab and others to produce specifically P3HB, it was imperative to confirm, especially given the use of an alternate glucose source [10]. To confirm the production of P3HB, polymer derived from all three glucose sources underwent thermal analysis via thermogravimetric analysis (TGA) and differential scanning calorimetry (DSC). The thermal metrics used to confirm the production of P3HB include the temperature of the onset of degradation (Tonset), given by TGA, and the melting temperature (Tm), given by DSC.
As shown in Table 4, reported Tonset temperatures range from 185°C to 263.4°C. Figure 2, the TGA results, show that G-derived P3HB had a Tonset of 284°C, CCG-derived P3HB had a Tonset of 285°C, CWG-derived P3HB had a Tonset of 267°C, and the purchased P3HB had a Tonset of 283°C. The Tm values for P3HB found in the literature range from 170-180°; the Tm values measured were 147°C for G-derived P3HB, 151°C for CCG-derived P3HB, 150°C for CWG-derived P3HB, and 165°C for the purchased P3HB. The Tonset of the tested samples fall just above the range of the literature values, and the Tm values fall just below or within, suggesting they likely are all P3HB.
Factors in production, especially the method of lysing, can affect the resulting P3HB polymer morphology [25]. The slight differences in the degradation and melting temperatures can be attributed to the variance in polymer morphology.
Thermal analysis can also provide details for potential processing of the P3HB as well. Typically, the melting temperature (Tm) and the temperature of the onset of degradation (Tonset) of P3HB are close in proximity, making processing at a precise temperature extremely important [26]. Further, P3HB typically degrades quickly, making it important to not begin degradation even slightly while processing P3HB [26].
Interestingly, as shown in Table 4, there is over 100°C between the Tm and Tonset of the G-derived P3HB, and both cotton sugar-derived P3HBs. The differences for G-derived P3HB and CCG-derived P3HB are nearly equal, with the difference for CWG-derived P3HB only about 15°C smaller. Regardless of the glucose source, all produced P3HB samples show a larger window available to select a temperature at which the polymer could flow and be processed via molding, compounding, extrusion, etc., without causing any degradation as compared to literature. Therefore, processing glucose derived P3HB might allow for more flexibility in temperature, bringing slight ease to processing by reducing the necessary control.
While the processing window was found to be different than seen before, the previously reported rapid degradation after Tonset was observed, Figure 2. The CWG-derived P3HB showed the most rapid degradation, with G-derived P3HB then CCG-derived P3HB coming shortly behind. Thus, care must be taken to control the resonance time in manufacturing equipment when processing glucose-derived P3HB.
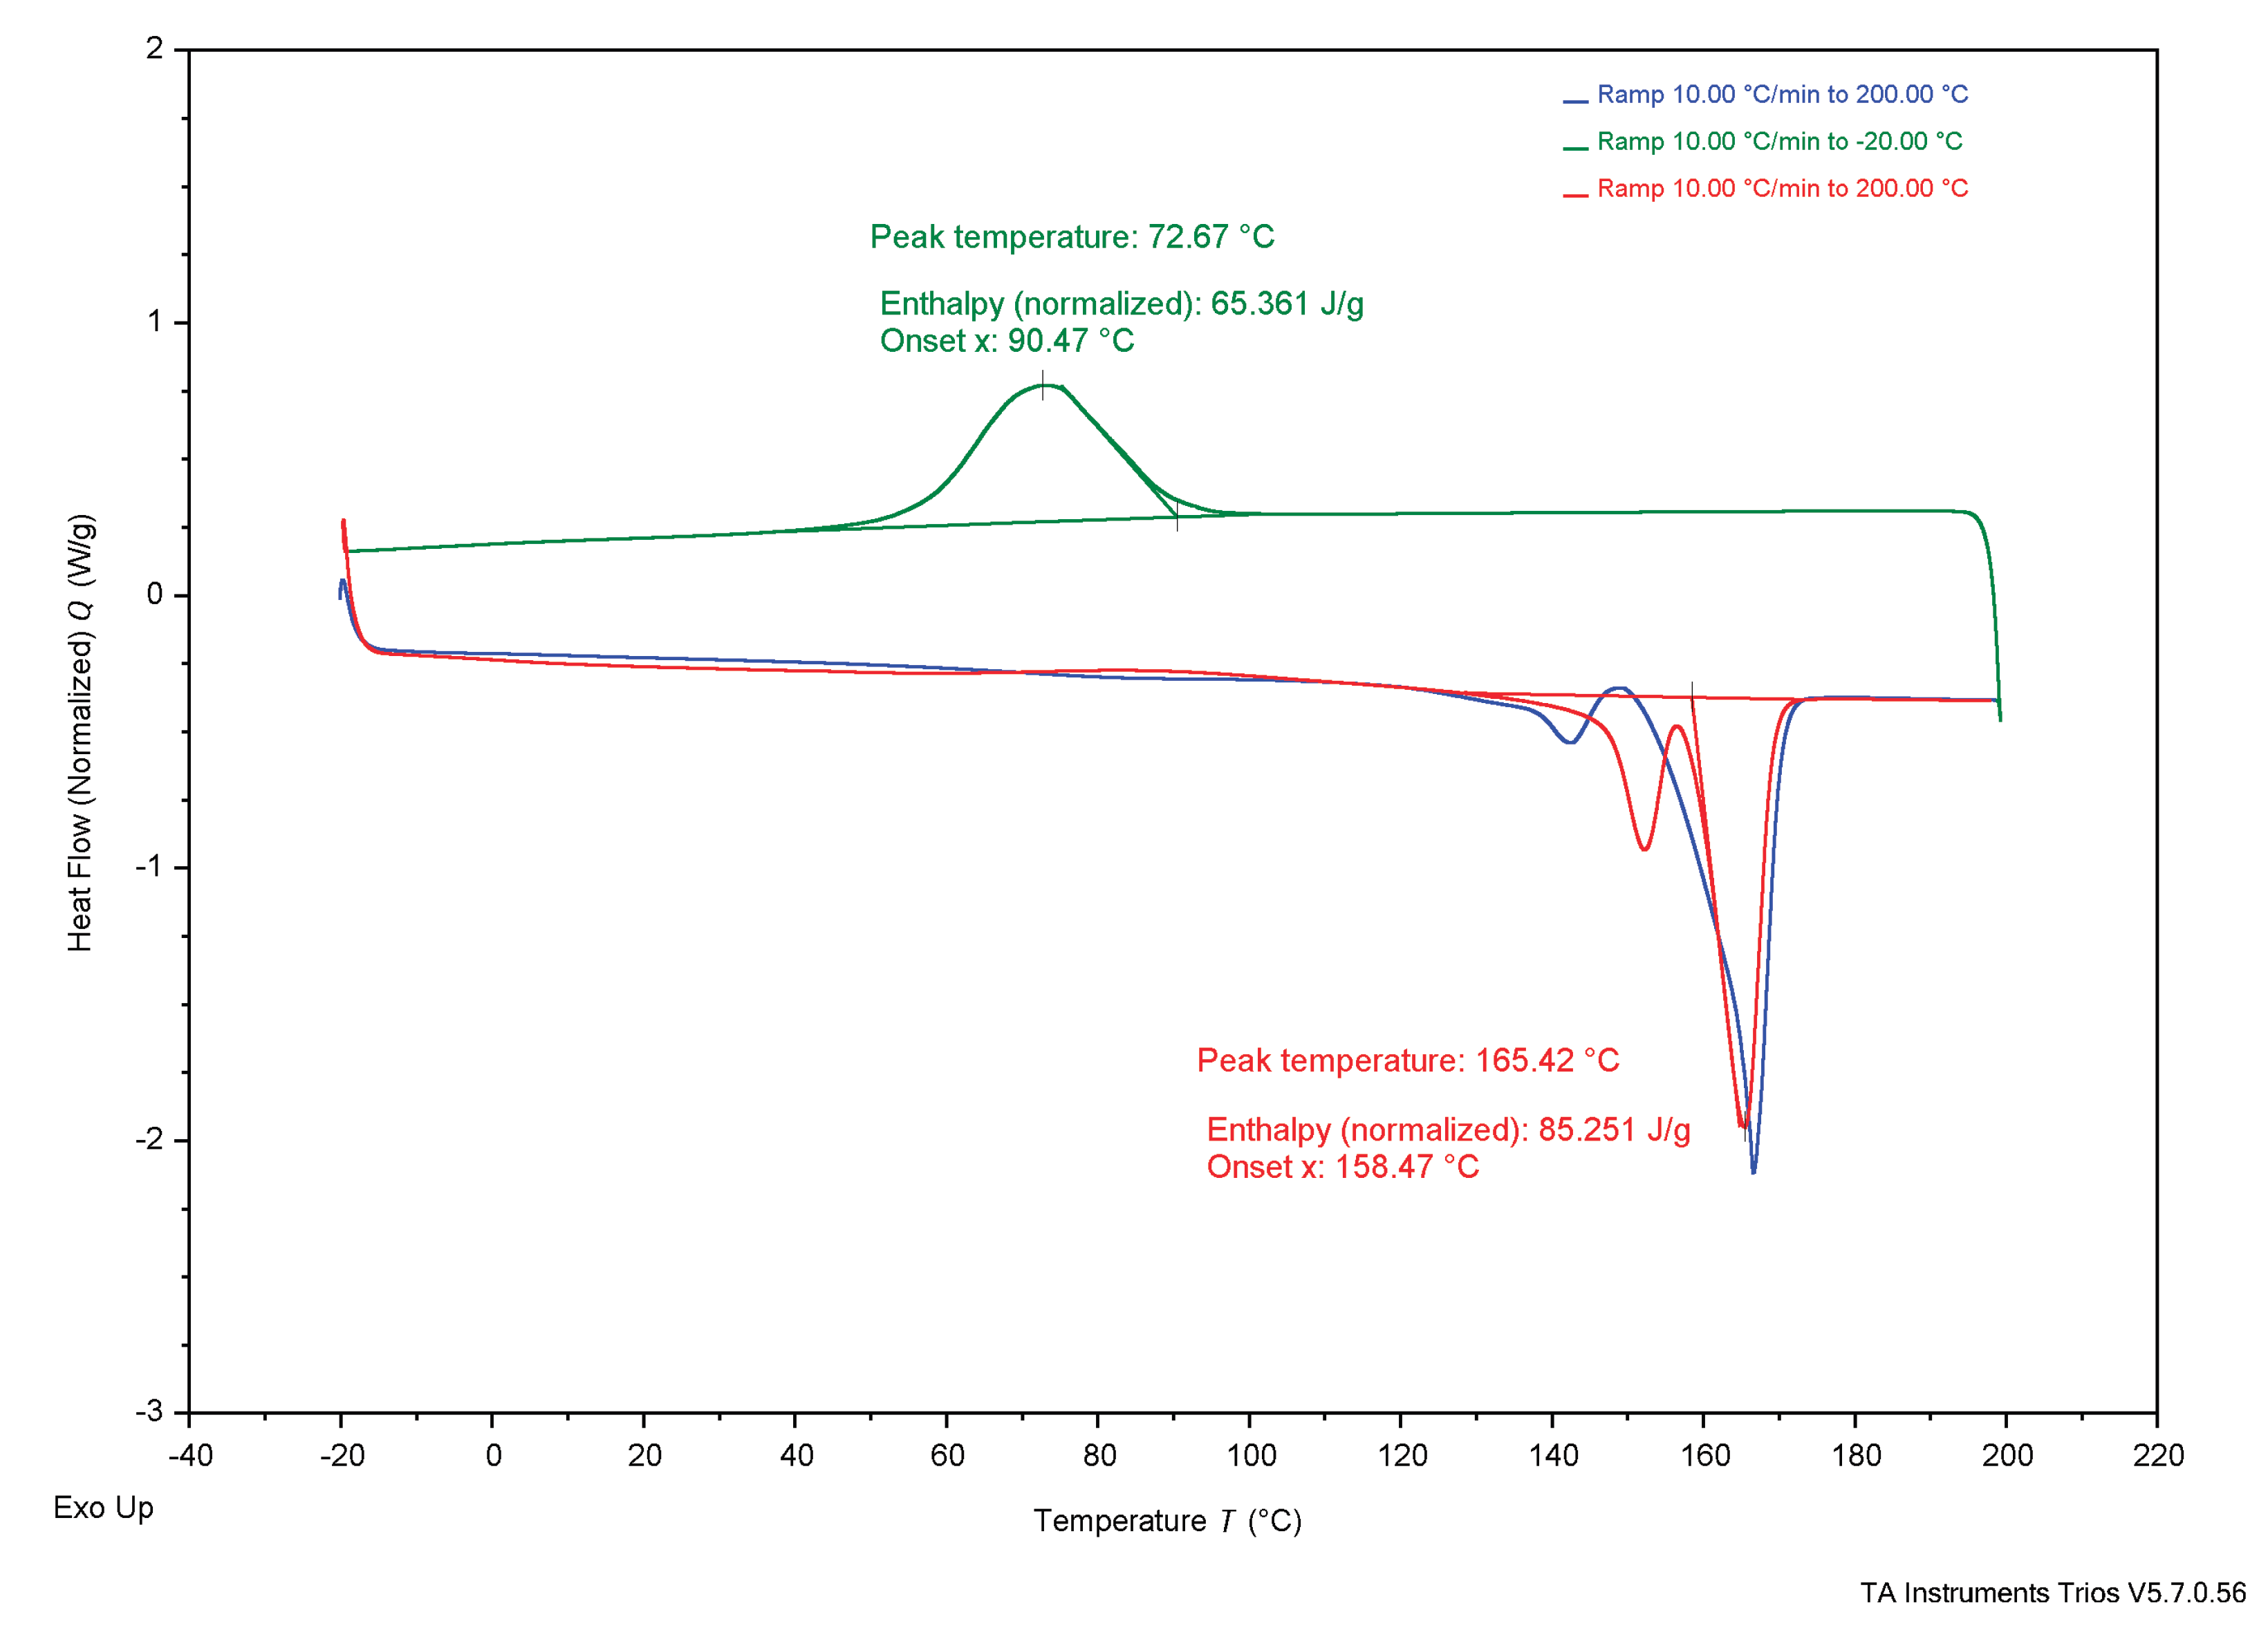
Further, thermal analysis is often used to explain how a polymer might behave in daily use. The glass-transition temperature (Tg), typically shown on a DSC graph, represents the value at which the amorphous regions of the polymer switches from a more glassy, brittle state to a more rubbery, flexible state. If Tg is below the typical ambient temperature of 20°C, the polymer is used regularly when its amorphous regions are rubbery, whereas if Tg is above ambient temperature, it the amorphous regions of the polymer are glassy. Tg is not apparent in the DSC graphs from the produced P3HB, Figure 3, Figure 4 and Figure 5, likely due to the Tc curve coming so close, but literature establishes the Tg of P3HB at about 4-5°C [27,28]. This places the amorphous regions of P3HB in a rubbery state at ambient temperature. P3HB is known to be a highly crystalline and brittle polymer [13]. The brittleness of the polymer is due to the high crystallinity, as the amorphous regions are existing in the rubbery state. Therefore, P3HB that is less crystalline, and thus more amorphous, should be less brittle than P3HB with higher crystallinity.
The P3HB produced using the methods described above are much less crystalline than the purchased P3HB and the P3HB reported on by Wang, see Table 5 [13]. The total melt polymer crystallinity, Xm, derived from Wang’s reported ΔHm value, comes to 61% crystalline [13]. The purchased P3HB was calculated to be 58% crystalline, while the G-derived P3HB and both cotton glucose-derived samples were found to be 38%-45% crystalline. This suggests that the method used to create films of the produced polymer created a less crystalline, and likely less brittle P3HB, potentially reducing the common downfall of brittleness in use. Further investigation, including mechanical analysis, is needed to support this claim, but the idea shows potential.
The double melting peaks shown in all tested samples are also interesting to note. While all produced samples showed this behavior, it is not necessarily always shown in literature. The DSC of P3HB ran and studied by Wang shows a single sharp melting peak [13]. Some DSC curves by Janigová show double peaks, while others do not [26]. The two peaks indicate a secondary crystal structure within the P3HB samples, which must be a result of the production or extraction methods if said structure is not always seen. Further analysis of the crystal structures would be required to understand why such variances may be forming and may also influence the mechanical behavior of the P3HB samples.
Figure 6.
Differential scanning calorimetry results of commercial, purchased P3HB.
4.3.2. Comparing Experimental Samples
While comparing the produced samples to literature values make them appear quite similar, there are many differences. Firstly, as seen in the TGA results, Figure 2, the Tonset of CWG-derived P3HB comes about 17°C before that of G-derived and CCG-derived P3HB, and the Tend comes about 20°C before either other sample. These data suggest that P3HB grown from the CWG is slightly less thermally stable due to the lower onset of degradation and end of degradation temperature. The lower Tonset and Tend could be caused by polymer morphology, like a slightly lower molecular weight or different crystal structure due to the alternate glucose source, or simply due to slight variances in the growth process and film casting. Further characterization is needed to support any such conclusions.
Secondly, the transitions seen on the DSC graphs, Figure 3-5, offer differences. The temperature of crystallization from the melt (Tc), of G-derived P3HB and CCG-derived P3HB are about 10°C higher than Tc of CWG-derived P3HB, Table 4. Further, the related enthalpy (ΔHc), and thus the percent crystallization from the melt (Xc), of CWG-derived P3HB is much smaller than that of the other two samples, Table 5. This suggests that CWG-derived P3HB is a slower crystallizer from the melt, as all three samples were cooled at the same rate during the DSC runs, Figure 3, Figure 4 and Figure 5. Slower melt crystallization requires a polymer to be cooled slower during processing, meaning CWG-derived P3HB may take longer to form products with an equal amount of crystallinity as those made from the other two samples.
Because the CWG-derived polymer crystallized much less in the melt, the cold crystallization percent (Xcc) was much higher than the other two samples, Table 5. Regardless, cold crystallization (Tcc) of all three samples occurred at the same point, ranging only from 24°C to 28°C, Table 4. At the end though, all three samples melted at nearly the same temperature, ranging from 147°C to 151°C, Table 4, and were quite similar in total crystallization percentage, from 38% to 45%, Table 5. Further, the Xc and Xcc of all three samples only explained about 50% of the total Xm, Table 5; this is interesting to note, suggesting the method of calculating Xc and Xcc using the standard melting enthalpy of P3HB of 146 J/g is not ideal, and investigation into the effect of temperature on the standard enthalpy of P3HB could be explored. Regardless, given the final Xm values, all three materials should behave the same when made into a final product, though mechanical analysis would help confirm this idea.
4.4. Future Work
Future work includes mechanical analysis of the P3HB produced using cotton-derived glucose. An AMDET micro tester along with MTEST Quattro software will be used to perform tensile testing on P3HB from each glucose source to compare the material to P3HB produced elsewhere, as well as other polymers to suggest potential end uses. Additionally, a study on the optimization of polymer production in the bioreactor will be performed by monitoring the bacterial growth and metabolism with a growth curve. The addition of an antibiotic into the growth media, and thus an antibiotic resistance gene into the bacteria, may also be explored, to reduce the possibilities of contamination once upscaled for more economical production.
5. Conclusions
To contribute to the goal of producing a more economically viable, biopolymer, this study focused on making the bioderived and biodegradable poly-3 hydroxybutyrate (P3HB) through the fermentation of R. eutropha fueled by cotton-derived glucose in a bioreactor. A single-solvent extraction method was created and utilized to reduce the process complexity and chemical consumption of the polymer extraction. Both cotton-derived glucoses were shown to produce more P3HB than commercial glucose. CCG-derived polymer showed very similar thermal properties to G-derived P3HB, and CWG-derived P3HB was only slightly less thermally stable. Further, both cotton glucose derived polymer samples had similar total crystallinity to G-derived P3HB, meaning they should perform similarly as final materials. That, along with the developed process resulting in P3HB with a larger temperature of processing window and a lower total crystallinity than P3HB in literature, suggests this method along with the use of cotton-derived glucose makes a promising P3HB polymer further exploration on manufacturing and implementation into the world of existing polymers.
Author Contributions
Conceptualization, A.C., G.F., and R.K.; methodology, A.C., L.G., G.F., H.S., and R.K.; investigation, A.C. and L.G.; data analysis, A.C. and L.G.; writing—original draft preparation, A.C. and L.G.; writing—review and editing, G.F. and H.S.; supervision, R.K.; funding acquisition, G.F. and R.K. All authors have read and agreed to the published version of the manuscript.
Funding
This research was funded by the Cotton Incorporated Product Development and Implementation Division Grant and a Lambert Foundation Innovation Grant.
Institutional Review Board Statement
Not applicable.
Data Availability Statement
Data are contained within the article.
Acknowledgments
The authors would like to sincerely thank Matt Farrell, Jade Phan, and the rest of Cotton Incorporated for their financial support and supply of cotton-derived glucose that made this work possible. We would also like to warmly acknowledge Rui de Paula Vieira de Castro and Geoff Toner of the Jefferson Institute for Bioprocessing for their provision of and assistance with the Sartorius Stedim Biostat A 2-L bioreactor. We also send thanks to Richa Rao for joyfully assisting with the laboratory work. Lastly, we thank the whole of the Jefferson College of Life Sciences – East Falls for their research space and support.
Conflicts of Interest
The authors declare no conflicts of interest.
Abbreviations
The following abbreviations are used in this manuscript:
| P3HB | Poly-3-hydroxybutyrate |
| G | Glucose, referring to commercial glucose |
| CCG | Cotton glucose |
| CWG | Cutting waste cotton glucose |
References
- Thunman, H., Berdugo Vilches, T., Seemann, M., Maric, J., Cañete Vela, I., Pissot, S., N.T. Nguyen, H. (2019). Circular use of plastics-transformation of existing petrochemical clusters into thermochemical recycling plants with 100% plastics recovery. Sustainable Materials and Technologies, 22, e00124, ISSN 2214-9937. [CrossRef]
- U.S. Environmental Protection Agency. (2020). Advancing Sustainable Materials Management: Facts and Figures Report. https://www.epa.gov/facts-and-figures-about-materials-waste-and-recycling/national-overview-facts-and-figures-materials.
- Parashar, N., & Hait, S. (2021). Plastics in the time of COVID-19 pandemic: Protector or polluter?. The Science of the total environment, 759, 144274. [CrossRef]
- Barnes, D. K., Galgani, F., Thompson, R. C., & Barlaz, M. (2009). Accumulation and fragmentation of plastic debris in global environments. Philosophical transactions of the Royal Society of London. Series B, Biological sciences, 364(1526), 1985–1998. [CrossRef]
- Mannina, G., Presti, D., Montiel-Jarillo, G., & Eugenia Suárez-Ojeda, M. (2019). Bioplastic recovery from wastewater: A new protocol for polyhydroxyalkanoates (PHA) extraction from mixed microbial cultures. Bioresource Technology, 282, 361-369, ISSN 0960-8524. [CrossRef]
- World Economic Forum, Ellen MacArthur Foundation, and McKinsey & Company. (2016). The New Plastics Economy: Rethinking the future of plastics. Retrieved from https://www.ellenmacarthurfoundation.org/the-new-plastics-economy-rethinking-the-future-of-plastics.
- Rhodes, C. J. (2018). Plastic pollution and potential solutions. Science progress, 101(3), 207–260. [CrossRef]
- Bhatia, S. K. , Otari, S. V., Jeon, J. M., Gurav, R., Choi, Y. K., Bhatia, R. K., Pugazhendhi, A., Kumar, V., Rajesh Banu, J., Yoon, J. J., Choi, K. Y., & Yang, Y. H. (2021). Biowaste-to-bioplastic (polyhydroxyalkanoates): Conversion technologies, strategies, challenges, and perspective. Bioresource technology, 326, 124733. doi.org/10.1016/j.biortech.2021.124733.
- Costa, A., Encarnação, T., Tavares, R., Todo Bom, T., & Mateus, A. (2023). Bioplastics: Innovation for Green Transition. Polymers, 15(3), 517.
- Khattab, M. M. , & Dahman, Y. (2019). Production and recovery of poly-3-hydroxybutyrate bioplastics using agro-industrial residues of hemp hurd biomass. Bioprocess and biosystems engineering, 42(7), 1115–1127. [CrossRef]
- Kovalcik, A., Pernicova, I., Obruca, S., Szotkowski, M., Enev, V., Kalina, M., & Marova, I. (2020). Grape winery waste as a promising feedstock for the production of polyhydroxyalkanoates and other value-added products. Food and Bioproducts Processing, vol. 124, pp. 1-10, ISSN 0960-3085. [CrossRef]
- Rysbek, A., Ramankulov, Y., Kurmanbayev, A., Richert, A., & Abeldenov, S. (2022). Comparative Characterization and Identification of Poly-3-hydroxybutyrate Producing Bacteria with Subsequent Optimization of Polymer Yield. Polymers, 14(2), 335. [CrossRef]
- Wang, Y., Chen, R., Cai, J., Liu, Z., Zheng, Y., Wang, H., Li, Q., et al. (2013). Biosynthesis and thermal properties of PHBV produced from levulinic acid by Ralstonia eutropha. Plos One, 8(4), e60318.
- Markets and Markets (2024) Polyhydroxyalkanoate (PHA) Market - Global Forecast to 2028. MarketsandMarkets. Retrieved from https://www.marketsandmarkets.com/Market-Reports/pha-market-395.html.
- Johnson S., Echeverria D., Venditti R., Jameel H., & Yao Y. (2020). Supply Chain of Waste Cotton Recycling and Reuse: A Review. AATCC Journal of Research, 7(1_suppl):19-31. [CrossRef]
- Cotton Incorporated. (2024). Monthly Economic Letter: Cotton Market Fundamentals and Price Outlook. Cotton Incorporated. from https.
- Vera, R. , Zambrano, F., Suarez, A., Pifano, A., Marquez, R., Farrell, M., Ankeny, M., Jameel, H., Gonzalez, R. (2022). Transforming textile wastes into biobased building blocks via enzymatic hydrolysis: A review of key challenges and opportunities. Cleaner and Circular Bioeconomy. 100026. 10.1016/j.clcb.2022.100026.
- Murawski de Mello, A., Vandenberghe, L., Wedderhoff Herrmann, L., Letti, L., Martínez Burgos, W., Scapini, T., Manzoki, M., Zwiercheczewski, P., & Soccol, C. (2023). Strategies and engineering aspects on the scale-up of bioreactors for different bioprocesses. Systems Microbiology and Biomanufacturing. 4. [CrossRef]
- Koller, M., Niebelschütz, H. and Braunegg, G. (2013), Strategies for recovery and purification of poly[(R)-3-hydroxyalkanoates] (PHA) biopolyesters from surrounding biomass. Eng. Life Sci., 13: 549-562. [CrossRef]
- Ramsay, J.A., Berger, E., Voyer, R. et al. Extraction of poly-3-hydroxybutyrate using chlorinated solvents. Biotechnol Tech, 8, 589–594 (1994). [CrossRef]
- Kourmentza, C., Plácido, J., Venetsaneas, N., Burniol-Figols, A., Varrone, C., Gavala, H. N., and Reis, M. A. M. (2017) Recent Advances and Challenges towards Sustainable Polyhydroxyalkanoate (PHA) Production. Bioengineering (Basel), 4.
- Azenta Life Sciences. (2024). Fioravanti4607-Taxonomy.
- Jefferson Institute for Bioprocessing. (2024). Jefferson Institute for Bioprocessing. Available online: https://www.jeffersonbioprocessing.com/.
- De Sousa Junior,. R. R., Cezario, F. E. M., Antonino, L. D., Dos Santos, D. J., & Lackner, M. (2023). Characterization of Poly(3-hydroxybutyrate) (P3HB) from Alternative, Scalable (Waste) Feedstocks. Bioengineering (Basel, Switzerland), 10(12), 1382. [CrossRef]
- García-Cerna, et al. (2022). Evaluation of Poly-3-Hydroxybutyrate (P3HB) Scaffolds Used for Epidermal Cells Growth as Potential Biomatrix. Polymers, 14(19), 4021. [CrossRef]
- Janigová, I., Lacı́k, I., & Chodák, I. (2002). Thermal degradation of plasticized poly(3-hydroxybutyrate) investigated by DSC. Polymer Degradation and Stability, 77, 1, 35-41, ISSN 0141-3910. [CrossRef]
- Lee, S.Y. (1996). Review bacterial polyhydroxyalkanoates. Biotechnol Bioeng, 49, 1–14. [CrossRef]
- Sudesh, K. et al. (2000). Synthesis, structure and properties of polyhydroxyalkanoates: biological polyesters. Progress in Polymer Science, 25, 1503-1555. [CrossRef]
Figure 2.
Thermogravimetric analysis results of P3HB produced using G, CCG, CWG, and of the commercial, purchased P3HB.
Figure 2.
Thermogravimetric analysis results of P3HB produced using G, CCG, CWG, and of the commercial, purchased P3HB.
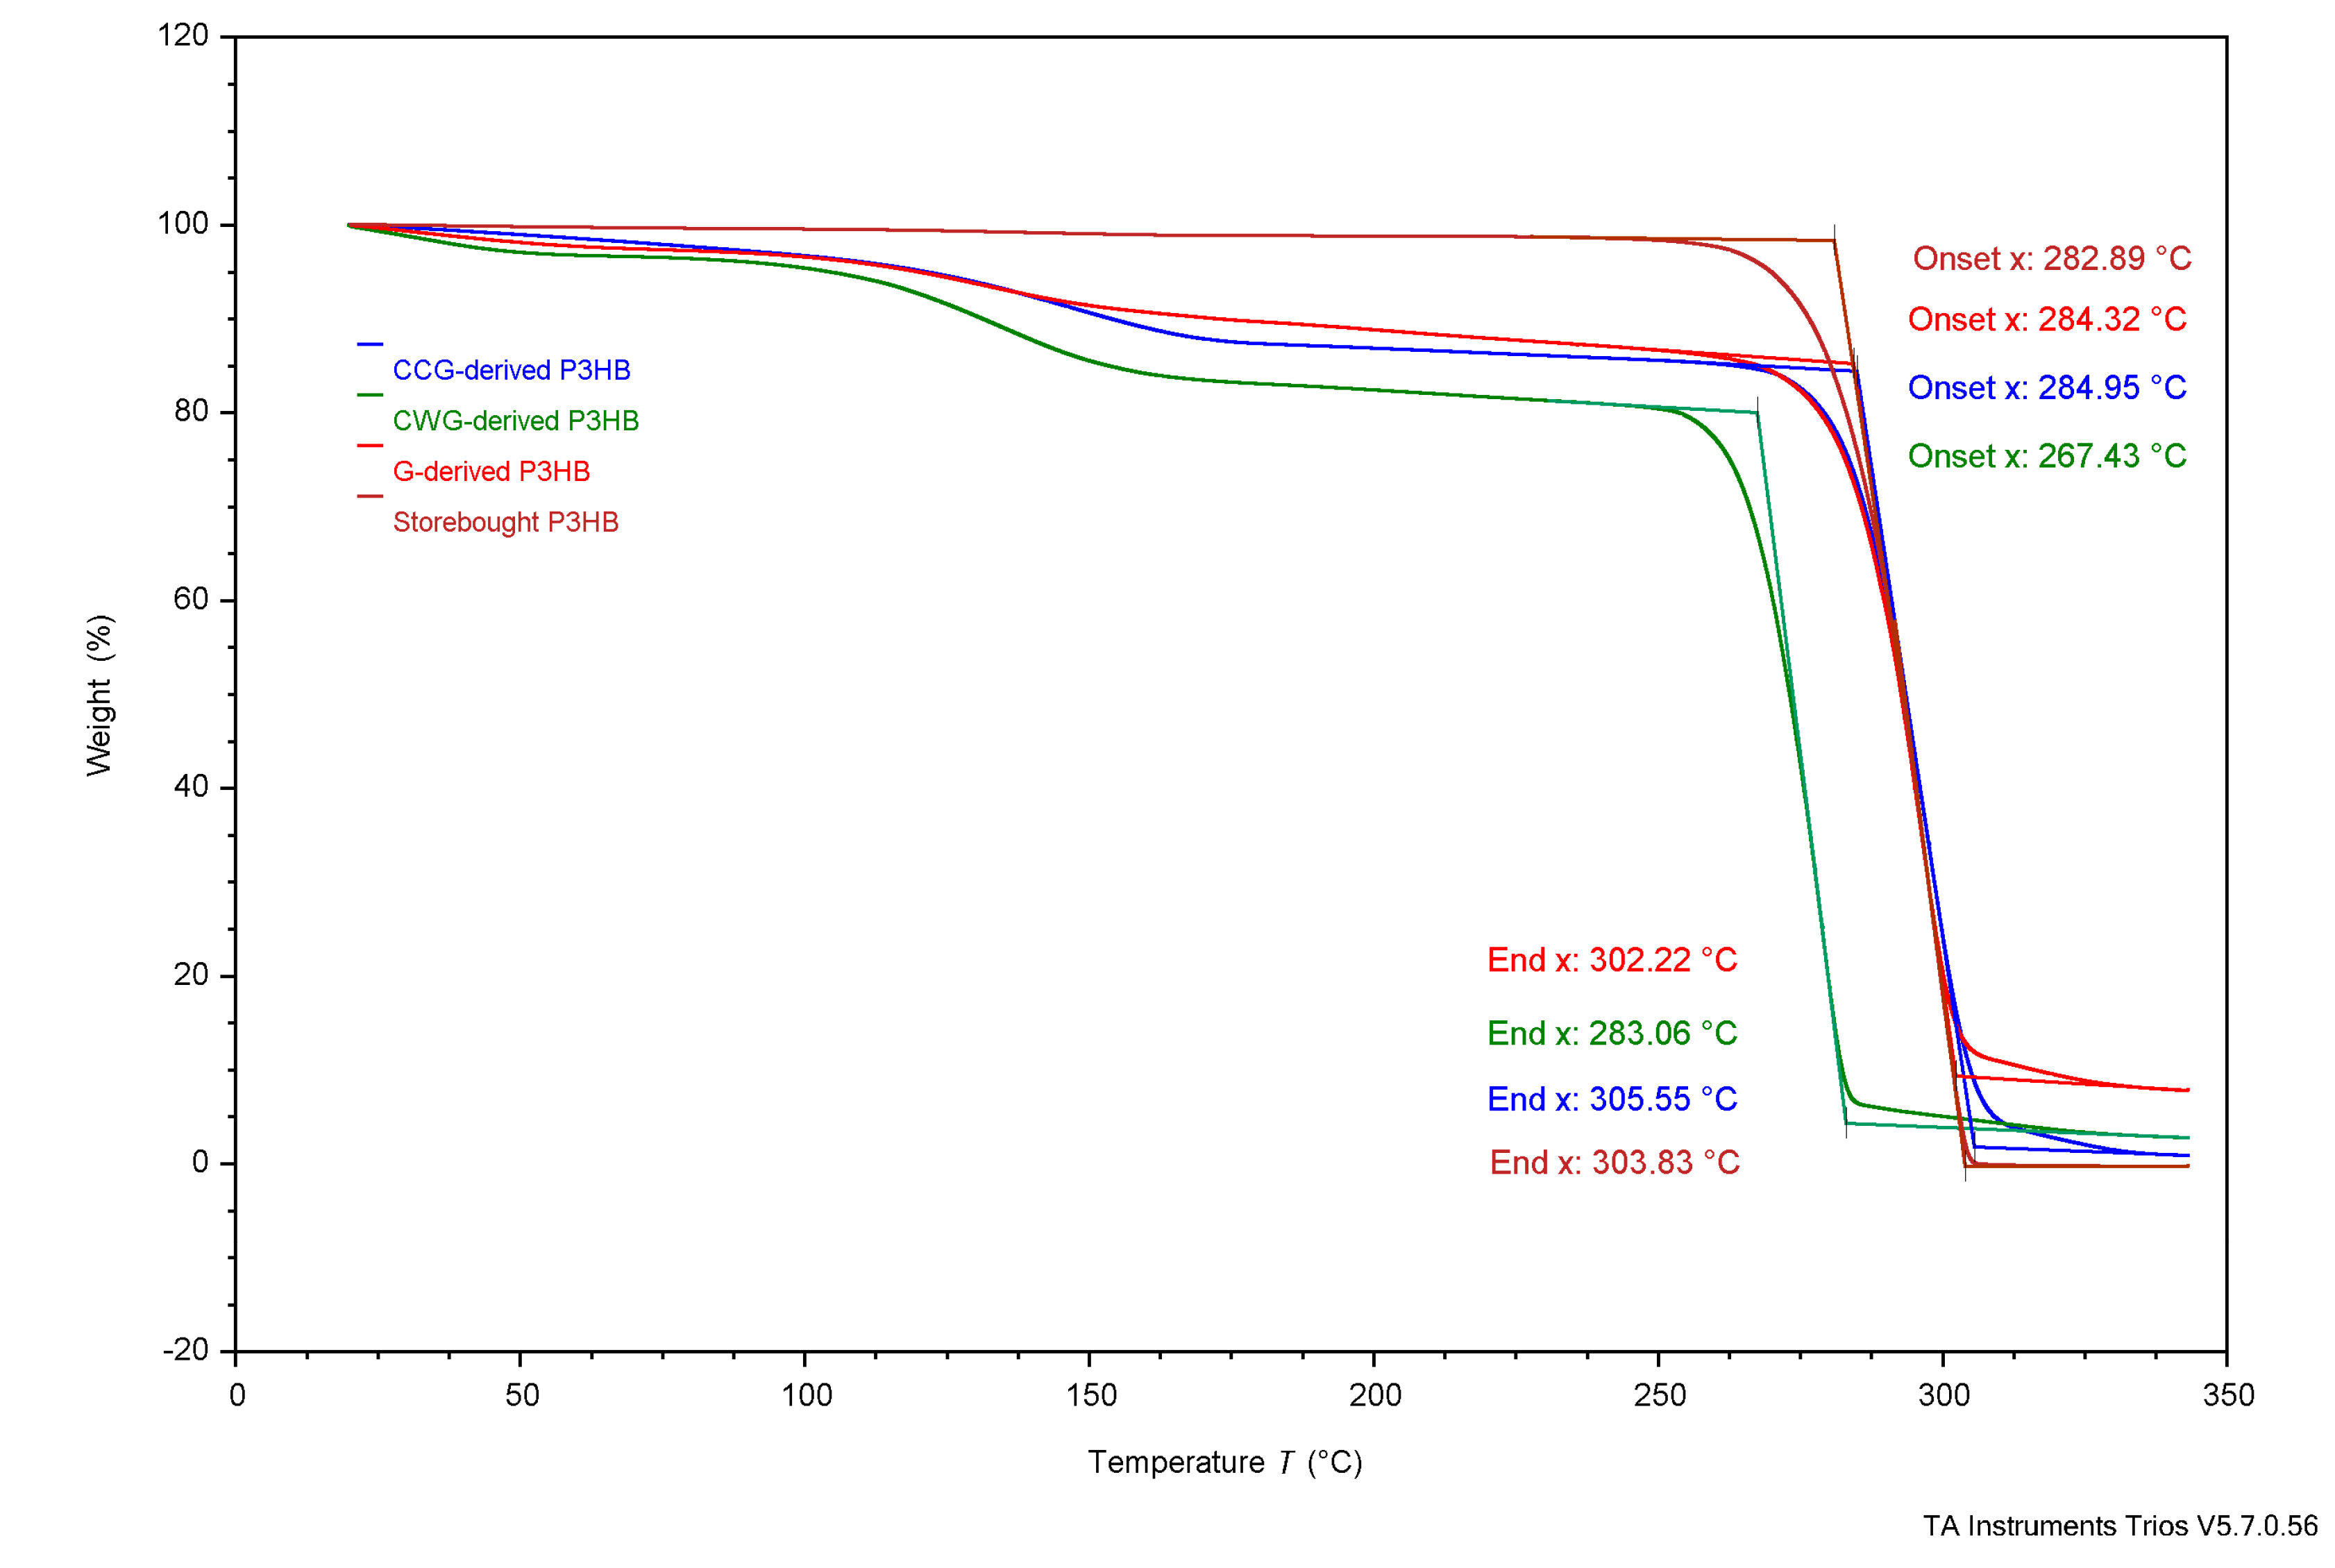
Figure 3.
Differential scanning calorimetry results of P3HB produced using G.
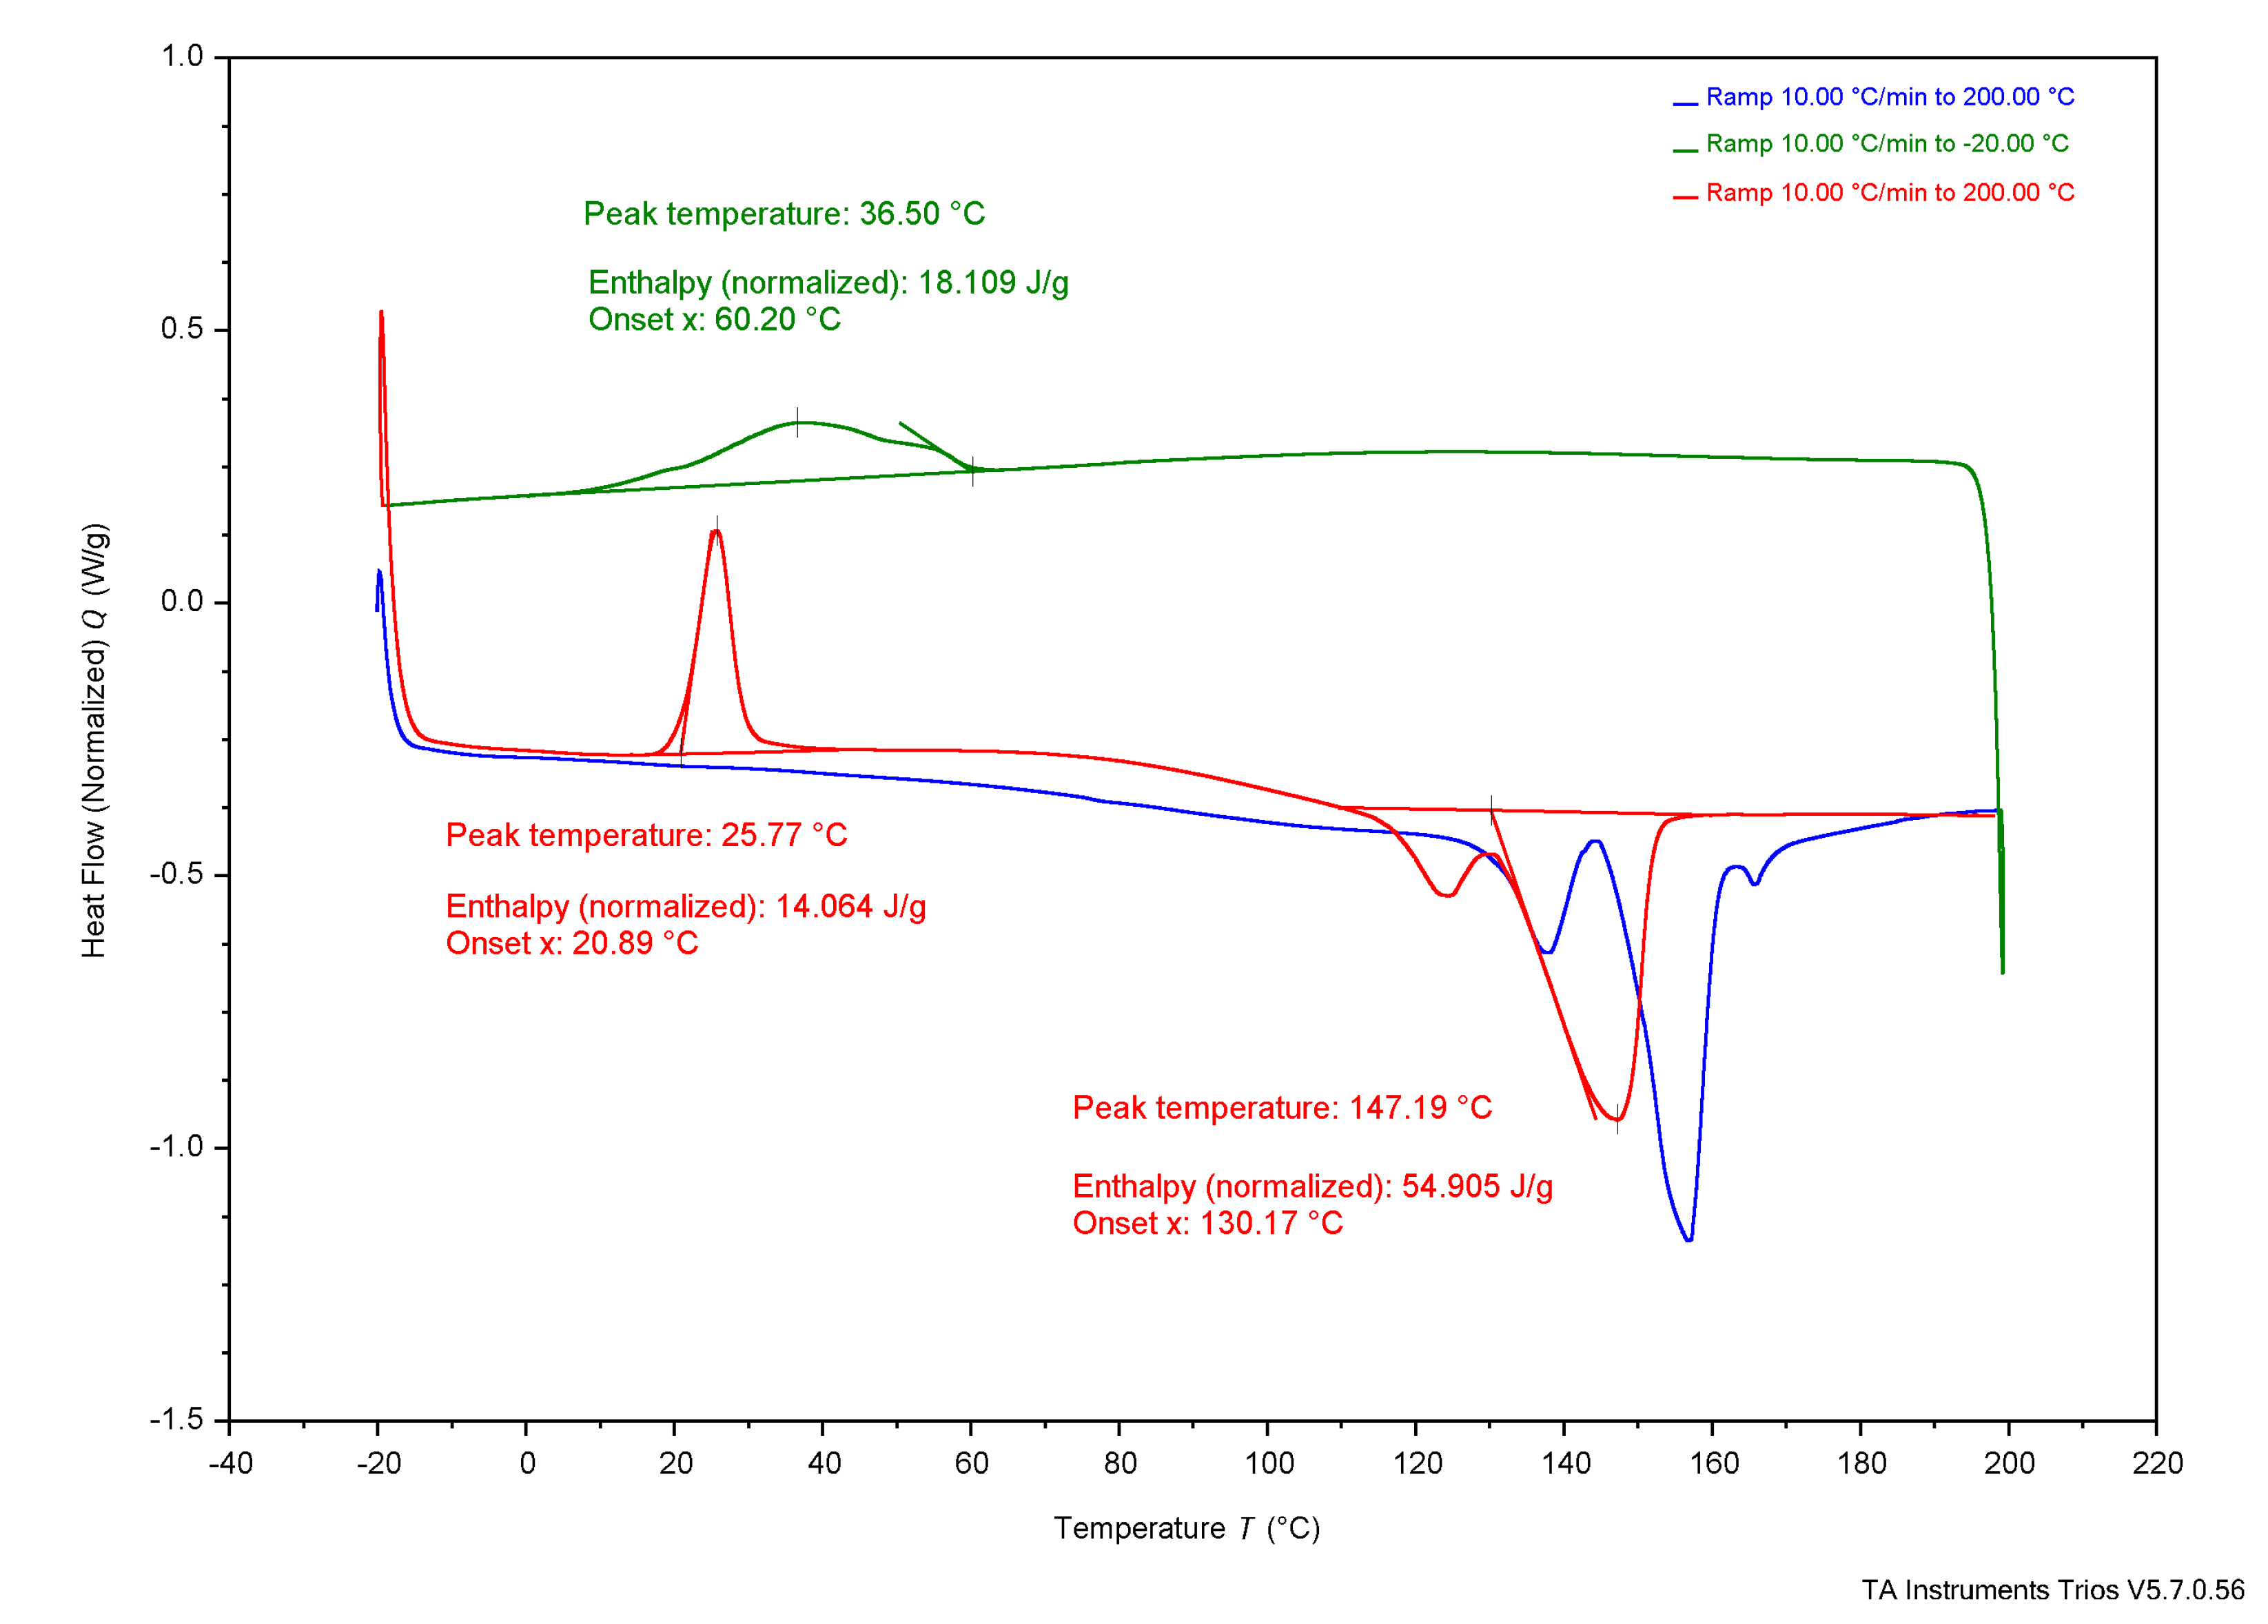
Figure 4.
Differential scanning calorimetry results of P3HB produced using CCG.
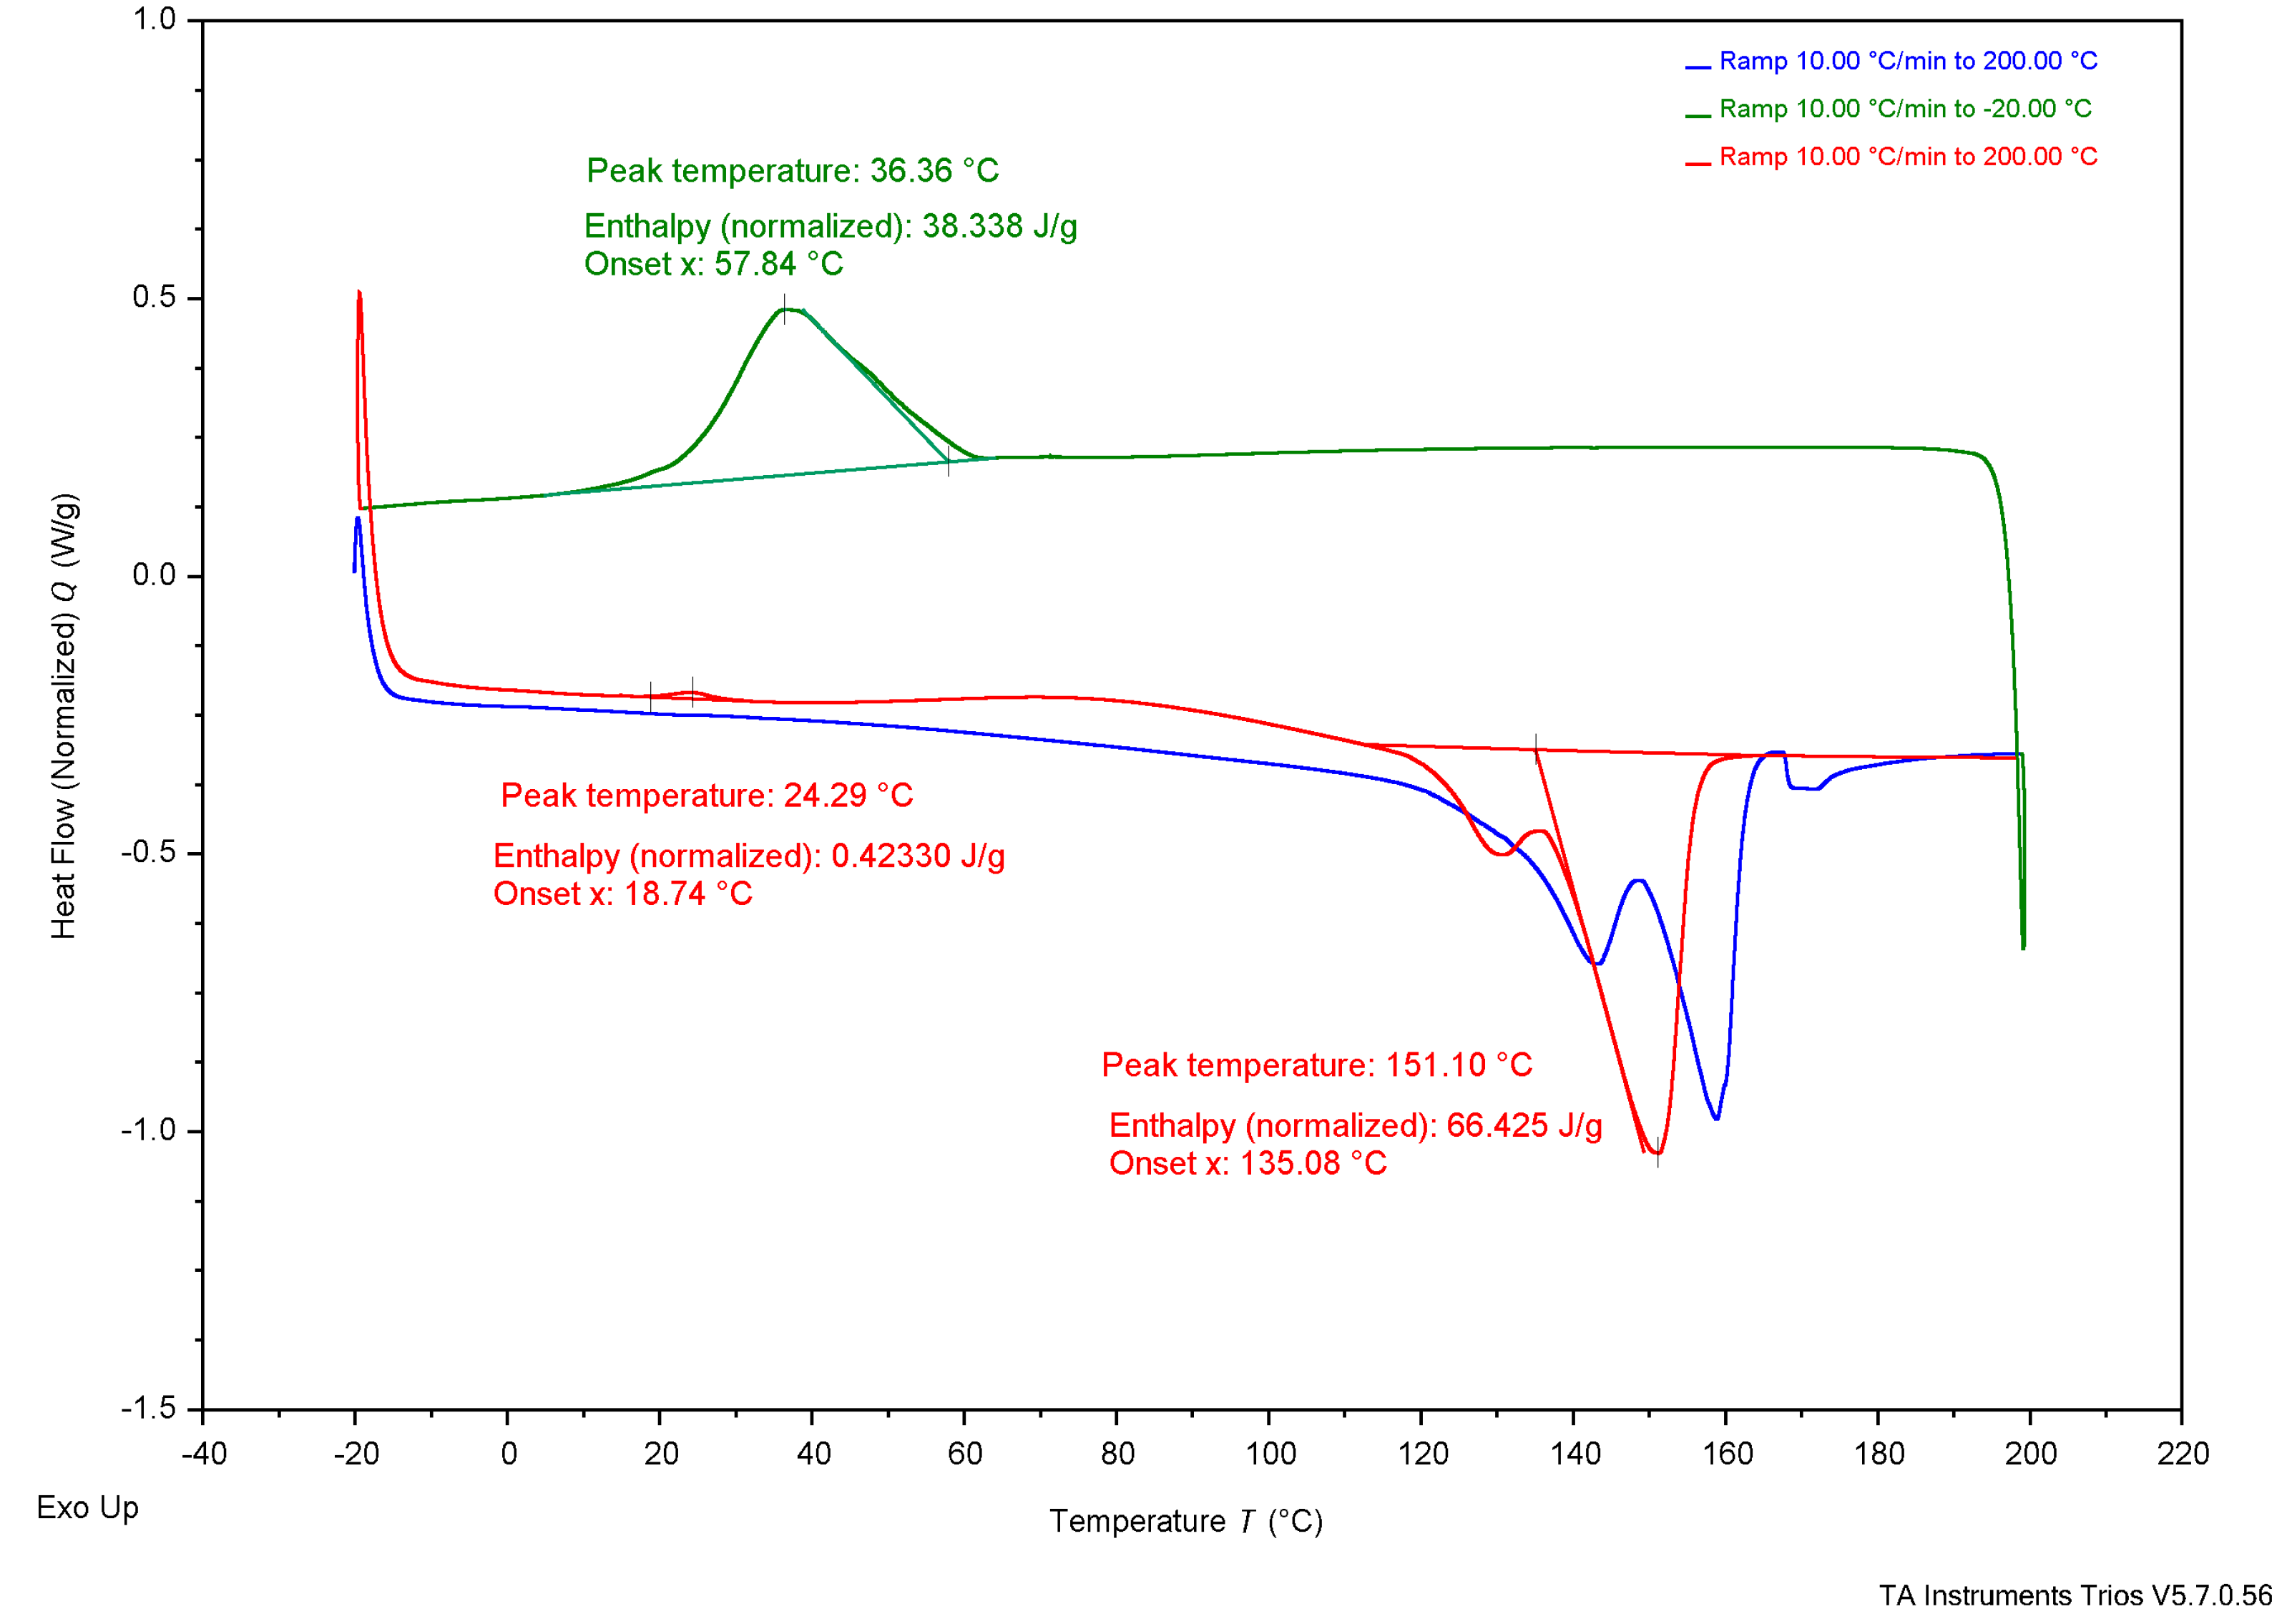
Figure 5.
Differential scanning calorimetry results of P3HB produced using CWG.
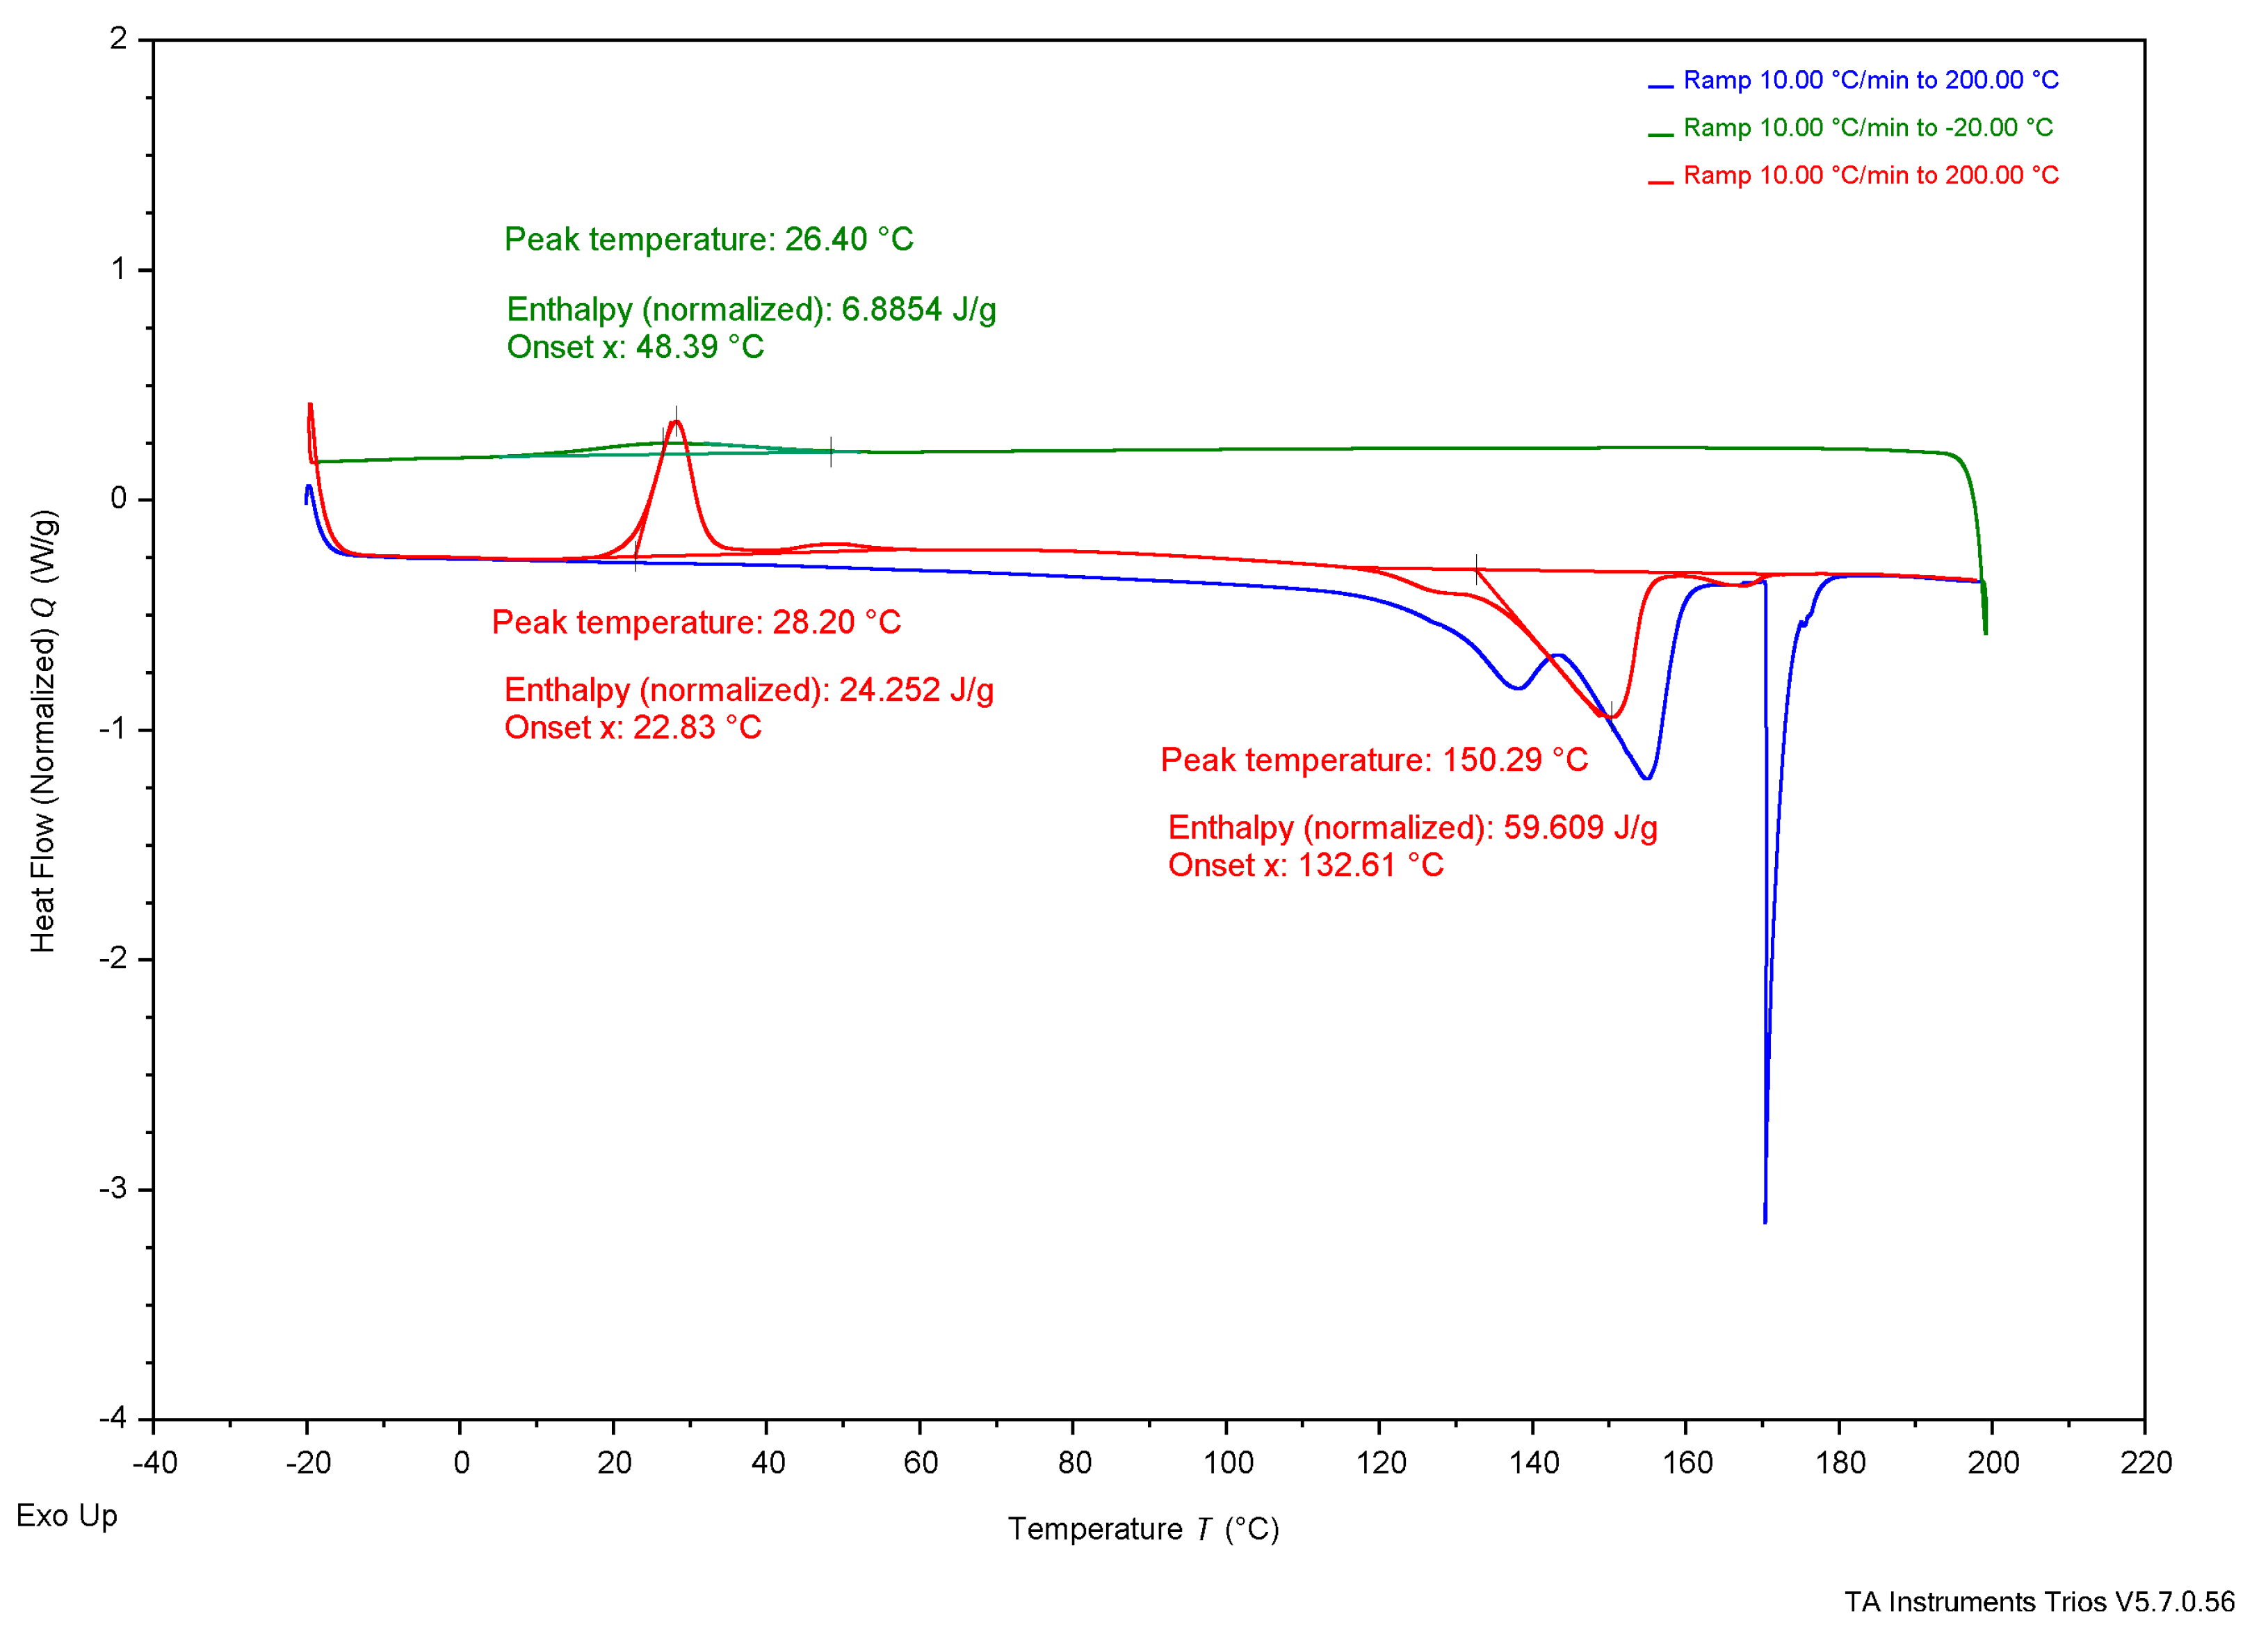

Table 1.
Preparation of 5 mL Starter Culture Solutions.
| Growth Medium | Control | G | CCG | CWG |
|---|---|---|---|---|
| Nutrient Broth | 5 mL (100% v/v) | 2.5 mL (50% v/v) | 2.5 mL (50% v/v) | 2.5 mL (50% v/v) |
| MSM 1 (5x concentration) | - | 0.25 mL (5% v/v) | 0.25 mL (5% v/v) | 0.25 mL (5% v/v) |
| MSM 2 (5x concentration) | - | 0.25 mL (5% v/v) | 0.25 mL (5% v/v) | 0.25 mL (5% v/v) |
| Commercial Glucose Solution (7.4% v/w glucose) | - | 0.625 mL (12.5% v/v) |
- | - |
| Cotton Glucose Solution (8.93% v/w glucose) |
- | - | 0.518 mL (10.36% v/v) |
- |
| Cutting Waste Cotton Glucose Solution (9.06% v/w glucose) |
- | - | - | 0.510 mL (10.2% v/v) |
| diH2O | - | 1.375 mL (27.5% v/v) |
1.482 mL (29.64% v/v) |
1.49 mL (29.8% v/v) |
Table 2.
Preparation of 1 L Bioreactor Fermentation Solutions.
| Growth Medium | G | CCG | CWG |
|---|---|---|---|
| MSM 1 (5x concentration) | 95 mL (9.5% v/v) | 95 mL (9.5% v/v) | 95 mL (9.5% v/v) |
| MSM 2 (5x concentration) | 95 mL (9.5% v/v) | 95 mL (9.5% v/v) | 95 mL (9.5% v/v) |
| Commercial Glucose Solution (7.4% v/w glucose) | 498.75 mL (49.875% v/v) |
- | - |
| Cotton Glucose Solution (8.93% v/w glucose) |
- | 413.3 mL (41.33% v/v) |
- |
| Cutting Waste Cotton Glucose Solution (9.06% v/w glucose) |
- | - | 407.368 mL (40.737% v/v) |
| diH2O | 261.25 mL (26.125% v/v) |
346.7 mL (34.67% v/v) |
352.632 mL (35.263% v/v) |
| Starter Culture Inoculum | 50 mL (5% v/v) | 50 mL (5% v/v) | 50 mL (5% v/v) |
Table 3.
P3HB yield data grown from respective sugar sources in the 2-L bioreactor.
| Glucose Source | Run | Cell Dry Weight (CDW) (g)* |
P3HB Yield (g) |
P3HB Yield (%)** |
|---|---|---|---|---|
| Commercial Glucose (G) | G1 | 5.86 g | 0.10 g | 1.69% |
| G2 | 5.05 g | 0.03 g | 0.59% | |
| G3 | 6.54 g | 0.06 g | 0.92% | |
| G4 | 3.81 g | 0.10 g | 2.62% | |
| G5 | 4.50 g | 0.03 g | 0.67% | |
| Mean ± Std. Dev. | - | - | 1.30 ± 0.86% | |
| Control Cotton Glucose (CCG) | CCG1 | 3.07 g | 1.14 g | 38.5% |
| CCG2 | 6.4 g | 1.09 g | 17.0% | |
| Mean ± Std. Dev. | - | - | 27.8 ± 15.2% | |
| Cutting Waste Cotton Glucose (CWG) | CWG1 | 3.21 g | 0.9 g | 28.0% |
| CWG2 | 6.05 g | 0.82 g | 13.6% | |
| CWG3 | 9.41 g | 0.78 g | 8.29% | |
| Mean ± Std. Dev. | - | - | 16.6 ± 10.2% |
* Dried cell matter with intracellular P3HB pre-lysing. ** P3HB Yield (%) = [P3HB Yield (g) / CDW (g)] x 100.
Table 4.
Collected thermal analysis data for each experimental P3HB sample compared to literature values, from Figure 2, Figure 3, Figure 4, Figure 5 and Figure 6.
| Test | Property | G-derived P3HB | CCG- derived P3HB |
CWG- derived P3HB |
Purchased P3HB | Literature Source | ||||
|---|---|---|---|---|---|---|---|---|---|---|
| Wang [13] |
Mannina [5] | Lee [27] |
Sudesh [28] | Rysbek [12] | ||||||
| TGA | Tonset | 284°C | 285°C | 267°C | 283°C | 263.4°C | 185°C | 200°C | - | - |
| Tend | 302°C | 306°C | 283°C | 304°C | 269.8°C | 267°C | - | - | - | |
| DSC | Tg | - | - | - | - | - | - | 5°C | 4°C | - |
| Tc* | 37°C | 36°C | 26°C | 73°C | - | - | - | 50-60°C | - | |
| Tcc* | 26°C | 24°C | 28°C | - | - | - | - | - | - | |
| Tm* | 147°C | 151°C | 150°C | 165°C | 172.05°C | - | 175°C | 180°C | 170°C | |
* Tc values are determined from the crystallization peak on the cooling curve, Tcc values are determined from the crystallization peak on the second heat curve, and Tm values are determined from the melting peak on the second heat curve, see Figure 3, Figure 4, Figure 5 and Figure 6 for the DSC curves.
Table 5.
Enthalpy and percent crystallization of prepared samples and purchased P3HB from Figure 3, Figure 4, Figure 5 and Figure 6.
| Property | G-derived P3HB | CCG- derived P3HB |
CWG- derived P3HB |
Purchased P3HB | Wang [13] |
|---|---|---|---|---|---|
| ΔHc J/g | 18 J/g | 38 J/g | 6.9 J/g | 65 J/g | - |
| Xc (%) | 12.3% | 26.0% | 4.7% | 44.5% | - |
| ΔHcc J/g | 14 J/g | 0.42 J/g | 24 J/g | - | - |
| Xcc (%) | 9.6% | 0.3% | 16.4% | - | - |
| ΔHm J/g | 55 J/g | 66 J/g | 60 J/g | 85 J/g | 89.7 J/g |
| Xm (%) | 37.7% | 45.2% | 41.1% | 58.2% | 61.4% |
Disclaimer/Publisher’s Note: The statements, opinions and data contained in all publications are solely those of the individual author(s) and contributor(s) and not of MDPI and/or the editor(s). MDPI and/or the editor(s) disclaim responsibility for any injury to people or property resulting from any ideas, methods, instructions or products referred to in the content. |
© 2025 by the authors. Licensee MDPI, Basel, Switzerland. This article is an open access article distributed under the terms and conditions of the Creative Commons Attribution (CC BY) license (http://creativecommons.org/licenses/by/4.0/).
Copyright: This open access article is published under a Creative Commons CC BY 4.0 license, which permit the free download, distribution, and reuse, provided that the author and preprint are cited in any reuse.


