
Submitted:
09 July 2025
Posted:
10 July 2025
You are already at the latest version
Abstract
Environmental pollution caused by petroleum-based plastics is a global problem due to the accumulation of waste, microplastic pollution, and greenhouse gas emissions. In this context, bioplastics, such as polyhydroxybutyrate (PHB), emerge as a sustainable alternative, as they are biodegradable and produced from renewable resources. This study evaluated the use of agro-industrial waste from Ecuador, specifically whey and pineapple peel, as carbon sources for the production of PHB through fermentation with Bacillus subtilis. Enzymatic hydrolysis of whey was performed with lactase, obtaining an optimal concentration of 761 ppm of glucose in 2 hours. For pineapple peel, acid hydrolysis with 6% H2SO4 was used, achieving a concentration of 5125.81 mg/L of reducing sugars in 30 minutes. Whey fermentation was carried out at pH 6, 37 °C, and 7 days of incubation, while pineapple peel fermentation was carried out at pH 7.7 and 36.7 °C. Whey fermentation produced a higher PHB yield (0.331 g/L) compared to pineapple peel (0.272 g/L). These results demonstrate the potential of both wastes as economical and sustainable substrates for obtaining PHB, highlighting whey as a more efficient source. This study demonstrates that the use of agro-industrial waste for PHB production through fermentation with Bacillus subtilis is a viable and efficient strategy, highlighting whey as a more effective carbon source compared to pineapple peel, which could have a significant impact on waste reduction and environmental sustainability.
Keywords:
fermentación
; polihidroxibutirato
; Bacillus subtilis
1. Introduction
In Ecuador, whey and pineapple peel waste presents significant environmental challenges; the dairy industry generates approximately 900 thousand liters of whey per day, of which only 10% is used, since regulations limit its commercial use [1]. As a result, whey becomes a waste product, causing contamination and waste of a nutritious resource [2,3]. In turn, the high import and consumption of single-use plastics in the country aggravates the waste problem, while pineapple peels are a significant environmental problem, the processing and cultivation operations of this fruit generate a large amount of by-products, mainly peels and crowns, which are usually not used in a sustainable manner [4,5]. In this context, the use of pineapple whey and peel as carbon sources for the production of PHB biopolymer by fermentation with Bacillus subtilis offers a sustainable alternative [6,7]. The production of PHB, a biodegradable and biocompatible biopolymer, represents a sustainable alternative to conventional plastics, with the advantage of reducing environmental impact and taking advantage of by-products considered waste [8,9,10]. Although whey is a valuable dairy by-product, its use in Ecuador is limited by commercial restrictions, generating a significant surplus that contributes to pollution [11,12]. On the other hand, lignocellulosic biomass, such as pineapple peel, reduces the costs of biopolymer production, since it offers a cheap and abundant source of carbon [13]. This process converts these residues into biopolymers, promoting the reduction of agroindustrial waste and offering an environmentally friendly option to conventional plastics [14,15,16].
PHB is a biopolymer belonging to the family of polyhydroxyalkanoates (PHA), which are polyesters synthesized intracellularly by bacteria such as Bacillus subtilis in response to stress conditions, such as an excess of carbon and a limitation of other essential nutrients [17,18]. Its chemical structure is that of a linear polyester with repeating 3-hydroxybutyric acid units, characterized by ester bonds connecting the monomers (3-hydroxybutyrate units), which gives it properties of biodegradability and biocompatibility [19,20].
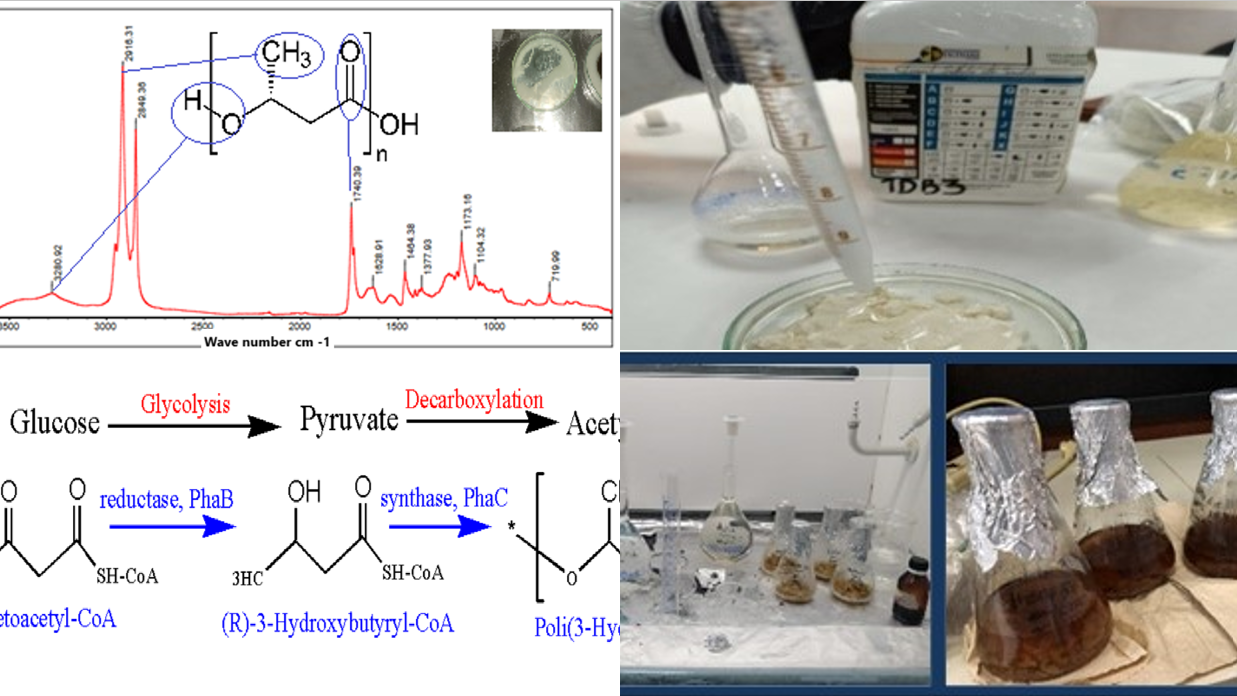
PHB is synthesized mainly as a result of carbon assimilation as shown in Figure 1, from sources such as glucose, starch and sources containing large amounts of polysaccharides linked by glycosidic bonds that can act as an intracellular energy reserve in certain microorganisms [21].
To obtain PHB, it is produced by a biochemical pathway for synthesis from carbohydrates [22]. These carbohydrates undergo metabolic processes, such as glycolysis to generate pyruvate, then pyruvate is converted to acetyl-CoA by a decarboxylation reaction [23,24]. Subsequently, two acetyl-CoA molecules are condensed to form intermediates such as acetoacetyl-CoA and then reduced to (R)-3-hydroxybutyryl-CoA and finally polymerized to form P3HB [25,26].
This study explores the use of agro-industrial wastes, such as whey and pineapple peel, in the production specifically of PHB by fermentation with the bacterium Bacillus subtilis. This bacterium, widely studied in biotechnology, has the ability to synthesize PHB intracellularly in response to stress conditions, such as nutrient limitations like nitrogen or phosphorus, or the presence of excess carbon. This project focuses on optimizing fermentative conditions and characterizing the PHB obtained, promoting sustainable biotechnological practices for waste management and production of biodegradable materials.
2. Materials and Methods
The following are the procedures that were carried out for pineapple peel and whey.
2.1. Pineapple Peel
In the present investigation, a finite population was studied, which is the case of pineapple residues (peel), which served as the only carbon source for Bacillus subtilis in the production of PHB. With these residues, the chemical proximate analysis was carried out in triplicate.
2.1.1. Moisture
The Mettler Toledo HB moisture analyzer was used to measure moisture in pineapple peels, using a 4 g sample.
2.1.2. Total Ash
The ash protocol contained in AOAC section 923.03 (1990) was followed, which consisted of measuring the ash in the sample with a sample particle size at 250 µm, and the results were expressed using equation 1:
Where: = Weight of empty crucible, = Weight of crucible with sample, = Weight of crucible with ash.
2.1.3. Total Fats
To determine total fats in pineapple peels, the ether extraction method described in AOAC (1990) procedure 920.39 c was used. Initially, 1 g of the pulverized sample was weighed and 10 ml of 50% S was added, followed by chemical digestion to remove non-fat components. Subsequently, by extraction with petroleum ether, the ethereal phase was recovered. The percentage of fat present in the peels was calculated using equation 2:
2.1.4. Hydrolysis Treatment
The substrate was subjected to acid hydrolysis with the objective of maximizing the release of sugars, especially glucose, through the decomposition of cellulose and starch. For this purpose, 10 g of the substrate was mixed in 100 ml of water, adding diluted S at 4 - 6% v/v. This solution was heated between 95 and 121 °C for a range of 10 - 83 min. Subsequently, the pH of the hydrolysate was adjusted to a range of 4.8 to 6.5 using a buffer prepared with citric acid () and sodium acetate (CCOONa).
2.1.5. Substrate Conditioning
In this study, the methodology proposed by [27] for pretreatment of pineapple peels was applied. However, adjustments were made based on the recommendations of [28], who investigated obtaining glucose syrups from the same peels by enzymatic hydrolysis. The main objective was to avoid the formation of inhibitors during the process. In response to the acid pH of the hydrolysate, a buffer solution was prepared using specific compounds that do not alter the sugars present. This solution, composed of citric acid, sodium acetate and calcium carbonate, was accurately prepared: 2.10 g of citric acid and 2.94 g of sodium acetate in 100 ml volume. Then, the pH was adjusted to 6.2 by the combination of HCl and CCOONa. In addition, the buffer was fortified with calcium carbonate to avoid undesired changes in pH during fermentation.
2.1.6. Quantification of Reducing Sugars
In this study, the 3,5-dinitrosalicylic acid (DNS) method was used to quantify reducing sugars in pineapple (Ananas comosus) peel hydrolysis. The method, previously described by [29], was adapted by preparing specific dilutions to construct a calibration curve. To establish the standards, glucose and fructose solutions were used, each with an initial mass of 50 mg. From these, dilutions were prepared with concentrations of 5000, 500, 50 and 5 ppm. The procedure consisted of taking 1 ml of the standard solution and adding 1 ml of the DNS reagent. Subsequently, the presence of glucose and fructose in the hydrolyzed samples was analyzed using a UV-Vis spectrophotometer (Jasco V-630 equipment).
2.1.7. Activation and Ambient of Microorganism Bacillus Subtilis ATCC (6633)
Bacillus subtilis strain ATCC (6633) was used and seeding was performed on semi-solid nutrient Agar for 48 hours at a temperature of 37 °C in an oven. Within the framework of this study, an adaptation of the carbon source used by the microorganism was carried out. In this case, the new carbon source consisted of xylose obtained from pineapple peels. To achieve this, initial mixtures of the new substrate were made with nutrient agar, evaluating the tolerance of the microorganism until it largely replaced the traditional carbon source. These adaptations were carried out in flasks with orbital shaker (Thermo Scientific MaxQ 4000) at a pH of 6.2 and a temperature of 36.7 °C, for a period of 96 hours. Three experimental conditions were carried out as detailed in Table 1, where M1 is the medium containing nutrient agar with 75 ml of substrate, M2 contains nutrient agar with 50 ml of substrate and M3 nutrient agar with 25 ml of substrate.
2.1.8. Fermentation Treatment
To perform the fermentation for PHB production, a one-way structure was proposed with a completely randomized design (CRD) and sequencing in transverse log, where the treatments were subjected to destructive testing. Table 1 shows the treatments modeled by the combination of: pH, temperature and medium for the fermentative production of PHB and the methodology proposed by [30] for the fermentative production of PHB using Bacillus subtilis bacteria was applied. Modifications were made to the operating conditions, implementing eight treatments previously described.
2.1.9. Extraction and Purification of PHB
For the extraction and purification, the methodology mentioned in the work of [31] called "Extraction, purification and modification of a biopolymer of the poly (3-hydroxybutyrate) type obtained from the fermentation of fatty acids with B. cepacia" was applied with the chloroform-sodium hypochlorite digestion (4% v/v). Once all the samples were purified, the product obtained was weighed in mg/mg to determine the yield obtained (SPY) in each treatment using equation 3:
2.1.10. Characterization of PHB in the FT-IR
For the characterization of PHB, the Fourier transform infrared spectroscopy technique was used, which was analyzed in Thermo Scientific Nicolet TM S10 FT-IR
2.2. Whey
2.2.1. Whey Preparation
The whey was obtained from an artisanal cheese production company located in the city of Cuenca and subsequently stored at a temperature of 2 °C. The collected material was subjected to several procedures. First, vacuum filtration was carried out in order to eliminate the proteins present. Next, a heat treatment was applied at 121 °C for 15 min to induce protein precipitation. Subsequently, centrifugation was performed to separate the proteins and remove the added water. Finally, the pH was adjusted to 6.5 using NaOH 1N in order to preserve the sugars. All procedures were carried out under aseptic conditions to avoid degradation of the sugars present.
2.2.2. Physicochemical Characterization of Spent Whey
Physicochemical characterization of the whey involved analyzing the following variables: pH, moisture content, sugar quantification, and enzymatic hydrolysis.
2.2.3. pH and Moisture Content
With the amount of 500 ml of substrate, pH levels were adjusted to 5, 6, 7 and 8 using 1 N NaOH. To determine the moisture content, a Mettler Toledo HB moisture analyzer with halogen lamp was used, in which 2 g of the sample was placed and placed in the analyzer tray. During the analysis the device monitored the weight loss until a constant mass was reached.
2.2.4. Quantification of Sugars
To carry out the validation, the DNS (3,5-dinitrosalicylic acid) method was followed, and for this, 0.8 g of NaOH was dissolved in distilled water, then 15 g of sodium tartrate was added and, finally, 0.5 g of DNS and the mixture was brought to a volume of 50 ml. For the calibration curve, absorbance readings were measured at 540 nm using 200, 400, 800 and 1000 ppm standard solutions. After obtaining the calibration curve for glucose as a standard, the samples to be analyzed were prepared: 5 ml of each sample was heated in a water bath for 5 minutes and the reaction was stopped with cold water. Subsequently, the sample was reconstituted with 5 ml of O, shaken and allowed to stand for 15 minutes. This procedure was repeated for each sample to be analyzed. The calibration curve was quantified by linear regression.
2.2.5. Enzymatic Hydrolysis
Using the methodology applied for the enzymatic hydrolysis of [32], enzymatic hydrolysis was carried out on each of the treatments using commercial LACTFLAT tablets. Six 1/2 tablets were dissolved in 18 ml of distilled water to achieve a concentration of 30 mg/ml lactase. The pH of all treatments was then adjusted to 6.5 to facilitate 99.99% enzymatic hydrolysis. To each treatment, 1 ml of the enzyme dilution was added. Three of the four treatments were incubated for one hour in a Shaker orbital incubator with agitation at 100 rpm and a temperature of 40°C. The fourth treatment was subjected to the same conditions, but for two hours. Subsequently, the pH of the four treatments was adjusted to values of 5, 6, 7 and 8, respectively. These were stored in a refrigerator at 2°C until further use for fermentation.
2.2.6. Activation and Microscopic Characterization of Bacillus Subtilis
For activation of the Bacillus subtilis ATCC 6051 strain, 2 ml of strain was used and inoculated in 10 ml of Trypticasein Soy Broth (TSB) for 24 hours at 37°C . The bacteria were then characterized using Gram staining to distinguish bacterial cell walls based on their response to crystal violet and iodine [33]. Initially, bacterial cells were heat fixed on a slide for adherence, subsequently stained with crystal violet followed by iodine to form a complex within the cell walls. Then a decolorization with alcohol-acetone was performed to differentiate between Gram-positive bacteria (retained staining) and Gram-negative bacteria (decolorized). Finally, a counterstain with safranin was applied to visualize Gram-negative bacteria, facilitating the identification and characterization of Bacillus subtilis based on its Gram-positive staining properties.
2.2.7. Reseeding of Bacillus subtilis Strain from Activation
For the reseeding process, eight test tubes were prepared, each containing 10 ml of medium. In pairs, the first two tubes each had 0.5 ml of activated bacteria, the next two had 1 ml, the next two had 1.5 ml and the last two had 2 ml of bacteria. Subsequently, the bacteria were counted and for this purpose followed the methodology proposed by [34] using the turbidity method, which analyzes the samples depending on the amount of light passing through the culture (see Table 2). Four standards were used and the absorbance at 600 nm of the previously prepared cultures at different pHs was measured.
2.2.8. Fermentation
Sixteen experiments were carried out using different combinations of parameters to evaluate fermentation with Bacillus subtilis. Each sample consisted of 112 ml of substrate and 10% v/v bacterial inoculum, ensuring an initial cell concentration between 1.5×and 9× cells/ml. The assays were performed in an orbital shaker incubator under constant shaking at 200 rpm, with pH values adjusted to 5, 6, 7 and 8, and temperatures between 30 °C and 40 °C. Fermentation times varied between 5 and 8 days according to the specific conditions of each sample, with the objective of analyzing the combined effect of temperature, pH and cell concentration on the fermentation process.
2.2.9. Obtaining Biomass and PHB Extraction
Two parameters were evaluated, wet weight and dry weight, the biomass was separated from the medium by centrifugation at 1200 rpm for 20 minutes [35]. To determine the wet weight the biomass and medium were centrifuged in Eppendorf tubes according to the previous parameters. Then, the precipitated biomass was transferred to already weighed Petri dishes. For dry weight, the sample was subjected to a climate chamber at 60°C for 24 hours to remove all moisture. The samples were then ground at 2500 rpm using a mill with 1.5 mm sieves and the ground biomass was weighed. Next, the SDS digestion and chloroform dispersion method was used to extract and purify the biopolymer.
2.2.10. Chemical Digestion with SDS (Sodium Dodecylsulfate)
Following the methodology of [36], polymer quantification was initiated by adapting the biomass quantification procedure without the drying step. This approach aimed to ensure that residue-free biomass from the culture medium could be digested and PHB quantified. The resulting precipitate was suspended in a 20% SDS solution, as shown in Figure 2, at a concentration of 0.55 ml/g and digested at 40°C for 2 hours. Subsequently, the samples were centrifuged at 3500 rpm for 30 min to remove SDS and biomass residues. Finally, the wet biomass was transferred to Petri dishes for drying.
2.2.11. Dry Sample Analysis in FTIR with SDS
The dry samples, after being treated with SDS, were measured by FTIR to analyze their content. This analysis was performed to identify and quantify the chemical composition and structural characteristics of the samples
2.2.12. Purification and Structuring of PHB with Chloroform
The cells obtained after digestion with SDS and subsequent drying were suspended in chloroform using a ratio of 20 ml of solvent per gram of biomass this according to the procedure of [37]. They were then stirred at room temperature for 24 hours. This process produced two distinct phases: a liquid phase composed mainly of polymer and chloroform, and a solid phase retained on the filter, composed of biomass residues. The polymer solution was poured into Petri dishes and left at room temperature to allow the chloroform to evaporate, resulting in a P3HB film.
3. Results
3.1. Pineapple Peel
3.1.1. Chemical Proximate Analysis of Pineapple Peel
The results obtained from the proximate analysis of pineapple peel are influenced by the variety of pineapple, its temperature, drying time, drying method used, among others. Table 3 shows the values obtained for moisture, ash and total fat.
The average percentage resulting from the triplicate samples gives us a value of 2.51% for pineapple peel. In the work of [38] he states that moisture is inversely proportional to temperature and time of drying and that this is the reason why the moisture percentages occupy a wide range, from 2.33% to 3,68% when working at temperatures from 70 to 80°C. In the results obtained by [39], he obtained values of 2.65% of ashes in dry basis and 9.84% of humidity, attributing as causal factor to the drying temperature at which he worked and also to the origin of the pineapple, however, the data obtained in this work do not differ from others reviewed.
The average amount of ash or inorganic residues of the three samples analyzed was 5.10%, slightly different from the value explained by [38] who in his study obtained the nutritional composition for different parts of the pineapple, corresponding to 5.2% ash.
The percentage data of the fat content present in each sample of pineapple peel in triplicate are presented in Table 9. The average value of total fat was 2.33%, which agrees with the literature as indicated by [40] that there is a range of 2-3% but that, depending on the variety of pineapple, the same is extended by 0.6 - 5.57%.
3.1.2. Hydrolysis Treatment
The acid hydrolysis process of pineapple peel, as illustrated in Figure 3, consisted of subjecting the lignocellulosic residues to the action of sulfuric acid under controlled temperature conditions. Initially, the peels are weighed and placed in flasks together with a solution of sulfuric acid at different concentrations. This system is kept under constant agitation and heating, ensuring the degradation of the polysaccharides into reducing sugars, such as glucose, which act as precursors for the production of biopolymers such as PHB.
3.1.3. Quantification of Reducing Sugars
As a result of the hydrolysis of the substrate (pineapple peel), the monosaccharides (glucose and fructose) present were quantified, as shown in Table 4. The analysis of the amount of fructose present was done as a standard since it represents xylose as a pentose for later statistical analysis.
3.1.4. Analysis of Hydrolysis Results
The analysis of reducing sugars presents an R-squared of 43.48%, implying that the model moderately explains the variability in the data, although the adjusted R-squared (0%) suggests limited predictive improvement when adjusting for the number of variables. The standard error of the estimate is 1774.94 and the mean absolute error is 861.8, both reflecting considerable variability in the results and limitations in the accuracy of the model. The Durbin-Watson statistic of 1.7972 and the low residual autocorrelation of Lag 1 (0.0419) suggest independence in the errors, a positive feature for the reliability of the analysis, although the high errors indicate possible areas for improvement of the predictive model in future studies.
Response Surface Plot
The response surface plot (Figure 4) showed an optimum hydrolysis corresponding to a value close to 5130 with an acid concentration close to 5.35% optimum in a time close to 35 min, for a temperature of 118,15°C.
3.1.5. Statistical Analysis of Reducing Sugars: Fructose
In this analysis, 0 effects have a p-value less than 0.05, indicating that they are significantly different from zero at a 95% confidence level. The values obtained indicate the moderate quality of molding prediction being: The R-squared statistic corresponding to the proportion of variability in hydrolysis data is 40.26% The standard error is 1774.94 which indicates the standard deviation of the residuals. The mean absolute error (MAE) of 903.678 corresponds to the average margin of error of the residuals in the predictions from the model used. The Durbin-Watson (DW) statistic of 1.7972 for this study indicates the absence of significant autocorrelation in model errors, i.e., these data do not have a significant influence by the order in which they are presented. This is justified by the p-value which is greater than 5%, thus there is no serial autocorrelation. In Figure 4 I present the values that the main influential variables in the fructose hydrolysis process applied for the pretreatment of pineapple peel should take, in order to achieve a better separation of the lignocellulosic matrix. For the concentration factor, the acid should have a concentration of 5.25%, the fermentation time should be in the range of 45 min and the ideal temperature should be close to 118°C, values that agree with and support the Pareto graphs and response surface graphs.
Response surface plot
The response surface plot (Figure 5) showed an optimum hydrolysis corresponding to a value close to 5035.24 with an acid concentration close to 5.35% optimum in a time range of 35- 40 min.
3.1.6. Yield of PHB from Substrate
The yield was calculated by dividing the amount of product formed for the substrate consumed for all 8 treatments proposed (see Table 5) in the methodology with its triplicate to check the yield of Bacillus subtilis using pineapple peel as PHB producer.
Table 6 provides information corresponding to the PHB yield obtained in each treatment from the Bacillus subtilis bacteria, with the highest value for treatment T7, which showed the best results. At a general level, it is possible to show that the best results were obtained with the conditions of treatment 7 (T7) with 0.27 being this yield value the highest, followed by treatment 6 (T6) with 0.11 and finally treatment 8 (T8) with 0.0911.
Next, in Figure 6, the result of the Shapiro-Wilk normality test suggests that there is not enough evidence to reject the null hypothesis of normality for this data set (p > 0.01). In addition, the Q-Q plot shows a scatter of points following a straight line (see Figure 6), which supports the idea that the data could be from a normal distribution.
An ANOVA analysis was then performed, which, indicates that there are statistically significant differences between treatments, as the F-value is large and the p-value is extremely small. This suggests that at least one treatment mean is different from the others. In addition, Tukey’s post hoc analysis identifies specific pairs of treatments with significant differences in their means.
As can be seen from the results in Table 7 that in T7, T8 (b) and T3, T2, T4 (d) there is no significant difference between treatments; while in treatments T1 (e) and T6 there is a significant difference with respect to the rest of the treatments.
3.1.7. Characterization of PHB Powder by FT-IR
In this analysis, the most important or representative peaks of the spectrum of all PHB products obtained were observed in order to verify their structure.
In the spectrum of Figure 7, it shows a sharp absorption band at 1723.04 corresponding to stretches of the C=O bond, another band was observed at 1277.87 corresponding to the C-H group, the presence of these bands have been reported as representative peaks of PHB. Intense bands were also observed between 1000 and 1300 , characteristic of the C-O ester group, in addition the bands at 2851.16 and 2921.07 show the presence of C and C with asymmetric and symmetric stretches respectively. The bands showing the terminal OH group are 3286.40 , so it can be induced that it contains the PHB peaks.
3.1.8. Proximal Chemical Analysis of Lacto-Serum
Moisture content analysis was performed on the whey used to produce (PHB) with Bacillus subtilis. This analysis is crucial for the efficiency of the fermentation process and the final yield of PHB. The results indicated that the whey had a moisture content of 91.64%, which is typical for whey, which naturally retains a significant amount of water
3.1.9. Quantification of Sugars
Quantitative analysis of the sugars present in the whey at different pH levels (5, 6, 7 and 8) was performed. This analysis made it possible to determine how these pH variations affect the concentration of hydrolyzed whey. The results indicated that an acidic pH (such as Sample 1, pH 5) favors the hydrolysis process, resulting in a higher concentration of fermentable sugars. On the other hand, an alkaline pH (such as Sample 4, pH 8) showed a lower concentration of sugars (see Table 8). Samples with intermediate pH (6 and 7) showed moderate concentrations and absorbance values, supported by a standard error of 51.6071, which increases the reliability and accuracy of the regression model. In addition, sugar content was evaluated under specific conditions by hydrolysis of samples with the commercial enzyme LACTFLAT. Hydrolysis was performed at pH 6.5 for 1 hour and 2 hours. The optimum result was obtained with a hydrolysis duration of 2 hours at a concentration of 761 ppm, which maximized the glucose concentration. This finding highlights the efficiency of the 2-hour duration as the most effective process for sugar release within the parameters of this research.
3.1.10. Statistical Analysis of Reducing Sugars
A statistical evaluation of reducing sugars (glucose) obtained from hydrolysis was performed. The objective was to determine their relevance at different durations and conditions (pH). Statistical tests such as ANOVA and Tukey HSD analysis were used to identify the optimum conditions that maximize glucose yield. Two analyses of glucose hydrolysis were performed at different pH conditions. First, at pH 6.5, it was found that the duration of hydrolysis does not significantly affect glucose concentration. Furthermore, in hydrolysis at different pH (5-6-7-8), no statistically significant differences in glucose concentration were observed between the different pH levels (see Figure 8 right). In both cases, ANOVA and Tukey HSD test were used to support these conclusions, ensuring that the observed differences were not random. Analysis of glucose hydrolysis at different pHs showed that the duration of hydrolysis and pH variations did not significantly affect glucose concentration. However, in Figure 8 (left), the graph suggests that a longer duration of the hydrolysis process (2 hours) results in a consistently higher glucose concentration Statistical methods supported these conclusions, ensuring that the observed differences were statistically significant.
3.1.11. Analysis of the Fermentation Process for Polyhydroxybutyrate Production
For the fermentation of whey using Bacillus subtilis, a microscopic characterization was performed. This characterization demonstrated the morphology and characteristics of this microorganism. Figure 9 shows a field densely populated by cells with a rod-shaped structure, in pairs and short chains, this being a typical morphological characteristic of Bacillus subtilis. The cell walls of this microorganism are thick, a feature typical of Gram-positive bacteria, being part of these Bacillus subtilis. As described by [41].
3.2. Obtaining Wet Weight and Dry Weight
For PHB production, emphasizing the impact of obtaining the wet and dry weight of biomass as it influences PHB yield. Variables such as bacterial concentration, fermentation time and pH were analyzed for production. In the work of [42] it is detailed that the weight of the biomass, whether wet or dry, tends to increase or decrease in a varied manner with the change in pH. Table 9 shows the biomass weights for obtaining polyhydroxybutyrate, here an interesting relationship between pH and the wet and dry weights during fermentation is observed. At pH 5, the wet weight decreases with time, indicating that more acidic conditions may reduce accumulation. However, at pH 8, the wet weight gradually increases, suggesting that a slightly basic environment favors greater accumulation. On the other hand, dry weight also shows variations according to pH: at pH 5, it decreases from 4.14 g to 2.17 g on day 8; at pH 6, it increases steadily for four days; at pH 7, it decreases from 4.86 g to 2.10 g over the same period; and at pH 8, it varies between 4.98 g, 3.49 g, 4.13 g and 3.67 g on the corresponding days

Table 9.
Biomass weights obtained at different pHs.
| Biomass wet weight | Dry weight of biomass | ||||||||
| pH | X1, (5D) | X2, (6D) | X3, (7D) | X4, (8D) | pH | X1, (5D) | X2, (6D) | X3, (7D) | X4, (8D) |
| 5 | 15.69 | 15.01 | 12.32 | 17.57 | 5 | 4.14 | 3.41 | 2.83 | 2.17 |
| 6 | 16.93 | 14.56 | 13.41 | 17.68 | 6 | 4.94 | 4.15 | 4.44 | 5.12 |
| 7 | 16.72 | 15.60 | 13.35 | 16.67 | 7 | 4.86 | 3.23 | 2.92 | 2.10 |
| 8 | 16.57 | 15.23 | 13.61 | 18.44 | 8 | 4.98 | 3.49 | 4.13 | 3.67 |
’D’ represents the fermentation days used in the study and units are in g. Source:
According to the ratio of dry weight to wet weight is determined by dividing dry weight by wet weight for each data set. This ratio provides information on the proportion of dry biomass within the total sample, which is essential to evaluate the production efficiency of bioproducts, such as PHB, Table 10 shows the ratios between the weights.
In the PHB elicitation study, the relationship between dry weight and wet weight was analyzed as a function of pH and time. The results reveal significant patterns. At pH 8 on day 5, the highest ratio was observed (0.301), followed by pH 6 on day 7 (0.331) and pH 8 on day 7 (0.304). Based on this ratio, the optimal conditions for fermentation and PHB production appear to be pH 6 on day 7 (ratio 0.331) and pH 8 on day 5 (ratio 0.304). In general, acidic conditions (pH 5) are less favorable for stable biomass production. Slightly acidic (pH 6) and neutral (pH 7) conditions are more beneficial for stable production, with pH 6 being the most favorable for both dry and wet weights. Although slightly basic conditions (pH 8) improve water retention, the variability in dry weight suggests that they are not ideal for dry biomass accumulation.
3.3. Biomass Analysis by FTIR Infrared Spectroscopy
The infrared spectrum (FTIR) in Figure 10 showed several absorption peaks that are characteristic of certain PHB functional groups. The features observed in the main spectrum include peaks at 3279.63 which shows the presence of OH groups of alcohols or carboxylic acids, at 1633.12 this peak represents the C=O stretches of esters, thus indicating the presence of PHB, also at 2849.61 is the stretching of methyl groups. -C, also at 1217.03 : This peak is associated with the C-O stretching vibration of the esters, which also supports the presence of PHB. The observed features suggest that the biomass obtained contains a ratio of this biopolymer.
3.4. Interpretation of the P3HB Film Spectra
The FTIR spectrum in Figure 11 illustrates in the analysis of a plastic film made from PHB that has undergone purification with chloroform. Where it can be seen that upon transformation of PHB from powder to plastic, the FTIR spectrum and its main absorption bands show no changes during film formation. Showing that the purification with chloroform contributed to preserve the integrity of PHB. It can be distinguished that the peaks at 1740.39 , 1173.16 and 1104.32 indicate the presence of ester functional groups, characteristic of PHB. Additionally, the peak at 3280.02 is possibly associated with O-H stretching vibrations of residual hydroxyl groups, which could be due to incomplete purification or the presence of residual moisture. Thus, it is confirmed that chloroform effectively maintains the structure.
3.5. Yield of PHB from Substrate
In the process yield and percentage recovery are shown in Table 11; these results show that the highest yield of PHB is achieved with the following conditions: at a pH level of 7 or 8 and a fermentation period of 8 days with treatment X4. The maximum yield obtained is 0.5266 g with a porcentual purification of 53.74 which is observed at pH 7 with treatment X4 after 8 days of fermentation.
This finding suggests that higher pH levels and extended fermentation periods significantly enhance PHB production. Specifically, a pH of 7 or 8 combined with 8 days of fermentation leads to the highest PHB accumulation, indicating that these conditions are the most effective. The optimal conditions for achieving the highest PHB yield are observed with treatment X4, at pH 7 and 8 days of fermentation. It is also important to note that treatment X2, at pH 6 and 8 days of fermentation, produces a remarkably high yield of the biopolymer.
4. Discussion
The results obtained in this research showed that the whey showed a higher efficiency, in terms of yield, reaching 0.331 g/L of PHB compared to 0.272 g/L obtained with pineapple peel. This difference can be attributed to the higher availability of simple sugars after enzymatic hydrolysis of whey, which favors bacterial metabolism and intracellular accumulation of PHB. These results are consistent with previous studies such as those of [7], who reported efficient PHB production using glycerol-rich residues, and [13], who demonstrated that pineapple residues are an economical source but require more stringent pretreatment conditions to achieve high yields. Furthermore, the optimal pH (7-8) and temperature (36-37 °C) values observed are in agreement with those reported by [30], who identified that B. subtilis maximizes its biosynthesis of PHB under neutral to slightly alkaline conditions and in the presence of excess carbon. Furthermore, characterization of the biopolymer by FTIR spectroscopy revealed characteristic bands of the ester group (C=O) and methyl groups (C), confirming the structural identity of the PHB produced, in agreement with that described by [19]. These findings reaffirm that the valorization of local agroindustrial waste by microbial fermentation is not only technically and economically feasible, but also aligns with the principles of sustainability and circular economy promoted in recent research [6,18].
5. Conclusions
Regarding the study of sugarcane, this research has succeeded in optimizing the pH conditions and fermentation time to maximize the yield of PHB. Statistical tests, such as analysis of variance (ANOVA) and Tukey HSD test, indicate that pH variation during enzymatic hydrolysis does not significantly affect glucose concentration, which simplifies the optimization of fermentation conditions. In addition, pH has been shown to influence biomass wet weight, with a slightly basic pH (7) being the most stable. In terms of PHB yield, treatments at pH 7 and 8 for 8 days of fermentation were the most effective, reaching maximum yields of 53.74% and 45.31%, respectively. These findings suggest that slightly basic pH levels and prolonged fermentation periods are essential to improve PHB production. However, in the pineapple peel study, PHB production was determined and optimized using Bacillus subtilis and whey as substrate. Statistical analysis revealed significant differences according to the physicochemical parameters evaluated. When experimenting with critical points, it was observed that the yield was minimal in treatments T4 and T5, where the microorganism showed high sensitivity at a pH of 5.67 and a temperature of 35.8 °C. The best treatment (T6) achieved a yield of 0.11, with optimal conditions of temperature (36 °C), pH (7.77), agitation (115 rpm) and culture medium (75 ml substrate, 25 ml agar, inoculum 6 ml). Treatment T2 obtained the lowest yield (5.878 x ) with conditions of pH 5.67, temperature 36.4 °C and medium (25 substrate, 75 agar, inoculum 6 ml). Overall, pH was identified as one of the most influential factors in the PHB production capacity by Bacillus subtilis bacteria.
Author Contributions
Conceptualization: Jorge Amaya. and Y.Y.; methodology: Jorge Amaya.; software: Jorge Amaya; validation, Jorge Amaya; formal analysis: Jorge Amaya; investigation: Jorge Amaya; resources: Jorge Amaya; data curation: Gabriela Vaca.; writing—original draft preparation: Jorge Amaya; writing—review and editing: Jorge Amaya.; visualization: Jorge Amaya; supervision: Jorge Amaya.; project administration: Jorge Amaya. All authors have read and agreed to the published version of the manuscript.
Funding
Esta investigación fue financiada por la Universidad Politécnica Salesiana, Sede Cuenca”. y “El APC fue financiado por el Grupo de Investigación y Evaluación de Biodiversidad (GIVABI) y la Universidad Politécnica Salesiana, Sede Cuenca”.
Institutional Review Board Statement
Not applicable.
Informed Consent Statement
Not applicable.
Data Availability Statement
The data supporting the results of this study are not publicly available due to institutional and confidentiality restrictions, but can be provided by the corresponding author upon reasonable request.
Acknowledgments
During the preparation of this study, the authors used the facilities of the Life Sciences Laboratory of the Universidad Politecnica Salesiana, Cuenca, for which they offer their sincere thanks to the university and the GIBAVI research group for the help provided The authors have reviewed and edited the results and assume full responsibility for the content of this publication.
Conflicts of Interest
“The authors declare that they have no conflict of interest” and “The funders had no role in the design of the study; in the collection, analysis, or interpretation of the data; in the writing of the manuscript; or in the decision to publish the results.”
Abbreviations
The following abbreviations are used in this manuscript:
| PHB | Polyhydroxybutyrate |
| ANOVA | Analysis of Variance |
| FTIR | Fourier Transform Infrared Spectroscopy |
| GR | Reagent grade methanol |
| DNS | 3,5-dinitrosalicylic acid |
| ATCC | American Type Culture Collection |
| CRD | Completely Randomized Design |
| TBS | Tryptic Soy Broth |
| SDS | Sodium Dodecyl Sulfate |
| HSD | Honestly Significant Difference |
| SPY | Substrate Product Yield |
References
- Coba, G. "Prohibición del suero líquido provocaría el desperdicio del 90% de insumos en la industria lechera", 2019.
- Addai, F.P.; Lin, F.; Wang, T.; Kosiba, A.A.; Sheng, P.; Yu, F.; Gu, J.; Zhou, Y.; Shi, H. Technical integrative approaches to cheese whey valorization towards sustainable environment. Food & Function 2020, 11, 8407–8423. [CrossRef]
- de Almeida, M.P.G.; Mockaitis, G.; Weissbrodt, D.G. Got Whey? Sustainability Endpoints for the Dairy Industry through Resource Biorecovery. Fermentation 2023, Vol. 9, Page 897 2023, 9, 897. [CrossRef]
- Sarangi, P.K.; Singh, A.K.; Srivastava, R.K.; Gupta, V.K. Recent Progress and Future Perspectives for Zero Agriculture Waste Technologies: Pineapple Waste as a Case Study. Sustainability 2023, Vol. 15, Page 3575 2023, 15, 3575. [CrossRef]
- Hamzah, A.F.A.; Hamzah, M.H.; Man, H.C.; Jamali, N.S.; Siajam, S.I.; Ismail, M.H. Recent Updates on the Conversion of Pineapple Waste (Ananas comosus) to Value-Added Products, Future Perspectives and Challenges. Agronomy 2021, Vol. 11, Page 2221 2021, 11, 2221. A su vez, la elevada importación y consumo de plásticos de un solo uso en el país agrava el problema de residuos, mientras que la cáscara de piña, son una problemática ambiental significativa, las operaciones de procesamiento y cultivo de esta fruta generan una gran cantidad de subproductos, principalmente cáscaras y coronas, que usualmente no se aprovechan de manera sostenible, . [CrossRef]
- Albuquerque, P.B.; Malafaia, C.B. Perspectives on the production, structural characteristics and potential applications of bioplastics derived from polyhydroxyalkanoates. International Journal of Biological Macromolecules 2018, 107, 615–625. [CrossRef]
- Cavalheiro, J.M.; de Almeida, M.C.M.; Grandfils, C.; da Fonseca, M.M. Poly(3-hydroxybutyrate) production by Cupriavidus necator using waste glycerol. Process Biochemistry 2009, 44, 509–515. [CrossRef]
- Noble, R.; Elphinstone, J.G.; Sansford, C.E.; Budge, G.E.; Henry, C.M. Management of plant health risks associated with processing of plant-based wastes: A review. Bioresource Technology 2009, 100, 3431–3446. [CrossRef]
- Wu, W.; Geng, P.; Li, G.; Zhao, D.; Zhang, H.; Zhao, J. Influence of Layer Thickness and Raster Angle on the Mechanical Properties of 3D-Printed PEEK and a Comparative Mechanical Study between PEEK and ABS. Materials 2015, Vol. 8, Pages 5834-5846 2015, 8, 5834–5846. [CrossRef]
- Papagianni, M. Fungal morphology and metabolite production in submerged mycelial processes. Biotechnology Advances 2004, 22, 189–259. [CrossRef]
- Pavel, C.C.; Popa, K. Investigations on the ion exchange process of Cs+ and Sr2+ cations by ETS materials. Chemical Engineering Journal 2014, 245, 288–294. [CrossRef]
- Papademas, P.; Kamilari, E.; Aspri, M.; Anagnostopoulos, D.A.; Mousikos, P.; Kamilaris, A.; Tsaltas, D. Investigation of donkey milk bacterial diversity by 16S rDNA high-throughput sequencing on a Cyprus donkey farm. Journal of Dairy Science 2021, 104, 167–178. [CrossRef]
- Suwannasing, W.; Tanamool, V.; Singhaboot, P.; Kaewkannetra, P. Valorisation of Pineapple Cannery Waste as a Cost Effective Carbon Source for Poly 3-hydroxyabutyrate (P3HB) Production. Polymers 2023, Vol. 15, Page 3297 2023, 15, 3297. [CrossRef]
- Yashas, Y.G.; Nagaraju, S.B.; Puttegowda, M.; Verma, A.; Rangappa, S.M.; Siengchin, S. Journal of Composites Science 2023, Vol. 7, Page 2426. [CrossRef]
- Valle, C.; Voss, M.; Gaudino, E.C.; Forte, C.; Cravotto, G.; Tabasso, S. Harnessing Agri-Food Waste as a Source of Biopolymers for Agriculture. Applied Sciences 2024, Vol. 14, Page 4089 2024, 14, 4089. [CrossRef]
- Blasi, A.; Verardi, A.; Lopresto, C.G.; Siciliano, S.; Sangiorgio, P. Lignocellulosic Agricultural Waste Valorization to Obtain Valuable Products: An Overview. Recycling 2023, Vol. 8, Page 61 2023, 8, 61. [CrossRef]
- Kourmentza, C.; Plácido, J.; Venetsaneas, N.; Burniol-Figols, A.; Varrone, C.; Gavala, H.N.; Reis, M.A. Recent Advances and Challenges towards Sustainable Polyhydroxyalkanoate (PHA) Production. Bioengineering 2017, Vol. 4, Page 55 2017, 4, 55. [CrossRef]
- Koller, M.; Maršálek, L.; de Sousa Dias, M.M.; Braunegg, G. Producing microbial polyhydroxyalkanoate (PHA) biopolyesters in a sustainable manner. New Biotechnology 2017, 37, 24–38. [CrossRef]
- Sudesh, K.; Abe, H.; Doi, Y. Synthesis, structure and properties of polyhydroxyalkanoates: biological polyesters. Progress in Polymer Science 2000, 25, 1503–1555. [CrossRef]
- Tomietto, P.; Loulergue, P.; Paugam, L.; Audic, J.L. Biobased polyhydroxyalkanoate (PHA) membranes: Structure/performances relationship. Separation and Purification Technology 2020, 252, 117419. [CrossRef]
- Berezina, N.; Martelli, S.M. Polyhydroxyalkanoates: Structure, Properties and Sources. RSC Green Chemistry 2014, 2015-January, 18–46. [CrossRef]
- Echavarría, A.C.C.; Martínez, A.L.M.; Montoya, M.M. Identificación Molecular de Bacterias Productoras de Polihidroxialcanoatos en Subproductos de Lácteos y Caña de Azúcar. Revista Facultad Nacional de Agronomía Medellín 2013, 66, 7129–7140.
- Campbell, I.; Campbell, H. A pyruvate dehydrogenase complex disorder hypothesis for bipolar disorder. Medical Hypotheses 2019, 130, 109263. [CrossRef]
- Kocharin, K.; Chen, Y.; Siewers, V.; Nielsen, J. Engineering of acetyl-CoA metabolism for the improved production of polyhydroxybutyrate in Saccharomyces cerevisiae. AMB Express 2012, 2, 1–11. [CrossRef]
- Chavan, S.; Yadav, B.; Tyagi, R.D.; Drogui, P. A review on production of polyhydroxyalkanoate (PHA) biopolyesters by thermophilic microbes using waste feedstocks. Bioresource Technology 2021, 341, 125900. [CrossRef]
- Tan, G.Y.A.; Chen, C.L.; Li, L.; Ge, L.; Wang, L.; Razaad, I.M.N.; Li, Y.; Zhao, L.; Mo, Y.; Wang, J.Y. Start a Research on Biopolymer Polyhydroxyalkanoate (PHA): A Review. Polymers 2014, Vol. 6, Pages 706-754 2014, 6, 706–754. [CrossRef]
- Amador, K.R.; Óscar Rojas Carrillo.; Aguilar, P.A.; Vega-Baudrit, J. OBTENCIÓN DE XILOSA A PARTIR DE DESECHOS LIGNOCELULÓSICOS DE LA PRODUCCIÓN Y PROCESO INDUSTRIAL DE LA PIÑA (Ananascomusus). Uniciencia 2012, 26, 75–89. En este estudio, se aplicó la metodología propuesta por Ramírez (2012) para el pretratamiento de las cáscaras de piña.
- Egúsquiza, A.D. Obtención de jarabes glucosados a partir de cáscaras de Ananas comosus (Piña) mediante hidrólisis enzimática de Celulasas. Ciencia y Tecnología 2016, 21, 36–42.
- Montañez, L.J.B. Cuantificación de azúcares reductores del sustrato en residuos de piña con el método del ácido 3,5-dinitrosalicílico. Revista de Investigación 2020, 13, 57–66. [CrossRef]
- Yüksekdaǧ, Z.N.; Aslim, B.; Beyatli, Y.; Mercan, N. Effect of carbon and nitrogen sources and incubation times on poly-beta-hydroxybutyrate (PHB) synthesis by Bacillus subtilis 25 and Bacillus megaterium 12. African Journal of Biotechnology 2004, 3, 63–66. [CrossRef]
- Farfán, A.F.R. Extracción, purificación y modificación de un biopolímero del tipo poli (3-hidroxibutirato) obtenido de la fermentación de ácidos grasos con B. cepacia. Master’s thesis, Universidad Nacional de Colombia - Sede Bogotá, 2019.
- Óscar Julián Sánchez Toro.; Buriticá, M.C.O.; Garcés, A.L.B. Obtención de ácido cítrico a partir de suero de leche por fermentación con Aspergillus spp. Revista Colombiana de Biotecnología, ISSN 0123-3475, ISSN-e 1909-8758, Vol. 6, Nº. 1, 2004, págs. 43-54 2004, 6, 43–54.
- 2018.
- Aryal, S. Normas McFarland: Principio, preparación, usos, limitaciones, 2021.
- Campuzano, C.A. Análisis de la producción de Polihidroxibutirato usando lactosuero como materia prima. Master’s thesis, Universidad NAcional de Colombia, 2015.
- Reyes, D.A.M. Modelamiento matemático y optimización del proceso de producción de polihidroxialcanoatos empleando la bacteria Burkholderia cepacia B27 a partir de ácidos grasos. Master’s thesis, Universidad Nacional de Colombia, 2016.
- Quines, L.K.; Schmidt, M.; Zanfonato, K.; Schmidell, W.; Aragão, G.M. Métodos de extração de poli-hidroxialcanoatos a partir de biomassa bacteriana. Quimica Nova 2015, 38, 1207–1218. [CrossRef]
- del Mar López-Fernández, M.; Franco-Mariscal, A.J. Indagación sobre la degradación de plásticos con estudiantes de secundaria. Educación Química 2021, 32, 21–36. [CrossRef]
- Castrejón, L.J. Elaboración de galletas con un edulcorante natural stevia (Stevia rabaudiana Bertoni) enriquecida con harina de cáscara deshidratada de piña (Ananas comusus). Universidad Nacional de Cajamarca 2019.
- Kosseva, M.R.; Rusbandi, E. Trends in the biomanufacture of polyhydroxyalkanoates with focus on downstream processing. International Journal of Biological Macromolecules 2018, 107, 762–778. [CrossRef]
- de Jesús San Miguel González, G.; Huerta, M.E.A.; Sánchez, G.B.R.; Díaz, D.P.N. Bacillus: Una bacteria versátil, multifuncional y ampliamente aplicada. Biología y Sociedad 2024, 7, 73–81. [CrossRef]
- Philip, S.; Sengupta, S.; Keshavarz, T.; Roy, I. Effect of impeller speed and pH on the production of poly(3- hydroxybutyrate) using Bacillus cereus SPV. Biomacromolecules 2009, 10, 691–699. [CrossRef]
Figure 1.
Synthesis of poly-3-hydroxybutyrate (P3HB). Source:
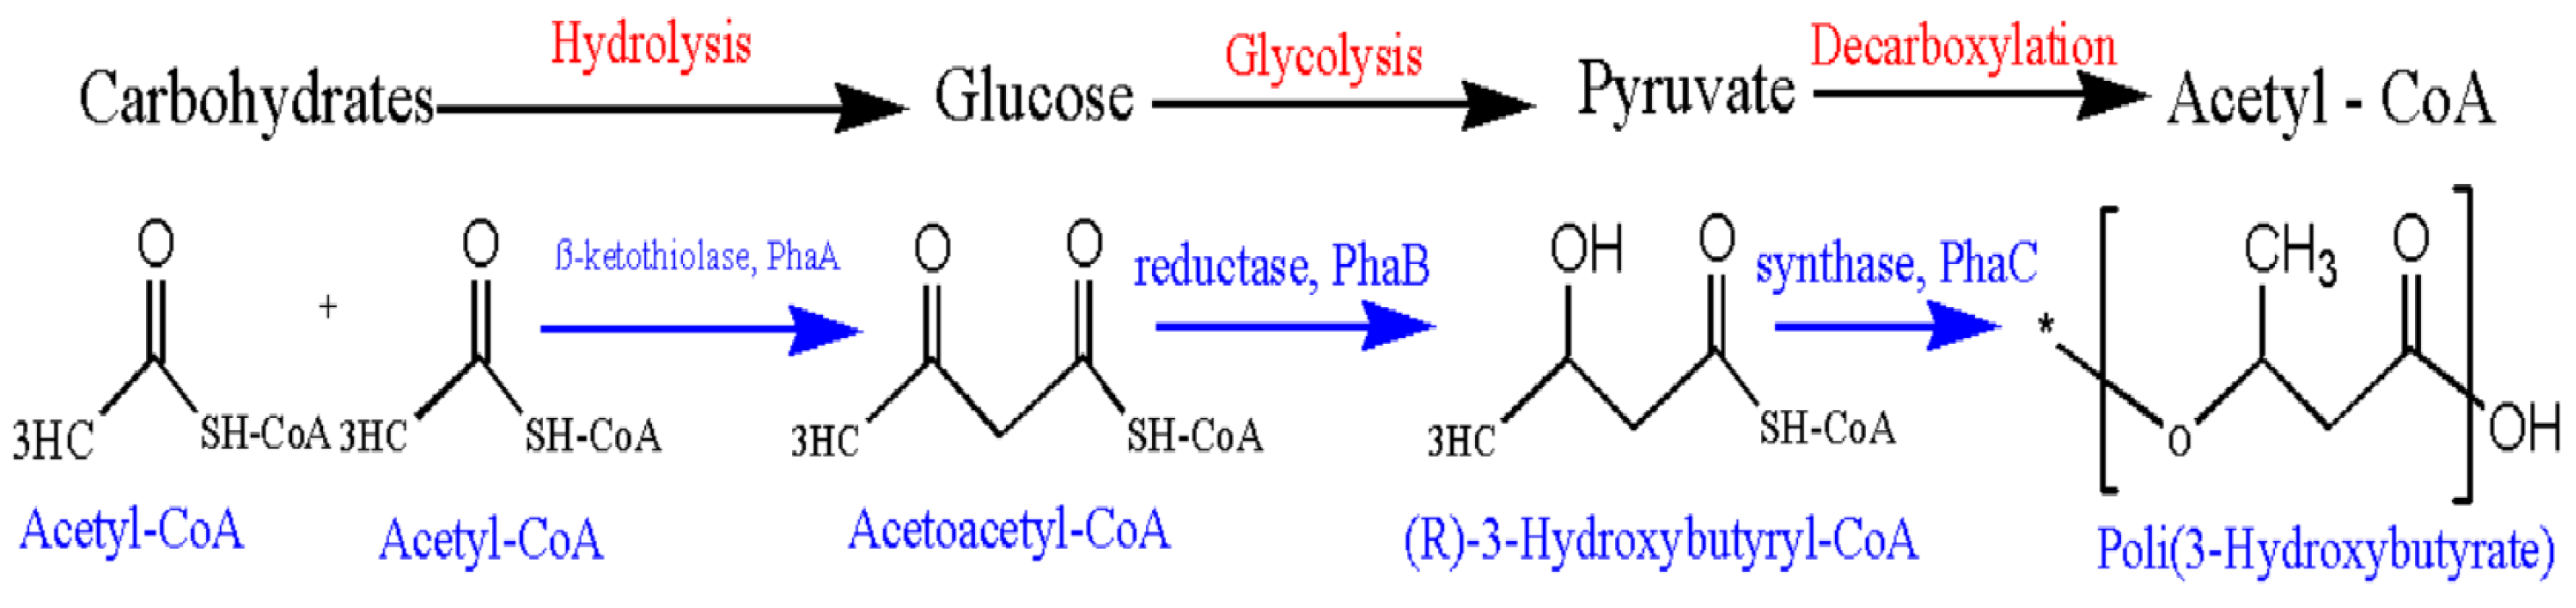
Figure 2.
Application of SDS to wet biomass. Source: The authors.
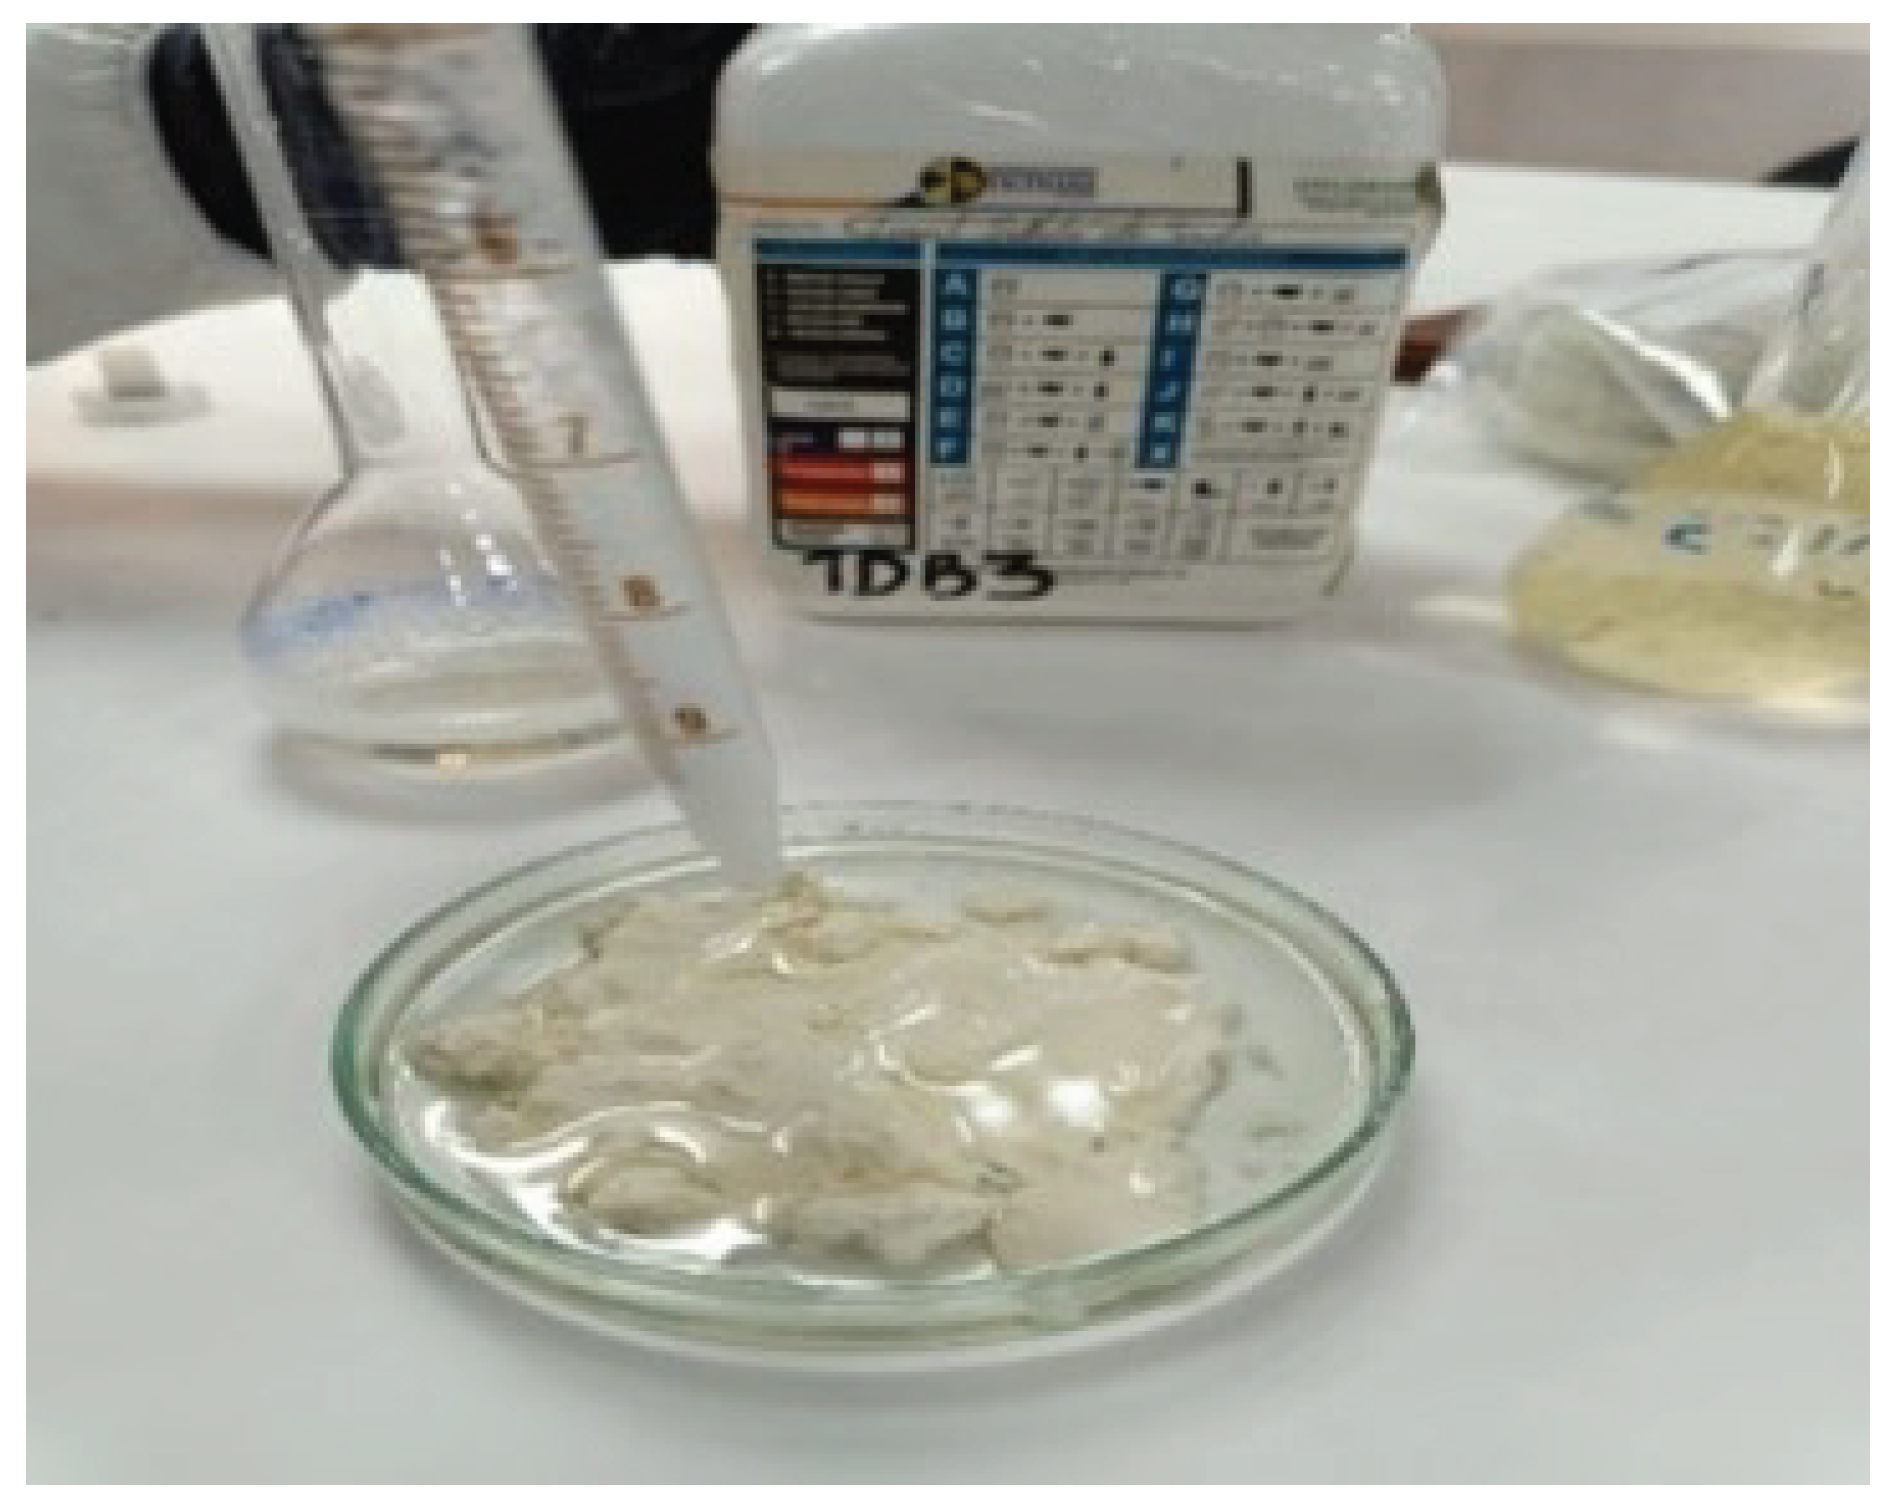
Figure 3.
Pineapple peel hydrolysis treatment. Source: The authors.
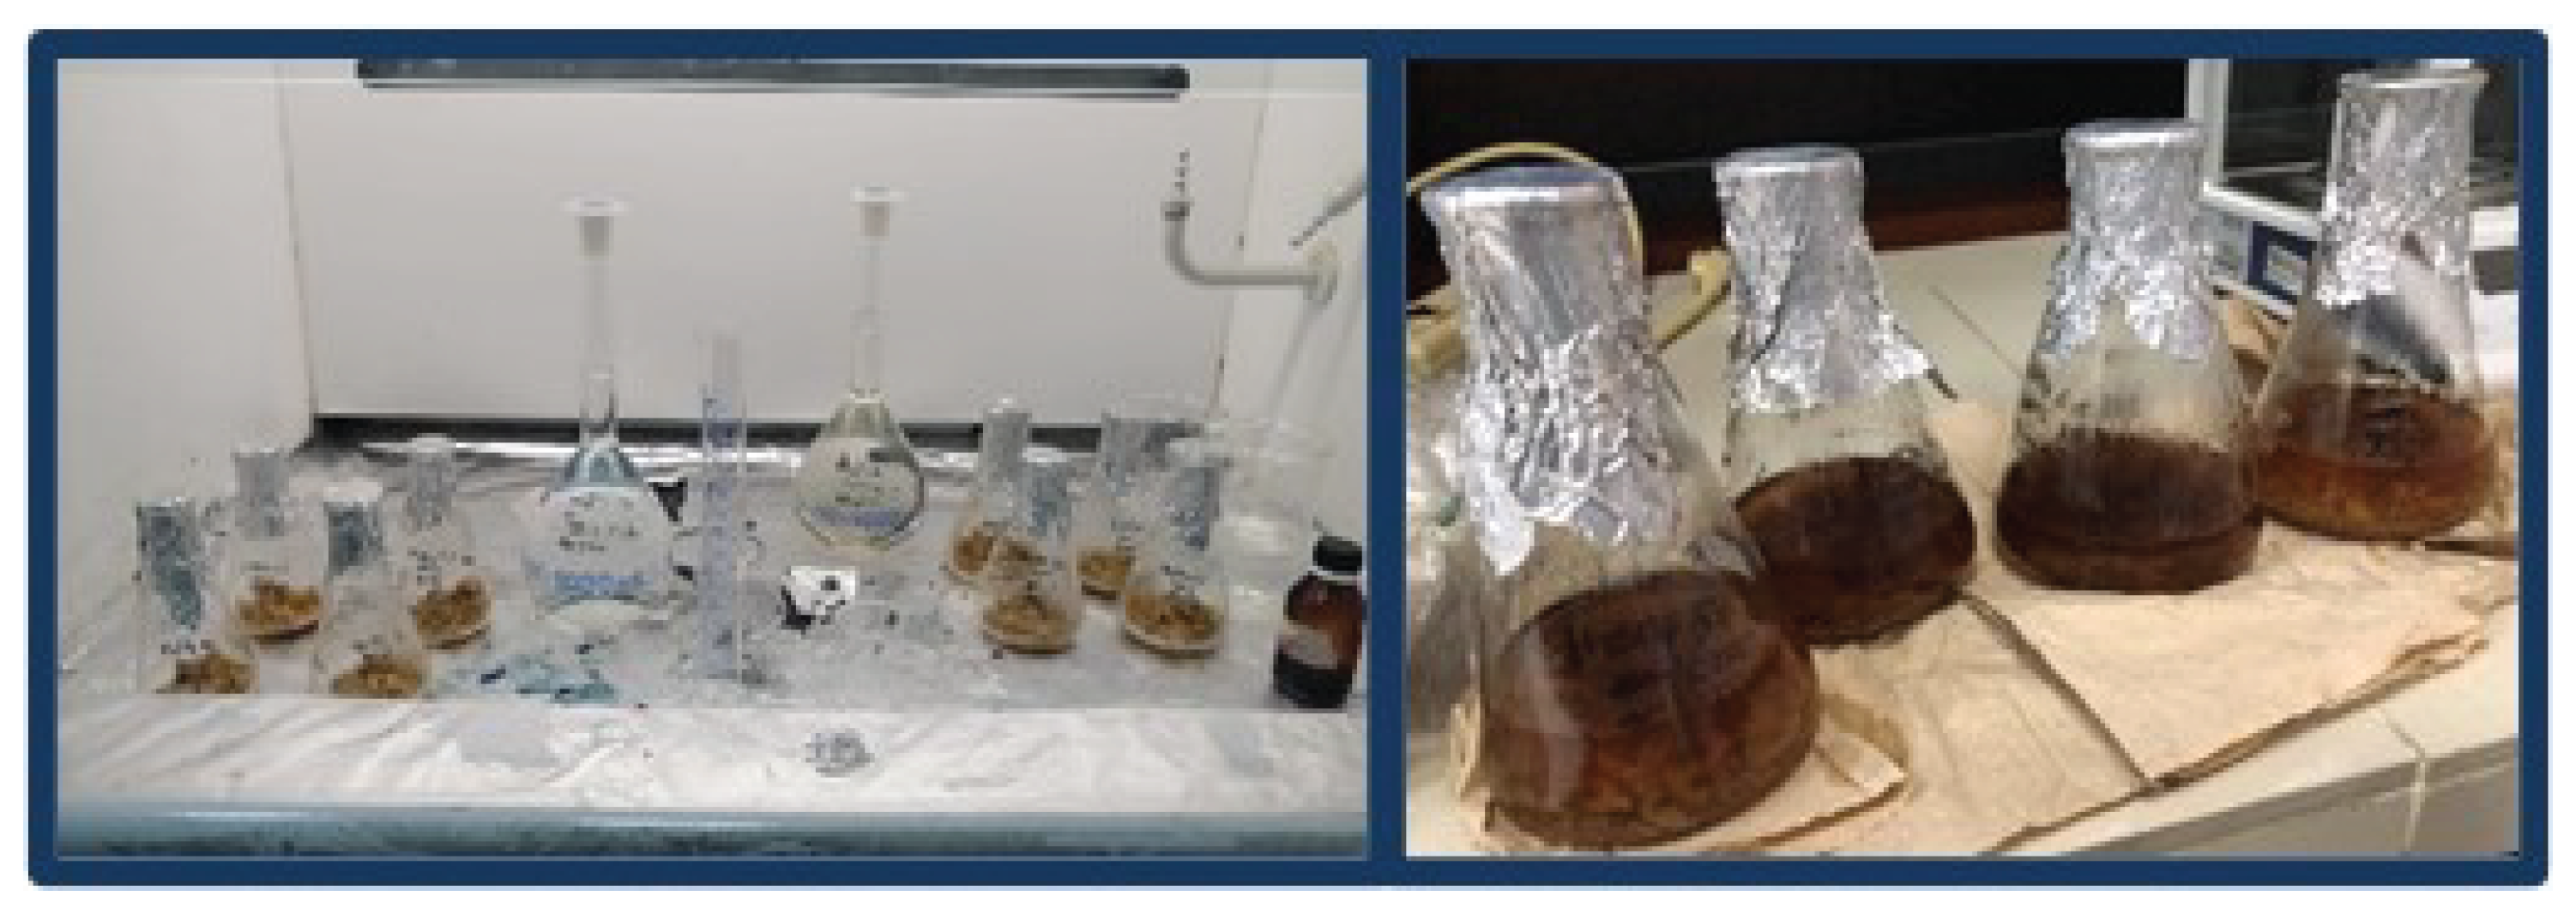
Figure 4.
Response surface plot at 118.15°C. Source: The authors.
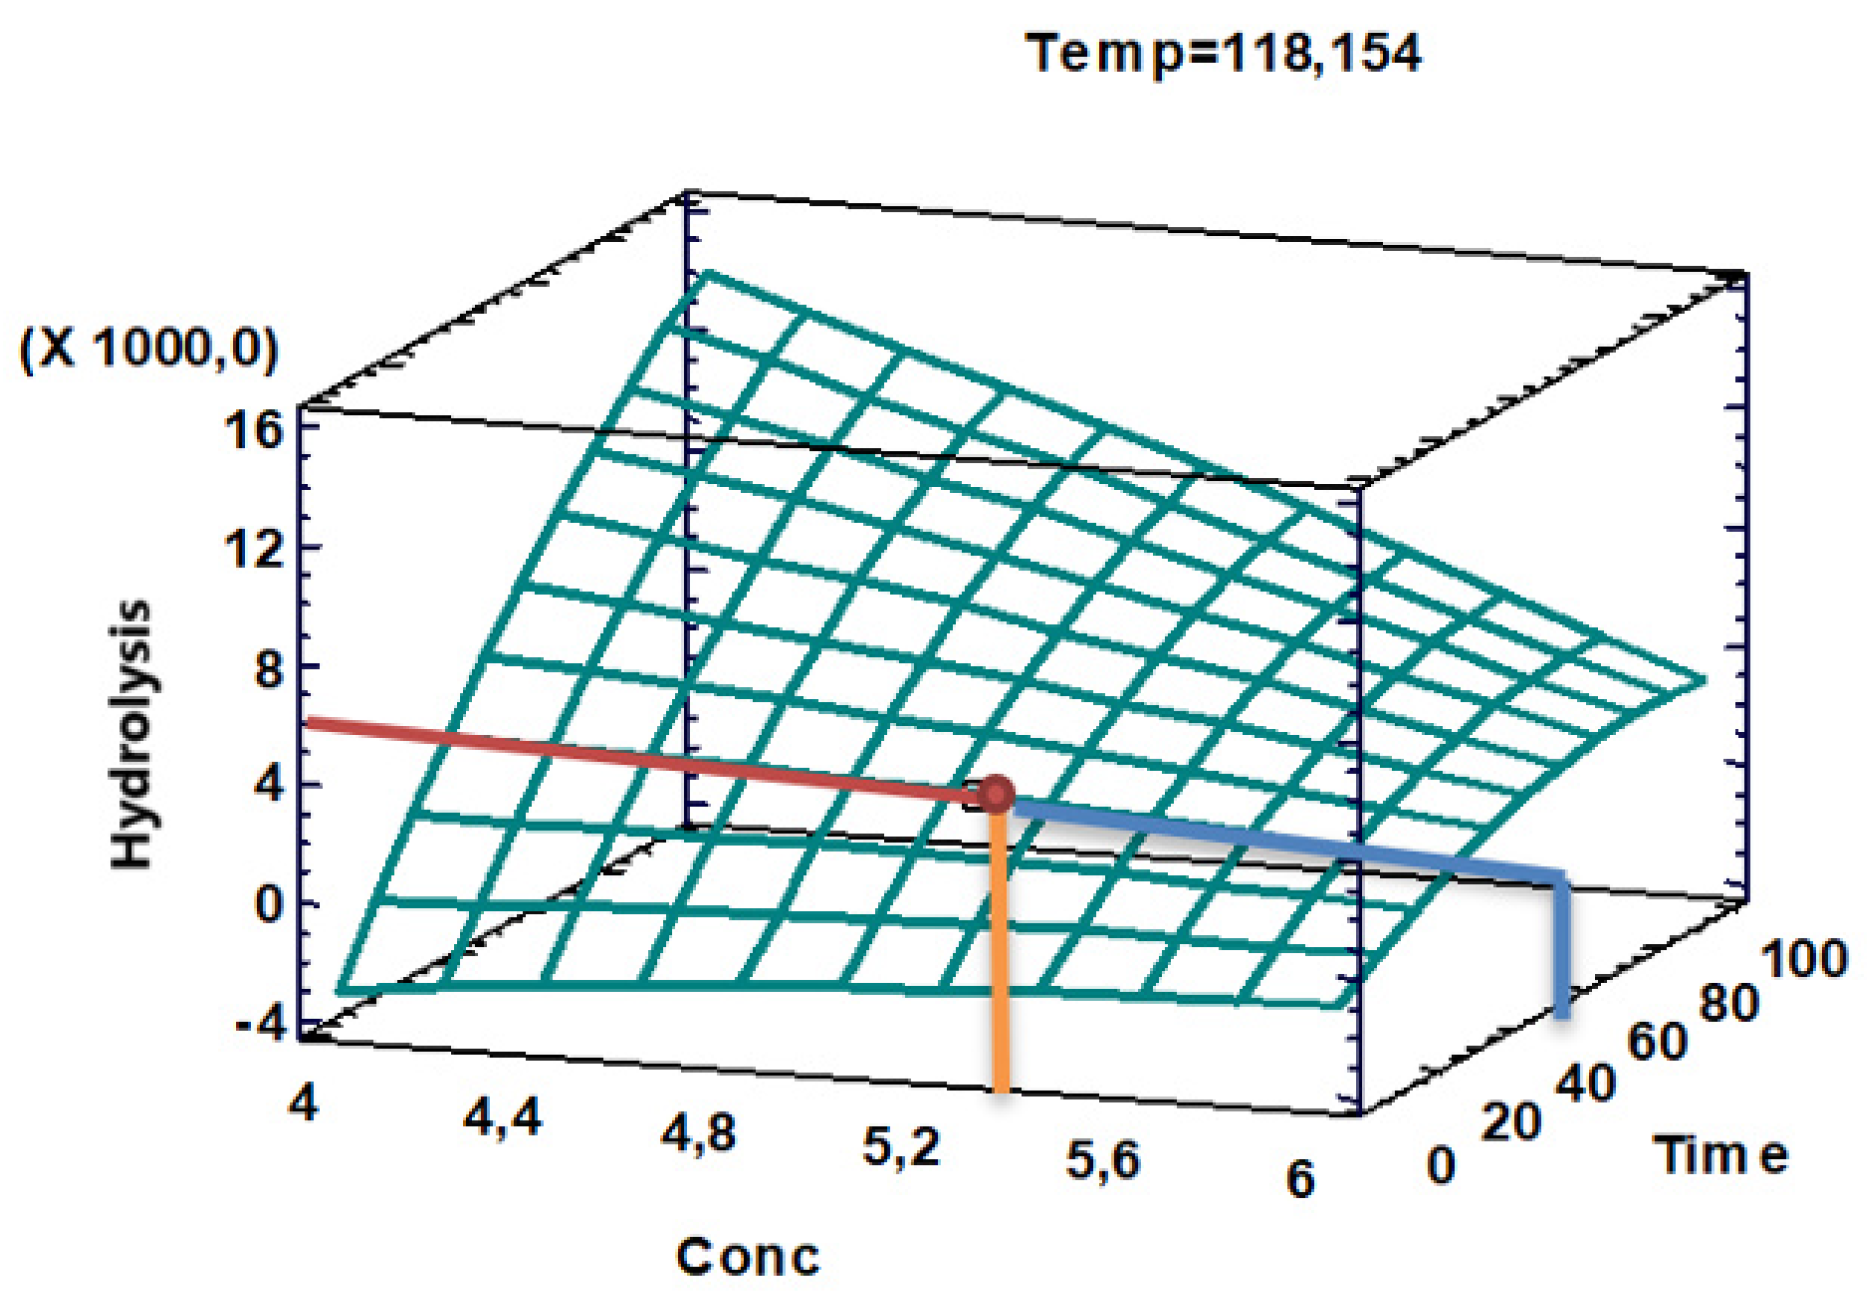
Figure 5.
Response surface graph at 118.01 °C. Source: The authors.
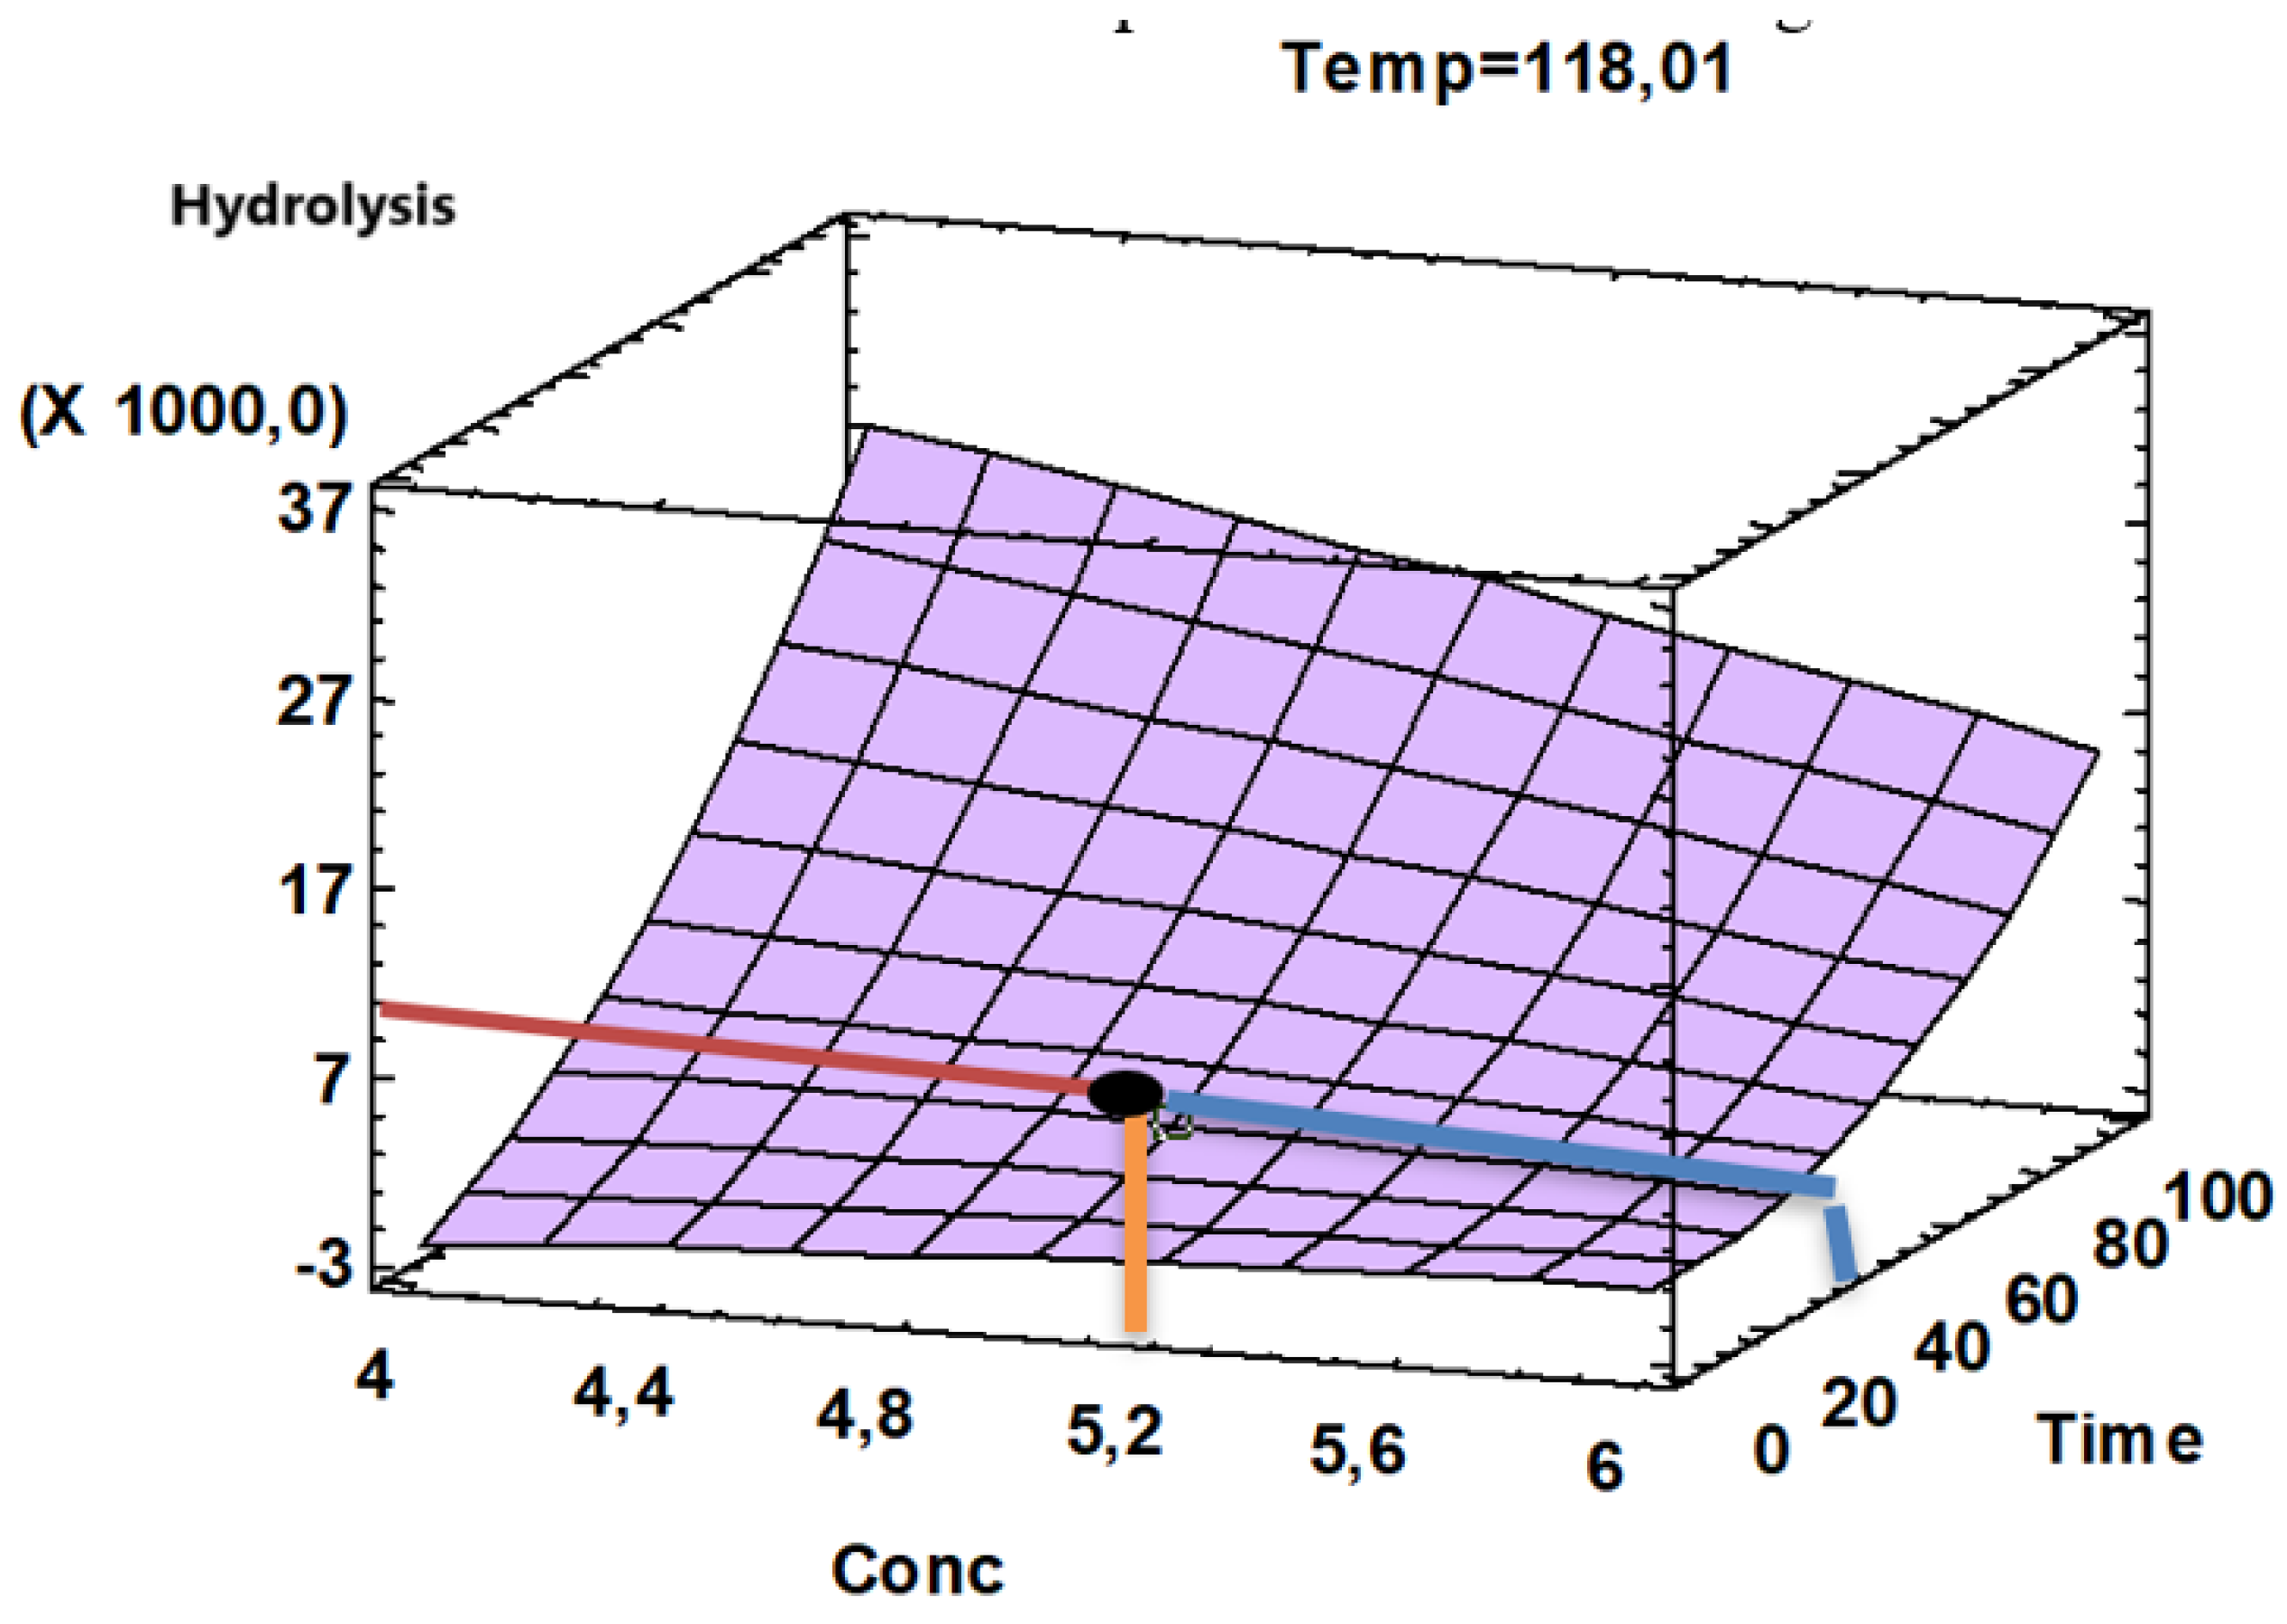
Figure 6.
Shapiro-Wilk normality test. Source: The authors.
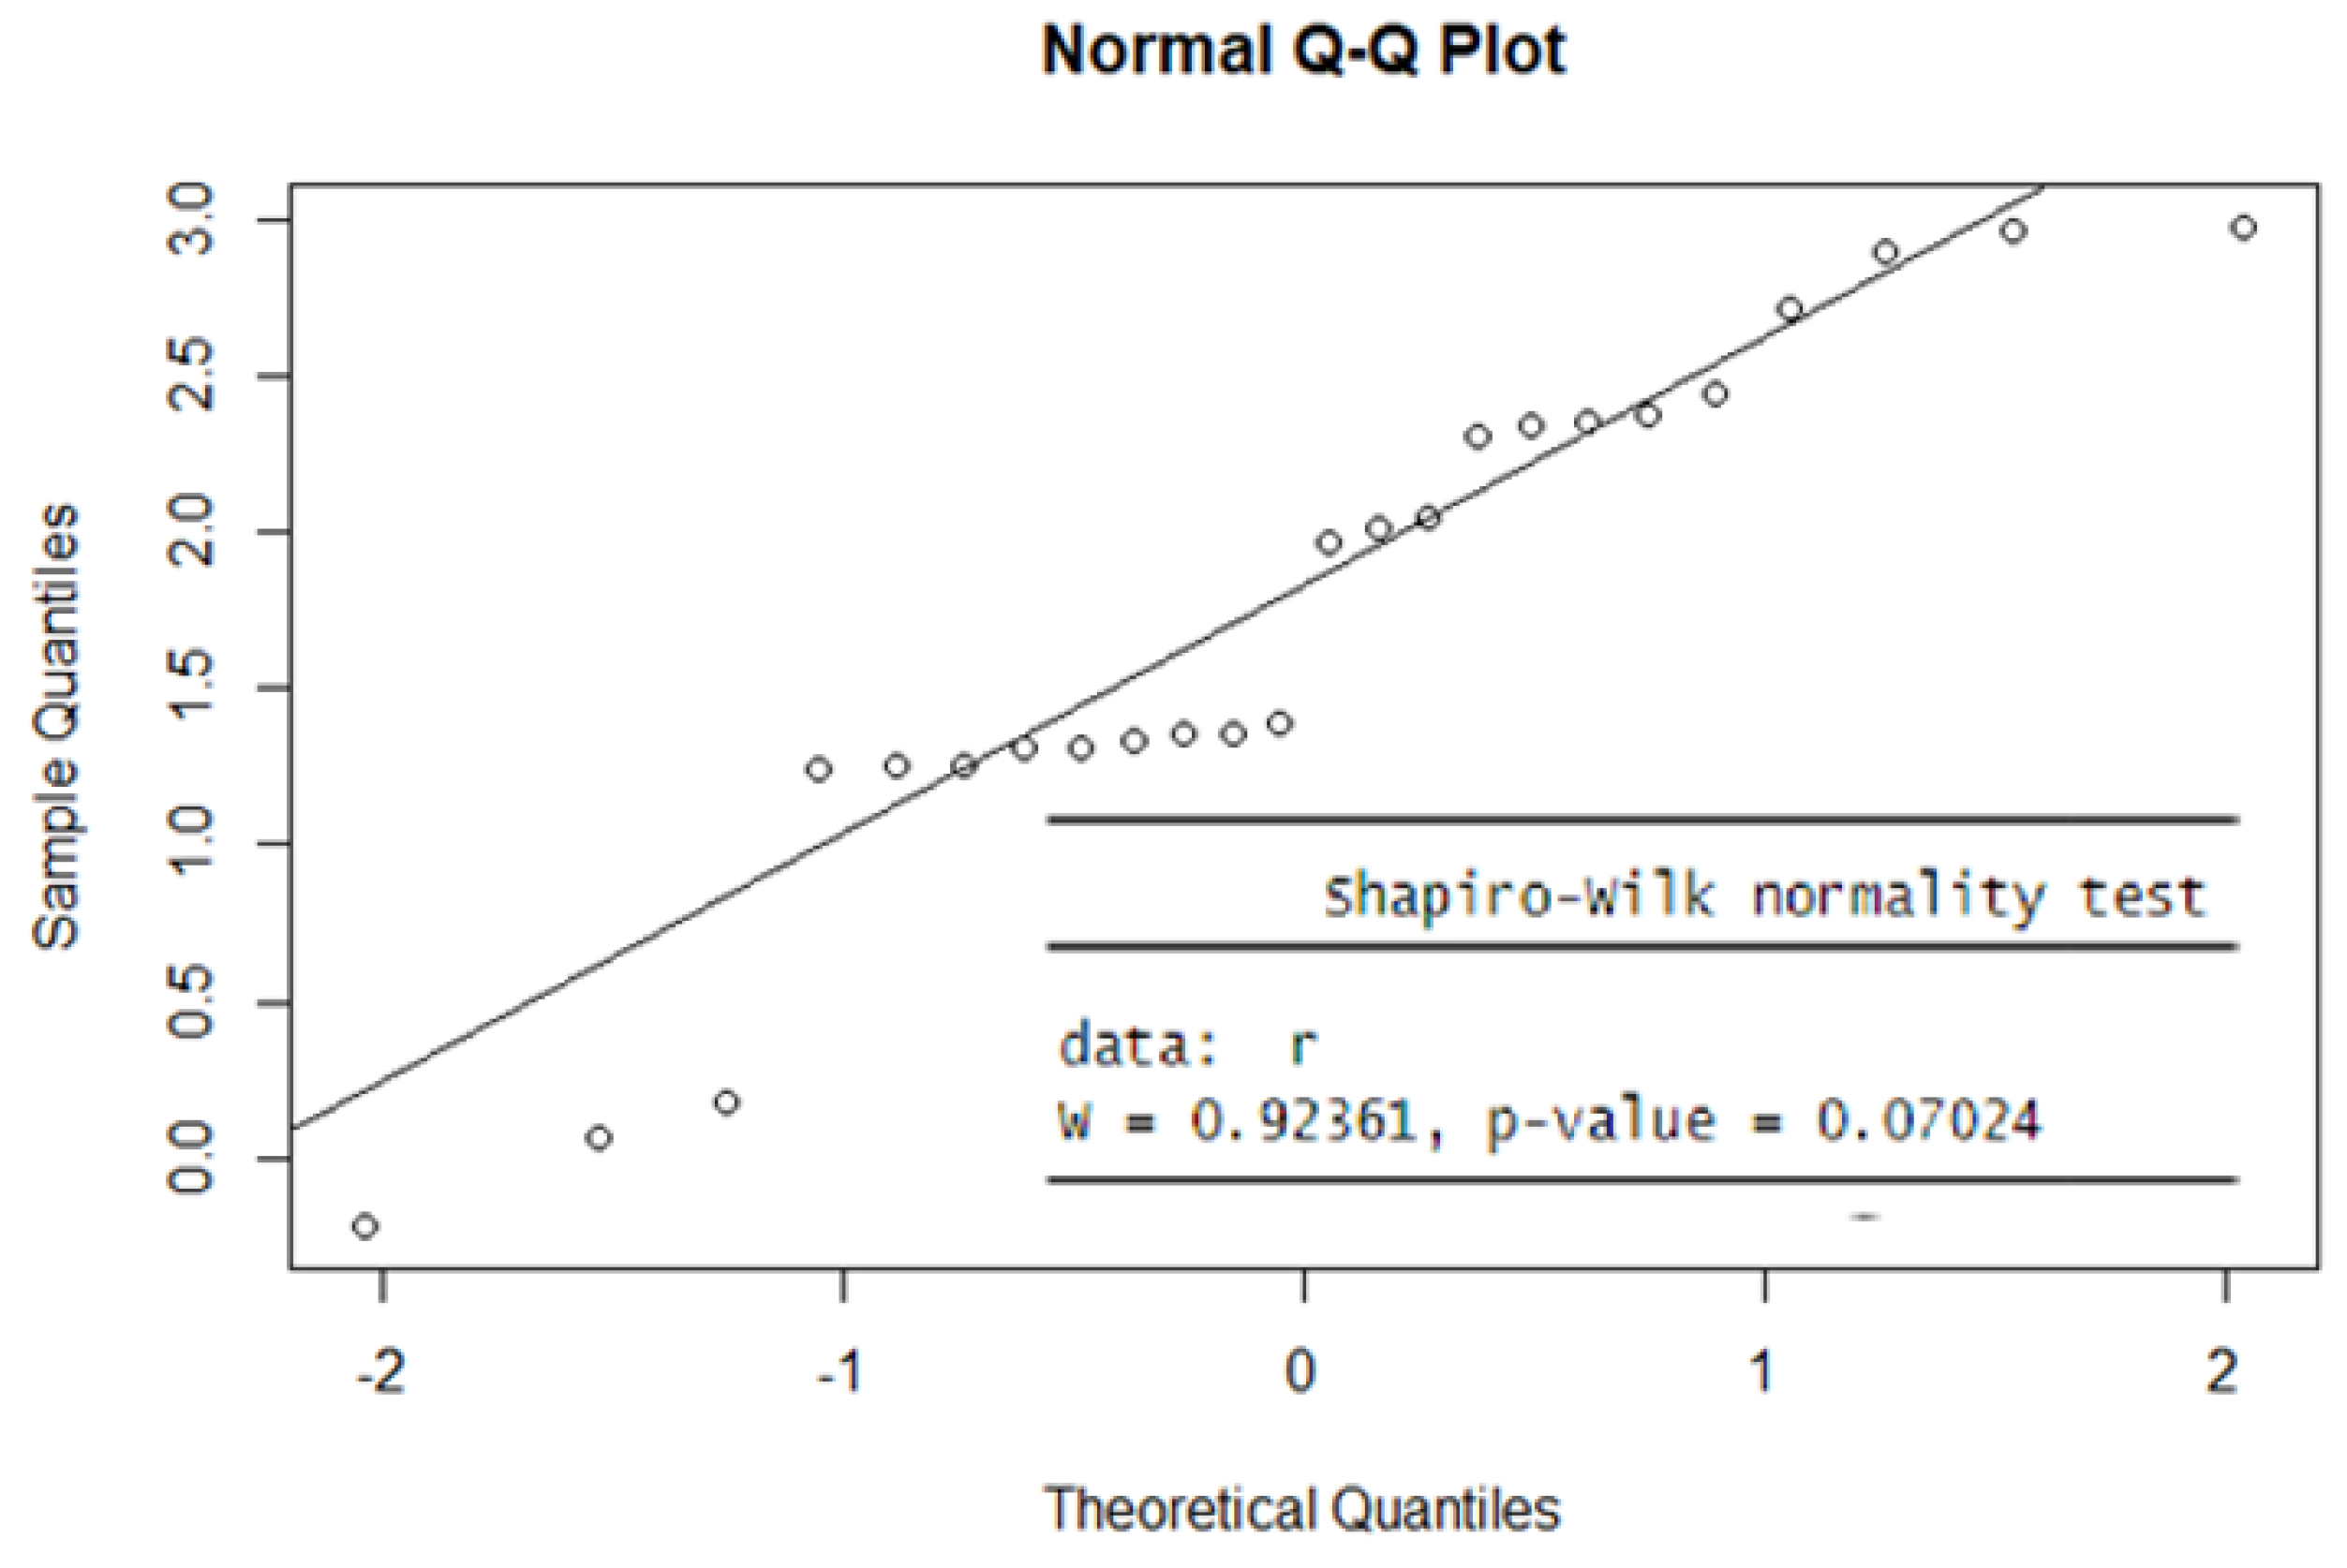
Figure 7.
FTIR spectrum of PHB. Source: The authors.
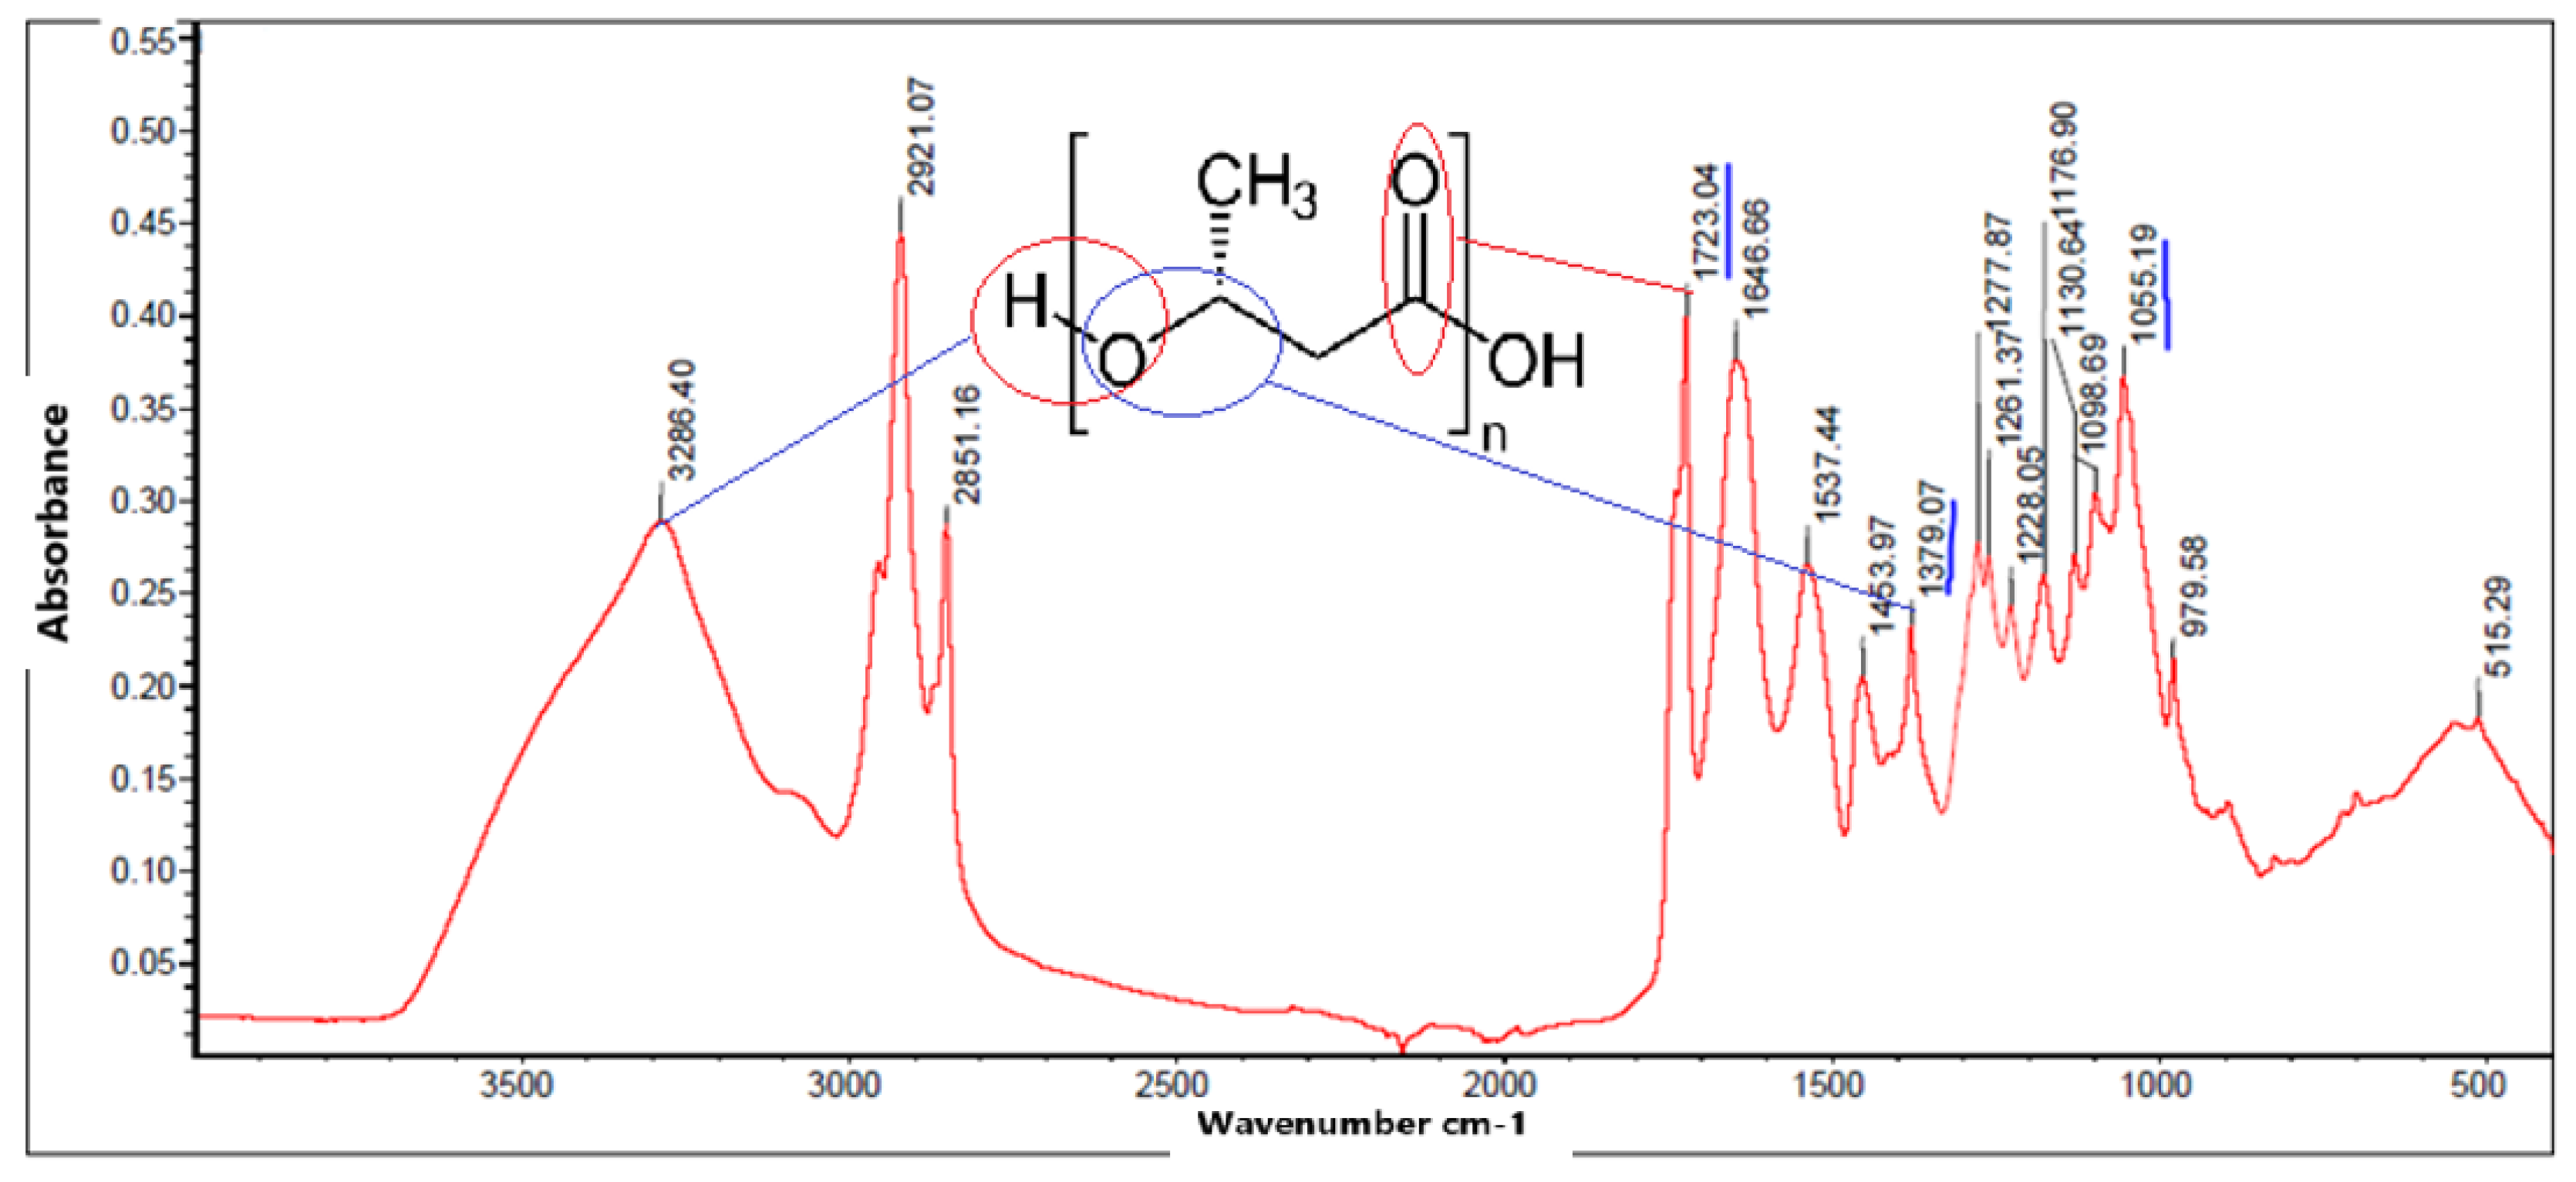
Figure 8.
Box-plots of statistical analysis of reducing sugars.
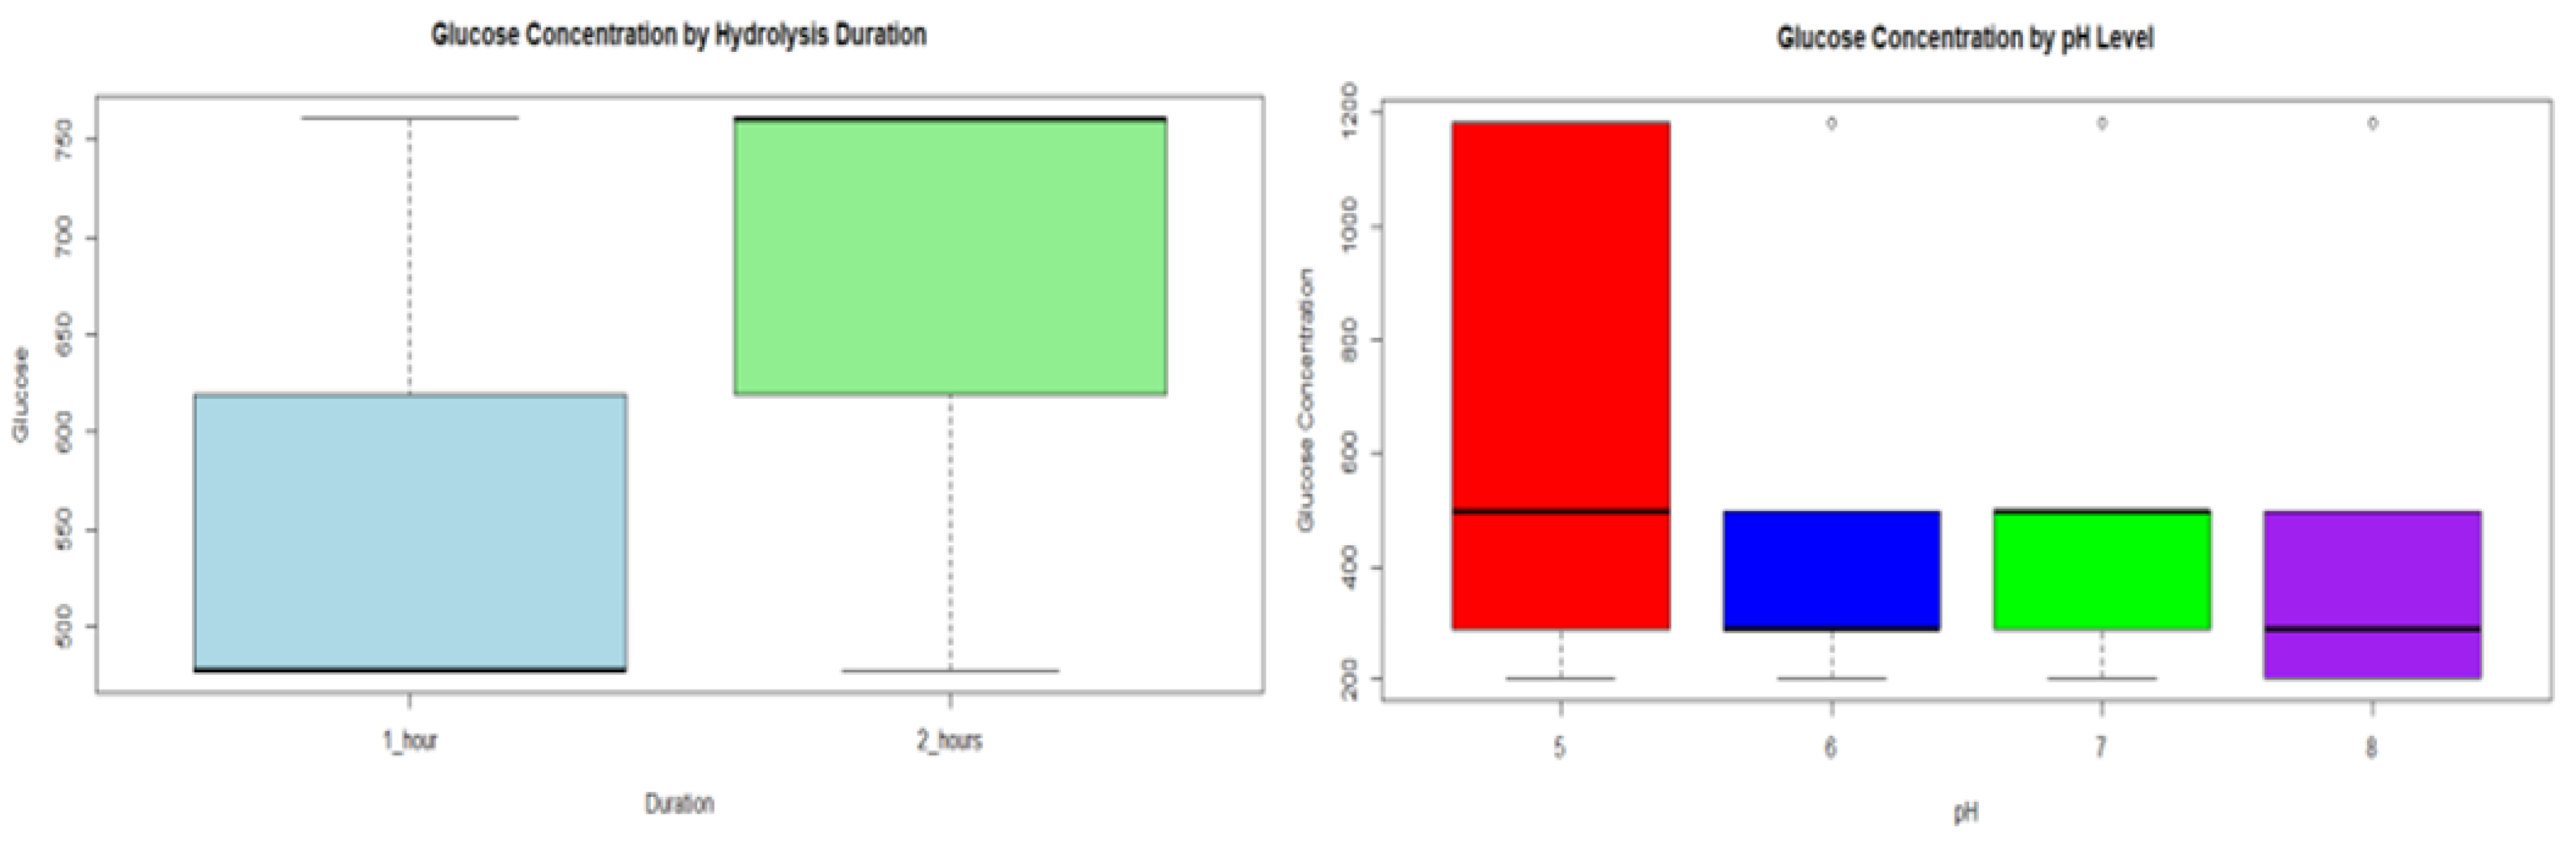
Figure 9.
Morphology of the bacterium Bacillus subtilis.
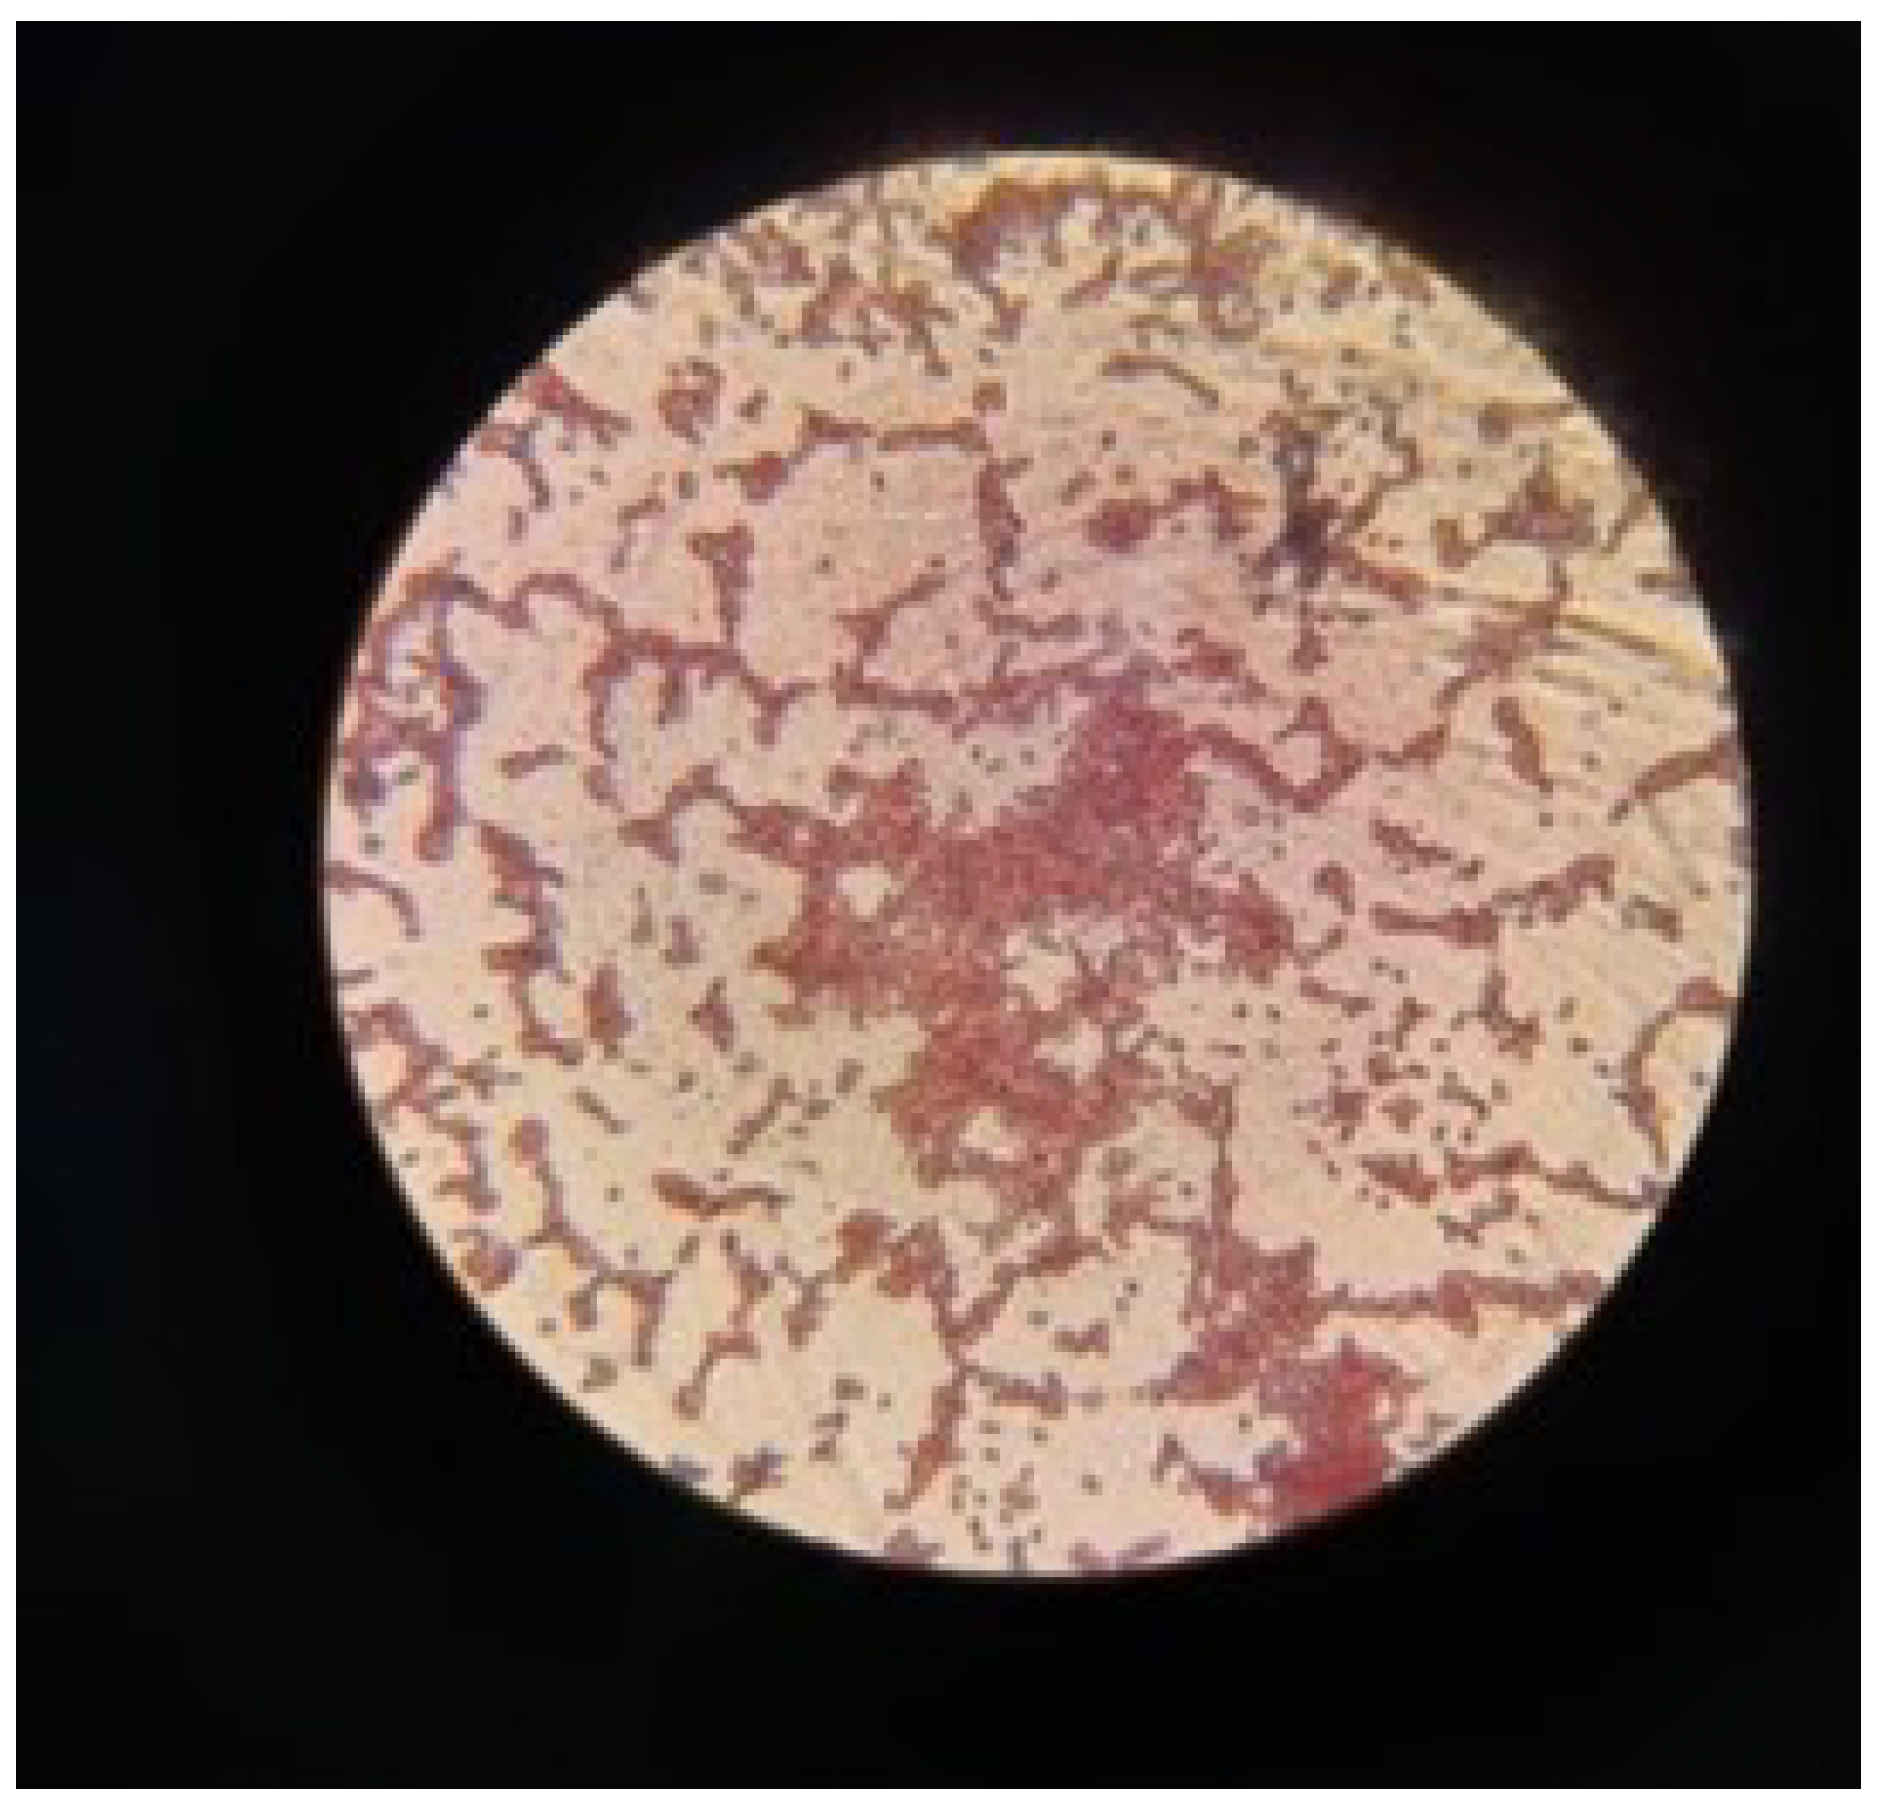
Figure 10.
IR spectrum of the biomass obtained.
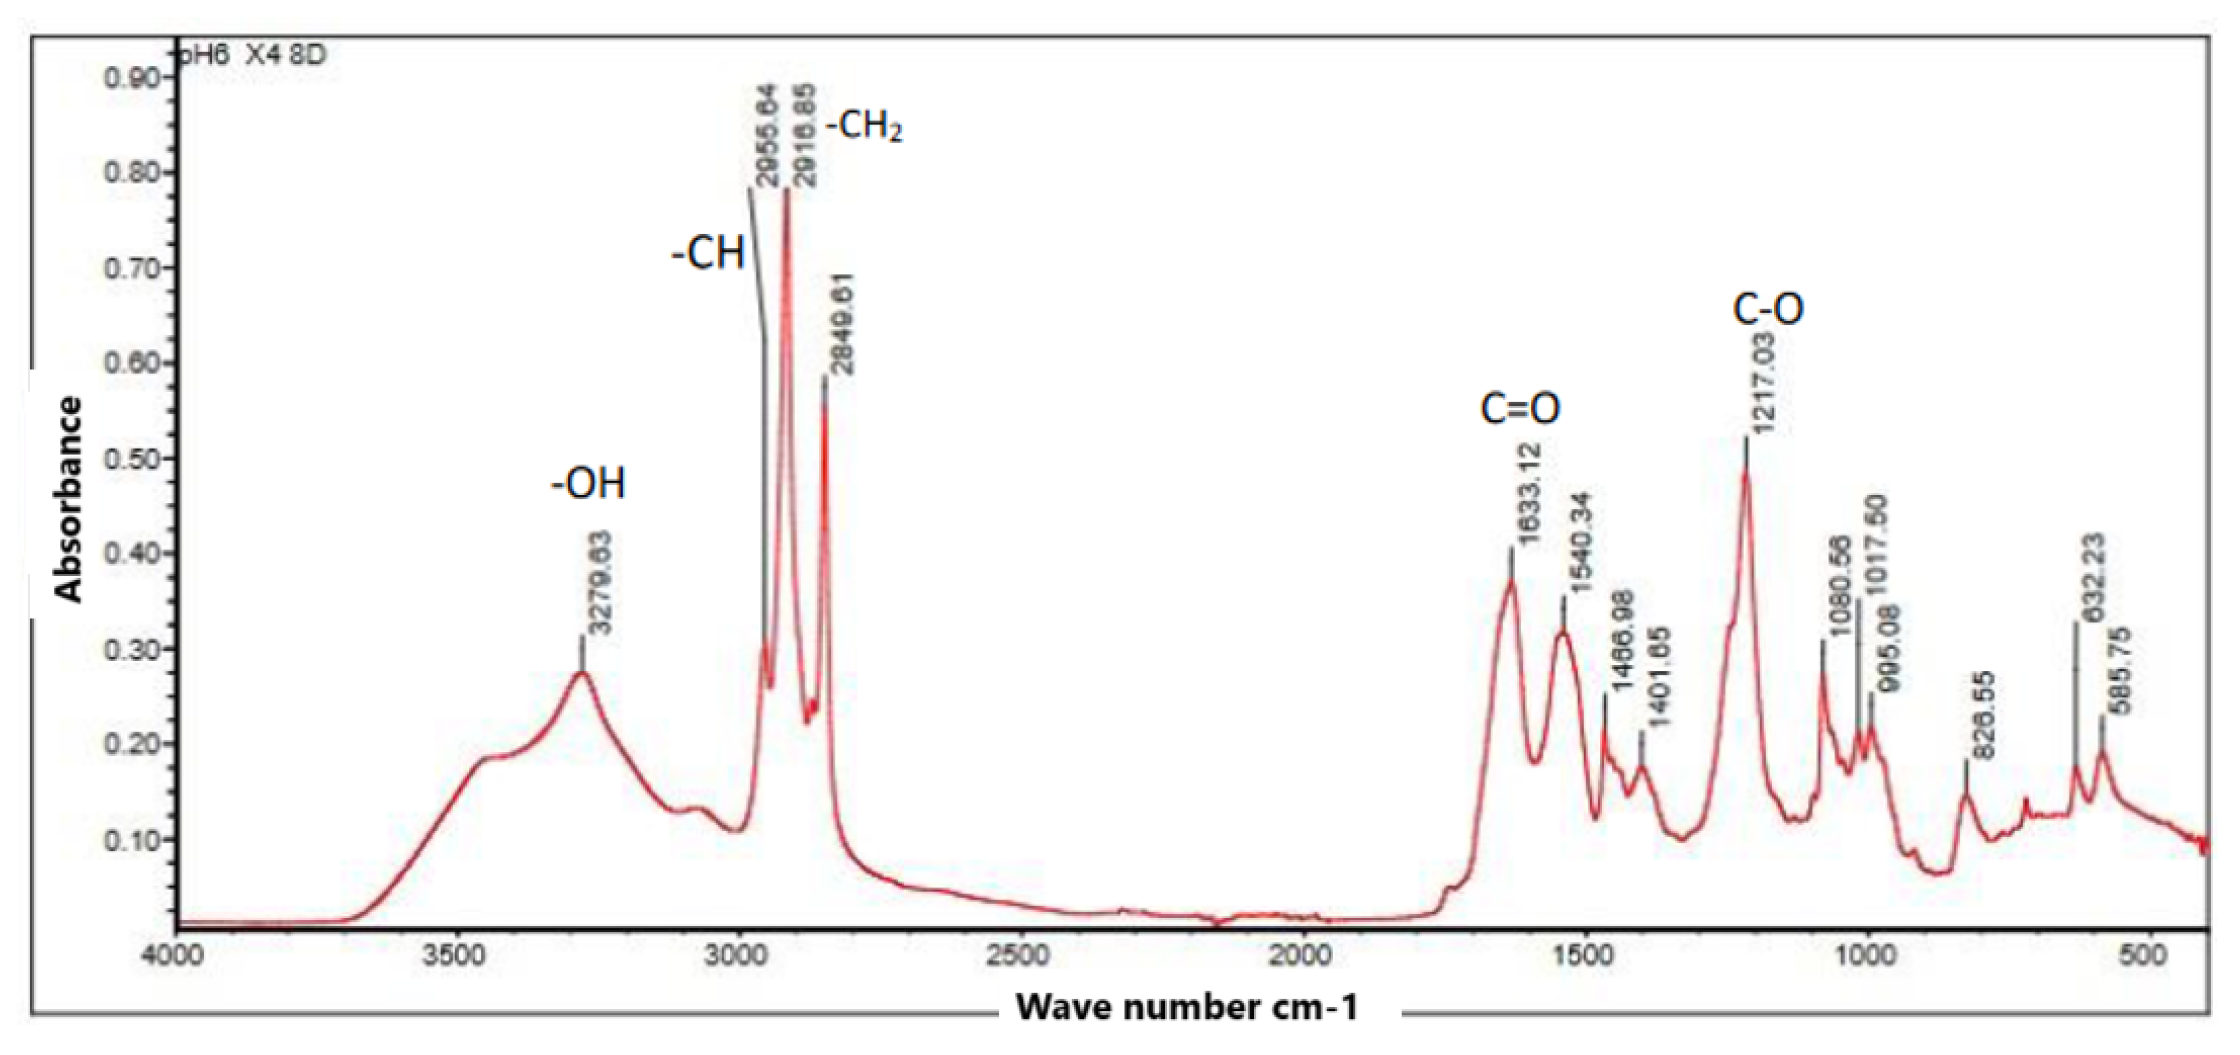
Figure 11.
FTIR spectrum of the plastic poly(3hydroxybutyrate).
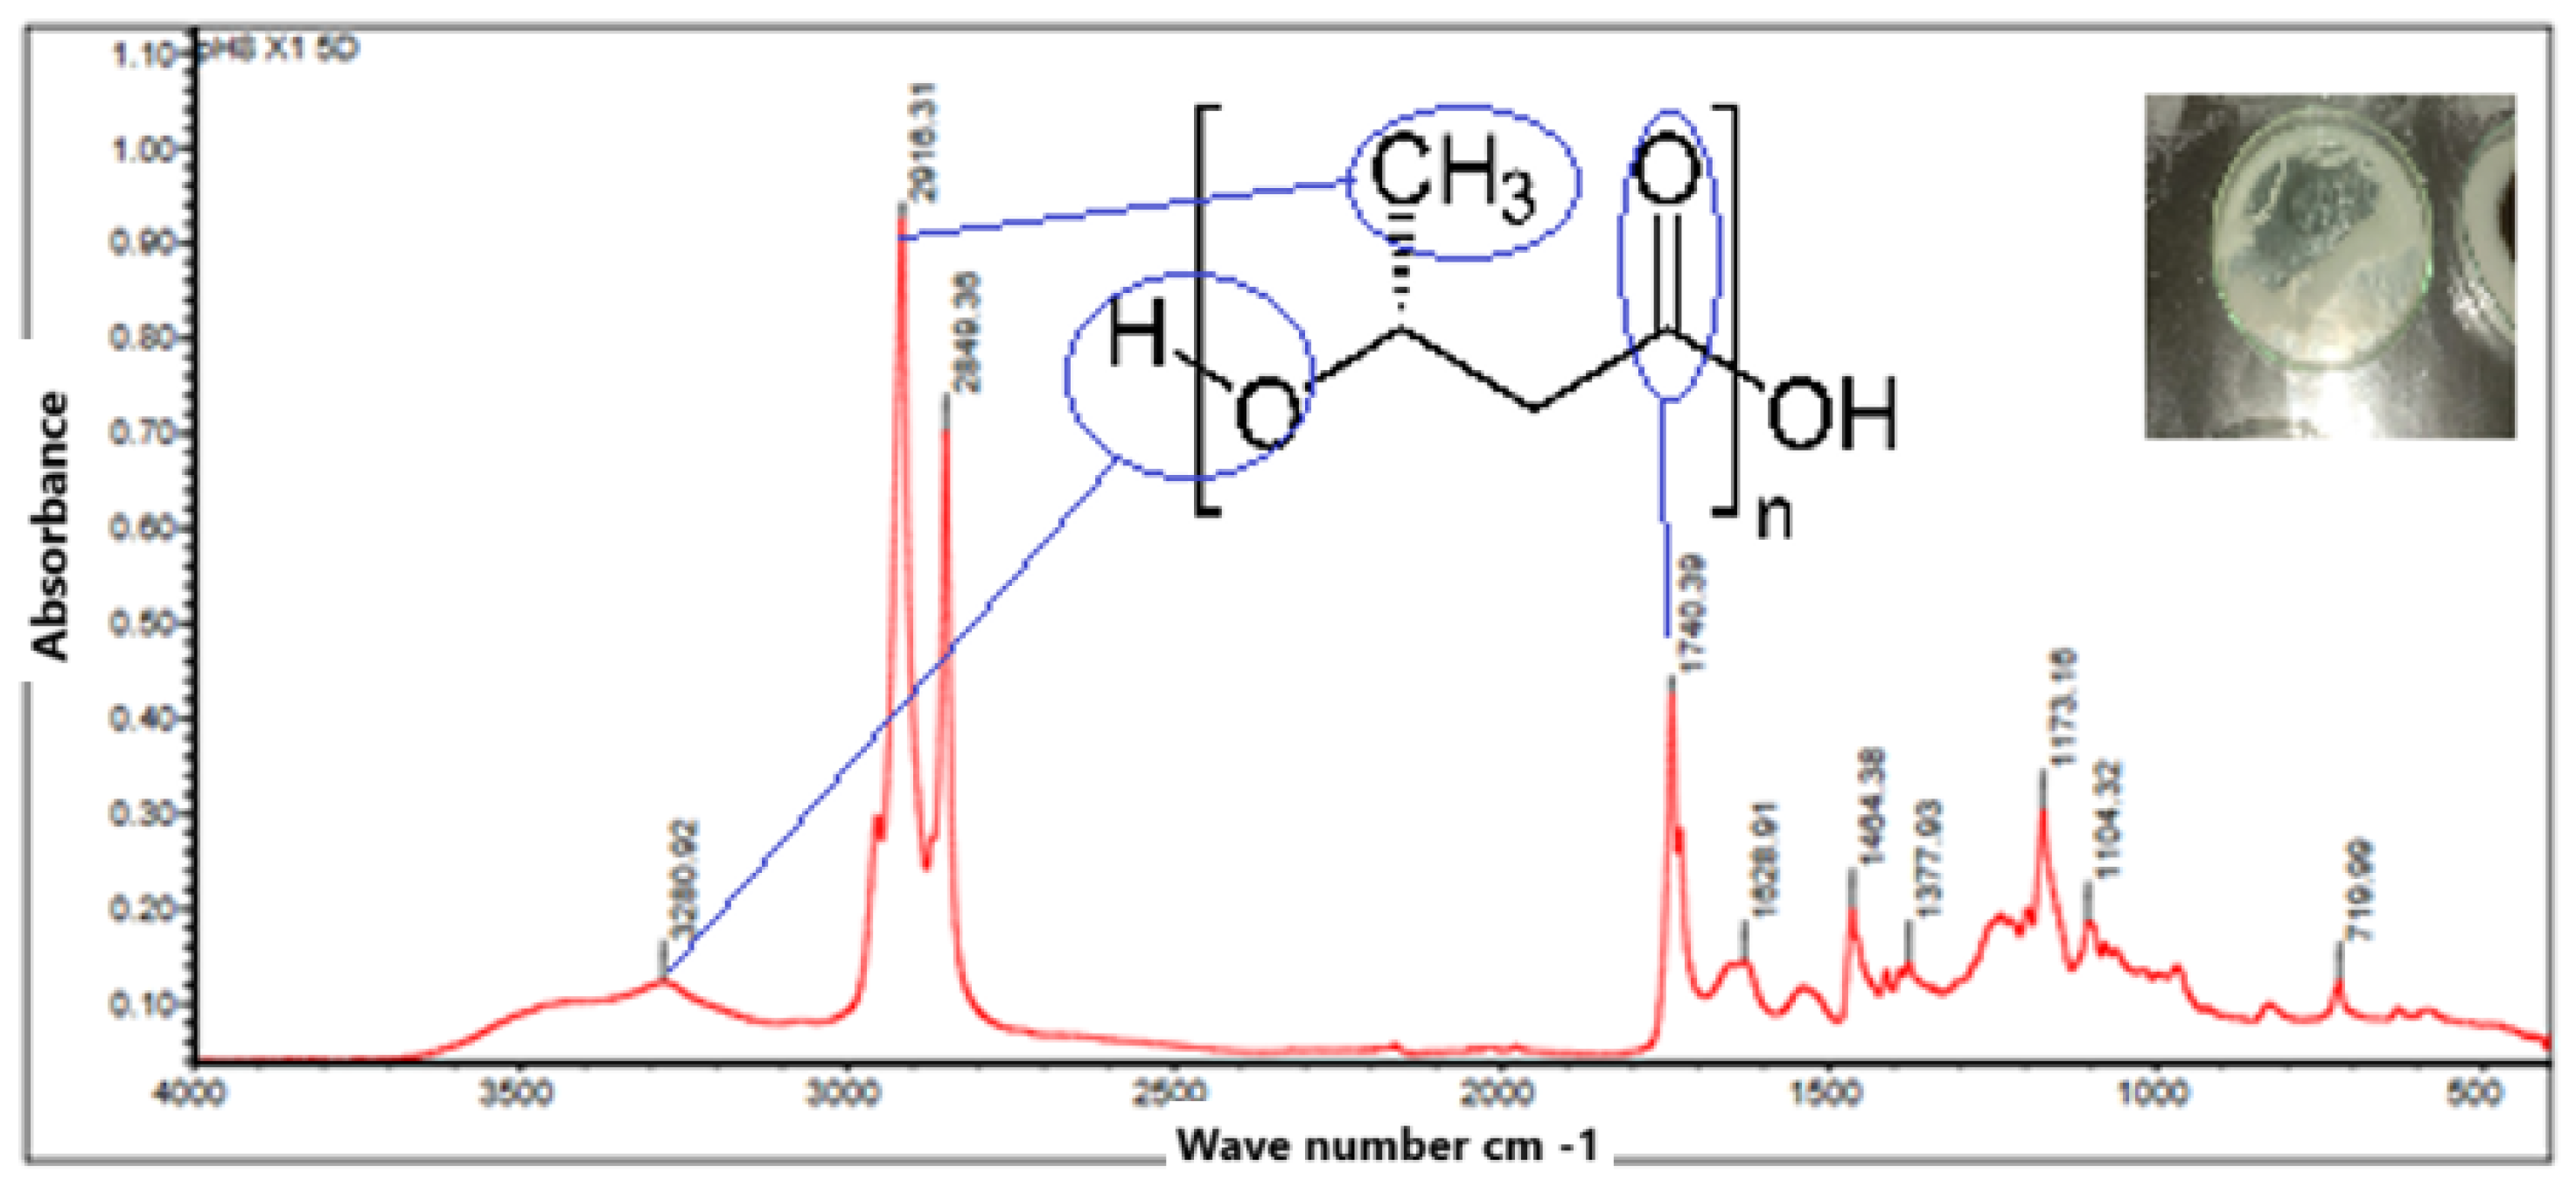
Table 1.
Fermentation treatments.
| Treatment | pH | Temperature °C | Medium |
|---|---|---|---|
| T1 | 6.20 | 37 | M3 |
| T2 | 6.20 | 37 | M2 |
| T3 | 6.20 | 37 | M1 |
| T4 | 5.67 | 35.8 | M1 |
| T5 | 5.67 | 35.8 | M2 |
| T6 | 7.77 | 36.7 | M3 |
| T7 | 7.77 | 36.7 | M2 |
| T8 | 7.77 | 36.7 | M1 |
Table 2.
Bacteria count.
| McFarlan standard | Absorbance (600 nm) | Bacterial suspension /mL |
| 0.5 | 0.08-01 | 1,5x10⁸ |
| 1.0 | 0.18-0.2 | 3,0x10⁸ |
| 2.0 | 0.36-0.4 | 6,0x10⁸ |
| 3.0 | 0.54-0.6 | 9,0x10⁸ |
Table 3.
Proximal chemical analysis of sugarcane.
| Pineapple | % Moisture | % Total ash | % Total fat |
| Sample 1 | 3.17 | 4.45 | 3 |
| Sample 2 | 2.3 | 4.92 | 2 |
| Sample 3 | 2.1 | 5.94 | 2 |
| Average | 2.52 | 5.10 | 2.33 |
Table 4.
Results of quantification of reducing sugars.
| Conc (%) S | Time (min) | Temperature °C | Glucose (mg) | Fructose (mg) |
| 6 | 15 | 121 | 700,86 | 762,33 |
| 5 | 30 | 118 | 5125,81 | 5035,24 |
| 6 | 83 | 98 | 1097,87 | 1742,49 |
| 4 | 20 | 115 | 513,68 | 442,34 |
| 4 | 10 | 121 | 428,21 | 343,985 |
| 6 | 30 | 121 | 621,509 | 967,964 |
| 5 | 80 | 100 | 268,13 | 399,78 |
| 6 | 20 | 115 | 774,86 | 1189,54 |
| 5 | 25 | 121 | 887,26 | 1023,95 |
| 4 | 83 | 98 | 312,25 | 338,907 |
| 6 | 25 | 115 | 697,991 | 813,303 |
| 5 | 28 | 120 | 4782,261 | 5025,272 |
| 5 | 15 | 121 | 682,664 | 550,971 |
| 4 | 15 | 121 | 492,16 | 295,52 |
| 5 | 80 | 98 | 713,551 | 1513,26 |
| 5 | 60 | 105 | 601 | 450,44 |
Table 5.
Treatments applied with Bacillus subtilis for PHB production.
| Medium | T1 | T2 | T3 | T4 | T5 | T6 | T7 | T8 |
| M 1 | 2,40 | 2,60 | 3,50 | 3,90 | 7,80 | 109,0 | 108,8 | 109.1 |
| M 2 | 2,60 | 3,80 | 3,80 | 3,50 | 7,50 | 109,1 | 109,0 | 108,1 |
| M 3 | 2,30 | 2,50 | 3,50 | 3,70 | 7,20 | 108,4 | 108,9 | 108,0 |
| Average | 2.43 | 2,96 | 3,6 | 3,7 | 7,5 | 108,83 | 108,9 | 108,4 |
Table 6.
Performance of Bacillus subtilis for PHB production.
| Treatment | Product formed (mg) | Substrate consumed (mg) | Yield of PHB from substrate (RPS) |
| T1 | 2,43 | 762,33 | 3.18x10⁻³ |
| T2 | 2,96 | 5035,24 | 5.878 x10⁻⁴ |
| T3 | 3,6 | 1742,49 | 2,066 x10-3 |
| T4 | 3,7 | 442,34 | 8.36 x10⁻³ |
| T5 | 7,5 | 343,985 | 0.068 |
| T6 | 108,83 | 967,964 | 0.11 |
| T7 | 108,9 | 399,78 | 0,272 |
| T8 | 108,4 | 1189,54 | 0.0911 |
Table 7.
ANOVA analysis of treatments.
| Df | Sum Sq | Mean Sq | F value | Pr(>F) | producto.t | groups | significance | |
| tratamientos | 7 | 18,123 | 2,5891 | 223,6 | 9.56e-15 | T6 | 2,950729 | a |
| Residuals | 16 | 0,185 | 0,0116 | T7 | 2,514396 | b | ||
| T8 | 2,338398 | b | ||||||
| tratamientos | *** | T5 | 2,014369 | c | ||||
| Residuals | T3 | 1,318426 | d | |||||
| — | T2 | 1,311451 | d | |||||
| Signif. | codes: | T4 | 1,307357 | d | ||||
| 0 "***" | 0,001 "**" | 0,01 "*" | 0,05 "," | 0,1 " " | 1 | T1 | 0,008946 | e |
Table 8.
Quantitative analysis of sugars in the whey.
| No | Sample | Comment | Conc (ppm) | Abs | 540 nm |
| Blanc | 0 | ||||
| 1 | 0 | 0,0568099 | 0,0568 | ||
| 2 | 200 | 0,183562 | 0,1836 | ||
| 3 | 400 | 0,314098 | 0,3141 | ||
| 4 | 600 | 0,537316 | 0,5373 | ||
| 5 | 800 | 0,505047 | 0,505 | ||
| 6 | 1000 | 0,569934 | 0,5699 | ||
| 1 | pH 5 | 100 ul - 9 ml | 1183,69 | 0,688157 | 0,6882 |
| 2 | pH 6 | 100 ul - 9 ml | 289,513 | 0,227826 | 0,2278 |
| 3 | pH 7 | 100 ul - 9 ml | 497,11 | 0,334698 | 0,3347 |
| 4 | pH 8 | 100 ul - 9 ml | 202,931 | 0,183253 | 0,1833 |
| 1 | Sample N°1 | 1,4 - 500 ul | 477,722 | 0,324717 | 0,3247 |
| 2 | Sample N°2 | 1,4 - 500 ul | 761,285 | 0,470698 | 0,4707 |
Table 10.
Calculation of dry to wet weight ratios.
| pH | Ratio 5D | Ratio 6D | Ratio 7D | Ratio 8D |
| 5 | 0.264 | 0.227 | 0.230 | 0.124 |
| 6 | 0.292 | 0.285 | 0.331 | 0.289 |
| 7 | 0.291 | 0.207 | 0.219 | 0.126 |
| 8 | 0.301 | 0.229 | 0.304 | 0.199 |
Table 11.
Percentage yields for each treatment.
| Treatment | Product formed (g) | Total biomass (g) | PHB yield | % Purification |
| pH 5 X1 5D | 3.34 | 19.83 | 0.1684 | 19.78 |
| pH6 X1 5D | 3.61 | 21.87 | 0.1650 | 16.84 |
| pH7 X1 5D | 3.54 | 21.58 | 0.1641 | 16.75 |
| pH8 X1 5D | 3.58 | 21.55 | 0.1661 | 16.94 |
| pH5 X2 6D | 2.32 | 18.42 | 0.1260 | 12.86 |
| pH6 X2 6D | 3.12 | 18.71 | 0.1667 | 17.02 |
| pH7 X2 6D | 4.10 | 18.83 | 0.2177 | 22.22 |
| pH8 X2 6D | 8.31 | 18.72 | 0.4440 | 45.31 |
| pH5 X3 7D | 2.91 | 15.15 | 0.1920 | 19.59 |
| pH6 X3 7D | 3.35 | 17.85 | 0.1877 | 19.16 |
| pH7 X3 7D | 3.37 | 16.27 | 0.2072 | 21.14 |
| pH8 X3 7D | 3.74 | 17.74 | 0.2109 | 21.52 |
| pH5 X4 8D | 3.88 | 19.74 | 0.1966 | 20.06 |
| pH6 X4 8D | 6.89 | 22.88 | 0.3011 | 30.72 |
| pH7 X4 8D | 9.83 | 18.67 | 0.5266 | 53.74 |
| pH8 X4 8D | 3.32 | 22.11 | 0.1502 | 15.33 |
Disclaimer/Publisher’s Note: The statements, opinions and data contained in all publications are solely those of the individual author(s) and contributor(s) and not of MDPI and/or the editor(s). MDPI and/or the editor(s) disclaim responsibility for any injury to people or property resulting from any ideas, methods, instructions or products referred to in the content. |
© 2025 by the authors. Licensee MDPI, Basel, Switzerland. This article is an open access article distributed under the terms and conditions of the Creative Commons Attribution (CC BY) license (http://creativecommons.org/licenses/by/4.0/).
Copyright: This open access article is published under a Creative Commons CC BY 4.0 license, which permit the free download, distribution, and reuse, provided that the author and preprint are cited in any reuse.


