
Submitted:
08 June 2025
Posted:
09 June 2025
You are already at the latest version
Abstract
The lack of proper management of pineapple peel waste has been an environmental and health challenge in developing countries such as Togo. Pineapple peel wastes could be a promising feedstock in the generation of bioenergy such as biohydrogen and biogas which has the potential to be used for cooking, transport, and electricity generation. This study assessed the feasibility of theoretically producing biohydrogen from pineapple peel waste through dark fermentation. A biogas test was also conducted from which a 53.0% methane production from the biogas was assumed to theoretically calculate the biohydrogen production potential. This process offers the best solution for properly managing pineapple peel waste, reducing the environmental and health impacts of releasing greenhouse gases (GHG) into the atmosphere and accelerating the energy transition.
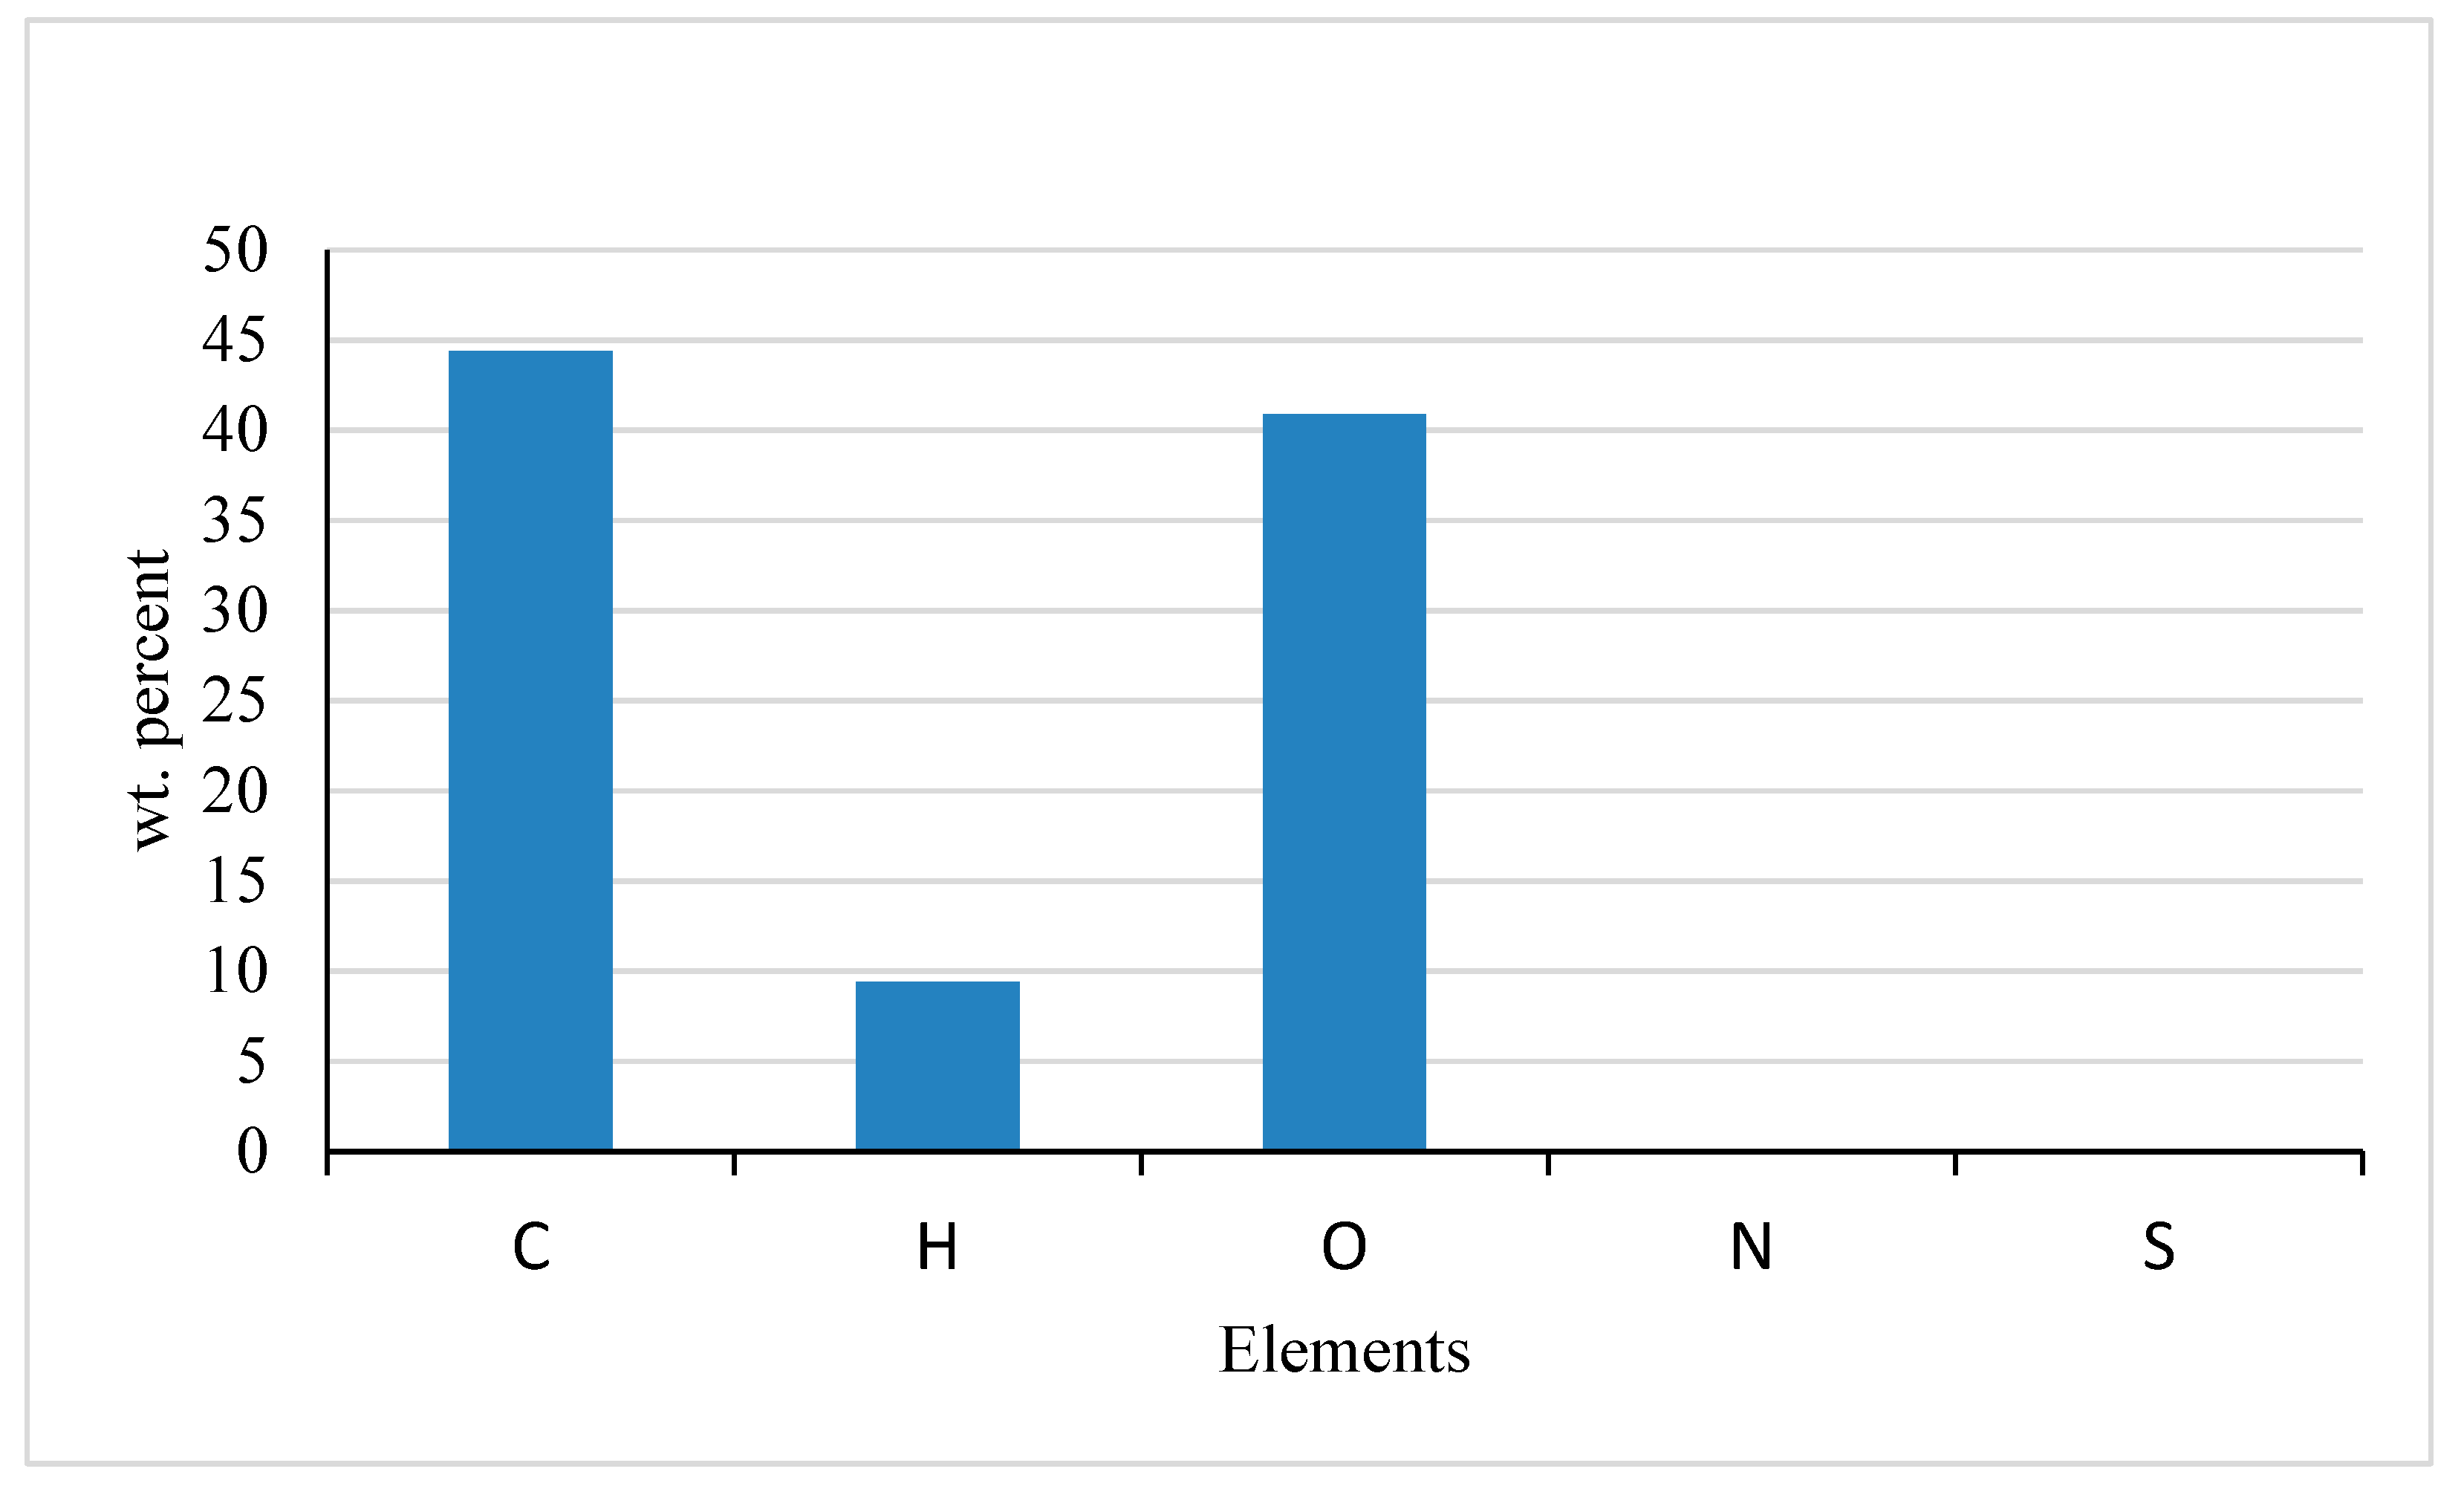
The ultimate analysis of the pineapple peel sample was conducted using an Optic digital microscope (LIBS Analyser) VHX-7000 and the results show carbon 44.4%, hydrogen 9.40%, and oxygen 40.9%. These results were then used to theoretically calculate the biohydrogen production potential. The proximate analysis was conducted to determine the moisture content, total solids, and volatile solids in the pineapple peel sample. The fiber analysis test was also done for cellulose, hemicellulose, and lignin contents using Fibretherm. The biogas test was conducted in bottles using the pineapple peel sample. The loading was such that 5 g of the sample, 200 g of inoculum, and 100 g of water were added into the bottles and then placed in a water bath at a mesophilic temperature of 380C for 21 days.
The results obtained from the theoretical biohydrogen production was 3.5 moles and the biogas test was 493.14 mLg-1VS. The estimated theoretical hydrogen production potential from the 53% methane yield in the biogas assuming 100% conversion efficiency was 1045.84 mLg-1VS.
Keywords:
Biohydrogen
; Dark fermentation
; pineapple peels
; Energy transition
; Greenhouse effect
1. Introduction
There is a high demand for energy due to the increase in economic and population growth rates [3]. According to International Energy Outlook 2013 and 2018 reports, this demand is expected to increase further. It was estimated that between 2010 and 2040, world energy consumption will increase from 524 to 820 quadrillion Btu which is about 56% [13]. However, the rapid depletion of fossil fuels coupled with the recent increase in oil and natural gas prices and the environmental pollution caused by the release of greenhouse gases (GHG) has led to the search for alternative energy sources [14]. There is a growing interest in renewable energy sources in recent times due to their ability to minimize fossil fuel dependence and the associated environmental impacts. Hydrogen appears to be the most promising clean energy carrier in the future for generating electricity in fuel cells and as gaseous biofuel used in the transport sector [28]. The energy content of hydrogen is 2.75 times higher than hydrocarbon fuel and the combustion product of hydrogen with oxygen is only water and therefore considered environmentally friendly. Hydrogen production methods can be biological, chemical, or physical processes [27]. The majority of molecular hydrogen is mainly produced from fossil fuels. According to a report, it is stated that about 71.27% of hydrogen is produced from natural gas (NG), 27.27% from coal, 0.7% from petroleum, and the remaining 0.7% from the electrolysis of water [2]. The thermochemical processes used to produce hydrogen are steam gasification, thermal decomposition, catalytic oxidation, auto-thermal reforming, and pyrolysis. However, the production of hydrogen from fossil fuel is not renewable as it involves the release of greenhouse gases (GHGs) into the atmosphere and is therefore not considered carbon neutral. Hydrogen production from biomass using biological pathways not only help reduce the dependence on fossil fuels but is also sustainable and eco-friendly [17]. Other advantages of biohydrogen production include operation under mild conditions (at ambient temperature and pressure), cost-effectiveness, and the potential utilization of renewable resources (biomass) and also various types of wastewater with a high content of carbohydrates and organic acid [30].
The pineapple (Ananas cosmos L.) is considered one of the most important fruits around the globe and it is taking the lead in the Bromeliaceae family of edible members. It is extensively grown in tropical and subtropical regions. It has the potential of growing up to a height of about 75 to 150cm with a spread of 90 to 120cm [34]. Pineapple is viewed as a rich source of vitamins, antioxidants, fibers, and minerals. It is reported that the global production of pineapple in 2018 was approximately 27.92 million metric tons [26], which mostly comes from countries like Costa Rica, Brazil, Philippines, Thailand, Indonesia, India, Nigeria, China, Mexico and Columbia [3. The top three producers of pineapple around the globe are Costa Rica, the Philippines, and Brazil [26]. According to (FAO) crop database report, Costa Rica is the leading producer of pineapple with an estimated amount of 3 million tons [9].
In Africa, Nigeria is the leading producer of pineapple and the yearly production is estimated at a share of about 1.41 million tons. Togo produced about 44,391 tons of pineapples during the 2021-2022 season and 33,737 tons from this volume were grown organically [12]. From these huge quantities of production, there is every possibility for the generation of a large amount of pineapple peel waste during the processing of the fruit, which is most of the time deposited in the area of production, market, and even in open landfills.
It is estimated that the total weight of pineapple accounts for about 50% of waste and the key components are pineapple peel (29–40%) and core (9–10%) among others [9]. The pineapple peel is reported to have a content of 16% lignin, 35% cellulose, 19.7% hemicellulose, 75 – 80% moisture, 4.7% total ash, 0.46% total fat, 23.71% total crude fibre, and 0.33% total proteins. It is made up of 27.08% total carbohydrate, 26.096 mg/kg potassium, 1.9 mg/kg magnesium, and 298.184 mg/kg zinc [8]. Pineapple peel waste can be used either as fertilizer or burnt in open landfills releasing greenhouse gases that have the potential of causing global warming, and environmental and health challenges. Fermentation is a process by which biohydrogen is produced from organic materials using fermentative bacteria. In this light, the fermentation process is divided into dark and photo fermentation. Dark fermentation is carried out by dark fermentative bacteria while photo fermentation is by photosynthetic bacteria [15]. The merits of the dark fermentation process are simple operating procedures, low energy requirements, a higher stable rate of biohydrogen production by the utilization of a wide range of waste substrates as feedstock, and a better economic process. This process is however limited by the insufficient utilization of substrate giving rise to low hydrogen yield [29]. The use of pineapple peel waste to produce biohydrogen and biogas will provide energy in sectors like clean cooking, transport, and electricity generation but also will help in the reduction of greenhouse gas emissions (GHGs).
1.1. Problem Statement
It is reported that food waste (FW) accounts for 15-63% of total municipal solid waste around the globe and is regarded as one of the most challenging and abundant organic solid wastes [33]. The issue of lack of proper pineapple waste management is still a challenge in Togo. The large quantities of pineapple production have a high tendency of generating pineapple peel waste during processing which most of the time ends up in open landfills, production sites, or being incinerated. This has the potential to generate greenhouse gases (GHG) such as carbon dioxide and methane which are eventually released into the atmosphere causing global warming, climate change, and environmental and health challenges. The Valorisation of this waste would not only contribute to proper waste management disposals but also helps to produce a value-added product such as biohydrogen and biogas [1].
1.2. Research Questions
I. What is the effective way of utilizing pineapple peel waste to improve its waste management?
II. Does pineapple peel waste have the potential for biohydrogen and biogas production?
1.3. Research Hypotheses
By performing dark fermentation using pineapple peels waste, it is believed that the problem of waste management and the associated environmental impact will be minimized and this process will also lead to the production of biohydrogen and biogas as alternative sources of energy to fossil fuels in mitigating climate change and accelerate the energy transition.
1.4. Research Objective
The main goal of this work is to use a dark fermentation approach to produce biohydrogen and test for biogas potential using pineapple peel waste. The specific objectives are:
I. To examine the characterization of solid pineapple peel wastes
II. To theoretically determine biohydrogen production potential from pineapple peel wastes
III. To perform a test for biogas production potential using pineapple peel wastes
IV. To estimate the biohydrogen production potential from methane in the biogas
2. Materials and Methods
2.1. Materials
The test material for this process was pineapple peel wastes from pineapple fruits in Togo.
Other laboratory materials used for this process are a Crucible, Laboratory binder oven, Desiccator, Electronic balance, Mudffle furnace, and incinerator.
2.2. Sample Collection
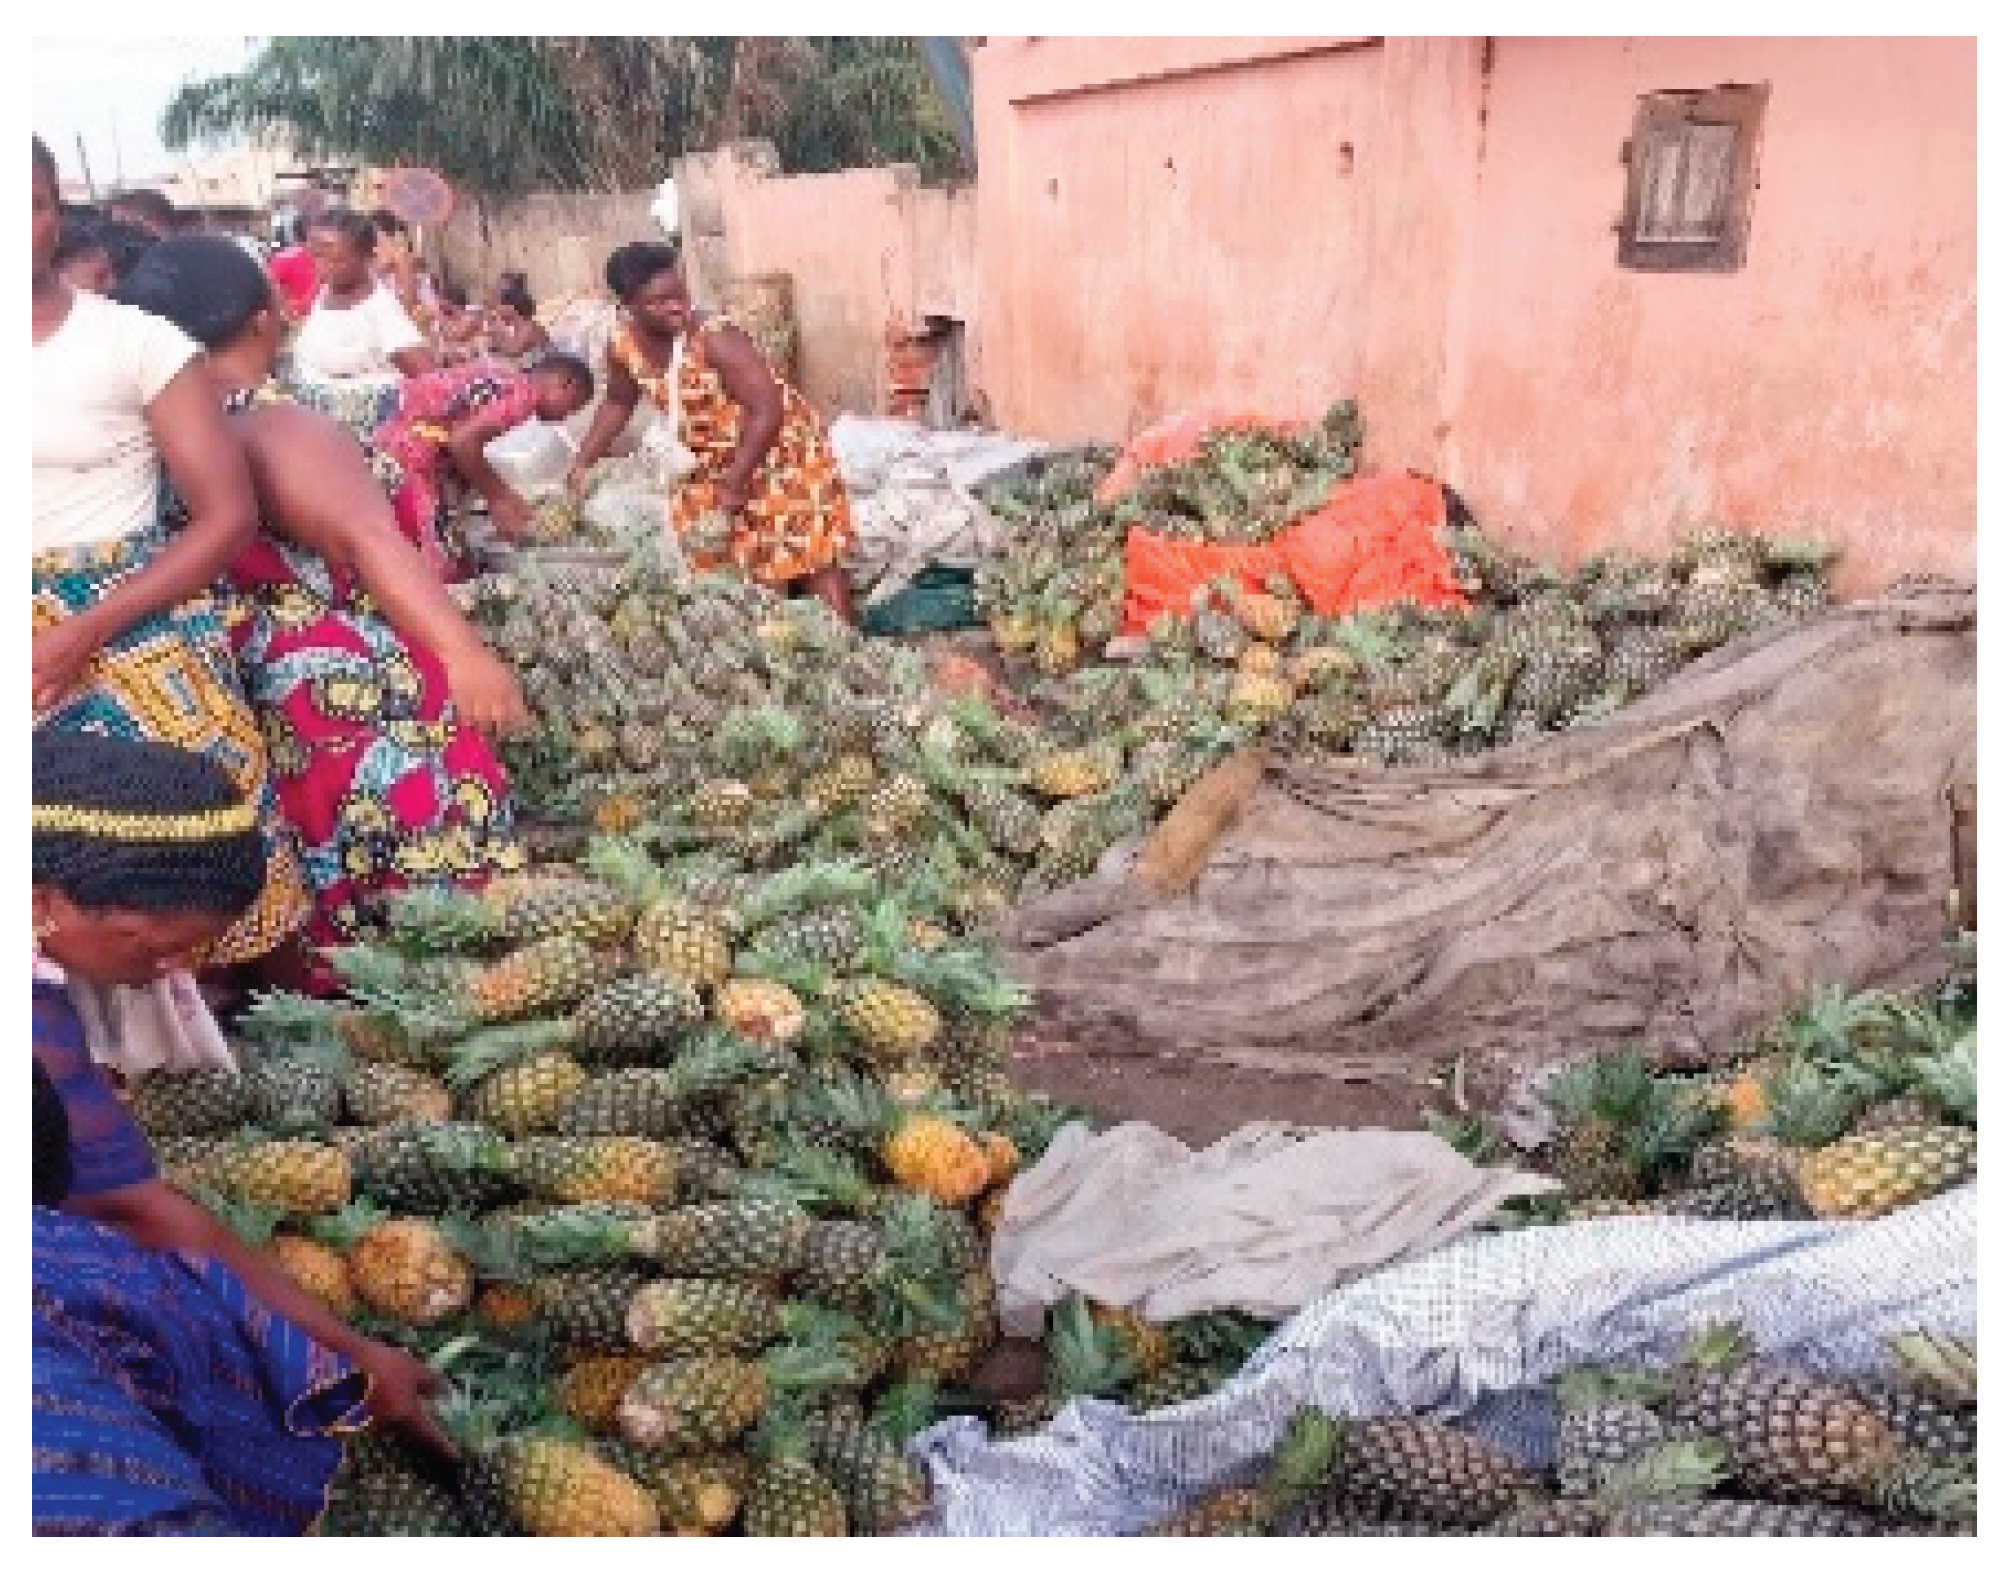
The pineapple fruits were bought from one of the Togo markets, the Hanoukopé fruit market. The pineapple fruits were washed and then peeled off and the peels were later taken to the physics laboratory at the University of Lomé for drying.
Figure 1.
Pineapple fruit collection site in Lomé, Togo.
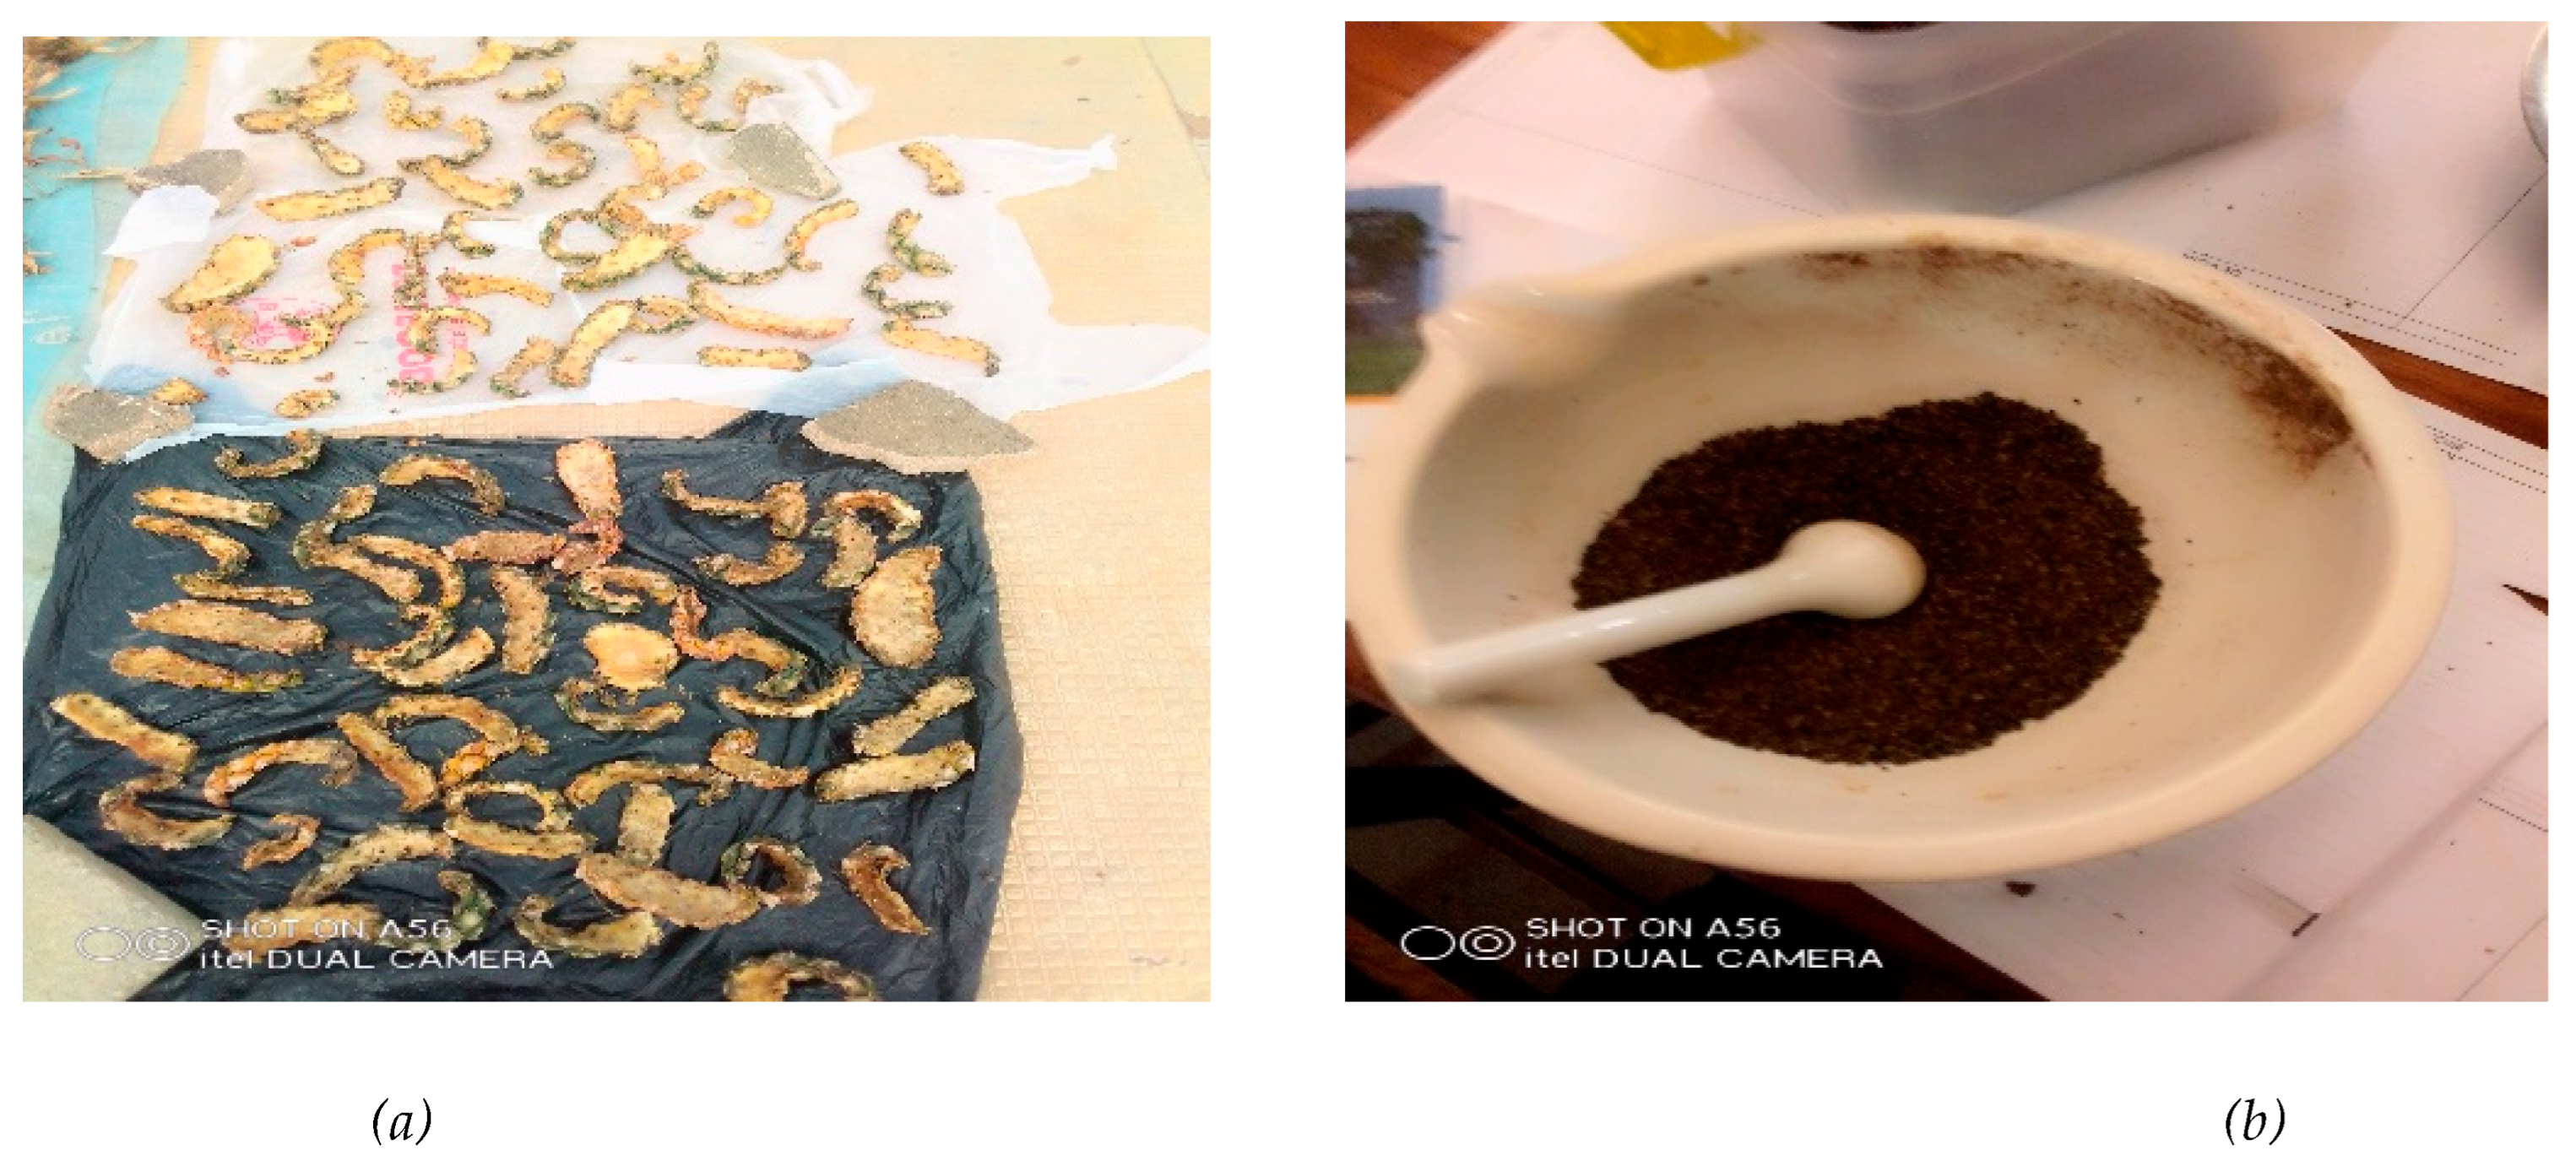
2.3. Sample Preparation and Pre-Treatment
The sample preparation was carried out at the physics department, where the pineapple peels were sun-dried for seven days. The dried pineapple peels were ground in a motor and pistol into a small size and stored in a rubber bottle for one month before transportation to Germany for further analysis. In Germany, no further pre-treatment was carried out. The ground pineapple peel sample was analyzed at the technical lab for waste management and Bioenergy, Department of Waste and Resource Management, Faculty of Agriculture and Environmental Sciences at the University of Rostock.
Figure 2.
a) Drying of pineapple peels; (b) Sample Preparation and Pretreatment.
2.4. Characterization of Solid Pineapple Peel Wastes
The dried pineapple peel sample was characterized for ultimate, proximate, and fiber analysis.
2.4.1. Ultimate Analysis
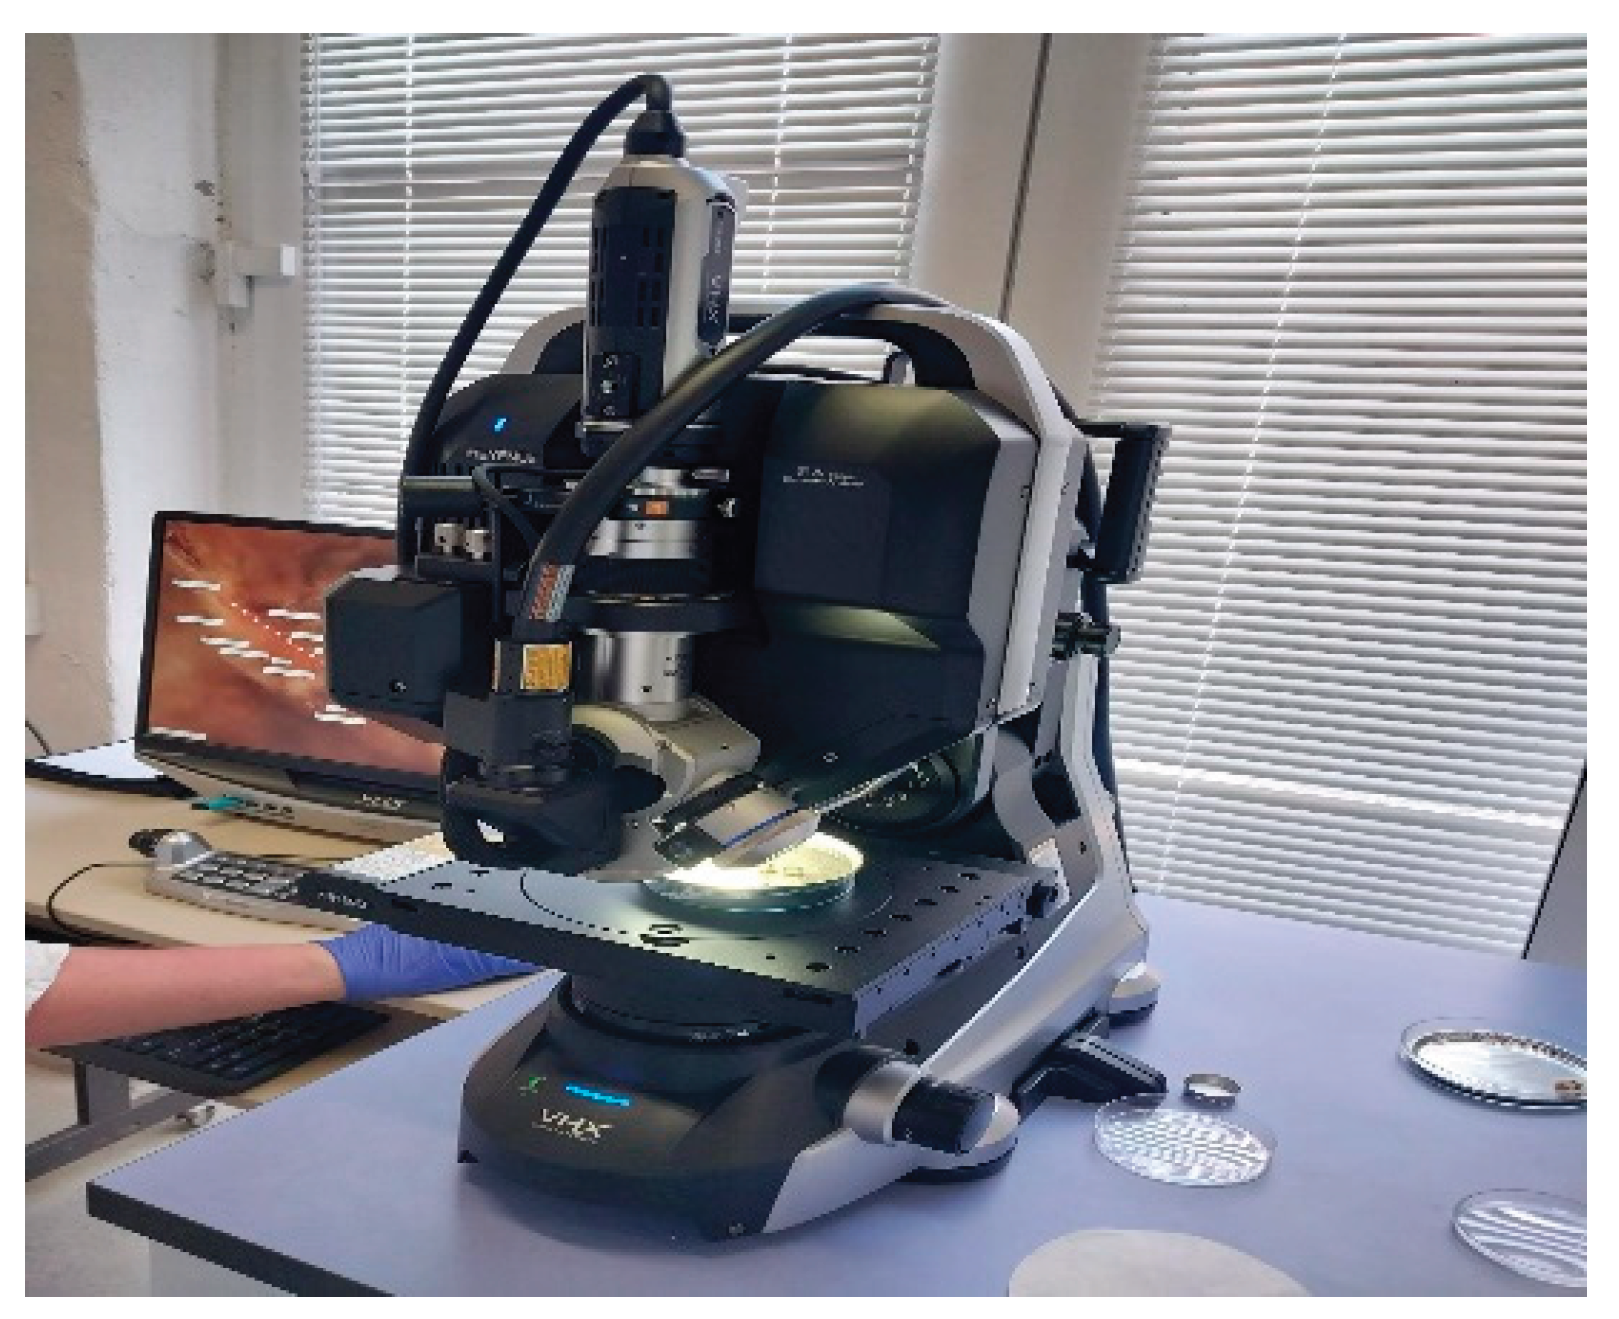
The dried ground pineapple peel sample was analyzed for the various elemental composition that is present in the sample such as carbon, hydrogen, nitrogen, oxygen, and sulfur by using an Optic digital microscope (LIBS Analyser) VHX-7000. The laser-induced breakdown spectroscope (LIBS Analyzer) is a type of analyzer that make use of the light emission analysis approach. The analyzer produces a short pulse laser with a high density of energy projected at the sample’s surface, thereby converting a small piece of the sample to plasma. The plasma becomes atomized and excited; light is emitted when the part exposed to the laser returns to the ground state. This emitted light is then transferred through fiber optics and enters the spectrometer through the silt to analyze the elements contained in the sample.
Figure 2.
Elemental analysis of pineapple peels.
2.4.2. Proximate Analysis
This was done to determine certain properties of the pineapple peels, such as moisture content, ash content, volatile matter, and total solids.
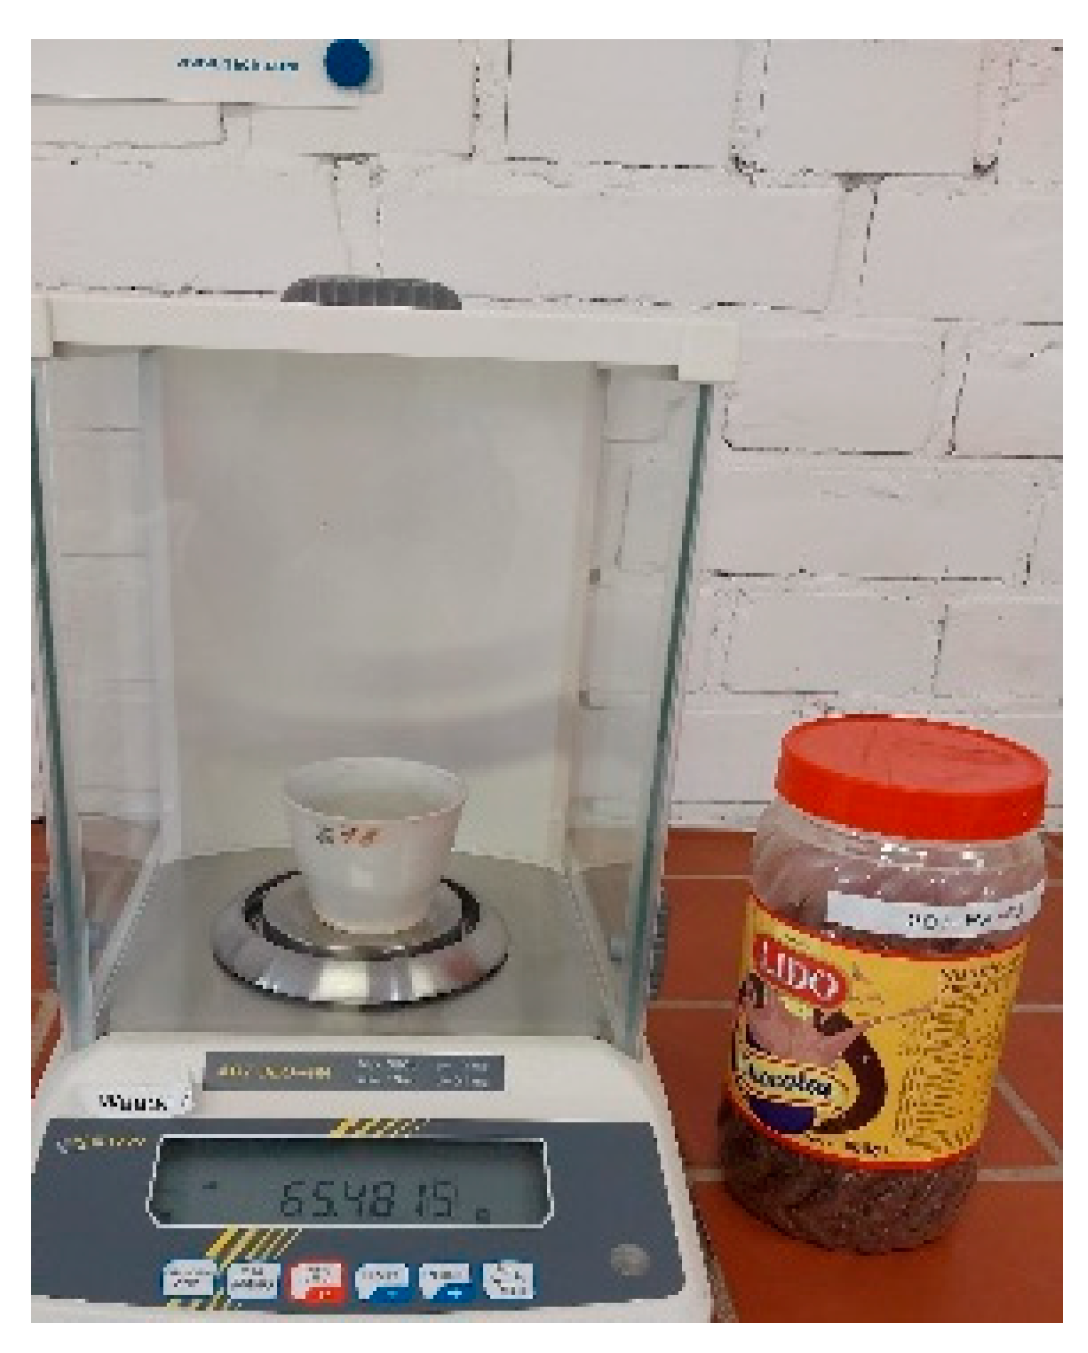
2.1. Determination of Moisture Content
The determination of the moisture content involves the drying of the sample to obtain a constant weight at 1050C [34]. The moisture content is then calculated as the loss in weight of the dried sample. The crucibles were weighed using a weighing balance and their weight was recorded as (W1). Then the dried ground pineapple peel sample was introduced into the crucibles and later weighed and recorded as (W2). The crucible containing the sample was later placed inside an oven and dried at 1050C for 4 hours and then cooled in a desiccator for 30min and weighed and values were recorded as (W3). This procedure was conducted in triplicate using the same sample and the moisture content was calculated on a dry basis using the equations below: [22]. The average mean and the standard error were determined from the three samples.
Weight of empty crucible = W1 (g)
Weight of empty crucible + sample = W2 (g)
Weight of empty crucible + sample after drying =W3 (g)
Mass of water in the sample = W2-W3 (g)
Mass of dry sample = W3-W1 (g)
Figure 3.
Weighing of the sample.
2.4.3. Determination of Ash Content
The ash content was determined by incineration of the total mass of the sample after drying in a muffle furnace at 5500C for 2hrs and was then cooled in a desiccator for 30min. The weighing was carried out immediately after the sample was removed from the desiccator to avoid moisture content in the ash samples. The weighing process was done in triplicate and values were recorded. The average mean was calculated from the three samples and the standard error.
The ash content was calculated on a dry basis as thus: [22].
Weigh to empty crucible = W1 (g)
Weigh to empty crucible + dry Sample = W2 (g)
Weigh to empty crucible + Ash after incineration = W3 (g)
Mass of Ash = W3-W1 (g)
Mass of dry sample = W2-W1 (g)
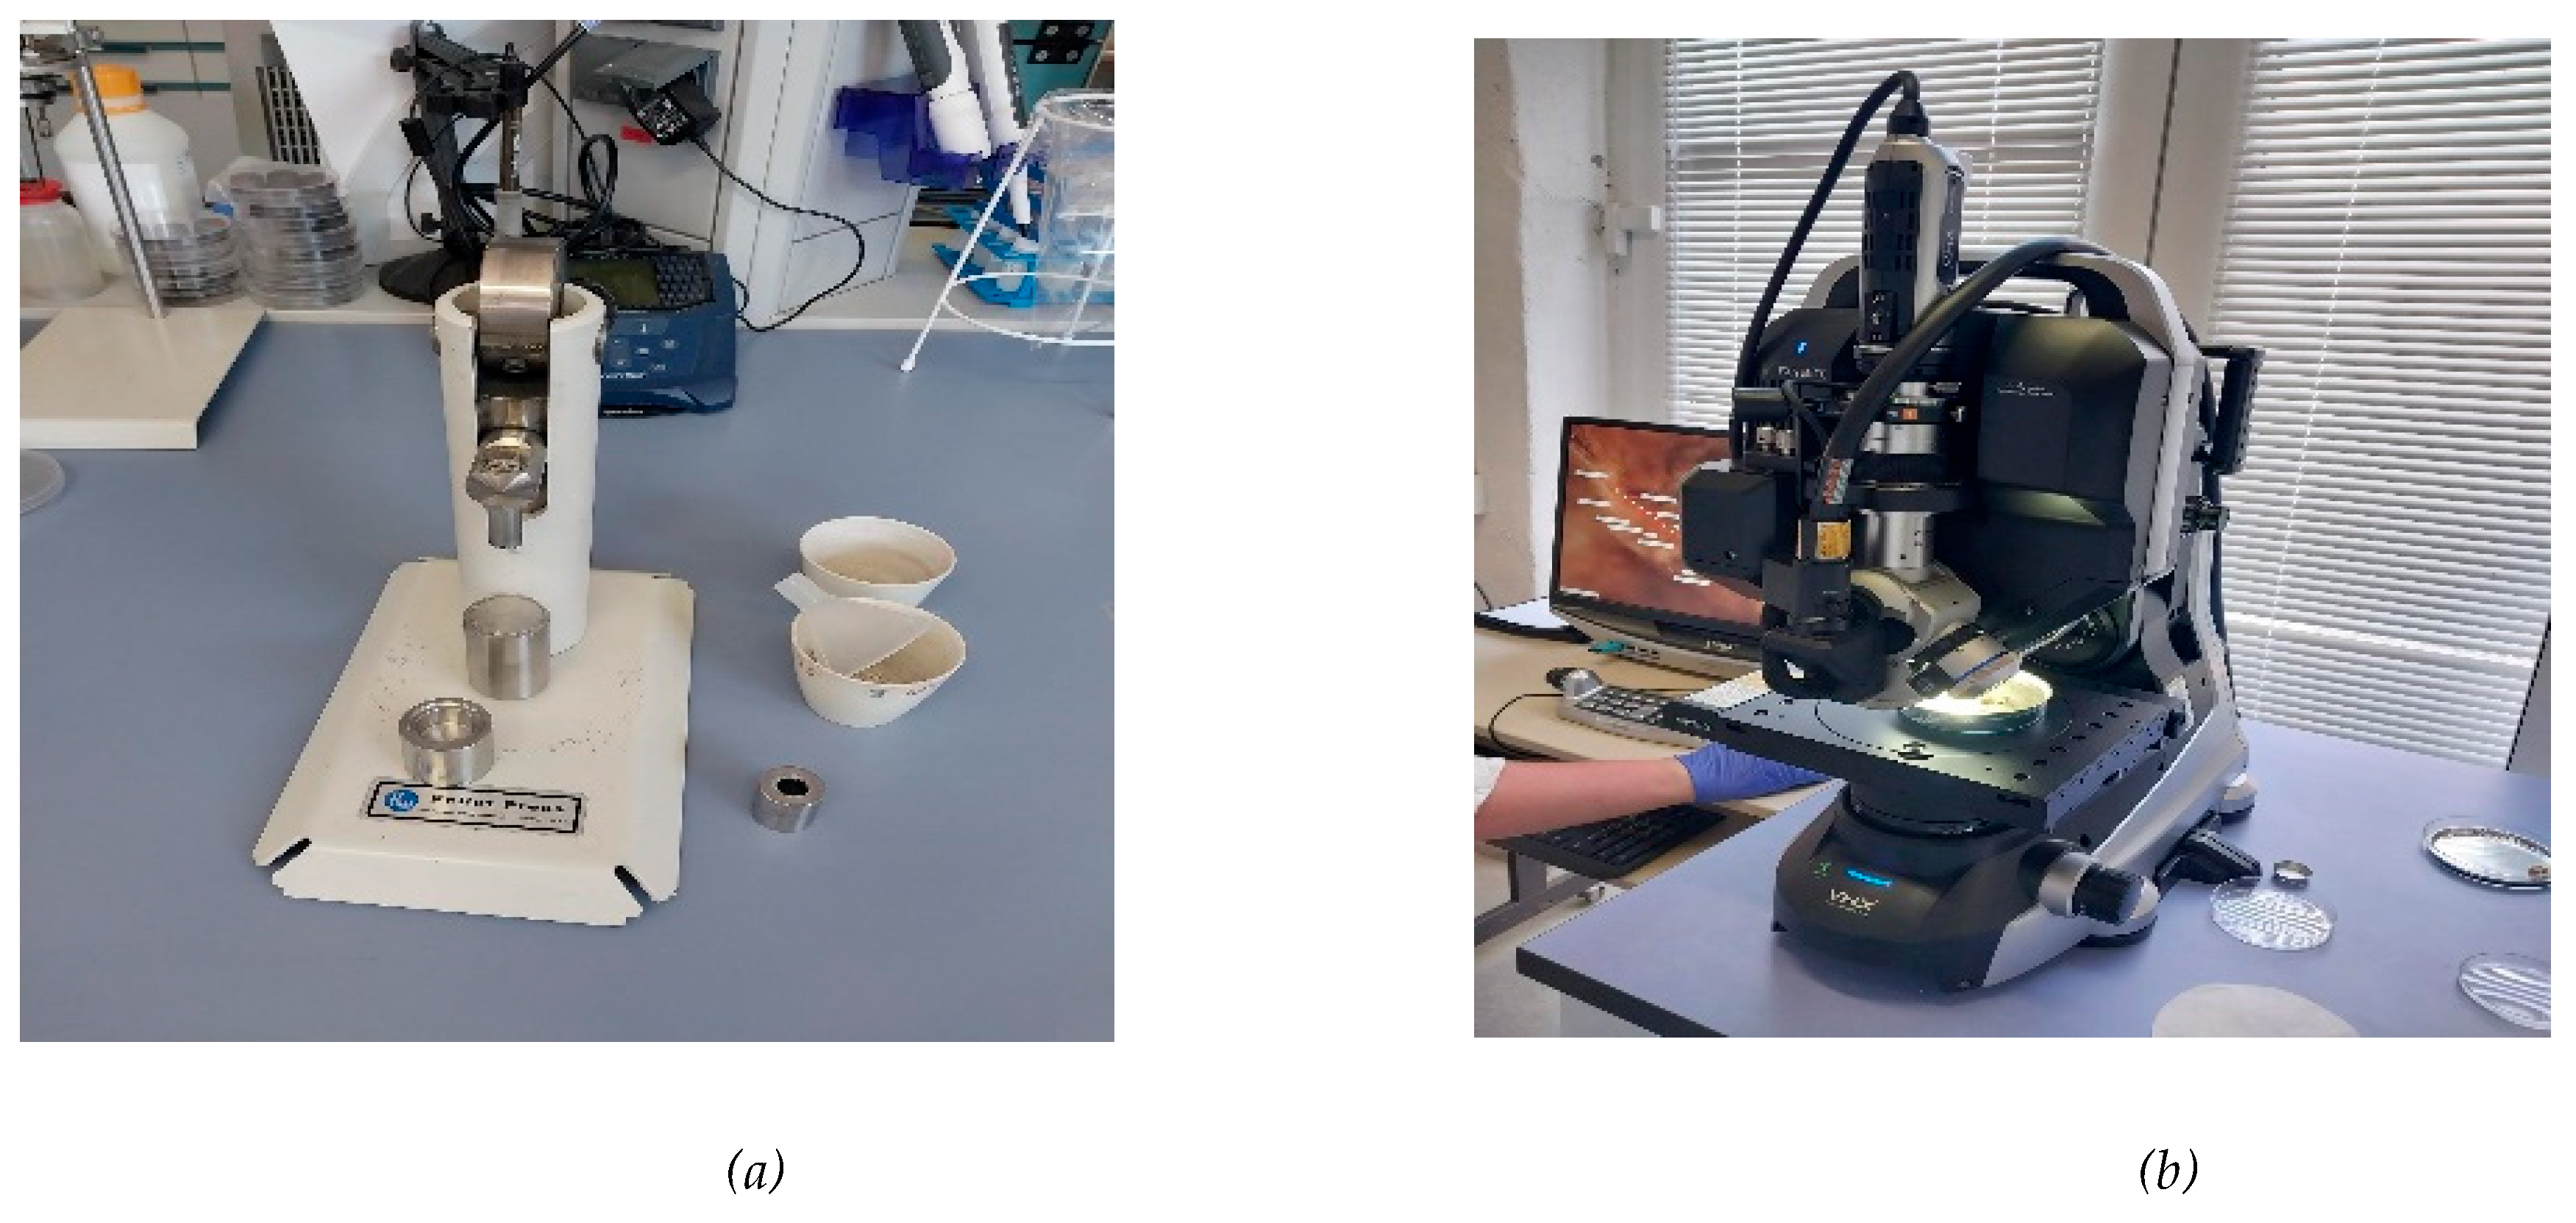
An ash analysis was also done to determine the elemental composition of the ash content. This was done by putting a small portion of the sample into a thimble and pressing it using a pellet press to form a small pellet which was later placed in an Optic digital microscope (LIBS Analyzer) VHX-7000 for analysis.
Figure 4.
(a) pellet press; (b) Ash analysis experimental setup.
2.4.4. Determination of Total Solids
It is the amount of solid that is present in the sample after the loss of water molecules. It also refers to the quantity of the material residue left in the crucible after evaporation of the sample and its subsequent drying in a laboratory oven at 105°C for a period of one hour. Equation (2.4) can be used to calculate the percentage of total solids [16]. Three samples were used, and the average mean was calculated from these three samples with the standard deviation.
Where:
Weight of crucible = W1 (g)
Weight of crucible + dried sample = W2 (g)
Weight of crucible + wet sample = W3 (g)
2.4. Determination of Volatile Solids
The volatile solid is the solid remaining after the dried sample was weighed in a crucible and incinerated in a muffle furnace at 550°C for 2hrs. The crucible was then allowed to cool by placing it into a desiccator. After the cooling process, the sample was weighed and this was repeated three times. The equation below was used to calculate the percentage of volatile solids [16]. Three samples were used, the average mean was calculated, and the standard deviation was also determined.
Where:
W4 (g) = weight of crucible + weight of sample after incineration
2.3. Compositional Analysis (Fibre Analysis)
Fibretherm was used in this process to determine cellulose, hemicellulose, and lignin content. It involves a fully automated digestion and filtration of the pineapple peel sample. This was done using two analytical methods: neutral-detergent fibre (NDF) and acid-detergent fibre (ADF). NDF analyzed the total fiber in the samples, that is, the residue that remains after treatment of the biomass with the neutral detergent solution while ADF after treatment with an acid detergent solution was oxidized by Cetyl trimethylammonium bromide in H2SO4 solution. The mass difference between the pineapple peels samples digested with acid detergent (72% H2SO4) followed by oxidation of buffered solution of acetic acid together with potassium permanganate was taken as the lignin content (ADL) (Kabenge et al., 2018)
Hemicellulose = Neutral Detergent Fiber (NDF) – Acid Detergent Fiber (ADF)
Cellulose = Acid Detergent Fiber (ADF) – Acid Detergent Lignin (ADL)
Lignin = Acid Detergent Lignin (ADL)
Procedures to Determine NDF, ADF, and ADL
The empty weight of the fibre bags was determined and 1g of the dried sample was accurately weighed and introduced in a beaker, 300-400ml of acetone was added into the beaker for 5mins to remove the fat and was later transferred to another beaker for drying. The dried sample was then placed into the fibre bags. A glass spacer is carefully inserted into the fibre bags and both together are placed in the sample carousel. This was then introduced in the Fibretherm to wash it with NDF solution (Amylase). The spacer was removed from each fibre bag and was then placed in the crucible rolled up and dried for approximately 24h at 105°C. This was allowed to cool down by placing it in a desiccator and the mass of NDF was determined.
To determine the mass of ADF the weighed fibre bags were hung in a sample carousel. The sample carousel with the fibre bags was placed in a beaker and covered at room temperature with 72% sulfuric acid. The sample was later introduced in the Fibretherm to be washed with ADF solution (40g of N-Acetyl-N, N, N- trimethylammonium bromide + 2L of sulfuric acid) and was left for two days. The fibre bags were then removed and dried in a muffle oven at 5500C for 6hrs and then placed in a desiccator for cooling and the mass of ADF was calculated.
A similar procedure was used to determine the ADL immediately after the ADF determination.
Where: NDF = Share of neutral detergent fibre %TS
ADF = Share of acid detergent fibre %TS
ADL = Share of acid detergent lignin %TS
M1 = Mass of the empty dried fibre bag (g)
M2 = Mass of the dried fibre bag with sample (g)
M3 = Mass of the empty crucible of the blank reading (g)
M4 = Mass of the crucible + fibrebag + sample after drying (g)
M5 = Mass of the crucible + fibre bag + sample after calcination (g)
M6 = Mass of the crucible + fibre bag after calcination of the blank reading (g)
M7 = Mass of the ADL-crucible + fibre bag after drying (g)
TSmd = Total solids of the dried and milled sample
2.4. Theoretical Determination of Biohydrogen Production Potential from Pineapple Peel Waste
The masses obtained from the ultimate analysis of carbon, hydrogen, and oxygen were used to theoretically calculate the biohydrogen production potential from pineapple peel waste.
The equation of dark fermentation of biomass is given as:
α Biomass + βH2O → γAcetic acid + δPropionic acid + εButyric acid + ζValeric acid + θHexanoic acid + κH2 + λCO2 + µMicrobial biomass + πOthers (e.g., ethanol)
Where: α, β, γ, δ, ε, ζ, θ, κ, λ, + π are molar coefficients [37].
However, the acetate pathway of biohydrogen production was considered in this work and the equation is given as:
Where x, y, and z are the moles of carbon, hydrogen, and oxygen. The number of moles of Carbon, Hydrogen, and Oxygen was determined by dividing their weight percentages by their molar masses. This was in turn divided by the smallest mole ratio. This is shown below
Where: n= number of moles, m = mass, M = molar mass
The number of moles was substituted into the equation above for x, y, and z and the entire equation was then balanced to determine the number of moles of biohydrogen that will be produced. This number of moles was then converted to milliliters of biohydrogen using the formula below:
2.5. Test for Biogas Production Potential Using the Pineapple Peels Waste
The biogas test was conducted on the pineapple peel sample to determine the potential biogas yield from the substrate under standard conditions. The inoculum used was anaerobic sludge from a biogas plant in Germany. The masses of the bottles were initially weighed and recorded. The inoculum was properly stirred to maintain homogeneity before introducing 200g into the bottles. 5g of the weighed sample and 100g of water were also added to the same bottles and this was done in triplicate. The bottles were covered with a magnetic stirrer to filter particles and prevent foaming. The methanogenic bacteria were activated by swirling the bottles thoroughly. A Gas measurement module with a lithium battery was introduced on top of the bottle’s filter to measure the biogas production potential. The sample bottles were then placed in a water bath at a mesophilic temperature of 38°C for 21 days.
2.6. Estimation of the Biohydrogen Produced from The Biogas Test
This was done by using the cumulative biogas yield from the pineapple peels sample and estimating the biohydrogen yield. The volume of methane was calculated from the biogas yield and the volume of hydrogen was later estimated from the volume of the methane using steam methane reforming and water gas-shift reactions as shown below;
A 53% methane production from the biogas and 90% theoretical conversion efficiency were assumed.
The volume of methane = Percentage of methane in the biogas x Cumulative biogas yield
3. Results
3.1. Characterization of Solid Pineapple Peels Waste
The characterization was carried out by doing ultimate, proximate, ash, and fiber analysis of the pineapple peel sample.
3.1.1. Ultimate Analysis

Table 1.
Ultimate Analysis of Pineapple Peels (in %wt.).
| Elements | C | H | O | N | S |
| Values (%wt.) | 44.40 | 9.40 | 40.90 | - | - |
Figure 5.
Ultimate analysis of pineapple peels.
3.1.2. Proximate Analysis
Table 2.
Proximate Analysis of Pineapple peels (on a dry basis).
| Items determined | % Composition |
| 1. Moisture content | |
| 2. Total solids | |
| 3. Volatile solids | |
| 4. Ash content | |
| 5. Dry matter content | 98.46 |
n.
3.1.3. Ash Analysis
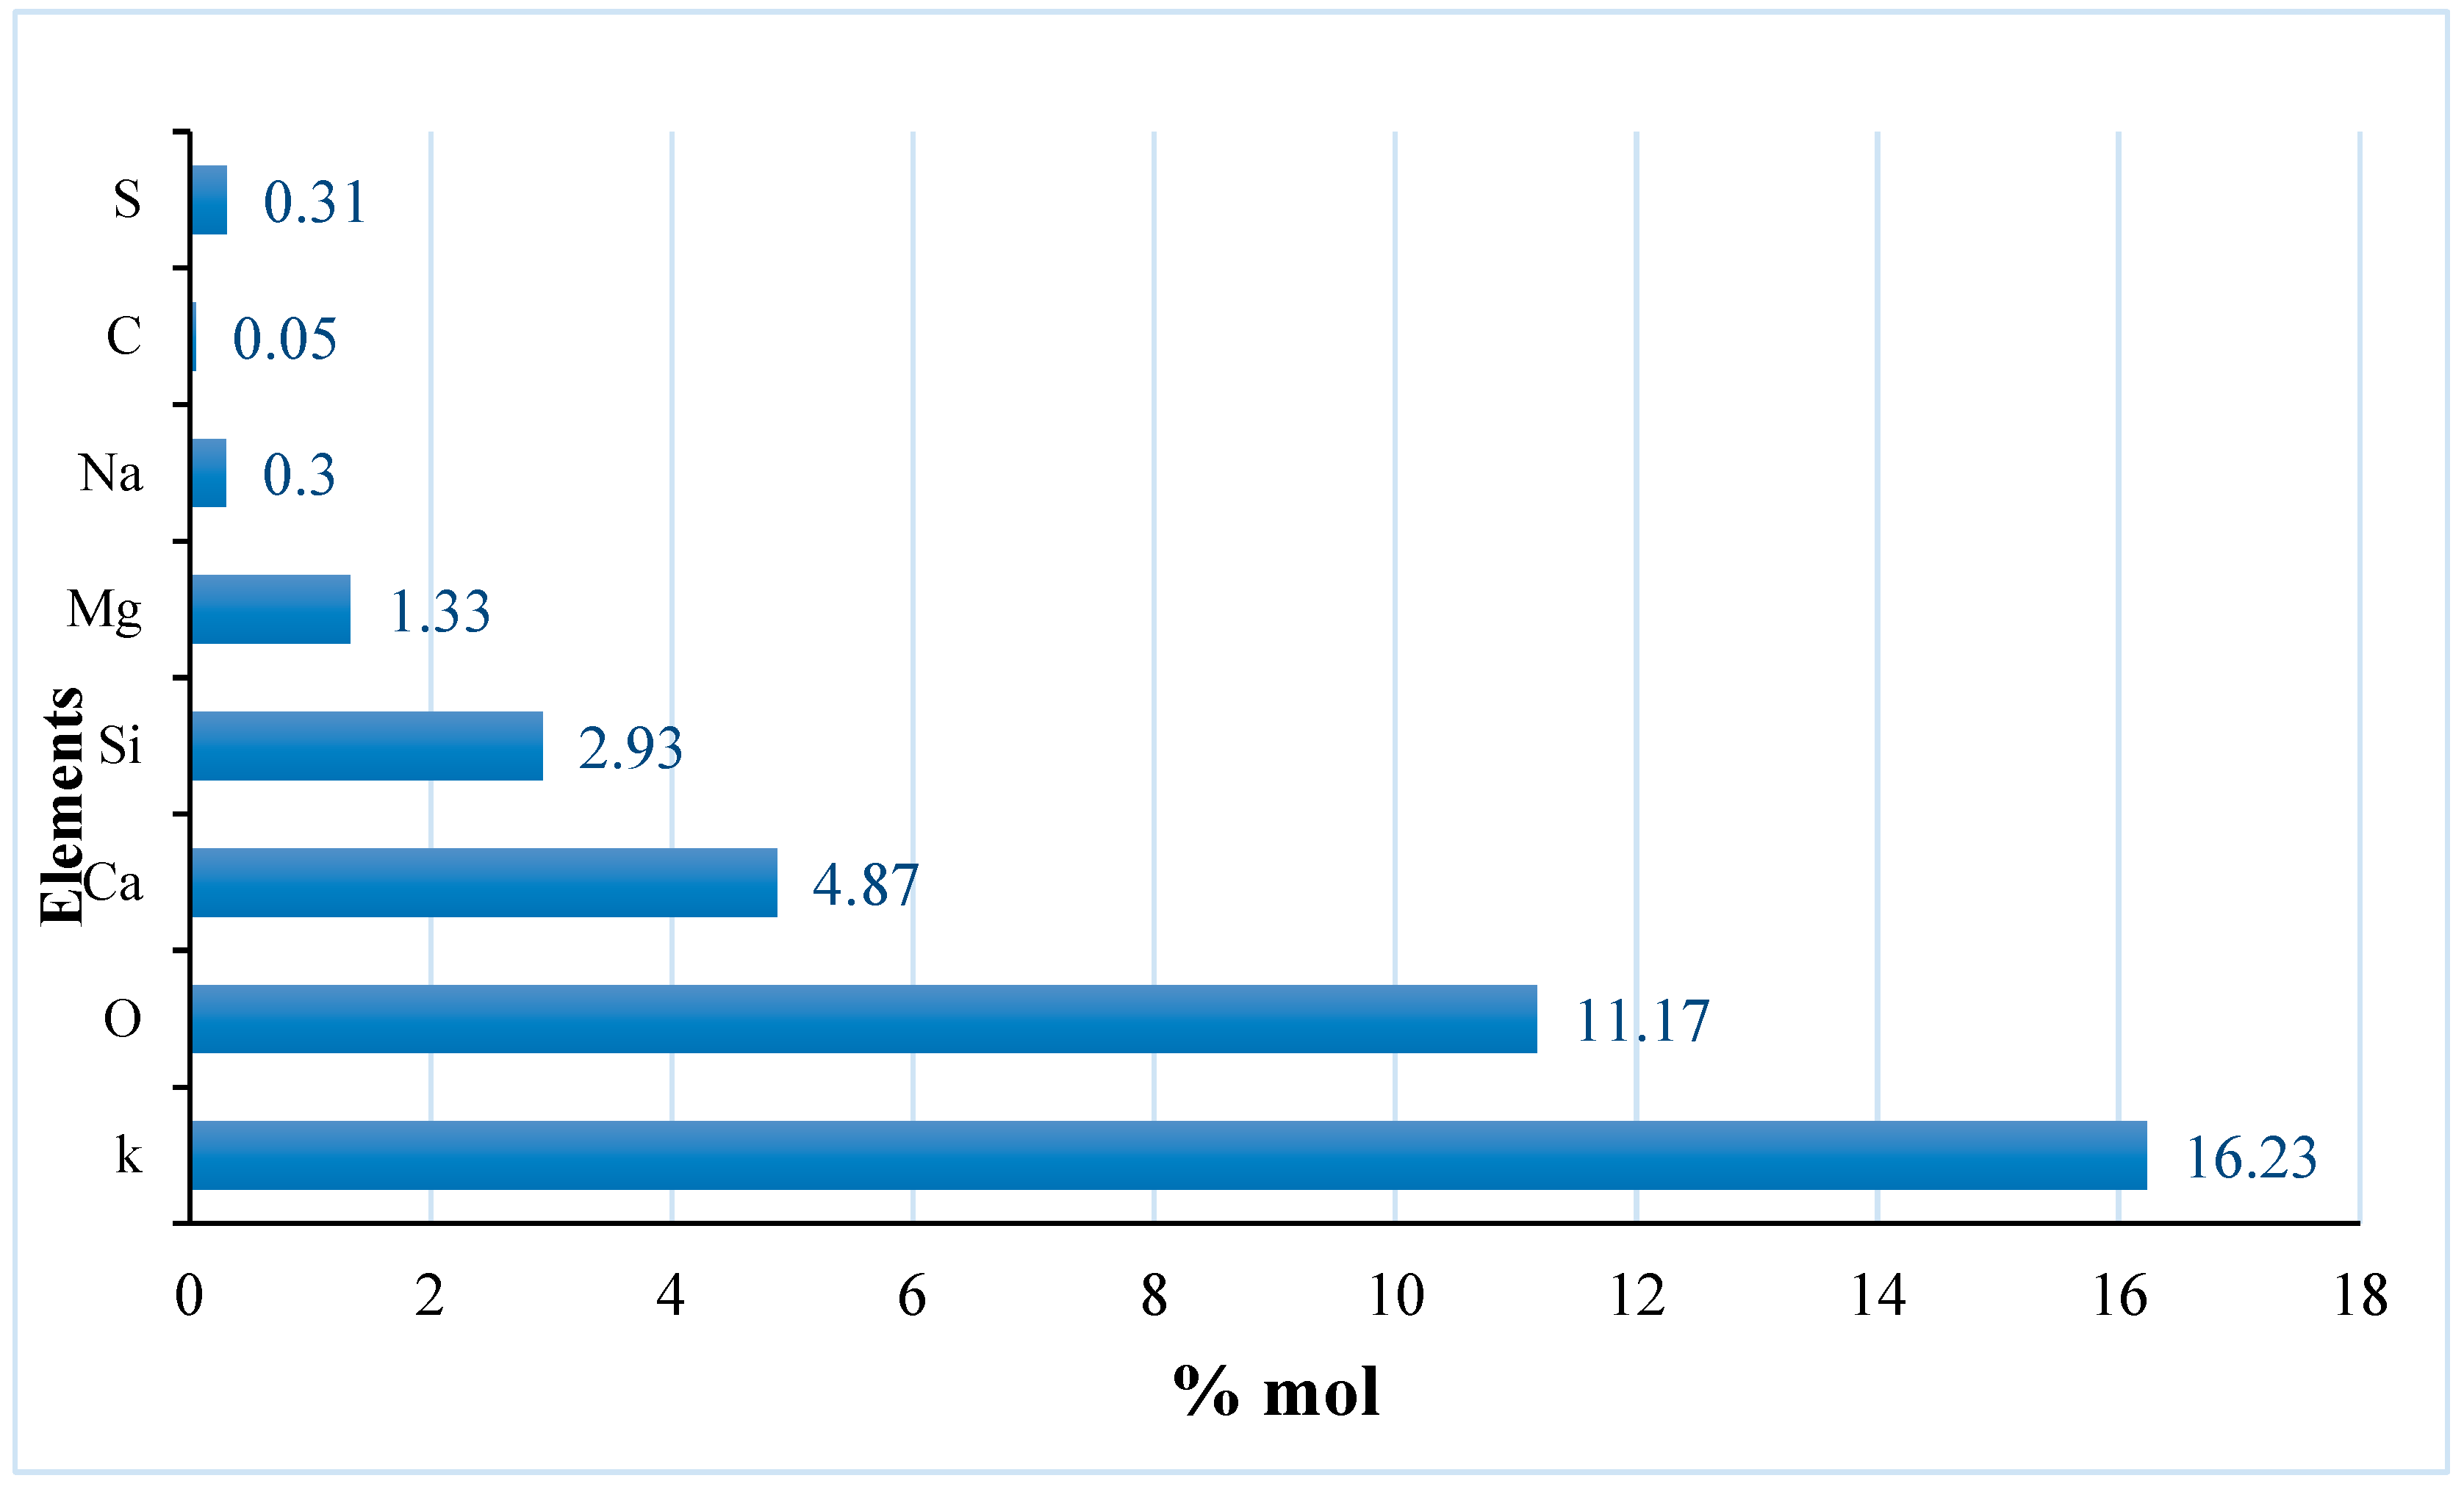
Table 6.
Ash Analysis of the pineapple Peel Sample (in mol %).
| Elements | K | O | Ca | Si | Mg | Na | C | S |
| Values(%mol) | 16.23 | 11.27 | 4.87 | 2.93 | 1.33 | 0.30 | 0.50 | 0.31 |
Figure 6.
Ash analysis of pineapple peels sample.
3.1.4. Fibre Analysis
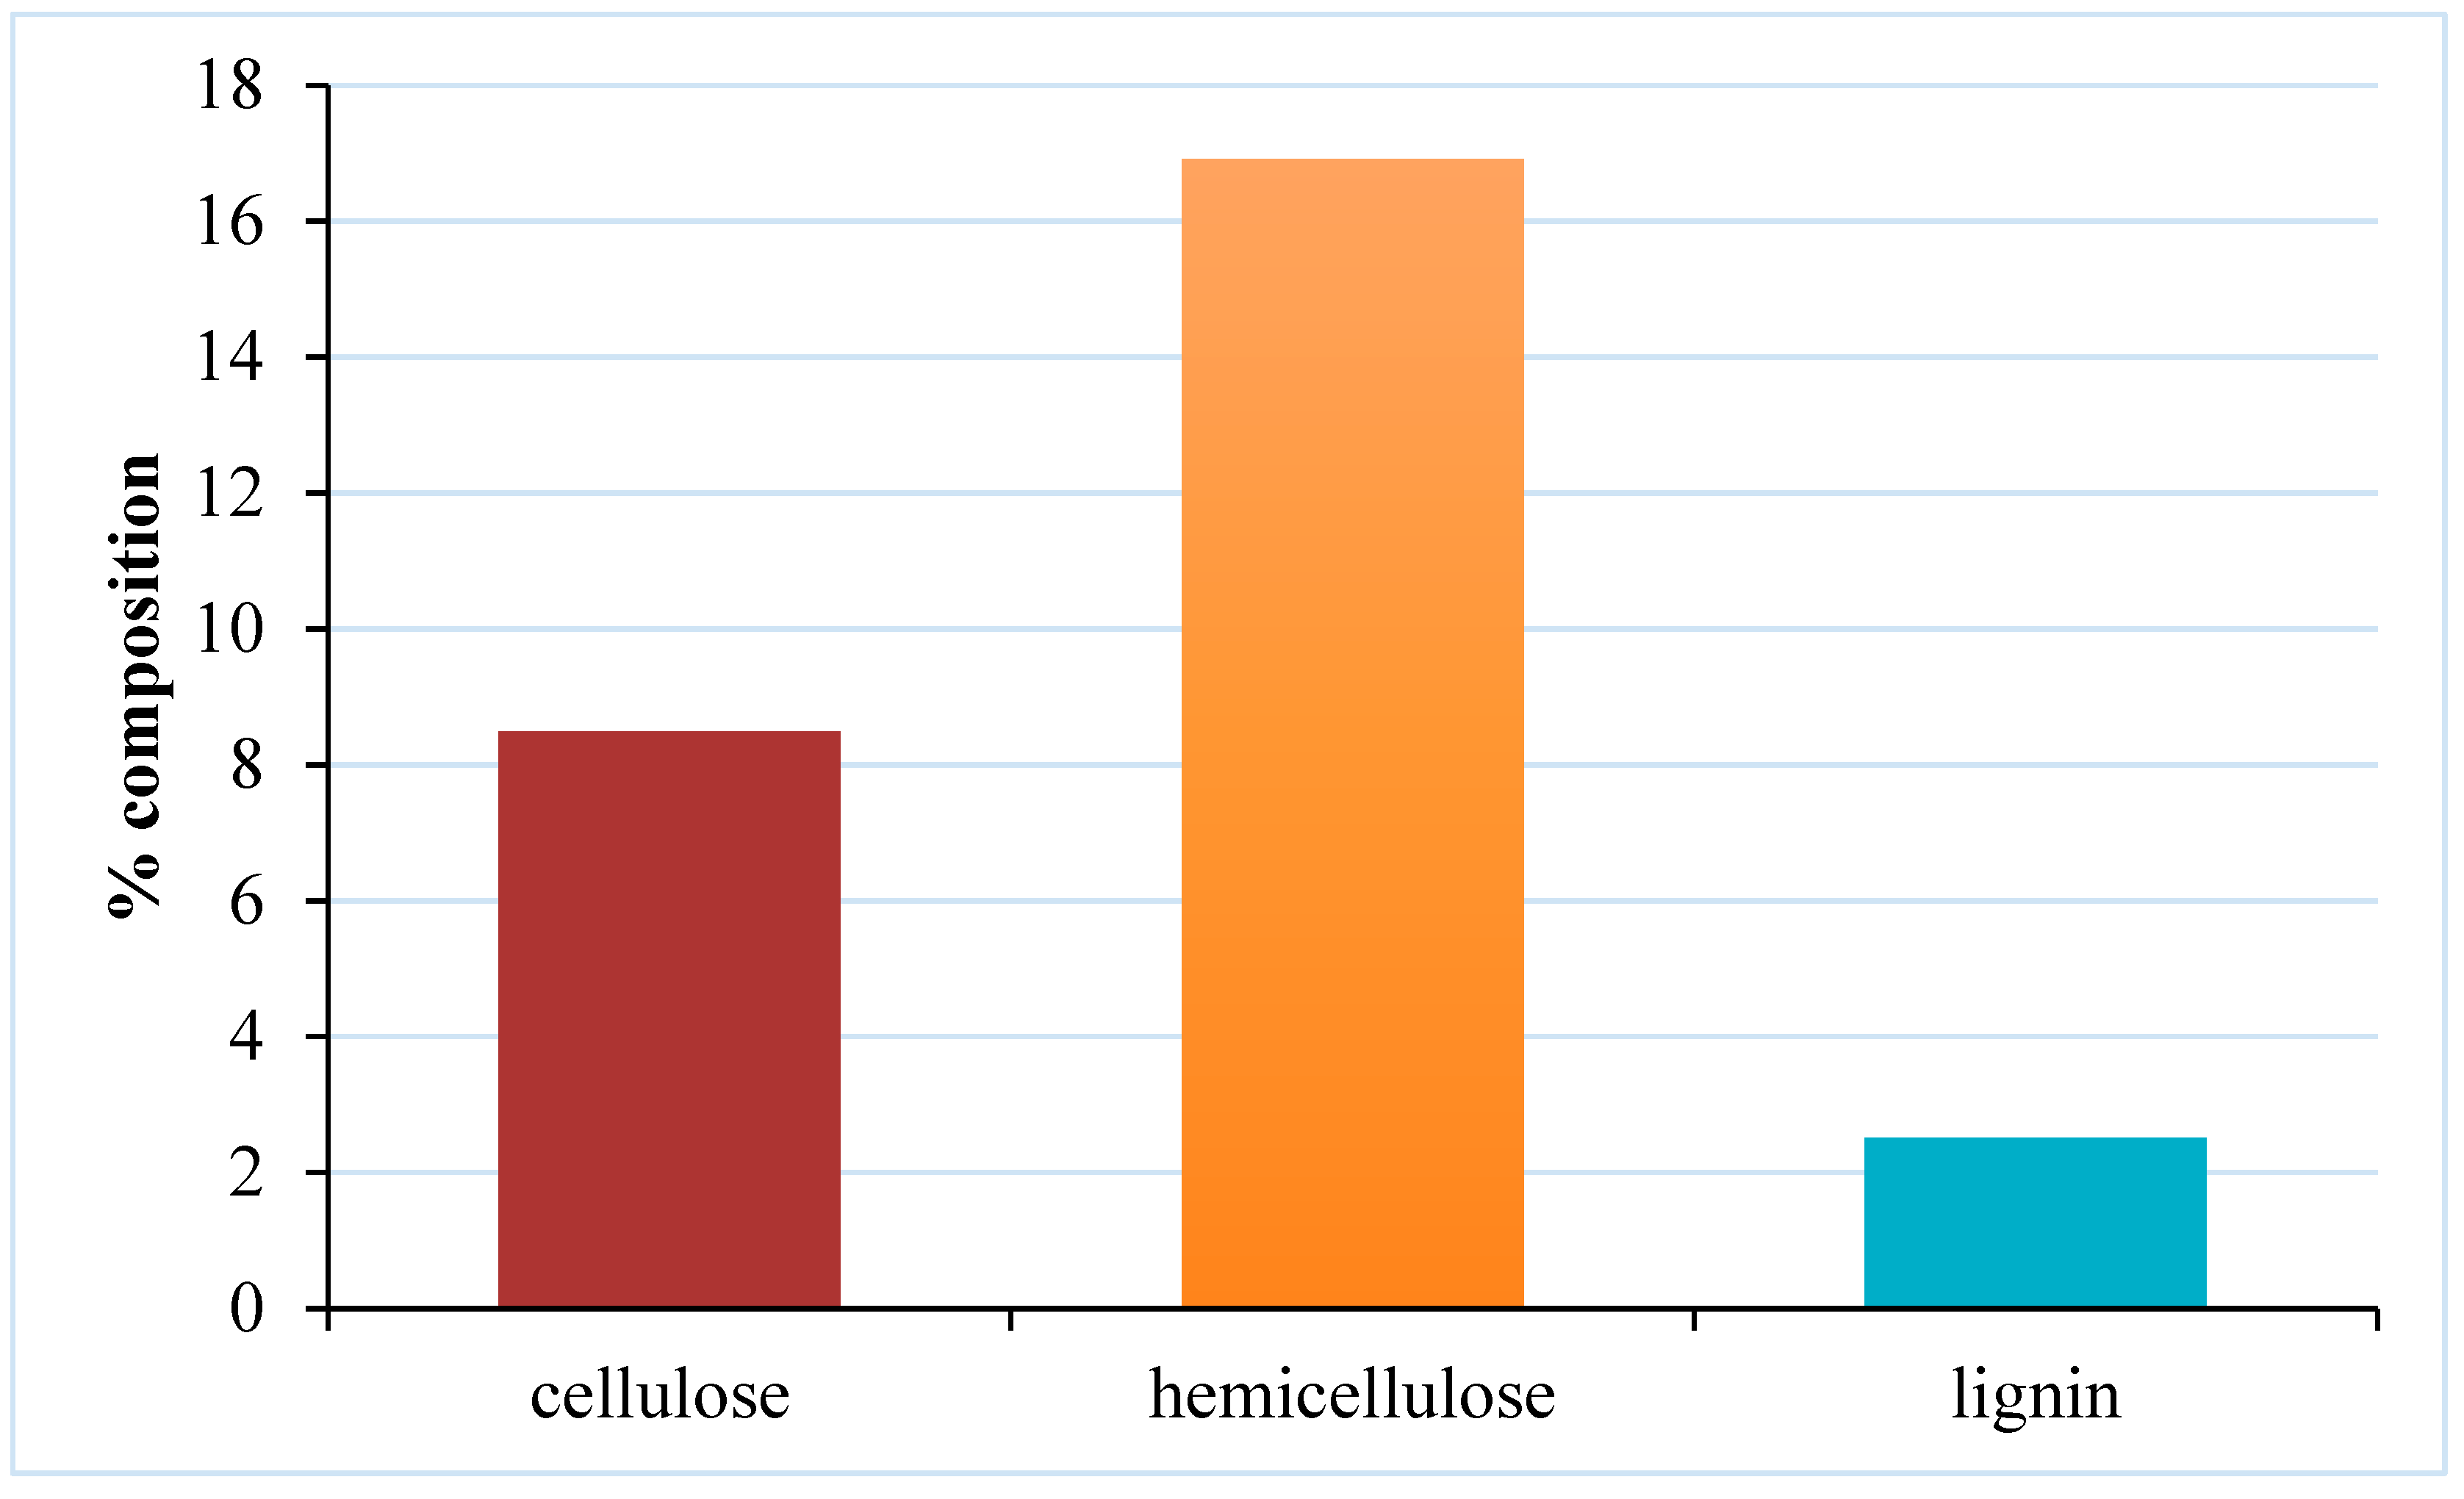
Table 3.
Fibre Analysis of Pineapple Peels.
| Items determined | % Composition |
| 1. Cellulose | 8.50 |
| 2. Hemicellulose | 16.92 |
| 3. lignin | 2.52 |
Figure 7.
Percentage composition of cellulose, hemicellulose, and lignin in sample.
3.2. Theoretical Determination of Biohydrogen Production Potential from Pineapple Peels Wastes
Ultimate analysis values of carbon, hydrogen, and oxygen are 44.4%, 9.4%, and 40.9% respectively.
Convert the values to grams and divide by their molar masses to determine the number of moles
|
Determination of the number of moles of carbon, hydrogen, and oxygen No. moles of Carbon No. of moles of Hydrogen No. of moles of Oxygen 3.7 mol 9.4 mol 2.6 mol Divide by the smallest mole ratio 1.4 3.6 1 Multiply by a whole number to remove the decimals (1.4 3.6 1) x 2 3 mol 7 mol 2 mol |
Hence, the theoretical pineapple substrate formula is given as
Using the substrate formula and balancing it according to the dark fermentation reaction
From the equation above, the theoretical biohydrogen production is 3.5 moles
In terms of volume is calculated as:
Hence, the theoretical volume of biohydrogen production is or 78400 .
3.3. Test for Biogas Production Potential Using the Pineapple Peel Waste
Table 4.
Biogas Production Potential Test (mLg-1VS) .
| Time (days) | Blank sample | Cellulose sample | Pineapple peels sample |
| 7 | 62.67 | 687.77 | 390.95 |
| 14 | 102.15 | 731.95 | 455.81 |
| 21 | 128.58 | 742.27 | 493.14 |
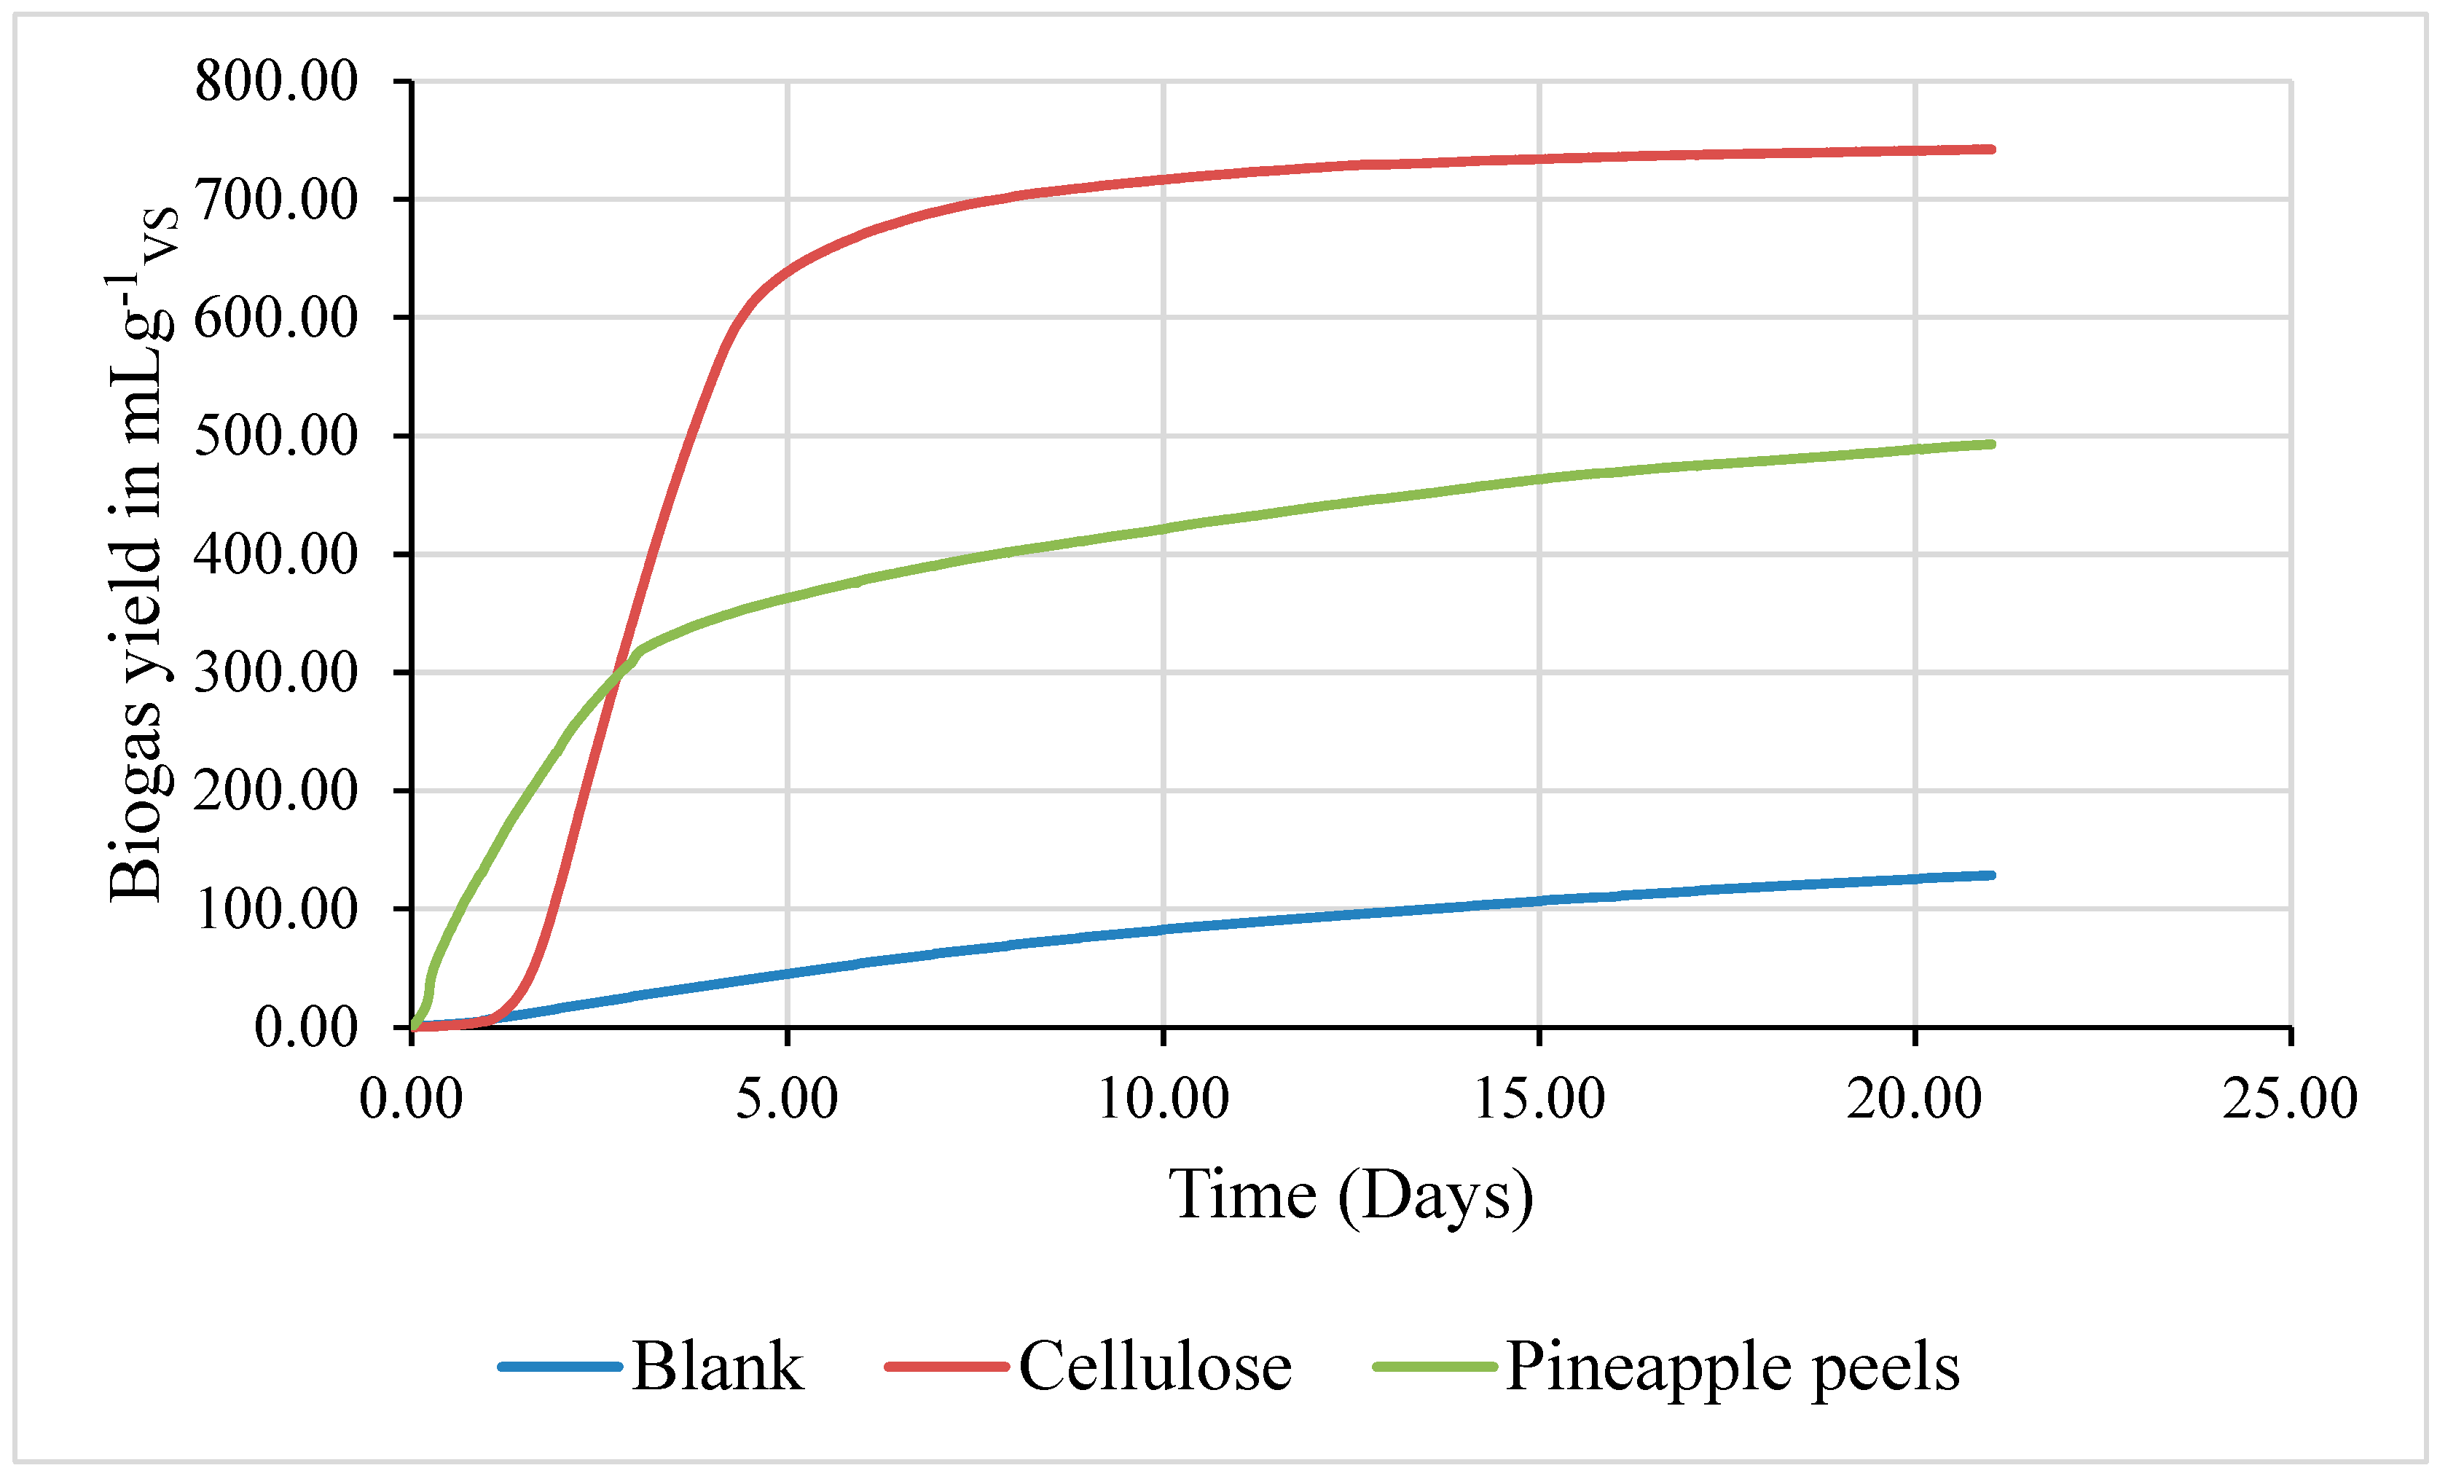
Figure 8.
Cumulative biogas production from pineapple peels sample, blank and cellulose standard.
3.4. Determination of Hydrogen Production Potential from the Biogas Yield
Table 5.
Theoretical Biohydrogen Production from the Biogas Yield.
| Theoretical yield | Conversion efficiency |
| 0.214 mole 1045.84 mLg-1VS |
90% |
4. Discussion
4.1. Ultimate Analysis
Table 4 shows the ultimate analysis of pineapple peel waste in weight percent on a dry basis. The value of carbon is 44.40% which is very close to a similar report by [38] for pineapple leaves and stems with values of 43.49 % and 41.08 % respectively.
Oxygen shows a value of 40.90 % which is similar to the result reported by [31] for pineapple peels (48.25%). This value is slightly lower than pineapple leaf (59.26 %), stem (57.31 %), and roots (75.72%) [38].
The value of hydrogen is 9.40% which is slightly greater than the values published by [35] for black sesame residue (6.79%), apple pulp (6.70%), and also by [5] for pineapple peels with a value of 5.70%.
However, the value of Nitrogen and Sulfur was not detected in this analysis rather potassium, silicon, and zinc were detected with 3.60%, 0.90%, and 0.008% respectively. When the ash content was analyzed, it was observed that there was little amount of sulfur (0.31 mol %) and no nitrogen detected. The lack of nitrogen in the sample might be due to the low protein content in pineapple peels.
4.2. Proximate Analysis
Table 5 gives the proximate analysis of the pineapple peel sample on a dry basis. It shows high total solids, volatile solids, and dry matter content, while also observing low moisture and ash content in the sample.
The moisture content of the sample is which is similar to results published by [34] for Josapine pineapple leaves and [4] for pineapple peels (13.0%), while [24] reported a value for pineapple peels lower than the value in this report. This might be due to the difference in the variety of pineapple fruit and the region of cultivation.
The proximate analysis value of total solids which constitutes the percentage of volatile matter, ash, and dry matter content present in the pineapple peel sample. This represents the solid remaining after the loss of water molecules in the sample. This value is, however, higher than a similar study of pineapple peels with a total solid of 72.8% [23].
The volatile solids show a value of which is in consonant with studies conducted for pineapple peels at 93.60% [25]. This value is seen as higher than a similar study of pineapple peels with a volatile solid of 73.23 ± 0.71% [31].
The ash content is which is similar to results obtained for pineapple peels (5.05±0.10) [26] and (3.78±0.05 %) [24]. However, another study revealed a high ash content for pineapple peels (8.28 ± 0.36 %) [31].
The dry matter content of the pineapple peel sample is 98.46% constituting the mass percent of the organic matter and the ash content of the sample. This value is close to a similar study of pineapple peels ( [5].
4.3. Ash Analysis
Table 6 gives the result for the analysis of the ash content of pineapple peels. The ash content shows minerals such as potassium, oxygen, calcium, silicon, magnesium, sodium, carbon, and sulfur with zero moles of hydrogen and nitrogen. Potassium shows the highest number of moles at 16.23 mol and sodium with the lowest value 0.30 mol. However, a trace of sulfur (0.31) was found in the ash which was not present in the ultimate analysis of the sample. This shows that during the sample’s combustion, sulfur could oxidize after the volatile matter was expelled from the sample.
4.4. Fibre Analysis
Table 7 shows the composition of the fiber analysis of pineapple peel waste. From the results, the highest composition present in the sample is hemicellulose followed by cellulose with 16.92% and 8.50 % respectively. Lignin shows the lowest composition of 2.51%.
The cellulose content of 8.50% was found to be very close to similar reports for pineapple peels (7.86%) [20], (10.90% ) [4]. However, this value is lower than other studies done for pineapple peels () [5], skin (14.0%), crown (29.6%) and pulp (14.3%) [7].
Hemicellulose content is 16.92% which agrees with a similar report for pineapple peels (16.03%) [20], and slightly lower than pineapple skin (20.20%), crown (23.2%), and pulp (22.2%) [7]. This value is however higher than a report by [19] for pineapple leaves (13.6 ± 0.82%) and stems (8.26 ± 2.10%).
The Lignin content of 2.51% is in consonant with reports for orange peels (2.65±0.70%) [6] and pineapple pulp (2.30%) [7]. In another report, this value is seen slightly lower than pineapple stem (5.42 ± 0.97%) [19], crown (4.50%) [7], and peels (7.10%) [4]. [20] reported a value for pineapple peels (1.99%) and [25] a value (1.37%) for pineapple peel which is lower than the value in this report.
4.5. Theoretical Determination of Biohydrogen Production Potential from Pineapple Peels Wastes
The result of the theoretical biohydrogen produced from the pineapple peels waste was obtained by using the fermentation equation below;
From the values of the ultimate analysis, carbon, hydrogen, and oxygen produce 3 moles, 7 moles, and 2 moles respectively. Substituting these values into equation (3.2) gives equation (3.3) when the acetate pathway is considered.
From equation (3.3), it was observed that 1 mole of the substrate produced 3.5 moles of biohydrogen. This is however close to the theoretical value reported in the literature when glucose is used as the main substrate with a maximum hydrogen yield of 4 moles as shown in equation (3.4) [18,37]
This pathway is selected since it has been proven to have the highest hydrogen production potential compared to the butyric pathway and other metabolites [18].
In terms of volume, the theoretical volume of biohydrogen produced is or 78400
4.6. Test for Biogas Production Potential Using the Pineapple Peels Waste
Table 8 shows the result of the biogas production potential test for blank, cellulose standard, and pineapple peel samples in terms of volatile solids for a period of 21 days. It is seen that all samples produce biogas. The production was relatively low in the first 7 days and increased for the reaming 21 days. It was observed that the production of biogas from the blank sample is the lowest with values ranging from 62.67 - 128.58 mLg-1VS than the cellulose standard and pineapple peels sample with values ranging from 689.77 - 742.27 mLg-1VS and 390.95 - 493.14 mLg-1TVS respectively. It was also observed that the production of biogas from the cellulose standard remains almost constant for the first 7 days while there was a steep increase in biogas production from the pineapple peels sample throughout the 21 days with a cumulative production rate of 493.14 mLg-1VS which is significantly higher than value for pineapple peel (31.70 ± 1.60 mLg-1vs) [21]. This high volume of biogas produced from the pineapple peel sample could be a result of the high %TS and %VS in the sample [16].
4.7. Determination of Biohydrogen Production Potential from the Biogas Yield
Table 9 shows the theoretical biohydrogen yield from methane in the biogas. Naturally, biogas from the anaerobic digestion process consists of a mixture of mainly (50–75%) methane (CH4), (19–34%) carbon dioxide (CO2), and trace amounts of other gases [10]. In this light, 53% methane from the biogas yield was assumed at 90% theoretical conversion efficiency. The number of moles produced is 0.214 moles and in terms of volume is 1045.84 mLg-1VS.
5. Conclusions
From this work, it can be established that the production of biohydrogen from pineapple peel waste by dark fermentation is feasible which can help combat the issue of proper management of pineapple peel waste and the associated environmental and health challenges. The ultimate and proximate analysis conducted shows similar results to other feedstock used for biohydrogen production. The ultimate analysis of the pineapple peels shows little sulfur and no nitrogen contents which is an indication of a good feedstock for biohydrogen production that will not pollute the environment during consumption. The theoretical biohydrogen production potential was estimated at 3.5 moles and in terms of volume is . The biogas test conducted shows a high biogas yield of 493.14 mlg-1VS after 21days which can be attributed to the fact that there are high total solids and volatile solids () and low lignin content (2.51%) in the pineapple peels. The estimated biohydrogen production from the biogas test is 1045.84 mLg-1VS. Biogas and biohydrogen could be used as alternative sources of energy to fossil fuels in mitigating climate change and helping accelerate the energy transition. This research will provide valuable baseline information to relevant stakeholders on biohydrogen production from pineapple peels by dark fermentation as a possible way of managing its waste.
Author Contributions
Abu Bakarr Bangura contributed to the entire write-up of this paper and Prof. Habil Satyanarayana Narra supervised the whole thesis.
Funding
Please add: “This research received no external funding” or “This research was funded by the GERMANY MINISTRY OF EDUCATION (BMBF) as a master’s program scholarship
Data Availability Statement
The original contributions presented in this study are included in the article/supplementary material. Further inquiries can be directed to the corresponding author(s)
Acknowledgments
I want to express my profound gratitude to the German Ministry of Education (BMBF) and WASCAL for scholarship awarded to me and also the presidents of both universities, Professor MAMADOU Saidou at Abmoumini University, Niger, and Professor KOKOROKO Dodzi Komla at the University of Lomé, Togo. “During the preparation of this manuscript/study, the author(s) used Optic digital microscope (LIBS Analyser) VHX-7000 for ultimate analysis. The authors have reviewed and edited the output and take full responsibility for the content of this publication.”
Conflicts of Interest
Declare conflicts of interest or state “The authors declare no conflicts of interest.”
Abbreviations
| ADE | Acid Detergent Fibre |
| ADL | Acid Detergent Lignin |
| NDF | Neutral Detergent Fibre |
| SMR | Steam Methane Reforming |
| WASCAL | West African Science Center on Climate Change and Adapted Land Use |
| WGS | Water Gas Shift Reaction |
Appendix A
Appendix A.1
Table A1.
Ultimate analysis Results of the sample.
| Element analysed | W% | |
|---|---|---|
| carbon | 44.4 |
|
| Oxygen Hydrogen Potassium Silicon Zinc |
40.9 9.4 3.6 0.9 0.008 |
Table A2.
Proximate analysis results of the sample (g).
| Mass of empty crucible | Total mass of crucible + sample | Total mass after drying (1050C) | Total mass after incineration (5500C) |
| 57.5887 | 72.7302 | 71.4757 | 58.3297 |
| 61.7273 | 75.7584 | 74.5498 | 61.9296 |
| 65.6857 | 79.9948 | 78.8016 | 66.3818 |
Table A3.
Ash analysis results of the sample (mol %).
| NO. | K | O | Ca | Si | Mg | Na | H | C | N | S | |
| 1 | 28.0 | 62.6 | 4.9 | 2.6 | 1.4 | 0.5 | 0.0 | 0.0 | 0.0 | 0.0 | |
| 2 | 10.9 | 38.6 | 3.4 | 3.2 | 1.5 | 0.2 | 0.0 | 0.027 | 0.0 | 0.395 | |
| 3 | 9.8 | 52.3 | 6.3 | 6.3 | 1.1 | 0.2 | 0.0 | 0.068 | 0.0 | 0.205 |
Table A4.
Fibre analysis results of the sample.
| TM in %FM | oTM in %FM | Ash in %FM | NDF | ADF | ADL |
| 91.7 | 86.8 | 4.9 | 27.93 | 11.01 | 2.51 |
References
- Abdullah, A., & Mat, H. (2008). CHARACTERISATION OF SOLID AND LIQUID PINEAPPLE WASTE. Reaktor, 12(1), 48. [CrossRef]
- Ahmed I. Osman, Tanmay J. Deka, Debendra C. Baruah, David W. Rooney (2020). Critical challenges in biohydrogen production processes from the organic feedstocks. Biomass Conversion and Biorefinery. [CrossRef]
- Amekan y., Wangi, D.S.A.P., Cahyanto, M.N., Sarto and Widada, J (2018). Effect of Different Inoculum Combination on Biohydrogen Production from Melon. Int. Journal of renewable energy development 101.
- Azevedo, A., Gominho, J., & Duarte, E. (2021). Performance of Anaerobic Co-digestion of Pig Slurry with Pineapple (Ananas comosus) Bio-waste Residues. Waste and Biomass Valorization, 12(1), 303–311. [CrossRef]
- Banerjee, S., Patti, A. F., Ranganathan, V., & Arora, A. (2019). Hemicellulose based biorefinery from pineapple peel waste: Xylan extraction and its conversion into xylooligosaccharides. Food and Bioproducts Processing, 117, 38–50. [CrossRef]
- Buxoo, S., & Jeetah, P. (2020). Feasibility of producing biodegradable disposable paper cups from pineapple peels, orange peels, and Mauritian hemp leaves with beeswax coating. SN Applied Sciences, 2(8), 1359. [CrossRef]
- Casabar, J. T., Unpaprom, Y., & Ramaraj, R. (2019). Fermentation of pineapple fruit peel wastes for bioethanol production. Biomass Conversion and Biorefinery, 9(4), 761–765. [CrossRef]
- Cahyari, K., Putri, A. M., Oktaviani, E. D., Hidayat, M. A., & Norajsha, J. D. (2018). Biohydrogen Production from Pineapple Waste: Effect of Substrate Concentration and Acid Pretreatment. IOP Conference Series: Materials Science and Engineering, 358, 012001. [CrossRef]
- Eixenberger, D., Carballo-Arce, A.-F., Vega-Baudrit, J.-R., Trimino-Vazquez, H., Villegas-Peñaranda, L. R., Stöbener, A., Aguilar, F., Mora-Villalobos, J.-A., Sandoval-Barrantes, M., Bubenheim, P., & Liese, A. (2022). Tropical agro-industrial biowaste revalorization through integrative biorefineries—review part II: Pineapple, sugarcane and banana by-products in Costa Rica. Biomass Conversion and Biorefinery. [CrossRef]
- Hamzah, A. F. A., Hamzah, M. H., Man, H. C., Jamali, N. S., Siajam, S. I., & Show, P. L. (2022). Biogas Production Through Mono- and Co-digestion of Pineapple Waste and Cow Dung at Different Substrate Ratios. BioEnergy Research. [CrossRef]
- https://wacomp.projects.ecowas.int/activities/national-level/togo/ last accessed on 09/03/2023. European Commission (2020). Pineapple value chain analysis in Togo. VCA4D.
- https://www.togofirst.com/en/agriculture/2111-10979-togo-produced-over-40-000-t-of-pineapples-in-2021. (Last accessed on 20th July, 2023).
- Jemilatu, Omuwa Audu, Eka, Latiffah Nadia Dzulkarnain, Zaharah, Ibrahim, Norahim, Ibrahim& Mohd, Firdaus Abdul-Wahab (2020). Microbial Identification and Extracellular Polymeric Substances. [CrossRef]
- Jey-R S. Ventura, Saul M. Rojas, Ruby Lynn G. Ventura, Fidel Rey P. Nayve Jr, Nacita B. Lantican (2021). Potential for biohydrogen production from organic wastes with focus on sequential dark- and photo-fermentation: the Philippine setting. Biomass Conversion and Biorefinery. [CrossRef]
- Junghare, M., Subudhi, S., & Lal, B. (2012). Improvement of hydrogen production under decreased partial pressure by newly isolated alkaline tolerant anaerobe, Clostridium butyricum TM-9A: Optimization of process parameters. International Journal of Hydrogen Energy, 37(4), 3160–3168. [CrossRef]
- Kelly Orhorhoro, E. (2017). Experimental Determination of Effect of Total Solid (TS) and Volatile Solid (VS) on Biogas Yield. American Journal of Modern Energy, 3(6), 131. [CrossRef]
- Kuppam Chandrasekhar, Yong-Jik Lee and Dong-Woo Lee (2015). Biohydrogen Production: Strategies to Improve Process Efficiency through Microbial Routes. Int. J. Mol. Sci. 2015, 16, 8266-8293. [CrossRef]
- Liu, Y., Min, J., Feng, X., He, Y., Liu, J., Wang, Y., He, J., Do, H., Sage, V., Yang, G., & Sun, Y. (2020). A Review of Biohydrogen Productions from Lignocellulosic Precursor via Dark Fermentation: Perspective on Hydrolysate Composition and Electron-Equivalent Balance. Energies, 13(10), 2451. [CrossRef]
- Mathew, S., Zakaria, Z. A., & Musa, N. F. (2015). Antioxidant property and chemical profile of pyroligneous acid from pineapple plant waste biomass. Process Biochemistry, 50(11), 1985–1992. [CrossRef]
- Mibulo, T., Nsubuga, D., Kabenge, I., Kiggundu, N., & Wydra, K. D. (2023). Comparative Study of Biogas Production from Jackfruit Waste, Banana Peels, and Pineapple Peels Co-Digested with Cow Dung. Journal of Sustainable Bioenergy Systems, 13(01), 1–15. [CrossRef]
- Muenmee, S., & Prasertboonyai, K. (2021). Potential Biogas Production Generated by Mono- and Co-digestion of Food Waste and Fruit Waste (Durian Shell, Dragon Fruit, and Pineapple Peel) in Different Mixture Ratio under Anaerobic Conditions. Environmental Research, Engineering and Management, 77(1), 25–35. [CrossRef]
- Nielsen, S. S. (2010). Determination of Moisture Content. In S. S. Nielsen (Ed.), Food Analysis Laboratory Manual (pp. 17–27). Springer US. [CrossRef]
- Ofomatah, A. C., Ugwu, K. E., & Ani, J. U. (2021). Biogas Production and Storage from Pig Dung Co-Digested with Pineapple Peel. IOP Conference Series: Earth and Environmental Science, 730(1), 012004. [CrossRef]
- Owoeye, T. F., Akinlabu, D. K., Ajayi, O. O., Afolalu, S. A., Popoola, J. O., & Ajani, O. O. (2022). Phytochemical constituents and proximate analysis of dry pineapple peels. IOP Conference Series: Earth and Environmental Science, 993(1), 012027. [CrossRef]
- Paepatung, N., Nopharatana, A., & Songkasiri, W. (2009). Bio-Methane Potential of Biological Solid Materials and Agricultural Wastes.
- Pereira, P. H. F., Ornaghi, H. L., Arantes, V., & Cioffi, M. O. H. (2021). Effect of chemical treatment of pineapple crown fiber in the production, chemical composition, crystalline structure, thermal stability, and thermal degradation kinetic properties of cellulosic materials. Carbohydrate Research, 499, 108227. [CrossRef]
- Reungsang, A., & Sreela-or, C. (2013). Bio-Hydrogen Production from Pineapple Waste Extract by Anaerobic Mixed Cultures. Energies, 6(4), 2175–2190. [CrossRef]
- Saidi, R., Liebgott, P. P., Hamdi, M., Auria, R., & Bouallagui, H. (2018). Enhancement of fermentative hydrogen production by Thermotoga maritima through hyperthermophilic anaerobic co-digestion of fruit-vegetable and fish wastes. International Journal of Hydrogen Energy, 43(52), 23168–23177. [CrossRef]
- Saratale, G. D., Saratale, R. G., Banu, J. R., & Chang, J.-S. (2019). Biohydrogen Production from Renewable Biomass Resources. In Biohydrogen (pp. 247–277). Elsevier. [CrossRef]
- Tiang, M. F., Fitri Hanipa, M. A., Abdul, P. M., Jahim, J. M. d., Mahmod, S. S., Takriff, M. S., Lay, C.-H., Reungsang, A., & Wu, S.-Y. (2020). Recent advanced biotechnological strategies to enhance photo-fermentative biohydrogen production by purple non-sulfur bacteria: An overview. International Journal of Hydrogen Energy, 45(24), 13211–13230. [CrossRef]
- Tsai, W.-T., Ayestas, R., Tsai, C.-H., & Lin, Y.-Q. (2022). Preparation and Characterization of Porous Materials from Pineapple Peel at Elevated Pyrolysis Temperatures. Materials, 15(13), 4686. [CrossRef]
- Yanan Yin and Jianlong Wang (2022). Production of biohydrogen. Biofuels and Biorefining. Elsevier (Pp 283-337). ISBN:978-0-12-824116-5. [CrossRef]
- Yun, Y.-M., Lee, M.-K., Im, S.-W., Marone, A., Trably, E., Shin, S.-R., Kim, M.-G., Cho, S.-K., & Kim, D.-H. (2018). Biohydrogen production from food waste: Current status, limitations, and future perspectives. Bioresource Technology, 248, 79–87. [CrossRef]
- Zainuddin, M. F., Shamsudin, R., Mokhtar, M. N., & Ismail, D. (2014). Physicochemical Properties of Pineapple Plant Waste Fibers from the Leaves and Stems of Different Varieties. BioResources, 9(3), 5311–5324. [CrossRef]
- Ozyuguran, A., Akturk, A., & Yaman, S. (2018). Optimal use of condensed parameters of ultimate analysis to predict the calorific value of biomass. Fuel, 214, 640–646. [CrossRef]
- Dahunsi, S. O. (2019). Liquefaction of pineapple peel: Pretreatment and process optimization. Energy, 185, 1017–1031. [CrossRef]
- Talapko. D, Talapko .J, Erić .I and Škrlec I. (2023). Biological Hydrogen Production from Biowaste Using Dark Fermentation, Storage, and Transportation.Energies 2023, 16(8), 3321; [CrossRef]
- Mansor, A.M., Theo, W.L., Lim, J.S., Ani, F.N., Hashim, H. and Ho, W.S., 2018. Potential commercialisation of biocoke production in Malaysia—A best evidence review. Renewable and sustainable energy reviews, 90, pp.636-649.
Disclaimer/Publisher’s Note: The statements, opinions and data contained in all publications are solely those of the individual author(s) and contributor(s) and not of MDPI and/or the editor(s). MDPI and/or the editor(s) disclaim responsibility for any injury to people or property resulting from any ideas, methods, instructions or products referred to in the content. |
© 2025 by the authors. Licensee MDPI, Basel, Switzerland. This article is an open access article distributed under the terms and conditions of the Creative Commons Attribution (CC BY) license (http://creativecommons.org/licenses/by/4.0/).
Copyright: This open access article is published under a Creative Commons CC BY 4.0 license, which permit the free download, distribution, and reuse, provided that the author and preprint are cited in any reuse.


