
Submitted:
02 September 2025
Posted:
03 September 2025
You are already at the latest version
Abstract
The Bactrian camel exemplifies mammalian adaptation to deserts, but the spatial organization of its innate immune system remains uncharacterized. This study integrated transcriptomes from 110 samples across 11 tissues to resolve tissue-specific gene expression and innate immune modularity. Through differential expression analysis, Tau specificity index (τ > 0.8), and machine learning validation (Random Forest F1-score = 0.86 ± 0.11), we identified 4,242 high-confidence tissue-specific genes (e.g., LIPE/PLIN1 in adipose). Weighted gene co-expression network analysis (WGCNA) of 1,522 innate immune genes revealed 11 co-expression modules, with six exhibiting significant tissue associations (FDR < 0.01): liver-specific (r = 0.96), spleen-adipose-enriched (r = 0.88), muscle-associated (r = 0.82), and blood-specific (r = 0.80) modules. These networks demonstrated multifunctional coordination of immune pathways—including Pattern Recognition, Cytokine Sig-naling, and Phagocytosis—rather than isolated functions. Our results establish that camel innate immunity is organized into spatially modular networks tailored to tissue microenvironments, providing the first systems-level framework for understanding immune resil-ience in desert-adapted mammals and may inform strategies for enhancing livestock re-silience in arid regions.
Keywords:
bactrian camel
; random forest
; innate immune gene
; gene co-expression network
; rna-seq
1. Introduction
Bactrian camels (Camelus bactrianus) exemplify extraordinary mammalian adaptation to extreme desert environments, enduring temperature fluctuations, water scarcity, and nutritional stress [1,2]. Their evolution of unique physiological systems to maintain homeostasis under chronic stressors positions them as ideal models for studying molecular adaptation, particularly in immune regulation across heterogeneous tissue environments [3,4].
Innate immunity—the first line of defense against pathogens—is critical for tissue integrity and systemic homeostasis [5,6]. Emerging evidence reveals that innate immune regulation is not monolithic but exhibits spatial heterogeneity, shaped by tissue-specific microenvironments, mechanical stresses, metabolic demands, and localized microbial exposure [7,8,9,10]. This spatial variation suggests modular organization of immune networks, where functionally coherent gene sets (modules) operate in a tissue-contextualized manner [7,11]. However, the mechanisms by which such spatial modularity governs innate immunity in extreme-environment adapted mammal remains unexplored, especially in non-model organisms like camels.
Advances in transcriptomics and systems biology now enable the comprehensive mapping of gene expression landscapes across tissues. Integrating these data with machine learning and network-based analyses like weighted gene co-expression network analysis (WGCNA) [12]—provides a powerful framework to uncover latent modular architectures, identify core regulatory genes, and delineate immune-functional units across tissues [13,14,15,16].
In this study, we characterize the spatial modularity of innate immune networks across 11 tissues of Bactrian camels. We integrated multi-tissue transcriptomics with differential expression, tissue-specificity indices, machine learning, and WGCNA to:(1) Identify tissue-specific gene signatures and functional markers defining tissue identity, (2) Detect innate immune-related co-expression modules and their hub genes, (3) Examine the tissue-level associations of these modules to reveal spatial immune network organization.
Our work establishes a foundational framework for spatially resolved immune adaptation in desert mammals and examines how environmental stress may relate to modular immune responses across tissues.
2. Materials and Methods
2.1. Transcriptome Data Sources
Peripheral blood collection and sequencing:
Whole blood samples (10 mL) were collected from the jugular vein of 10 adult domestic Bactrian camels in Alxa Left Banner, China. Samples were preserved in TRIzol reagent (TaKaRa) at −80°C prior to RNA extraction. Total RNA (1.0 μg per sample) was used to construct sequencing libraries with the TruSeq RNA Library Prep Kit v2 (Illumina). Polyadenylated mRNA was enriched by poly-T magnetic beads, fragmented, and converted to double-stranded cDNA. Libraries underwent end repair, A-tailing, adapter ligation, and PCR amplification. Quality was verified using an Agilent Bioanalyzer, followed by normalization and pooling.
Sequencing was performed on the Illumina NovaSeq 6000 platform (150-bp paired-end reads) using the TruSeq PE Cluster Kit v3-cBot-HS.
Public data curation:
Transcriptomic datasets from 100 additional camel tissue samples were retrieved from NCBI SRA (Projects: PRJNA471391, PRJNA857334, PRJNA485657, PRJNA416060). Tissues included: adipose (28), stomach (12 rumen, 5 reticulum, 2 abomasum), intestine (6 small intestine, 2 cecum), liver (8), kidney (7), spleen (7), skeletal muscle (7), heart (6), esophagus (5), and lung (5).
2.2. Transcriptome Data Processing
Raw reads were assessed using FastQC (v0.11.9) for base quality, GC content, and duplication levels. Adapters and low-quality reads (Q20 < 80% or N bases > 10%) were trimmed using Fastp [17] (v0.23.2).
Clean reads were aligned to the C.bactrianus reference genome (Ca_bactrianus_MBC_1.0) via HISAT2 [18,19] (v2.0.5) with default parameters. Alignments were sorted and converted to BAM format using Samtools [20] (v1.12). Transcript assembly and expression quantification (raw counts, TPM) were performed with StringTie [19] (v1.3.3).Gene expression levels were quantified using both raw gene counts and TPM (Transcripts Per Mil-lion), allowing for flexible downstream analysis.
2.3. Identification of Tissue-Specific Differentially Expressed Genes
Based on RNA-seq data from 110 samples across different camel tissues, we identified tissue-specific gene expression profiles. To enhance the efficiency and reliability of differential analysis, lowly expressed genes (expression count <10 in more than 80% of samples) were filtered out.
Batch effects were corrected using the ComBat algorithm, and differential expression analysis was conducted using DESeq2 (v1.38.3). Pairwise comparisons were performed between each tissue and all other tissues to identify uniquely expressed genes. Genes were considered differentially expressed if they met the following criteria: absolute log2 fold change (|log2FC|) > 1 and an adjusted P-value (Padj) < 0.05, corrected using the Benjamini–Hochberg method.
We also calculated the Tau index, which quantifies the tissue specificity of gene expression. Tau values range from 0 (ubiquitous expression) to 1 (exclusive expression in a single tissue). Genes with Tau > 0.8 were considered highly tissue-specific.
The Tau index was calculated as follows:
Where:
xi is the expression of a gene in tissue,
max(x) is the maximum expression across all tissues,
n is the total number of tissues.
2.4. Machine Learning-Based Identification of Tissue-Specific Genes
To refine the set of tissue-specific genes, we applied three machine learning models: Random Forest (RF), Extreme Gradient Boosting (XGBoost), and Support Vector Machine (SVM), using the gene set identified by both DESeq2 and the Tau index.
The dataset (110 samples) was partitioned into a training set (70%, n = 77) and a held-out test set (30%, n = 33). To address class imbalance in the training set, Synthetic Minority Over-sampling Technique (SMOTE) [21] was applied. Hyperparameter optimization was performed via 5-fold cross-validation on the training set. Final model performance was assessed on the independent test set using macro-averaged precision, recall, and F1-score. Confusion matrices comparing predicted versus true tissue labels.
All machine learning analyses were conducted in Python (v3.10). Data processing was done using Pandas (v1.5.3); model training and evaluation were performed using Scikit-learn (v1.2.2); visualizations were generated with Matplotlib (v3.7.1) and Seaborn (v0.12.2).
2.5. Construction of Innate Immune Gene Co-Expression Networks
Weighted Gene Co-expression Network Analysis (WGCNA) was employed to construct tissue-level co-expression networks for 1,522 innate immune-related genes across 11 tissues [12]. The identification process of the 1,522 innate immune genes is described in detail in an unpublished article [22]. Pairwise Pearson correlation coefficients were computed for all gene pairs, followed by transformation into a signed adjacency matrix using a soft-thresholding power β=12. This threshold was selected to achieve scale-free topology fit(R2>0.85). The adjacency matrix was subsequently converted to a Topological Overlap Matrix (TOM), which quantifies gene-pair similarity through both direct correlations and shared neighborhood connectivity. Hierarchical clustering with average linkage was performed on the TOM-based dissimilarity matrix (1-TOM), and co-expression modules were identified via dynamic hybrid tree cutting with a minimum module size of 20 genes. All analyses were implemented in R v4.2.2 using the WGCNA package v1.72.5. Resulting networks were exported to Cytoscape v3.10.2 for visualization.
2.6. Gene Enrichment Analysis
Functional enrichment analysis of selected gene sets was conducted using g:Profiler [23] (https://biit.cs.ut.ee/gprofiler/gost). This web-based platform integrates various biological data-bases, including Gene Ontology (GO), Kyoto Encyclopedia of Genes and Genomes (KEGG), Reactome, and transcription factor binding sites.
Statistical significance was determined by Benjamini-Hochberg false discovery rate (FDR) correction, with Padj < 0.05 considered significant. Only terms containing ≥5 annotated genes from the input set were analyzed.
3. Results
3.1. Overview of Transcriptome Data
A total of 100 transcriptome datasets from various Bactrian camel tissues were obtained from the NCBI Sequence Read Archive (SRA), along with 10 additional whole-blood transcriptomes generated in this study. In total, approximately 645 GB of raw sequencing data were collected. After quality control, the effective base rate reached 97.64%, with a Q30 ratio above 92.72% and a GC content exceeding 51.74%. On average, 91.85% of reads were aligned to the Bactrian camel reference genome (Ca_bactrianus_MBC_1.0), and about 80.26% of reads per sample were uniquely mapped. Following read alignment and quantification, genes not expressed in at least 80% of samples and with gene counts <10 were filtered out, resulting in 20,957 genes retained for downstream analysis.
3.2. Tissue-Specific Gene Expression
To systematically identify tissue-specific genes, we employed an integrated approach combining differential expression analysis, Tau index filtering, and machine learning-based classification.
First, the tissue distribution of TPM values for all 20,957 genes was examined. A global heterogeneity test using PERMANOVA revealed that tissue type significantly influenced gene expression profiles (R2 = 0.66, F = 19.2, P< 0.001), indicating substantial transcriptomic divergence across tissues (Figure 1).
Differential gene expression analysis was performed using DESeq2 for each of the 11 tissues. The number of tissue-specific DEGs identified were as follows: skeletal muscle (3,343), stomach (2,737), spleen (1,207), kidney (923), lung (666), liver (653), esophagus (513), intestine (483), adipose tissue (1,587), myocardium (372), and blood (162), totaling 12,646 differentially expressed genes (some redundantly counted across tissues).
Tau index analysis showed that approximately 77.2% of genes had Tau values between 0.5 and 1.0, indicating widespread tissue-specific expression bias. Using stringent criteria (Tau > 0.8 and con-firmed by DE analysis), a set of 4,242 high-confidence tissue-specific genes was identified (Table. S1).
To validate the discriminative power of these genes, multi-class classification models were trained using Random Forest (RF), XGBoost, and Support Vector Machine (SVM). Random Forest (RF) achieved peak performance (mean F1-score: 0.86 ± 0.11), with perfect classification (F1 = 1.00) for adipose, kidney, and spleen (Figure 2).
XGBoost showed elevated performance in lung (F1 = 0.83) and myocardium (F1 = 0.67), but higher variability (SD ± 0.21; Figure 3).
SVM demonstrated limited generalizability (mean F1 = 0.67), particularly in blood (recall = 0.50) and myocardium (recall = 0.60; Figure 4).
To further interpret the model, SHAP (SHapley Additive exPlanations) were used to analyze feature importance across the 11 tissue types. The top 20 most influential genes contributing to tissue classification are shown in Figure 5.
In adipose tissue (n = 28), LOC105074883, LIPE, and PLIN1 showed the highest SHAP contributions, consistent with their roles in lipid metabolism. In blood (n = 10), key genes included LOC105071890, PLEKHN1, and MYO1B, all showing SHAP values in the 0.004–0.007 range.
In esophagus (n = 5), SBK2, LOC123617879, and MYH8 were the dominant predictors, though sample scarcity led to greater SHAP dispersion. For intestine (n = 8), CADPS, MAB2112, and TAC1 showed strong positive impacts on classification. In kidney (n = 7), BSND, FMN1, and UMOD were top contributors, reflecting roles in ion transport and metabolism.
In liver (n = 8), core genes included PHKA2, INHBC, and F2, with SLC10A1 showing a linear in-crease in SHAP value relative to expression. In lung (n = 5), DNAAF3, TEKT2, and KLHDC8A had narrow SHAP ranges, and misclassification with myocardium was observed, possibly due to functional overlap.
Additional key drivers included CCDC181 and RAB33A in myocardium, CASQ1, MYPN, and LOC105079143 in skeletal muscle, RAMP3 and NIBAN3 in spleen, and BARX1, PITX1, and ATG9B in stomach.
3.3. Co-Expression Network of Innate Immunity Genes Across Tissues
To explore tissue-specific co-expression of innate immune genes, we performed Weighted Gene Co-expression Network Analysis (WGCNA) on the 1,522 expressed innate immune genes across 110 tissue samples. A soft-thresholding power of β = 14 was chosen to achieve scale-free topology (R2 = 0.85).
Eleven distinct co-expression modules were identified (Figure 6), with sizes ranging from 31 to 335 genes: black (88), blue (335), green (95), greenyellow (40), magenta (44), pink (282), purple (44), salmon (31), tan (35), and turquoise (209).
Six modules showed significant correlations with specific tissues (P < 0.01). For instance, the black module was highly correlated with liver (r = 0.96), but not with other tissues, suggesting a liver-specific immune regulatory function. Similarly, the pink module correlated strongly with spleen (r = 0.88), and also with adipose tissue (r = 0.88). The salmon module was associated with muscle (r = 0.82), the purple module with blood (r = 0.80), while the tan module had weaker correlation with gastrointestinal tissues (r = 0.53).
3.4. Tissue-Specific Innate Immunity Networks
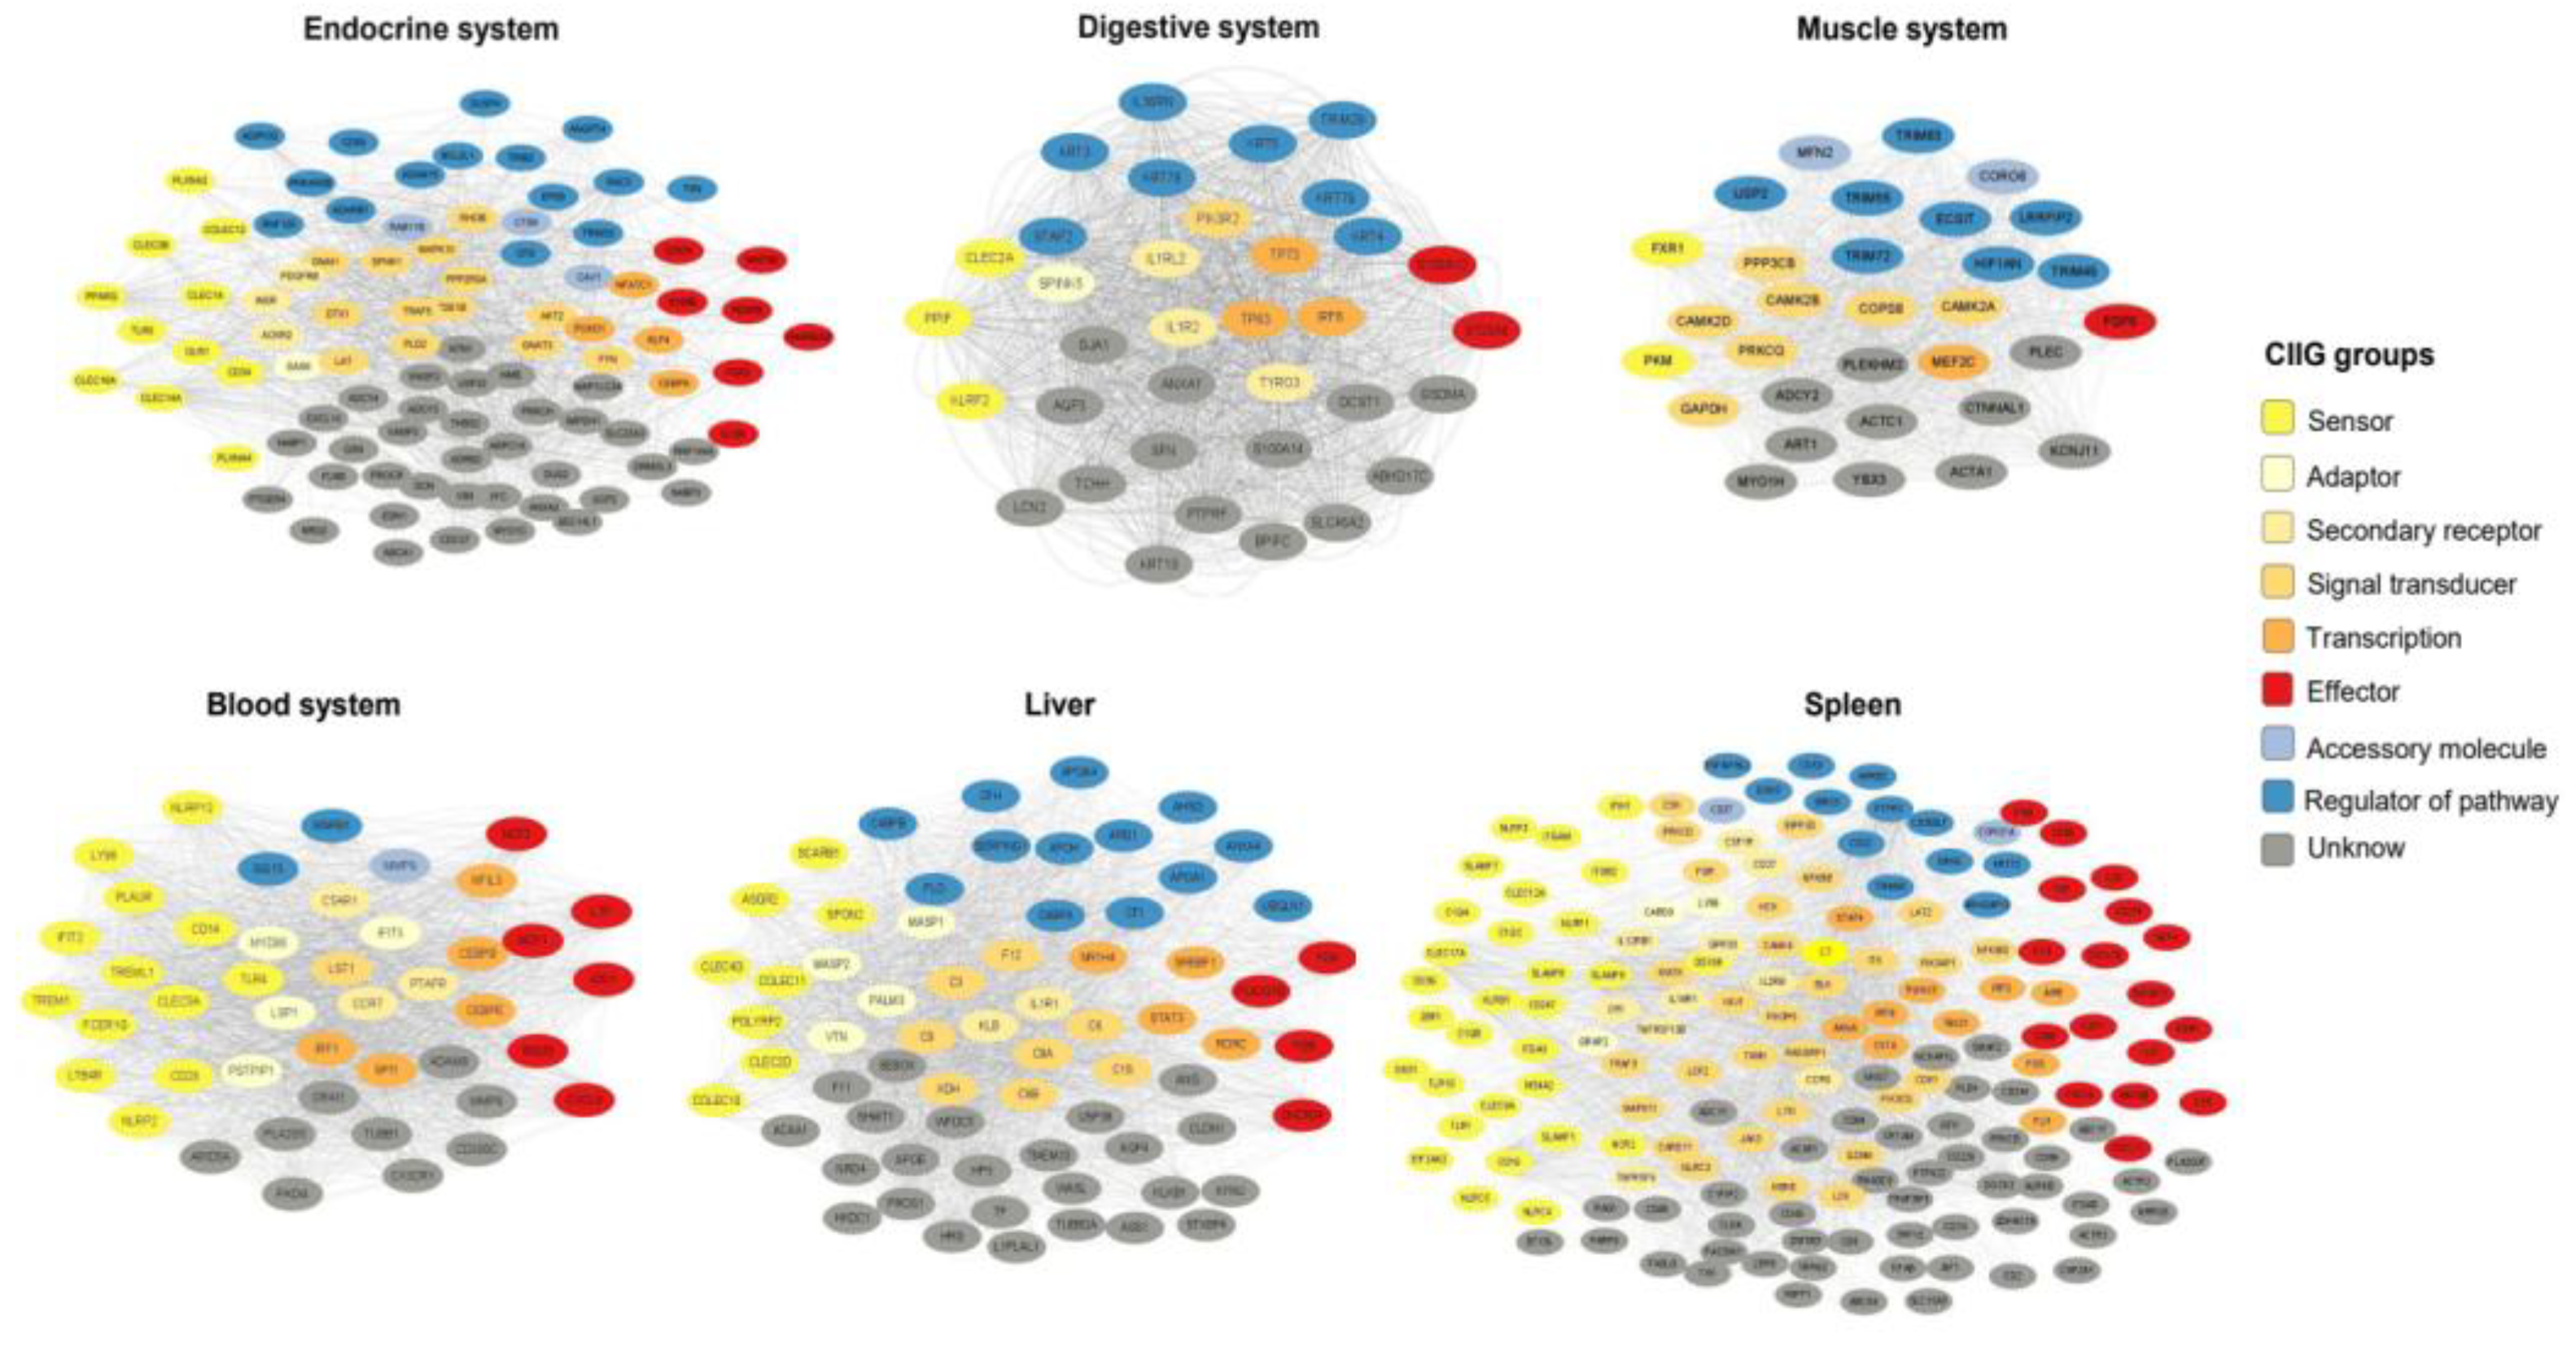
To elucidate functional coordination within tissue-associated modules, we constructed innate immunity co-expression networks for significant WGCNA modules (Figure 7). Networks were derived from topological overlap matrices (TOM) using tissue-specific edge thresholds to ensure biological relevance. For adipose tissue (green module; 24 genes), we identified 2,106 significant edges (TOM > 0.01, average threshold). Gastrointestinal (tan; 35 genes), muscle (salmon; 31 genes), and blood (purple; 44 genes) networks were constructed using average TOM thresholds, yielding 1,842, 1,570, and 1,955 edges respectively. Liver (black module; 88 genes) and spleen (pink; 282 genes) required higher stringency (TOM > 0.06 and > 0.18 respectively), resulting in 1,964 and 2,134 edges.
4. Discussion
This study integrates multi-tissue transcriptomic data with machine learning to systematically delineate the expression dynamics and regulatory networks of tissue-specific and innate immune genes in the Bactrian camel. Our findings reveal distinct transcriptional strategies underpinning tissue-level adaptation to extreme environments. By identifying high-confidence tissue-specific genes and characterizing spatially modular innate immune co-expression networks, we provide novel insights into the molecular mechanisms governing physiological specialization and immune function in this resilient species.
Our integrated approach, combining DESeq2-based differential expression analysis with Tau index filtering, identified 4,242 high-confidence tissue-specific genes. The functional distribution of these genes robustly reflects the core physiological specialization of each tissue. For instance, the adipose-specific high expression of LIPE (hormone-sensitive lipase) and PLIN1 (perilipin 1) – both exhibiting substantial SHAP contributions to tissue classification – not only signifies active lipolysis but also suggests a potential role, potentially coordinated with ADIPOQ (adiponectin), in mitigating chronic inflammation via NF-κB pathway suppression [24]. This mechanism appears crucial for balancing lipid mobilization and immune homeostasis under the energy-limited conditions typical of the Bactrian camel's habitat. Similarly, the high SHAP contribution of MYO1B (myosin IB) and PLEKHN1 in blood tissue underscores their importance as effector genes in lymphocyte polarization and neutrophil extracellular trap (NET) formation [25,26], respectively, highlighting their utility as biomarkers for dynamic immune cell states.
Critically, the Random Forest classifier, trained on these tissue-specific gene expression profiles, achieved exceptional performance (mean F1-score = 0.86). This not only validates the reliability of the identified gene set but also strongly supports the concept that transcriptomic profiles serve as robust biological signatures of tissue identity and functional state. SHAP value analysis further elucidated the key genetic drivers of tissue classification, offering mechanistic insights into the molecular basis of tissue-specific functions.
Weighted Gene Co-expression Network Analysis (WGCNA) of 1,522 expressed innate immune genes across 110 samples identified 11 co-expression modules, six of which exhibited significant correlations with specific tissues (P<0.01). This striking pattern demonstrates a pronounced spatial modularity in innate immune regulation, where transcriptional programs are tailored to the unique microenvironmental pressures, pathogen exposures, and metabolic demands encountered by each tissue [27].
The liver's dominant correlation with the black module aligns with its dual role as a central metabolic/detoxification organ and a key immunological site. This module likely encodes pathways for hepatic immune tolerance induction and inflammation modulation in response to exogenous and endogenous stressors [28]. As a primary lymphoid organ, the spleen's strong association with the pink module reflects finely tuned gene expression programs essential for pathogen clearance and immunological memory formation [29]. Correlation with the green module supports adipose tissue's endocrine function in systemic immune regulation, potentially mediated through adipokine and cytokine signaling [30]. The muscle-associated salmon module potentially governs immune functions critical for tissue repair, inflammation control, and metabolic adaptation within musculature [31]. The blood-specific purple module likely mirrors the functional status and compositional heterogeneity of circulating immune cells [32]. The weaker but significant correlation with the tan module suggests the existence of a dedicated immune network within the GI tract, presumably adapted to manage the complex luminal microbiota and antigenic load.
Analysis of the tissue-specific co-expression networks (Figure 7) revealed a key organizational principle: innate immune pathways within each tissue are orchestrated by multifunctional gene networks rather than dominated by single gene classes [33,34,35]. Genes representing diverse functional categories – including Pattern Recognition (e.g., TLRs, NLRs), Cytokine Signaling, Complement System, Phagocytosis, Antimicrobial Peptides, Inflammasome components, Cell Adhesion/Migration, and Immunoregulation – were intricately interconnected within each tissue-associated module. This coordinated activity, evident in networks from the gastrointestinal tract, muscle, and blood, suggests an integrated functional response [36,37,38]. Such complex network architectures likely enable tissues to optimize responses to local stimuli while simultaneously preserving tissue homeostasis, representing a sophisticated adaptation for maintaining organismal integrity under environmental stress.
Collectively, these findings establish a crucial foundational framework for understanding the molecular basis of the Bactrian camel's extraordinary resilience. The identified gene signatures, characterized co-expression modules, and resolved tissue-specific networks provide essential resources for future investigations. These include functional validation of key genes (e.g., via knockdown/overexpression), mechanistic studies of tissue-specific immune adaptations (e.g., hepatic tolerance, splenic memory, adipose-immune crosstalk), and exploration of the genetic underpinnings of this species' unique environmental adaptations.
5. Conclusions
Multi-tissue transcriptomics revealed spatially organized innate immunity in Bactrian camels. We identified 4,242 tissue-specific genes validated by machine learning and discovered six functionally distinct immune modules (via WGCNA) strongly associated with liver, spleen, blood, muscle, adipose, and gut tissues. These modules demonstrate cross-pathway integration as a core mechanism maintaining tissue immune homeostasis. This pioneering construction of multi-tissue co-expression networks decodes the spatial immune adaptation underlying camel resilience to extreme environments.
Supplementary Materials
The following supporting information can be downloaded at the website of this paper posted on Preprints.org., Table S1: 4,242 high-confidence tissue-specific genes.
Author Contributions
Conceptualization, W.Z. and L.G.; methodology, L.G.; software, B.L.; validation, L.Z.; formal analysis, L.G.; investigation, L.G.; resources, W.Z.; data curation, C.C.; writing—original draft preparation, L.G.; writing—review and editing, W.Z.; visualization, L.G.; supervision, F.M.; project administration, W.Z.; funding acquisition, W.Z. All authors have read and agreed to the published version of the manuscript.
Funding
This work was supported by Major special projects of Inner Mongolia Autonomous Region (No.2019ZD016).
Institutional Review Board Statement
The animal study protocol was approved by the Inner Mongolia Agricultural University Laboratory Animal Welfare and Ethics Committee (No: NND2023110).
Acknowledgments
We are grateful for sampling assistance of Caixia Shi, Man Da, Na Risu, Mingjuan Gu and Ling Zhu.
Conflicts of Interest
The authors declare that the research was conducted in the absence of any commercial or financial relationships that could be construed as a potential conflict of interest.
References
- Wu, H.; Guang, X.; Al-Fageeh, M.B.; Cao, J.; Pan, S.; Zhou, H.; Zhang, L.; AbuTarboush, M.H.; Xing, Y.; Xie, Z.; et al. Camelid genomes reveal evolution and adaptation to desert environments. Nat. Commun. 2014, 5, 5188. [Google Scholar] [CrossRef]
- Rocha, J.L.; Godinho, R.; Brito, J.C.; Nielsen, R. Life in Deserts: The Genetic Basis of Mammalian Desert Adaptation. Trends Ecol. Evol. 2021, 36, 637–650. [Google Scholar] [CrossRef]
- Hussen, J.; Schuberth, H.-J. Recent Advances in Camel Immunology. Front. Immunol. 2021, 11. [Google Scholar] [CrossRef]
- Seida, A.; Hassan, M.; Abdulkarim, A.; Hassan, E. Recent progress in camel research. Open Veter- J. 2024, 14, 2877–2882. [Google Scholar] [CrossRef] [PubMed]
- Mass, E.; Nimmerjahn, F.; Kierdorf, K.; Schlitzer, A. Tissue-specific macrophages: how they develop and choreograph tissue biology. Nat. Rev. Immunol. 2023, 23, 563–579. [Google Scholar] [CrossRef]
- Gray, J.I.; Farber, D.L. Tissue-Resident Immune Cells in Humans. Annu. Rev. Immunol. 2022, 40, 195–220. [Google Scholar] [CrossRef]
- Conde, C.D.; Xu, C.; Jarvis, L.B.; Rainbow, D.B.; Wells, S.B.; Gomes, T.; Howlett, S.K.; Suchanek, O.; Polanski, K.; King, H.W.; et al. Cross-tissue immune cell analysis reveals tissue-specific features in humans. Science 2022, 376, 713. [Google Scholar] [CrossRef]
- Du, H.; Bartleson, J.M.; Butenko, S.; Alonso, V.; Liu, W.F.; Winer, D.A.; Butte, M.J. Tuning immunity through tissue mechanotransduction. Nat. Rev. Immunol. 2022, 23, 174–188. [Google Scholar] [CrossRef] [PubMed]
- Caputa, G.; Castoldi, A.; Pearce, E.J. Metabolic adaptations of tissue-resident immune cells. Nat. Immunol. 2019, 20, 793–801. [Google Scholar] [CrossRef]
- Mishra, A.; Lai, G.C.; Yao, L.J.; Aung, T.T.; Shental, N.; Rotter-Maskowitz, A.; Shepherdson, E.; Singh, G.S.N.; Pai, R.; Shant, A.; et al. Microbial exposure during early human development primes fetal immune cells. 2021. [Google Scholar] [CrossRef]
- Russell, M.; Aqil, A.; Saitou, M.; Gokcumen, O.; Masuda, N.; Fu, F. Gene communities in co-expression networks across different tissues. PLOS Comput. Biol. 2023, 19, e1011616. [Google Scholar] [CrossRef]
- Langfelder, P.; Horvath, S. WGCNA: an R package for weighted correlation network analysis. BMC Bioinform. 2008, 9, 559. [Google Scholar] [CrossRef]
- Divate, M.; Tyagi, A.; Richard, D.J.; Prasad, P.A.; Gowda, H.; Nagaraj, S.H. Deep Learning-Based Pan-Cancer Classification Model Reveals Tissue-of-Origin Specific Gene Expression Signatures. Cancers 2022, 14, 1185. [Google Scholar] [CrossRef]
- Eisen, M.B.; Spellman, P.T.; Brown, P.O.; Botstein, D. Cluster analysis and display of genome-wide expression patterns. Proc. Natl. Acad. Sci. USA 1998, 95, 14863–14868. [Google Scholar] [CrossRef]
- Yap, M.; Johnston, R.L.; Foley, H.; MacDonald, S.; Kondrashova, O.; Tran, K.A.; Nones, K.; Koufariotis, L.T.; Bean, C.; Pearson, J.V.; et al. Verifying explainability of a deep learning tissue classifier trained on RNA-seq data. Sci. Rep. 2021, 11, 1–12. [Google Scholar] [CrossRef] [PubMed]
- Mishra, B.; Kumar, N.; Mukhtar, M.S. Network biology to uncover functional and structural properties of the plant immune system. Curr. Opin. Plant Biol. 2021, 62, 102057. [Google Scholar] [CrossRef]
- Chen, S.; Zhou, Y.; Chen, Y.; Gu, J. fastp: an ultra-fast all-in-one FASTQ preprocessor. Bioinformatics 2018, 34, i884–i890. [Google Scholar] [CrossRef]
- Kim, D.; Langmead, B.; Salzberg, S.L. HISAT: A fast spliced aligner with low memory requirements. Nat. Methods 2015, 12, 357–360. [Google Scholar] [CrossRef]
- Pertea, M.; Kim, D.; Pertea, G.M.; Leek, J.T.; Salzberg, S.L. Transcript-level expression analysis of RNA-seq experiments with HISAT, StringTie and Ballgown. Nat. Protoc. 2016, 11, 1650–1667. [Google Scholar] [CrossRef]
- Li, H. , Handsaker, B., Wysoker, A., Fennell, T., Ruan, J., Homer, N. The Sequence Alignment/Map format and SAMtools. Bioinformatics 2009, 25, 2078–2079. [Google Scholar] [CrossRef] [PubMed]
- Fernandez, A.; Garcia, S.; Herrera, F.; Chawla, N.V. SMOTE for Learning from Imbalanced Data: Progress and Challenges, Marking the 15-year Anniversary. J. Artif. Intell. Res. 2018, 61, 863–905. [Google Scholar] [CrossRef]
- Guo, L.; Liu, Z.; Dai, L.; et al. CRISPR-Cas9 Screening and Simulated Infection Transcriptomic Identify Key Drivers of Innate Immunity in Bactrian Camels. BMC genomics. n.d., in press.
- Kolberg, L.; Raudvere, U.; Kuzmin, I.; et al. g:Profiler-interoperable web service for functional enrichment analysis and gene identifier mapping. Nucleic Acids Res. 2023, 51, W207–W212. [Google Scholar] [CrossRef]
- Quarta, S.; Scoditti, E.; Carluccio, M.A.; Calabriso, N.; Santarpino, G.; Damiano, F.; Siculella, L.; Wabitsch, M.; Verri, T.; Favari, C.; et al. Coffee Bioactive N-Methylpyridinium Attenuates Tumor Necrosis Factor (TNF)-α-Mediated Insulin Resistance and Inflammation in Human Adipocytes. Biomolecules 2021, 11, 1545. [Google Scholar] [CrossRef] [PubMed]
- Yu, X.; Noll, R.R.; Dueñas, B.P.R.; Allgood, S.C.; Barker, K.; Caplan, J.L.; Machner, M.P.; LaBaer, J.; Qiu, J.; Neunuebel, M.R. Legionella effector AnkX interacts with host nuclear protein PLEKHN1. BMC Microbiol. 2018, 18, 1–14. [Google Scholar] [CrossRef] [PubMed]
- Ohmura, G.; Tsujikawa, T.; Yaguchi, T.; Kawamura, N.; Mikami, S.; Sugiyama, J.; Nakamura, K.; Kobayashi, A.; Iwata, T.; Nakano, H.; et al. Aberrant Myosin 1b Expression Promotes Cell Migration and Lymph Node Metastasis of HNSCC. Mol. Cancer Res. 2015, 13, 721–731. [Google Scholar] [CrossRef]
- Weisberg, S.P.; Ural, B.B.; Farber, D.L. Tissue-specific immunity for a changing world. Cell 2021, 184, 1517–1529. [Google Scholar] [CrossRef] [PubMed]
- Racanelli, V.; Rehermann, B. The liver as an immunological organ. Hepatology. 2006, 43, S54–62. [Google Scholar] [CrossRef] [PubMed]
- Bronte, V.; Pittet, M.J. The Spleen in Local and Systemic Regulation of Immunity. Immunity 2013, 39, 806–818. [Google Scholar] [CrossRef]
- Ouchi, N.; Parker, J.L.; Lugus, J.J.; Walsh, K. Adipokines in inflammation and metabolic disease. Nat. Rev. Immunol. 2011, 11, 85–97. [Google Scholar] [CrossRef]
- Tidball, J.G. Regulation of muscle growth and regeneration by the immune system. Nat. Rev. Immunol. 2017, 17, 165–178. [Google Scholar] [CrossRef]
- Zheng, P.-F.; Zou, Q.-C.; Chen, L.-Z.; Liu, P.; Liu, Z.-Y.; Pan, H.-W. Identifying patterns of immune related cells and genes in the peripheral blood of acute myocardial infarction patients using a small cohort. J. Transl. Med. 2022, 20, 1–18. [Google Scholar] [CrossRef]
- Tegnér, J.; Nilsson, R.; Bajic, V.B.; et al. Systems biology of innate immunity. Cellular Immunology. 2006, 244, 105–109. [Google Scholar] [CrossRef] [PubMed]
- Prasad, K.; Khatoon, F.; Rashid, S.; Ali, N.; AlAsmari, A.F.; Ahmed, M.Z.; Alqahtani, A.S.; Alqahtani, M.S.; Kumar, V. Targeting hub genes and pathways of innate immune response in COVID-19: A network biology perspective. Int. J. Biol. Macromol. 2020, 163, 1–8. [Google Scholar] [CrossRef] [PubMed]
- Subramanian, N.; Torabi-Parizi, P.; Gottschalk, R.A.; Germain, R.N.; Dutta, B. Network representations of immune system complexity. Wiley Interdiscip. Rev. Syst. Biol. Med. 2015, 7, 13–38. [Google Scholar] [CrossRef]
- Inouye, M.; Silander, K.; Hamalainen, E.; Salomaa, V.; Harald, K.; Jousilahti, P.; Männistö, S.; Eriksson, J.G.; Saarela, J.; Ripatti, S.; et al. An Immune Response Network Associated with Blood Lipid Levels. PLOS Genet. 2010, 6, e1001113. [Google Scholar] [CrossRef]
- Casals, F.; Sikora, M.; Laayouni, H.; Montanucci, L.; Muntasell, A.; Lazarus, R.; Calafell, F.; Awadalla, P.; Netea, M.G.; Bertranpetit, J. Genetic adaptation of the antibacterial human innate immunity network. BMC Evol. Biol. 2011, 11, 1–11. [Google Scholar] [CrossRef]
- Green, N.; Walker, J.; Bontrager, A.; Zych, M.; Geisbrecht, E.R. A tissue communication network coordinating innate immune response during muscle stress. J. Cell Sci. 2018, 131, jcs.217943. [Google Scholar] [CrossRef] [PubMed]
Figure 1.
Transcriptomic landscape across Bactrian camel tissues. (a) Non-metric multidimensional scaling (NMDS) plot of tissue-specific gene expression profiles, points represent individual samples, colored by tissue type; (b) Distribution of tissue-specific expression levels by box plot.
Figure 1.
Transcriptomic landscape across Bactrian camel tissues. (a) Non-metric multidimensional scaling (NMDS) plot of tissue-specific gene expression profiles, points represent individual samples, colored by tissue type; (b) Distribution of tissue-specific expression levels by box plot.
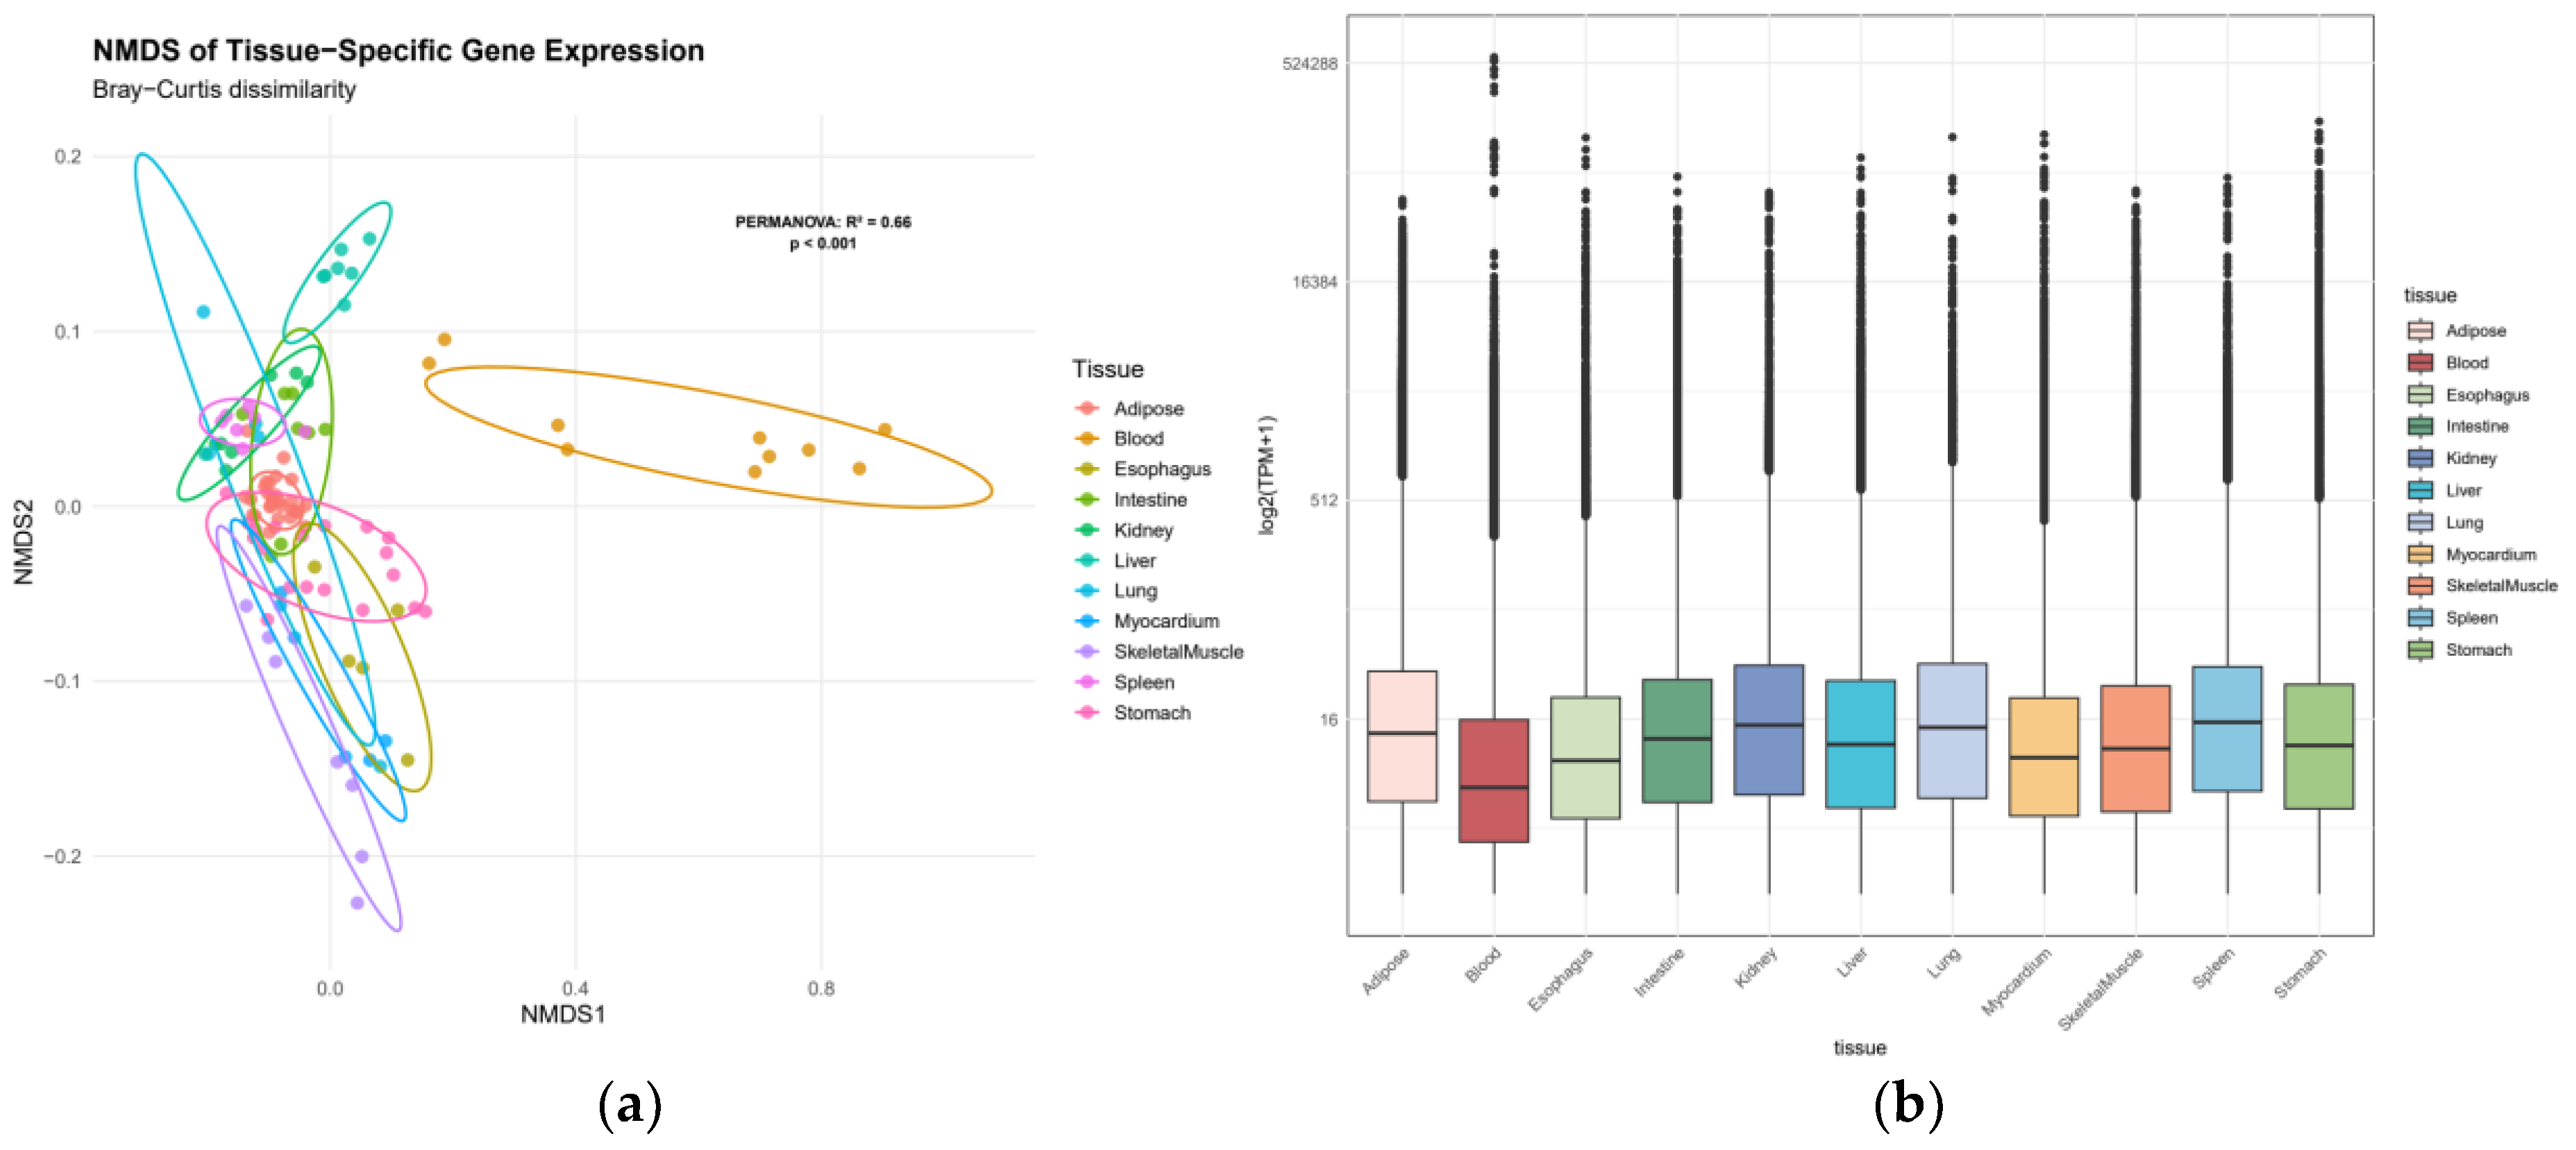
Figure 2.
Heatmap of tissue classification performance using Random Forest algorithm.
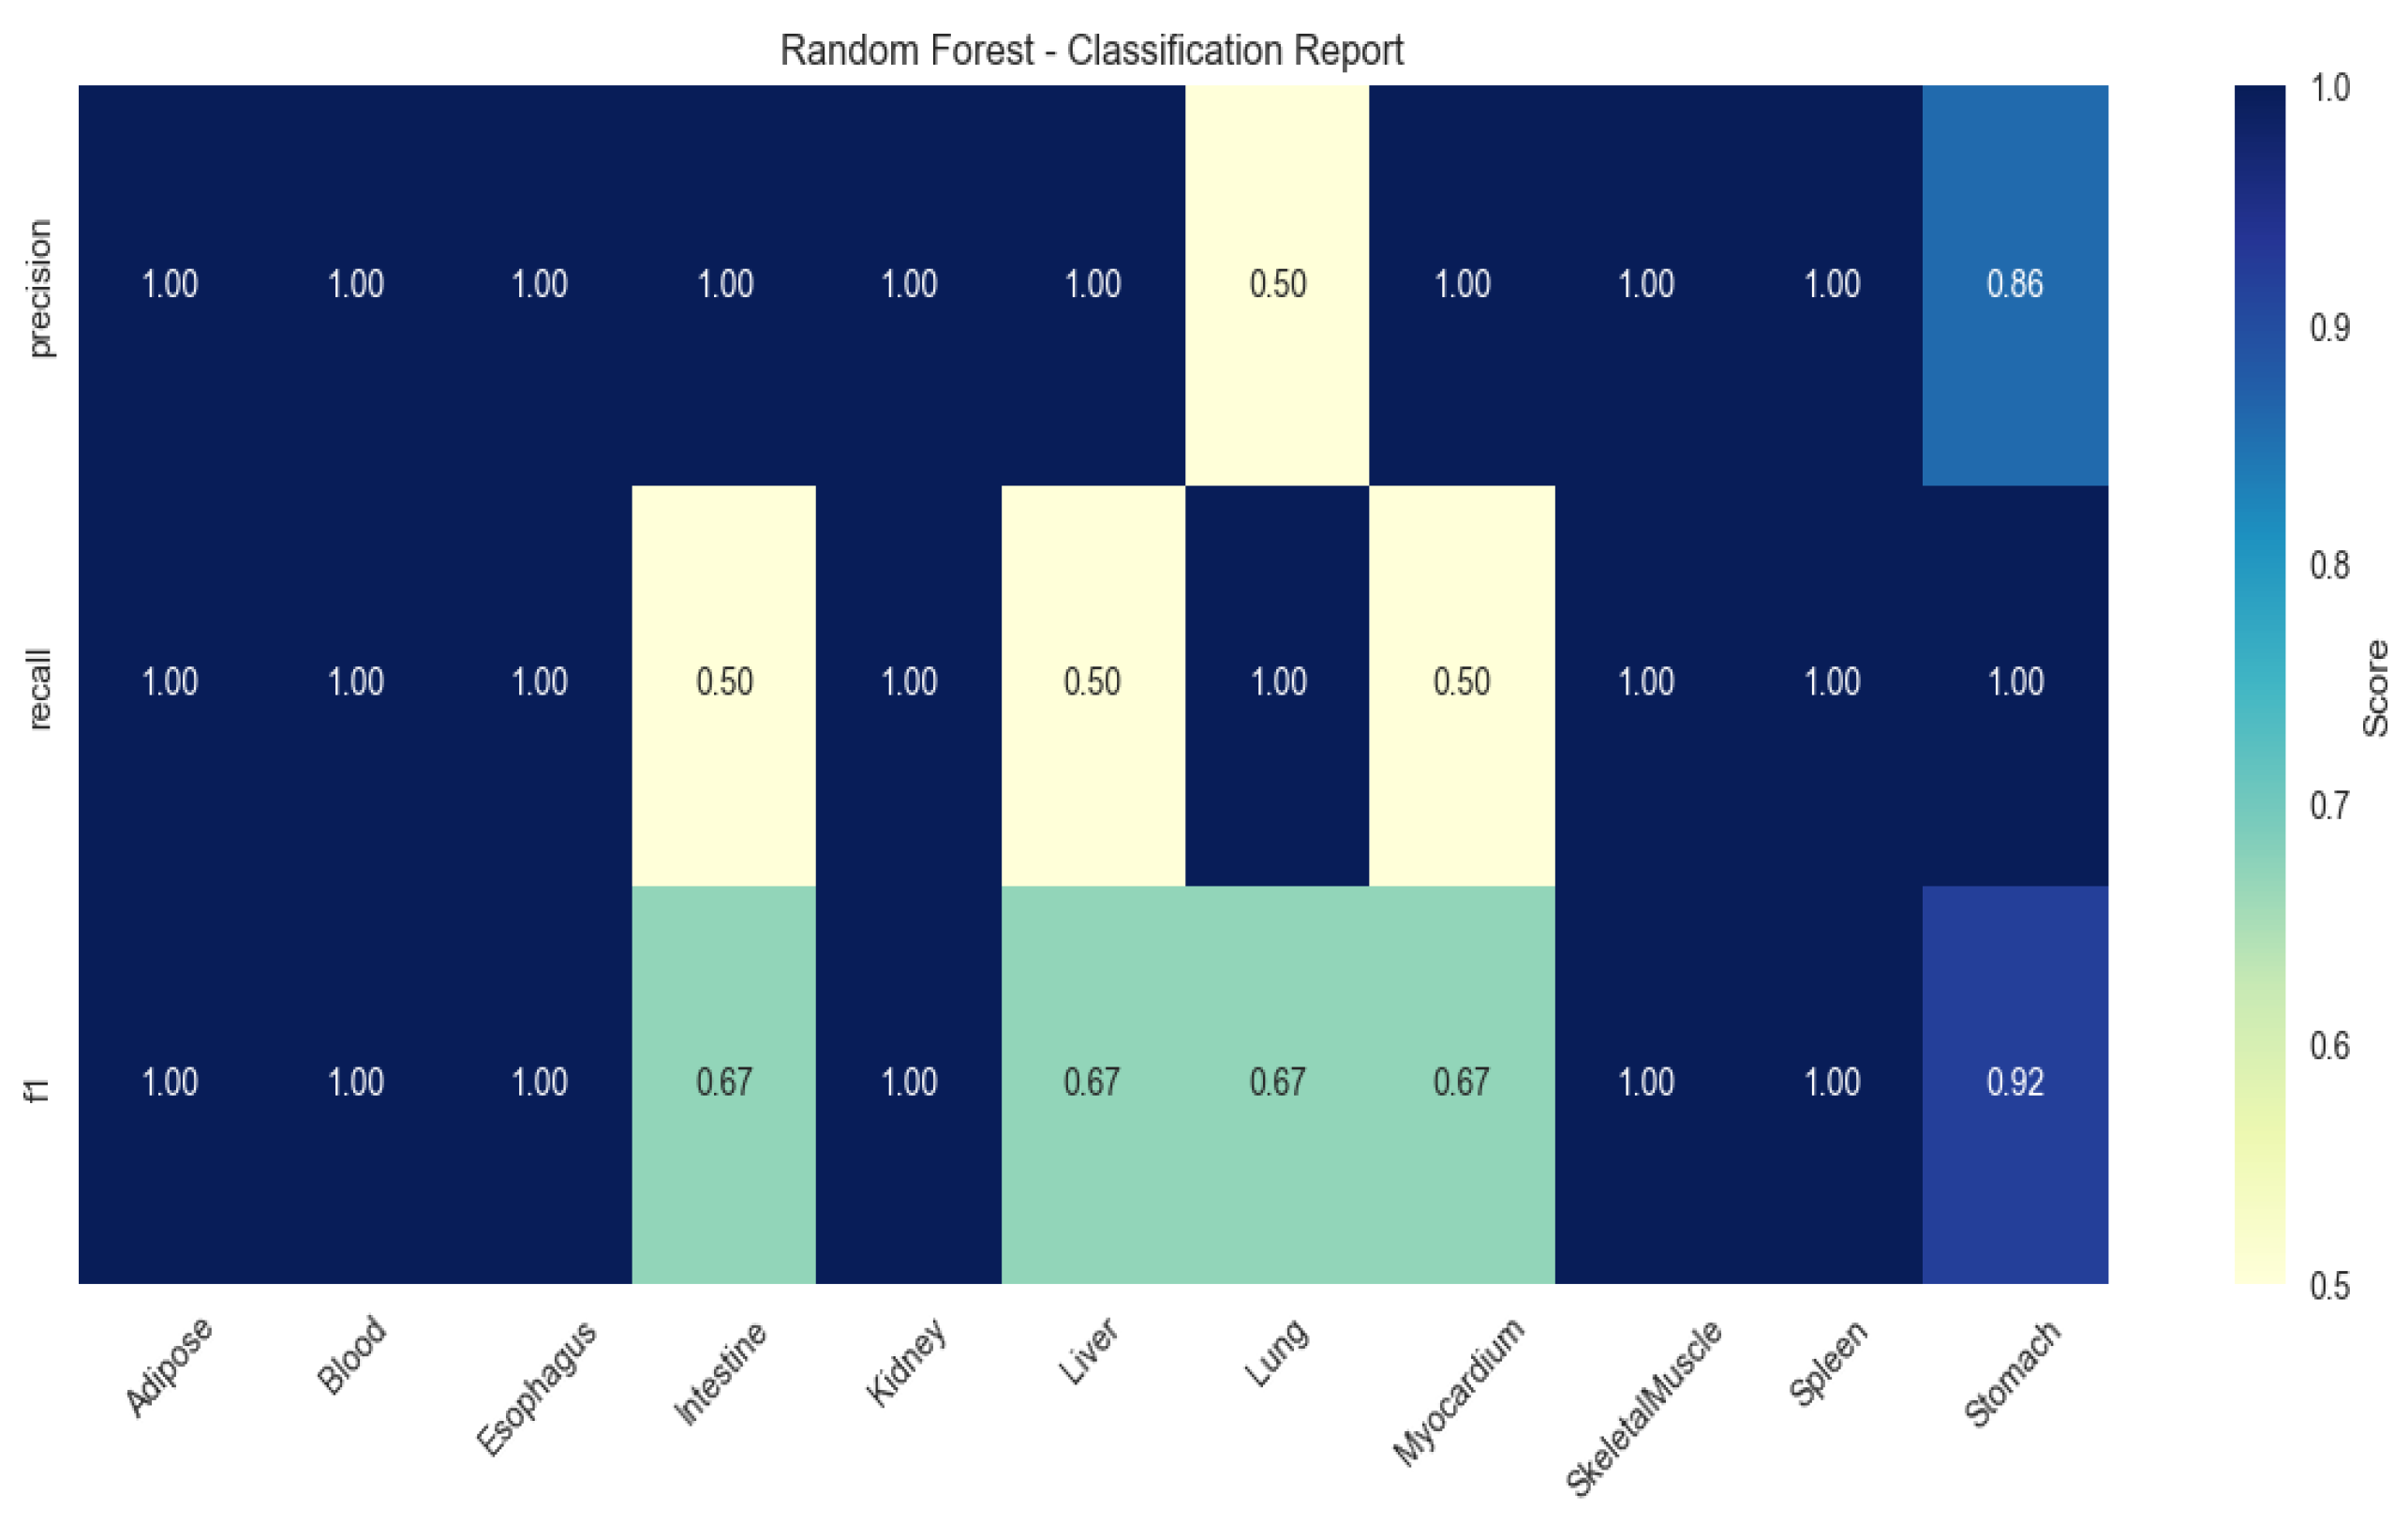
Figure 3.
Heatmap of tissue classification performance using XGBoost algorithm.
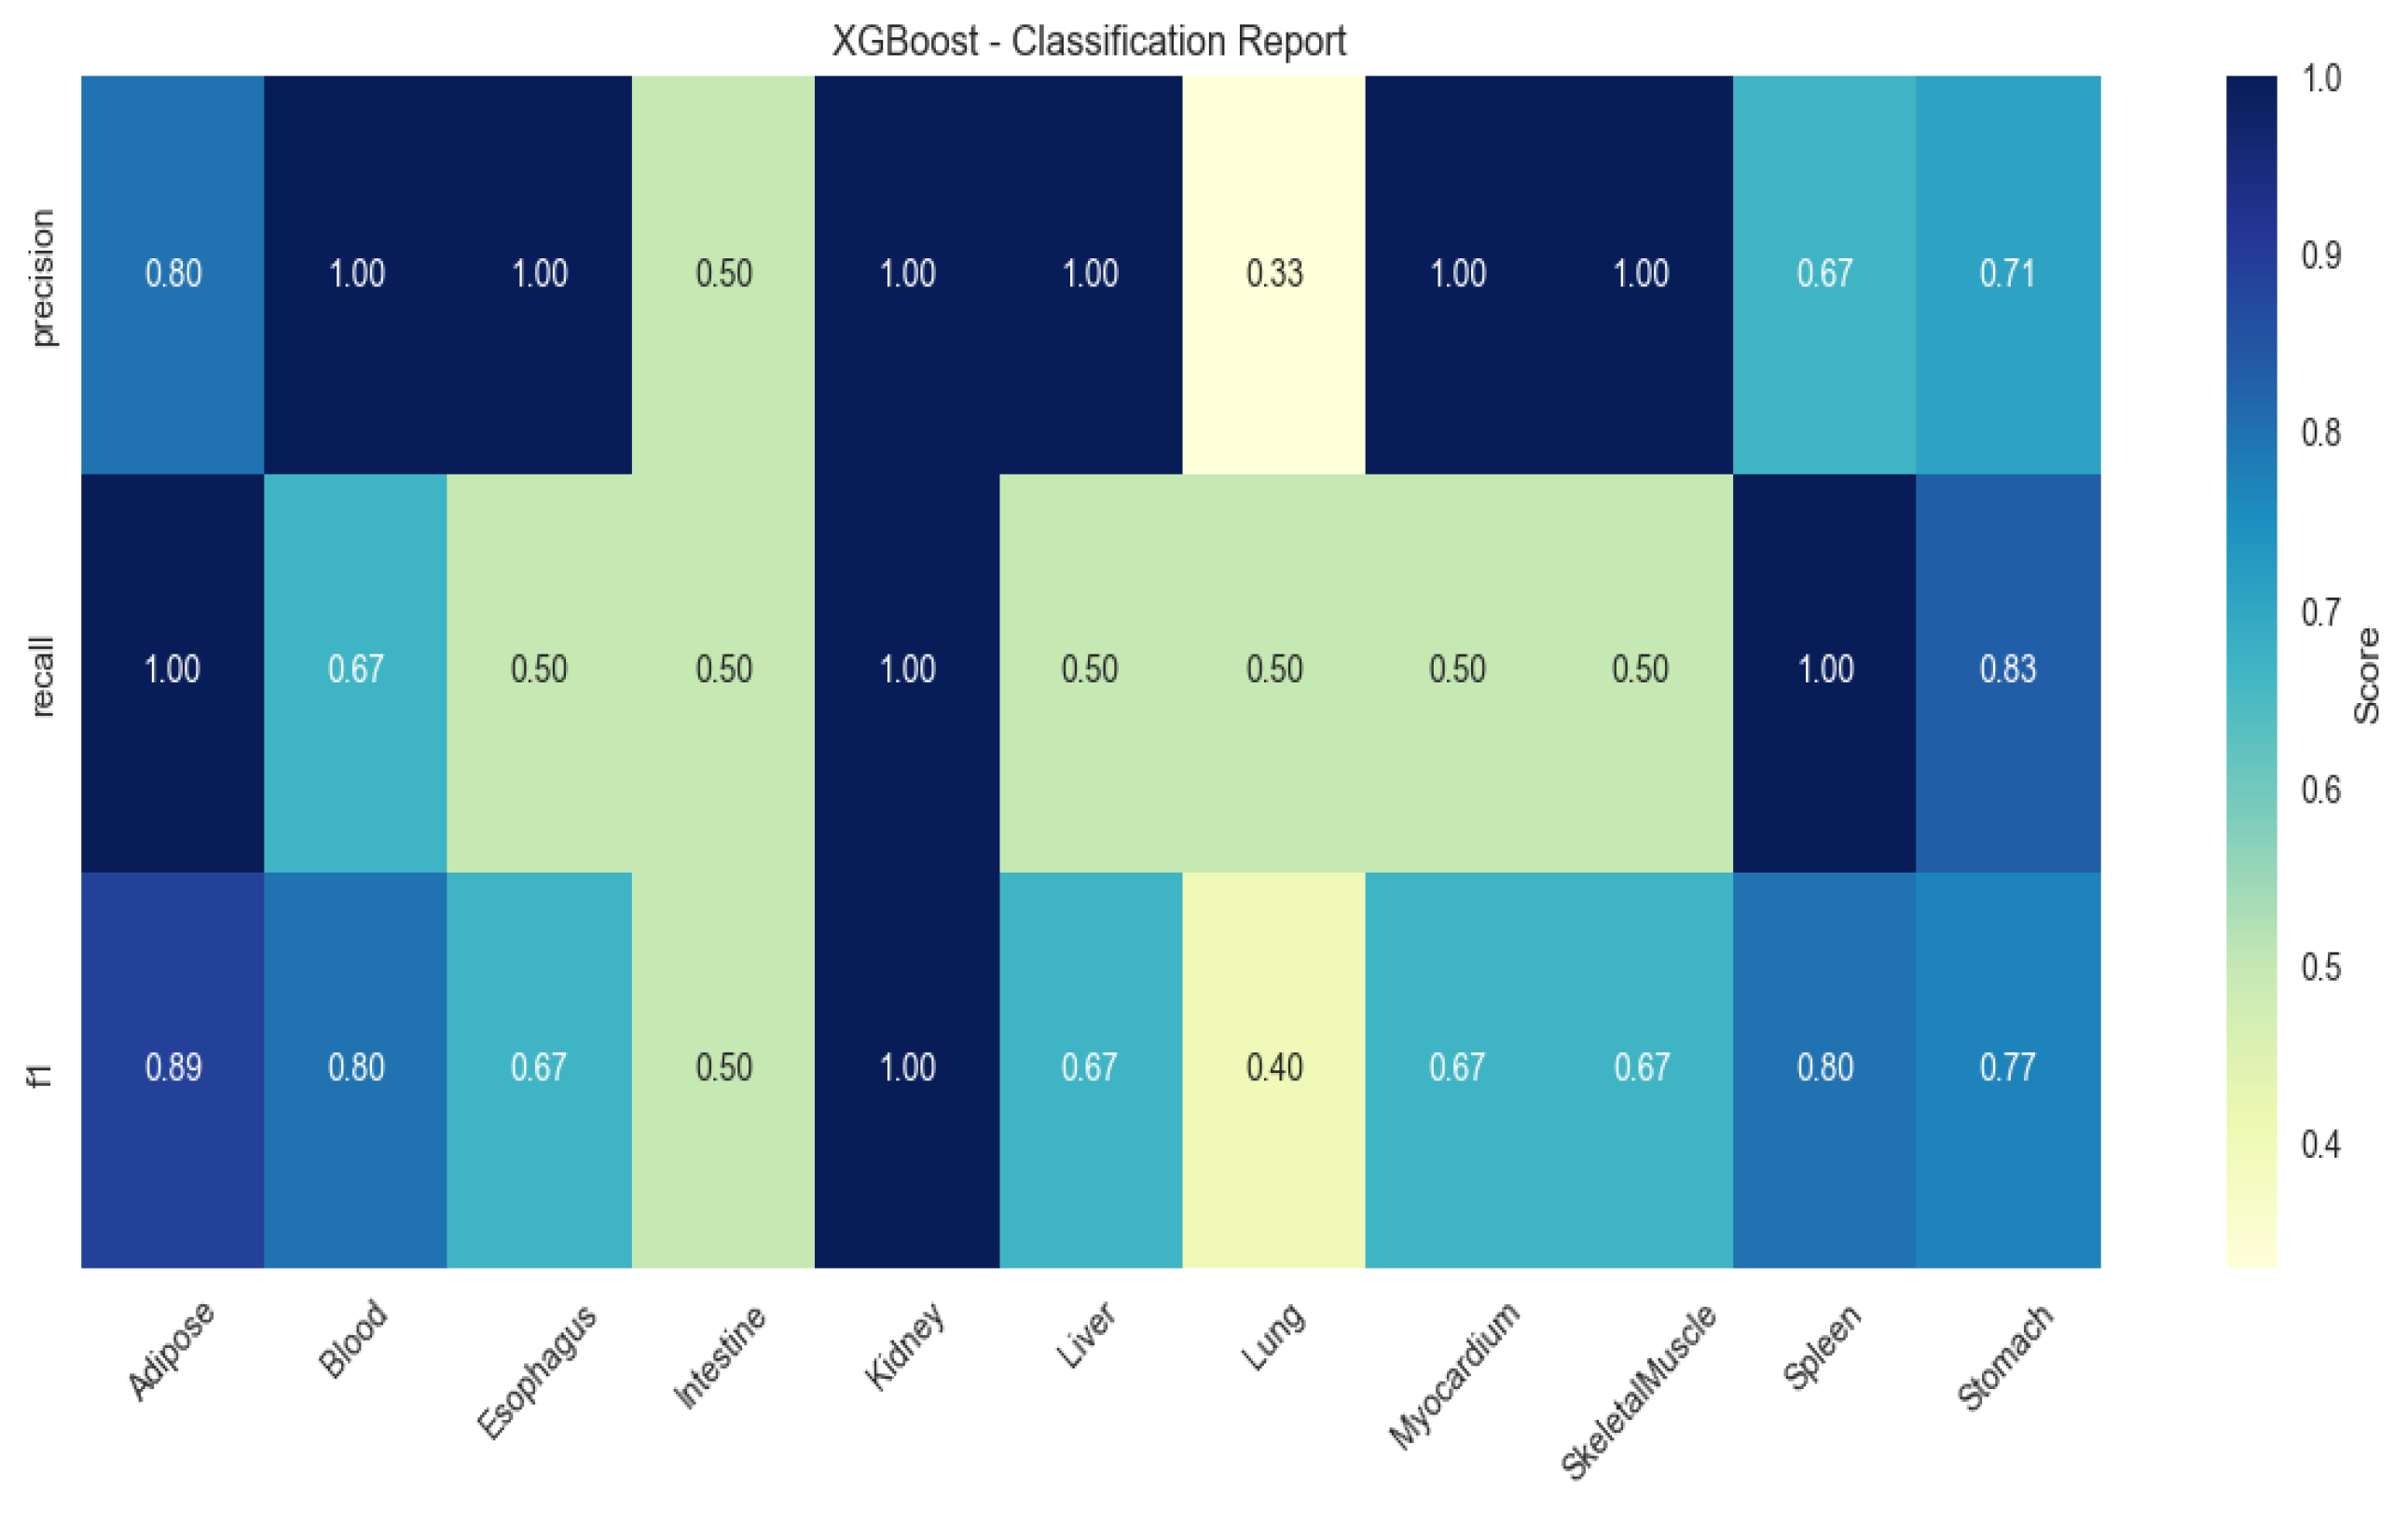
Figure 4.
Heatmap of tissue classification performance using Support Vector Machine (SVM) algorithm.
Figure 4.
Heatmap of tissue classification performance using Support Vector Machine (SVM) algorithm.
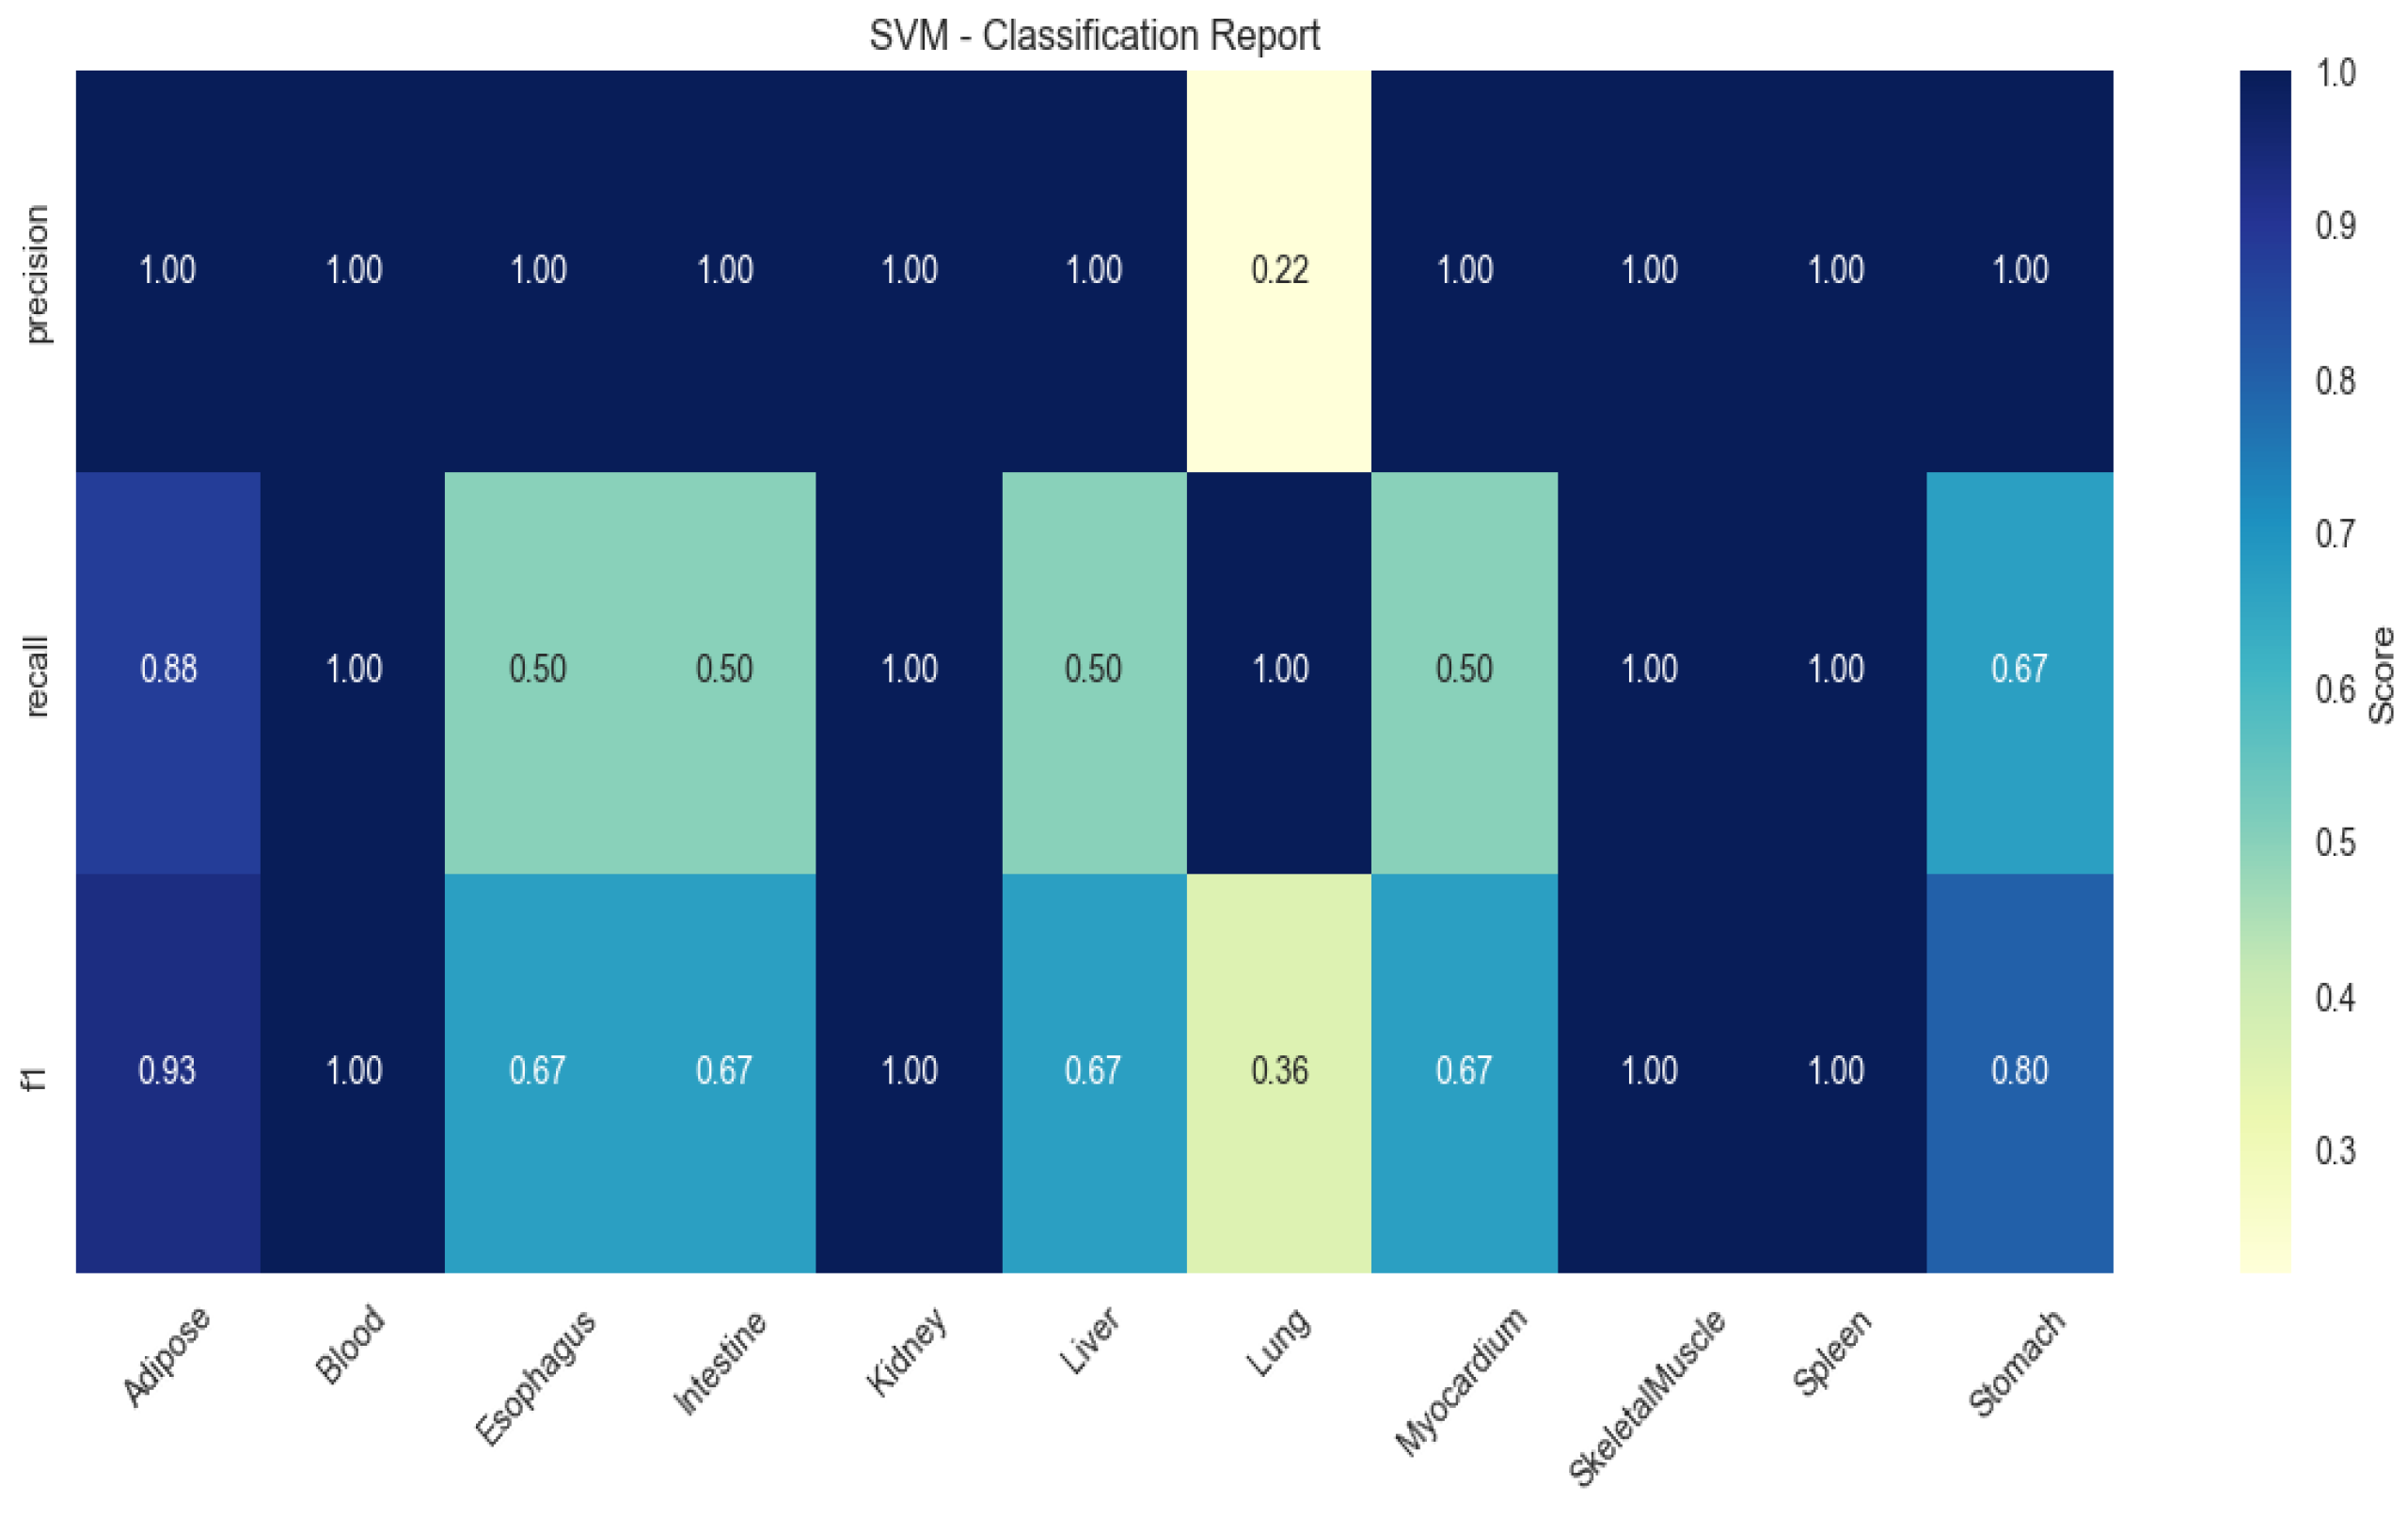
Figure 5.
SHAP value distribution of top discriminative genes across 11 tissues. Genes are ranked vertically by mean absolute SHAP value (most influential at top). Each point represents an individual sample, colored by normalized gene expression level (red: high expression, blue: low expression).
Figure 5.
SHAP value distribution of top discriminative genes across 11 tissues. Genes are ranked vertically by mean absolute SHAP value (most influential at top). Each point represents an individual sample, colored by normalized gene expression level (red: high expression, blue: low expression).
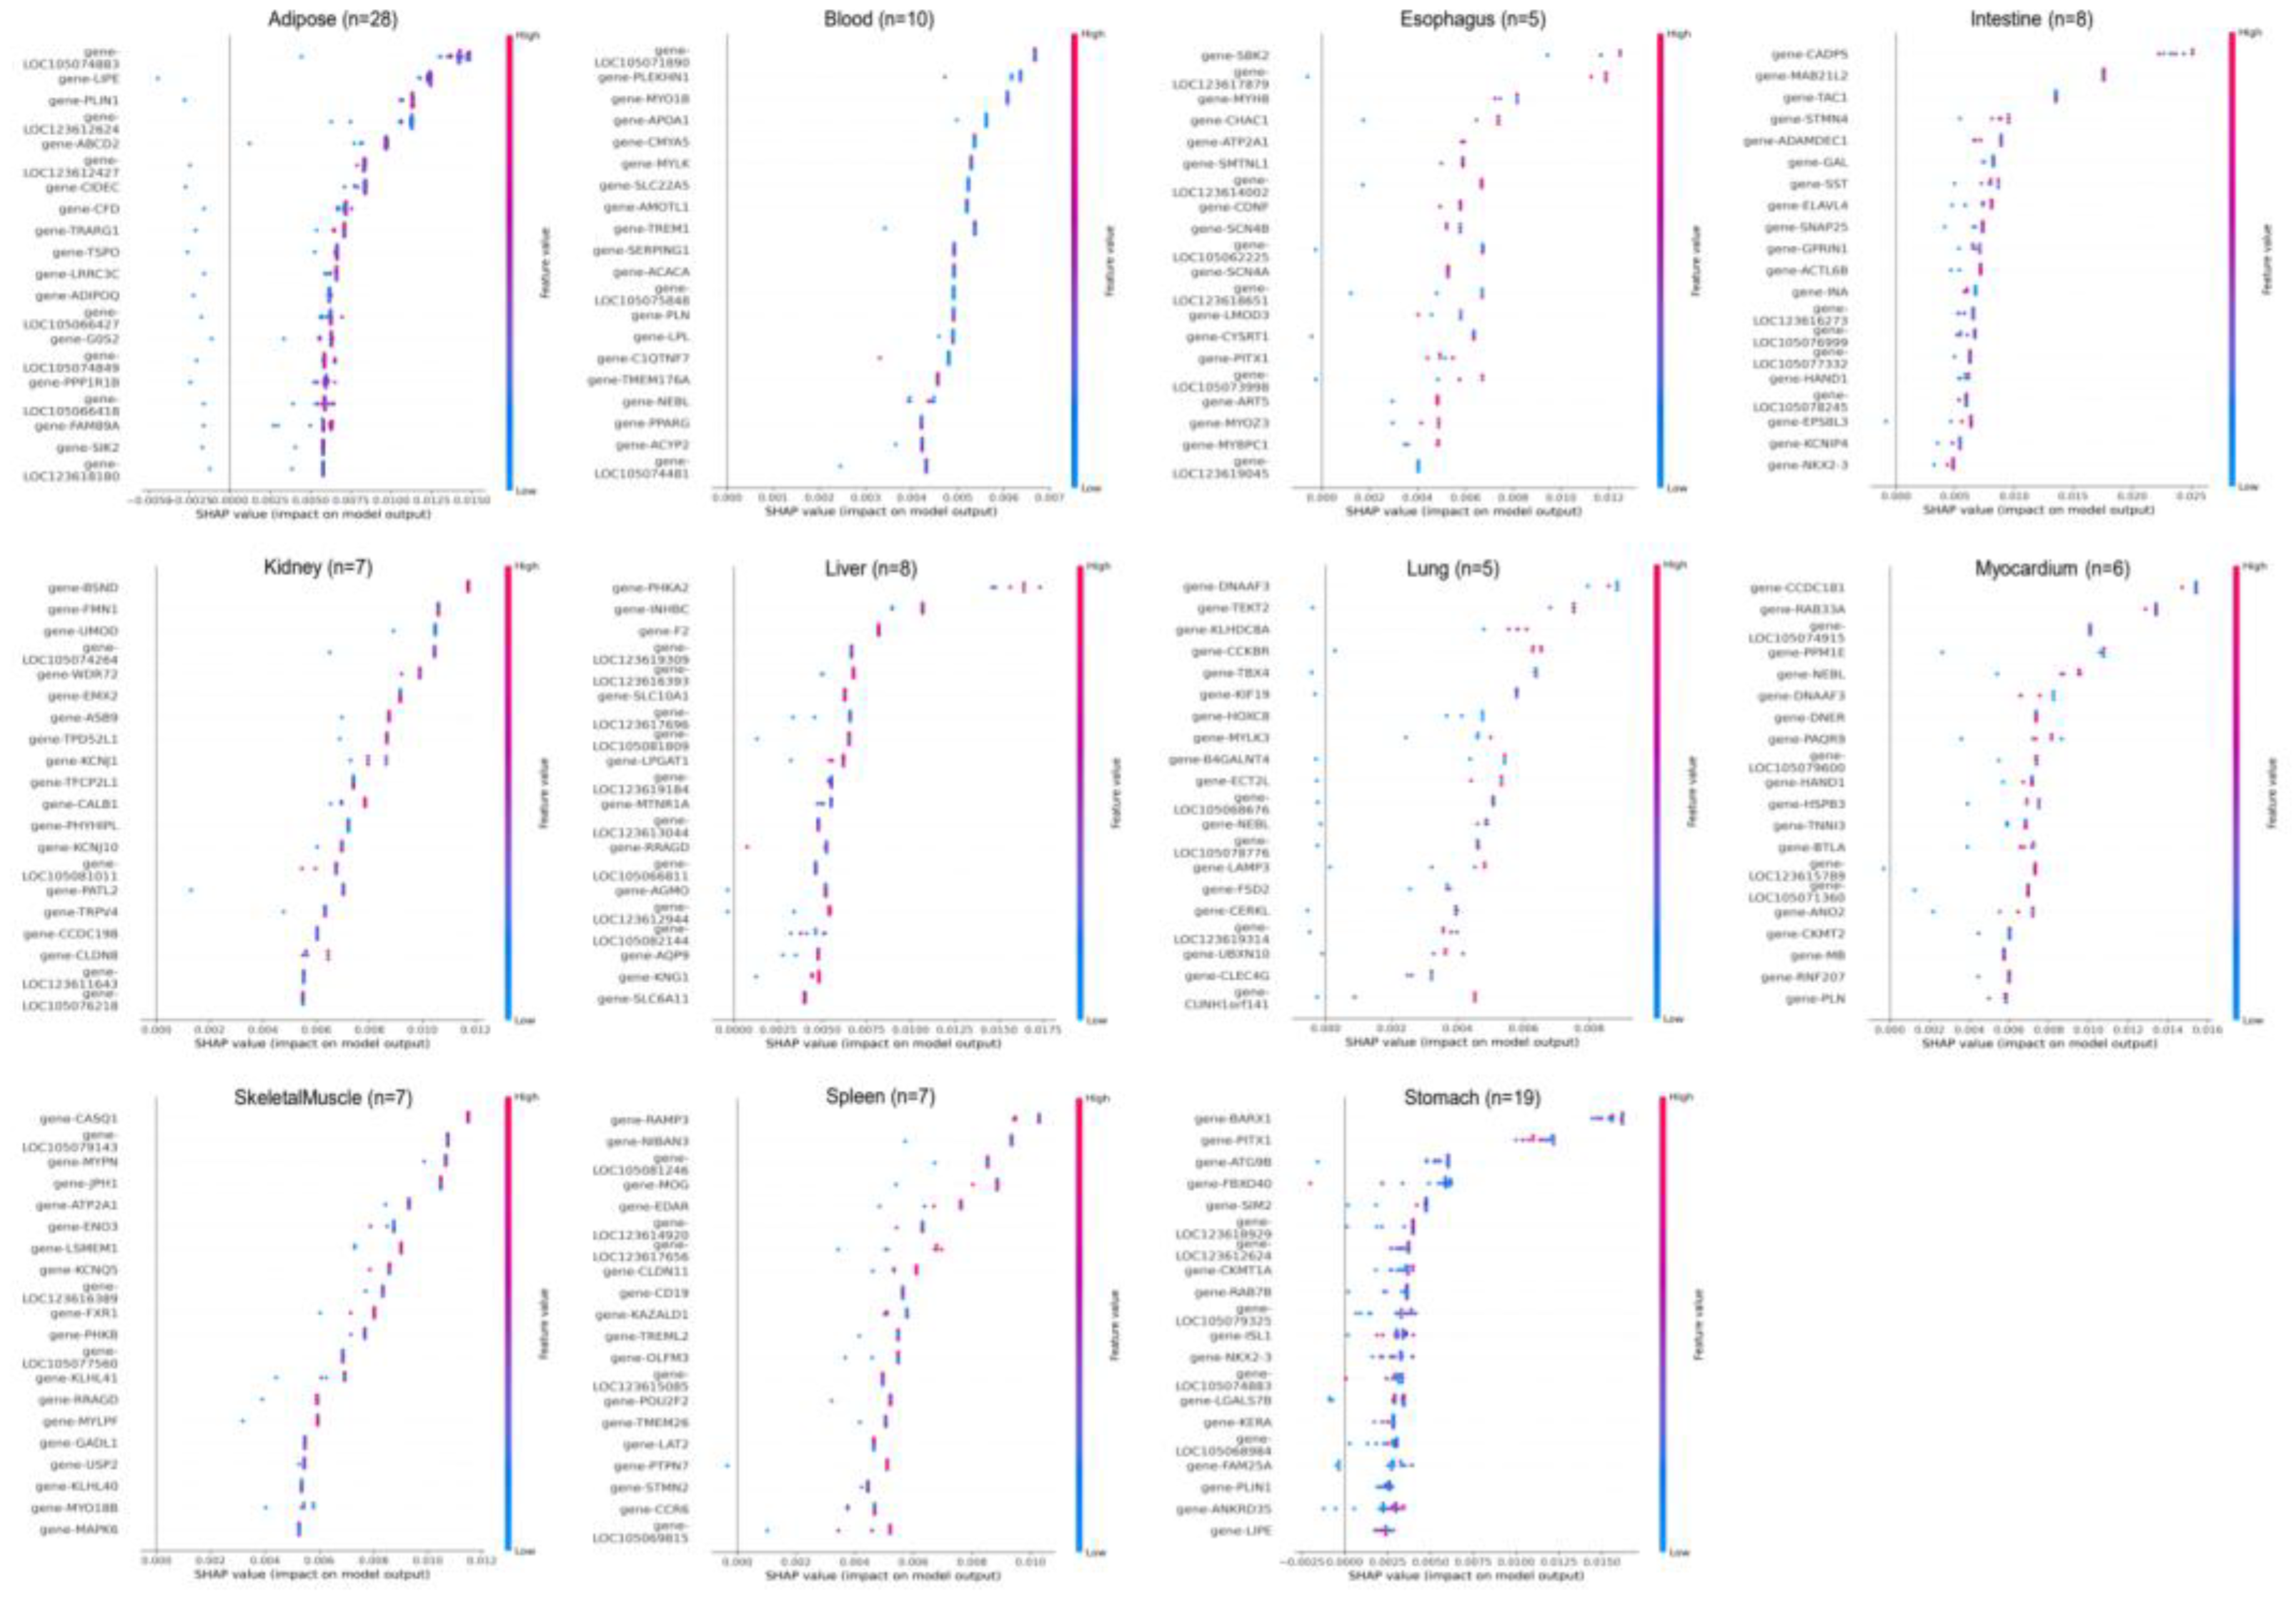
Figure 6.
Correlation between innate immunity gene expression clusters and tissue types.
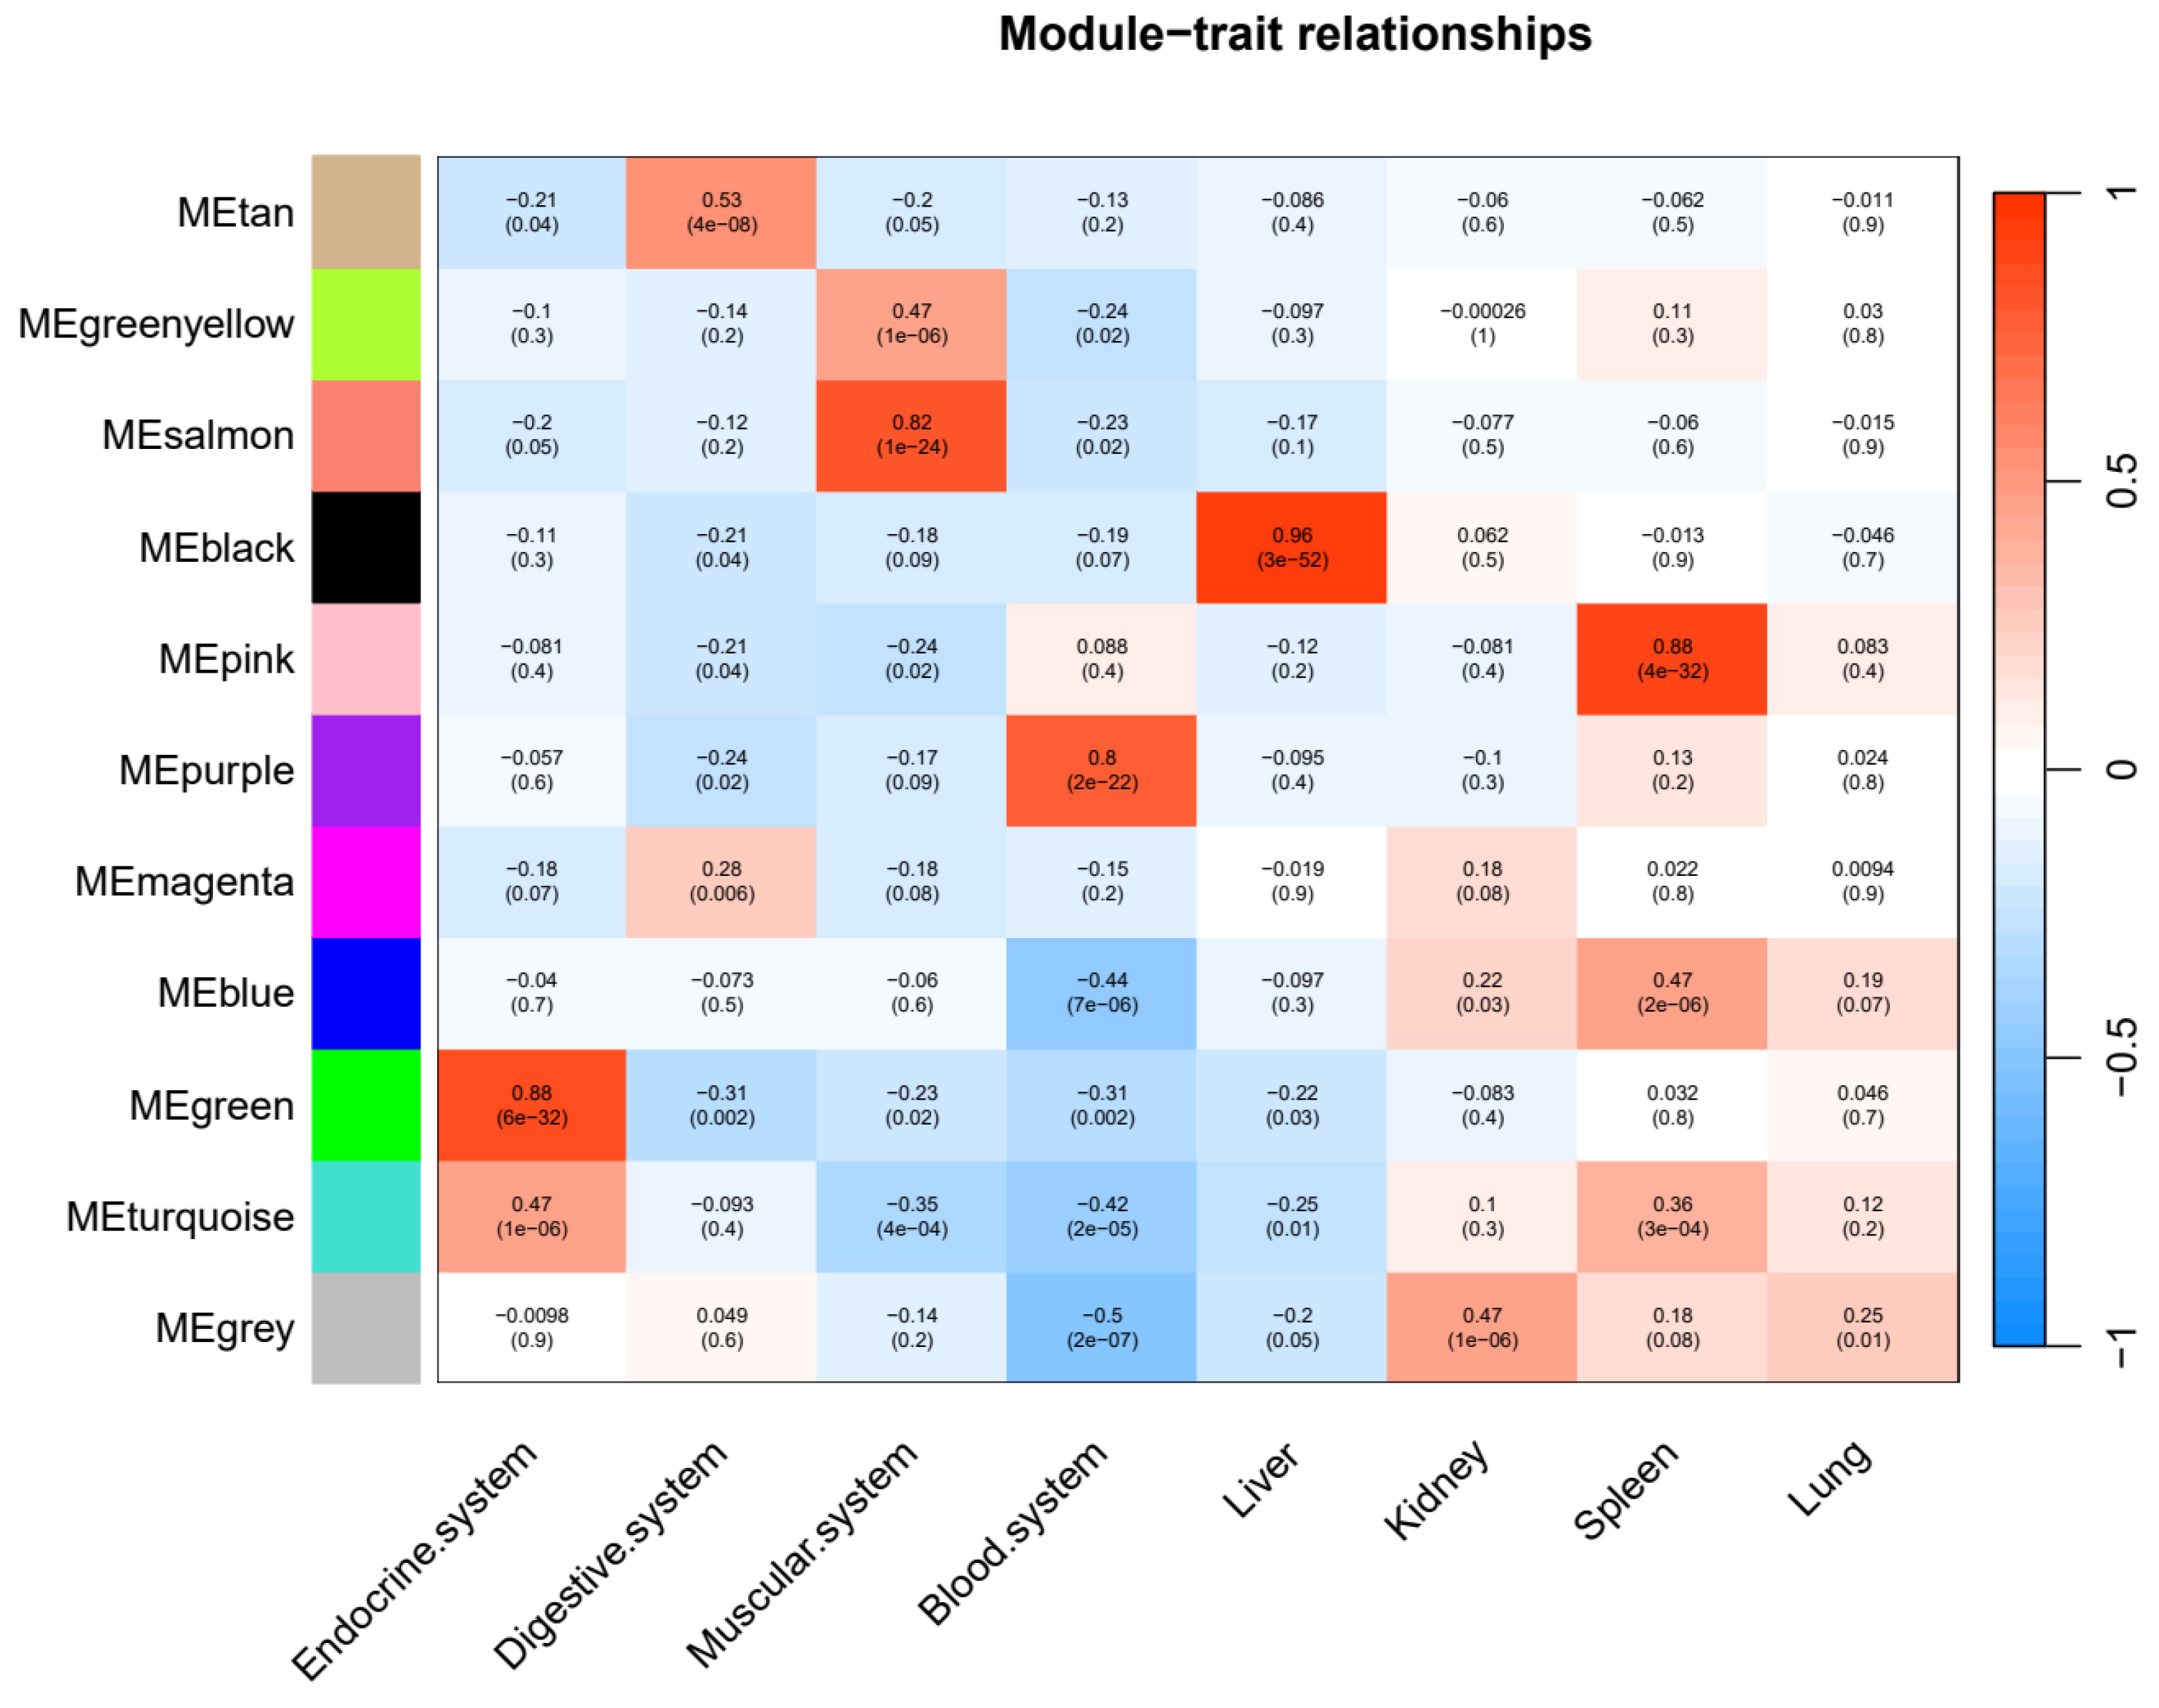
Figure 7.
Tissue-resolved innate immunity networks. Co-expression networks for six tissue-associated modules. Nodes represent innate immunity genes colored by functional class (see legend). Edge thickness scales with topological overlap (TOM).
Figure 7.
Tissue-resolved innate immunity networks. Co-expression networks for six tissue-associated modules. Nodes represent innate immunity genes colored by functional class (see legend). Edge thickness scales with topological overlap (TOM).
Disclaimer/Publisher’s Note: The statements, opinions and data contained in all publications are solely those of the individual author(s) and contributor(s) and not of MDPI and/or the editor(s). MDPI and/or the editor(s) disclaim responsibility for any injury to people or property resulting from any ideas, methods, instructions or products referred to in the content. |
© 2025 by the authors. Licensee MDPI, Basel, Switzerland. This article is an open access article distributed under the terms and conditions of the Creative Commons Attribution (CC BY) license (http://creativecommons.org/licenses/by/4.0/).
Copyright: This open access article is published under a Creative Commons CC BY 4.0 license, which permit the free download, distribution, and reuse, provided that the author and preprint are cited in any reuse.


