Preprint
Article

This version is not peer-reviewed.

Differentially Expressed Genes in Cardiomyocytes of the First Camelized Mouse Model, Nrapc.255ins78 Mouse

A peer-reviewed article of this preprint also exists.

Submitted:

02 January 2025

Posted:

03 January 2025

You are already at the latest version

Abstract

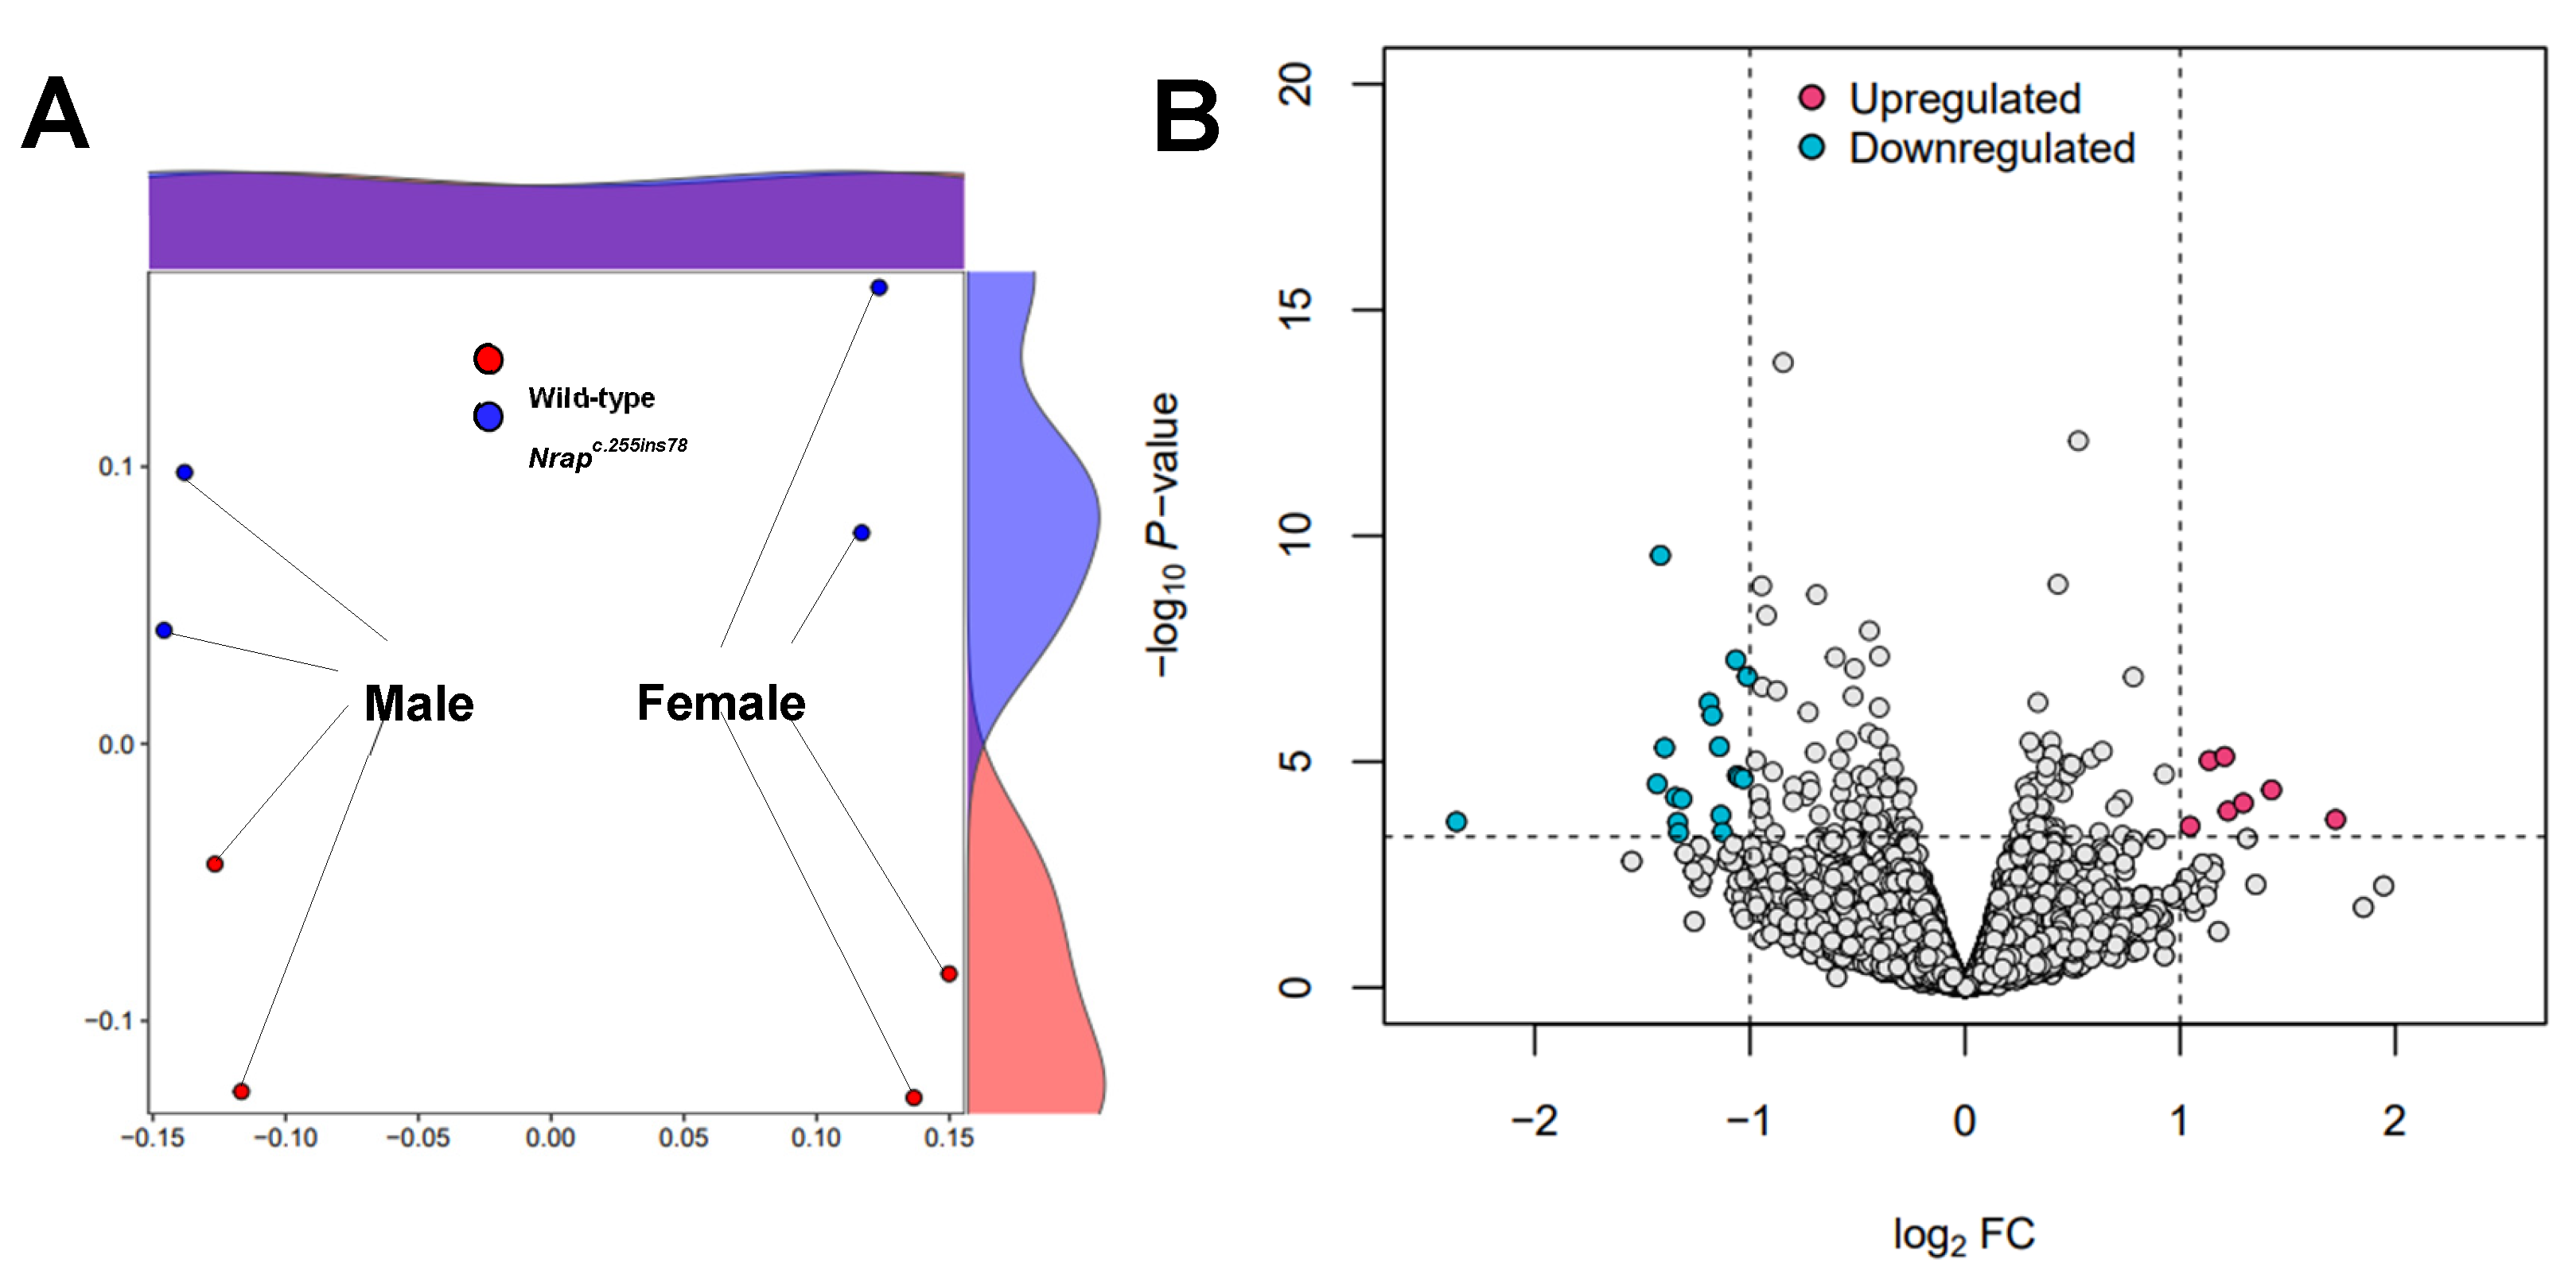
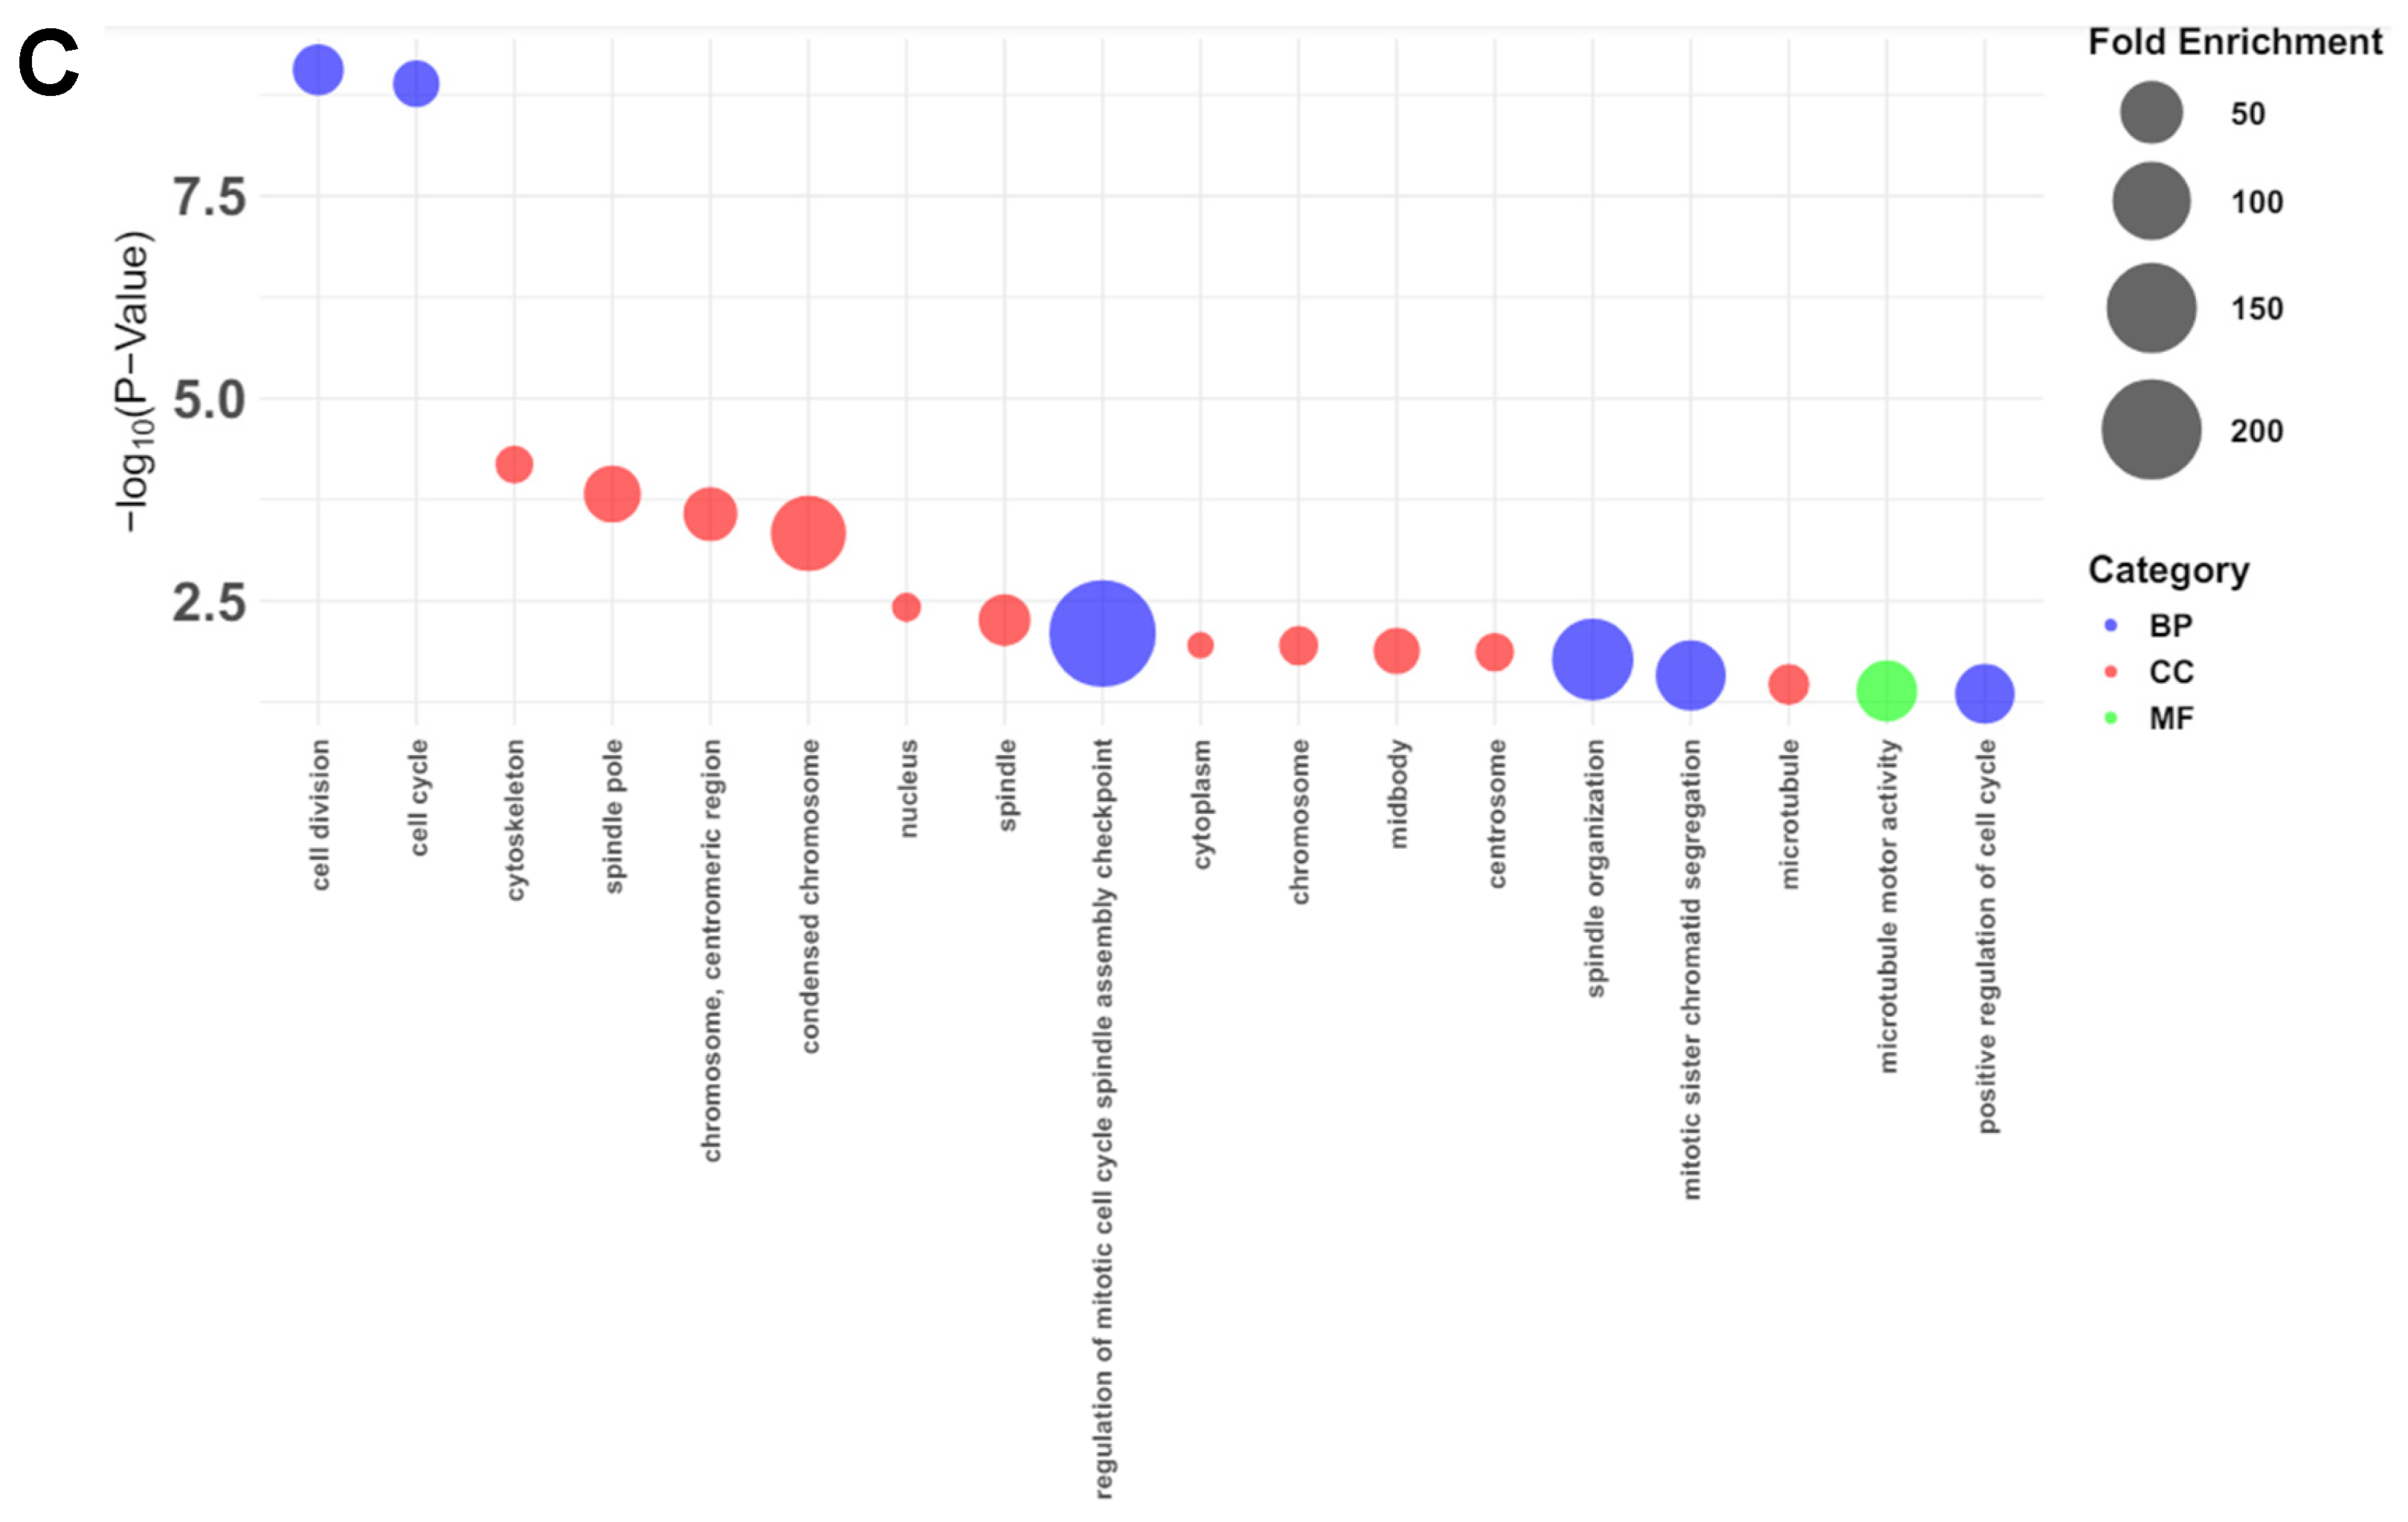
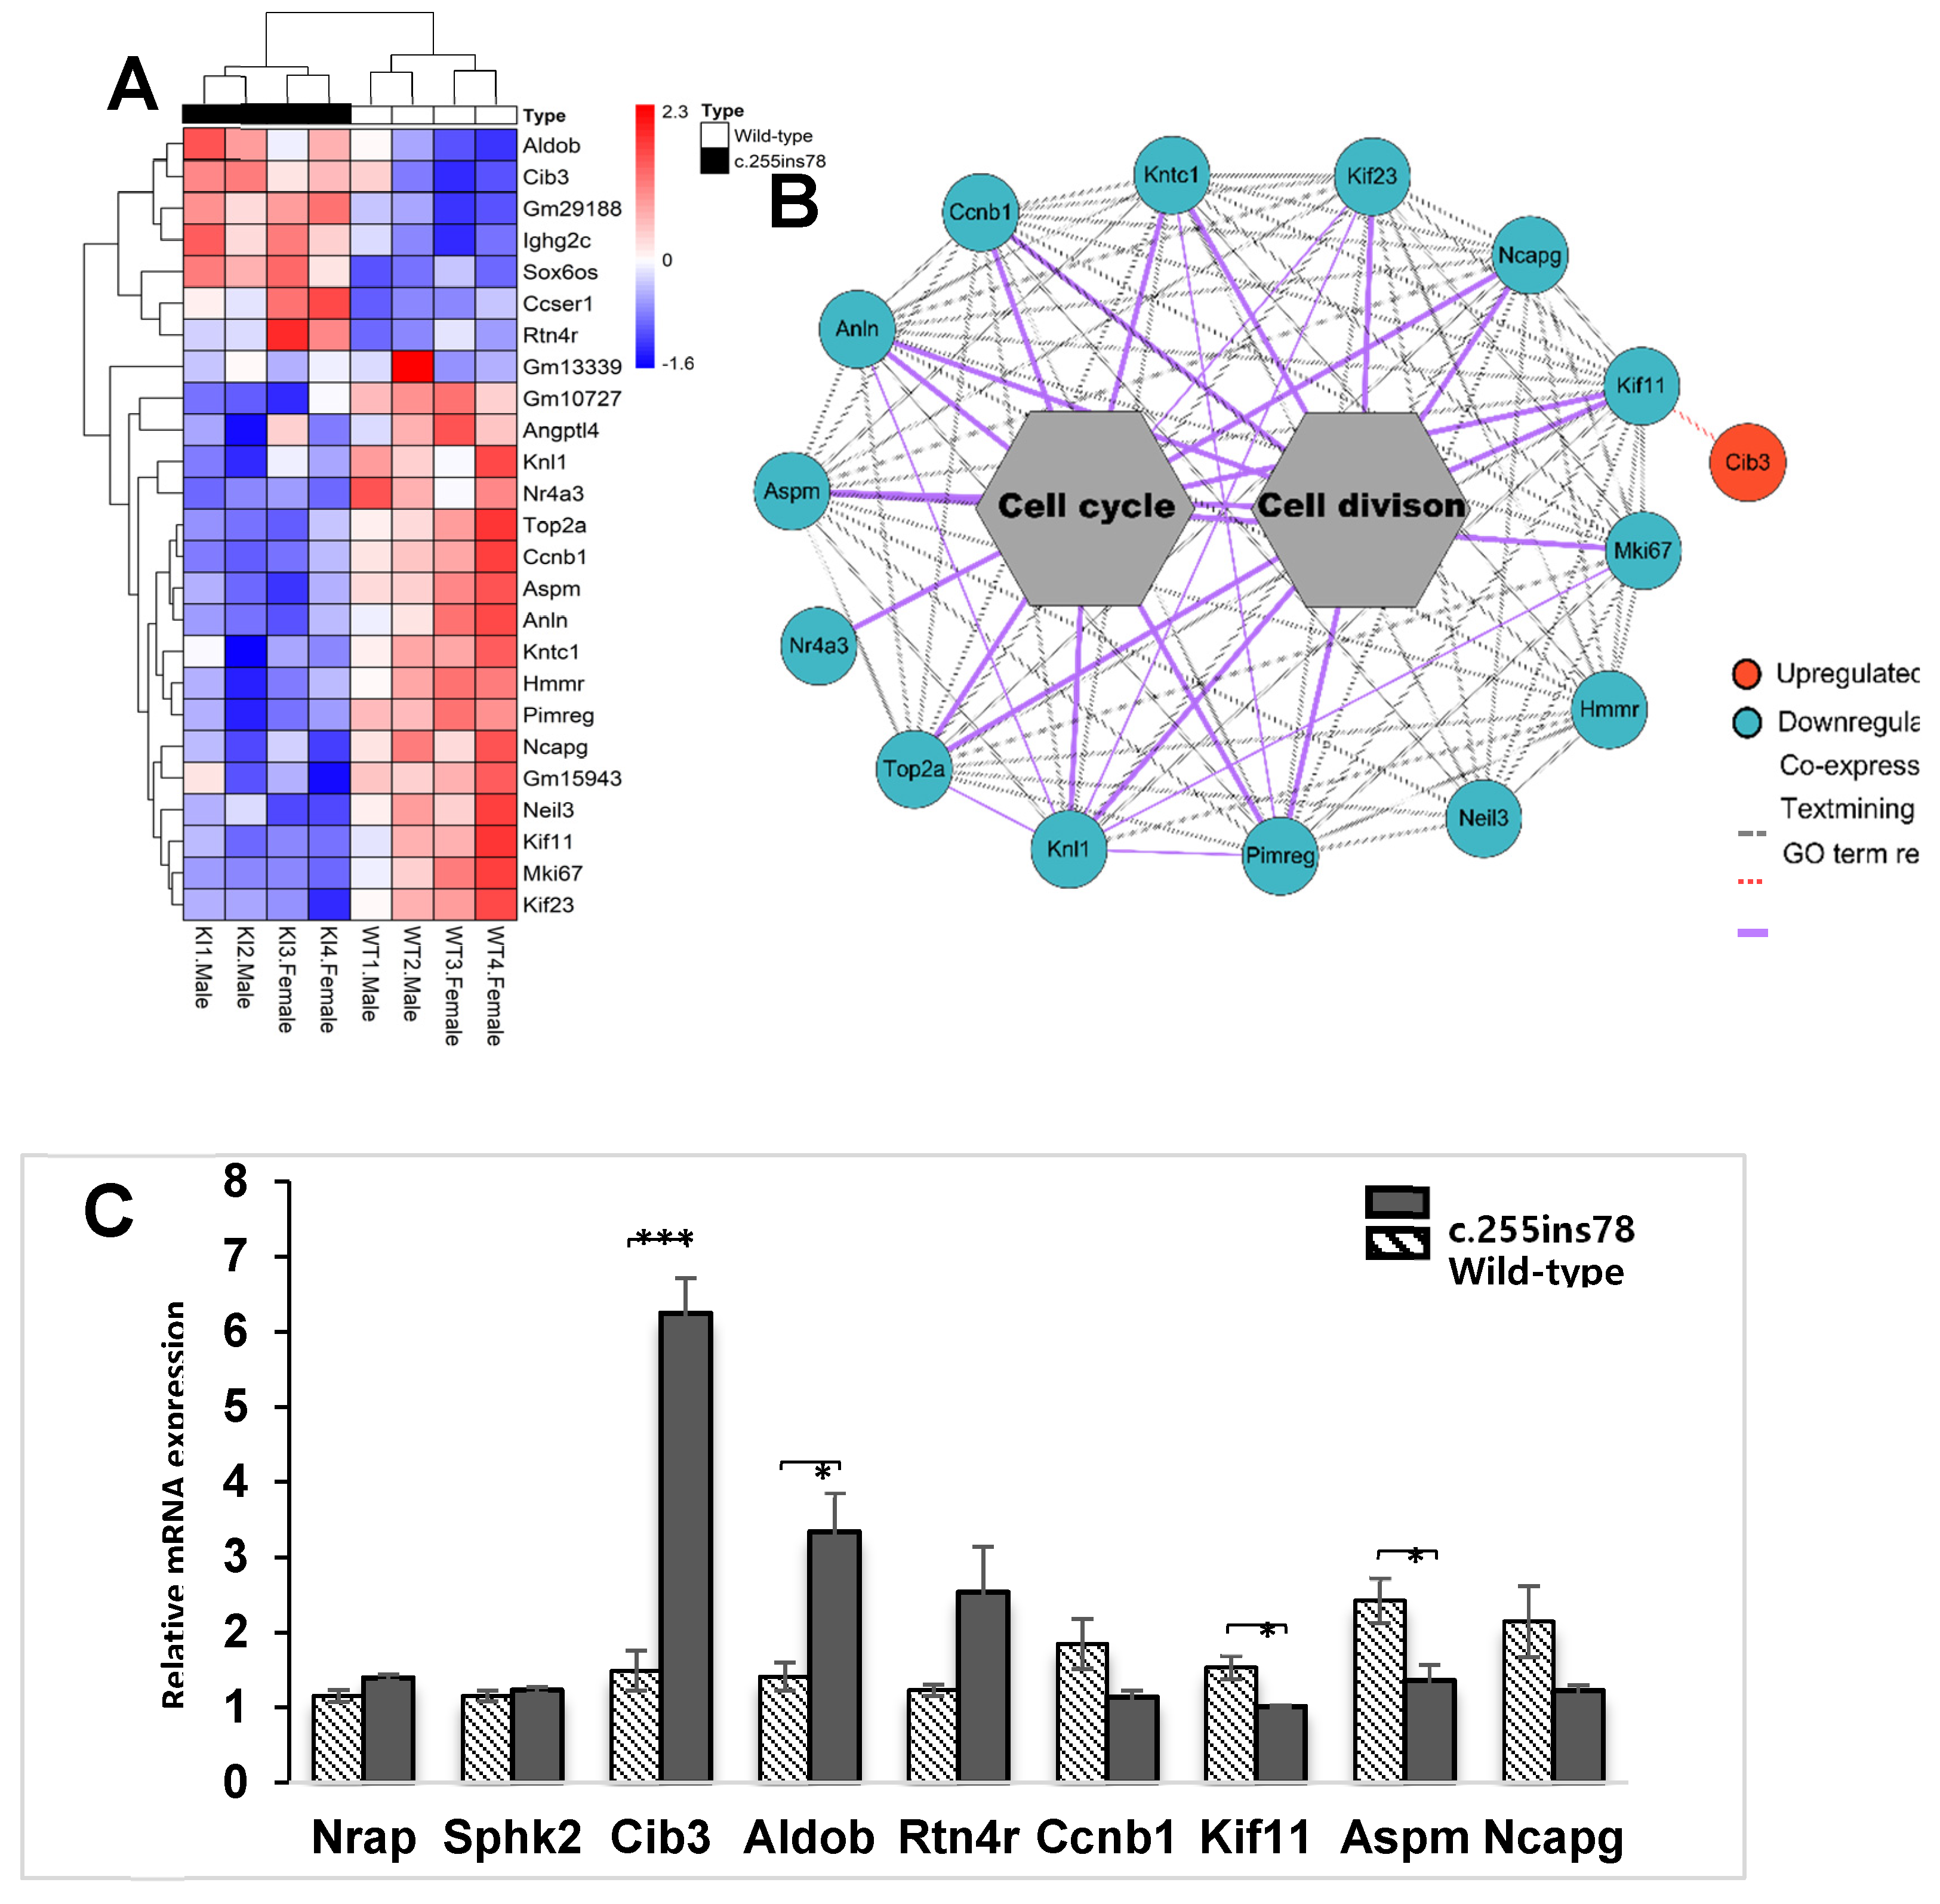
The first camelized mouse model (Nrap c.255ins78) was developed to explore how camels adapt to extreme environments. Previous studies showed that these mice exhibit a cold‐resistant phenotype, with increased expression of inflammatory cytokine‐related genes in the heart under cold stress. This study aims to build on prior research by analyzing the heart transcriptomes of Nrap c.255ins78 mice under non‐stress conditions to investigate the origins of inflammatory cytokine responses in the heart during cold exposure. For this purpose, RNA sequencing was used to analyze the heart transcriptomes of 12‐week‐old male and female Nrap c.255ins78 mice and control wild‐type mice. As a result, we identified 25 differentially expressed genes between wild‐type and Nrap c.255ins78 mice. Twelve of them were associated with the cell cycle and division, all consistently downregulated in Nrapc.255ins78 mice. The Cib3 (calcium and integrin‐binding protein) gene was significantly upregulated (FDR < 0.05; P < 0.001). These DEGs are linked to altered calcium dynamics in cardiomyocytes, maintaining homeostasis, and suggest that inflammatory cytokines during cold exposure may serve as an adaptive response. Our findings provide insights into the genetic mechanisms underlying temperature adaptation in camels and suggest pathways for enhancing stress resistance in other mammals.

Keywords: 
;  ;  ;  

1. Introduction

Camels are unique mammals that have adapted remarkably to extreme environmental conditions, thriving in harsh habitats like deserts. Numerous studies have highlighted the physiological, behavioral, and genetic mechanisms camels have developed to survive under such conditions [1,2,3]. However, our understanding of the genetic variations that drive environmental adaptation in camels remains incomplete.
Our previous research identified that exon 4 of the NRAP gene in camels plays a significant role in cold resistance. Specifically, the Nrapc.255ins78 variant in mice exhibits unique expression in the heart, where it enhances inflammatory cytokine production under cold stress, thereby contributing to temperature resilience [4]. Cytokine expression is known to change in mammals exposed to cold [5,6,7]. For instance, cold exposure has been reported to increase interleukin (IL)-1β and IL-6 levels in cold-resistant humans [8], while in mice, cold stress elevates tumor necrosis factor (TNF)-α and IL-6 levels [9].
These findings suggest a greater upregulation of inflammatory cytokines in Nrapc.255ins78 mice compared to wild-type mice. To investigate these cytokine mechanisms, this study analyzes changes in the heart transcriptome of Nrapc.255ins78 mice under non-stress conditions using RNA sequencing (RNA-seq). RNA-seq is a widely used tool for analyzing transcriptomic changes in organs influenced by internal and external environments [10,11,12,13]. This approach, comparing the differentially expressed gene set under normal conditions, may provide insights into the cytokine expression pathways observed in the heart under cold stress. Ultimately, this study could further contribute to understanding temperature adaptation mechanisms in camels and environmental stress adaptation in various mammals.

2. Materials and Methods

2.1. Ethics

All animal experiments including standards of euthanasia for this study were performed according to the Korean Food and Drug Administration (KFDA) guidelines and the relevant legal guidelines and conducted in the GEM division of Macrogen Inc. (Seoul, Republic of Korea). The protocols were reviewed and approved by the IACUC (MS-2022-01).

2.2. RNA-seq

To investigate gender-based differences in gene expression, twelve-week-old Nrapc.255ins78 homozygous mice (2 males and 2 females) were used, along with twelve-week-old wild-type mice (2 males and 2 females) as controls. The excised hearts were photographed to confirm phenotypic characteristics, and total RNA was extracted using Trizol reagent (Sigma-Aldrich, St. Louis and Burlington, MA, USA) following the manufacturer’s instructions. Detailed RNA sequencing procedures were previously reported [4].

2.3. Differentially Expressed Gene (DEG) Analyses

The quality of raw read data for each sample was assessed using FastQC software v0.11.7. Adaptor trimming was conducted with Trimmomatic v0.38, based on quality results. The trimmed reads were then aligned to the reference genome (GRCm39) from the Ensembl genome browser using HISAT2 v2.1.0. Raw counts for each library were calculated based on the exons in Mus musculus GTF v110 (Ensembl) using the featureCounts function of the Subread package v1.6.3. Differentially expressed gene (DEG) analysis was conducted using edgeR v3.26.5, with raw counts normalized via the TMM (Trimmed Mean of M-values) method. DEGs were identified in the hearts of Nrapc.255ins78 mice compared to wild-type mice, using a false discovery rate (FDR) of < 0.05 and an absolute log2 fold-change (FC) threshold of ≥ 1. A multidimensional scaling (MDS) plot analysis was also performed to illustrate the sample clustering.

2.4. Gene Ontology (GO) Functional Enrichment Analysis

The identified DEGs were annotated with Gene Ontology (GO) terms using DAVID (Database for Annotation, Visualization, and Integrated Discovery) v2024q1 [14]. GO annotations were conducted across the categories of Biological Processes (BP), Cellular Components (CC), and Molecular Functions (MF), using thresholds of P-value < 0.05 and counts ≥ 2. Enriched GO terms were grouped with similar terms and visualized in a bubble plot, displaying -log10 P-value and fold enrichment.

2.5. Interaction Network Construction

A network based on the DEGs was constructed using the Search Tool for the Retrieval of Interacting Genes (STRING) in Cytoscape v3.10.2. The interaction score was set to 0.4, representing a medium confidence level.

2.6. RT-qPCR Validation

Reverse transcription-quantitative polymerase chain reaction (RT-qPCR) was performed using the SYBR Green PCR mix (Qiagen, Hilden, Germany) to validate the RNA-seq results. Β-actin was used as a control for normalization. Relative quantification of mRNA expression was calculated using the 2-ΔΔCt method, and results were presented as the average relative fold change. The primer sequences and amplification temperatures are provided in Table S1.

2.7. Statistics

All statistical values are presented as mean ± SEM. RNA-seq data analysis and visualization were conducted using R statistical software v4.3.3. The qPCR experiments were independently repeated three times. Statistical significance was evaluated using a paired t-test, with a P-value of less than 0.05 considered statistically significant.

3. Results

3.1. Data Processing and Transcriptomes

The average overall mapping rate was 99.15%, and the average unique mapping rate was 72.60% (Table S2). Multiclustering was observed in the MDS analysis, with the transcriptomes of each sample showing differentiation by sex and genotype (Figure 1a). DEG analysis was conducted by comparing expression levels, which were visualized in a volcano plot (FDR < 0.05, absolute log2FC ≥ 1) (Figure 1b). In total, 25 DEGs were identified in heart tissue, with 7 upregulated and 18 downregulated (Table S3).

3.2. Functional Annotations

Functional enrichment analysis was conducted based on Gene Ontology (GO) terms in heart tissue and visualized with a bubble plot (Figure 1c). The most significantly enriched Biological Processes (BP) included cell division (GO:0051301; P-value = 8.78E-10; FDR = 1.21E-07) and cell cycle (GO:0007049; P-value = 1.30E-9; FDR = 1.21E-07). A comprehensive list and detailed values for each GO term are provided in Table S4.

3.3. Expression Pattern and Validation

We visualized the expression patterns of the 25 DEGs across all samples in a heatmap (Figure 2a) and performed a co-expression network analysis to examine interactions among genes identified in enriched GO terms (Figure 2b). The network analysis revealed interactions based on the GO terms “cell division” and “cell cycle.” Within this network, the Kif11 gene displayed a text-mining association with Cib3, which was identified as an upregulated gene
To confirm the reliability of the RNA-seq data, we selected 3 upregulated genes (Cib3, Aldob, Rtn4r), 4 downregulated genes (Ccnb1, Kif11, Aspm, Ncapg), and 2 non-significant genes (Nrap, Spkh2) for validation. The expression levels of all genes closely matched the transcriptome analysis results (Figure 2c).

4. Discussion

In mammals, the heart is a critical organ for regulating body temperature and circulating blood to accommodate sudden physiological changes [15,16,17]. In this study, we grouped the heart transcriptomes of Nrapc.255ins78 and wild-type mice by genotype and sex. Transcriptomic differences were observed in each group through MDS visualization (Figure 1a), suggesting that Nrapc.255ins78 exhibits distinct phenotypes depending on gender.
Functional annotation of the 25 DEGs showed significant associations with the “cell cycle” and “cell division” GO terms (Figure 1c). Notably, all 12 genes (Kif11, Anln, Ccnb1, Kntc1, Kif23, Ncapg, Aspm, Mki67, Pimreg, Knl1, Top2a, Nr4a3) associated with cell cycle and division terms were consistently downregulated in Nrapc.255ins78 mice (Figure 2a, b). Reduced expression of Nr4a3 has been linked to an increased population of cells susceptible to infection [18]. In T. cruzi-infected human fibroblasts, cytokines are secreted as part of the immune response; however, cell cycle downregulation due to infection occurs independently of cytokine signaling [19]. This suggests that inflammatory cytokine regulation and cell cycle function may operate separately, potentially explaining why cell cycle downregulation was not observed under cold exposure conditions.
The DEG network illustrates interactions among 12 genes involved in the cell cycle and division, with Cib3 (calcium and integrin-binding protein 3) showing an association with Kif11 (Figure 2b). Cib3 was the most significantly upregulated gene (Table S3) and belongs to the CIB family, which includes Cib1, Cib2, and Cib4 [20]. CIB proteins are small EF-hand calcium-binding proteins that interact with the cytoplasmic domain of integrin αIIbβ3, playing a role in hemostasis. Among these, Cib3 is expressed at relatively low levels in the heart and muscle tissues [21,22]. Notably, prior research has demonstrated that overexpression of Cib1, which shares strong homology with Cib3, inhibits cell proliferation [23]. These findings align with the results of our study.
Maintaining appropriate calcium levels in the heart is essential for preserving calcium homeostasis in the cytoplasm through ATPase pumps. Although our analysis alone cannot determine the causal relationship between cell proliferation and Cib3 upregulation, the observed inhibition of cell cycle and division genes in Nrapc.255ins78 mouse hearts suggest a regulatory mechanism to control abnormal calcium flow [24,25]. This altered calcium flow can potentially affect intracellular signaling pathways, and the significant upregulation of Cib3, which is expressed in a calcium-dependent manner, can be interpreted as a response to the calcium flow in cardiomyocytes [26].
This transcriptome analysis did not identify differential expression of the Nrap (nebulin-related anchoring protein) gene, but qPCR results indicated a slight increase in its expression (Figure 2c). The Nrap is a Z-disc protein with nebulin-like super repetitive sequences, playing a crucial role in myofibril formation [27,28]. Nebulin can bind to calmodulin (CaM) and regulate calcium release in skeletal muscle [29]. The predictions of the domains and protein structure of Nrapc.255ins78 suggest that there be structural and functional alteration in the protein [4]. Although further in-depth analysis of the protein structure is necessary, this change in the domain structure of the Nrapc.255ins78 protein may lead to altered interactions with proteins like CaM, potentially affecting calcium levels in cardiomyocytes [30].
Despite the downregulation of genes involved in cell cycle and division, the hearts of Nrapc.255ins78 mice did not significantly differ in size from those of wild-type mice (Figure S1). In our findings, downregulated genes such as Angptl4, Ccnb1, Mki67, and Top2a are known to be influenced by YAP/TAZ signaling [31,32,33,34]. Consequently, YAP/TAZ inactivation could lead to alterations in extracellular matrix (ECM) stiffness [35]. Although the precise mechanisms by which ECM stiffness regulates YAP/TAZ remain unclear, compensatory effects in actin cytoskeleton stability might have helped maintain organ size under these conditions [36].
Future investigations should incorporate histological staining, heart rate measurements, and blood composition analyses, including calcium concentration assessments, to clarify physiological impacts. Additionally, integrating transcriptome analyses of other organs, such as the lungs and kidneys, could offer a more comprehensive understanding of genetic influence on temperature stress adaptation.

5. Conclusions

The heart transcriptomes of Nrapc.255ins78 mice under non-stress conditions revealed consistent downregulation of cell proliferation-related genes alongside significant upregulation of the Cib3 gene. These findings suggest a homeostatic response within cardiomyocytes to altered calcium dynamics, ultimately indicating heightened cytokine sensitivity compared to wild-type. This study provides foundational insights into temperature adaptation mechanisms, broadening the understanding of the NRAP gene’s exon 4 function beyond camels.

Supplementary Materials

The following supporting information can be downloaded at the website of this paper posted on Preprints.org, Figure S1: Comparison of heart tissue Nrapc.255ins75 and wild-type mice; Table S1: RT-qPCR primer sequences; Table S2: Overview of data process for RNA-seq; Table S3: DEG profiling; Table S4: Functional annotations based on identified DEGs

Author Contributions

S.-Y.L. and K.-S.K.: conceptualization; investigation; S.-Y.L., B.-Y.L. and K.-S.K.: formal analysis. S.-Y.L. and K.-S.K.: writing—original draft. S.-Y.L., B.L., G.J., J.-S.C., X.-S.C.: methodology; data curation. S.-Y.L. and K.-S.K.: writing—review and editing. K.-S.K. acquired funding and supervised the project. All authors have read and agreed to the published version of the manuscript.

Funding

This work was supported by the National Research Foundation (NRF) of Korea grant funded by the Korea government (MSIT) (No. 2020R1A4A1017552), Republic of Korea.

Institutional Review Board Statement

All animal experiments including standards of euthanasia for this study were performed according to the Korean Food and Drug Administration (KFDA) guidelines and the relevant legal guidelines and conducted in the GEM division of Macrogen Inc. (Seoul, Republic of Korea). The protocols were reviewed and approved by the IACUC (MS-2022-01).

Data Availability Statement

We have submitted the RNA-seq data to the National Center of Biotechnology Information`s Sequence Read Archive under accession number PRJNA1175414.

Conflicts of Interest

The authors declare no conflicts of interest.

References

  1. Hoter, A.; Rizk, S.; Naim, H.Y. Cellular and molecular adaptation of Arabian camel to heat stress. Front. Genet. 2019, 10, 588. [Google Scholar] [CrossRef] [PubMed]
  2. Kandeel, M.; Al-Taher, A.; Venugopala, K.N.; Marzok, M.; Morsy, M.; Nagaraja, S. Camel proteins and enzymes: A growing resource for functional evolution and environmental adaptation. Front. Vet. Sci. 2022, 9, 911511. [Google Scholar] [CrossRef] [PubMed]
  3. Wu, H.; Guang, X.; Al-Fageeh, M.B.; Cao, J.; Pan, S.; Zhou, H.; Zhang, L.; Abutarboush, M.H.; Xing, Y.; Xie, Z.; Alshanqeeti, A.S.; Zhang, Y.; Yao, Q.; Al-Shomrani, B.M.; Zhang, D.; Li, J.; Manee, M.M.; Yang, Z.; Yang, L.; Wang, J. Camelid genomes reveal evolution and adaptation to desert environments. Nat. Commun. 2014, 5, 6188. [Google Scholar] [CrossRef] [PubMed]
  4. Lee, S.; Lee, B.; Lim, B.; Uzzaman, R.; Jang, G.; Kim, K. Exploring the importance of predicted camel NRAP exon 4 for environmental adaptation using a mouse model. Anim. Genet. 2025, 56, e13490. [Google Scholar] [CrossRef]
  5. Arias, N.; Velapatiño, B.; Hung, A.; Cok, J. Cytokines expression in alpacas and llamas exposed to cold stress. Small Rumin. Res. 2016, 141, 135–140. [Google Scholar] [CrossRef]
  6. Castellani, J.W.; Brenner, I.K.M.; Rhind, S.G. Cold exposure: human immune responses and intracellular cytokine expression. Med. Sci. Sports Exerc. 2002, 34, 2013–2020. [Google Scholar] [CrossRef]
  7. Leon, L.R. Molecular Biology of Thermoregulation Invited Review: Cytokine regulation of fever: studies using gene knockout mice. J. Appl. Physiol. 2002, 92, 2648–2655. [Google Scholar] [CrossRef] [PubMed]
  8. Dugue, B.; Leppaänen, E. Adaptation related to cytokines in man: effects of regular swimming in ice-cold water. Clin. Physiol. 2000, 20, 114–121. [Google Scholar] [CrossRef]
  9. Nie, Y.; Yan, Z.; Yan, W.; Xia, Q.; Zhang, Y. Cold exposure stimulates lipid metabolism, induces inflammatory response in the adipose tissue of mice and promotes the osteogenic differentiation of BMMSCs via the p38 MAPK pathway in vitro. Int. J. Clin. Exp. Pathol. 2015, 8, 10875–10886. [Google Scholar] [PubMed] [PubMed Central]
  10. Kim, D.Y.; Lim, B.; Kim, J.M.; Kil, D.Y. Integrated transcriptome analysis for the hepatic and jejunal mucosa tissues of broiler chickens raised under heat stress conditions. J. Anim. Sci. Biotechnol. 2022, 13, 1. [Google Scholar] [CrossRef]
  11. Li, G.; Yu, X.; Portela Fontoura, A.B.; Javaid, A.; de la Maza-Escolà, V.S.; Salandy, N.S.; Fubini, S.L.; Grilli, E.; McFadden, J.W.; Duan, J.E. Transcriptomic regulations of heat stress response in the liver of lactating dairy cows. BMC Genomics 2023, 24, 1. [Google Scholar] [CrossRef] [PubMed]
  12. Lim, B.; Kim, S.; Lim, K.S.; Jeong, C.G.; Kim, S.C.; Lee, S.M.; Park, C.K.; te Pas, M.F.W.; Gho, H.; Kim, T.H.; et al. Integrated time-serial transcriptome networks reveal common innate and tissue-specific adaptive immune responses to PRRSV infection. Vet. Res. 2020, 51, 1. [Google Scholar] [CrossRef] [PubMed]
  13. Du, K.; Shi, Y.; Bai, X.; Chen, L.; Sun, W.; Chen, S.; Wang, J.; Jia, X.; Lai, S. Integrated Analysis of Transcriptome, microRNAs, and Chromatin Accessibility Revealed Potential Early B-Cell Factor1-Regulated Transcriptional Networks during the Early Development of Fetal Brown Adipose Tissues in Rabbits. Cells 2022, 11, 2675. [Google Scholar] [CrossRef]
  14. Huang, D.W.; Sherman, B.T.; Lempicki, R.A. Systematic and integrative analysis of large gene lists using DAVID bioinformatics resources. Nat. Protoc. 2009, 4, 44–57. [Google Scholar] [CrossRef]
  15. Ma, Y.; Li, J. Metabolic shifts during aging and pathology. Compr. Physiol. 2015, 5, 667–686. [Google Scholar] [CrossRef] [PubMed]
  16. Mota-Rojas, D.; Titto, C.G.; Orihuela, A.; Martínez-Burnes, J.; Gómez-Prado, J.; Torres-Bernal, F.; Flores-Padilla, K.; Carvajal-De la Fuente, V.; Wang, D. Physiological and behavioral mechanisms of thermoregulation in mammals. Animals 2021, 11, 61733. [Google Scholar] [CrossRef] [PubMed]
  17. Torrent-Guasp, F.; Kocica, M.J.; Corno, A.F.; Komeda, M.; Carreras-Costa, F.; Flotats, A.; Cosin-Aguillar, J.; Wen, H. Towards new understanding of the heart structure and function. Eur. J. Cardio-Thorac. Surg. 2005, 27, 191–201. [Google Scholar] [CrossRef]
  18. Bluteau, D.; Gilles, L.; Hilpert, M.; Antony-Debré, I.; James, C.; Debili, N.; Camara-Clayette, V.; Wagner-Ballon, O.; Cordette-Lagarde, V.; Robert, T.; et al. Down-regulation of the RUNX1-target gene NR4A3 contributes to hematopoiesis deregulation in familial platelet disorder/acute myelogenous leukemia. Blood 2011, 118, 6310–6320. [Google Scholar] [CrossRef]
  19. Costales, J.A.; Daily, J.P.; Burleigh, B.A. Cytokine-dependent and-independent gene expression changes and cell cycle block revealed in Trypanosoma cruzi-infected host cells by comparative mRNA profiling. BMC Genomics 2009, 10. [Google Scholar] [CrossRef] [PubMed]
  20. Dal Cortivo, G.; Dell’orco, D. Calcium-and Integrin-Binding Protein 2 (CIB2) in Physiology and Disease: Bright and Dark Sides. Int. J. Mol. Sci. 2022, 23, 73552. [Google Scholar] [CrossRef]
  21. Huang, H.; Bogstie, J.N.; Vogel, H.J. Biophysical and structural studies of the human calcium-and integrin-binding protein family: Understanding their functional similarities and differences. Biochem. Cell Biol. 2012, 90, 646–656. [Google Scholar] [CrossRef] [PubMed]
  22. Yu, Y.; Song, X.; Du, L.; Wang, C. Molecular characterization of the sheep CIB1 gene. Mol. Biol. Rep. 2009, 36, 1799–1809. [Google Scholar] [CrossRef]
  23. Naik, M.U.; Naik, U.P. Calcium- and integrin-binding protein 1 regulates microtubule organization and centrosome segregation through polo like kinase 3 during cell cycle progression. Int. J. Biochem. Cell Biol. 2011, 43, 120–129. [Google Scholar] [CrossRef]
  24. Kahl, C.R.; Means, A.R. Regulation of Cell Cycle Progression by Calcium/Calmodulin-Dependent Pathways. Endocr. Rev. 2003, 24, 719–736. [Google Scholar] [CrossRef]
  25. Varghese, E.; Samuel, S.M.; Sadiq, Z.; Kubatka, P.; Liskova, A.; Benacka, J.; Pazinka, P.; Kruzliak, P.; Büsselberg, D. Anti-cancer agents in proliferation and cell death: The calcium connection. Int. J. Mol. Sci. 2019, 20, 12017. [Google Scholar] [CrossRef]
  26. Yamniuk, A. P.; Vogel, H. J. Calcium- and magnesium-dependent interactions between calcium- and integrin-binding protein and the integrin αIIb cytoplasmic domain. Protein Sci. 2005, 14, 1429–1437. [Google Scholar] [CrossRef] [PubMed]
  27. Nicolau, S.; Dasgupta, A.; Dasari, S.; Charlesworth, M. C.; Johnson, K. L.; Pandey, A.; Doles, J. D.; Milone, M. Molecular signatures of inherited and acquired sporadic late onset nemaline myopathies. Acta Neuropathol. Commun. 2023, 11, 1. [Google Scholar] [CrossRef]
  28. Vermij, S. H.; Abriel, H.; Van Veen, T. A. B. Refining the molecular organization of the cardiac intercalated disc. Cardiovasc. Res. 2017, 113, 259–275. [Google Scholar] [CrossRef] [PubMed]
  29. Patel, K.; Strong, P. N.; Dubowitz, V.; Dunn, M. J. Calmodulin-binding profiles for nebulin and dystrophin in human skeletal muscle. FEBS Lett. 1988, 234, 267–271. [Google Scholar] [CrossRef] [PubMed]
  30. Yuen, M.; Ottenheijm, C. A. C. Nebulin: big protein with big responsibilities. J. Muscle Res. Cell Motil. 2020, 41, 103–124. [Google Scholar] [CrossRef]
  31. Hooglugt, A.; van der Stoel, M.M.; Boon, R.A.; Huveneers, S. Endothelial YAP/TAZ Signaling in Angiogenesis and Tumor Vasculature. Front. Oncol. 2021, 10. [Google Scholar] [CrossRef] [PubMed]
  32. Meinhold, M.; Verbrugge, S.; Shi, A.; Schönfelder, M.; Becker, L.; Jaspers, R. T.; Zammit, P. S.; Wackerhage, H. Yap/Taz activity is associated with increased expression of phosphoglycerate dehydrogenase that supports myoblast proliferation. Cell Tissue Res. 2024, 395, 271–283. [Google Scholar] [CrossRef] [PubMed]
  33. Tóth, M.; Wehling, L.; Thiess, L.; Rose, F.; Schmitt, J.; Weiler, S. M. E.; Sticht, C.; De La Torre, C.; Rausch, M.; Albrecht, T.; Grabe, N.; Duwe, L.; Andersen, J. B.; Köhler, B. C.; Springfeld, C.; Mehrabi, A.; Kulu, Y.; Schirmacher, P.; Roessler, S.; Breuhahn, K. Co-expression of YAP and TAZ associates with chromosomal instability in human cholangiocarcinoma. BMC Cancer 2021, 21, 1. [Google Scholar] [CrossRef] [PubMed]
  34. Yang, W. H.; Chi, J. T. Hippo pathway effectors YAP/TAZ as novel determinants of ferroptosis. Mol. Cell. Oncol. 2020, 7, 1. [Google Scholar] [CrossRef]
  35. Cai, X.; Wang, K.C.; Meng, Z. Mechanoregulation of YAP and TAZ in Cellular Homeostasis and Disease Progression. Front. Cell Dev. Biol. 2021, 9. [Google Scholar] [CrossRef] [PubMed]
  36. Halder, G.; Dupont, S.; Piccolo, S. Transduction of mechanical and cytoskeletal cues by YAP and TAZ. Nat. Rev. Mol. Cell Biol. 2012, 13, 591–600. [Google Scholar] [CrossRef] [PubMed]
Figure 1. Transcriptome in heart of Nrapc.255ins78 and wild-type mice. (a) Group clustering and Multidimensional scaling (MDS). Grouping transcript frequencies between Nrap c.255ins78 and wild- type mice revealed distinct differences. (b) Differentially expressed genes (DEGs) identified using a volcano plot are displayed with the x-axis representing the log2 fold change and the y-axis representing the -log10 P-value. (c) The gene ontology (GO) bubble plot was created based on the –log P-values and fold enrichment related to the biological processes (BP), cellular components (CC), and molecular functions (MF) terms.
Preprints 145000 g001aPreprints 145000 g001b
Figure 2. Expression pattern of Nrapc.255ins78 heart. (a) Heatmap for expression between all DEGs. (b) The interactions using DEGs indicate the associations between co-expression of each gene. (c) Verification of the RNA-seq by RT-qPCR. * and *** indicate P-value < 0.05 and P-vlaue < 0.001, respectively.
Preprints 145000 g002
Disclaimer/Publisher’s Note: The statements, opinions and data contained in all publications are solely those of the individual author(s) and contributor(s) and not of MDPI and/or the editor(s). MDPI and/or the editor(s) disclaim responsibility for any injury to people or property resulting from any ideas, methods, instructions or products referred to in the content.
Copyright: This open access article is published under a Creative Commons CC BY 4.0 license, which permit the free download, distribution, and reuse, provided that the author and preprint are cited in any reuse.
Prerpints.org logo

Preprints.org is a free preprint server supported by MDPI in Basel, Switzerland.

Subscribe

Disclaimer

Terms of Use

Privacy Policy

Privacy Settings

© 2025 MDPI (Basel, Switzerland) unless otherwise stated