
Submitted:
01 September 2025
Posted:
02 September 2025
You are already at the latest version
Abstract
Digital Mobility outcomes can serve as objective biomarkers of health, but their validation in populations with multiple long-term conditions (MLTC) based on wrist-worn devices remains unexplored. We refined, improved, and introduced novel algorithms, specifically tailored and adapted for i)gait sequence detection, ii)initial contact identification, and iii)stride length estimation from a single wrist-worn device. Validation was performed using data from 28 participants with co-occurring MLTC performing a 2.5-hour real-world monitoring session. Reference data from an established multi-sensor system were used to assess algorithm performance across diverse gait patterns of co-occurring MLTC. Twenty-eight participants (mean age 70.4 years, 43% females) had a median of three co-occurring MLTC. Among six gait sequence detection methods, improved versions of the Kheirkhahan algorithm performed best (accuracy=0.92, specificity=0.96). For initial contact detection (nine methods tested), Shin’s algorithm achieved the highest performance index (0.85) followed by McCamley (0.84). Stride length estimation was most accurate using novel approaches based on the Weinberg method (performance index>0.70). The proposed fine-tuned algorithms, the newly developed adaptive variants, and the foot-length augmented versions, demonstrated robust performance, surpassing many existing methods and addressing the complexity of gait patterns in MLTC. These findings enable scalable, real-time mobility monitoring in complex clinical populations using accessible wearable technology.
Keywords:
digital mobility assessment
; wearable sensors
; wrist-worn inertial measurement units (IMU)
; real-world monitoring
; biomedical signal processing
; gait analysis
; multimorbidity
; algorithm validation
; stride length estimation
1. Introduction
Digital Mobility Outcomes (DMOs) have advanced considerably in recent years, emerging as promising tools for the objective assessment of real-world mobility as a reflection of overall health status [1,2,3]. A critical first step toward establishing DMOs as ecologically valid digital biomarkers is the robust demonstration of their algorithmic validity, including accuracy, reliability, and consistency when acquired in real-world settings. Within the scope of the EU-funded Mobilise-D project [4], substantial progress has been made toward this goal, including the development of a comprehensive validation framework, which has been applied across several single long-term conditions (i.e., one primary long-term disease) [1,5]. As such, gait detection algorithms have been developed and validated within the context of single disease populations, capturing condition-specific gait patterns [1,5]. This disease-specific focus may limit the broader applicability of DMOs as generalisable biomarkers, particularly in real-world settings where multiple long-term conditions (MLTC) are highly prevalent [6]. Given that gait is shaped by the complex interplay of multiple, co-existing long-term conditions, there is a critical need to extend the validation of DMOs to populations with MLTC, which present with a diverse range of gait impairments, including slow gait, high variability, and asymmetry.
To date, most algorithm development and validation efforts to date have relied on data captured from a single sensor positioned on the lower back [7]. Although this location provides important biomechanical benefits, ensuring that algorithms perform consistently across additional sensor locations represents a key step toward their integration into commercially available devices and, in particular, their suitability for long-term or large-scale deployment in clinical practice [8]. The wrist position offers a more user-friendly and scalable alternative, being widely adopted through commercially available wearable systems [8,9]. However, this device location poses unique challenges due to the non-fixed orientation of the wrist and the variability of arm movements [10]. These challenges are especially evident in the estimation of outcomes such as stride length, where traditional biomechanical models are inapplicable, thereby requiring the adoption of intensity-based or data-driven methodologies.
To date, large-scale algorithmic ranking validation studies of wrist-worn inertial measurement units (IMUs) have been conducted primarily in single disease populations and have focused exclusively on gait sequence detection (GSD) [11]. There remains a critical gap in the literature concerning the validation of additional outcomes, such as initial contact (IC), identification and stride length (SL), in populations with MLTC (co-occurring long-term conditions), which more accurately represent real-world mobility in clinical populations.
In the present study, we aimed to:
- (i)
- refine, optimise, and introduce novel versions of state-of-the-art algorithms for GSD, IC detection, and SL estimation using wrist-worn IMUs
and
- (i)
- technically validate and rank these algorithms in real-world settings.
This validation employed a diverse patient cohort representing five primary long-term conditions with accompanying equally important co-occurring long-term conditions, analysed collectively to encompass the full spectrum of gait patterns characteristic of multiple long-term conditions in real-world settings.
2. Materials and Methods
Study Population
The initial sample included 108 participants from the Mobilise-D Technical Validation Study (TVS) open access dataset [12], each with a primary diagnosis of a single condition: proximal femur fracture (PFF), chronic obstructive pulmonary disease (COPD), Parkinson’s disease (PD), multiple sclerosis (MS), and chronic heart failure (CHF) [13]. For the present analysis, we included only individuals with MLTC, so with at least two co-occurring long-term conditions (cardiovascular, metabolic, respiratory, musculoskeletal, or neurological) of equal importance, as inferred from their medication records. Hence, each participant presented with one index long-term condition and at least one other equally significant co-occurring condition. The long-term conditions spanned distinct multimorbidity clusters, including respiratory, cardio-metabolic, neurological, and musculoskeletal conditions [14].
Experimental Protocol
The experimental protocol has been detailed elsewhere [13]. Briefly, participants underwent a 2.5-hour free-living monitoring session. Participants were equipped with a wrist-worn IMU, a lower-back IMU, and the multisensor INDIP system (INertial modules, DIstance Sensors and Pressure insoles).
IMU Data
Data from the target device were collected using a wrist-worn inertial sensor placed on the non-dominant wrist. The sensor recorded triaxial acceleration at a sampling frequency of 100 Hz (range: ±8 g; resolution: 1 mg) and triaxial gyroscope data (range: ±2000°/s; resolution: 70 mdps). Further details on the hardware specifications of the device can be found in Salis et al. [15].
Reference Data
Reference data were collected using the INDIP system at 100Hz, comprising two inertial measurement units (IMUs) affixed to the shoelaces (instep position), two distance sensors attached on the medial aspect of the lower shank with Velcro straps, and two pressure-sensing insoles. The derivation of reference spatiotemporal gait characteristics using the INDIP system, in comparison to the stereophotogrammetry system, has been described and validated in detail previously [15]. Data from both wrist-IMU and INDIP were synchronized using timestamps referred to a common clock (± 1 sample).
Algorithms Selection and Optimisation
We employed a combination of algorithms previously published in the literature, and novel improved or optimised versions (e.g., using adaptive/personalised thresholds) developed to enhance performance across diverse gait patterns in populations with equally significant long-term conditions. Improved or adaptive threshold versions were fine tuned in the whole TVS population (n=108). A grid search identified the best-performing threshold/parameter combinations, to derive the improved or adaptive versions. Some algorithms were originally designed for a lower back sensor with specific axis orientations; we adapted them for wrist use by replacing axis-specific dependencies with the 3D accelerometer signal norm. Details of both original and adapted algorithms are presented in Table 1. The novel algorithm implementation and analysis scripts are publicly available on both GitHub and Zenodo (10.5281/zenodo.16926413) [16]. Exceptions include the GSD Iluz, Ionescu, and ICD Shin and HK Lee algorithms, which have already been implemented in existing software and are publicly available [17].
Equation 1. Novel step length estimation model based on Weinberg [32]; RMS: Root Mean Square of the acceleration signal between two consecutive ICs; maxmin: amplitude of the acceleration signal between two consecutive ICs; stride length = 2 × step length.
Equation 2. Novel step length estimation model based on Kim [33]; RMS: Root Mean Square of the acceleration signal between two consecutive ICs; μ: average of the acceleration signal between two consecutive ICs; stride length = 2 × step length.
Equation 3. Novel step length estimation model based on Bylemans [34]; RMS: Root Mean Square of the acceleration signal between two consecutive ICs; μ: average of the acceleration signal between two consecutive ICs; Δt: time difference between two consecutive ICs; maxmin: amplitude of the acceleration signal between two consecutive ICs; stride length = 2 × step length.
Performance Metrics
In Table S1 (online supplement), we present the predefined threshold ranges used to classify performance metrics as poor, acceptable, good, or excellent, based on values reported in previous validation studies [1,11]. For each algorithm and relative DMO, a customised validation and ranking approach was employed, following methods similar to those described previously [1]. Briefly, metrics representing benefits (e.g., accuracy) were used directly on a 0–1 scale, while cost metrics (e.g., absolute errors) were normalized to 0–1 using an exponential transformation; all metrics were then weighted and summed to produce an overall performance score.
GSD
The full recording was provided as an input for both systems. Each window of 0.1s of each recording was classified as true positive (TP), false positive (FP), true negative (TN) or false negative (FN) while accuracy, recall (sensitivity), specificity, precision (positive predictive value) were calculated (see Online Supplement page 2). In addition, absolute errors and Intraclass Correlation Coefficients (ICC(2,1)) for the total accumulated duration of all gait sequences, were calculated between the two systems. For the purposes of this study, gait sequences were defined as walking bouts containing at least two consecutive strides of both feet (e.g., R–L–R–L–R–L or L–R–L–R–L–R, where R/L denote right/left foot contacts). Consecutive bouts were separated by breaks of ≥3 s, whereas pauses ≤3 s were considered part of the same bout.
IC
The refined gait sequences from the reference system were provided as input to the algorithms to allow comparisons with the reference. Each IC event in the reference walking bouts was classified as TP, FP, or FN by comparing the IC between the two systems within a tolerance window of ±0.25 s centred around the reference event. Recall (sensitivity), precision (positive predictive value), absolute, and relative error (normalised to average step duration per walking bout) were used as performance metrics.
SL
For stride length estimation both the reference WBs and ICs were provided to allow for reliable comparisons. The measures used included: relative errors, absolute errors and ICC(2,1).
Index Based Algorithm Ranking
An adapted version of the ranking methodology (described previously [1,35]) was employed to compare algorithm performance via a weighted decision matrix. Performance measures were classified as either benefits (e.g., accuracy, recall, specificity, precision, ICC) or costs (e.g., absolute and relative errors), with cost normalised using an exponential transformation to ensure compatibility. Each metric was weighted according to its relevance to validity assessment using customised weights presented in Tables S2-S4 (online supplement). A performance index (ranging from 0 (worst) to 1 (best)) was calculated as a weighted mean, enabling algorithm ranking.
3. Results
A total of 28 participants experienced a median of three long-term conditions, with a range of two to four co-occurring long-term conditions of equal importance. Demographic and clinical characteristics are presented in Table 2.
3.1. Performance Metrics of Algorithms
3.1.1. GSD
We report in Table 3 the GSD algorithms performance metrics. Performance metrics for the nine gait sequence detection algorithms ranged from average to excellent. In the 9 evaluated algorithms, recall (sensitivity) ranged from 0.31 in MacLean to 0.64 in Ionescu adaptive, indicating substantial variation in the ability to correctly detect walking bouts. Specificity was consistently high, ranging from 0.90 (Iluz) to 0.98 (Keren improved and adaptive), reflecting strong performance in correctly identifying non-walking periods. Accuracy varied between 0.81 (MacLean) and 0.92 (Kheirkhahan, Ionescu), while precision (positive predictive value) ranged from 0.38 (MacLean) to 0.63 (Kheirkhahan, Ionescu). Ionescu adaptive, Hickey, and Iluz methods overestimated the total gait sequence duration, whereas the remaining algorithms underestimated it. The ICC(2,1) ranged from 0.37 (Iluz) to 0.64 (Kheirkhahan).
Among the evaluated methods, Kheirkhahan achieved the highest overall performance, exhibiting high accuracy (0.92), specificity (0.96), and precision (0.63), alongside the highest ICC (0.64). The second-best performance was observed in the Ionescu method, which showed comparable accuracy (0.92), precision (0.63), and recall (0.55), but slightly lower ICC (0.60).
A comparison of the performance index between original and novel, or refined algorithms is shown in Figure S5 in the online supplement.
3.1.2. ICD
Table 4 summarises the performance metrics of the evaluated ICD algorithms. Sensitivity (recall) ranged from good to excellent (0.69 (Gu adaptive) to 0.82 (McCamley)), while positive predictive value (precision) varied between 0.65 (Micó-Amigo wrist) and 0.82 (Shin). Absolute timing errors ranged from 0.09 s (12% relative error) for ShinIC to 0.13 s (19% relative error) for HKLeeIC. Among the algorithms, Shin wrist achieved the highest overall performance index of 0.85, reflecting its balanced precision (0.82) and recall (0.77). The second-best performance was observed for McCamley wrist with a performance index of 0.84, demonstrating the highest recall (0.82) but slightly lower precision (0.77). The third-best performance was achieved by the Zijlstra method, achieving a performance index of 0.83, with balanced recall (0.78) and precision (0.77).
Figure 1.
Plot of relative initial contact timing error versus walking speed for all initial contact detection algorithms. Each point reflects the relative error and corresponding walking speed calculated from a single walking bout. The figure illustrates how the measurement error of the wearable system’s initial contact detection varies with walking speed across all algorithms evaluated. The fitted curve represents an exponential decay, ϵ = a e− b x + c, derived via non-linear least squares (parameters a, b, and c). The R2 value indicates the goodness-of-fit between the data points and the fitted curve.
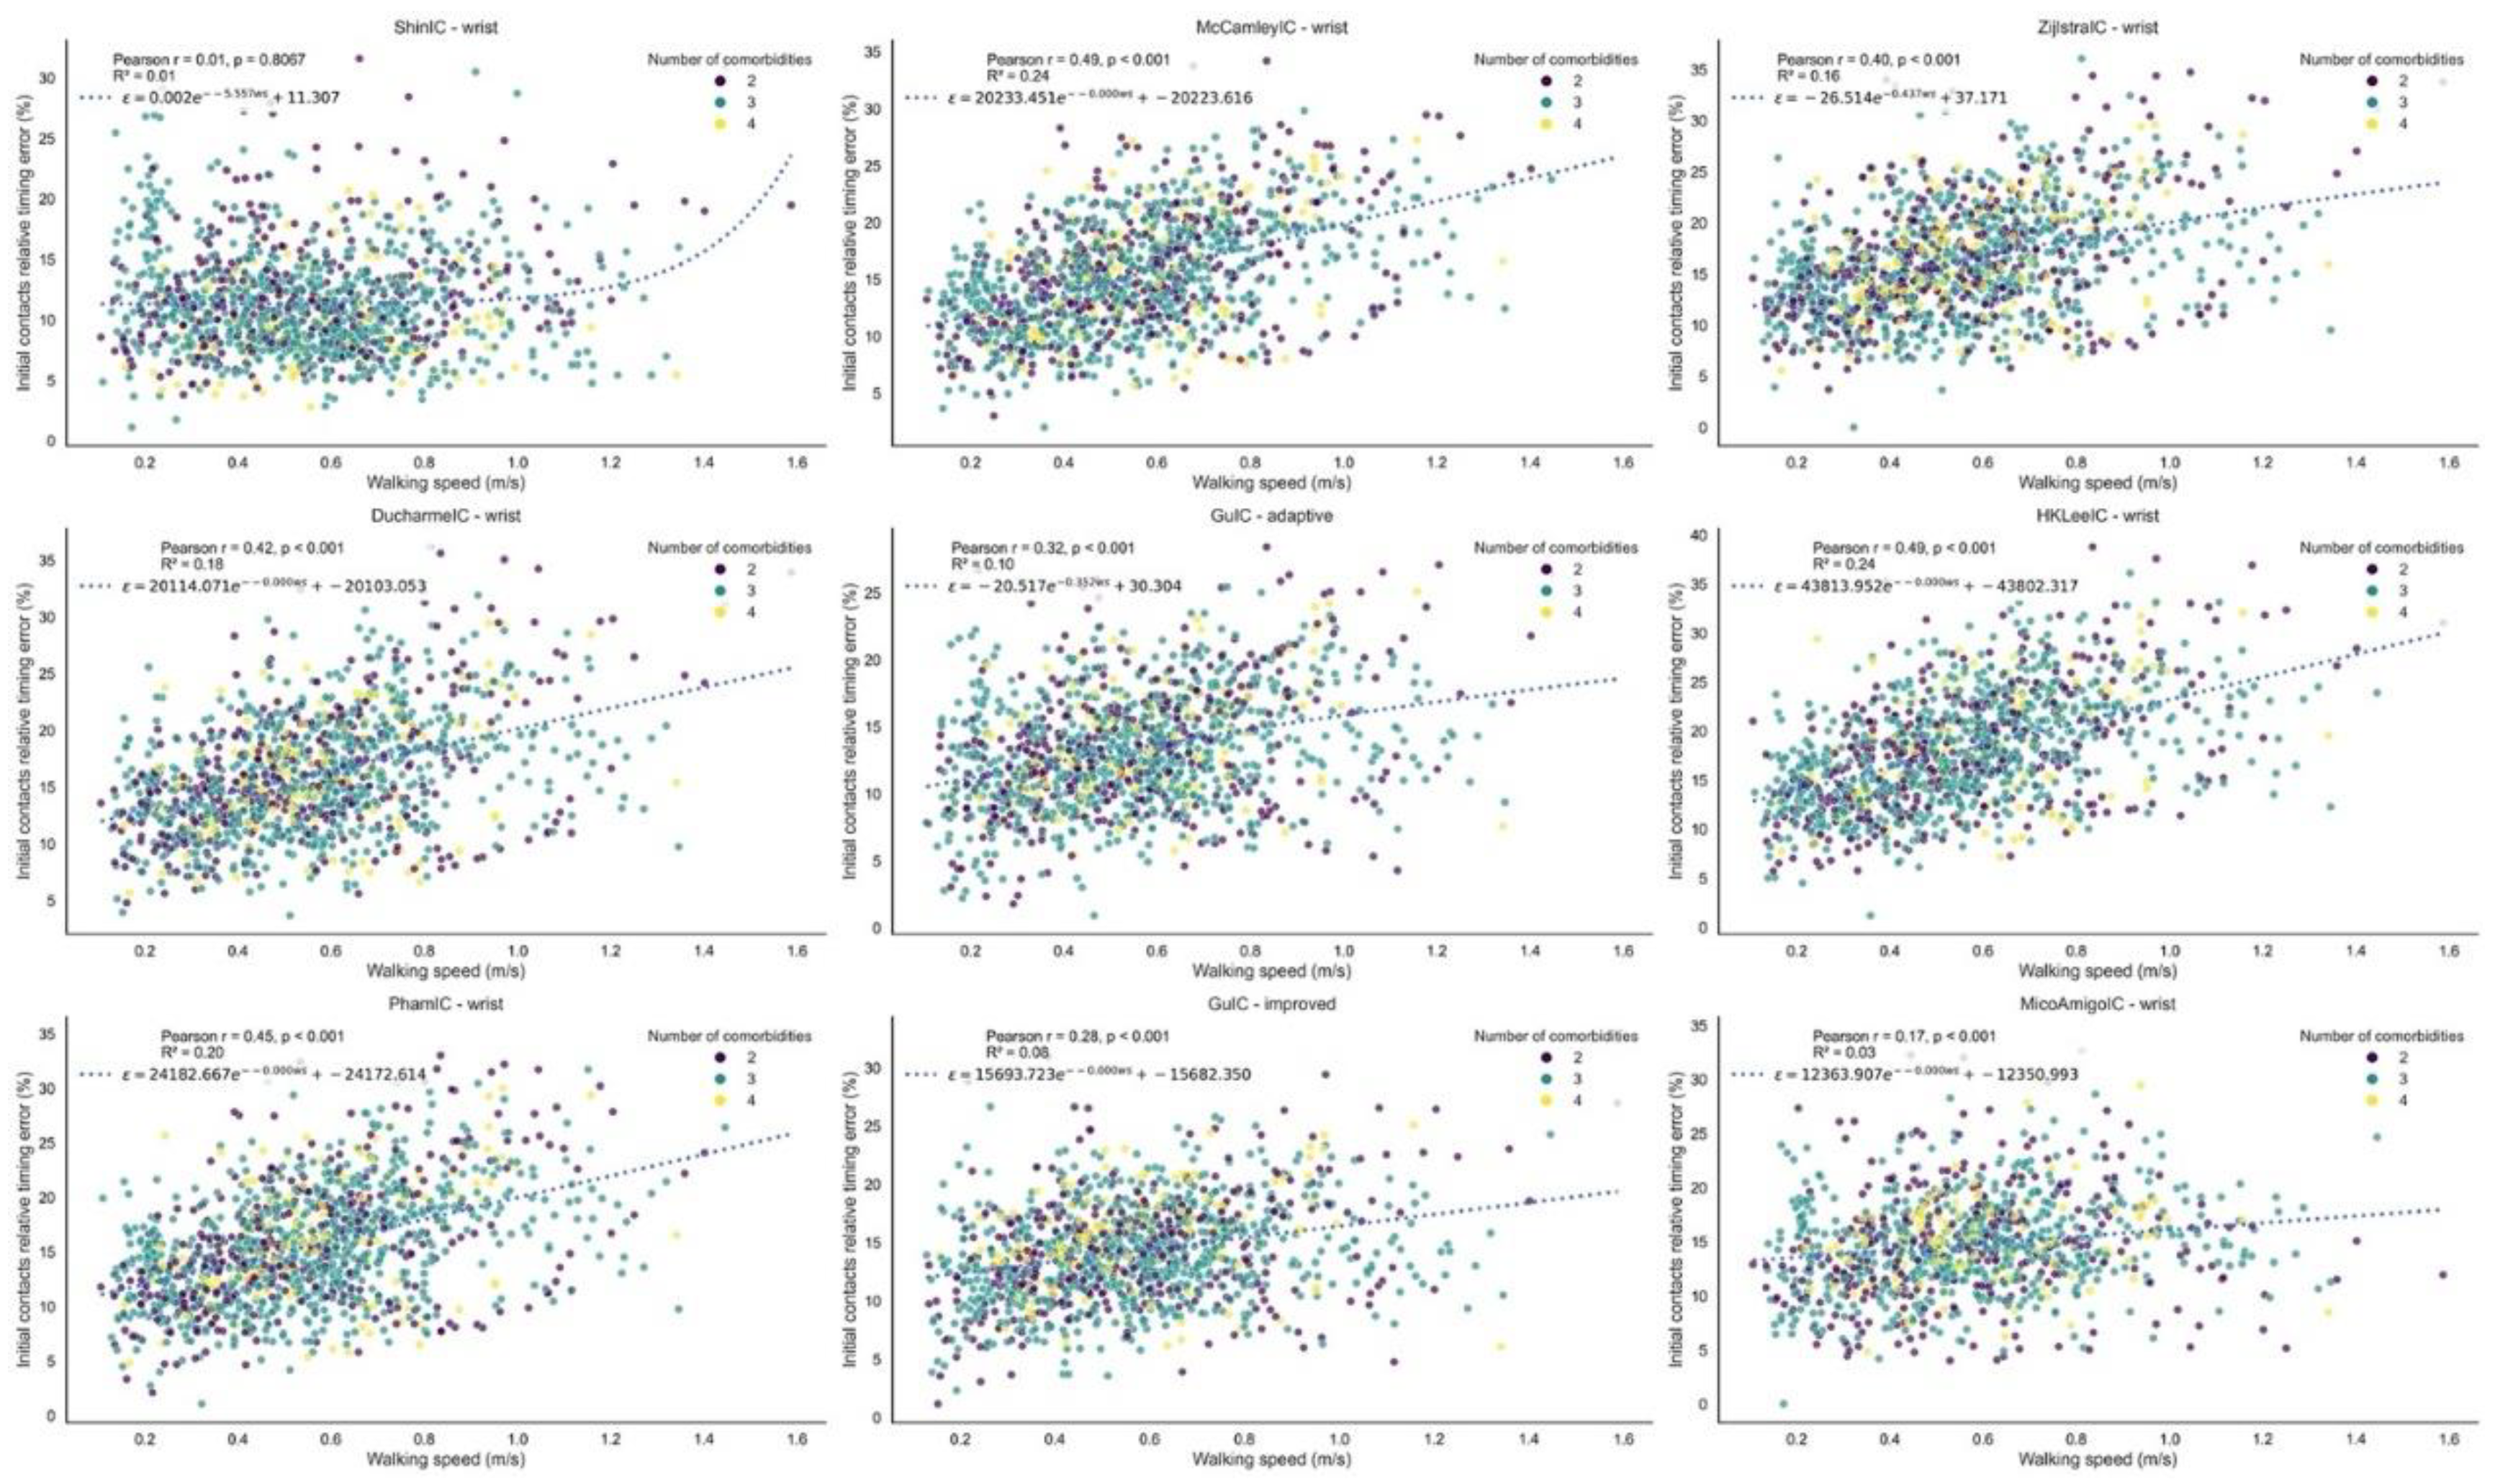
Figure 2.
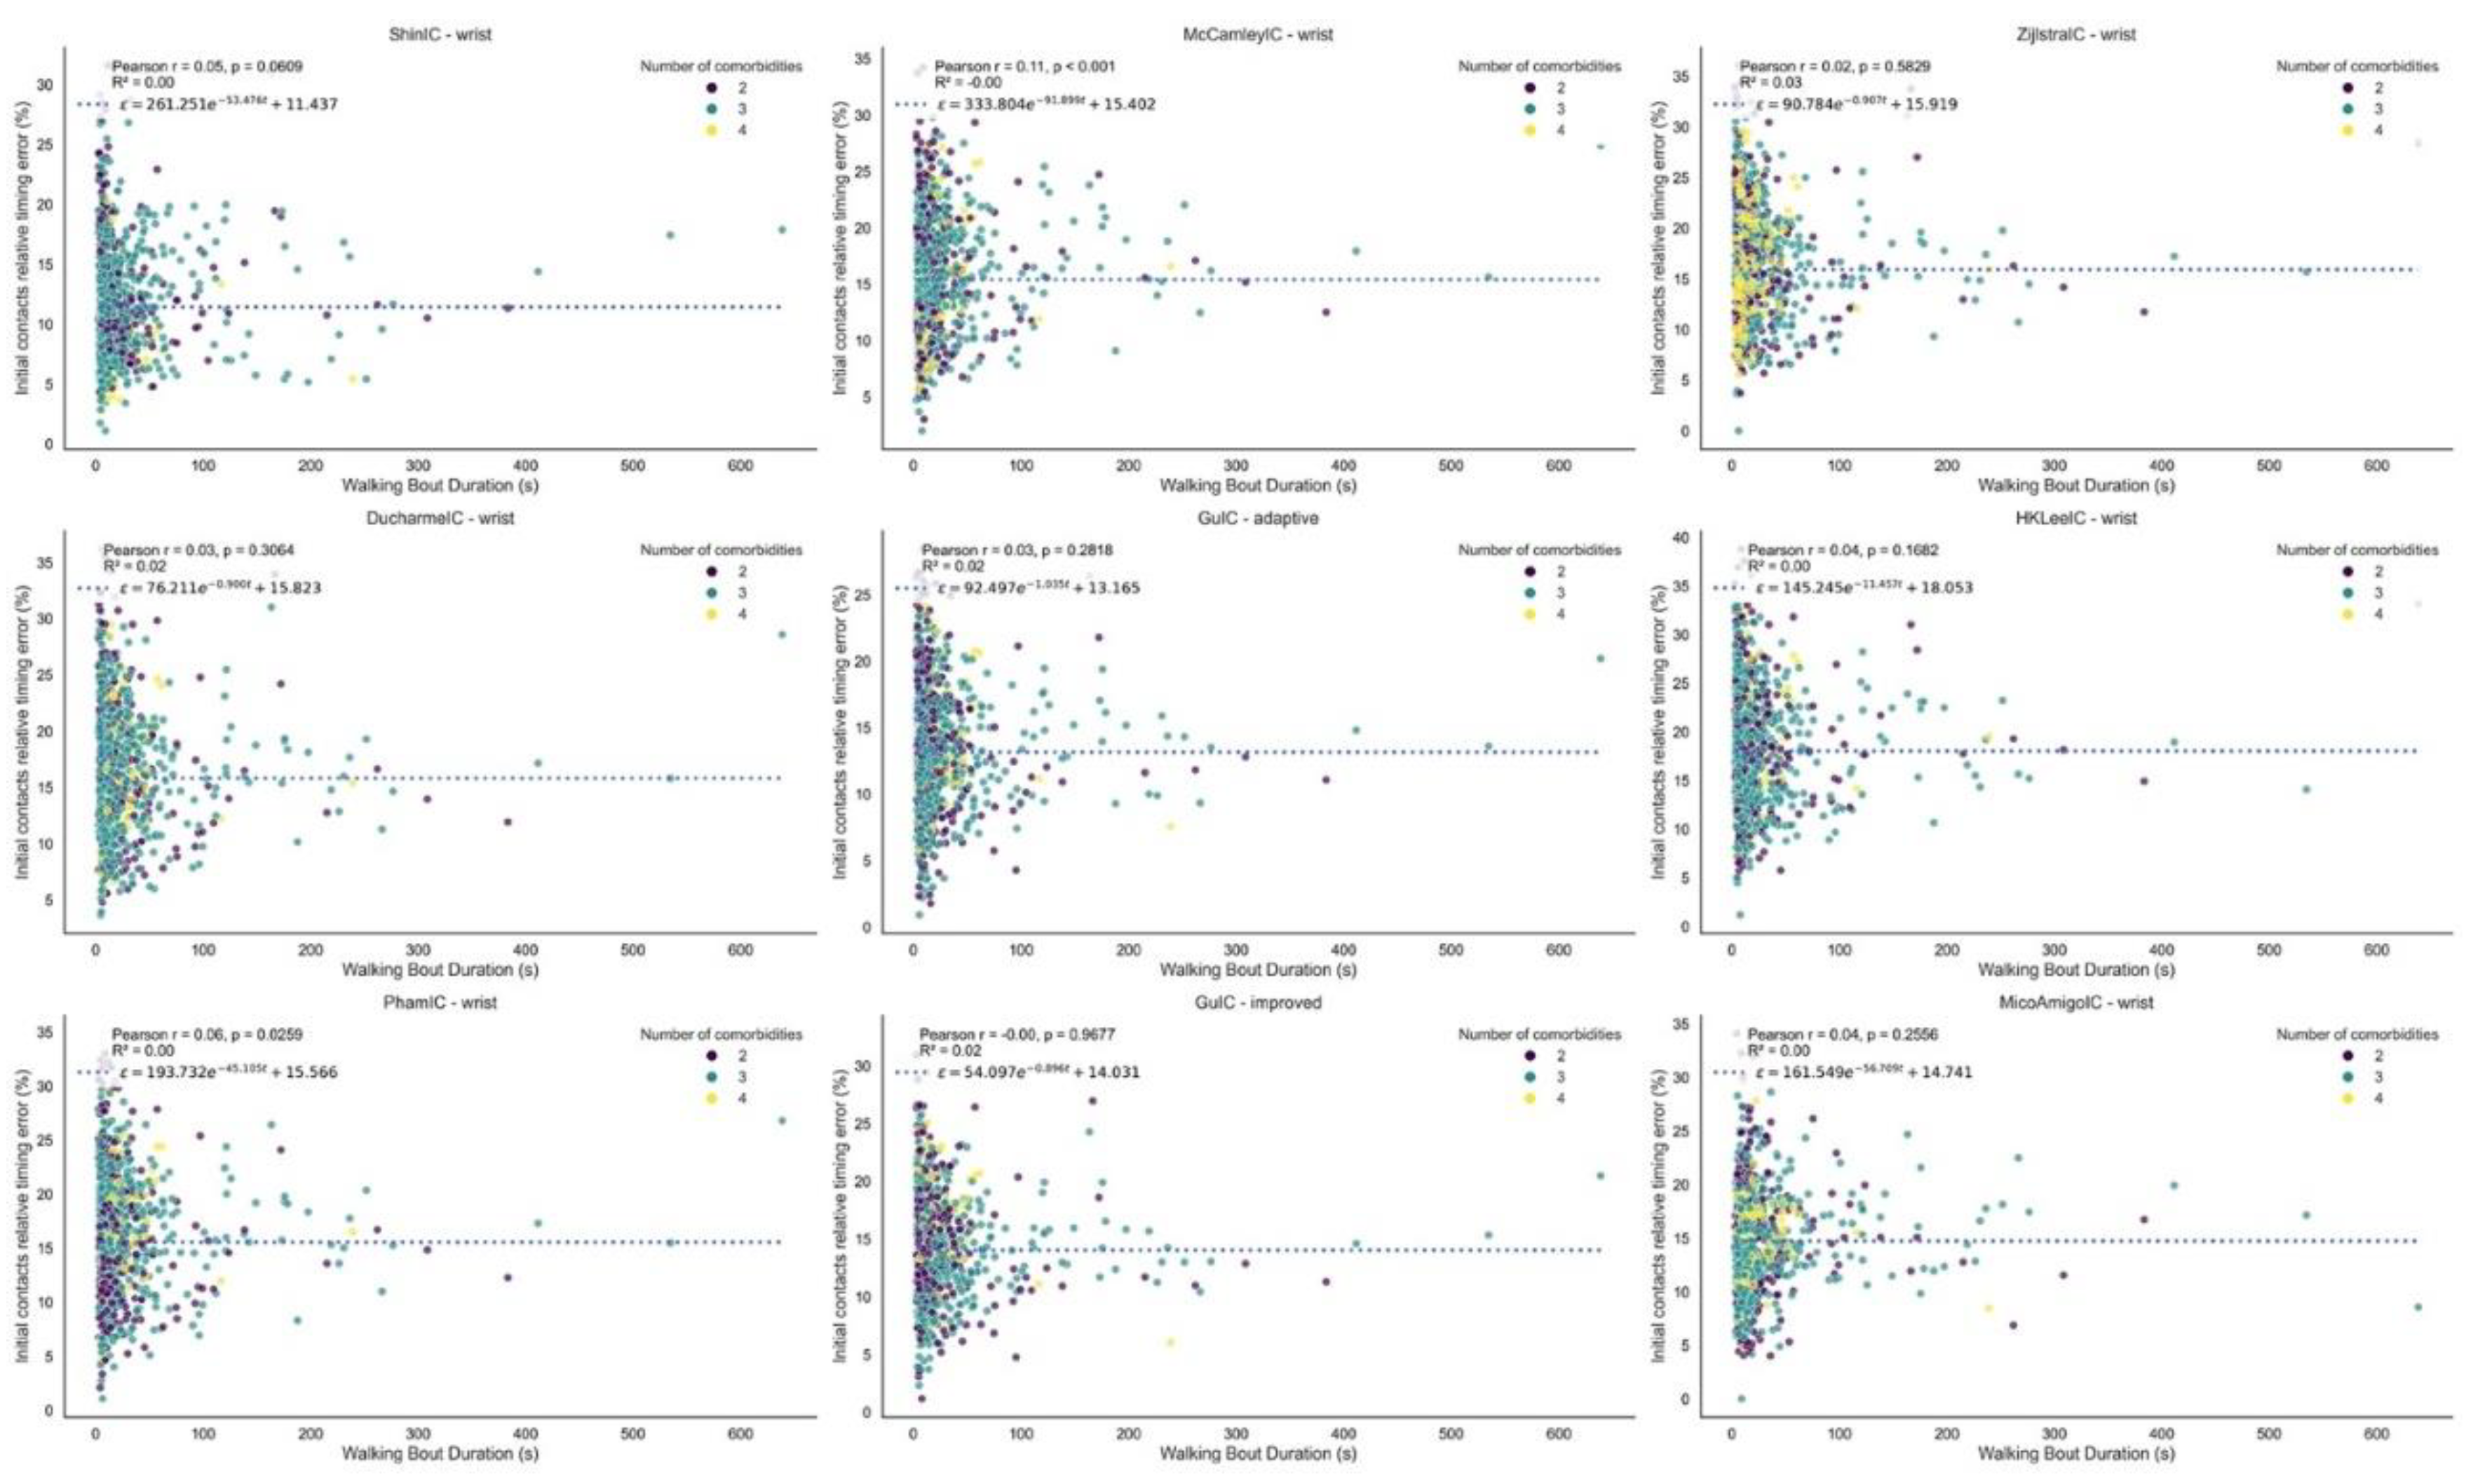
Plot of relative initial contact timing error versus walking bout duration for all initial contact detection algorithms. Each point reflects the relative error and corresponding walking bout duration calculated from a single walking bout. The figure illustrates how the wearable system’s measurement error in initial contact detection varies with walking bout duration across all algorithms evaluated. The fitted curve represents an exponential decay, ϵ = a e− b x + c, derived via non-linear least squares (parameters a, b, and c). The R2 value indicates the goodness-of-fit between the data points and the fitted curve. Each point is colour codes based on the number of comorbidities.
Figure 2.
Plot of relative initial contact timing error versus walking bout duration for all initial contact detection algorithms. Each point reflects the relative error and corresponding walking bout duration calculated from a single walking bout. The figure illustrates how the wearable system’s measurement error in initial contact detection varies with walking bout duration across all algorithms evaluated. The fitted curve represents an exponential decay, ϵ = a e− b x + c, derived via non-linear least squares (parameters a, b, and c). The R2 value indicates the goodness-of-fit between the data points and the fitted curve. Each point is colour codes based on the number of comorbidities.
3.1.3. Stride Length
Performance metrics for stride length algorithms are presented in Table 5. The Weinberg and Bylemans algorithm versions consistently overestimated stride length, while the Kim algorithm versions consistently underestimated it. The Weinberg wrist and wrist adaptive versions showed the best performance, with absolute errors of 0.19m [0.16, 0.21] m and relative errors of 31 [25,37] for both versions. The third best performing method was the Bylemans adaptive version incorporating foot length, with an absolute error of 0.20m [0.18, 0.22] m and a relative error of 32 [27,38].
Figure 3 shows Bland–Altman plots comparing stride length from all four versions of the Weinberg algorithm to the reference. Figure 4 presents the relative stride length error versus walking speed for all versions of the Weinberg algorithm. Figure 5 shows the relative stride length error in relation to walking bout duration for the same algorithm. Supplementary Figure S1 shows similar Bland–Altman plots for the Bylemans algorithm, while Figures S3 and S4 present its relative stride length error versus walking speed and walking bout duration, respectively.
4. Discussion
4.1. Main Findings
This study presents the first comprehensive technical validation of gait detection algorithms for a single wrist-worn device in people with multiple long-term conditions (MLTC), conducted in a real-world setting to ensure ecologically valid assessment.
We successfully extracted spatial and temporal mobility outcomes, including gait sequence detection (GSD), initial contact detection (IC), and stride length estimation (SL), from a wrist-worn sensor in a cohort with MLTC. A major contribution of this study is the successful estimation of stride length from a single wrist-worn sensor with high performance, representing a significant advance in spatial gait analysis from a highly accessible sensor location. Several novel algorithmic adaptations were introduced and tested, specifically tailored to the variability and signal complexity encountered in diverse gait patterns from a cohort with diverse disease entities. To the best of our knowledge, this is the first detailed real-world validation of wrist-derived GSD, ICD, and SL in a multimorbid sample, with 4,200 minutes of continuous monitoring from 28 participants.
4.2. GSD
The three top-performing GSD methods were the Kheirkhahan, Ionescu, and Keren; the latter being the only method originally developed specifically for a wrist-worn device. Following fine-tuning, performance improved by 22.6% in the Kheirkhahan, by 25% in the Ionescu, and by a modest 3% in the Keren. Among the remaining methods, Hickey performed better than Iluz and MacLean wrist versions. While these methods were outperformed by the top three, they nonetheless achieved good recall and precision in detecting gait sequences.
When compared to results in single-disease cohorts reported by Kluge et al. [11], performance metrics (e.g., specificity, recall) in Kheirkhahan, Ionescu, and Hickey algorithms was similar or slightly higher, whereas Iluz performed worse in the present study. We attribute the improved metrics in the former algorithms to the extended fine-tuning implemented here, and the reduced performance of Iluz to the increased heterogeneity of our sample, which included diverse multimorbid populations rather than focusing on a single disease condition. However, the best-performing wrist-based model in our study (Kheirkhahan) underperformed the lower-back–derived performance metrics (sensitivity and precision) reported in the aforementioned sample for participants with a single long-term condition [1], likely reflecting that the earlier validation was disease-specific and the sensor was placed on the lower-back which is a position with fixed axes, whereas the present work targeted a multimorbid sample. In contrast, accuracy and specificity were similar between studies.
Adaptive or personalised variants—where thresholds or constants were dynamically adjusted to individual signal characteristics—were implemented in Ionescu and Keren methods. In both methods the adaptive versions yielded improved performance compared to the original methods but similar to the fine-tuned on-adaptive variants. However, we anticipate that in new samples of multimobidity, the personalised nature of adaptive methods may enable superior generalisation and improved performance compared to their fixed-threshold counterpart.
4.3. ICD
The highest-performing ICD method was the Shin, it achieved a performance index of 0.85 and demonstrated stable error levels across walking speeds. The McCamley method ranked second, (performance index: 0.84). The Zijlstra method ranked third, yielding a performance index of 0.83 and an improvement of almost 23% compared to original method. The Ducharme method achieved a performance index of 0.82. The Gu, HKLee, Pham, and Micó-Amigo methods demonstrated slightly lower performance, with Micó-Amigo, being the only approach with an index below 0.80 (0.78). Across all methods, the absolute timing error ranged from 0.09s for the best performing method to 0.13s. When compared with prior reports in single-disease cohorts using a single lower-back sensor, our fine-tuned wrist adaptations achieved comparable recall, precision, as well as timing errors, across all algorithms [1]. This strong performance, despite the use of wrist-worn sensor, is likely due to the systematic fine-tuning process and the development of novel algorithmic variants. The introduction of novel algorithmic versions and fine tunned thresholds was efficacious, while adaptive version in one algorithm (Gu) with thresholds dynamically adjusted to individual signal patterns slightly outperformed the respective fixed-threshold version. However, we expect that adaptive versions will perform better in new samples given that they are adaptive to the individual signal and gait pattern.
Most algorithms exhibited higher errors at faster walking speeds (Figure 1), but Shin and Micó-Amigo methods maintained stable error levels across all speeds, making them more robust for diverse gait patterns. The robustness of the Shin and Micó-Amigo algorithms across walking speeds likely reflects their reliance on phase-based (Shin) or time-aligned template-matching (Micó-Amigo) detection strategies, which are less sensitive to amplitude variation and step frequency changes compared to the predominantly threshold-based approaches used by other methods. This poorer performance at higher speeds may reflect altered arm-swing or other upper-limb movements and increased high-frequency components. Regarding walking bout duration (Figure 2), all methods demonstrated robustness, with no notable degradation in performance across short or long bouts. For the exponential fits, Pearson r values were close to zero and R2 values were very low (<0.04), indicating no meaningful correlation or trend. Similarly, the number of comorbidities (within the limited range of 2–4) did not exhibit any discernible influence on error across different walking speeds or bout durations. The only noticeable pattern was a confined increase at very small walking bout durations (<4 seconds), after which performance stabilised.
4.4. SL estimation
The top-performing stride length estimation method consisted of the Weinberg algorithm, the fine-tuned wrist version achieved the highest performance index (0.72), all versions exhibited minimal bias, and most values fell within the ±1.96 SD limits in Bland–Altman analysis. Adaptive versions incorporated the root mean square (RMS) of acceleration between consecutive initial contacts, based on the theoretical assumption that RMS magnitude increases with step length. In the foot length–augmented version, an additional constant term proportional to the participant’s foot length was added (parameter B, Table 1). The latter parameter was not fine-tuned in the wrist and adaptive versions to avoid overfitting to the study population, while the inclusion of the foot length added to the intensity-based model is biomechanically justified given the proportional relationship between foot size and stride length. All four versions of the Weinberg method exhibited a biphasic bias–error relationship in the Bland–Altman analysis: each model overestimated stride length at shorter strides, underestimated at longer strides, and agreed only at intermediate stride lengths, which comprised the majority of observations given the approximately normal distribution of values in the plots. This inconsistency suggests that over- and underestimation may balance out across the measurement range. Notably, in the foot-length–augmented versions, trend was more pronounced, likely because adding foot length as a parameter to the intensity-based model amplifies magnitude-dependent scaling effects, increasing proportional bias and thus exaggerating over- or underestimation at the extremes.
The second-highest performing method was Bylemans. Its adaptive version also incorporated RMS between steps, improving robustness to speed variation. Similar to Weinberg, foot length–augmented versions were tested and the best performance metrics were achieved by the adaptive version incorporating foot length (0.66), while the worst metrics were observed in the wrist version (0.55). The Bylemans versions did not exhibit a consistent trend in the Bland–Altman plots, indicating that their estimation errors were randomly distributed across the measurement range without systematic over- or underestimation. However, the wrist foot-length–augmented model, showed a biphasic pattern similar to the Weinberg versions. Among the three trend-free versions, the wrist adaptive model displayed a higher number of outliers and the worst metrics overall, suggesting greater variability in estimation accuracy and reduced reliability across stride lengths compared to the others. Across both methods (i.e., Bylemans, Weinberg), relative error was higher at lower walking speeds but decreased and stabilised rapidly across the observed range (Figure 4 and Figure S3). Bylemans’ adaptive version appeared less speed-sensitive than the other variants. Neither Weinberg nor Bylemans showed any association between relative error and walking bout duration. The range of comorbidities did not appear to affect error patterns.
The Kim algorithm ranked third. Its mathematical formulation proved less effective in adjusting stride length values within walking bouts, reflected in the Bland–Altman plot (Figure S2), where stride length estimates repeatedly cluster along discrete values, indicating the algorithm’s inability to capture natural variability. Hence, we suggest the use of Weinberg and Bylemans methods.
When comparing our relative stride length errors to those reported from a lower-back sensor in single-disease populations using biomechanical models [1], results were broadly comparable, though some cohorts showed lower errors (25–30% vs. 31% in our study). Machine learning (ML) models on lower-back sensor reported smaller errors (Root Mean Squared Error (RMSE) 6–7 cm) [36], while our best intensity-based methods reached absolute errors of 19 cm. For wrist-worn sensor, recent ML models achieved RMSE values of 14–18.3 cm and Mean Absolute Error (MAE) of 11.6–14.5cm [37], slightly outperforming our intensity-based models. Direct comparisons remain limited by differing error metrics, but these findings point to a performance gap between biomechanical, intensity-based, and machine learning approaches. Given that wrist-worn IMU axes are not fixed in anatomical space, traditional biomechanics-based models cannot be applied directly; instead, the fine-tuned intensity-based approaches presented here—incorporating adaptive RMS and foot length augmentation—offer a computationally efficient alternative requiring minimal processing power and suitable for real-time implementation. While thresholds optimised in this study may not generalise across all populations, these methods represent a significant advance in spatial gait analysis from wrist-worn sensor. Future work will aim to build on this foundation using AI-based models that can further account for the complexities of human movement, including non-linear gait adaptations and context-dependent variability.
4.5. Algorithm Performance and Gait Pattern Diversity
While some algorithms achieved consistently high validity across the full sample, others showed performance limitations. Higher performing algorithms were able to detect and accommodate the diversity of gait patterns present in this multimorbid population including different disease entities such as cardiovascular disease, chronic obstructive pulmonary disease, Parkinson’s disease, hypertension, arthritis, and proximal femur fracture, where individuals often exhibit multiple, overlapping gait impairments. This high degree of variability—both across different individuals and within the same individual—is a defining feature of real-world multimorbidity. Algorithms that are unable to accommodate this complexity are therefore not suitable for use in such populations.
4.6. Strengths and Limitations
A major contribution of this study is the successful estimation of stride length from wrist-worn sensor with high performance, representing a significant advance in spatial gait analysis from a highly accessible sensor location. Our work expands prior validation efforts, which have predominantly focused on lower-back sensor and single disease cohorts, by demonstrating that accurate and reliable mobility outcomes can be extracted from wrist-worn devices in populations with diverse, multiple long-term conditions.
Importantly, we have introduced the first stride length estimation algorithm specifically tailored and validated for wrist-worn sensor, based on dead reckoning principles commonly used in wearable navigation systems, thereby complementing existing spatial-temporal mobility outcomes. Unlike traditional biomechanics-based models, which are computationally complex [28] and less suited for real-time use, the presented stride length algorithms are computationally efficient, making them well-suited for online applications. However, because these algorithms were fine-tuned to a specific multimorbid sample, their high performance may not generalise to other populations with different gait patterns, a limitation akin to overfitting in machine learning models, contrasting with more generalisable biomechanics-based approaches. Hence, we emphasise the use of the novel adaptive and foot length-augmented versions, which incorporate individual-specific adjustments to improve robustness and applicability across diverse populations. All algorithms evaluated here are openly available and will be integrated into an efficient processing pipeline designed to support real-world mobility monitoring and longitudinal data aggregation in clinical and research settings. This approach facilitates scalable deployment of wearable technology for remote health assessment and monitoring in complex multimorbid populations.
Nevertheless, several limitations should be acknowledged. The analysis was based on a pre-existing dataset designed for single long-term conditions, and the small multimorbid subsample precluded stratification by specific disease combinations or functional impairment severity. Given the wide spectrum of gait alterations associated with different pathologies and disease severity, future investigations (ISRCTN25008143) should include carefully phenotyped multimorbid clusters and matched reference standards to further validate and refine these algorithms, enabling targeted clinical applications and personalised monitoring strategies. Furthermore, the reference data were derived from refined gait sequences, whereby micro walking bouts separated by <3 seconds were merged. This approach may disadvantage algorithms capable of detecting gait at the micro-bout level, leading to lower performance metrics in our evaluation.
Furthermore, while this study focused on signal processing methods to maximise granularity and interpretability at the sample frequency level, we did not include ML approaches. Current published AI/ML gait models lack the necessary temporal resolution for direct comparison with our reference methods, which support precision (gait detection) per sample. A recent self-supervised learning model demonstrates gait detection including stride length and walking speed with granularity at the level of 10-second or longer walking bouts, highlighting the potential of AI approaches for coarser temporal resolutions. Future work will incorporate ML-based models for high-granularity gait detection from wrist sensors, leveraging the strong performance of the validated algorithms presented here while aiming to capture additional variability in multimorbid populations with diverse gait characteristics.
5. Conclusions
This study successfully developed, fine-tuned, and validated algorithmic approaches for extracting key mobility outcomes (gait sequence detection, initial contact timing, and stride length estimation) from wrist-worn sensor in a diverse, multimorbid population in real-world conditions. Our findings demonstrate that these methods perform robustly across diverse gait patterns, surpassing or matching the accuracy of existing algorithms originally designed for other sensor locations or single-disease cohorts. In addition, novel intensity-based, computationally efficient methods for stride length estimation exemplify the scalability of this approach using widely accessible wearable technology. This paves the way for improved remote health assessment and personalised rehabilitation strategies in diverse clinical populations.
Supplementary Materials
The following supporting information can be downloaded at the website of this paper posted on Preprints.org. Online Supplement.
Author Contributions
Conceptualisation: D.M., I.V., and S.D.D.; Methodology: D.M., I.V., and S.D.D.; Software: D.M.; Validation: D.M., S.D.D.; Formal analysis: D.M.; Visualisation: D.M.; Data curation: L.A., K.S., A.C., and H.H.; Writing: D.M., L.A., K.S., H.H., A.C., I.V., and S.D.D.
Funding
This work was supported by the Medical Research Council (UKRI/MR/B000091/1). SDD was also supported by the IDEA-FAST project that has received funding from the Innovative Medicines Initiative 2 Joint Undertaking (JU) under grant agreement No. 853981. This JU receives support from the European Union’s Horizon 2020 research and innovation program and the European Federation of Pharmaceutical Industries and Associations (EFPIA). SDD and LA were also supported by the National Institute for Health Research (NIHR) Newcastle Biomedical Research Centre (BRC) based at The Newcastle upon Tyne Hospital NHS Foundation Trust, Newcastle University and the Cumbria, Northumberland and Tyne and Wear (CNTW) NHS Foundation Trust. SDD and LA were also supported by the NIHR/Wellcome Trust Clinical Research Facility (CRF) infrastructure at Newcastle upon Tyne Hospitals NHS Foundation Trust. SDD was supported by the UK Research and Innovation (UKRI) Engineering and Physical Sciences Research Council (EPSRC) (Grant Ref: EP/X031012/1 and Grant Ref: EP/X036146/1). All opinions are those of the authors and not the funders. The content in this publication reflects the authors’ view, and neither IMI nor the European Union, EFPIA, NHS, NIHR or any associated partners are responsible for any use that may be made of the information contained herein.
Data Availability Statement
The complete dataset from the Mobilise-D Technical Validation study is available on Zenodo: https://zenodo.org/records/15861907.
Acknowledgments
The authors would like to acknowledge all the participants of the study for their time and enthusiastic contribution. The authors also acknowledge the members of the Mobilise-D Work Package 2 for their efforts in collecting and curating the public dataset used in this study.
Conflicts of Interest
D.M., L.A., K.S., H.H., A.C., and I.V. have nothing to disclose. S.D.D. is a shareholder in Enoda Health Ltd.
Abbreviations
The following abbreviations are used in this manuscript:
| DMO | Digital Mobility Outcome |
| IMU | Inertial Measurement Unit |
| TVS | Technical Validation Study |
| MLTC | Multiple Long-Term Conditions |
| GSD | Gait Sequence Detection |
| IC / ICD | Initial Contact / Initial Contact Detection |
| SL | Stride Length Estimation |
| PFF | Proximal Femur Fracture |
| COPD | Chronic Obstructive Pulmonary Disease |
| PD | Parkinson’s Disease |
| MS | Multiple Sclerosis |
| CHF | Chronic Heart Failure |
| RMS | Root Mean Square |
| μ | Mean of the acceleration signal between two consecutive ICs |
| Δt | Time difference between two consecutive ICs |
| TP | True Positive |
| FP | False Positive |
| TN | True Negative |
| FN | False Negative |
| R/L | Right/Left (foot) |
| MAE | Mean Absolute Error |
| RMSE | Root Mean Squared Error |
| CWT | Continuous Wavelet Transform |
| SD | Standard Deviation |
| AI/ML | Artificial Intelligence / Machine Learning |
References
- Micó-Amigo, M.E., et al., Assessing real-world gait with digital technology? Validation, insights and recommendations from the Mobilise-D consortium. Journal of NeuroEngineering and Rehabilitation, 2023. 20(1): p. 78. [CrossRef]
- Megaritis, D., et al., Effects of pharmacological and non-pharmacological interventions on physical activity outcomes in COPD: a systematic review and meta-analysis. ERJ Open Research, 2023. 9(5): p. 00409-2023. [CrossRef]
- Delgado-Ortiz, L., et al., How do people with COPD walk? A European study on digitally measured real-world gait. European Respiratory Journal, 2025: p. 2402303. [CrossRef]
- Mobilise-D. Connecting digital mobility assessment to clinical outcomes for regulatory and clinical endorsement [Accessed 1 Jul 2025].
- Kirk, C., et al., Mobilise-D insights to estimate real-world walking speed in multiple conditions with a wearable device. Scientific Reports, 2024. 14(1): p. 1754. [CrossRef]
- Kingston, A., et al., Projections of multi-morbidity in the older population in England to 2035: estimates from the Population Ageing and Care Simulation (PACSim) model. Age and Ageing, 2018. 47(3): p. 374-380. [CrossRef]
- Kobsar, D., et al., Validity and reliability of wearable inertial sensors in healthy adult walking: a systematic review and meta-analysis. Journal of NeuroEngineering and Rehabilitation, 2020. 17(1): p. 62. [CrossRef]
- Germini, F., et al., Accuracy and Acceptability of Wrist-Wearable Activity-Tracking Devices: Systematic Review of the Literature. J Med Internet Res, 2022. 24(1): p. e30791. [CrossRef]
- Truslow, J., et al., Understanding activity and physiology at scale: The Apple Heart & Movement Study. npj Digital Medicine, 2024. 7(1): p. 242. [CrossRef]
- Brand, Y.E., et al., Gait Detection from a Wrist-Worn Sensor Using Machine Learning Methods: A Daily Living Study in Older Adults and People with Parkinson’s Disease. Sensors (Basel), 2022. 22(18). [CrossRef]
- Kluge, F., et al., Real-World Gait Detection Using a Wrist-Worn Inertial Sensor: Validation Study. JMIR Form Res, 2024. 8: p. e50035.
- Silvia, D.D., Mobilise-D Technical Validation Study (TVS) dataset (V1.0.2) Zenodo, Editor. 2025.
- Mazzà, C., et al., Technical validation of real-world monitoring of gait: a multicentric observational study. BMJ Open, 2021. 11(12): p. e050785. [CrossRef]
- Sinnige, J., et al., The Prevalence of Disease Clusters in Older Adults with Multiple Chronic Diseases – A Systematic Literature Review. PLOS ONE, 2013. 8(11): p. e79641. [CrossRef]
- Salis, F., et al., A multi-sensor wearable system for the assessment of diseased gait in real-world conditions. Frontiers in Bioengineering and Biotechnology, 2023. 11. [CrossRef]
- Dimitrios, M., Multimobility_Wrist: Algorithms for Digital Mobility Assessment from Wrist-Worn Sensors. 2025, Zenodo.
- Küderle, A., Tasca, P., Bicer, M., Kirk, C., Megaritis, D., Hinchliffe, C., Stihi, A., Muecke, A., Babar, Z., Kluge, F., Mueller, and M. A., C., Del Din, S., Cereatti, A., Rochester, L., Rooks, D., & Caulfield, B. , MobGap - The Mobilise-D algorithm toolbox.
- Hickey, A., et al., Detecting free-living steps and walking bouts: validating an algorithm for macro gait analysis. Physiol Meas, 2017. 38(1): p. N1-n15.
- Kheirkhahan, M., et al. Adaptive walk detection algorithm using activity counts. in 2017 IEEE EMBS International Conference on Biomedical & Health Informatics (BHI). 2017.
- MacLean, M.K., et al. Walking Bout Detection for People Living in Long Residential Care: A Computationally Efficient Algorithm for a 3-Axis Accelerometer on the Lower Back. Sensors, 2023. 23. [CrossRef]
- Keren, K., et al., Quantification of Daily-Living Gait Quantity and Quality Using a Wrist-Worn Accelerometer in Huntington’s Disease. Front Neurol, 2021. 12: p. 719442. [CrossRef]
- Paraschiv-Ionescu, A., et al., Locomotion and cadence detection using a single trunk-fixed accelerometer: validity for children with cerebral palsy in daily life-like conditions. Journal of NeuroEngineering and Rehabilitation, 2019. 16(1): p. 24. [CrossRef]
- Iluz, T., et al., Automated detection of missteps during community ambulation in patients with Parkinson’s disease: a new approach for quantifying fall risk in the community setting. Journal of NeuroEngineering and Rehabilitation, 2014. 11(1): p. 48. [CrossRef]
- Ducharme, S.W., et al., A Transparent Method for Step Detection using an Acceleration Threshold. J Meas Phys Behav, 2021. 4(4): p. 311-320. [CrossRef]
- Gu, F., et al., Robust and Accurate Smartphone-Based Step Counting for Indoor Localization. IEEE Sensors Journal, 2017. 17(11): p. 3453-3460.
- Shin, S.H. and C.G. Park, Adaptive step length estimation algorithm using optimal parameters and movement status awareness. Med Eng Phys, 2011. 33(9): p. 1064-71. [CrossRef]
- Lee, H., et al., Computational methods to detect step events for normal and pathological gait evaluation using accelerometer. Electronics Letters, 2010. 46: p. 1185-1187. [CrossRef]
- Zijlstra, W. and A.L. Hof, Assessment of spatio-temporal gait parameters from trunk accelerations during human walking. Gait Posture, 2003. 18(2): p. 1-10.
- Micó-Amigo, M.E., et al., A novel accelerometry-based algorithm for the detection of step durations over short episodes of gait in healthy elderly. Journal of NeuroEngineering and Rehabilitation, 2016. 13(1): p. 38.
- McCamley, J., et al., An enhanced estimate of initial contact and final contact instants of time using lower trunk inertial sensor data. Gait Posture, 2012. 36(2): p. 316-8.
- Pham, M.H., et al., Validation of a Step Detection Algorithm during Straight Walking and Turning in Patients with Parkinson’s Disease and Older Adults Using an Inertial Measurement Unit at the Lower Back. Front Neurol, 2017. 8: p. 457.
- Weinberg, H., Using the ADXL202 in Pedometer and Personal Navigation Applications. Analog Devices AN-602 Application Note, 2002. 2: p. 1-6.
- Kim, J., et al., A Step, Stride and Heading Determination for the Pedestrian Navigation System. Journal of Global Positioning Systems, 2004. 3: p. 273-279.
- Bylemans, I., M. Weyn, and M. Klepal. Mobile Phone-Based Displacement Estimation for Opportunistic Localisation Systems. in 2009 Third International Conference on Mobile Ubiquitous Computing, Systems, Services and Technologies. 2009.
- Bonci, T., et al. An Objective Methodology for the Selection of a Device for Continuous Mobility Assessment. Sensors, 2020. 20, DOI: 10.3390/s20226509. [CrossRef]
- Zadka, A., et al., A wearable sensor and machine learning estimate step length in older adults and patients with neurological disorders. NPJ Digit Med, 2024. 7(1): p. 142. [CrossRef]
- Brand, Y.E., et al., Continuous Assessment of Daily-Living Gait Using Self-Supervised Learning of Wrist-Worn Accelerometer Data. medRxiv, 2025.
Figure 3.
Bland–Altman plots illustrating the agreement and potential bias between sensor-derived and reference stride length measurements for the Weinberg algorithm. Each point is derived from a single walking bout, plotted as the difference between methods against their mean. Distributions of the stride length differences and means are shown along the top and right margins, respectively. Differences were calculated as wearable – reference, such that positive values indicate overestimation by the wearable and negative values indicate underestimation. Each point is colour codes based on the number of comorbidities.
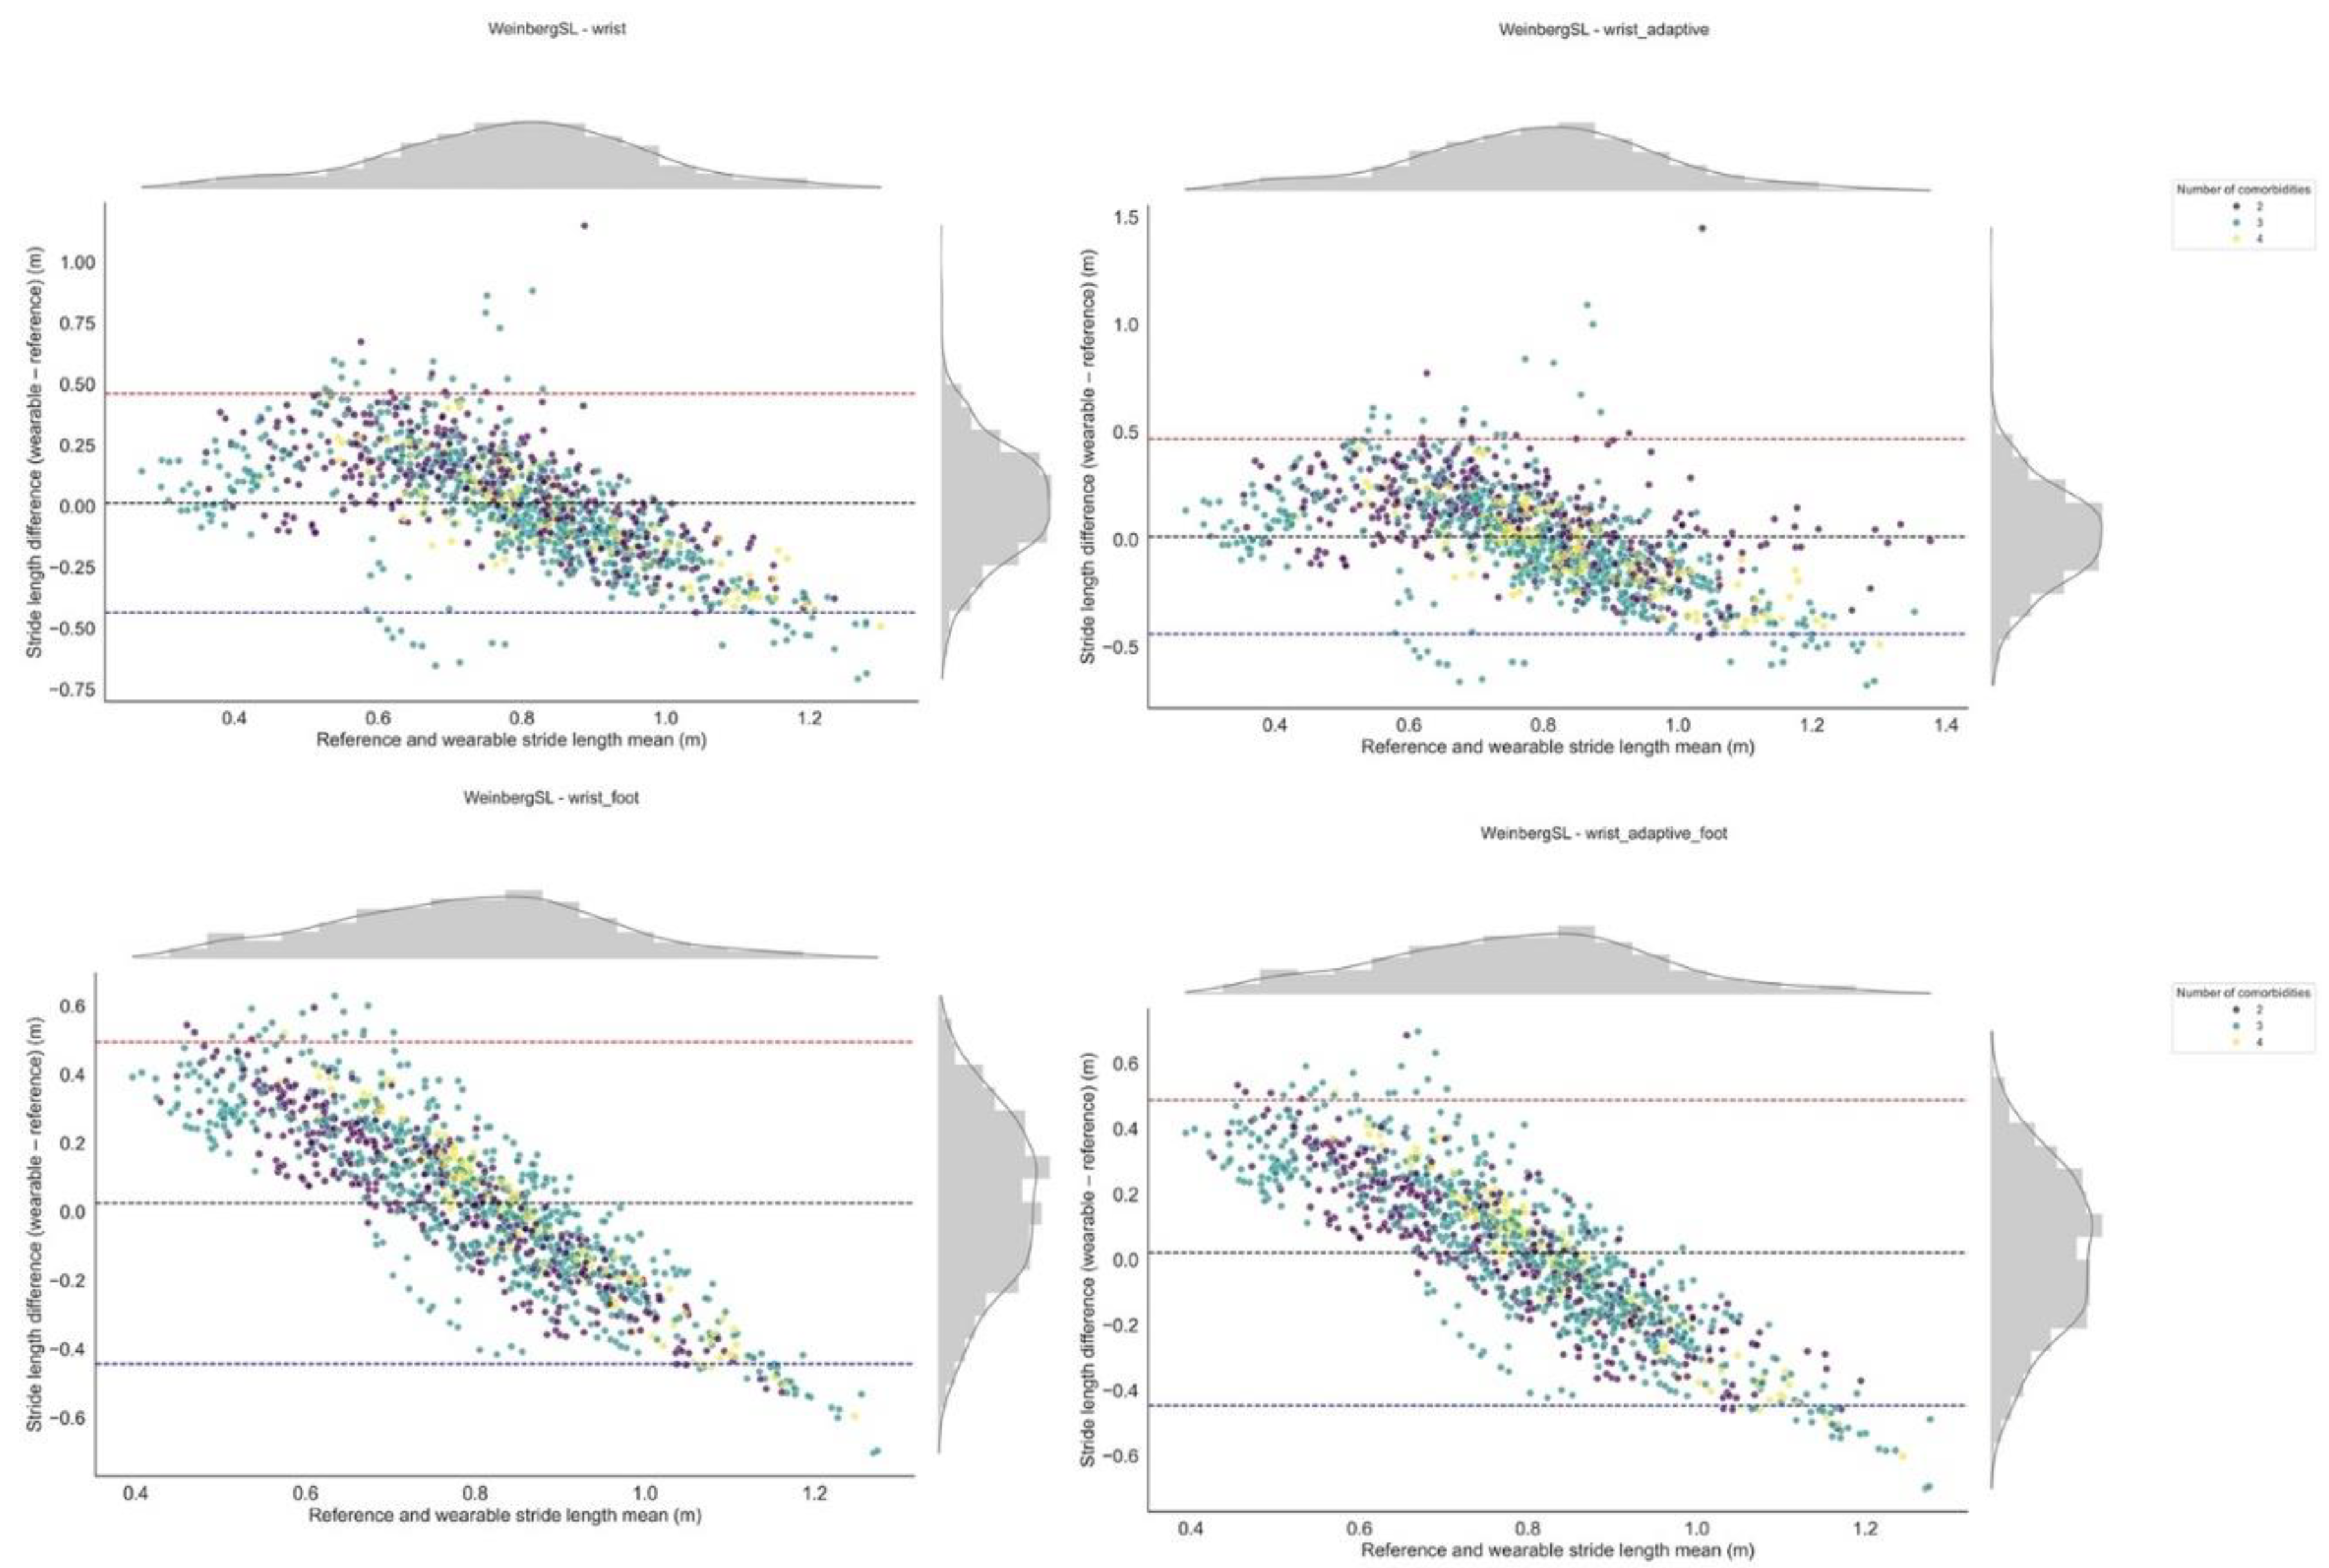
Figure 4.
Plot of relative stride length error (%) versus walking speed for the Weinberg algorithm. Each point reflects the relative error and corresponding walking speed calculated from a single walking bout. The figure illustrates how the wearable system’s measurement error varies with walking speed. The fitted curve represents an exponential decay, ϵ = a e− b x + c, derived via non-linear least squares (parameters a, b, and c). The R2 value indicates the goodness-of-fit between the data points and the fitted curve. Each point is colour codes based on the number of comorbidities.
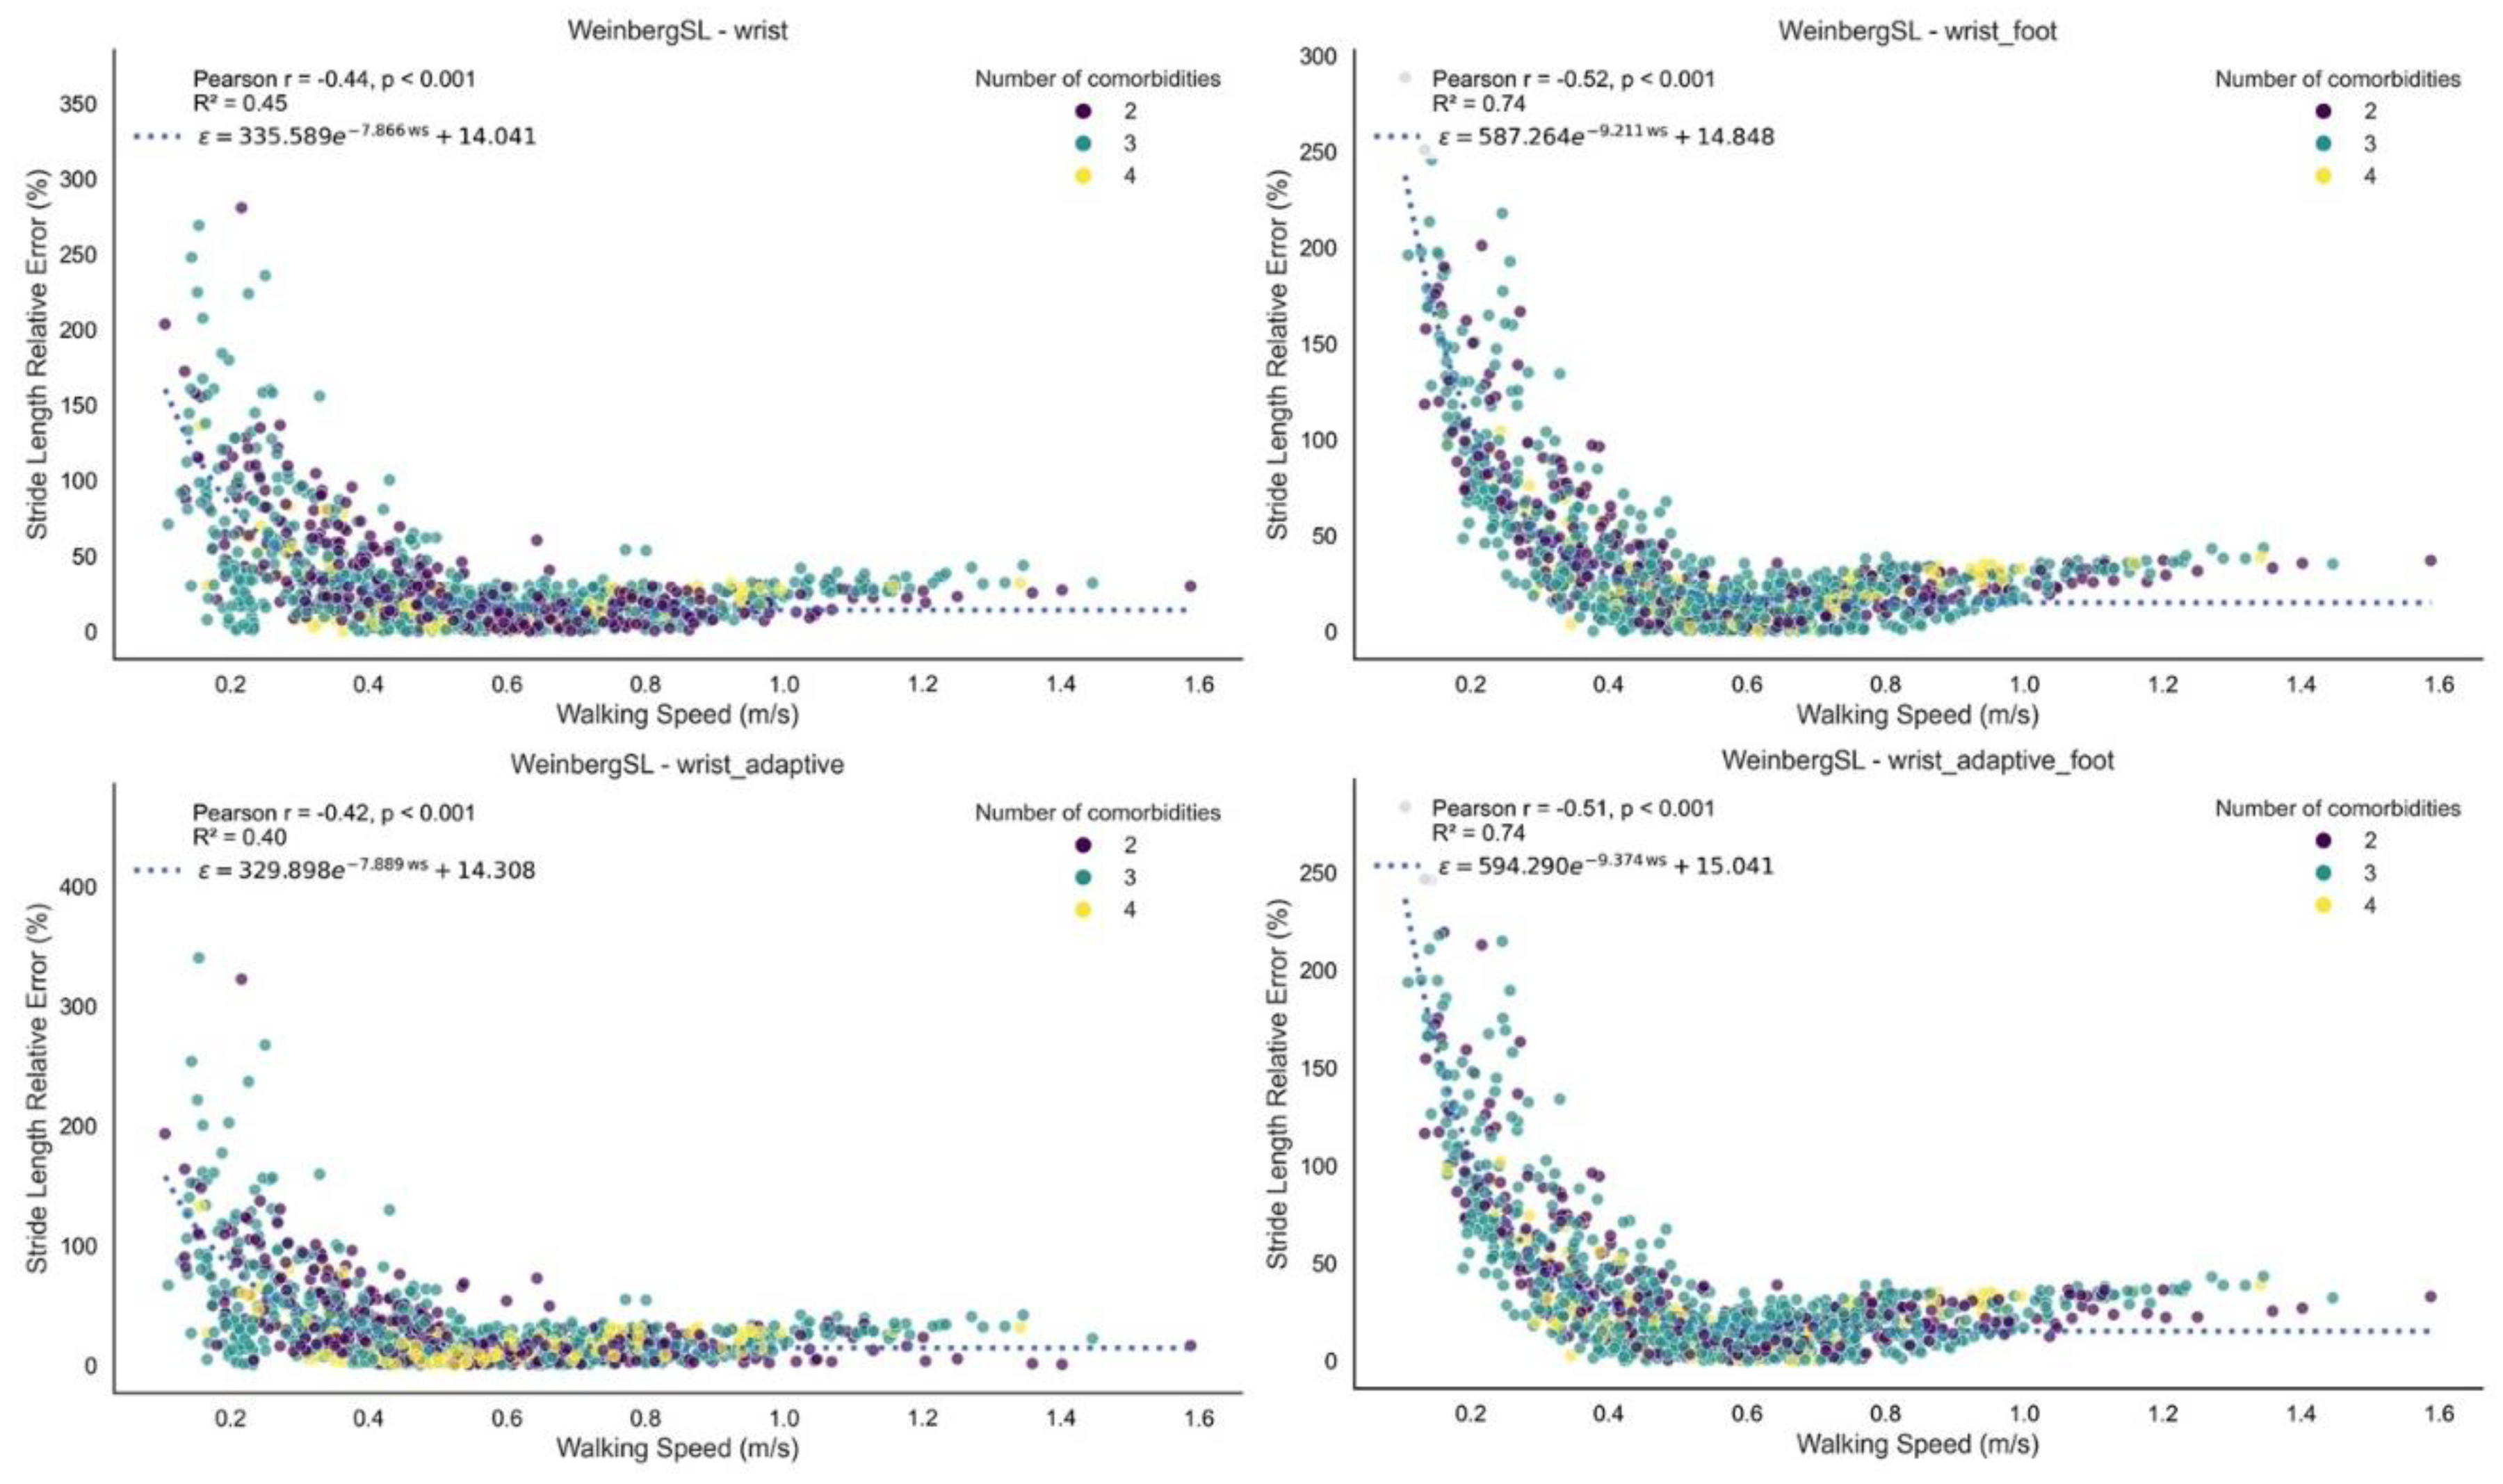
Figure 5.
Plot of relative stride length error (%) versus walking bout duration for the Weinberg algorithm. Each point reflects the relative error and corresponding walking bout duration calculated from a single walking bout. The figure illustrates how the wearable system’s measurement error varies with walking bout duration. The fitted curve represents an exponential decay, ϵ = a e− b x + c, derived via non-linear least squares (parameters a, b, and c). The R2 value indicates the goodness-of-fit between the data points and the fitted curve. Each point is colour codes based on the number of comorbidities.
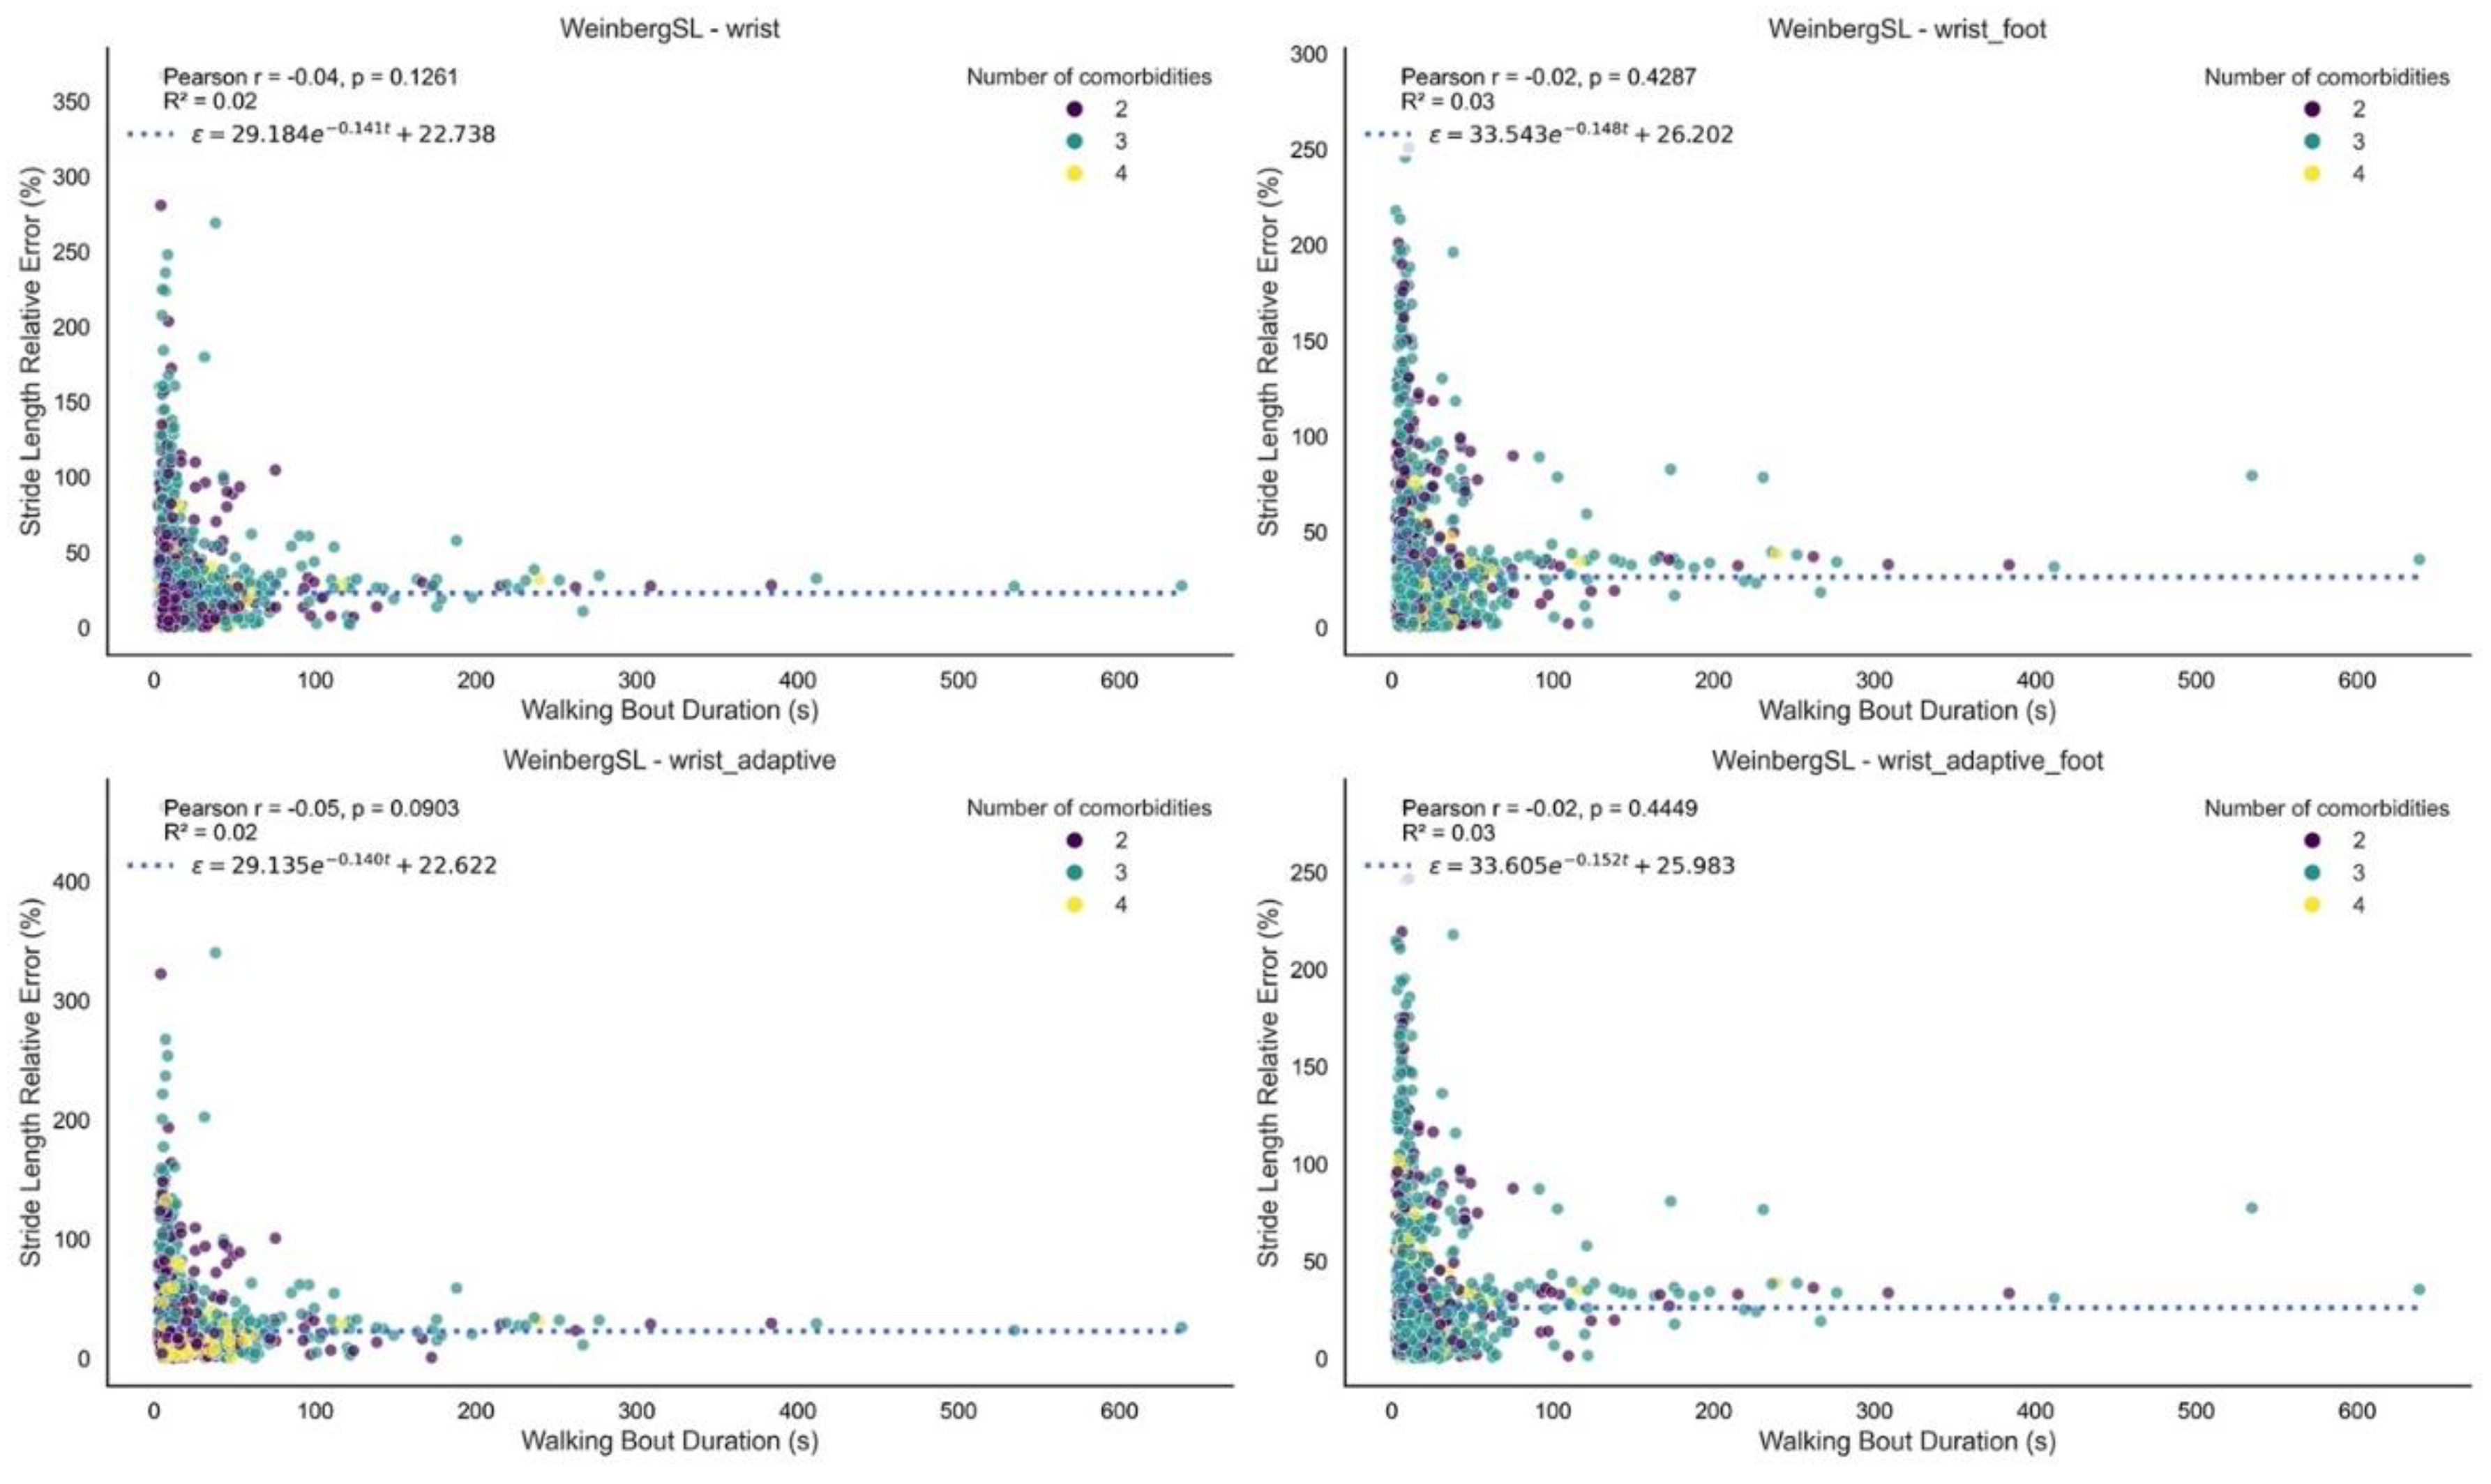

Table 1.
Gait sequence detection (GSD), initial contact event detection (ICD), and stride length estimation (SL) algorithm descriptions, adaptations, modified and novel versions.
Table 1.
Gait sequence detection (GSD), initial contact event detection (ICD), and stride length estimation (SL) algorithm descriptions, adaptations, modified and novel versions.
| Algorithm | Description | Adaptations for Wrist-Worn Sensor and Improved/Novel versions | Thresholds per version (in g-unit for simplicity): |
|---|---|---|---|
| GSD | |||
| Hickey [18] | Identifies bouts of walking using window-based calculations of the acceleration signal variability and orientation thresholds. Includes resampling, gravity removal, axis correction, and Butterworth filtering. | Gravity is removed from all axes before computing the acceleration norm. The “thresholdstill” is fine-tuned for the wrist-worn position. The original upright-position threshold, based on vertical acceleration from a lower-back sensor, is replaced by a maximum activity threshold applied to the norm. This threshold corresponds to the 100th percentile of wrist acceleration during walking bouts in the TVS dataset (n=108), excluding high-intensity activities that may meet other walking variability criteria. |
wrist* -thresholdstill = 0.1 -thresholdupright = 9.5 |
| Kheirkhahan [19] | Identifies walking bouts using activity counts from triaxial acceleration. Data are preprocessed, segmented into overlapping windows, and windows meeting criteria are marked as walking. | The optimised wrist version uses the acceleration norm and improved threshold, and window size fine-tuned for the wrist worn position. |
wrist* -threshold = 0.58 -win_size = 9 |
| MacLean [20] | Identifies walking bouts using a threshold-based algorithm. The signal is filtered, centred, and the norm is used. A binary activity signal is generated and smoothed to identify continuous active periods. Short inactive gaps between active segments are merged, and candidate bouts are evaluated against signal intensity and duration criteria. | Since the acceleration norm is used already, the thresholds have been fine-tuned for the wrist-worn position. |
wrist* threshold_binary = 0.11 gap_threshold = 0.4 gap_index = 0.1 walk_threshold = 0.5 walk_index = 0.05 |
| Keren [21] | Identifies walking bouts using a multi-step algorithm applied. The norm of the signal is filtered and detrended. Gait-like windows are detected based on peak presence, signal variability, dominant frequency, and autocorrelation regularity. Conditions are evaluated in overlapping windows, and consecutive valid segments are merged into walking bouts. | The improved version includes fine-tuned thresholds. An adaptive version has been introduced using a dynamic threshold based on a percentile of the acceleration signal, rather than a fixed value. |
improved* threshold = 0.08 threshold_sd = 0.07 adaptive* threshold_percentile = 84 threshold_sd = 0.07 |
| Ionescu [22] | Identifies walking bouts by detecting steps from the low-pass filtered acceleration norm. Peaks above a threshold indicate steps, which are grouped into gait sequences using an adaptive step duration threshold. In addition, an adaptive version sets the step threshold based on a percentile of peak amplitudes in detected active periods. | Since the acceleration norm is used already, the thresholds of both the fixed and adaptive versions have been fine-tuned for the wrist-worn position. |
wrist* active_signal_threshold = 0.31 wrist_adaptive* active_signal_fallback_threshold = 0.4 percentile = 31 |
| Iluz [23] | Identifies walking bouts using a frequency-based approach applied to vertical and anterior–posterior acceleration signals. First, these signals are band-pass filtered. Then, a convolution with a sine wave is performed, and local maxima from this convolution are detected to define gait regions. | To adapt the algorithm for wrist-worn data, gravity removal is applied per axis at the start, activity is detected using the acceleration norm, standing and orientation change checks are removed, and peak detection is performed only once. The |
wrist* std_threshold = 0.06 step_threshold = 0.84 |
| IC | |||
| Ducharme [24] | Detects initial contact events using the tri-axial accelerometer norm. The signal is first detrended by mean subtraction, then resampled to 80 Hz to apply a fourth-order Butterworth bandpass filter (0.25–2.5 Hz). Peaks above a specified threshold are identified as initial contacts using a standard peak detection function. The detected peak indices are then rescaled to the original sampling frequency. | The algorithm was designed for a lower-back sensor but already operates on the norm of tri-axial acceleration. To adapt it for wrist-worn sensor, the detection threshold has been fine-tuned. |
wrist* threshold = 0.01 |
| Gu [25] | Detects initial contacts using peak detection and multi-stage filtering. It segments the signal, identifies local maxima, and applies thresholds on peak magnitude, periodicity, similarity, and continuity to improve robustness. | The algorithm was designed for use with a wrist-worn sensor. The thresholds have been fine-tuned. In addition, a novel adaptive version has been introduced based on percentiles of the acceleration signal for the magnitude threshold. |
improved* k = 2 period_min = 25 period_max = 120 sim_thres = -0.7 var_thres = 0.0005 mag_thres = 1.1 adaptive* k = 2 period_min = 25 period_max = 110 sim_thres = -0.7 var_thres = 0.005 * (9.81**2) mag_thres = 70 |
| Shin [26] | Detects initial contacts on the norm of the acceleration signals. A sliding window sum reduces noise in the acceleration norm. A differencing step acts as a high-pass filter to remove gravity. Initial contacts are then identified as zero-crossings on the positive slope. | The algorithm was designed for a lower-back sensor but already operates on the norm of tri-axial acceleration, hence, it is used as is. | original* |
| Lee [27] | Detects initial contacts by preprocessing the acceleration norm using low-pass filtering, detrending, Savitzky–Golay smoothing, and Gaussian smoothing, followed by a continuous wavelet transform to enhance step features. Morphological filters are then applied, and initial contact events are detected as maxima between zero-crossings. | The algorithm was designed for a lower-back sensor but already operates on the norm of tri-axial acceleration, hence, it is used as is. | original* |
| Zijlstra [28] | Detects initial contacts by preprocessing the acceleration signal with detrending and low-pass filtering to isolate gait-related components. Initial contacts are then identified either by detecting positive-to-negative zero crossings or by locating peak maxima between zero crossings. | The algorithm was designed for a lower-back sensor and the anteroposterior axis was used, hence, in the wrist version the acceleration norm was used. The peak detection method as well as the cutoff for the Butterworth filter were fine tuned for use in wrist-worn IMUs. |
wrist* cutoff = 2.5 peak detection method=“peak” |
| Micó-Amigo [29] | Detects initial contacts by estimating step periodicity via autocovariance and spectral analysis to define a subject-specific template. A template-matching approach based on dynamic time warping (DTW) identifies high-similarity segments through normalised correlation and variance. Peaks in the resulting similarity signal are selected as initial contacts. | Adapted for wrist-worn sensor by removing the gravity component from the 3-axis acceleration signal using a Butterworth filter, followed by computing the signal norm replacing the original lower-back anteroposterior axis. Two new parameters, peakdistance and peakdistance_coef, have been introduced and fine-tuned for wrist-worn sensor. These control the minimum spacing between peaks in the acceleration and similarity signals, respectively, and were optimized to improve detection accuracy. |
wrist* peakdistance = 1.1 peakdistance_coef = 1.0 shiftfactor = 0.15 factorlimit = 2 event_offset = 5 |
| McCamley [30] | Detects initial contacts by downsampling (50 Hz) and preprocessing the acceleration signal with detrending and a low-pass Butterworth filter (20 Hz), followed by cumulative trapezoidal integration. The integrated signal is smoothed using a continuous wavelet transform (CWT) and upsampled back to the original sampling rate. Initial contacts are identified as local minima. Detected events are then filtered to remove those occurring less than 0.25 seconds apart or isolated beyond 2.25 seconds from neighbouring events. | The algorithm was designed for a lower-back sensor using the vertical (inferosuperior) acceleration axis. For the wrist version, the acceleration norm is used instead. In addition, the wavelet centre frequency is dynamically set using the signal’s dominant frequency to enchase sensitivity to individual gait patterns. |
wrist* cwt_method = “adaptive” |
| Pham [31] | Detects initial contacts by upsampling (128 Hz) and preprocessing the acceleration signal with detrending, low-pass Butterworth filtering (10 Hz), and cumulative trapezoidal integration. The smoothed signal is further processed using a continuous wavelet transform (CWT). The resulting signal is detrended again, and local minima are detected. Peaks are retained only if their magnitude exceeds a specified percentage of the average peak amplitude. | The algorithm was originally designed for a lower-back sensor using the anteroposterior axis. For the wrist version, the acceleration vector norm was used instead. The peak detection threshold percentage was fine-tuned to optimise performance for wrist data. In addition, the wavelet centre frequency is dynamically set using the signal’s dominant frequency to enchase sensitivity to individual gait patterns. |
wrist* percentage_thresh = 0.02 cwt_method = “adaptive” |
| SL | |||
| Weinberg [32] | Step length is estimated using an intensity-based method. The acceleration signal is preprocessed by computing the Euclidean norm and applying a low-pass Butterworth filter (2 Hz). Step length is calculated between consecutive initial contacts using the formula:. Values are interpolated to per-second resolution; stride length is twice the step length. | Since the original algorithm was developed within the framework of inertial dead reckoning systems, finely tuned versions are provided in this paper. Additionally, adaptive versions are introduced, which utilise the root mean square (RMS) of acceleration between consecutive initial contacts multiplied by a finely tuned constant threshold (see Equation 1). Furthermore, foot length–augmented variants are introduced, where an additional term based on individual foot length (in cm) is incorporated into the model to personalise stride length estimation. |
wrist* A = 0.62 B = 0 wrist_footlength* A = 0.21 B = foot length (cm) wrist_adaptive* A = 0.60 B = 0 wrist_adaptive_footlength* A = 0.20 B = foot length (cm) |
| Kim [33] | Step length is estimated using an intensity-based method. Step length is calculated between consecutive initial contacts using the Euclidean norm and the formula . Values are interpolated to per-second resolution; stride length is twice the step length. |
Since the original algorithm was developed within the framework of inertial dead reckoning systems, finely tuned versions are provided in this paper. Additionally, adaptive versions are introduced, which utilise the RMS of acceleration between consecutive initial contacts multiplied by a finely tuned constant threshold (see Equation 2). Furthermore, foot length–augmented variants are introduced, where an additional term based on individual foot length (in cm) is incorporated into the model to personalise stride length estimation. |
wrist* A = 0.35 B = 0 wrist_footlength* A = 0.10 B = foot length (cm) wrist_adaptive* A = 0.35 B = 0 wrist_adaptive_footlength* A = 0.10 B = foot length (cm) |
| Bylemans [34] | Step length is estimated using an intensity-based method with signal preprocessing. Acceleration data are high-pass filtered and smoothed using a moving average. Step length is calculated between consecutive initial contacts using the formula: ; stride length is twice the step length. |
Since the original algorithm was developed within the framework of inertial dead reckoning systems, finely tuned versions are provided in this paper. The preprocessing of the signal has been improved in the current implementation by replacing the original custom IIR high-pass filter with a 4 Hz 4th-order Butterworth filter for improved signal fidelity and reproducibility. Additionally, adaptive versions are introduced, which utilise the RMS of acceleration between consecutive initial contacts multiplied by a finely tuned constant threshold (see Equation 3). Furthermore, foot length–augmented variants are introduced, where an additional term based on individual foot length (in cm) is incorporated into the model to personalise stride length estimation. |
wrist* A = 2.30 B = 0 wrist_footlength* A = 0.75 B = foot length (cm) wrist_adaptive* A = 9.15 B = 0 wrist_adaptive_footlength* A = 3.46 B = foot length (cm) |
*naming of version present in the open access algorithms in python; GSD: gait sequence detection; ICD: initial contact detection; SL: stride length estimation.
Table 2.
Sociodemographic and clinical characteristics of 28 people with co-occurring long-term conditions.
Table 2.
Sociodemographic and clinical characteristics of 28 people with co-occurring long-term conditions.
| Variable | n = 28 |
|---|---|
| Age, mean (SD) | 70.4 (10.7) |
| Sex, Female n (%) | 12 (43%) |
| Height (cm), mean (SD) | 168.9 (9.2) |
| Weight (Kg), mean (SD) | 77.8 (16.8) |
| BMI (Kg/m2), mean (SD) | 27.4 (6.3) |
| MoCa score, median (Q1-Q3) | 26 (21-28) |
| VAS score,_GeneralPain, median (Q1-Q3) | 6 (3-26) |
| VAS score,_Walking Pain, median (Q1-Q3) | 8 (2-38) |
| LLFDI score, median (Q1-Q3) | 58 (49-67) |
| Fall History, Yes n(%) | 11 (39%) |
| Walking aid use, n(%) | |
| One cane/crutch | 4 (14%) |
| Rollator | 3 (11%) |
| Walker | 1 (4%) |
| Other | 1 (4%) |
| Number of co-occurring long-term conditions, median (range) | 3 (2-4) |
| Cardiovascular Disease | 14 (50%) |
| Chronic Obstructive Pulmonary Disease | 8 (29%) |
| Lung Disease (other than COPD) | 4 (14%) |
| Hypertension | 20 (71%) |
| Arthritis | 3 (11%) |
| Gouty arthritis | 2 (7%) |
| Depression | 3 (11%) |
| Hyperlipidemia | 5 (18%) |
| Multiple Sclerosis | 4 (14%) |
| Type 2 Diabetes | 3 (11%) |
| Parkinson’s Disease | 8 (29%) |
| Proximal Femur Fracture | 6 (21%) |
SD: Standard Deviation; Q1-Q3: First and Third Quartiles; BMI: Body Mass Index; MoCa: Montreal Cognitive Assessment; VAS: Visual Analogue Scale; LLFDI: Late-Life Function and Disability Instrument; COPD: Chronic Obstructive Pulmonary Disease.
Table 3.
Gait sequence detection algorithm performance metrics ranked by performance index, with all metrics and error measures reported as mean values with 95% confidence intervals [95% CI].
Table 3.
Gait sequence detection algorithm performance metrics ranked by performance index, with all metrics and error measures reported as mean values with 95% confidence intervals [95% CI].
| Method | Version | Performance Index | Detected Walking Time (s) | Reference Walking Time (s) | Specificity | Accuracy | Recall | Precision | Absolute Relative Duration Error (%) | ICC |
|---|---|---|---|---|---|---|---|---|---|---|
| Kheirkhahan | wrist_improved | 0.76 | 892.53 [681.32, 1103.74] | 1028.44 [809.28, 1247.60] | 0.96 [0.95, 0.98] | 0.92 [0.90, 0.94] | 0.55 [0.45, 0.64] | 0.63 [0.53, 0.73] | 35 [23, 47] | 0.64 [0.36, 0.81] |
| Ionescu | wrist | 0.75 | 925.50 [693.32, 1157.68] | 1028.54 [809.37, 1247.72] | 0.96 [0.95, 0.98] | 0.92 [0.90, 0.94] | 0.55 [0.46, 0.65] | 0.63 [0.52, 0.74] | 41 [27, 55] | 0.60 [0.31, 0.79] |
| wrist_adaptive | 0.73 | 1043.35 [904.00, 1182.69] | 1028.55 [809.37, 1247.74] | 0.95 [0.94, 0.96] | 0.91 [0.89, 0.93] | 0.64 [0.54, 0.73] | 0.59 [0.48, 0.69] | 53 [27, 79] | 0.47 [0.12, 0.71] | |
| Keren | improved | 0.69 | 579.21 [424.14, 734.29] | 1028.94 [809.69, 1248.20] | 0.98 [0.97, 0.98] | 0.91 [0.89, 0.93] | 0.36 [0.28, 0.45] | 0.62 [0.51, 0.73] | 44 [33, 54] | 0.41 [-0.05, 0.71] |
| adaptive | 0.69 | 603.82 [445.95, 761.69] | 1028.93 [809.68, 1248.19] | 0.98 [0.97, 0.98] | 0.91 [0.89, 0.93] | 0.37 [0.28, 0.46] | 0.60 [0.49, 0.70] | 43 [33, 53] | 0.43 [-0.03, 0.72] | |
| Hickey | wrist_improved | 0.65 | 1076.48 [817.62, 1335.34] | 1028.74 [809.54, 1247.95] | 0.92 [0.90, 0.95] | 0.87 [0.84, 0.90] | 0.43 [0.35, 0.50] | 0.44 [0.35, 0.54] | 65 [32, 99] | 0.46 [0.11, 0.71] |
| MacLean | wrist | 0.65 | 819.60 [631.30, 1007.90] | 1028.62 [809.43, 1247.80] | 0.94 [0.93, 0.96] | 0.88 [0.85, 0.90] | 0.31 [0.23, 0.39] | 0.38 [0.29, 0.46] | 31 [20, 42] | 0.43 [0.09, 0.68] |
| Iluz | wrist | 0.60 | 1208.85 [881.06, 1536.65] | 1028.54 [809.36, 1247.72] | 0.90 [0.87, 0.93] | 0.85 [0.82, 0.88] | 0.41 [0.32, 0.51] | 0.38 [0.30, 0.46] | 95 [49, 142] | 0.37 [0.01, 0.65] |
Table 4.
Initial contact detection algorithm performance metrics ranked by performance index, with all metrics and error measures reported as mean values with 95% confidence intervals [95% CI].
Table 4.
Initial contact detection algorithm performance metrics ranked by performance index, with all metrics and error measures reported as mean values with 95% confidence intervals [95% CI].
| Method | Version | Performance Index | Recall | Precision | Absolute Timing Error (s) | Relative Timing Error (%) |
|---|---|---|---|---|---|---|
| ShinIC | wrist | 0.85 | 0.77 [0.72, 0.82] | 0.82 [0.77, 0.87] | 0.09 [0.08, 0.09] | 12 [11, 13] |
| McCamleyIC | wrist | 0.84 | 0.82 [0.79, 0.86] | 0.77 [0.73, 0.80] | 0.12 [0.11, 0.13] | 16 [15, 18] |
| ZijlstraIC | wrist | 0.83 | 0.78 [0.74, 0.82] | 0.77 [0.73, 0.81] | 0.12 [0.11, 0.13] | 16 [15, 18] |
| DucharmeIC | wrist | 0.82 | 0.76 [0.69, 0.83] | 0.77 [0.74, 0.81] | 0.12 [0.11, 0.13] | 16 [15, 18] |
| GuIC | adaptive | 0.82 | 0.69 [0.61, 0.77] | 0.79 [0.76, 0.82] | 0.10 [0.09, 0.10] | 14 [13, 15] |
| HKLeeIC | wrist | 0.82 | 0.77 [0.73, 0.81] | 0.79 [0.76, 0.82] | 0.13 [0.13, 0.14] | 19 [17, 20] |
| GuIC | improved | 0.82 | 0.67 [0.59, 0.74] | 0.82 [0.78, 0.85] | 0.10 [0.10, 0.11] | 14 [13, 15] |
| PhamIC | wrist | 0.82 | 0.77 [0.72, 0.82] | 0.74 [0.70, 0.78] | 0.12 [0.11, 0.13] | 16 [15, 18] |
| Micó-Amigo | wrist | 0.78 | 0.69 [0.64, 0.74] | 0.65 [0.60, 0.70] | 0.11 [0.10, 0.11] | 15 [14, 16] |
Table 5.
Stride length estimation algorithm performance metrics ranked by performance index, with all metrics and error measures reported as mean values with 95% confidence intervals [95% CI].
Table 5.
Stride length estimation algorithm performance metrics ranked by performance index, with all metrics and error measures reported as mean values with 95% confidence intervals [95% CI].
| Method | Version | Performance Index | Detected Stride Length (m) | Reference Stride Length (m) | Absolute Error (m) | Relative Error (%) | ICC |
|---|---|---|---|---|---|---|---|
| WeinbergSL | wrist | 0.72 | 0.78 [0.73, 0.82] | 0.76 [0.69, 0.84] | 0.19 [0.16, 0.21] | 31 [25, 37] | 0.63 [0.34, 0.81] |
| wrist_adaptive | 0.71 | 0.77 [0.73, 0.82] | 0.76 [0.69, 0.84] | 0.19 [0.16, 0.22] | 31 [24, 38] | 0.62 [0.33, 0.81] | |
| BylemansSL | wrist_adaptive_foot | 0.67 | 0.77 [0.73, 0.82] | 0.76 [0.69, 0.84] | 0.20 [0.18, 0.22] | 32 [27, 38] | 0.54 [0.21, 0.76] |
| WeinbergSL | wrist_adaptive_foot | 0.66 | 0.79 [0.76, 0.82] | 0.76 [0.69, 0.84] | 0.20 [0.18, 0.22] | 35 [28, 42] | 0.53 [0.20, 0.75] |
| wrist_foot | 0.66 | 0.79 [0.76, 0.82] | 0.76 [0.69, 0.84] | 0.20 [0.18, 0.22] | 35 [28, 42] | 0.53 [0.20, 0.75] | |
| BylemansSL | wrist_foot | 0.62 | 0.78 [0.75, 0.81] | 0.76 [0.69, 0.84] | 0.20 [0.18, 0.22] | 35 [28, 42] | 0.44 [0.08, 0.70] |
| wrist | 0.61 | 0.76 [0.71, 0.80] | 0.76 [0.69, 0.84] | 0.22 [0.19, 0.24] | 34 [28, 40] | 0.41 [0.05, 0.68] | |
| KimSL | wrist_adaptive_foot | 0.56 | 0.74 [0.72, 0.76] | 0.76 [0.69, 0.84] | 0.22 [0.19, 0.24] | 35 [27, 44] | 0.31 [-0.06, 0.61] |
| wrist_foot | 0.55 | 0.73 [0.71, 0.75] | 0.76 [0.69, 0.84] | 0.22 [0.19, 0.24] | 35 [27, 43] | 0.39 [0.04, 0.65] | |
| BylemansSL | wrist_adaptive | 0.55 | 0.65 [0.56, 0.73] | 0.76 [0.69, 0.84] | 0.33 [0.29, 0.37] | 47 [40, 54] | 0.30 [-0.07, 0.60] |
| KimSL | wrist_adaptive | 0.44 | 0.73 [0.72, 0.74] | 0.76 [0.69, 0.84] | 0.23 [0.20, 0.26] | 37 [28, 46] | 0.06 [-0.32, 0.42] |
| wrist | 0.42 | 0.70 [0.70, 0.71] | 0.76 [0.69, 0.84] | 0.23 [0.20, 0.26] | 37 [28, 45] | 0.01 [-0.33, 0.36] |
Disclaimer/Publisher’s Note: The statements, opinions and data contained in all publications are solely those of the individual author(s) and contributor(s) and not of MDPI and/or the editor(s). MDPI and/or the editor(s) disclaim responsibility for any injury to people or property resulting from any ideas, methods, instructions or products referred to in the content. |
© 2025 by the authors. Licensee MDPI, Basel, Switzerland. This article is an open access article distributed under the terms and conditions of the Creative Commons Attribution (CC BY) license (http://creativecommons.org/licenses/by/4.0/).
Copyright: This open access article is published under a Creative Commons CC BY 4.0 license, which permit the free download, distribution, and reuse, provided that the author and preprint are cited in any reuse.


