
Submitted:
30 August 2025
Posted:
01 September 2025
You are already at the latest version
Abstract
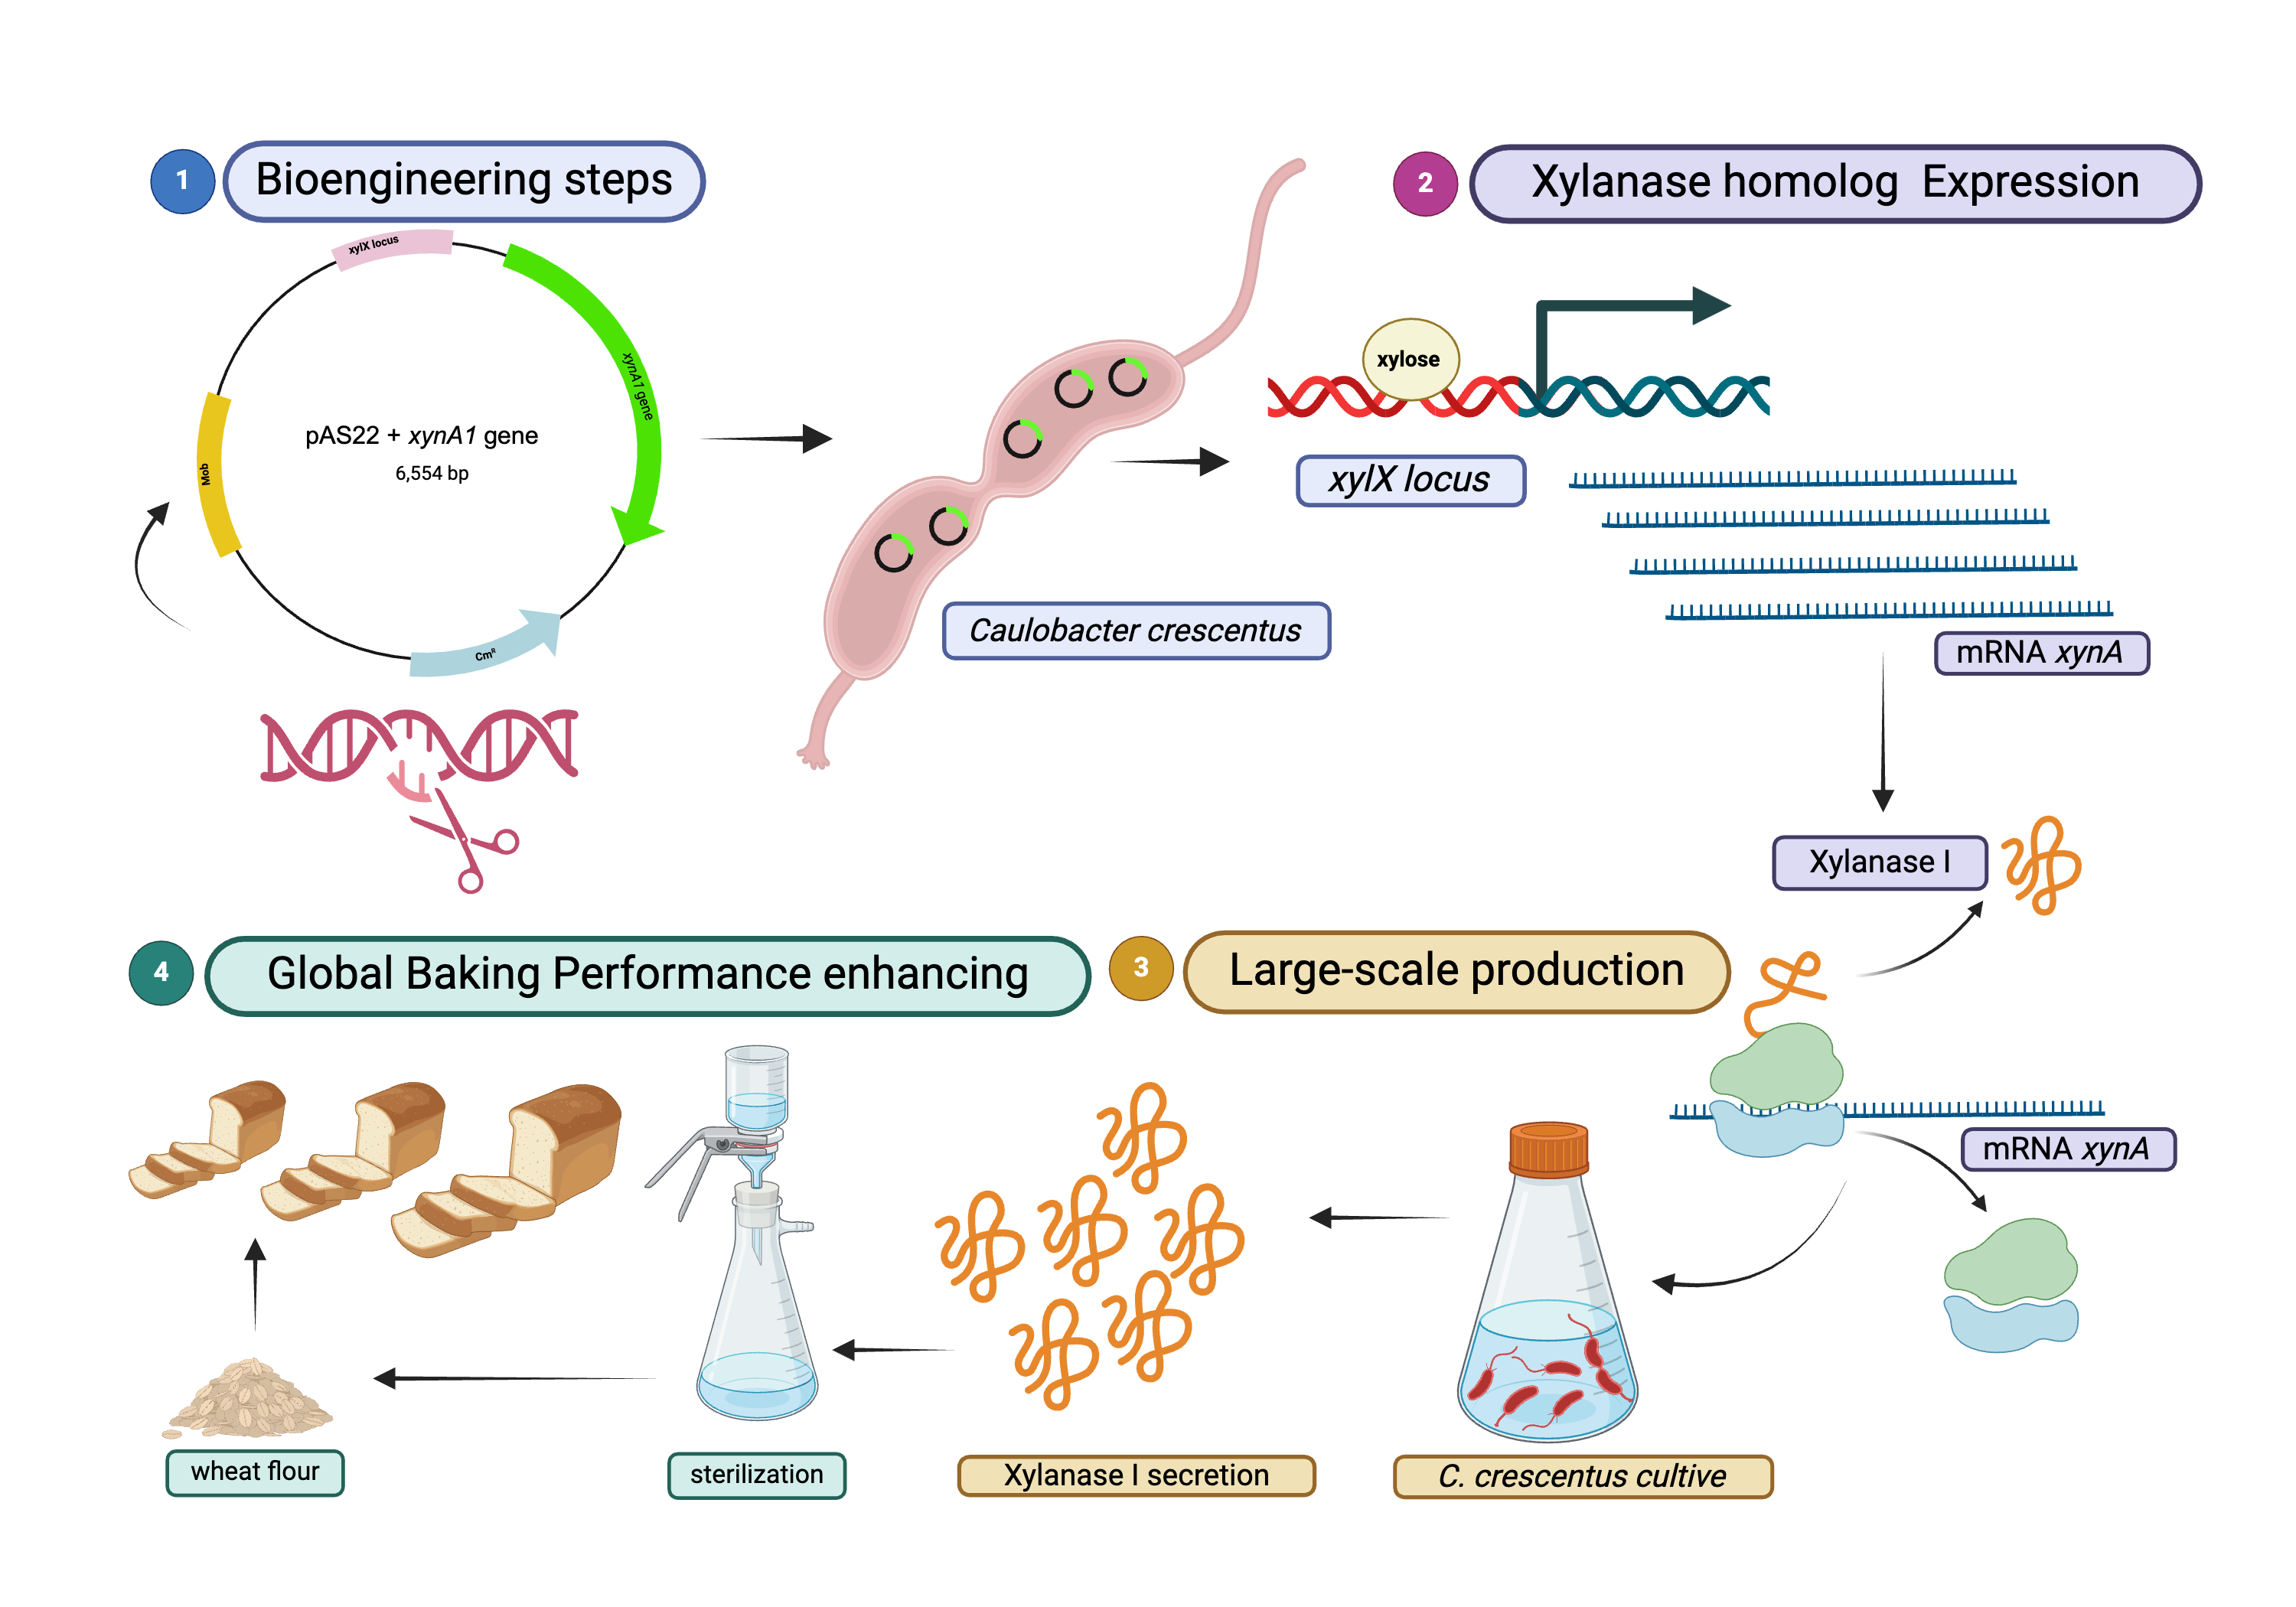
This study investigated the impact of using genetic engineering strategies and a cell-free Xylanase in the baking industry. The xynA1 gene from the nonpathogenic bacterium Caulobacter crescentus (C. crescentus) (NA1000 strain) was integrated into the pAS22 vector with a xylose-inducible promoter and introduced back into the bacteria, resulting in the creation of the BS-xynA1. This construct exhibited substantial secreted xylanase activity, reaching 17.22 U/mL, and a specific activity of 278.64 U/mg after an 18-hour growth period with 0.2% (w/v) corn straw. RT-qPCR analysis confirmed that higher xylanase activity in C. crescentus cells was correlated with increased transcription of the xynA1 gene. Moreover, BS-xynA1 cells coexpress other enzymes, including cellulase, pectinase, α-amylase, β-glycosidase, β-xylosidase, and α-L-arabinosidase, at low levels (≤2 U/mL). In vitro comparison of cell-free xylanase from BS-xynA1 with three commercially available xylanase-containing mixtures commonly utilized in baking protocols revealed its superior specific activity (163.4 U/mg) across a broad temperature range (30-100 °C), with optimal performance at 50 °C. In practical baking tests, the addition of cell-free Xylanase I led to a 9% reduction in dough beat time and an impressive 18.2% increase in bread height compared to those of the control. Notably, the incorporation of Xylanase I resulted in enhanced alveolar structure formation within the bread crumb. Specifically, the following changes were observed in the mass parameters compared to those of the control: an 18.8% increase in extensibility, a 5.2% increase in elasticity, an 8.3% increase in deformation energy, and subsequent improvements in strength. Additionally, Xylanase I inclusion led to a 6.0% reduction in toughness and a 20.6% reduction in the toughness/elasticity index, indicating a reduction in the mass stiffness of the enzyme-treated bread. To date, this is the first successful application of recombinant xylanase I from C. crescentus in biotechnological processes related to baking, underscoring the potential and prospects of synthetic biology in the food industry.
Keywords:
xynA1 gene
; secreted xylanase
; bread structure
; bioengineering
; synthetic biology
1. Introduction
Xylan is a representative part of the lignocellulosic mass in plants, and its degradation involves the synergistic action of different enzymes, with endo-β,4-D-xylanases (E.C.3.2.1.8) and β-D-xylosidases (E.C. 3.2.1.37) being the most important [1]. Endo-β-1,4-D-xylanases cleave the xylan main chain, producing xylo-oligosaccharides that can be converted to xylose by β-D-xylosidases [2]. In many biotechnological and industrial applications, bacterial xylanases have shown better performance than fungal xylanases [3,4,5]. The significant differences found were low cellulase activity, low cellulase stability, low cellulase activity in the alkaline range, and high cellulase thermostability, among others [6,7]. Moreover, superxylanases are very difficult to produce when all these features are combined, implying that most of the available bacterial xylanases have only one or two of these properties, leading industrial processes to depend on expensive and hazardous chemical processes or strategies for designing or engineering superenzymes [6,8].
Xylanases have been widely used in the baking industry for decades. They are employed in baking together with α-amylase, maleate amylase, glucose oxidase and proteases. Xylanases breakdown hemicellulose in wheat flour, helping to redistribute water and make the dough softer and easier to knead. During the bread baking process, they generate greater flexibility and elasticity, allowing the dough to grow. The use of xylanases in baking assures an increase in bread volume, better water absorption and greater resistance to fermentation [9,10]. In the manufacture of cookies and crackers, xylanase is recommended to make them creamy and lighter and to improve their texture, palatability, and uniformity [1].
Xylanases are widely used as processing aids in the grain milling industry to produce flour. In this industry, xylanases are often referred to as hemicellulases or pentosanases. Thus, the term hemicellulase refers to the ability of xylanase to hydrolyze insoluble nonstarch compounds found in flour, while the term pentosanase indicates that the substrate for the xylan enzyme is composed of pentose monomers [11]. Therefore, xylanases can improve the quality of the baking process and bread dough. In Bacillus sp., for instance, the xynHB gene encoding xylanase was cloned and inserted into an antibiotic-free vector and integrated into the Saccharomyces cerevisiae genome. The yeast strain A13 overexpressing xylanase was applied in baking and showed a reduction in the time required for kneading and an increase in bread dough height and diameter [8].
Recently, a xylanase-producing fungus, Phoma sp. MF13, was isolated from mangrove sediment, and the xylanase gene (xynMF13A) was cloned from this fungus and expressed successfully in Pichia pastoris. The resulting expressed protein was subsequently purified and characterized. The results demonstrated that XynMF13A is a salt-tolerant enzyme with a high degree of salt resistance up to 4 M NaCl. The hydrolysis products generated from corncob xylan by this xylanase include xylobiose, xylotriose, xylotetraose, and xylopentaose. Furthermore, recombinant xylanase (XynMF13A) had a beneficial effect on Chinese steamed bread, a traditional food, by improving its specific volume and elasticity while simultaneously decreasing its hardness and chewiness [12].
Bacteria of the Caulobacter genus are gram-negative and are present in virtually all aquatic environments and in many soil types [13,14]. The genome of Caulobacter crescentus (NA1000 strain) contains eight genes [15,16], which are directly involved in biomass degradation and are therefore relevant for biotechnological applications. Among these genes, only one encodes cellulase (celA1), two encode enzymes with endoxylanase activity (xynA1-2), and five encode enzymes with β-xylosidase activity (xynB-xynB5) [2,3,4,5,17,18,19,20,21,22]. In addition, C. crescentus has traditionally been considered nonpathogenic and assumed to be nontoxic to humans, making it a promising bioengineering vector for environmental remediation, the food industry, and medical applications [23].
The C. crescentus xynA1 gene was successfully overexpressed in E. coli. The purified recombinant XynA1 was thoroughly characterized, revealing an enzymatic activity of 18.26 U/mL and a specific activity of 2.22 U/mg when xylan from beechwood was employed as the substrate. Kinetic analysis of XynA1 revealed KM and Vmax values of 3.77 mg/mL and 10.20 μM/min, respectively. The enzyme exhibited an optimal pH of 6 and peaked at 50 °C. Impressively, XynA1 has demonstrated remarkable thermal stability for biotechnological applications, retaining 80% of its activity over a span of 4 hours at 50 °C [3]. Building upon previous work involving the purification and biochemical characterization of C. crescentus XynA1, this study introduces a novel approach in which a conditional mutant was engineered. This mutant enabled homologous overexpression of the C. crescentus xynA1 gene within the NA1000 strain, leveraging an induced promoter regulated by xylose. The resulting overexpressed and secreted C. crescentus XynA1 was incorporated into flour and applied throughout baking processes.
2. Materials and Methods
2.1. Bacterial Strains and Growing Conditions
The strains and plasmids used in the present work are described in Table 1. Escherichia coli DH5α and S17 bacterial strains [24] were used for subcloning and conjugation, respectively. Both strains were grown at 37 °C and maintained at 4 °C in Luria–Bertani (LB) medium [25].
The recombinant NA1000 strain [26,27] containing the pAS22-xynA1 [28] construct was grown at 37 °C and maintained at 4 °C in LB media supplemented with chloramphenicol (1 µg/mL). The bacterial strain C. crescentus NA1000 was grown at 30 °C and maintained at 4 °C in PYE media (0.2% bactopeptone, 0.1% yeast extract, 1.7 mM MgSO4, 0.5 mM CaCl2). The BS-xynA1 mutant strain was isolated at 30 °C and maintained at 4 °C in PYE media supplemented with chloramphenicol (1 µg/mL) and nalidixic acid (20 µg/mL).
To induce the expression of xylanase I (XynA1) and other enzymes, the NA1000 strain and C. crescentus mutant BS-xynA1 were cultivated at 30 °C and 120 rpm in minimal medium (M2) (Na2HPO4 12 mM, NH4Cl 9 mM, KH2PO4 8 mM, MgSO4 1 mM, CaCl2 0.5 mM, FeSO4 10 mM) (Ely, 1991) supplemented with 0.2% (w/v) glucose, 0.3% (w/v) xylose and 0.3% xylose added from different agro-industrial residues at 0.2% (w/v) (CS) corn straw, (CC) corn cob, (HPM) hemicellulose from corn straw, (WS) wheat straw, (PR) polisher residue (WF) wheat flour industry vacuum cleaner residue (RF) rice flour (SB) sugarcane bagasse (RS) rice straw and (SR) soybean residue.
2.2. Cloning of the xynA1 Gene in the pAS22 Expression Vector
The DNA fragment corresponding to the xynA1 gene (CCNA_02894) was isolated from the pJET1.2-xynA1 construct [3] as described below. The xynA1 gene of interest containing 1,158 base pairs present in the pJET1.2-xynA1 construct, along with the priming methionine and its stop codon, was digested with the restriction enzyme XhoI (Thermo Fischer Scientific®). This enzyme cleaves this construct only to promote the linearization of the same construct. Then, a reaction with the enzyme DNA Blunting (Fermentas®) was carried out to obtain a noncohesive end, which allowed the subcloning process in the pAS22 vector to another noncohesive site in subsequent steps. With the gene still partially attached to the pJET1.2 vector at one end but containing a noncohesive end, it was digested with the restriction enzyme EcoRI. (Thermo Fischer Scientific®). After digestion, the genetic material was resolved by 1% agarose gel electrophoresis in 1× TAE buffer. The 1,793 bp gel band, corresponding to the xynA1 gene and an untranslated portion of the pJET1.2 blunt plasmid that remained attached after the stop codon of the xynA1 gene, was cut from the scalpel gel and recovered with a DNA extraction kit (Pure Link Gel Extraction Kit - Invitrogen®).
The plasmid used for xylanase (XynA1) expression [3] in C. crescentus was pAS22. This plasmid has a xylose-inducible promoter, which allows for an increase in the expression of the cloned xylanase gene upstream of the promoter. Construction planning was based on experimental evidence that the C. crescentus xynA1 gene is not regulated by xylose according to transcriptomic analysis [29]. Furthermore, the gene was also cloned without the control of its original promoter. The increase in gene expression in this case can easily be accompanied by an increase in xylanase activity, dispensing with evidence for the accumulation of essential protein mass in the case of proteins that do not present measurable enzymatic function. Double plasmid digestion was performed with EcoRI and EcoRV restriction enzymes (Thermo Fischer Scientific®). This linearized vector was ligated to the DNA fragment corresponding to the xynA1 gene (EcoRI/Blunt) with the aid of T4 DNA Ligase (BioLabs®). Subsequently, the pAS22-xynA1 construct was used for transformation of the E. coli strain DH5α. Transformants were selected by growth in media supplemented with chloramphenicol (1 μg/mL), a resistance marker of the pAS22 vector. After the transformants were selected, the plasmid material was extracted by mini plasmid preparation, double-digested with the restriction enzymes EcoRI/KpnI and resolved by 1% TAE 1X agarose gel electrophoresis to confirm the gene size.
2.3. Construction of the BS-xynA1 Mutant Strain
The pAS22-xynA1 construct was used to transform the E. coli strain S17, which has conjugative functions. Transformants were selected by growth in media supplemented with chloramphenicol (1 μg/mL), the resistance marker of the pAS22 vector. After selection of the transformant, plasmid material was extracted by mini plasmid preparation, double-digested with the restriction enzymes EcoRI/KpnI and resolved by 1% TAE 1X agarose gel electrophoresis to confirm the recombinant size. E. coli S17 transformant strains containing the pAS22-xynA1 construct were used for the transformation of the C. crescentus NA1000 strain by conjugation. An aliquot of a fresh E. coli strain containing the pAS22-xynA1 vector was mixed with twice the amount of fresh C. crescentus cells of the NA1000 strain in solid PYE media. After 48 hours of growth at 30 °C, samples of the bacterial cultures grown on the plate were streaked on a new solid PYE plate containing chloramphenicol (1 μg/mL), the pAS22 vector selection mark and nalidixic acid (20/μg mL), a selection mark of the NA1000 strain and not the E. coli strain, at 30 °C for 48 hours. Isolated colonies grown on these plates were again streaked onto a new PYE plate containing the same amount of chloramphenicol and nalidixic acid. Microscopy analysis was carried out to confirm that only C. crescentus cells were present in the medium. Aliquots of the mutant cells were then named BS-xynA1 and stored at -20 °C and 80 °C for subsequent characterization. In parallel to the construction of the BS-xynA1 mutant, a control strain of the NA1000 strain was constructed via conjugation of the empty plasmid pAS22.
2.4. Growth, Xylose Consumption and Xylanase Expression
C. crescentus strains Cc-pAS22 and BS-xynA1 were preinoculated in 10 mL of liquid PYE medium supplemented with chloramphenicol (1 µg/mL) and nalidixic acid (20 µg/mL) and grown for 12 hours at 30 °C and 120 rpm. When the cells reached the stationary phase of growth, they were diluted (OD λ600 nm= 0.1) in M2 medium supplemented with 0.3% (w/v) xylose and grown at 30 °C with 120 rpm agitation. Every two hours of growth, a 2 mL aliquot of the growing culture was collected. From this volume, 1 mL was used to measure spectrophotometer cell growth, 1 mL was centrifuged at 15,000 xg for 5 min at 4 °C, and the supernatant was reserved for extracellular xylanase activity analysis (optimizing for pH and temperature of xylanase I) in addition to the dosage of xylose consumption by the Orcinol method for pentoses [30]. Cell precipitates from centrifugation were frozen for further quantification of intracellular xylanase. The frozen cell pellet was lysed with 350 μL of 50 mM phosphate buffer, pH 6.0, under vigorous vortexing until thawing. The samples were kept on ice, and the overall activity levels of xylanolytic enzymes were determined. The assay and dosages were performed in biological and experimental triplicates, respectively.
2.5. XynA1 Expression in Different Agro-Industrial Residues
Preinoculation and inoculation were performed as described in the previous section, but the M2 medium was supplemented with 0.3% (w/v) xylose and 0.2% (w/v) different agro-industrial residues. (CS) Corn Straw; (CC) Corn Cob; (HPM) Hemicellulose from Corn Straw; (WS) Wheat Straw, (PR) Polisher Residue (WF) Wheat Flour Industry Vacuum Cleaner Residue (RF) Rice Flour. (SB) Sugarcane bagasse (RS) rice straw; (SR) soybean residue. All residues were prepared as described previously [18]. Cultures were incubated at 30 °C with shaking at 120 rpm for 18 hours. Then, the samples were centrifuged at 15,000 × g for 5 min at 4 °C. The supernatants were used to quantify XynA1 activity. The supernatant with the highest xylanase I activity was also characterized by the presence of cellulase, pectinase, α-L-arabinofuranosidase, β-glycosidase, β-xylosidase and α-amylase. Since the bacterium has two genes for xylanases (xynA1 and xyn2), two enzymes can be expressed under induced conditions. In these experiments, the NA1000 strain containing only the pAS22 (Cc-pAS22) vector was used as a control.
2.6. Dosages of Different Extracellular Enzymes
Reactions to verify xylanase I and II activity were performed using 1% (w/v) xylan from beechwood (Sigma®) substrate (in 50 mM sodium phosphate buffer pH 6.0 for xylanase I and buffer McIvaine pH 8.0 for xylanase II) followed by incubation at 50 and 60 °C, respectively. Reactions to verify cellulase and α-amylase activity were performed using 1% (w/v) carboxymethylcellulose (CMC) as the substrate in 50 mM sodium citrate buffer (pH 5.5) and 1% starch as the substrate (w/v) in 50 mM sodium citrate buffer (pH 5.0), respectively, followed by incubation at 40 °C. Reducing sugars were measured using 3,5-dinitrosalicylic acid (DNS) [31]. Xylanolytic and cellulolytic activities were defined in U/mL as the amount of enzyme capable of releasing 1 μmol of xylose per mL of solution per min of reaction (U). The enzymatic activities of β-glycosidase, β-xilosidase, and α-L-arabinosidase were determined using ρ-nitrophenyl-β-D-glucopyranoside (ρNPG) and ρ-nitrophenyl-β-D-xylopyranoside (ρNPX) reagents. and ρ-nitrophenyl-α-L-arabinofuranoside (ρNPA) (Sigma®), respectively, according to the adapted methodology described by Justo et al. (2015), estimating the amount of ρ-nitrophenol (ρNP) released from the respective reagents. The total protein concentration was estimated by the Bradford method [32], which uses bovine serum albumin (BSA; Bio-Rad®) as a standard.
2.7. Commercially Available Xylanases Versus Xylanase of Mutant BS-xynA1
Xylanolytic activity was also measured in different commercial xylanase mixtures available for application in the bakery industry. Among the variants tested were Spring CA 400 (produced by Granotec from Brail S.A. Nutrition and Biotechnology), Mega Cell 899 and Xylamax 292 (produced by Prozin Industrial and Comercial Ltd.). Enzymatic assays were performed as described in the previous section, with varying incubation temperatures (40, 50, 60, 70, 80, 90 and 100 °C). The same procedure was performed for the extracellular crude extract containing the C. crescentus enzyme XynA1.
2.8. Test for Confirmation of the Absence of Viable Bacteria in Enzyme Extracts
The total enzyme extracts produced were centrifuged at 5,000 × g at 4 °C for 10 min. The centrifuged supernatant containing C. crescentus XynA1 was sterilized with a 0.22 µm polystyrene vacuum filtration system containing sterile, pyrogen-free low protein binding polyether sulfone (Ciencor®). The complete absence of viable bacteria in the extracellular extracts was tested by plating a 100 µl aliquot of extracellular enzymatic crude extract into each of the three PYE media plates at 30 °C and LB at 37 °C followed by incubation for 48 hours for microbial growth investigation. Aliquots of the filtrates and cell-free Xylanase I was used for enzymatic assay testing after centrifugation and filtration to confirm the maintenance of xylanase activity.
2.9. Application of C. crescentus XynA1 cell-Free in Bread Formulation
To ensure food safety, the C. crescentus BS-xynA1 mutant was grown in the absence of chloramphenicol since the cells maintained the pAS22 plasmid and xylanase production under the tested conditions for up to three consecutive days. The extracellular enzymatic extracts enriched with recombinant homologous xylanase I from C. crescentus were filtered with a PES (polyestersulfone) vacuum filtration system of 0.1 μm and 500 mL capacity (431475-Corning®) and cell-free Xylanase I was used in the baking assays. Therefore, it is certain that the final product used in the tests meets food safety standards. The xylanolytic activity of enzymatic extracts used as processing aids in the production of white wheat flour bread has been investigated. This study aimed to evaluate the effects of these enzyme extracts on bread quality using a standardized loaf formulation adhering to the guidelines of Art. 661 of the Argentine Food Code.
The baking trials were meticulously executed in triplicate, employing carefully defined formulations. The core ingredients consisted of white wheat flour (as specified), sugar, salt, fresh yeast (Fleischmann®), vegetable shortening (Coamo®), and water. To explore the impact of enzyme extracts, two additional formulations were developed based on an experimental design in which the enzyme extract concentrations were manipulated. Adjustments in water content were made according to the volume of enzyme solution employed, ensuring consistency with the standard formulation. Refer to Table 2 for a breakdown of the ingredient quantities in each test formulation.
The dough preparation procedure included distinct phases, each of which contributed to the final bread characteristics: 1. Mixing (Phase I and Phase II): Initial ingredients, including flour, sugar, salt, and water (also incorporating enzymatic solution for tests T2 and T3), were combined in a trough maintained at a temperature of 4 to 6 °C. This mixture was blended at a constant speed (100 rpm) for 3 minutes. In Phase II, the blend welcomed vegetable fat and fresh yeast, and mixing was continued at 190 rpm until the desired dough consistency was achieved; 2. Division: The resulting dough was divided into uniform 500-gram portions with precision, aided by spatulas and scales; 3. Modeling: The modeling phase involved a single pass through a specialized machine designed to roll, fold, stretch, and thereby homogenize the dough. This three-step process ensured an even dough texture and structure, promoting symmetrical bread formation during fermentation and baking; 4. Fermentation and Growth: The molded dough was shaped into standard forms and positioned within a controlled fermentation chamber set at 28 °C. This allowed for an exact fermentation period of 4 hours, promoting optimal dough development; 5. Baking (Final Step): The fully formed, fermented, and grown dough was placed into a preheated oven set at 180 °C. Baking transpired over a 30-minute period. After baking, the loaves were allowed to cool to room temperature. Bread height measurements were acquired using a measuring tape, and cross-sectional observations were made by halving the loaves to assess alveolar structure. Additionally, photographic documentation facilitated a comprehensive comparison between control loaves and loaves subjected to varying enzyme extract concentrations.
2.10. Alveograph Test: Evaluating Flour Viscoelastic Characteristics
The enzymatic impact on the viscoelastic properties of flour is assessed through alveography, a technique that emulates dough behavior during fermentation by replicating the formation of air pockets (alveoli) generated by yeast-released carbon dioxide (CO2). This assessment involves the analysis of various alveographic parameters to gauge the viscoelastic traits of different dough samples. Employing the Chopin Alveograph model, AlveoPC, crafted by CHOPIN Technologies (Villeneuve-la-Garenne, France) and adhering to the International Association for Cereal Science and Technology guidelines [33], this test method provides precision to the characterization process.
For the enzyme addition experiment (Table 3), the enzyme extract volume was determined according to the ratio of enzyme extract per kilogram of flour as utilized in baking test T3. The control run, devoid of enzyme supplementation, served as a baseline. Consistency was maintained in both the control and test groups according to the following parameters: humidity, 14.4%; hydration, 50%; and B concentration, 15% H2O, in line with the AACC methodology recommendations. The preparation involved diluting sodium chloride in sterile water to afford a 2.5% (w/v) saline solution, which was subsequently combined with the enzyme solution in the enzyme addition test. A total of 250 grams of flour was introduced into the mixer at 24±2 °C. The process begins, and within 20 seconds, saline solution is added. The mixing continued for one minute, encompassing the 20 seconds prior to saline addition. Following this, the mixer halts, allowing for the clearing of its sides using a spatula – a one-minute procedure.
The mixture was mixed for an additional 7 minutes, resulting in a total of 8 minutes. The mixer is then paused to alter the rotation direction of the paddle, leading to the division of the resulting dough into five uniform portions. These portions were placed within an alveograph rest chamber maintained at 25 ± 0.2 °C. Twenty-eight minutes after the initiation of dough mixing, the first portion was placed at the center of the stationary alveograph plate and coated with Vaseline. The lid is positioned and secured, and the plate undergoes two full turns within 20 seconds. Five seconds later, the lid and ring were removed, and the dough was allowed to inflate until a bubble formed. This sequence is repeated for the other four dough portions.
Parameters derived from the alveograms include toughness (P), which represents the peak pressure exerted during mass expansion (measured in millimeters); extensibility (L), which quantifies the length of the curve (measured in millimeters); and mass deformation energy (W), which signifies the mechanical work needed to expand the bubble until rupture, expressed as 10-4 J. The ratio of toughness to extensibility (P/L) offers insight into mass equilibrium, where P signifies the mass's resistance to deformation, and L indicates mass extensibility.
2.11. RNA Extraction, RT-qPCR Assays and Statistical Analysis
The RNA extraction and RT-qPCR assays closely followed the protocols outlined in the study by Corrêa et al. [21]. These procedures were meticulously replicated in three distinct experimental trials, except for the alveograph tests, which underwent a comprehensive fivefold investigation. To ensure the accuracy of the results, standard errors were employed for result validation.
For the enzymatic treatment test within the bread formulation and the alveographic test, the acquired data were subjected to rigorous scrutiny through analysis of variance (ANOVA). Subsequently, a Tukey post hoc test was conducted to determine significant differences, maintaining a significance level of 99%.
3. Results and Discussion
3.1. Subcloning of the xynA1 Gene and Construction of the BS-xynA1 Strain
To construct BS-xynA1 strain, we generated a C. crescentus strain harboring a single functional copy of the xynA1 gene. This gene was placed under the control of an inducible xylose promoter, as outlined in the 1997 work by Meisenzahl et al. [28]. The construction process involved assembling a DNA fragment of 1,793 base pairs corresponding to the xynA1 gene (depicted in Figure 1). This DNA fragment was then combined with a portion of the pJET1.2Blunt vector situated after the EcoRI-digested stop codon (Figure 1A–C). The resulting fragment was inserted into the pAS22 expression vector, which had been predigested with EcoRI and EcoRV enzymes. Validation of the construct, named pAS22-xynA1 (Figure 1D), was carried out by transforming it into E. coli DH5α. Successful cloning was confirmed through mini-plasmid preparation, followed by digestion with EcoRI and KpnI restriction enzymes (Figure 1E). Subsequent resolution on a 1% agarose gel in TAE 1X revealed the presence of a distinct 5,230 base pair band indicative of the plasmid pAS22. Another band at 1,793 base pairs, corresponding to the xynA1 insert, further confirmed the successful cloning of the expression vector.
The pAS22-xynA1 construct was transformed into the E. coli strain S17 via a transformation process. The E. coli S17 strain harboring the pAS22-xynA1 vector (Figure 1D) facilitated conjugation with the C. crescentus NA1000 strain. Transconjugants of E. coli-(S17)-pAS22-xynA1/NA1000 were selectively cultured in PYE media supplemented with chloramphenicol (1 μg/mL) and nalidixic acid (20 μg/mL) at a temperature of 30 °C. The resulting mutant clone was tested to determine the stability of the plasmid pAS22 within the C. crescentus NA1000 strain after exposure to chloramphenicol, which was subsequently preserved at -80 °C. The derived strain, designated BS-xynA1, exhibited extracellular expression of the xynA1 gene. This strain was subjected to various enzymatic and bakery-related assays, as described in the following sections.
3.2. Growth, Xylose Consumption and Xylanase Production of BS-XynA1strain
The BS-xynA1 was initially characterized for growth in minimal M2 medium supplemented with 0.3% xylose (Figure 2). The analysis of bacterial growth versus xylose consumption showed that they were very similar in both the parental control strain containing the empty plasmid Cc-pAS22 (Table 1) and the strain BS-xynA1. Xylose consumption occurred in both strains at the same rate as they advanced at different stages of the cell cycle (Figure 2).
The control strains Cc-pAS22 and the BS-xynA1 were grown in minimal media supplemented with 0.2% glucose and 0.3% xylose, respectively, for 24 hours. The intracellular and extracellular xylanase activities of the strains were measured and showed in the Figure 3A,B, respectively. Intracellular xylanase activity was greater in the BS-xynA1 than in the parental strain (Figure3A); thus, the optimal yield was 6.16 U/mL, which is more than 4 times greater (1.485 U/mL) than found in the extracellular media using BS-xynA1strain after 18 hours of xylose-induced cultivation (Figure 3B). In the control strain, xylanase levels remained invariable between 16 and 20 hours of growth and were lower than those in the BS-xynA1 strain (Figure 3A).
The data indicate that the BS-xynA1 strain, which expresses homologous xylanase I in C. crescentus, secretes part of produced enzyme to the extracellular space (Figure 3A), since high enzymatic activity was verified into the cells. It is important to emphasize that both xylanases present in C. crescentus, Xylanase I [3] and Xylanase II (Jacomini et al., 2020; Jacomini et al. 2023), present different biochemical characteristics, to name a few optimal pH and temperature, so this property is very reliable for differentiating the activity in the measurements prior to xylanases in bacteria. Considering the biochemical parameters used of pH and temperature, only Xylanase I from C. crescentus is active. Even if Xylanase II is expressed from its own gene in the BS-xynA strain, Xylanase II will not be active. Although extracellular xylanase levels are lower than enzyme levels within the cell, it is noted that part of the enzyme is secreted and allows its application in an easier and safer manner because it is cell-free and does not require expensive enzymatic purification steps.
3.3. XynA1 Production in Different Agro-Industrial Residues
The extracellular xylanase activity values obtained for each of the agro-industrial residues were tested to evaluate the most effective residue for xylanase production (Figure 4). Among the residues tested, the highest xylanase activity (17.22 ± 0.22 U/mL) was obtained in expression medium supplemented with 0.2% (w/v) corn straw. In the presence of wheat straw and hemicellulose from wheat straw, there was practically no variation in xylanase activity (2.3 U/mL) or xylanase activity between the polished residue and the wheat flour industry vacuum cleaner residue (1.9 U/mL).
Several studies have reported that xylanase is an inducible enzyme secreted in media containing pure xylan or xylan-rich residues. Induction is initiated primarily by xylan. Several reports have shown the induction of xylanase by lignocelluloses such as wheat bran, rice straw, corncob, and sugarcane bagasse [34,35]. Xylose is the preferred carbon source for xylanase production by Arthrobacter sp. [36] and in Streptomyces rameus dextrose is the best inducer of xylanase production [37,38]. Several studies have shown that xylanase induction appears to be species specific in different bacterial strains [36].
3.4. Enzyme Quantification in Extracellular Extracts of the BS-xynA1 Strain
To better characterize the extracellular extract of C. crescentus XynA1 released by the BS-xynA1 strain, it was also evaluated for its ability to produce other enzymes, such as cellulase, pectinase, α-amylase, β-glycosidase, β-xylosidase and α-L-arabinosidase (Figure 5A). In the presence of 0.2% (w/v) corn straw, the xylanase concentration at pH 6.0 and 50 °C produced by BS-xynA1 was 17.22 U/mL, approximately 8 times greater than that of the control strain (2.08 U/mL). Different C. crescentus Xylanase I, the optimal parameters for xylanase II activity previously studied by our group is a pH of 8.0, an optimal temperature of 60 °C (Jacomini et al. 2020), and an activity of 1.16 U/mL, which is approximately 15 times lower than that observed for xylanase I in the BS-xynA1 strain (Figure 5).
By comparing the activities of the cellulase, pectinase, α-amylase, β-xylosidase and α-L-arabinosidase enzymes, it was determined that all the enzymes were very weakly coexpressed with XynA1 in the control strain Cc-pAS22 (Figure 5-white bars). The activity of all these enzymes was still repressed in the BS-xynA1 strain, except for the β-glycosidase, whose activity increased (1.3 U/mL) compared to that of the control strain (0.4 U/mL), although it remained the same at low levels (Figure 5 - black bars). When observing the activities of the enzymes present in the extracellular extracts of the C. crescentus BS-xynA1 and Cc-pAS22 strains, there was a high production of XynA1 and a low production of the enzymes in general in the extracts of BS-xynA1. In contrast, the Cc-pAS22 extracts showed low XynA1 enzymatic activity and increased activity of other enzymes. These data demonstrate that, in fact, the induction of xylose promoter activity from the pAS22 vector in the BS-xynA1 strain leads to a peculiar expression and specific activity of C. crescentus XynA1 in the extracellular medium.
The great advantage of this work is that only XynA1 is induced and expressed; therefore, it is active in the bacterium C. crescentus, while other enzymes that are commonly coexpressed with xylanases are not (Figure 5). This is because the strategy used in this study involved the use of a small amount of carbon (0.3% xylose combined with 0.2% corn straw) to promote the activity of the pAS22 vector and consequently the xynA1 gene. This approach allows us to experimentally show the specific biotechnological role of XynA1 expression in bacterial enzyme cell-free extracts for the bread industry.
Under certain specific experimental conditions, the potential to achieve xylanolytic activities surpassing those observed in our current study exists. However, this heightened activity is often coupled with a diminished degree of control over other contributing factors, particularly other enzymes that are significant within the context of the fermentation processes of the bread industry. An illustrative example of this can be found in the work of Corrêa et al. [21]. In their research, they advocated for the optimization of β-xylosidase expression in C. crescentus (strain NA1000) through the application of response surface methodology, utilizing corn cob as a carbon source. Within their optimized extract, a notably distinct profile of coexpressed enzymes emerges. Interestingly, the optimized conditions to produce bacterial β-xylosidases using a 3.5% corn cob substrate (393.36 U/mL) are associated with increased xylanase activity, which surpasses the levels observed in our present study (28.28 U/mL). This parallel increase in xylanase activity mirrors the pattern observed for β-xylosidases [21].
In concurrence with the findings pertaining to β-xylosidases, the RT-qPCR analysis presented in the present work substantiates that this overarching elevation in xylanase activity in the presence of corn straw (Figure 4) by the BS-xynA1 strain is a direct consequence of heightened transcription rates exhibited by the xynA1 gene in these cells (Figure 6).
3.5. Commercial Xylanases Versus Xylanase from BS-xynA1
Commercial enzymes commonly used in spring CA400, Xylamax292 and MegaCell 899 baking flours were used in vitro in parallel in comparative enzymatic dosing assays with extracellular XynA1 produced by the C. crescentus strain BS-xynA1. As a comparative parameter, the values of the specific activities (U/mg) of commercial enzymes and the XynA1 enzyme present in the crude extracellular extract obtained after BS-xynA1 strain culture filtration were adopted. The highest specific activity observed for XynA1, 163,397 U/mg, was at 50 °C, which coincides with the optimal XynA1 enzyme temperature previously reported [3] (Figure 7). In fact, XynA1 overexpression resulted in the highest specific activity (above 148 U/mg) at temperatures ranging from 50-70 °C in comparative studies. In addition, the specific enzymatic activity remained high at levels that are suitable for diverse applications in the manufacturing industry at all temperatures tested (30-100 °C) (Figure 7). These data show a certain robustness for C. crescentus XynA1 in the large temperature range in which it has activity, demonstrating the qualities necessary for a baking enzyme (Figure 7).
3.6. The Absence of Bacteria in the Enzyme Extracts Was Tested
The experiment involved testing enzyme extracts for the presence of bacteria using two different growth media: PYE at 30 °C and LB at 37 °C. After an incubation period of 48 hours, no bacterial growth was observed in either of the media, as indicated by the lack of visible bacterial colonies on the agar plates. This suggests that the enzyme extracts were free from viable bacteria. This outcome could be interpreted as a successful result, indicating that the Xylanase I extracellular is a cell-free enzyme.
3.7. Application of XynA1 in Bakery
The application of C. crescentus XynA1 in baking tests reduced the dough beat time by 9% and led to an 18.2% increase in bread height compared to the control (Table 4). In addition, the presence of XynA1 improved alveolar structure. When the enzyme XynA1 was added as a baking aid, the results were similar to those obtained with improved flour breads supplemented with commercial xylanases [39,40]. Other studies have also demonstrated improvements in bread characteristics with the addition of xylanases, but all these studies used commercial enzymes [41,42,43]. Jiang et al. [44] did not use a commercial enzyme but rather a xylanase isolated from Thermomyces lanuginosus CAU44 using costly enzymatic purification techniques. In the present work, we used a crude extracellular extract (without previous purification) because xylanase I is secreted predominantly in relation to other enzymes (Figure 5) and has high specific activity in the extract due to conditional expression; thus, the advantage of not spending time and costs on complex purification and enzymatic isolation methodologies.
De Queiroz Brito Cunha et al. [10] reported that the enzyme derived from the synthetic gene Streptomyces sp. XynBS27, the cloned S27 expressed in Pichia pastoris, was used in the breadmaking test. After purification, it was used as an additive in the baking process, promoting a decrease in stiffness and improvements in specific volume. In tests involving the enzymatic treatment of bread with the crude extract of C. crescentus BS-xynA1, similar results were obtained for improving bread characteristics.
3.8. Alveograph Test
The alveograph evaluations were carried out through five replicates, both in the absence and presence of the XynA1 enzyme extract enrichment. The introduction of the bacterial xylanase XynA1 notably improved the dough properties, specifically in terms of extensibility (L) and toughness reduction (P). This enhancement indicated a favorable impact due to the presence of XynA1, resulting in a dough that is more pliable and less rigid (Figure 8). With the incorporation of XynA1, the alveograph tests showed an impressive 18.8% increase (from 69 mm to 82 mm) in mass extensibility (L) compared to that of the control. This signifies a significant enhancement in the stretchability of the dough without compromising its structural integrity. Furthermore, the addition of XynA1 led to a notable 6.0% reduction (from 134 mmH2O to 126 mmH2O) in toughness (P), effectively reducing the dough stiffness (Table 5).
Furthermore, the combined effect of augmented extensibility (L) and diminished toughness (P) resulted in a substantial 20.6% decrease (from 1.94 to 1.54) in the toughness/elasticity index (P/L) in comparison to that of the control. This indicates a more harmonious dough composition, as outlined in Table 5. In the context of the alveograph examination, the introduction of xylanase I reduced the maximum pressure (P) and the tensile strength/extensibility ratio (P/L). This phenomenon can be attributed to the hydrolysis of insoluble pentosans, leading to the release of water, thereby softening the texture of the dough. This outcome is reminiscent of findings by Osella et al. [45], where the application of Bacillus subtilis xylanase resulted in improved dough consistency during kneading and subsequently enhanced bread quality, particularly when dealing with lower quality flour, upon increasing the enzyme concentration.
All the results presented in this report highlight the successful production and application of xylanase I from C. crescentus. Through homologous overexpression and secretion, the cell-free xylanase I enzyme was effectively obtained. Furthermore, the enzyme exhibited remarkable stability following sterilization through filtration, making it suitable for various biotechnological applications, particularly in the bakery industry. The study demonstrated that xylanase I, when incorporated into the baking process, significantly influenced the rheological properties of the dough. This influence resulted in an increase in bread volume and an overall improvement in the alveolar structure of the crumb (Figure 9). These findings suggest that xylanase I holds significant promise as a valuable processing aid within the baking industry. Importantly, this research presents a novel approach to produce xylanase I. The use of homologous expression in C. crescentus to produce this enzyme is an innovative step forward. Furthermore, the successful application of the produced xylanase I in the bakery industry demonstrates its practical utility and potential for commercial use. In conclusion, this study not only highlights the successful production of xylanase I through homologous expression in C. crescentus but also underscores its effectiveness as a tool for improving the quality of baked goods. The results contribute to our understanding of the potential applications of this enzyme in the baking industry, opening new avenues for biotechnological innovation and product improvement.
Author Contributions
B.S.: investigation, visualization, and writing - original draft; P.M.C.R, A. F, J.L.C.S.; R.F.G. and AM: methodology; M.K.: methodology and resources; RCGS: Software, project administration, funding acquisition, supervision, writing, review, and editing. All authors have read and agreed to the published version of the manuscript.
Funding
B. Simioni; P.M.C. Rocha, A. Fávero were fellows of CAPES, the Coordination of Improvement of Higher Education Personnel. M. K. Kadowaki was supported by CNPq (Universal Grant: 407596/2023-2). This work was supported by SETI: Superintendência Geral de Ciência, Tecnologia e Ensino Superior do Estado do Paraná.
Institutional Review Board Statement
Not applicable.
Informed Consent Statement
Not applicable.
Data Availability Statement
The original contributions presented in this study are included in the article. Further inquiries can be directed to the corresponding author.
Acknowledgments
We thank P. R. Heinen for the critical reading of this manuscript and suggestions for its improvement. The alveograph tests were carried out by B. Simioni under the supervision and technical-professional assistance of P.H. Zanini from Moinho Rio Azul. The authors kindly thank P. H. Zanini for their partnership in the present work.
Conflicts of Interest
The authors declare no conflict of interest.
References
- Manicardi, T., Baioni e Silva, G., Longati, A.A., Paiva, T.D., Souza, J.P.M., Pádua, T.F., Furlan, F.F., Giordano, R.L.C., Giordano, R.C., Milessi, T.S.: Xylooligosaccharides: A Bibliometric Analysis and Current Advances of This Bioactive Food Chemical as a Potential Product in Biorefineries’ Portfolios. Foods. 2023; 12. [CrossRef]
- Bosetto, A., Justo, P.I., Zanardi, B., Venzon, S.S., Graciano, L., dos Santos, E.L., de Cássia Garcia Simão, R.: Research Progress Concerning Fungal and Bacterial β-Xylosidases. Appl. Biochem. Biotechnol. 2016; 178, 766–795 . [CrossRef]
- Graciano, L., Corrêa, J.M., Vieira, F.G.N., Bosetto, A., Loth, E.A., Kadowaki, M.K., Gandra, R.F., Simão, R. de C.G.: Cloning and Expression of the xynA1 Gene Encoding a Xylanase of the GH10 Group in Caulobacter crescentus. Appl. Biochem. Biotechnol.2015; 175, 3915–3929. [CrossRef]
- Jacomini, D., Bussler, L., Corrêa, J.M., Kadowaki, M.K., Maller, A., da-Conceição Silva, J.L., Simão, R. de C.G.: Cloning, expression and characterization of C. crescentus xynA2 gene and application of Xylanase II in the deconstruction of plant biomass. Mol. Biol. Rep.2020; 47, 4427–4438. [CrossRef]
- Jacomini, D., Bussler, L., da-Conceição Silva, J.L., Maller, A., Kadowaki, M.K., Simão, R. de C.G.: Biopolishing of denim by the recombinant xylanase II of Caulobacter crescentus. Brazilian J. Microbiol.2023; 54 (3): 1559-1564. [CrossRef]
- Chakdar, H., Kumar, M., Pandiyan, K., Singh, A., Nanjappan, K., Kashyap, P.L., Srivastava, A.K.: Bacterial xylanases: biology to biotechnology. 3 Biotech.2026; 6. [CrossRef]
- Dutta, B., Banerjee, A., Chakraborty, P., Bandopadhyay, R.: In silico studies on bacterial xylanase enzyme: Structural and functional insight. J. Genet. Eng. Biotechnol. 2018; 16, 749–756. [CrossRef]
- Fang, C., Wang, Q., Selvaraj, J.N., Zhou, Y., Ma, L., Zhang, G., Ma, Y.: High copy and stable expression of the xylanase XynHB in Saccharomyces cerevisiae by rDNA-mediated integration. Sci. Rep. 2017; 7, 1–9 . [CrossRef]
- Putseys, J.A., Schooneveld-Bergmans, M.E.F.: Enzymes used in baking. Ind. Enzym. Appl. 2019; 97–123. [CrossRef]
- De Queiroz Brito Cunha, C.C., Gama, A.R., Cintra, L.C., Bataus, L.A.M., Ulhoa, C.J.: Improvement of bread making quality by supplementation with a recombinant xylanase produced by Pichia pastoris. PLoS One. 2018; 13, 1–14. [CrossRef]
- Kumar, V., Binod, P., Sindhu, R., Gnansounou, E., Ahluwalia, V.: Bioconversion of pentose sugars to value added chemicals and fuels: Recent trends, challenges and possibilities. Bioresour. Technol. 2018; 269, 443–451. [CrossRef]
- Wu, J., Qiu, C., Ren, Y., Yan, R., Ye, X., Wang, G.: Novel salt-tolerant xylanase from a mangrove-isolated fungus phoma sp. MF13 and its application in Chinese steamed bread. ACS Omega. 2018; 3, 3708–3716. [CrossRef]
- Barrows, J.M., Goley, E.D.: Synchronized Swarmers and Sticky Stalks: Caulobacter crescentus as a Model for Bacterial Cell Biology. J. Bacteriol. 2023; 205. [CrossRef]
- Hosoi-Tanabe, S., Zhang, H., Zhu, D., Nagata, S., Ban, S., Imura, S.: Comprehensive analysis of an antarctic bacterial community with the adaptability of growth at higher temperatures than those in Antarctica, Biocontrol Sci; 2010. 15 (2) : 57-62. [CrossRef] [PubMed]
- Nierman, W.C., Feldblyum, T. V., Laub, M.T., Paulsen, I.T., Nelson, K.E., Eisen, J., Heidelberg, J.F., Alley, M.R.K., Ohta, N., Maddock, J.R., Potocka, I., Nelson, W.C., Newton, A., Stephens, C., Phadke, N.D., Ely, B., DeBoy, R.T., Dodson, R.J., Durkin, A.S., Gwinn, M.L., Haft, D.H., Kolonay, J.F., Smit, J., Craven, M.B., Khouri, H., Shetty, J., Berry, K., Utterback, T., Tran, K., Wolf, A., Vamathevan, J., Ermolaeva, M., White, O., Salzberg, S.L., Venter, J.C., Shapiro, L., Fraser, C.M.: Complete genome sequence of Caulobacter crescentus. Proc. Natl. Acad. Sci. U. S. A. 2002; 98, 4136–4141. [CrossRef]
- Marks, M.E., Castro-Rojas, C.M., Teiling, C., Du, L., Kapatral, V., Walunas, T.L., Crosson, S.: The genetic basis of laboratory adaptation in Caulobacter crescentus. J. Bacteriol. 2010; 192, 3678–3688. [CrossRef]
- Corrêa, J.M., Graciano, L., Abrahão, J., Loth, E.A., Gandra, R.F., Kadowaki, M.K., Henn, C., Simão, R.D.C.G.: Expression and characterization of a GH39 β-xylosidase II from caulobacter crescentus. Appl. Biochem. Biotechnol. 2012; 168, 2218–2229. [CrossRef]
- Corrêa, J.M., Mingori, M.R., Gandra, R.F., Loth, E.A., Seixas, F.A.V., Simão, R.D.C.G.: Depletion of the xynB2 gene upregulates β-xylosidase expression in C. crescentus. Appl. Biochem. Biotechnol. 2014; 172, 1085–1097. [CrossRef]
- Graciano, L., Corrêa, J.M., Gandra, R.F., Seixas, F.A.V., Kadowaki, M.K., Sampaio, S.C., da Conceição Silva, J.L., Osaku, C.A., Simão, R. de C.G.: The cloning, expression, purification, characterization and modeled structure of Caulobacter crescentus β-Xylosidase I. World J. Microbiol. Biotechnol. 2012; 28, 2879–2888. [CrossRef]
- Justo, P.I., Corrêa, J.M., Maller, A., Kadowaki, M.K., da Conceição-Silva, J.L., Gandra, R.F., Simão, R. de C.G.: Analysis of the xynB5 gene encoding a multifunctional GH3-BglX β-glucosidase-β-xylosidase-α-arabinosidase member in Caulobacter crescentus. Antonie van Leeuwenhoek, 2015; 108, 993–1007. [CrossRef]
- Corrêa, J.M., dos Santos, E.L., Simões, M.R., Kadowaki, M.K., Gandra, R.F., Simão, R. de C.G.: Optimization of C. crescentus β-Xylosidases and Expression of xynB1–5 Genes in Response to Agro-Industrial Waste. Waste and Biomass Valorization. 2020; 11, 6169–6178. [CrossRef]
- Silva, A.A., Corrêa, J.M., Maller, A., Kadowaki, M.K., Sene, L., Gandra, R.F., da-Conceição Silva, J.L., Simão, R. de C.G.: Caulobacter crescentus β-Xylosidase II Is Highly Tolerant to Inhibitors Present in Fermentative Processes Involving Lignocellulosic Biomass. Bioenergy Res. 2020; 13, 301–313. [CrossRef]
- Moore, G.M., Gitai, Z.: Both clinical and environmental Caulobacter species are virulent in the Galleria mellonella infection model. PLoS One. 2020; 15, 1–14 . [CrossRef]
- Simon, R., Priefer, U., Pühler, A.: A Broad Host Range Mobilization System for In Vivo Genetic Engineering: Transposon Mutagenesis in Gram Negative Bacteria. Nat. Biotechnol. 1983; 1(9): 784-791. [CrossRef]
- Green, M.R and Sambrook, J. : Molecular cloning: A laboratory manual, 4th ed., CSH: Cold Spring Harbor Press, New York, 2012.
- Evinger, M., Agabian, N.:Envelope-associated nucleoid from Caulobacter crescentus stalked and swarmer cells. J Bacteriol. 1977; 132 (1) :294-301 1977. [CrossRef]
- Jenal, U. and Fuchs, T.: An essential protease involved in bacterial cell-cycle control. The EMBO Journal. 1988 ; 17: 5658-5669. [CrossRef]
- Meisenzahl, A.C., Shapiro L., Jenal, U.: Isolation and characterization of a xylose-dependent promoter from Caulobacter crescentus. J Bacteriol. 1997; 179 (3):592-600. [CrossRef]
- Hottes, A. K., Meewan, M., Yang, D., Arana, N., Romero, P., Mcadams, H. H., et al. Transcriptional profiling of Caulobacter crescentus during growth on complex and Minimal Media. Journal of Bacteriol.2004; 186, 1448–1461.
- Herbert, D., Phipps, P.J., Strange, R.E.: Chemical Analysis of Microbial Cells. Methods Microbiol. 1971; 5, 209–344. [CrossRef]
- Miller, G.L.: Use of Dinitrosalicylic Acid Reagent for Determination of Reducing Sugar. Anal. Chem. 1959; 31, 426–428. [CrossRef]
- Bradford, M.M.: A rapid and sensitive method for the quantitation of microgram quantities of protein utilizing the principle of protein-dye binding. Anal. Biochem. 1976; 72, 248–254 (1976). [CrossRef]
- de Beer, T.: Quality assessment of wheat flour, dough, and bread. INC (2023).
- Juturu, V., Wu, J.C.: Microbial xylanases: Engineering, production and industrial applications. Biotechnol. Adv. 2012; 30, 1219–1227. [CrossRef]
- Alokika, Singh, B.: Production, characteristics, and biotechnological applications of microbial xylanases. Appl. Microbiol. Biotechnol. 2019; 103, 8763–8784. [CrossRef]
- Rai, R., Samanta, D., Goh, K.M., Chadha, B.S., Sani, R.K.: Biochemical unraveling of the endoxylanase activity in a bifunctional GH39 enzyme cloned and expressed from thermophilic Geobacillus sp. WSUCF1. Int. J. Biol. Macromol. 2024; 257, 128679. [CrossRef]
- Zhu, W., Qin, L., Xu, Y., Lu, H., Wu, Q., Li, W., Zhang, C., Li, X.: Three Molecular Modification Strategies to Improve the Thermostability of Xylanase XynA from Streptomyces rameus L2001. Foods. 2023; 12. [CrossRef]
- Fatokun, E.N., Nwodo, U.U., Okoh, A.I.: Classical optimization of cellulase and xylanase production by a marine streptomyces species. Appl. Sci. 2026; 6, 1–14. [CrossRef]
- Chen, S., Wu, Y., Su, L., Wu, J.: Contribution of disulfide bond to the stability of Thermobifida fusca cutinase. Food Biosci. 2019; 27, 6–10. [CrossRef]
- Han, C., Yang, R., Sun, Y., Liu, M., Zhou, L., Li, D.: Identification and Characterization of a Novel Hyperthermostable Bifunctional Cellobiohydrolase- Xylanase Enzyme for Synergistic Effect With Commercial Cellulase on Pretreated Wheat Straw Degradation. Front. Bioeng. Biotechnol. 2020; 8, 1–13. [CrossRef]
- Hu, G., Hong, X., Zhu, M., Lei, L., Han, Z., Meng, Y., Yang, J.: Improving the Quality of Wheat Flour Bread by a Thermophilic Xylanase with Ultra Activity and Stability Reconstructed by Ancestral Sequence and Computational-Aided Analysis. Molecules. 2024; 29, 1895. [CrossRef]
- Frohberg, C., Quanz, M.: Use of linear poly-alpha-1.4-glucans as resistant starch. 1, 2008 (US 2008/0249297 A1).
- de Oliveira Simas, A.L., de Alencar Guimarães, N.C., Glienke, N.N., Galeano, R.M.S., de Sá Teles, J.S., Kiefer, C., de Souza Nascimento, K.M.R., Masui, D.C., Zanoelo, F.F., Giannesi, G.C.: Production of Phytase, Protease and Xylanase by Aspergillus niveus with Rice Husk as a Carbon Source and Application of the Enzymes in Animal Feed.2024; Waste and Biomass Valorization. [CrossRef]
- Jiang, Z.Q., Yang, S.Q., Tan, S.S., Li, L.T., Li, X.T.: Characterization of a xylanase from the newly isolated thermophilic Thermomyces lanuginosus CAU44 and its application in bread making. Lett. Appl. Microbiol. 2005; 41, 69–76 . [CrossRef]
- Osella, C. de la T., Erben, M., Gallardo, A., Sanchez, H.: Effect of xylanase on the technological behavior of wheat flours. J of Food Research; 2013; 1, 33–39 .
Figure 1.
Strategies for engineering C. crescentus strains that overexpress xylanase I in the strain BS-xynA1. (A) Genetic context of the xynA1 construct in the pJet1.2-Blunt cloning vector. (B) The pJet1.2-Blunt construct containing the xynA1 gene was digested with XhoI and treated to produce blunt-end DNA. Next, pJet1.2-Blunt-xynA1 was digested with EcoRI, and the resulting fragment, containing the complete xynA1 gene (C), was subcloned and inserted into the pAS22 vector (EcoRI/EcoRV) under the control of a promoter induced by xylose (D), generating the synthetic strain BS-xynA1, which expresses Xylanase I in its own bacterium when 0.3% xylose is added. (E) DNA agarose gel electrophoresis on a TAE1X 1% gel. 1: Molecular weight marker 1 kb DNA Ladder (Thermo); 2: Construction of pAS22-xynA1 digested with EcoRI/KpnI enzymes.
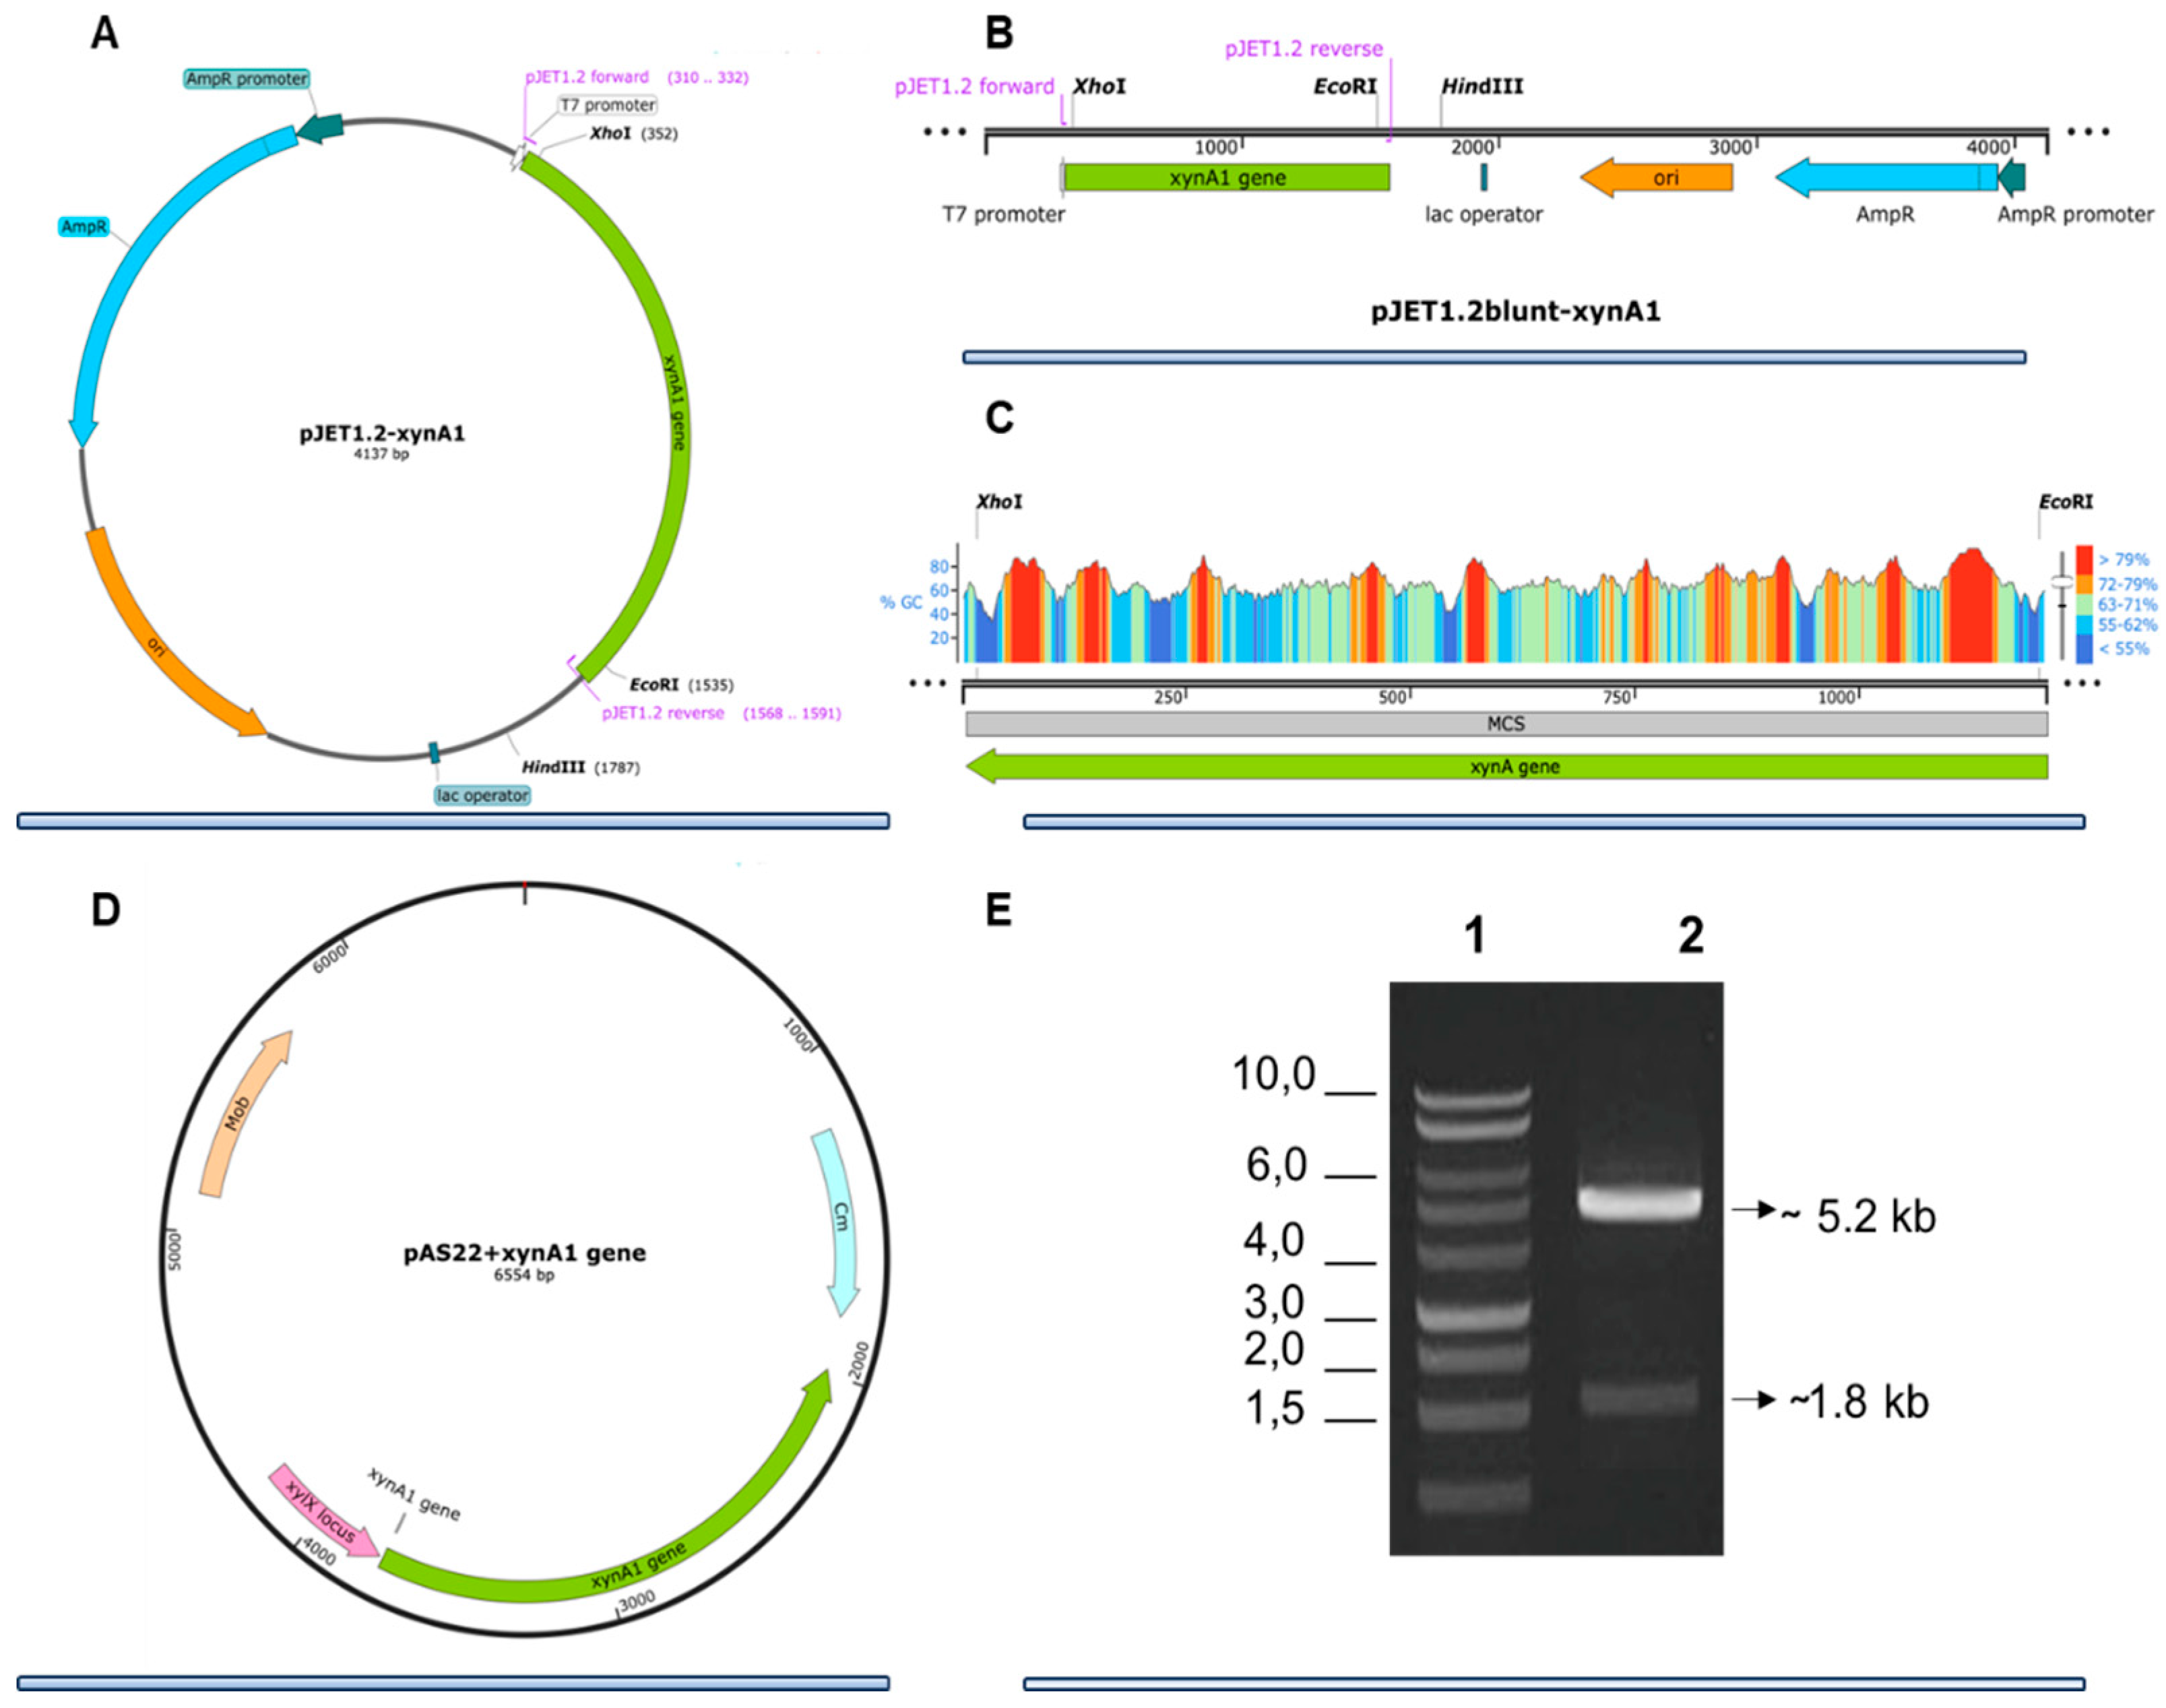
Figure 2.
Cell growth curves and xylose consumption of the control strain Cc-pAS22 and the BS-xynA1 strain in M2 media supplemented with 0.3% xylose at 30 °C and 120 rpm. Cell growth (continuous line) is expressed as the O.D.λ = 600 nm. The residual xylose content (sectioned line) is expressed as a percentage of the total initial sugar content.
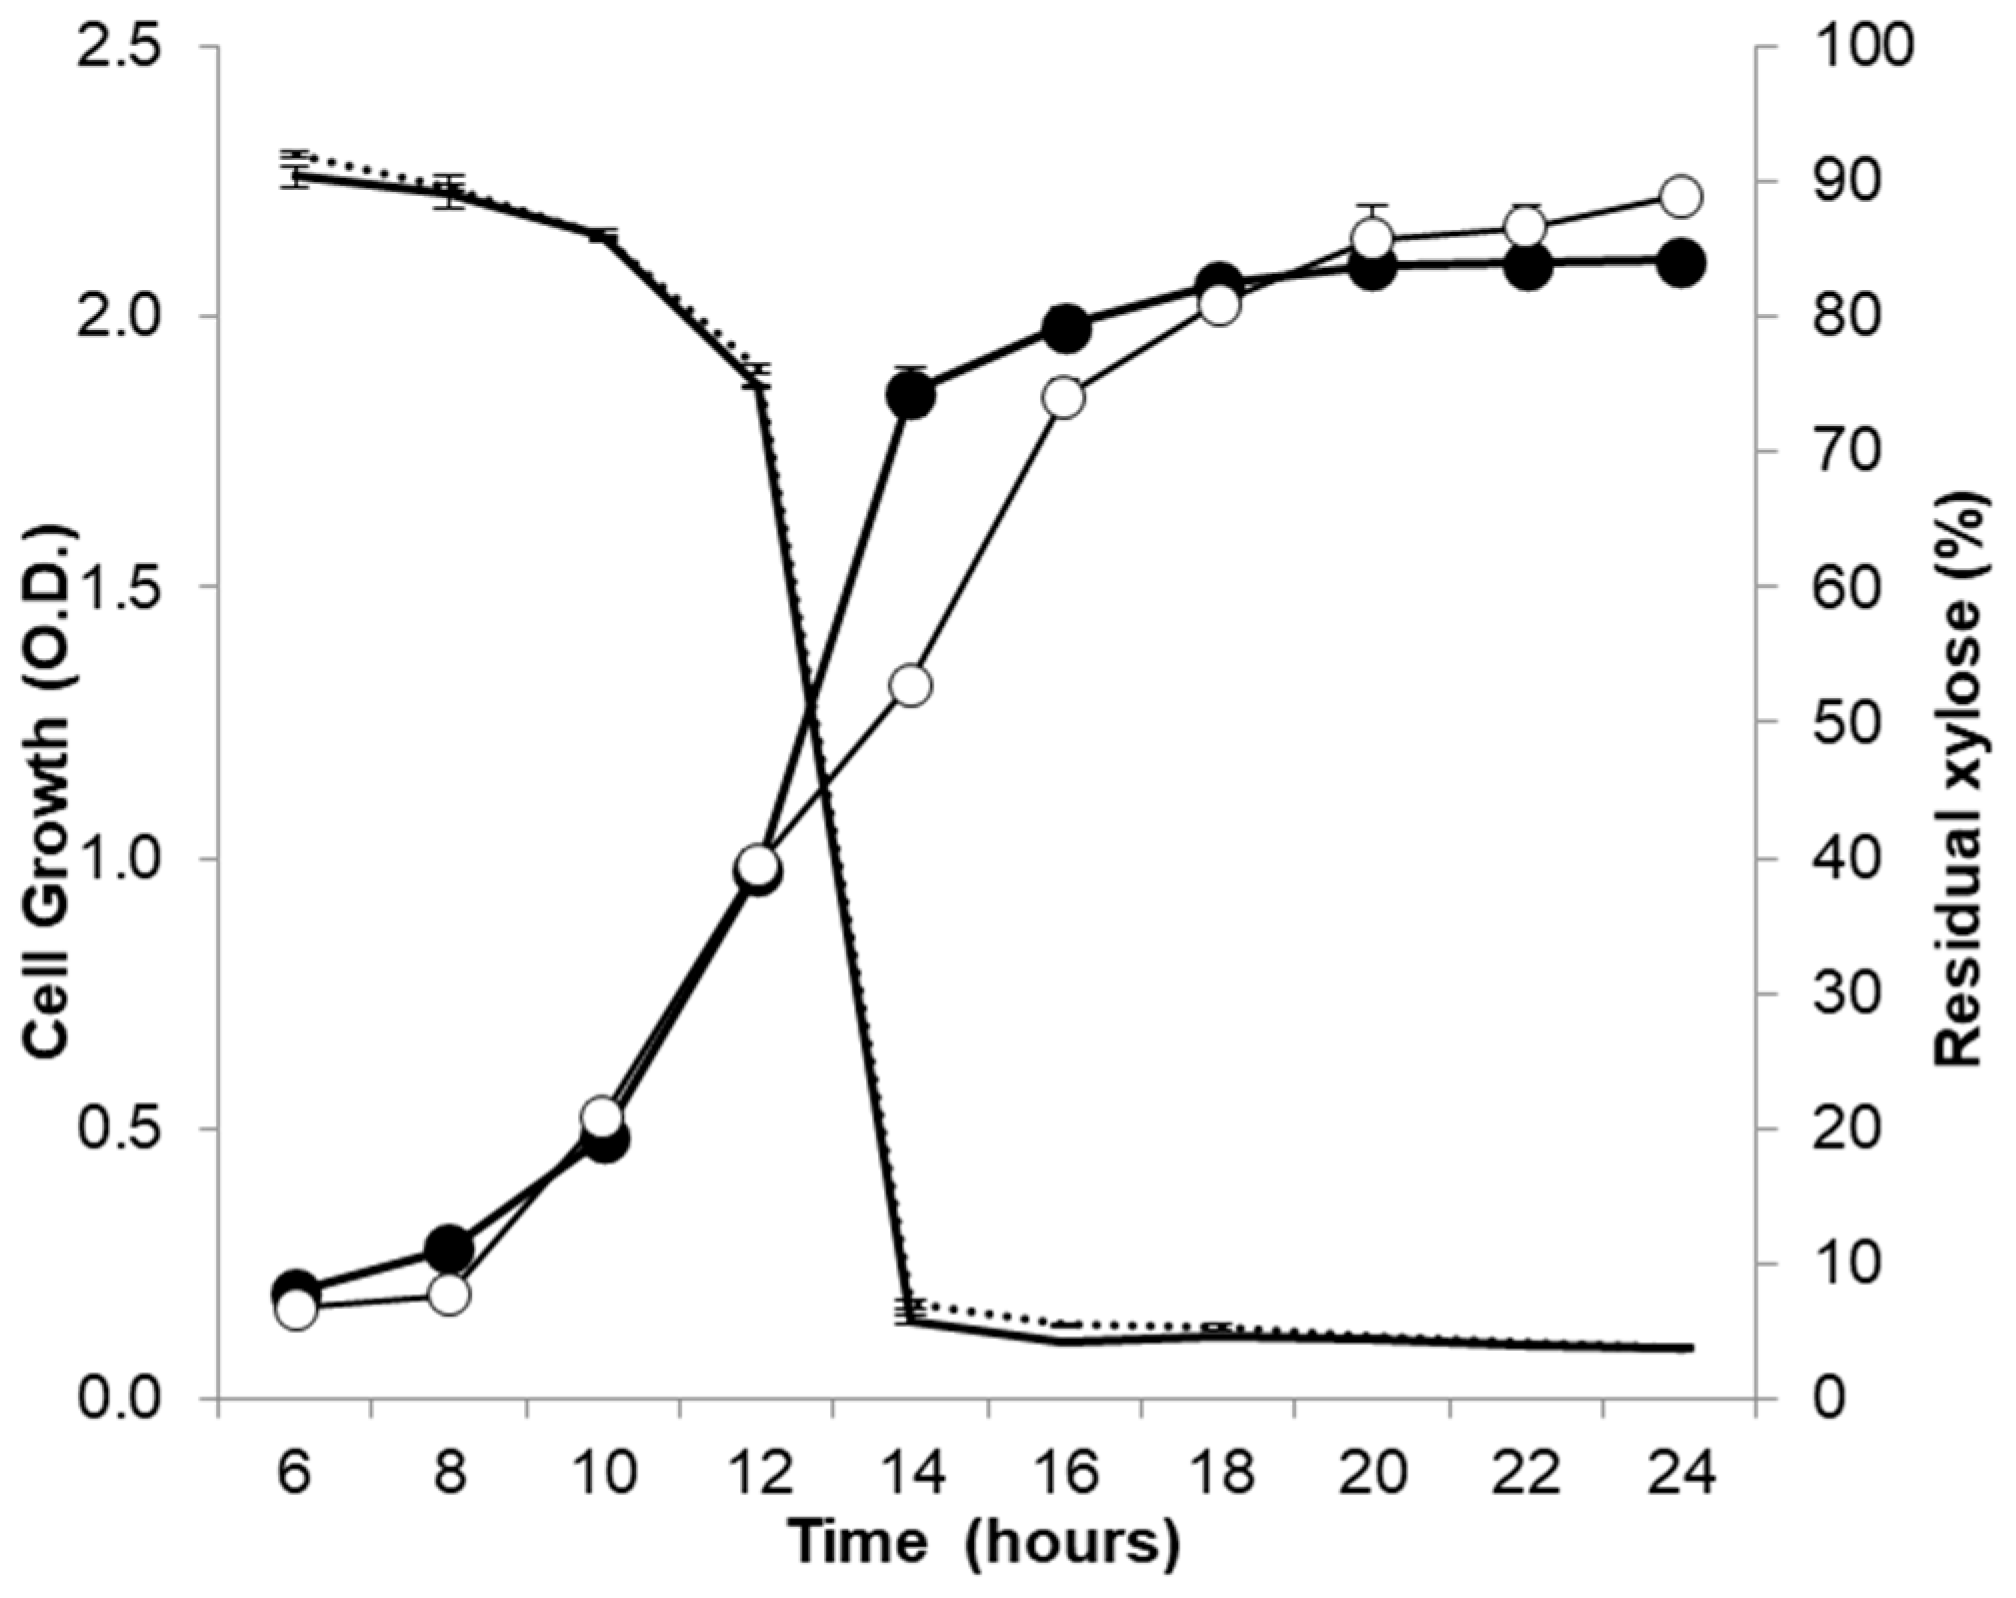
Figure 3.
(A) Intracellular xylanase activity of the control strain Cc-pAS22 (open circle) and BS-xynA1 (closed circle). Bacterial cells were grown in M2 media at 30 °C and 120 rpm. (B) Extracellular xylanase activity of the Cc-pAS22 (open circle) and BS-xynA1 (closed circle) strains of C. crescentus. Bacterial cells were grown in M2 media supplemented with 0.2% (w/v) glucose (Cc-pAS22) and 0.3% (w/v) xylose (BS-xynA1) at 30 °C and 120 rpm for 24 hours. Aliquots of the culture were removed, and xylanolytic activities were measured.
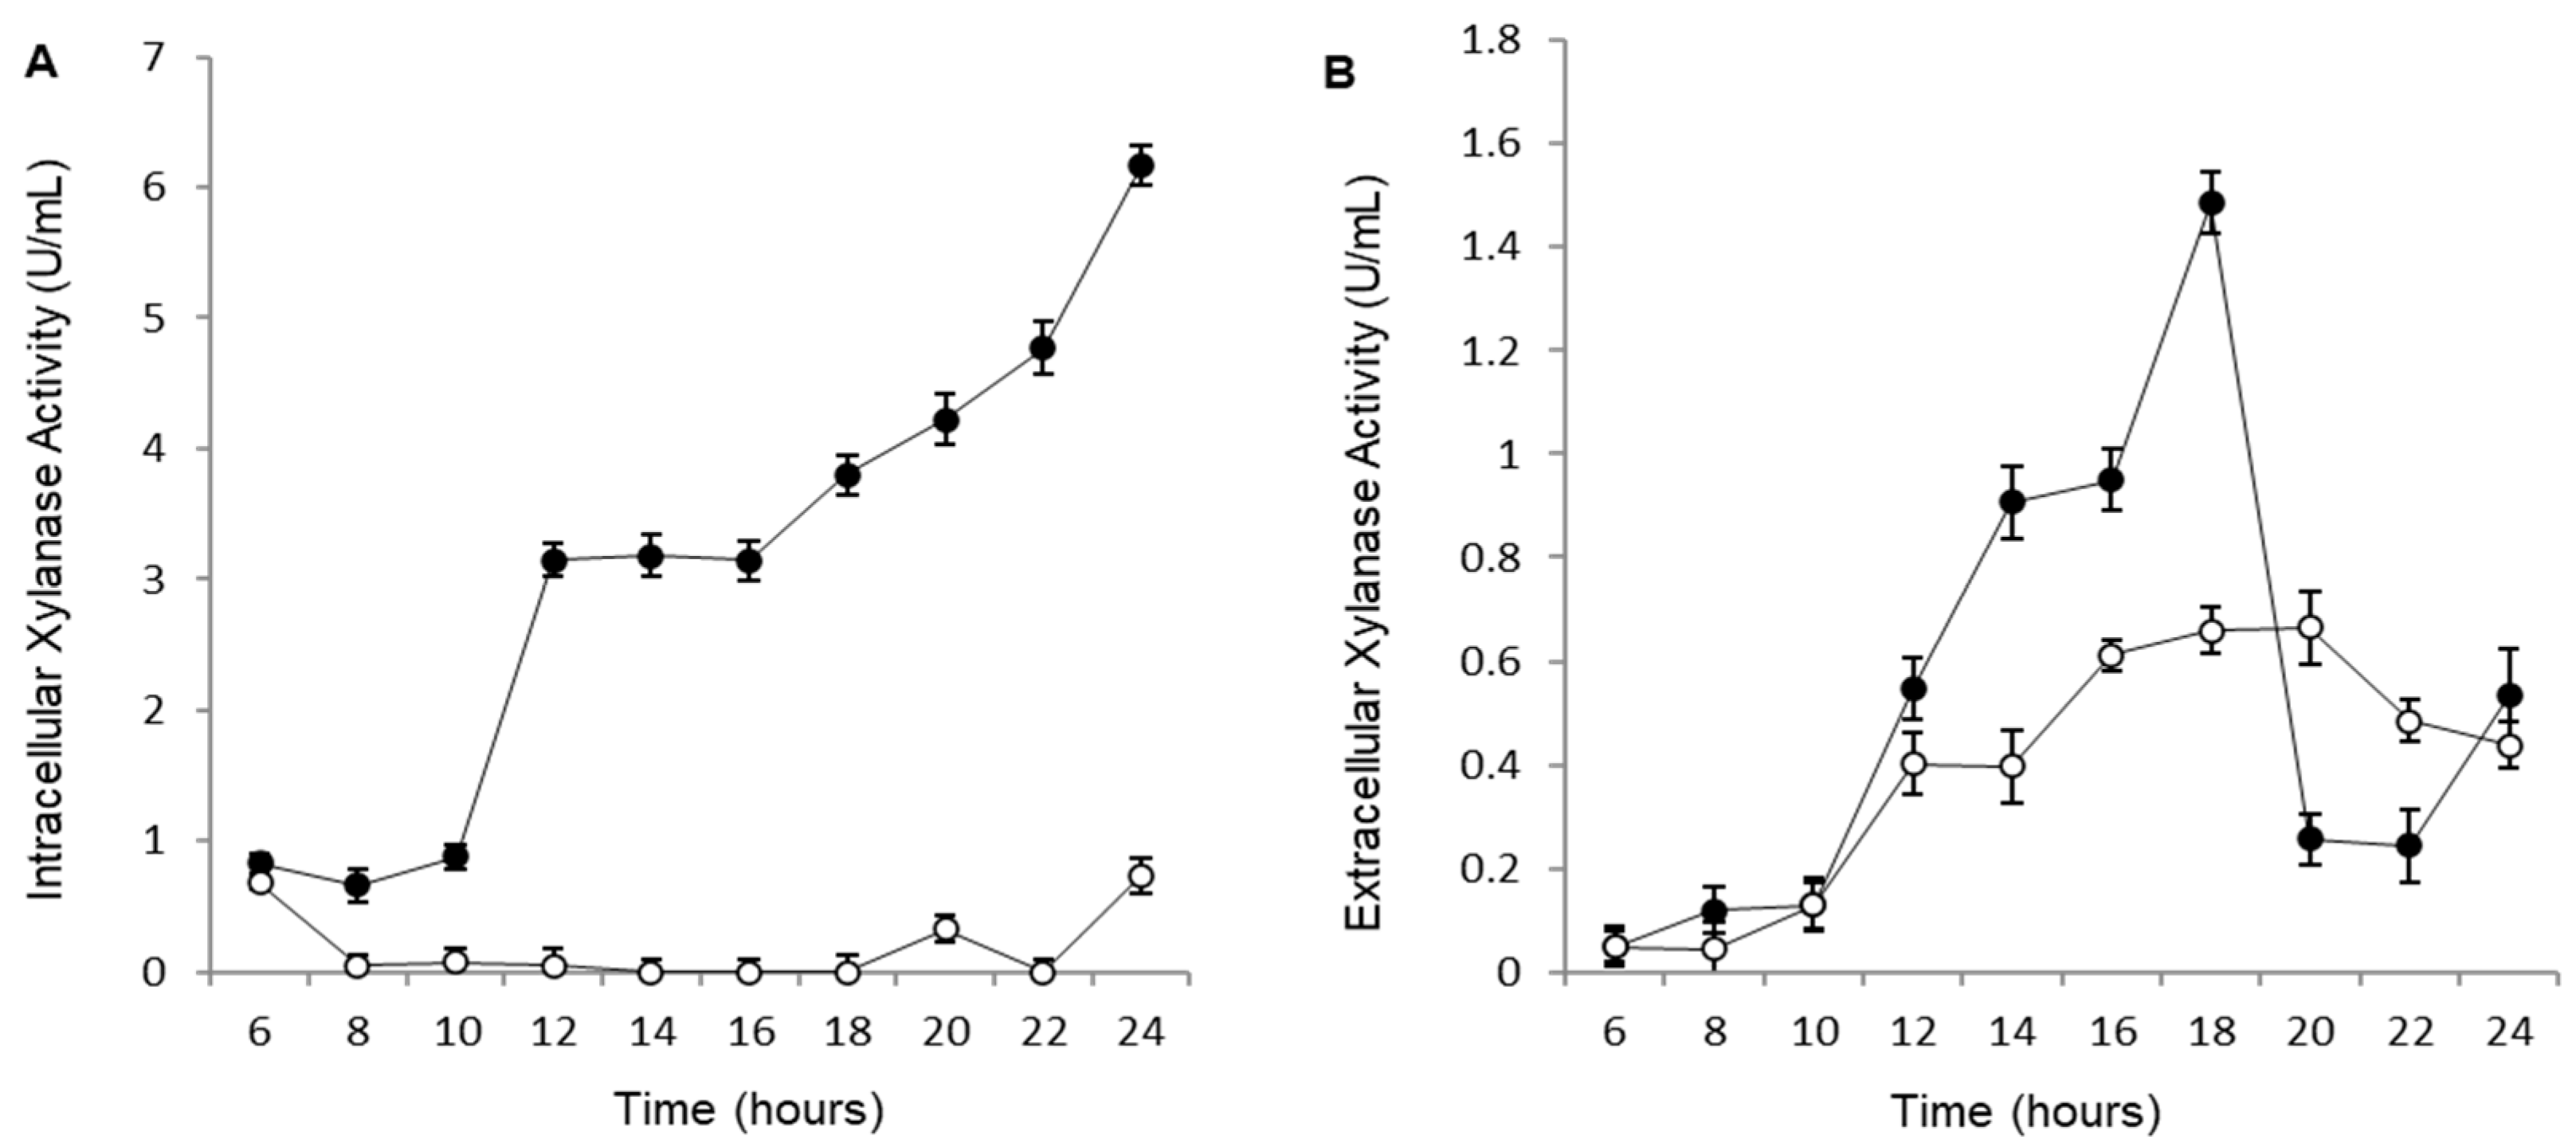
Figure 4.
Xylanase I production in the presence of different agro-industrial residues. C. crescentus BS-xynA1 strain cells were grown in minimal M2 medium supplemented with 0.3% xylose (w/v) and supplemented with 0.2% (w/v) agro-industrial residues: (CS) corn straw; (CC) corn cob; (HPM) hemicellulose from corn straw; (WS) wheat straw; (PR) polisher residue (WF) wheat flour industry vacuum cleaner residue (RF) rice flour (SB) sugarcane bagasse (RS) rice straw; and (SR) soybean residue. The inoculum was generated by diluting the cells at the stationary phase to an O.D.λ of 0.1 at 600 nm in the same culture medium containing different carbon sources. Bacterial growth occurred at 30 °C for 18 h with agitation at 120 rpm.
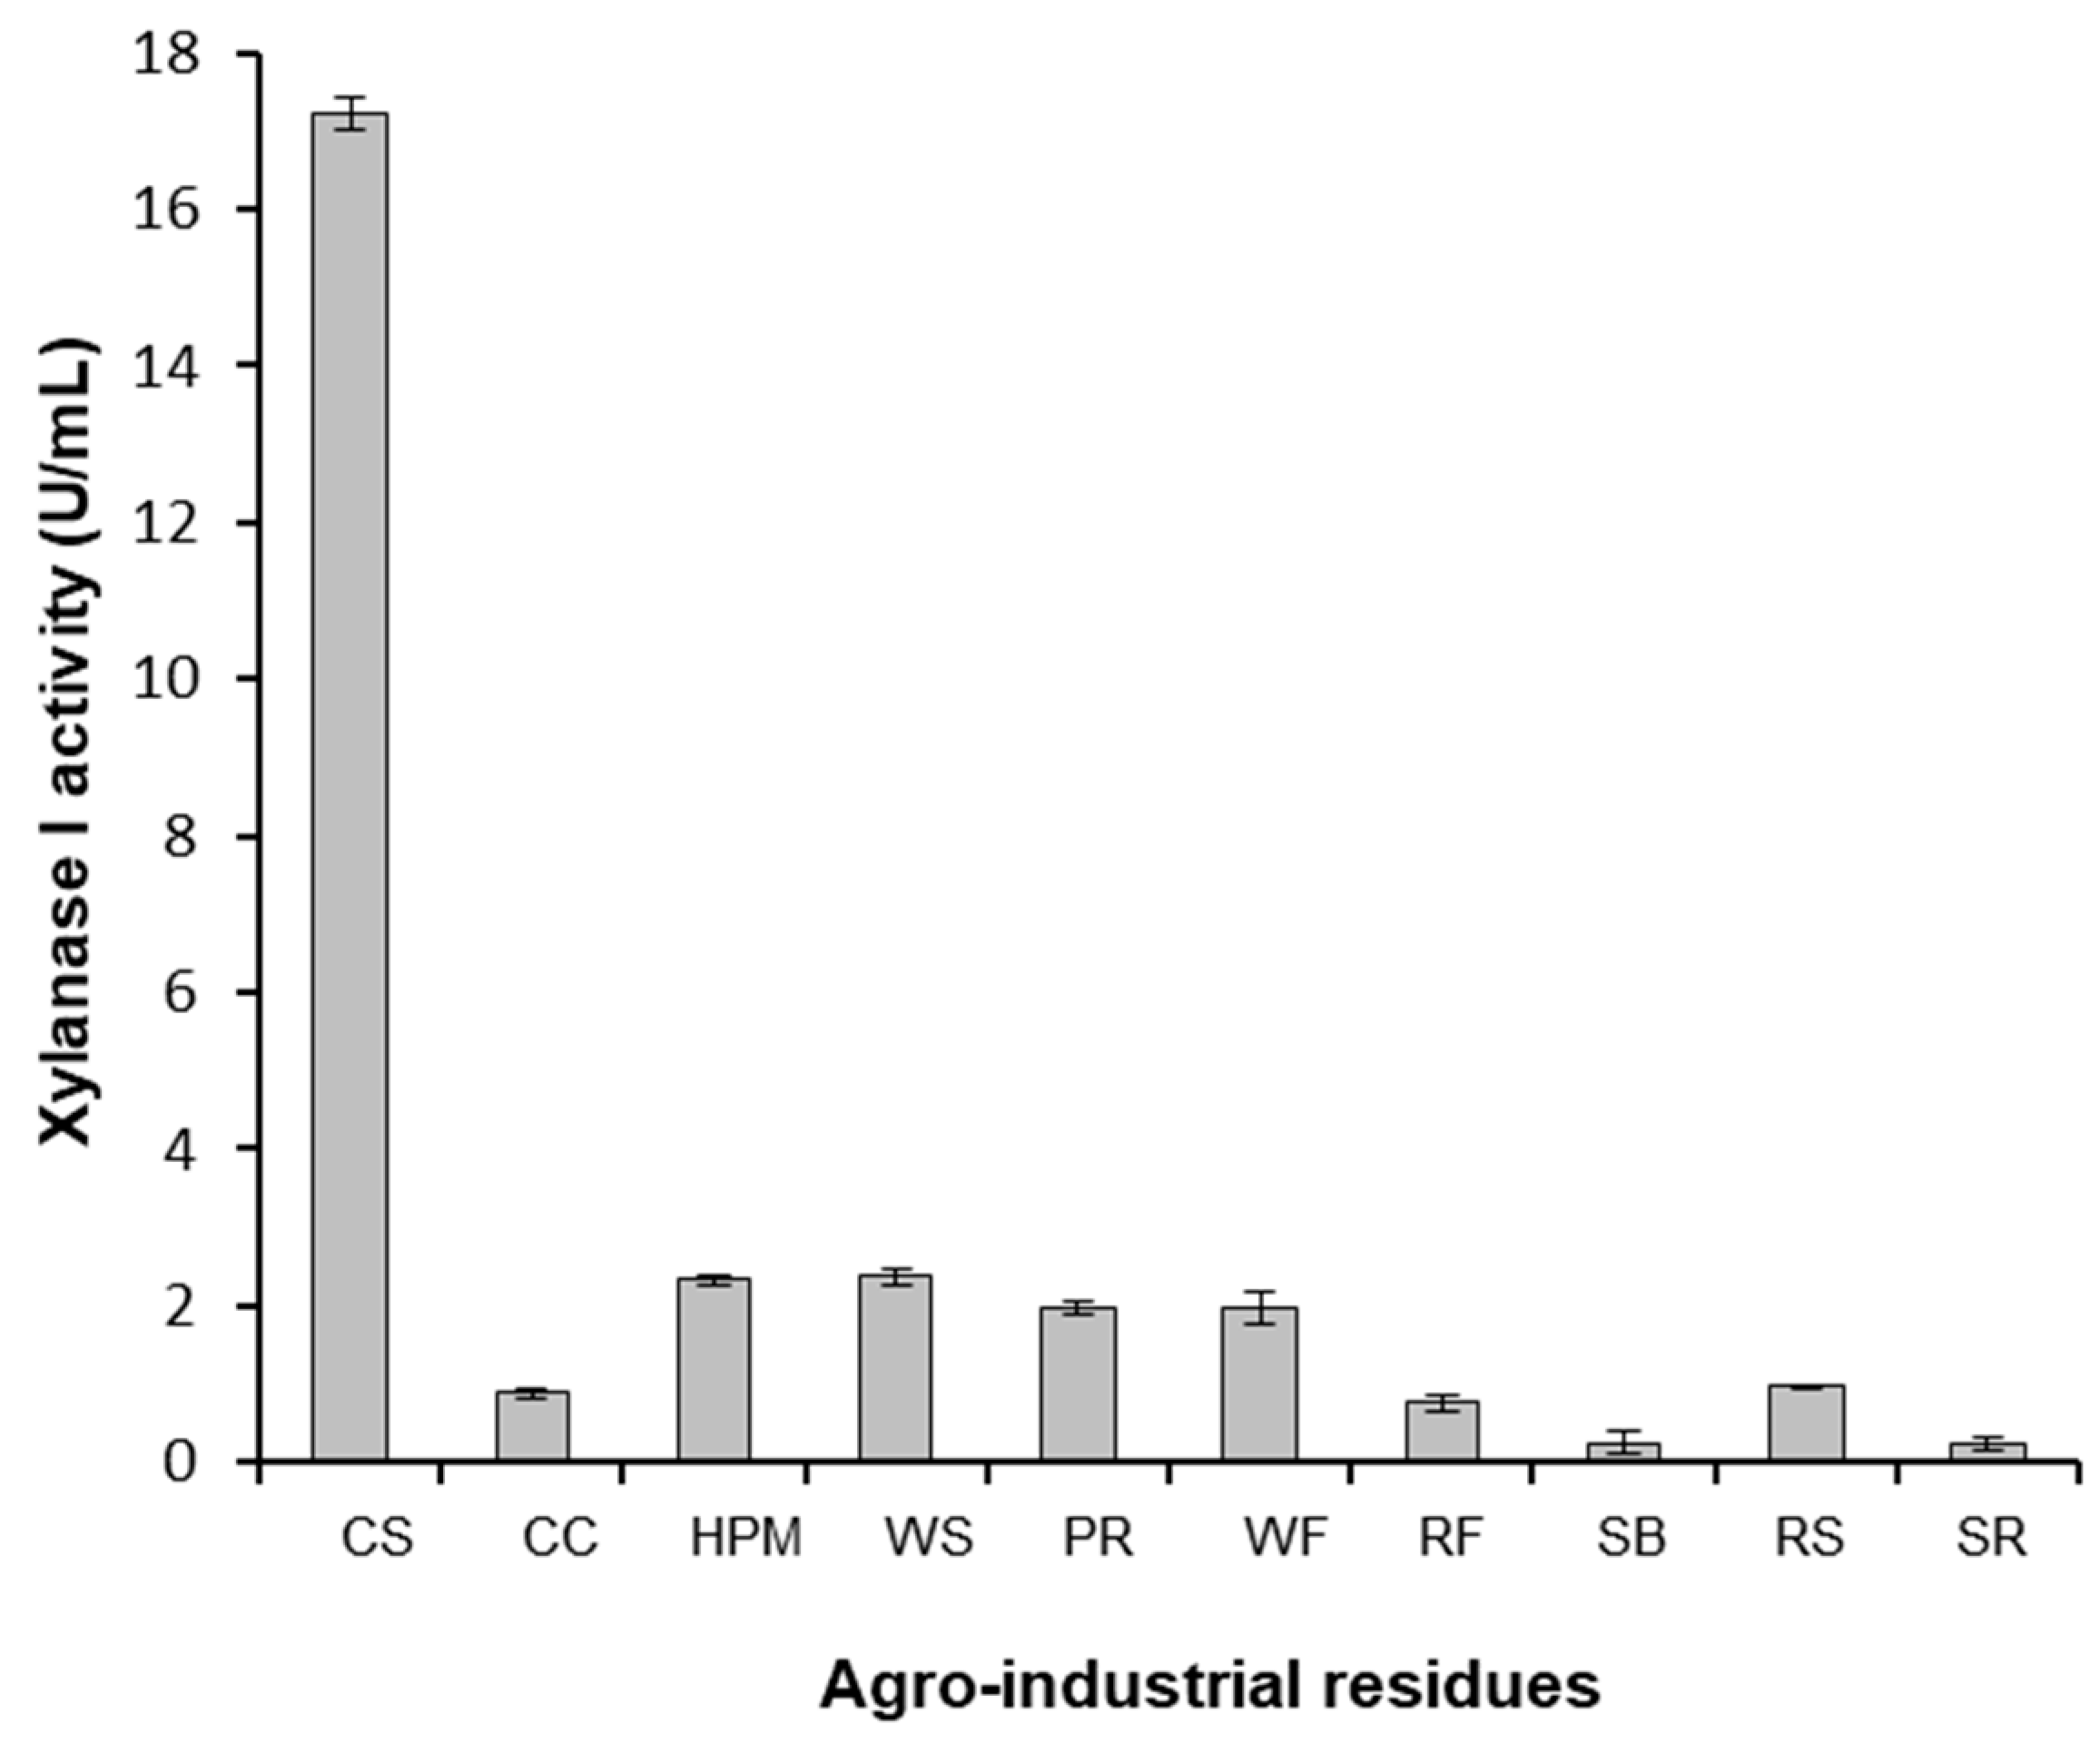
Figure 5.
Enzyme activities produced by different C. crescentus strains (Cc-pAS22 and BS-xynA1) after growth in M2 medium supplemented with 0.2% (w/v) corn straw at 30 °C and 120 rpm for 18 hours. (XynA1) xylanase I; (CelA1) cellulase; (Pect) pectinase; (α-Ara) α-L-arabinosidase; (β-gly) β-glycosidase; (β-xyl) β-xylosidase; (α-amy) α-amylase.
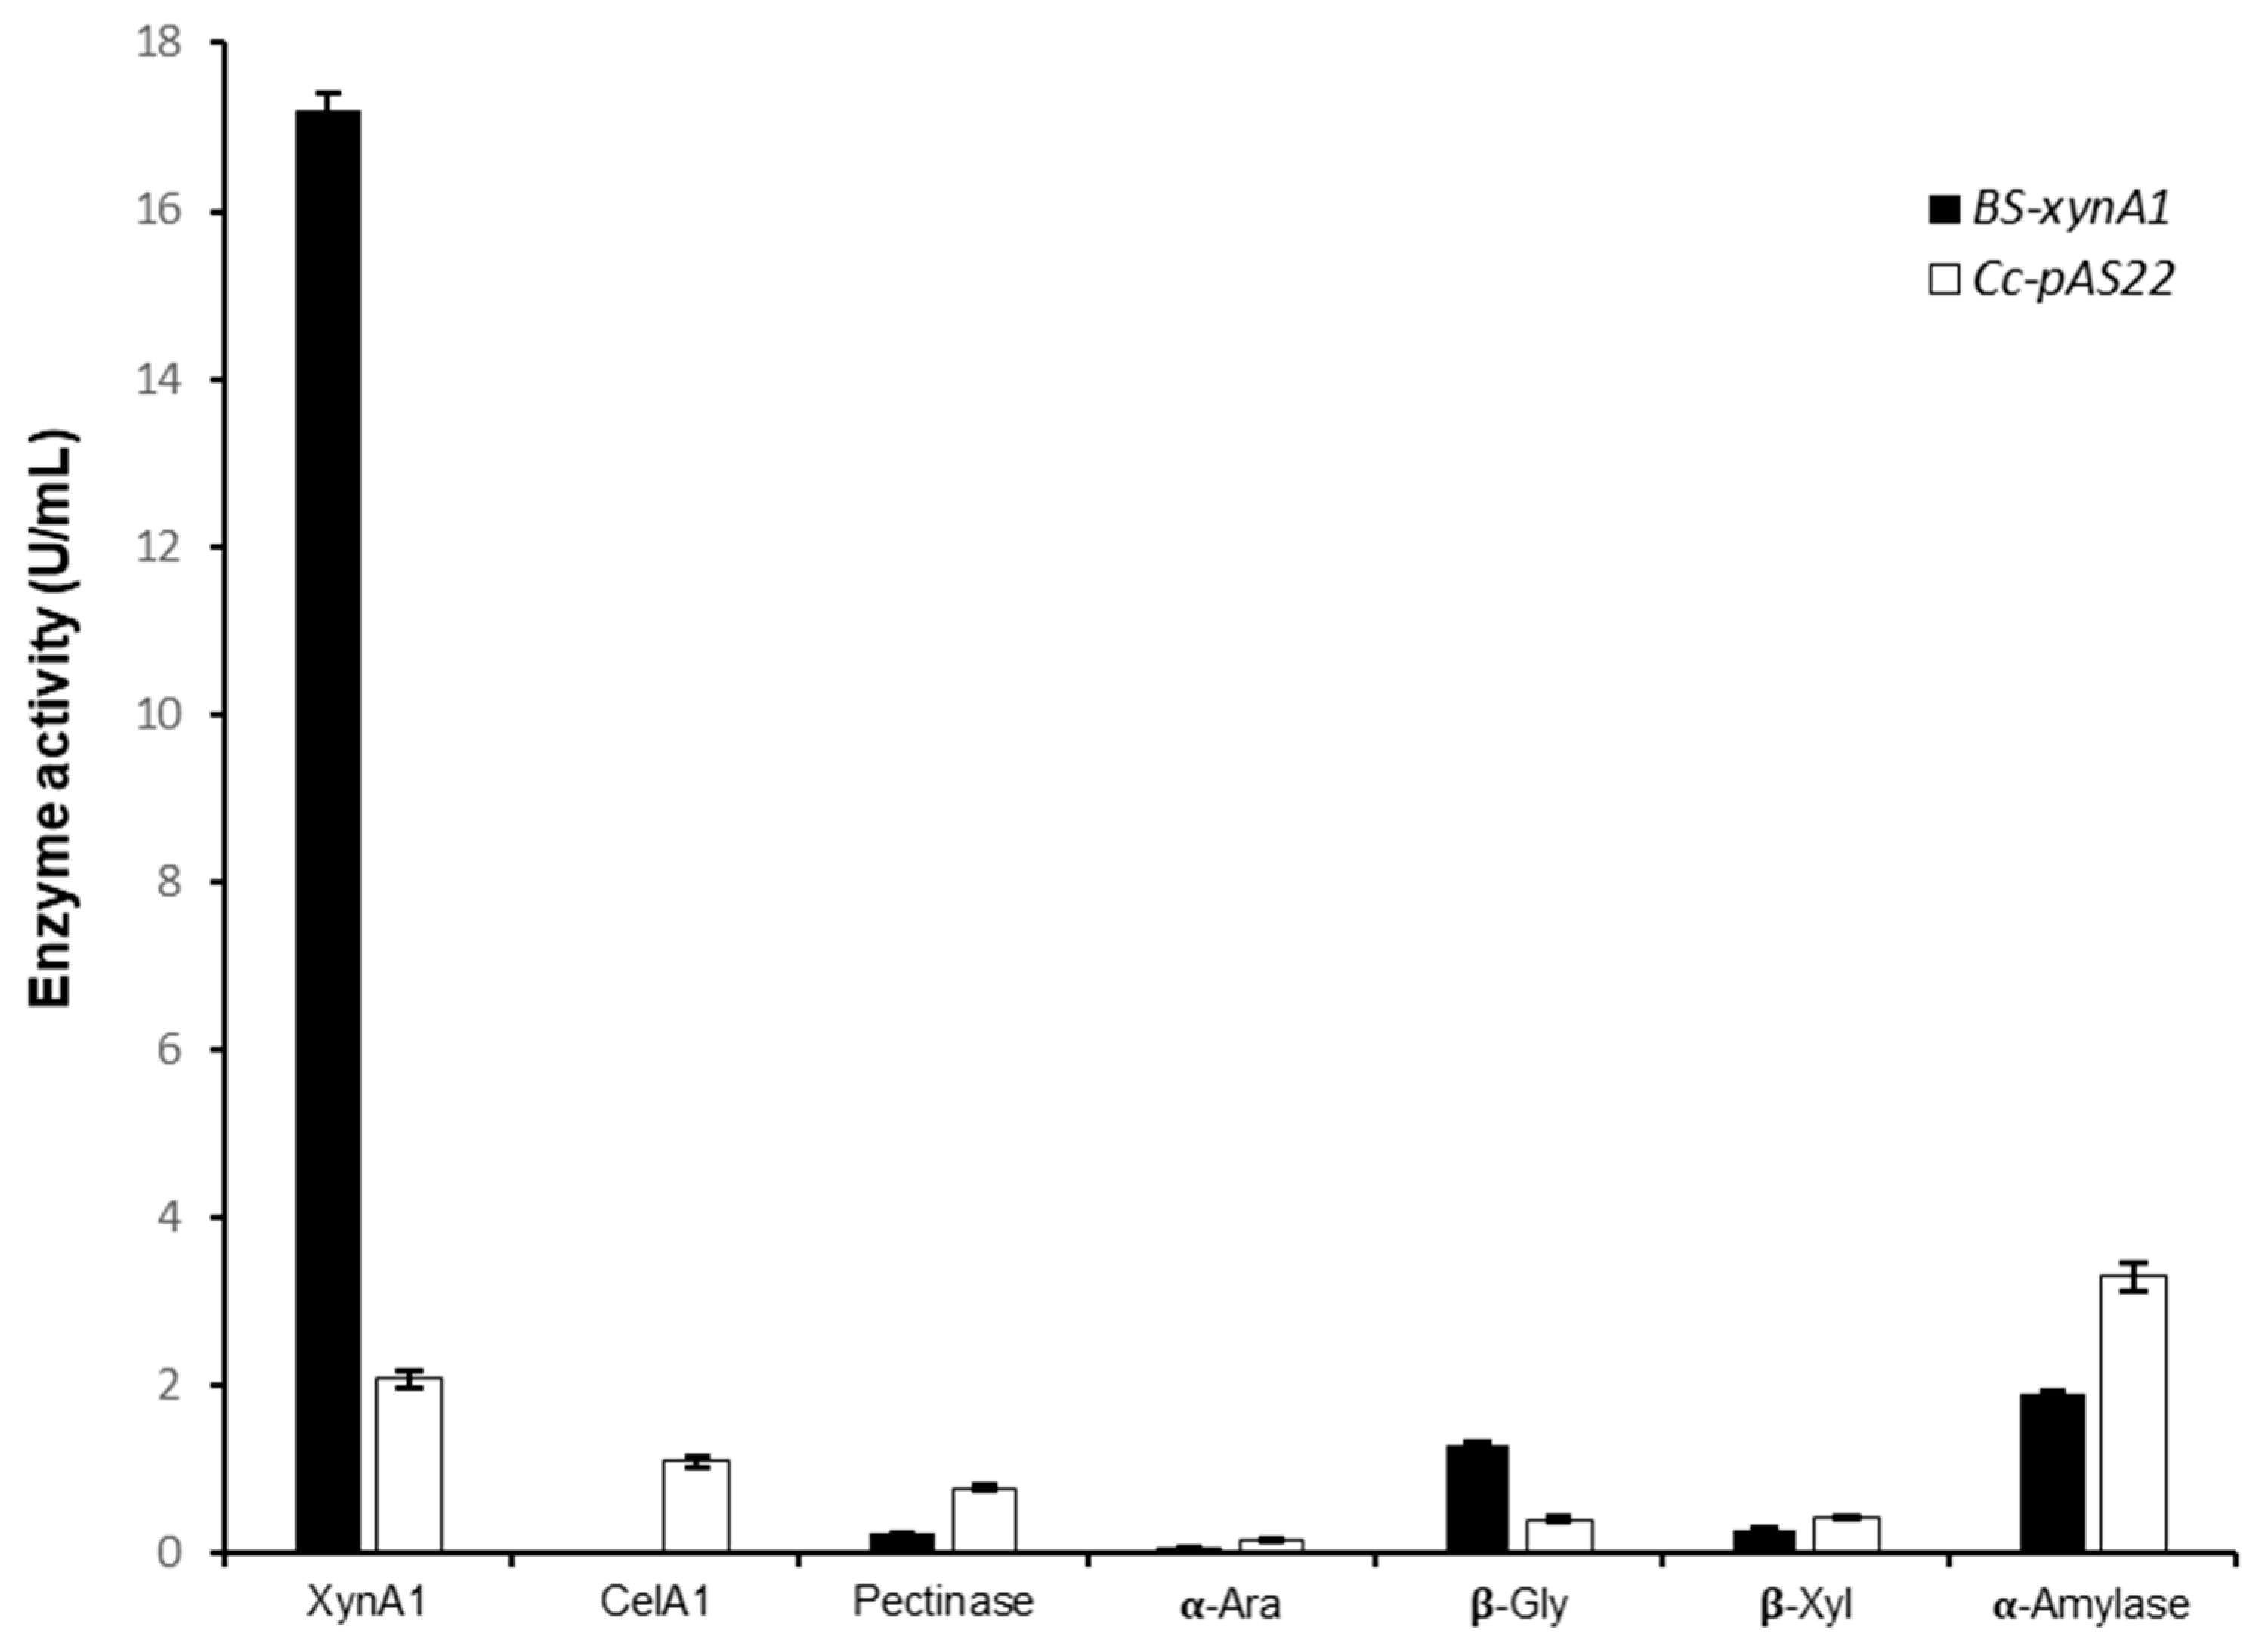
Figure 6.
Relative gene expression of xylanase genes (xynA1-2) in the C. crescentus NA1000 (white bars) and BS-xynA1 (blue bars) strains determined via quantitative real-time PCR (RT‒qPCR). This study aimed to understand how nutrient availability and growth conditions affect the expression of the xynA1 gene in C. crescentus strains. RNA extraction and RT-qPCR protocols followed established procedures. Data normalization was performed using the 16S rRNA gene as an endogenous control, ensuring accuracy and reliability across treatments. Three independent biological experiments with three replicates each were conducted to ensure robustness and consistency. Relative gene expression levels were calculated for treatments under different media conditions, CS: corn straw; CC: corn cob and M2 minimum media.
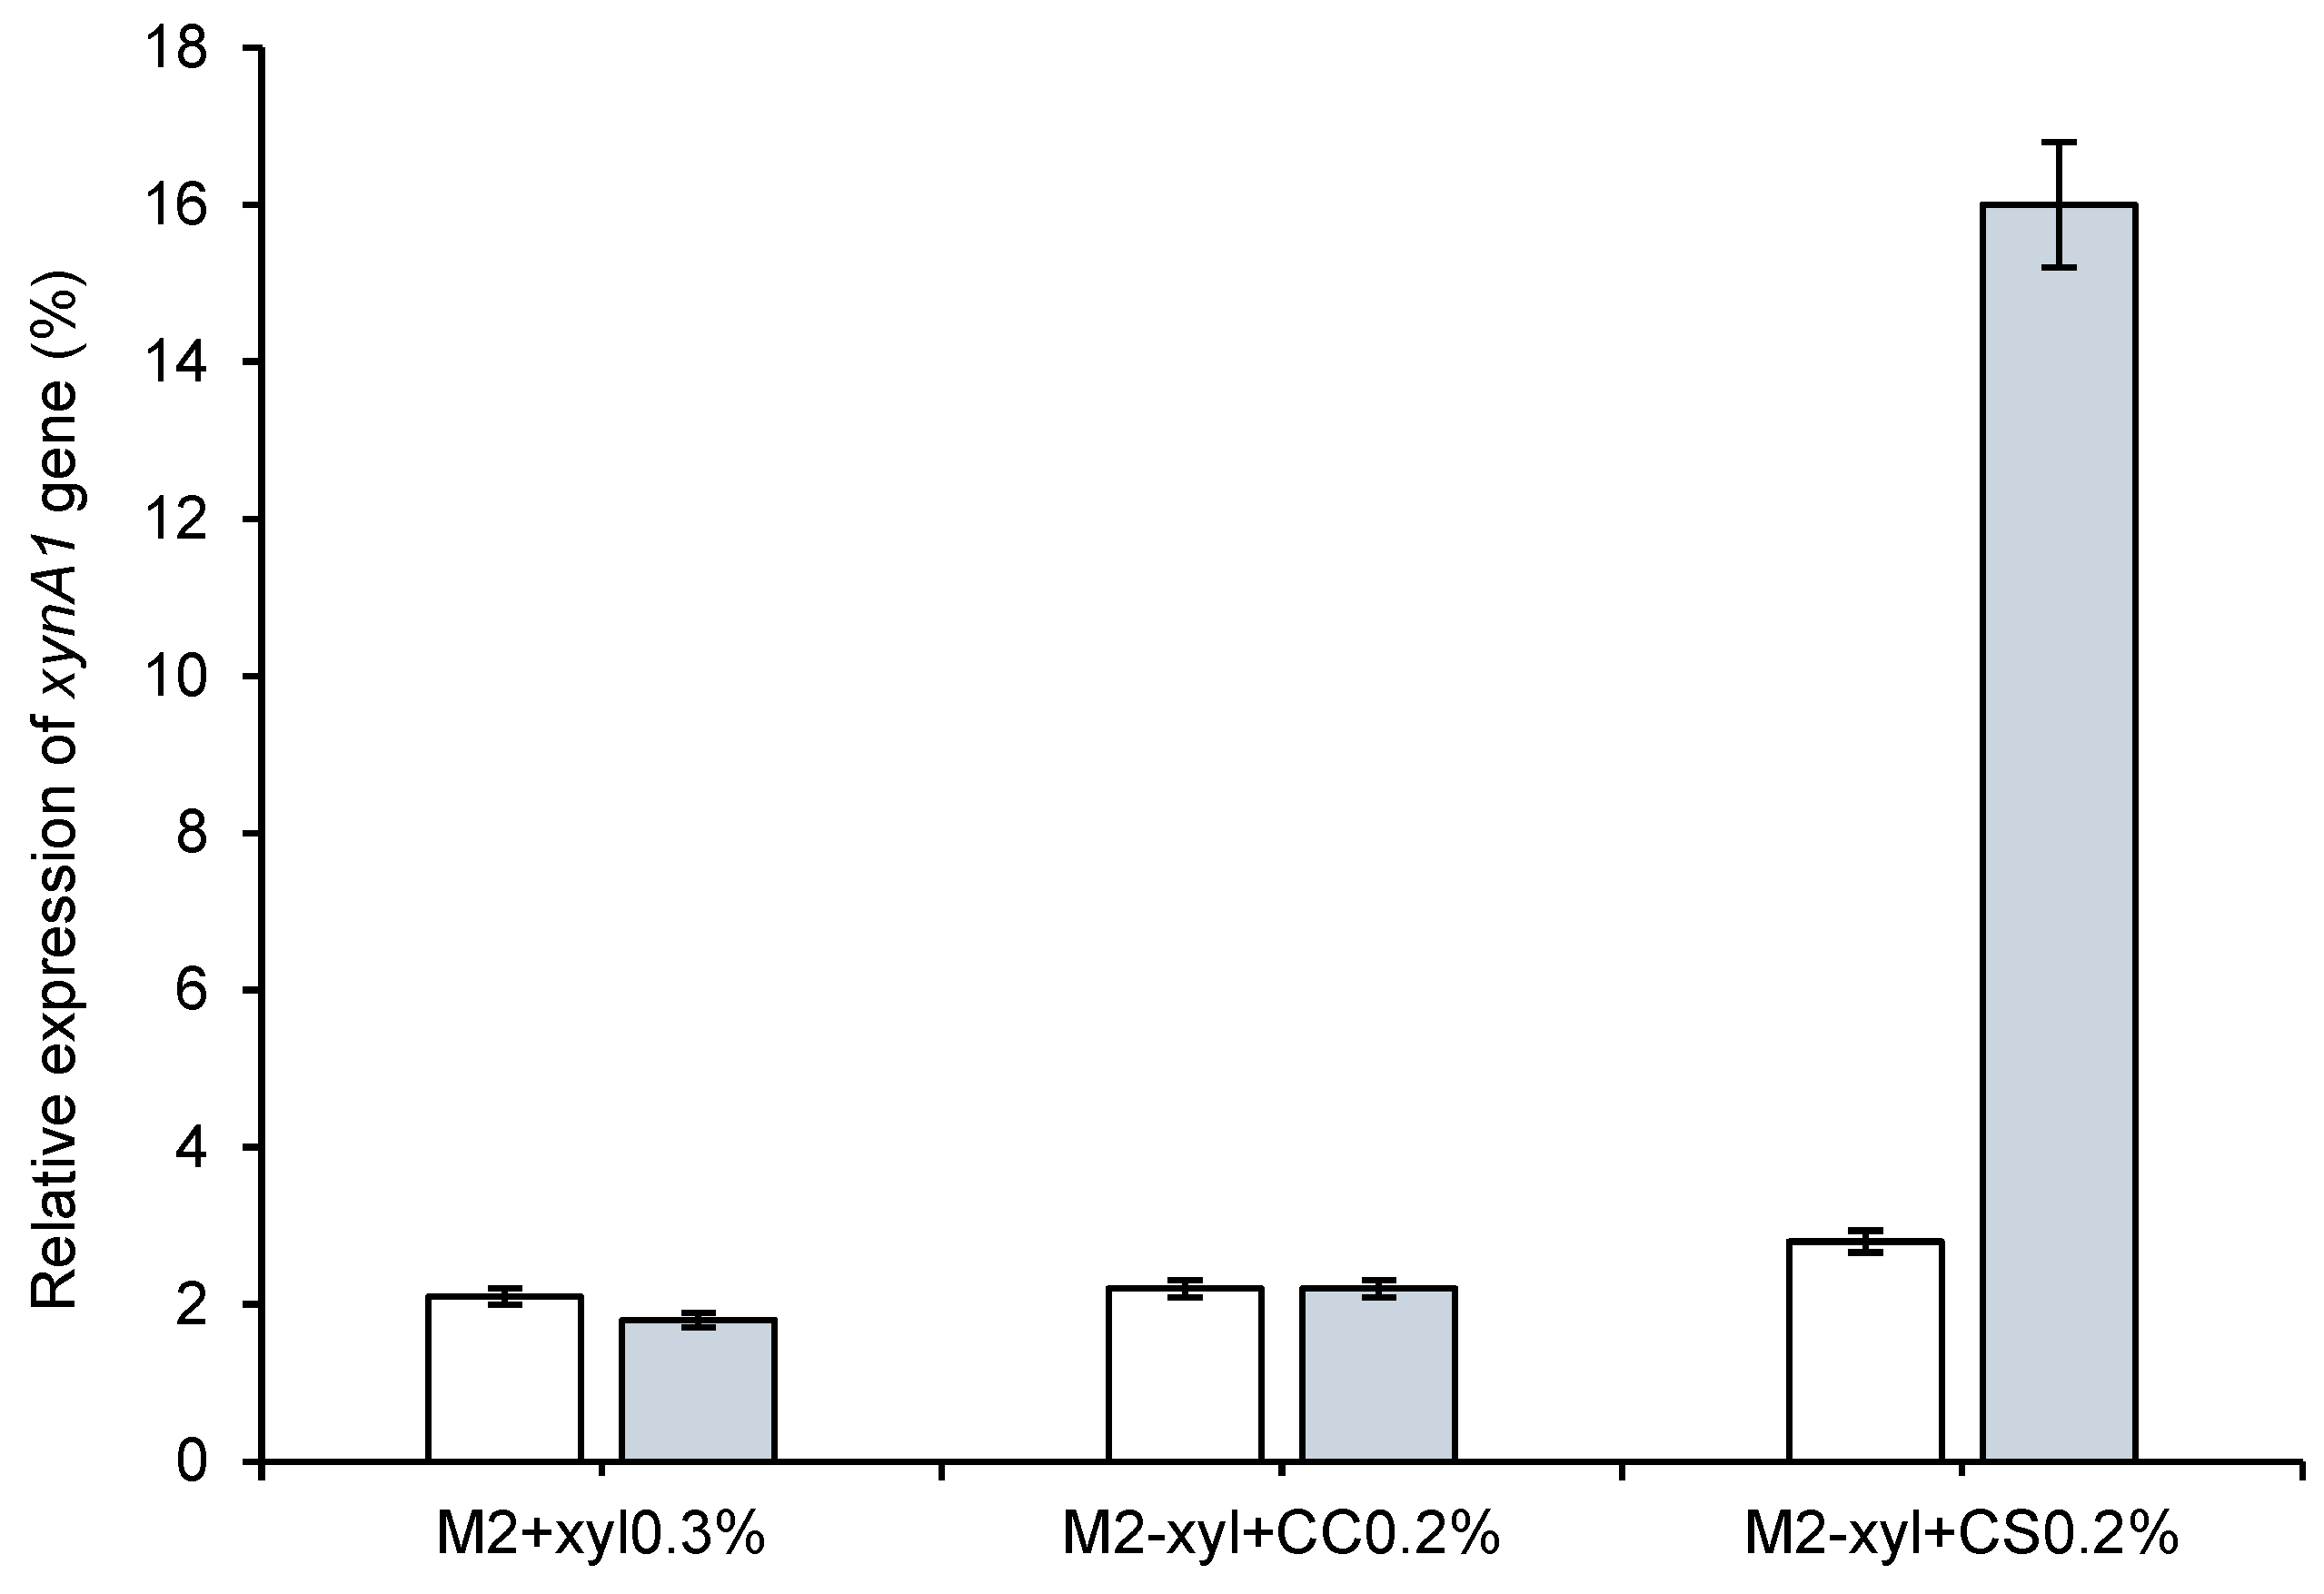
Figure 7.
Comparison between the specific activity (U/mg) of different commercial xylanases and cell-free Xylanase I from C. crescentus BS-xynA1 strain.
Figure 7.
Comparison between the specific activity (U/mg) of different commercial xylanases and cell-free Xylanase I from C. crescentus BS-xynA1 strain.
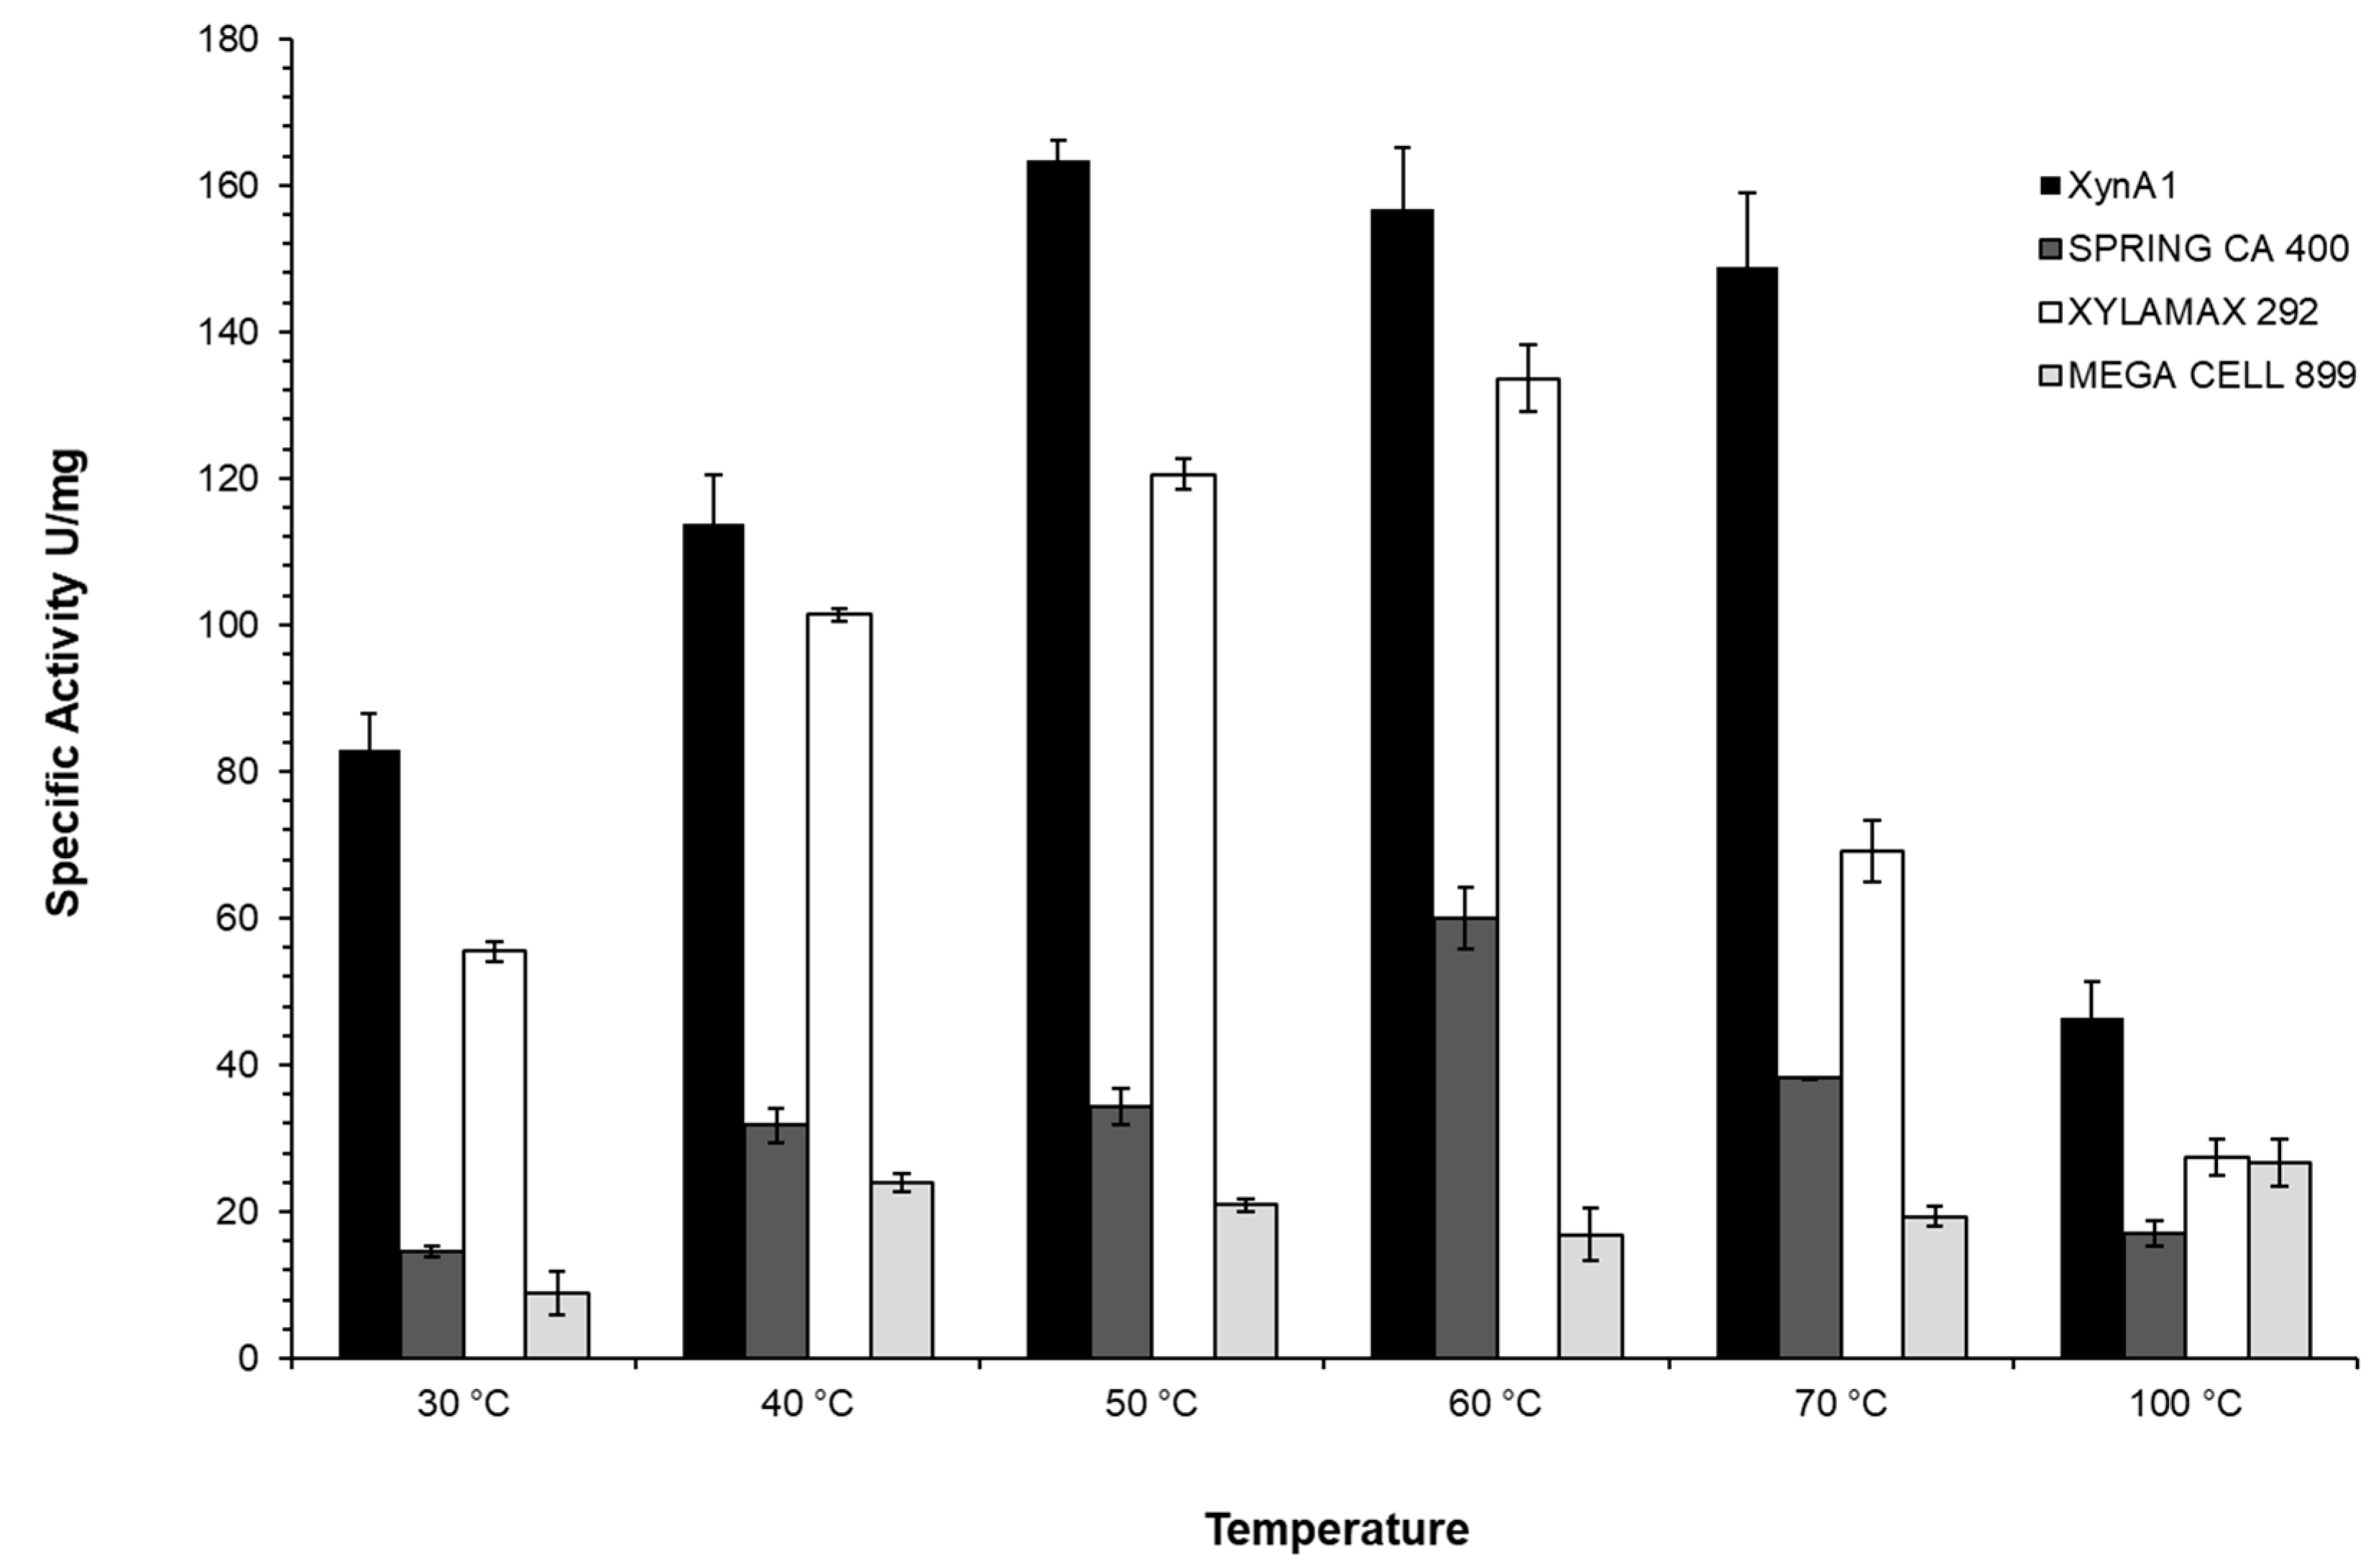
Figure 8.
Average alveographs provided by the apparatus (alveograph). (A) Control assay. (B) Alveographs obtained after treatment with cell-free Xylanase I (30 mL of extract in 250 g of flour). The axis of the abscissa shows the values of elasticity expressed in millimeters (mm). The ordinate axis expresses the toughness values expressed in millimeters of water (mmH2O). The data represent the arithmetic mean of five independent repetitions.

Figure 9.
(A) Representative images of breads after fermentation. (B, C) Images of breads after baking. (B) Whole breads; (C) Breads cut exactly in half. (T1) Control without the addition of the enzyme extract. (T2) Addition of 60 mL of enzyme extract to 1 kg of flour. (T3) A total of 120 mL of enzymatic extract containing cell-free Xylanase I (specific activity = 278.64 U/mg) was added to 1 kg of flour.
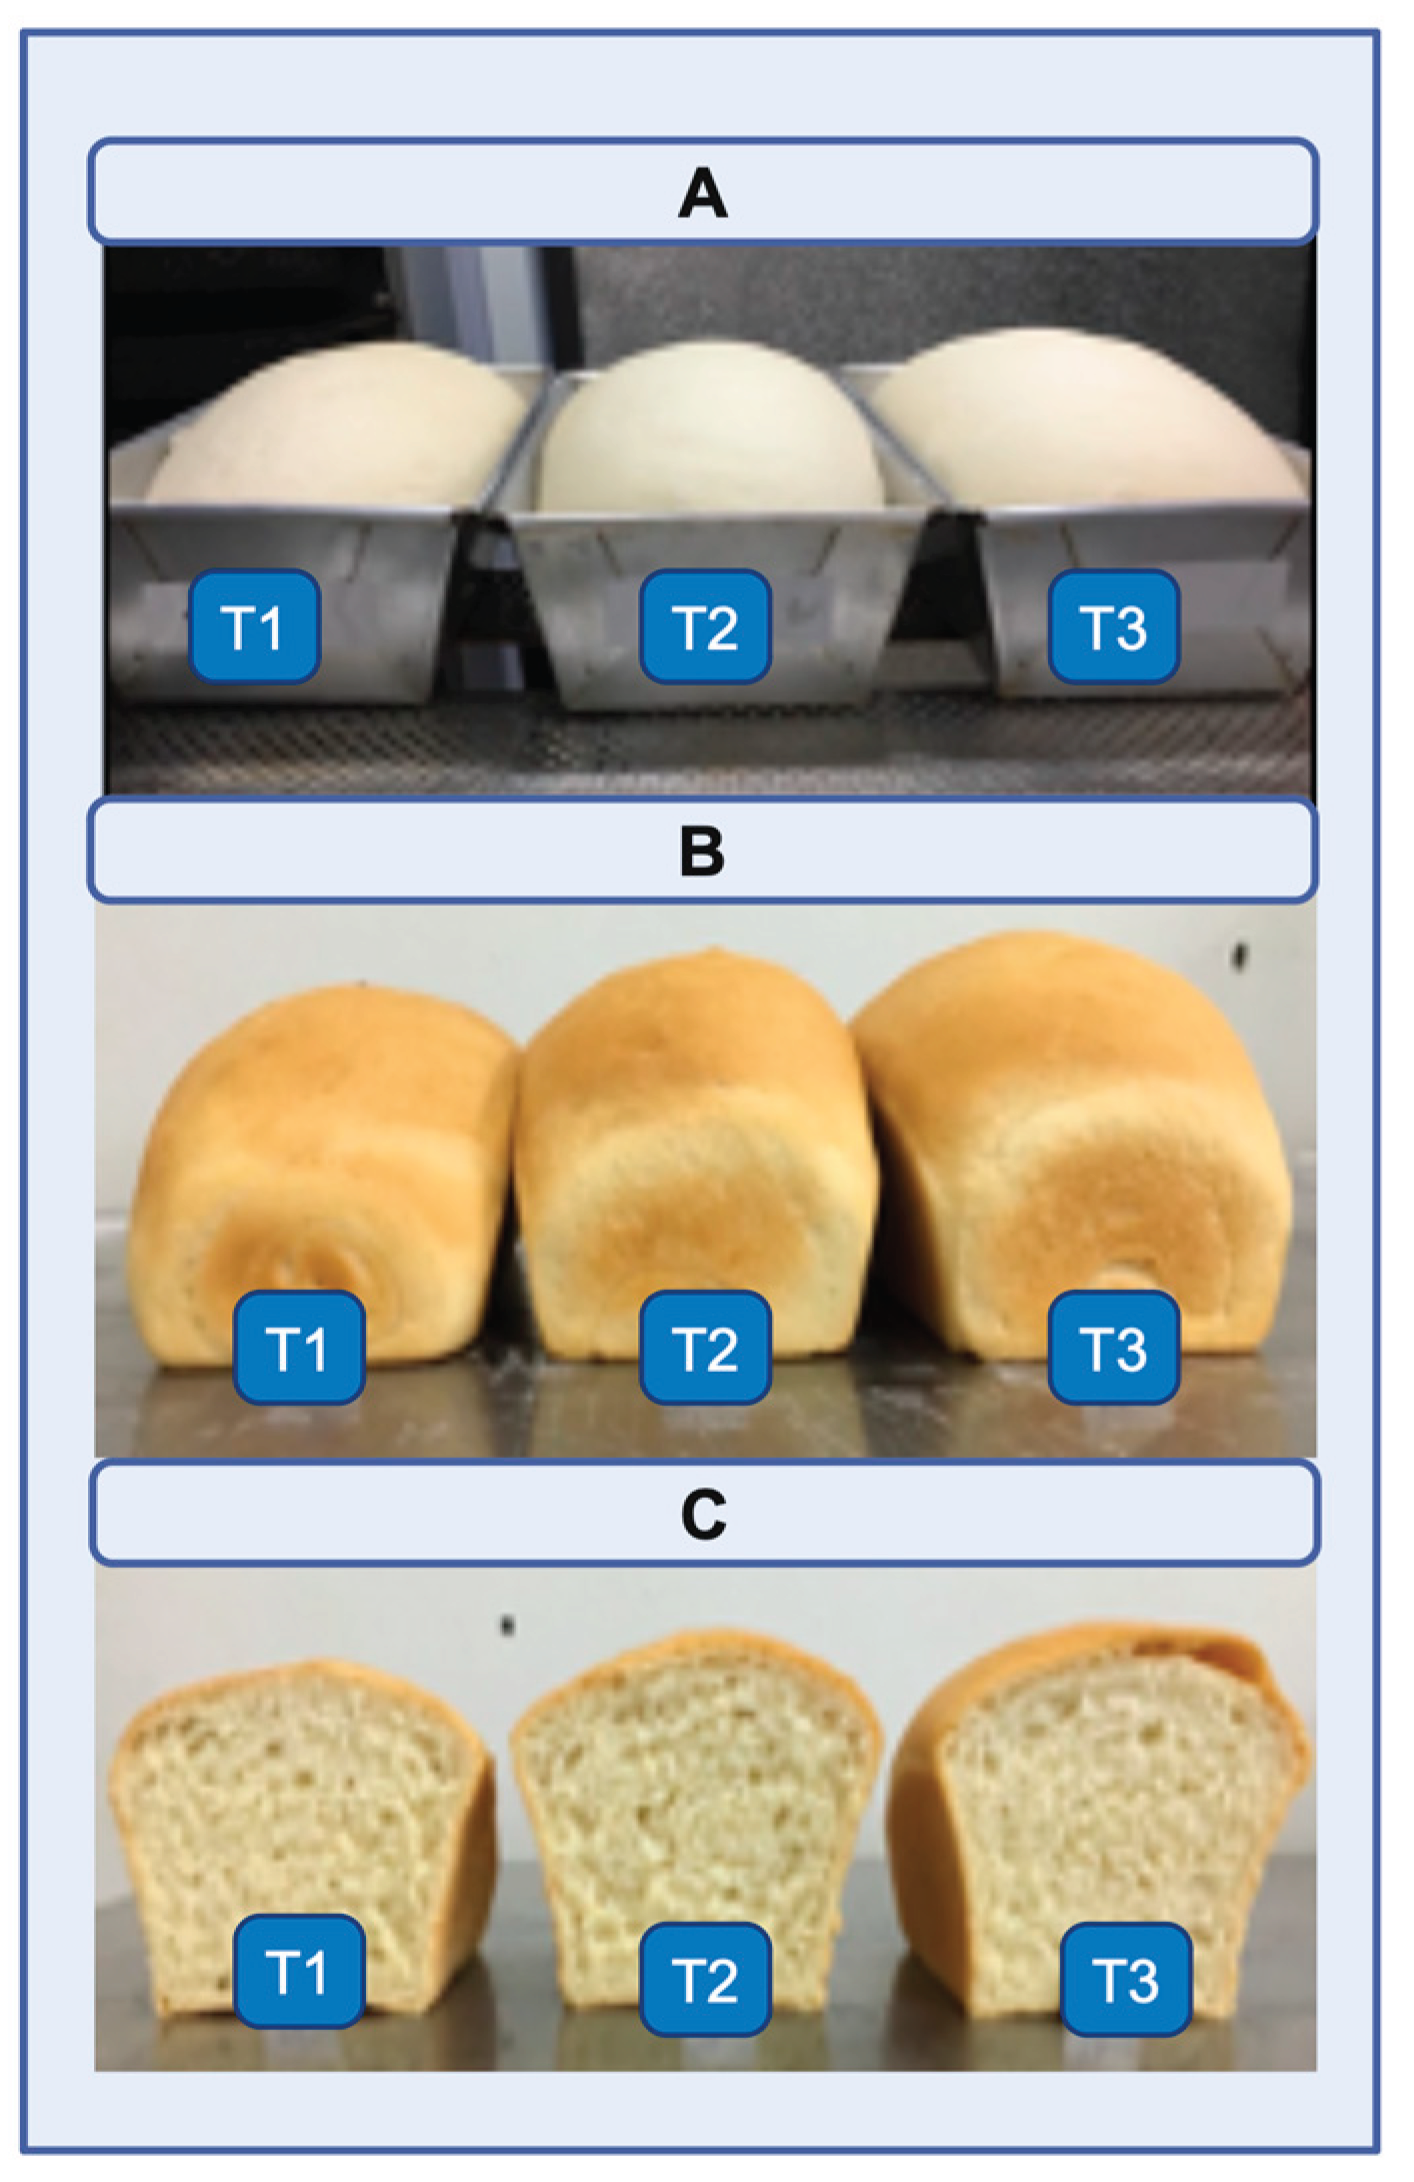

Table 1.
Strains and plasmids used in the present report.
| Strains/Plasmids | Genotype/Description | Source/Reference |
|---|---|---|
| E. coli | ||
| DH5α |
Δ (lacZYA-argF) U169 deoR recA1 endA1 hsdR17 phoA sup144 thi-1 gyrA96 relA1 (φ80 lacZDM15). |
Invitrogen®. |
| S17 | M294::RP4-2 (Tc::Mu) (Km::Tn7) |
[24] |
| DH5α-pAS22-xynA1 | E. coli DH5α carrying pAS22-xynA1. | This study |
| S17-pAS22-xynA1 | E. coli S17 carrying pAS22-xynA1 | This study |
| DH5α-pAS22 | E. coli DH5α carrying pAS22 | This study |
| S17-pAS22 | E. coli S17 carrying pAS22 | This study |
| C. crescentus | ||
| NA1000 | Holdfast mutant derivative of wild-type strain CB15 |
[26] |
| BS-xynA1 | NA1000 carrying pAS22-xynA1 | This study |
| Cc-pAS22 | NA1000 carrying pAS22 | This study |
| Plasmid | ||
| pAS22 | Vector for expression of genes in Caulobacter from the PxylX promoter, ori T, CmR | [27] |
| pAS22-xynA1 | pAS22 containing the xynA1 gene under the control of PxylX promoter | This study |
Table 2.
Test formulations.
| Components | T1 | T2 | T3 |
|---|---|---|---|
| Flour | 1000 g | 1000 g | 1000 g |
| Salt | 20 g | 20 g | 20 g |
| Sugar | 60 g | 60 g | 60 g |
| Vegetable fat | 40 g | 40 g | 40 g |
| Yeast | 20 g | 20 g | 20 g |
| Water | 500 mL | 440 mL | 380 mL |
| Cell-free XylanaseI * | - | 60 mL | 120mL |
*Xylanase activity 10 U/mL, specific activity 278.64 U/mg.
Table 3.
Composition of alveograph tests.
| XynA | − | +* |
|---|---|---|
| Flour | 250 g | 250 g |
| Water | 127.7 mL | 97.7 mL |
| Sodium Chloride | 3,192.5 g | 3,192.5 g |
| Cell-free XynA1* | no addition | 30 mL |
*Cell-free XynA1 activity 10 U/mL; Specific activity of XynA1 (278.64 U/mg).
Table 4.
Parameters checked on breads.
| Parameters | T1 | T2 | T3 |
|---|---|---|---|
| Beat time to get the veil point (min) | 11 | 10 | 10 |
| Height of bread after fermentation (cm) | 7.9 ± 0.05 | 8.6 ± 0.04 | 9.3 ± 0.05 |
| Height of bread after furnace (cm) | 8.8 ± 0.07 | 9.8 ± 0.08 | 10.4 ± 0.07 |
Table 5.
Alveography results.
| Parameters Generated | XynA1 - | Cell-free XynA1+ |
|---|---|---|
| P (tenacity) | 134 mmH2O | 126 mmH2O |
| L (extensibility) | 69 mm | 82 mm |
| W (mass deformation energy) | 326 10-4J | 353 10-4J |
| P/L (tenacity / extensibility) | 1.94 | 1.54 |
| Ie (elasticity index) | 53.6 % | 56.4 % |
Disclaimer/Publisher’s Note: The statements, opinions and data contained in all publications are solely those of the individual author(s) and contributor(s) and not of MDPI and/or the editor(s). MDPI and/or the editor(s) disclaim responsibility for any injury to people or property resulting from any ideas, methods, instructions or products referred to in the content. |
© 2025 by the authors. Licensee MDPI, Basel, Switzerland. This article is an open access article distributed under the terms and conditions of the Creative Commons Attribution (CC BY) license (http://creativecommons.org/licenses/by/4.0/).
Copyright: This open access article is published under a Creative Commons CC BY 4.0 license, which permit the free download, distribution, and reuse, provided that the author and preprint are cited in any reuse.


